student health program - massachusetts public interest ... community college roxbury community...
TRANSCRIPT
Student Health ProgramAcademic Years 2005-2006 through 2007-2008
Baseline Report
November 2009
Deval L. Patrick, GovernorCommonwealth of MassachusettsTimothy P. MurrayLieutenant Governor
JudyAnn Bigby, M.D., SecretaryExecutive Office of Health and Human Services
Sarah Iselin, CommissionerDivision of Health Care Finance and Policy
Massachusetts Division of Health Care Finance and Policy 1
Student Health Program
Introduction….……………………………………………………………………………………………………………………………………………..……………….2
Overview……………………………………………………………………………………………………………………………………………………………………….3
Enrollment and Waiver……………..………………………………………………………………………………………………………………………………….8
Premiums…………….……………………………………………………………………………………………………………………………………………………….12
Financial Performance………………………………………………………………….………………………………………………………………………………15
Benefit Analysis…………………………………………………………………………………………………….……………………………………………………..25
Customer Service……………..………………………………………………………………………………………………………………………………………….31
Appendix……………………………………………………………………………………………………………………………………………………………………….32
Table of Contents
Massachusetts Division of Health Care Finance and Policy 2
About This Report
The Student Health Program Baseline Report is the first comprehensive report on the Student Health Program (SHP) from the Division of Health Care Finance and Policy (DHCFP) and aims to:
• Provide an overview of SHP enrollment and financial performance at Massachusetts colleges and universities,
• Serve as a baseline for SHP comparisons in the future, and• Improve transparency within the SHP marketplace.
Major FindingsThe major findings of this report include:
• Over 95,000 students purchase health insurance through their schools each year.• Student Health Program benefits vary greatly by school. While SHPs are required to provide a minimum
set of benefits to students, schools often tailor their SHPs to meet the needs of their students.• The average SHP premium is $1,216 per year, but there is a wide range of premiums among schools.
Some schools achieve lower than average premiums through limiting benefit coverage. Students enrolled in SHPs offering lower levels of coverage may experience significant out-of-pocket expenses due to coverage gaps.
• Student Health Program enrollment is concentrated among a small number of national insurance carriers. This market dynamic may have contributed to the higher average profit margins realized by SHP carriers compared to those seen in private insurance products in Massachusetts.
This report reflects data for the academic years of 2005-2006, 2006-2007, and 2007-2008. It is important to note that premiums reported do not include university/college administrative or health center fees (for schools that have them). Schools also did not include data on services provided at student health centers. A brief description of the analytic methodology relevant to each data table is provided at the bottom of each page. Additional information is available in the Appendix.
DHCFP would like to thank Nancy Turnbull of the Harvard School of Public Health for her strategic and analytic support in the development of this report. We also thank Dianna Welch and Gregory Herrle from Oliver Wyman Actuarial Consulting, Inc. for their support and review of the data. Finally, we thank the staff at schools, insurance carriers, and insurance brokers for their continued timely responses to our requests for data.
Introduction
Contributing Staff: Han Huang, Steve McCabe, Caroline Minkin, and Patricia Sardon.
Massachusetts Division of Health Care Finance and Policy 3
About the Student Health Program
The Student Health Program (SHP) statute (MGL C. 15A § 18) requires:• Students enrolled at Massachusetts institutions of higher education to have health insurance, and• Schools to offer health insurance to their students.
The regulation (114.6 CMR 3.00) sets the requirements for a SHP and the criteria for students with health insurance from another source to waive participation through their school’s SHP. The SHP regulation applies to students enrolled in at least 75% of a full-time courseload and public or private colleges and universities under the purview of the Massachusetts Department of Higher Education.
Student Health Programs are currently required to offer reasonably comprehensive coverage of health services, including preventive and primary care, emergency services, surgical services, hospitalization benefits, ambulatory patient services, and mental health services. Student Health Programs must provide at least a $50,000 maximum aggregate indemnity benefit per illness or injury. Any fully insured SHP must also include all Massachusetts mandated benefits. Student Health Programs must also provide coverage for a 52-week period, students who are away from campus for any reason, and Christian Science healing practices.
Student Health Programs may also:• Contain reasonable exclusions and limitations, including different benefit levels for in-network and out-
of-network providers,• Include reasonable co-payments and deductibles (total annual deductible may not exceed $250 per
year),• Exclude charges reimbursable by another health plan,• Exclude coverage for injuries resulting from participation in intercollegiate athletics (if the service is
covered under another health insurance of equal or better coverage),• Provide some or all of its SHP benefits through an on-campus student health service, and• Exceed the minimum benefit levels.
Schools may tailor SHPs to fit their student population and join with other schools to realize savings through collective bidding of their SHPs.
Overview
Massachusetts Division of Health Care Finance and Policy 4
Student Health Program Insurance Carriers
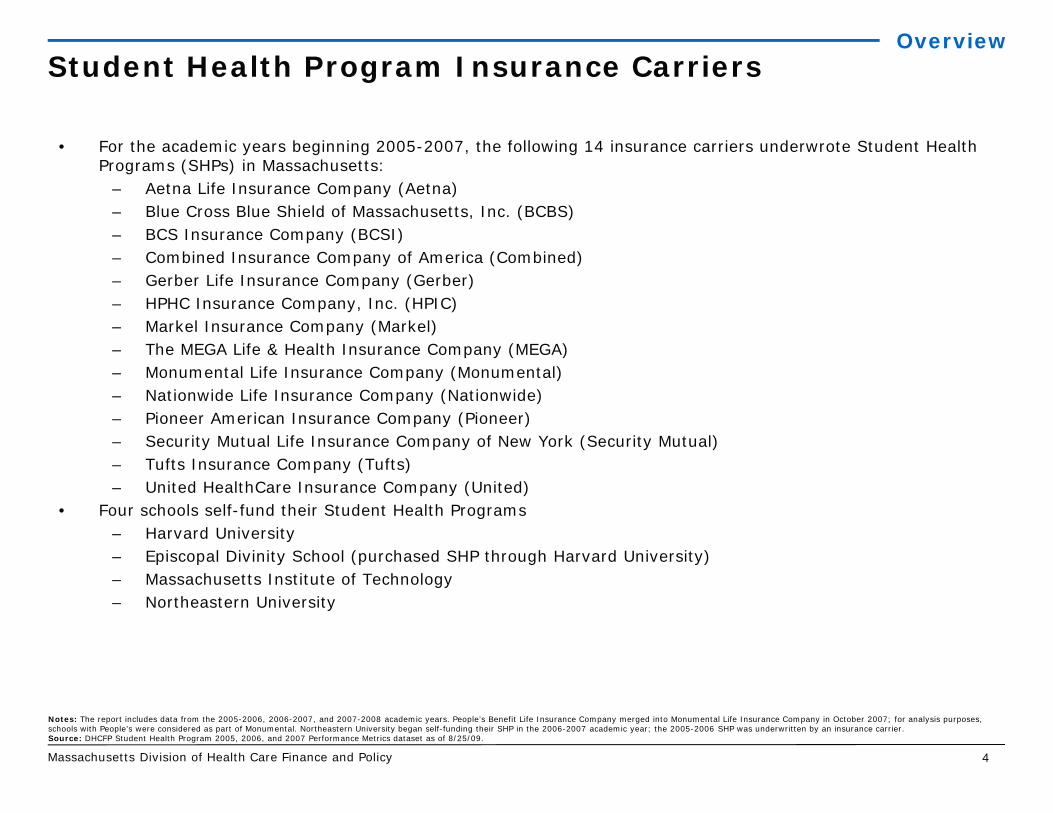
• For the academic years beginning 2005-2007, the following 14 insurance carriers underwrote Student Health Programs (SHPs) in Massachusetts:
– Aetna Life Insurance Company (Aetna)– Blue Cross Blue Shield of Massachusetts, Inc. (BCBS)– BCS Insurance Company (BCSI)– Combined Insurance Company of America (Combined)– Gerber Life Insurance Company (Gerber)– HPHC Insurance Company, Inc. (HPIC)– Markel Insurance Company (Markel)– The MEGA Life & Health Insurance Company (MEGA)– Monumental Life Insurance Company (Monumental)– Nationwide Life Insurance Company (Nationwide)– Pioneer American Insurance Company (Pioneer)– Security Mutual Life Insurance Company of New York (Security Mutual)– Tufts Insurance Company (Tufts)– United HealthCare Insurance Company (United)
• Four schools self-fund their Student Health Programs– Harvard University– Episcopal Divinity School (purchased SHP through Harvard University)– Massachusetts Institute of Technology– Northeastern University
Overview
Notes: The report includes data from the 2005-2006, 2006-2007, and 2007-2008 academic years. People’s Benefit Life Insurance Company merged into Monumental Life Insurance Company in October 2007; for analysis purposes, schools with People’s were considered as part of Monumental. Northeastern University began self-funding their SHP in the 2006-2007 academic year; the 2005-2006 SHP was underwritten by an insurance carrier. Source: DHCFP Student Health Program 2005, 2006, and 2007 Performance Metrics dataset as of 8/25/09.

Massachusetts Division of Health Care Finance and Policy 5
Schools by Category (1 of 2)
Community Colleges (16)Berkshire Community CollegeBristol Community CollegeBunker Hill Community CollegeCape Cod Community CollegeGreenfield Community CollegeHolyoke Community CollegeMassasoit Community CollegeMassBay Community CollegeMiddlesex Community CollegeMount Wachusett Community CollegeNorth Shore Community CollegeNorthern Essex Community CollegeQuincy College*Quinsigamond Community CollegeRoxbury Community CollegeSpringfield Technical Community College
Self-Funded Schools (4)Harvard UniversityEpiscopal Divinity SchoolMassachusetts Institute of TechnologyNortheastern University
Overview
State Colleges (7)Bridgewater State CollegeFitchburg State CollegeFramingham State CollegeMassachusetts College of Liberal ArtsSalem State CollegeWestfield State CollegeWorcester State College
UMass Schools (5)University of Massachusetts at AmherstUniversity of Massachusetts BostonUniversity of Massachusetts DartmouthUniversity of Massachusetts LowellUniversity of Massachusetts Medical School
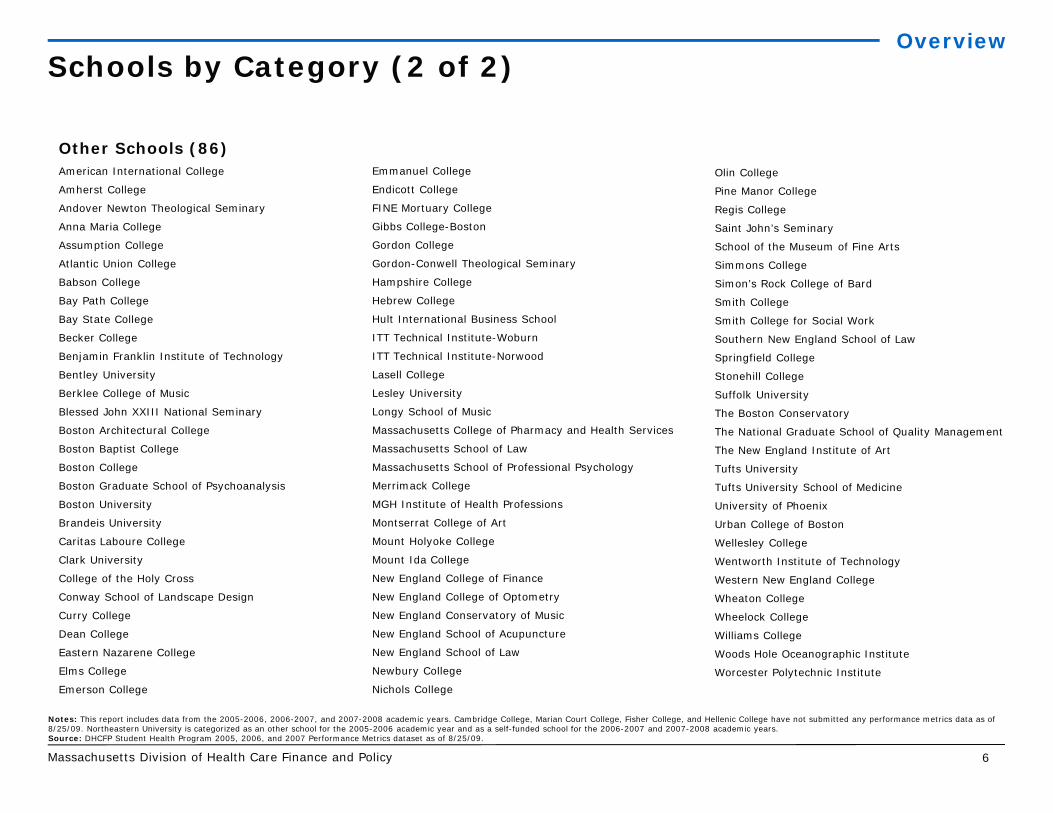
Other Schools (86)See next page for list of schools
Notes: The report includes data from the 2005-2006, 2006-2007, and 2007-2008 academic years. Two state schools (Massachusetts College of Art and Design and Massachusetts Maritime Academy) and 4 other schools (Cambridge College, Marian Court College, Fisher College, and Hellenic College) have not submitted any Performance Metrics data as of 8/25/09. Northeastern University is categorized as an other school for the 2005-2006 academic year and as a self-funded school for the 2006-2007 and 2007-2008 academic years.* Municipally funded Source: DHCFP Student Health Program 2005, 2006, and 2007 Performance Metrics dataset as of 8/25/09.
There are 118 schools that provided Student Health Program (SHP) performance metrics data for the 2005-2006 through 2007-2008 academic years.
Grouping schools into these categories allows DHCFP to compare data among various public and private schools throughout Massachusetts.
Massachusetts Division of Health Care Finance and Policy 6
Schools by Category (2 of 2)
Olin College
Pine Manor College
Regis College
Saint John’s Seminary
School of the Museum of Fine Arts
Simmons College
Simon’s Rock College of Bard
Smith College
Smith College for Social Work
Southern New England School of Law
Springfield College
Stonehill College
Suffolk University
The Boston Conservatory
The National Graduate School of Quality Management
The New England Institute of Art
Tufts University
Tufts University School of Medicine
University of Phoenix
Urban College of Boston
Wellesley College
Wentworth Institute of Technology
Western New England College
Wheaton College
Wheelock College
Williams College
Woods Hole Oceanographic Institute
Worcester Polytechnic Institute
Other Schools (86)American International College
Amherst College
Andover Newton Theological Seminary
Anna Maria College
Assumption College
Atlantic Union College
Babson College
Bay Path College
Bay State College
Becker College
Benjamin Franklin Institute of Technology
Bentley University
Berklee College of Music
Blessed John XXIII National Seminary
Boston Architectural College
Boston Baptist College
Boston College
Boston Graduate School of Psychoanalysis
Boston University
Brandeis University
Caritas Laboure College
Clark University
College of the Holy Cross
Conway School of Landscape Design
Curry College
Dean College
Eastern Nazarene College
Elms College
Emerson College
Notes: This report includes data from the 2005-2006, 2006-2007, and 2007-2008 academic years. Cambridge College, Marian Court College, Fisher College, and Hellenic College have not submitted any performance metrics data as of 8/25/09. Northeastern University is categorized as an other school for the 2005-2006 academic year and as a self-funded school for the 2006-2007 and 2007-2008 academic years.Source: DHCFP Student Health Program 2005, 2006, and 2007 Performance Metrics dataset as of 8/25/09.
Emmanuel College
Endicott College
FINE Mortuary College
Gibbs College-Boston
Gordon College
Gordon-Conwell Theological Seminary
Hampshire College
Hebrew College
Hult International Business School
ITT Technical Institute-Woburn
ITT Technical Institute-Norwood
Lasell College
Lesley University
Longy School of Music
Massachusetts College of Pharmacy and Health Services
Massachusetts School of Law
Massachusetts School of Professional Psychology
Merrimack College
MGH Institute of Health Professions
Montserrat College of Art
Mount Holyoke College
Mount Ida College
New England College of Finance
New England College of Optometry
New England Conservatory of Music
New England School of Acupuncture
New England School of Law
Newbury College
Nichols College
Overview
Massachusetts Division of Health Care Finance and Policy 7
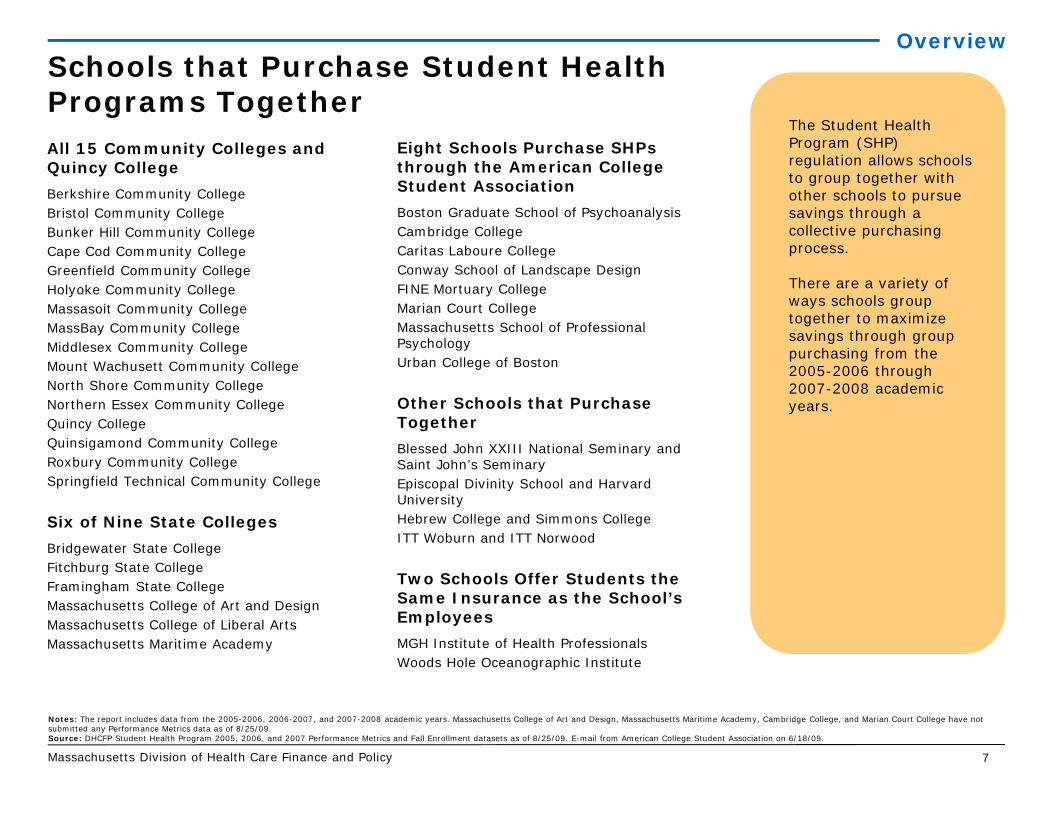
Schools that Purchase Student Health Programs TogetherAll 15 Community Colleges and Quincy CollegeBerkshire Community CollegeBristol Community CollegeBunker Hill Community CollegeCape Cod Community CollegeGreenfield Community CollegeHolyoke Community CollegeMassasoit Community CollegeMassBay Community CollegeMiddlesex Community CollegeMount Wachusett Community CollegeNorth Shore Community CollegeNorthern Essex Community CollegeQuincy CollegeQuinsigamond Community CollegeRoxbury Community CollegeSpringfield Technical Community College
Six of Nine State CollegesBridgewater State CollegeFitchburg State CollegeFramingham State CollegeMassachusetts College of Art and DesignMassachusetts College of Liberal ArtsMassachusetts Maritime Academy
Overview
The Student Health Program (SHP) regulation allows schools to group together with other schools to pursue savings through a collective purchasing process.
There are a variety of ways schools group together to maximize savings through group purchasing from the 2005-2006 through 2007-2008 academic years.
Eight Schools Purchase SHPs through the American College Student AssociationBoston Graduate School of PsychoanalysisCambridge CollegeCaritas Laboure CollegeConway School of Landscape DesignFINE Mortuary CollegeMarian Court CollegeMassachusetts School of Professional PsychologyUrban College of Boston
Other Schools that Purchase TogetherBlessed John XXIII National Seminary and Saint John’s SeminaryEpiscopal Divinity School and Harvard UniversityHebrew College and Simmons CollegeITT Woburn and ITT Norwood
Two Schools Offer Students the Same Insurance as the School’s EmployeesMGH Institute of Health ProfessionalsWoods Hole Oceanographic Institute
Notes: The report includes data from the 2005-2006, 2006-2007, and 2007-2008 academic years. Massachusetts College of Art and Design, Massachusetts Maritime Academy, Cambridge College, and Marian Court College have not submitted any Performance Metrics data as of 8/25/09.Source: DHCFP Student Health Program 2005, 2006, and 2007 Performance Metrics and Fall Enrollment datasets as of 8/25/09. E-mail from American College Student Association on 6/18/09.
Massachusetts Division of Health Care Finance and Policy 8
Academic Year 2005-2006 2006-2007 2007-2008
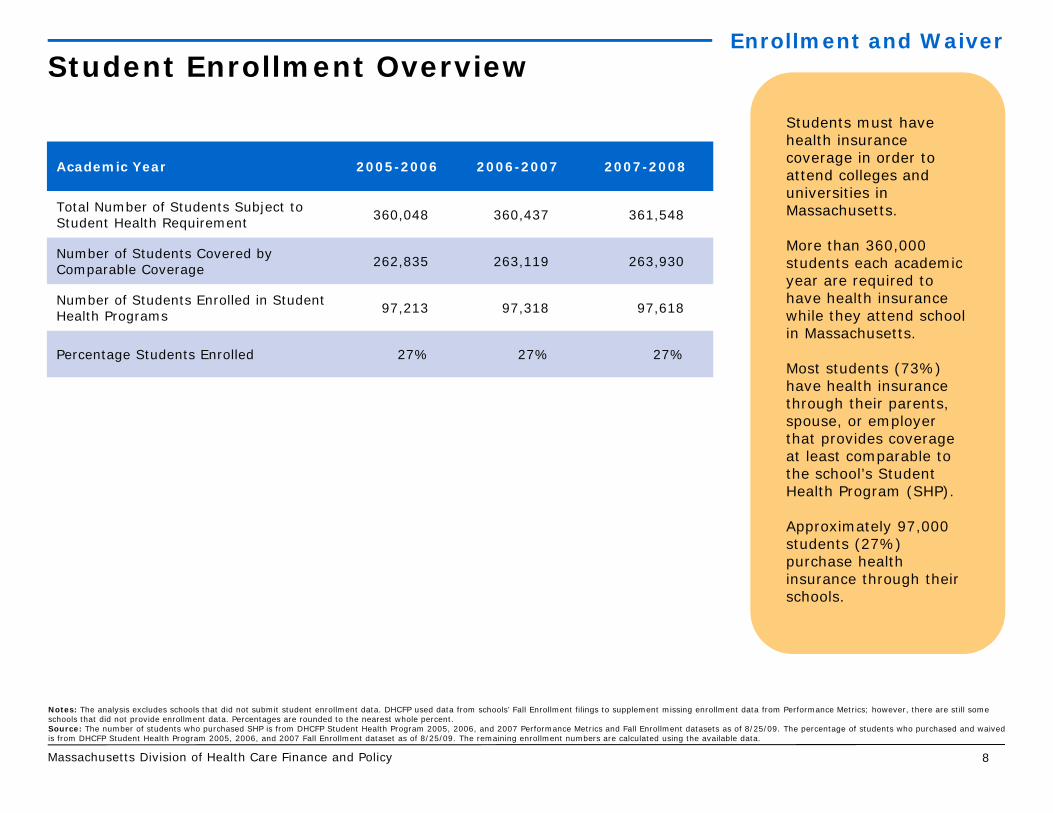
Total Number of Students Subject to Student Health Requirement 360,048 360,437 361,548
Number of Students Covered by Comparable Coverage 262,835 263,119 263,930
Number of Students Enrolled in Student Health Programs 97,213 97,318 97,618
Percentage Students Enrolled 27% 27% 27%
Students must have health insurance coverage in order to attend colleges and universities in Massachusetts.
More than 360,000 students each academic year are required to have health insurance while they attend school in Massachusetts.
Most students (73%) have health insurance through their parents, spouse, or employer that provides coverage at least comparable to the school’s Student Health Program (SHP).
Approximately 97,000 students (27%) purchase health insurance through their schools.
Student Enrollment OverviewEnrollment and Waiver
Notes: The analysis excludes schools that did not submit student enrollment data. DHCFP used data from schools’ Fall Enrollment filings to supplement missing enrollment data from Performance Metrics; however, there are still some schools that did not provide enrollment data. Percentages are rounded to the nearest whole percent.Source: The number of students who purchased SHP is from DHCFP Student Health Program 2005, 2006, and 2007 Performance Metrics and Fall Enrollment datasets as of 8/25/09. The percentage of students who purchased and waived is from DHCFP Student Health Program 2005, 2006, and 2007 Fall Enrollment dataset as of 8/25/09. The remaining enrollment numbers are calculated using the available data.
Massachusetts Division of Health Care Finance and Policy 9
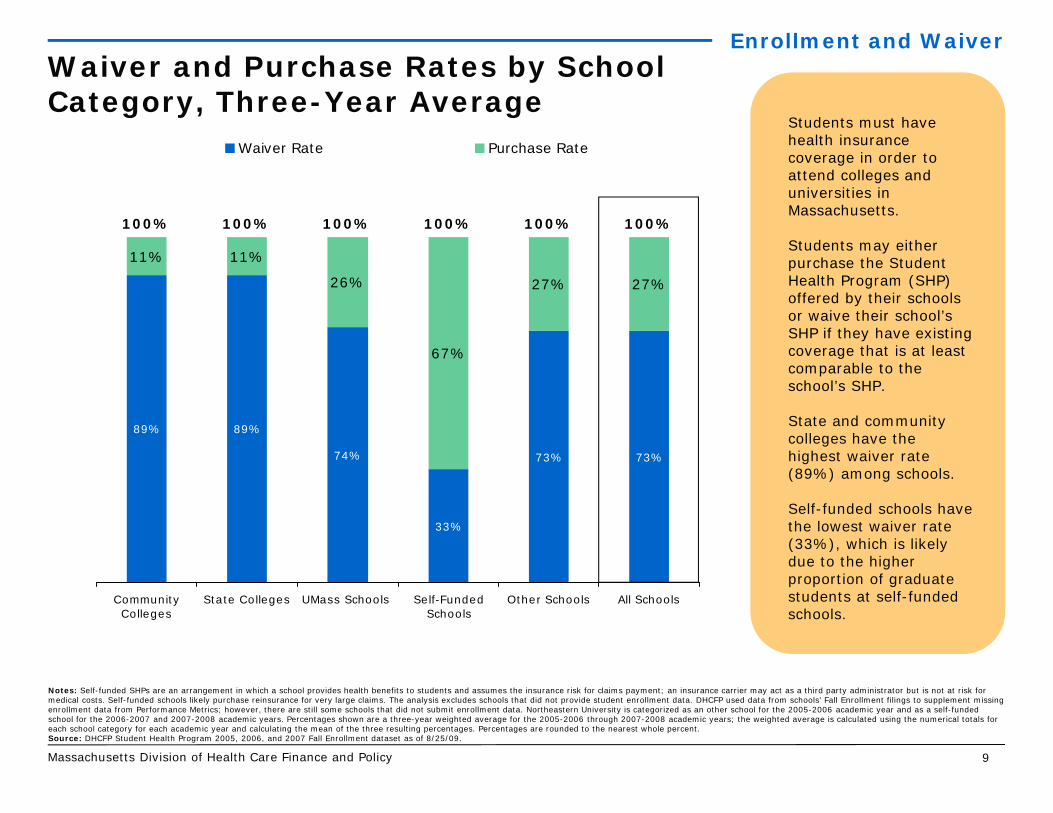
Students must have health insurance coverage in order to attend colleges and universities in Massachusetts.
Students may either purchase the Student Health Program (SHP) offered by their schools or waive their school’s SHP if they have existing coverage that is at least comparable to the school’s SHP.
State and community colleges have the highest waiver rate (89%) among schools.
Self-funded schools have the lowest waiver rate (33%), which is likely due to the higher proportion of graduate students at self-funded schools.
89% 89%
74%
33%
73% 73%
11% 11%
26%
67%
27% 27%
100% 100% 100% 100% 100% 100%
CommunityColleges
State Colleges UMass Schools Self-FundedSchools
Other Schools All Schools
Waiver Rate Purchase Rate
Waiver and Purchase Rates by School Category, Three-Year Average
Enrollment and Waiver
Notes: Self-funded SHPs are an arrangement in which a school provides health benefits to students and assumes the insurance risk for claims payment; an insurance carrier may act as a third party administrator but is not at risk for medical costs. Self-funded schools likely purchase reinsurance for very large claims. The analysis excludes schools that did not provide student enrollment data. DHCFP used data from schools’ Fall Enrollment filings to supplement missing enrollment data from Performance Metrics; however, there are still some schools that did not submit enrollment data. Northeastern University is categorized as an other school for the 2005-2006 academic year and as a self-funded school for the 2006-2007 and 2007-2008 academic years. Percentages shown are a three-year weighted average for the 2005-2006 through 2007-2008 academic years; the weighted average is calculated using the numerical totals for each school category for each academic year and calculating the mean of the three resulting percentages. Percentages are rounded to the nearest whole percent.Source: DHCFP Student Health Program 2005, 2006, and 2007 Fall Enrollment dataset as of 8/25/09.

Massachusetts Division of Health Care Finance and Policy 10
The four schools who self-fund their Student Health Program (SHP) account for 25% of all students enrolled in SHPs.
Students enrolled in SHPs at the five UMass schools comprise 14% of all SHP students.
Students enrolled in SHPs at the 15 community colleges and Quincy College account for 8% of the SHP enrolled population.
Of the remaining enrolled students, 4% attend state colleges and 50% attend other schools.
7,895
3,650
13,221
24,331
48,287
CommunityColleges
State Colleges UMass Schools Self-FundedSchools
Other Schools
SHP Student Enrollment by School Category, Three-Year Average
Enrollment and Waiver
Notes: Self-funded SHPs are an arrangement in which a school provides health benefits to students and assumes the insurance risk for claims payment; an insurance carrier may act as a third party administrator but is not at risk for medical costs. Self-funded schools likely purchase reinsurance for very large claims. The analysis excludes schools that did not provide student enrollment data. DHCFP used data from schools’ Fall Enrollment filings to supplement missing enrollment data from Performance Metrics; however, there are still some schools that did not submit enrollment data. Northeastern University is categorized as an other school for the 2005-2006 academic year and as a self-funded school for the 2006-2007 and 2007-2008 academic years. Numbers shown are a three-year weighted average for the 2005-2006 through 2007-2008 academic years; the weighted average is calculated using the numerical totals for each school category for each academic year and calculating the mean of the three resulting totals. Numbers are rounded to the nearest whole number.Source: DHCFP Student Health Program 2005, 2006, and 2007 Fall Enrollment dataset as of 8/25/09.
Percent Total Average Student Enrollment:
8.1% 3.7% 13.6% 25.0% 49.6%

Massachusetts Division of Health Care Finance and Policy 11
Fourteen insurance carriers underwrite Student Health Programs (SHPs) in Massachusetts.
The majority of students are enrolled in an Aetna, self-funded, or Nationwide SHP, representing 74.9% of the total enrolled student population.
SHP Student Enrollment by Insurance Carrier, Three-Year Average
Enrollment and Waiver
Number of Schools
Number of Students Enrolled
Percent of Total Students
Enrolled
Aetna 21 32,737 33.3%
Self-Funded 4 24,331 24.7%
Nationwide 40 16,633 16.9%
Combined 11 6,458 6.6%
MEGA 6 4,353 4.4%
HPIC 3 3,835 3.9%
Markel 7 2,041 2.1%
Monumental 4 1,919 1.9%
Security Mutual 6 1,741 1.8%
Tufts 1 1,572 1.6%
BCBS 3 1,364 1.4%
United 5 665 0.7%
BCSI 1 370 0.4%
Pioneer 1 339 0.3%
Gerber 1 62 0.1%
Notes: Self-funded SHPs are an arrangement in which a school provides health benefits to students and assumes the insurance risk for claims payment; an insurance carrier may act as a third party administrator but is not at risk for medical costs. Self-funded schools likely purchase reinsurance for very large claims. The analysis excludes schools that did not provide student enrollment and valid insurance carrier data. DHCFP used data from schools’ Fall Enrollment filings and benefit brochures to supplement missing enrollment and missing or inaccurate carrier data from Performance Metrics; however, there are still some schools that did not submit enrollment or carrier data. DHCFP assumed that schools with Chickering or United HealthCare Student Resources as their carrier had Aetna or United, respectively, as their actual carrier. Numbers shown are a three-year weighted average for the 2005-2006 through 2007-2008 academic years; the weighted average is calculated by computing a numerical total for each carrier for each academic year and calculating the mean of the three resulting totals. The average percentages are calculated using the numerical totals for each carrier for each academic year and calculating the mean of the three resulting percentages. Numbers are rounded to the nearest whole number and percentages are rounded to the nearest tenth of a percent.Source: DHCFP Student Health Program 2005, 2006, and 2007 Performance Metrics and Fall Enrollment datasets as of 8/25/09.

Massachusetts Division of Health Care Finance and Policy 12
On average, students paid $1,216 for health insurance each academic year during the three-year period.
On average, Student Health Program (SHP) coverage for a student and his/her spouse costs $4,325. The average SHP premium for family coverage is approximately $6,300.
Premiums vary significantly across schools. These differences result, at least in part, because of benefit differences.
Additional premium information for individual schools is available in the Appendix.
$1,216
$4,325
$6,388
$5,208
$13,020
N/A
Student Student and Spouse Family
SHP Average 2007 Employer-Based Mean
Average Annual Premium for All Schools, Three-Year Average
Premiums
Notes: The analysis excludes schools that did not provide annual premium data for each of the categories. Schools are not required to offer SHPs to spouses or families. Premiums may vary due to the range of benefits covered by the SHP and the scope of services provided at on-campus student health centers. Student health centers may lower premiums, as some medical expenses will be covered exclusively through school, and not insurance carrier, resources. Employer-based premiums are total premiums including both the employer and employee share. SHP numbers shown are a three-year weighted average for the 2005-2006 through 2007-2008 academic years; the weighted average is calculated by computing a numerical total for each school category for each academic year and calculating the mean of the three resulting totals. Premiums are rounded to the nearest whole dollar.Source: DHCFP Student Health Program 2005, 2006, and 2007 Performance Metrics dataset as of 8/25/09. Employer-based mean comparison data from 2007 DHCFP Employer Survey.
Massachusetts Division of Health Care Finance and Policy 13
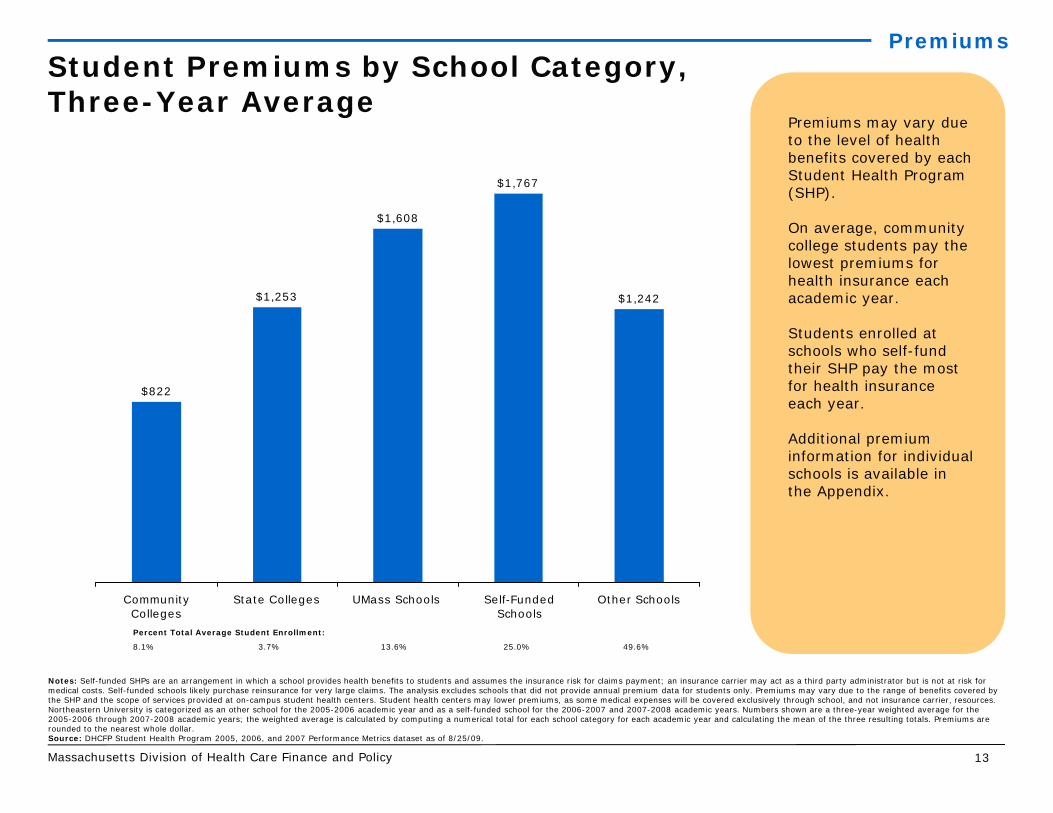
Premiums may vary due to the level of health benefits covered by each Student Health Program (SHP).
On average, community college students pay the lowest premiums for health insurance each academic year.
Students enrolled at schools who self-fund their SHP pay the most for health insurance each year.
Additional premium information for individual schools is available in the Appendix.
$822
$1,253
$1,608
$1,767
$1,242
CommunityColleges
State Colleges UMass Schools Self-FundedSchools
Other Schools
Student Premiums by School Category, Three-Year Average
Premiums
Notes: Self-funded SHPs are an arrangement in which a school provides health benefits to students and assumes the insurance risk for claims payment; an insurance carrier may act as a third party administrator but is not at risk for medical costs. Self-funded schools likely purchase reinsurance for very large claims. The analysis excludes schools that did not provide annual premium data for students only. Premiums may vary due to the range of benefits covered by the SHP and the scope of services provided at on-campus student health centers. Student health centers may lower premiums, as some medical expenses will be covered exclusively through school, and not insurance carrier, resources. Northeastern University is categorized as an other school for the 2005-2006 academic year and as a self-funded school for the 2006-2007 and 2007-2008 academic years. Numbers shown are a three-year weighted average for the 2005-2006 through 2007-2008 academic years; the weighted average is calculated by computing a numerical total for each school category for each academic year and calculating the mean of the three resulting totals. Premiums are rounded to the nearest whole dollar.Source: DHCFP Student Health Program 2005, 2006, and 2007 Performance Metrics dataset as of 8/25/09.
Percent Total Average Student Enrollment:
8.1% 3.7% 13.6% 25.0% 49.6%
Massachusetts Division of Health Care Finance and Policy 14
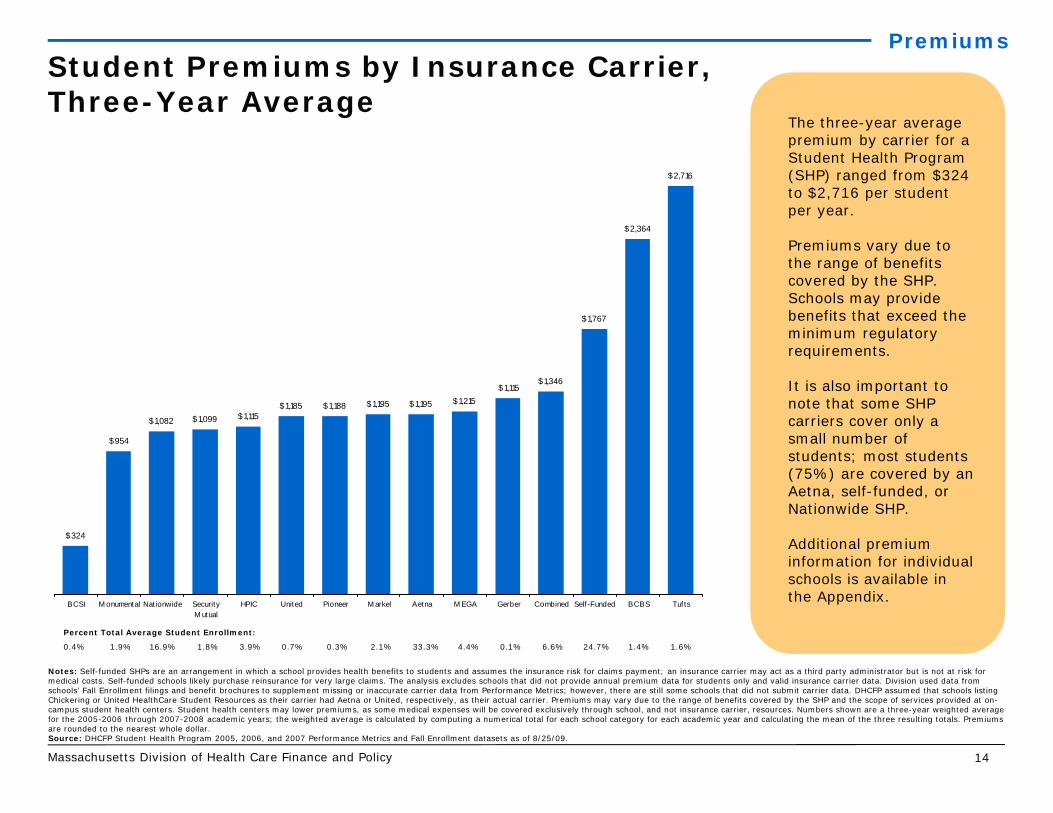
The three-year average premium by carrier for a Student Health Program (SHP) ranged from $324 to $2,716 per student per year.
Premiums vary due to the range of benefits covered by the SHP. Schools may provide benefits that exceed the minimum regulatory requirements.
It is also important to note that some SHP carriers cover only a small number of students; most students (75%) are covered by an Aetna, self-funded, or Nationwide SHP.
Additional premium information for individual schools is available in the Appendix.
$324
$954
$1,082 $1,115$1,185 $1,188 $1,195 $1,195 $1,215
$1,346
$1,767
$2,364
$2,716
$1,115
$1,099
BCSI M onumental Nationwide SecurityM utual
HPIC United Pioneer M arkel Aetna M EGA Gerber Combined Self -Funded BCBS Tufts
Student Premiums by Insurance Carrier, Three-Year Average
Premiums
Notes: Self-funded SHPs are an arrangement in which a school provides health benefits to students and assumes the insurance risk for claims payment; an insurance carrier may act as a third party administrator but is not at risk for medical costs. Self-funded schools likely purchase reinsurance for very large claims. The analysis excludes schools that did not provide annual premium data for students only and valid insurance carrier data. Division used data from schools’ Fall Enrollment filings and benefit brochures to supplement missing or inaccurate carrier data from Performance Metrics; however, there are still some schools that did not submit carrier data. DHCFP assumed that schools listing Chickering or United HealthCare Student Resources as their carrier had Aetna or United, respectively, as their actual carrier. Premiums may vary due to the range of benefits covered by the SHP and the scope of services provided at on-campus student health centers. Student health centers may lower premiums, as some medical expenses will be covered exclusively through school, and not insurance carrier, resources. Numbers shown are a three-year weighted average for the 2005-2006 through 2007-2008 academic years; the weighted average is calculated by computing a numerical total for each school category for each academic year and calculating the mean of the three resulting totals. Premiums are rounded to the nearest whole dollar.Source: DHCFP Student Health Program 2005, 2006, and 2007 Performance Metrics and Fall Enrollment datasets as of 8/25/09.
Percent Total Average Student Enrollment:
0.4% 1.9% 16.9% 1.8% 3.9% 0.7% 0.3% 2.1% 33.3% 4.4% 0.1% 6.6% 24.7% 1.4% 1.6%

Massachusetts Division of Health Care Finance and Policy 15
Student Health Program (SHP) medical expense ratios are lower than private insurance products.
SHP administrative expense ratios are unfavorable compared to private insurance products. This may be due, in part, to SHP premiums being lower than private insurance products. With fewer premium dollars to pay for fixed expenses, administrative costs will account for a larger percentage of total premiums.
SHP profit margins are generally much higher than private insurance products.
77%71% 75%
64%69%
88%
25%
25%
20% 13%24%
20%
10%
-2%
20%8% 11% 12% 10%
2%
56%
100%100%100%100%100%100%100%
CommunityColleges
StateColleges
UMassSchools
Self-FundedSchools
OtherSchools
All Schools 2008 PrivateInsurance
Medical Expense Ratio Administrative Expense Ratio Profit Margin
Expense Ratios and Profit Margin by School Category, Three-Year Average
Financial Performance
Notes: Medical expense ratio is calculated by dividing the total medical expenses by total premiums earned. Administrative expense ratio is calculated by dividing the total administrative expenses (including commissions) by total premiums earned. Profit margin is calculated by dividing the difference between the total premium and sum of total medical and administrative expenses (including commissions) by total premiums earned. Self-funded SHPs are an arrangement in which a school provides health benefits to students and assumes the insurance risk for claims payment; an insurance carrier may act as a third party administrator but is not at risk for medical costs. Self-funded schools likely purchase reinsurance for very large claims. The analysis excludes schools that did not provide total earned premium, total medical expense, and total administrative expense data. Northeastern University is categorized as an other school for the 2005-2006 academic year and as a self-funded school for the 2006-2007 and 2007-2008 academic years. Percentages shown are a three-year weighted average for the 2005-2006 through 2007-2008 academic years; the weighted average is calculated using the numerical totals for each school category for each academic year and calculating the mean of the three resulting percentages. Percentages are rounded to the nearest whole percent and may not sum to 100% due to rounding.Source: DHCFP Student Health Program 2005, 2006, 2007 Performance Metrics dataset as of 8/25/09. QSHIP Minimum Benefits Analysis for the Massachusetts Division of Health Care Finance and Policy from Oliver Wyman Actuarial Consulting, Inc. on October 30, 2009. Comparative private insurance information derived from data included on pages 17 through 19 of Health Care in Massachusetts: Key Indicators, May 2009.
Percent Total Average Student Enrollment:
8.1% 3.7% 13.6% 25.0% 49.6% 100.0% N/A

Massachusetts Division of Health Care Finance and Policy 16
Student Health Program (SHP) expense ratios and profit margins vary significantly across carriers participating in the SHP market.
It is also important to note that medical expense ratios can vary significantly from year to year, particularly for schools with fewer students enrolled.
It is also important to note that some SHP carriers cover only a small number of students; most students (75%) are covered by an Aetna, self-funded, or Nationwide SHP.
68%79%
56%47%
56%64% 66%
47%
75%
89%
46%
88%
21%
27%
34%
27%
27%
27%
27% 27%
32%
13%
14%
27%
10%11%2%
-13%
18%26%
17%9% 7%
22%11%
-2%
27%
2%
71%
100%100%100%100%100%100%100%100%100%100%100%100%
100%
Aetna BCBS BCSI Combined HPIC M arkel M EGA Nationwide SecurityM utual
Self-Funded
Tufts United 2008Private
Insurance
Medical Expense Ratio Administrative Expense Ratio Profit Margin
Expense Ratios and Profit Margin by Insurance Carrier, Three-Year Average
Financial Performance
Notes: Medical expense ratio is calculated by dividing the total medical expenses by total premiums earned. Administrative expense ratio is calculated by dividing the total administrative expenses (including commissions) by total premiums earned. Profit margin is calculated by dividing the difference between the total premium and sum of total medical and administrative expenses (including commissions) by total premiums earned. Self-funded SHPs are an arrangement in which a school provides health benefits to students and assumes the insurance risk for claims payment; an insurance carrier may act as a third party administrator but is not at risk for medical costs. Self-funded schools likely purchase reinsurance for very large claims. The analysis excludes schools that did not provide total earned premium, total medical expense, total administrative expense, and valid insurance carrier data. DHCFP used data from the Fall Enrollment filings and benefit brochures to supplement missing or inaccurate carrier data from Performance Metrics; however, there are still some schools that did not submit carrier data. DHCFP assumed that schools with Chickering or United HealthCare Student Resources as their carrier had Aetna or United, respectively, as their actual carrier. Percentages shown are a three-year weighted average for the 2005-2006 through 2007-2008 academic years; the weighted average is calculated using the numerical totals for each school category for each academic year and calculating the mean of the three resulting percentages. Percentages are rounded to the nearest whole percent and may not sum to 100% due to rounding.Source: DHCFP Student Health Program 2005, 2006, 2007 Performance Metrics and Fall Enrollment datasets as of 8/25/09. QSHIP Minimum Benefits Analysis for the Massachusetts Division of Health Care Finance and Policy from Oliver Wyman Actuarial Consulting, Inc. on October 30, 2009. Comparative private insurance information derived from data included on pages 17 through 19 of Health Care in Massachusetts: Key Indicators, May 2009.
Percent Total Average Student Enrollment:
33.3% 1.4% 0.4% 6.6% 3.9% 2.1% 4.4% 16.9% 1.8% 24.7% 1.6% 0.7% N/A
Massachusetts Division of Health Care Finance and Policy 17
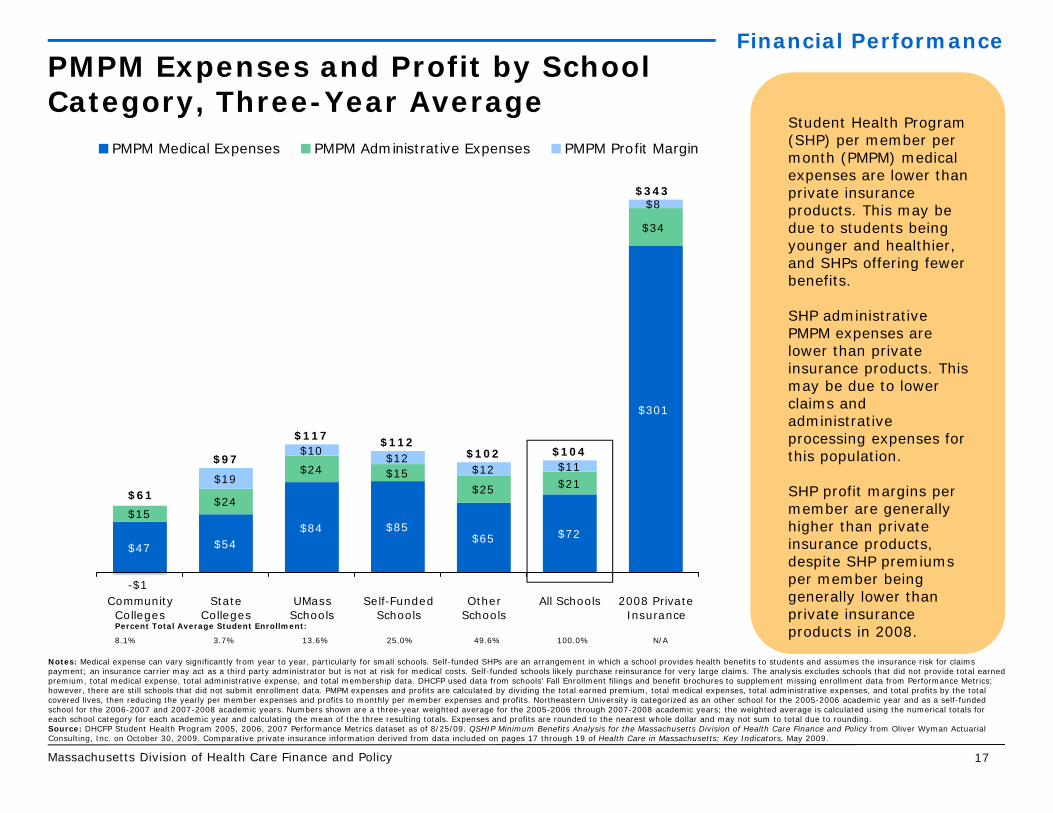
Student Health Program (SHP) per member per month (PMPM) medical expenses are lower than private insurance products. This may be due to students being younger and healthier, and SHPs offering fewer benefits.
SHP administrative PMPM expenses are lower than private insurance products. This may be due to lower claims and administrative processing expenses for this population.
SHP profit margins per member are generally higher than private insurance products, despite SHP premiums per member being generally lower than private insurance products in 2008.
$47
$84 $85$65 $72
$301
$15$24
$24 $15$25 $21
$34
$19
$10 $12$12 $11
$8
$54
-$1
$117
$343
$104$102$112
$97
$61
CommunityColleges
StateColleges
UMassSchools
Self-FundedSchools
OtherSchools
All Schools 2008 PrivateInsurance
PMPM Medical Expenses PMPM Administrative Expenses PMPM Profit Margin
PMPM Expenses and Profit by School Category, Three-Year Average
Financial Performance
Notes: Medical expense can vary significantly from year to year, particularly for small schools. Self-funded SHPs are an arrangement in which a school provides health benefits to students and assumes the insurance risk for claims payment; an insurance carrier may act as a third party administrator but is not at risk for medical costs. Self-funded schools likely purchase reinsurance for very large claims. The analysis excludes schools that did not provide total earned premium, total medical expense, total administrative expense, and total membership data. DHCFP used data from schools’ Fall Enrollment filings and benefit brochures to supplement missing enrollment data from Performance Metrics; however, there are still schools that did not submit enrollment data. PMPM expenses and profits are calculated by dividing the total earned premium, total medical expenses, total administrative expenses, and total profits by the total covered lives, then reducing the yearly per member expenses and profits to monthly per member expenses and profits. Northeastern University is categorized as an other school for the 2005-2006 academic year and as a self-funded school for the 2006-2007 and 2007-2008 academic years. Numbers shown are a three-year weighted average for the 2005-2006 through 2007-2008 academic years; the weighted average is calculated using the numerical totals for each school category for each academic year and calculating the mean of the three resulting totals. Expenses and profits are rounded to the nearest whole dollar and may not sum to total due to rounding.Source: DHCFP Student Health Program 2005, 2006, 2007 Performance Metrics dataset as of 8/25/09. QSHIP Minimum Benefits Analysis for the Massachusetts Division of Health Care Finance and Policy from Oliver Wyman Actuarial Consulting, Inc. on October 30, 2009. Comparative private insurance information derived from data included on pages 17 through 19 of Health Care in Massachusetts: Key Indicators, May 2009.
Percent Total Average Student Enrollment:
8.1% 3.7% 13.6% 25.0% 49.6% 100.0% N/A
Massachusetts Division of Health Care Finance and Policy 18
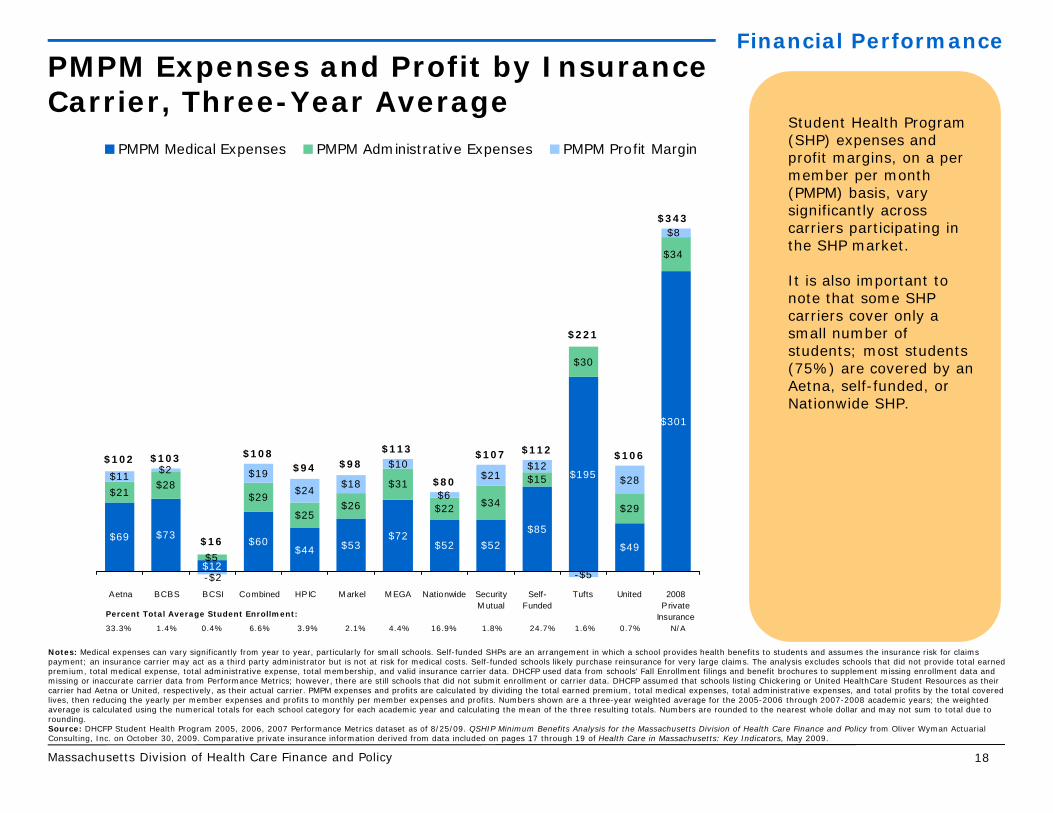
Student Health Program (SHP) expenses and profit margins, on a per member per month (PMPM) basis, vary significantly across carriers participating in the SHP market.
It is also important to note that some SHP carriers cover only a small number of students; most students (75%) are covered by an Aetna, self-funded, or Nationwide SHP.
$69
$12
$60$44 $53
$72$52 $52
$85
$195
$49
$301
$21$28
$5
$29
$25$26
$31
$22 $34
$15
$30
$29
$34
$11 $2 $19$24 $18
$10
$6
$21$12
-$5
$28
$8
$73
-$2
$102 $103 $108$94 $98
$113
$80
$107 $112 $106
$343
$16
$221
Aetna BCBS BCSI Combined HPIC M arkel M EGA Nationwide SecurityM utual
Self-Funded
Tufts United 2008Private
Insurance
PMPM Medical Expenses PMPM Administrative Expenses PMPM Profit Margin
PMPM Expenses and Profit by Insurance Carrier, Three-Year Average
Financial Performance
Notes: Medical expenses can vary significantly from year to year, particularly for small schools. Self-funded SHPs are an arrangement in which a school provides health benefits to students and assumes the insurance risk for claims payment; an insurance carrier may act as a third party administrator but is not at risk for medical costs. Self-funded schools likely purchase reinsurance for very large claims. The analysis excludes schools that did not provide total earned premium, total medical expense, total administrative expense, total membership, and valid insurance carrier data. DHCFP used data from schools’ Fall Enrollment filings and benefit brochures to supplement missing enrollment data and missing or inaccurate carrier data from Performance Metrics; however, there are still schools that did not submit enrollment or carrier data. DHCFP assumed that schools listing Chickering or United HealthCare Student Resources as their carrier had Aetna or United, respectively, as their actual carrier. PMPM expenses and profits are calculated by dividing the total earned premium, total medical expenses, total administrative expenses, and total profits by the total covered lives, then reducing the yearly per member expenses and profits to monthly per member expenses and profits. Numbers shown are a three-year weighted average for the 2005-2006 through 2007-2008 academic years; the weighted average is calculated using the numerical totals for each school category for each academic year and calculating the mean of the three resulting totals. Numbers are rounded to the nearest whole dollar and may not sum to total due to rounding.Source: DHCFP Student Health Program 2005, 2006, 2007 Performance Metrics dataset as of 8/25/09. QSHIP Minimum Benefits Analysis for the Massachusetts Division of Health Care Finance and Policy from Oliver Wyman Actuarial Consulting, Inc. on October 30, 2009. Comparative private insurance information derived from data included on pages 17 through 19 of Health Care in Massachusetts: Key Indicators, May 2009.
Percent Total Average Student Enrollment:
33.3% 1.4% 0.4% 6.6% 3.9% 2.1% 4.4% 16.9% 1.8% 24.7% 1.6% 0.7% N/A
Massachusetts Division of Health Care Finance and Policy 19
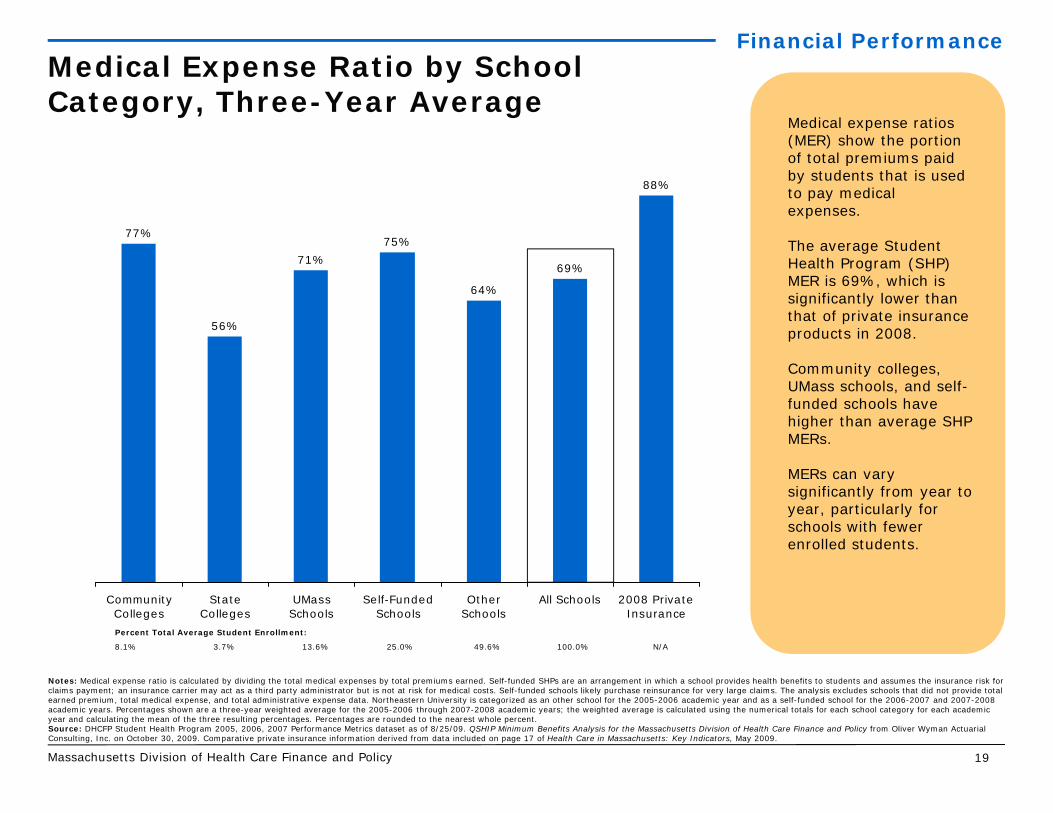
Medical expense ratios (MER) show the portion of total premiums paid by students that is used to pay medical expenses.
The average Student Health Program (SHP) MER is 69%, which is significantly lower than that of private insurance products in 2008.
Community colleges, UMass schools, and self-funded schools have higher than average SHP MERs.
MERs can vary significantly from year to year, particularly for schools with fewer enrolled students.
77%
56%
71%75%
64%
69%
88%
CommunityColleges
StateColleges
UMassSchools
Self-FundedSchools
OtherSchools
All Schools 2008 PrivateInsurance
Medical Expense Ratio by School Category, Three-Year Average
Financial Performance
Notes: Medical expense ratio is calculated by dividing the total medical expenses by total premiums earned. Self-funded SHPs are an arrangement in which a school provides health benefits to students and assumes the insurance risk for claims payment; an insurance carrier may act as a third party administrator but is not at risk for medical costs. Self-funded schools likely purchase reinsurance for very large claims. The analysis excludes schools that did not provide total earned premium, total medical expense, and total administrative expense data. Northeastern University is categorized as an other school for the 2005-2006 academic year and as a self-funded school for the 2006-2007 and 2007-2008 academic years. Percentages shown are a three-year weighted average for the 2005-2006 through 2007-2008 academic years; the weighted average is calculated using the numerical totals for each school category for each academic year and calculating the mean of the three resulting percentages. Percentages are rounded to the nearest whole percent. Source: DHCFP Student Health Program 2005, 2006, 2007 Performance Metrics dataset as of 8/25/09. QSHIP Minimum Benefits Analysis for the Massachusetts Division of Health Care Finance and Policy from Oliver Wyman Actuarial Consulting, Inc. on October 30, 2009. Comparative private insurance information derived from data included on page 17 of Health Care in Massachusetts: Key Indicators, May 2009.
Percent Total Average Student Enrollment:
8.1% 3.7% 13.6% 25.0% 49.6% 100.0% N/A
Massachusetts Division of Health Care Finance and Policy 20
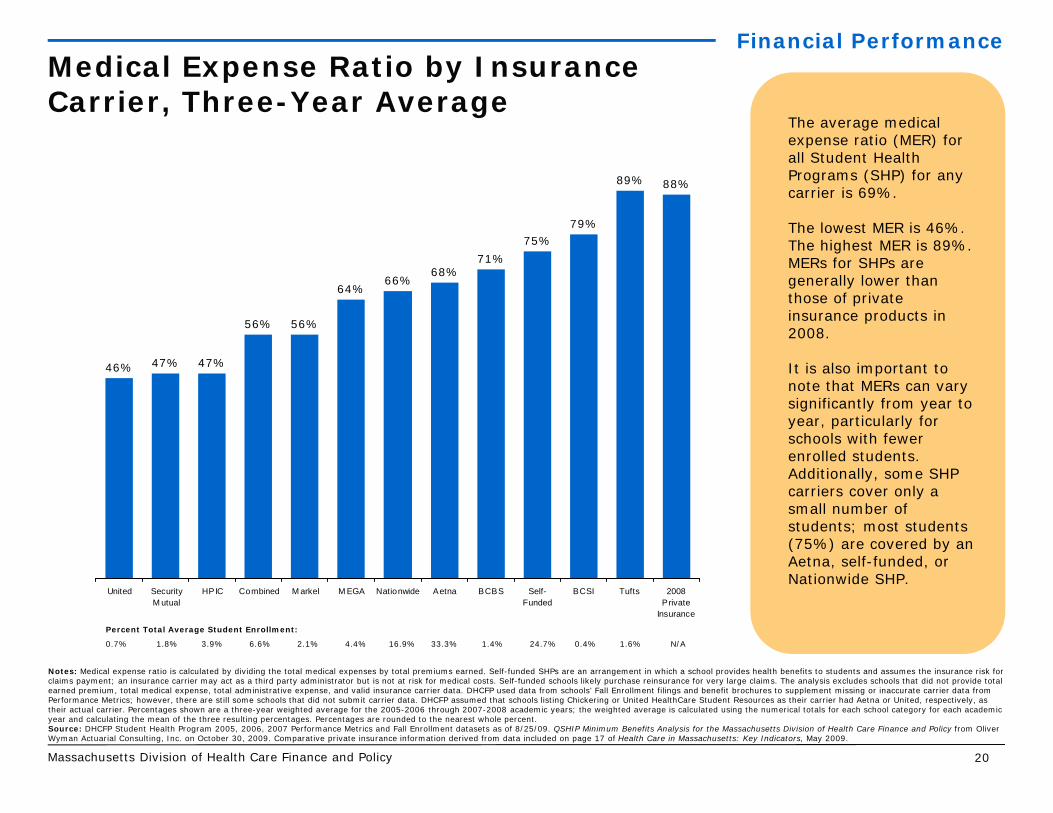
The average medical expense ratio (MER) for all Student Health Programs (SHP) for any carrier is 69%.
The lowest MER is 46%. The highest MER is 89%. MERs for SHPs are generally lower than those of private insurance products in 2008.
It is also important to note that MERs can vary significantly from year to year, particularly for schools with fewer enrolled students. Additionally, some SHP carriers cover only a small number of students; most students (75%) are covered by an Aetna, self-funded, or Nationwide SHP.
46% 47% 47%
56% 56%
64%66%
68%71%
75%79%
89% 88%
United SecurityM utual
HPIC Combined M arkel M EGA Nationwide Aetna BCBS Self-Funded
BCSI Tufts 2008Private
Insurance
Medical Expense Ratio by Insurance Carrier, Three-Year Average
Financial Performance
Notes: Medical expense ratio is calculated by dividing the total medical expenses by total premiums earned. Self-funded SHPs are an arrangement in which a school provides health benefits to students and assumes the insurance risk for claims payment; an insurance carrier may act as a third party administrator but is not at risk for medical costs. Self-funded schools likely purchase reinsurance for very large claims. The analysis excludes schools that did not provide total earned premium, total medical expense, total administrative expense, and valid insurance carrier data. DHCFP used data from schools’ Fall Enrollment filings and benefit brochures to supplement missing or inaccurate carrier data from Performance Metrics; however, there are still some schools that did not submit carrier data. DHCFP assumed that schools listing Chickering or United HealthCare Student Resources as their carrier had Aetna or United, respectively, as their actual carrier. Percentages shown are a three-year weighted average for the 2005-2006 through 2007-2008 academic years; the weighted average is calculated using the numerical totals for each school category for each academic year and calculating the mean of the three resulting percentages. Percentages are rounded to the nearest whole percent.Source: DHCFP Student Health Program 2005, 2006, 2007 Performance Metrics and Fall Enrollment datasets as of 8/25/09. QSHIP Minimum Benefits Analysis for the Massachusetts Division of Health Care Finance and Policy from Oliver Wyman Actuarial Consulting, Inc. on October 30, 2009. Comparative private insurance information derived from data included on page 17 of Health Care in Massachusetts: Key Indicators, May 2009.
Percent Total Average Student Enrollment:
0.7% 1.8% 3.9% 6.6% 2.1% 4.4% 16.9% 33.3% 1.4% 24.7% 0.4% 1.6% N/A

Massachusetts Division of Health Care Finance and Policy 21
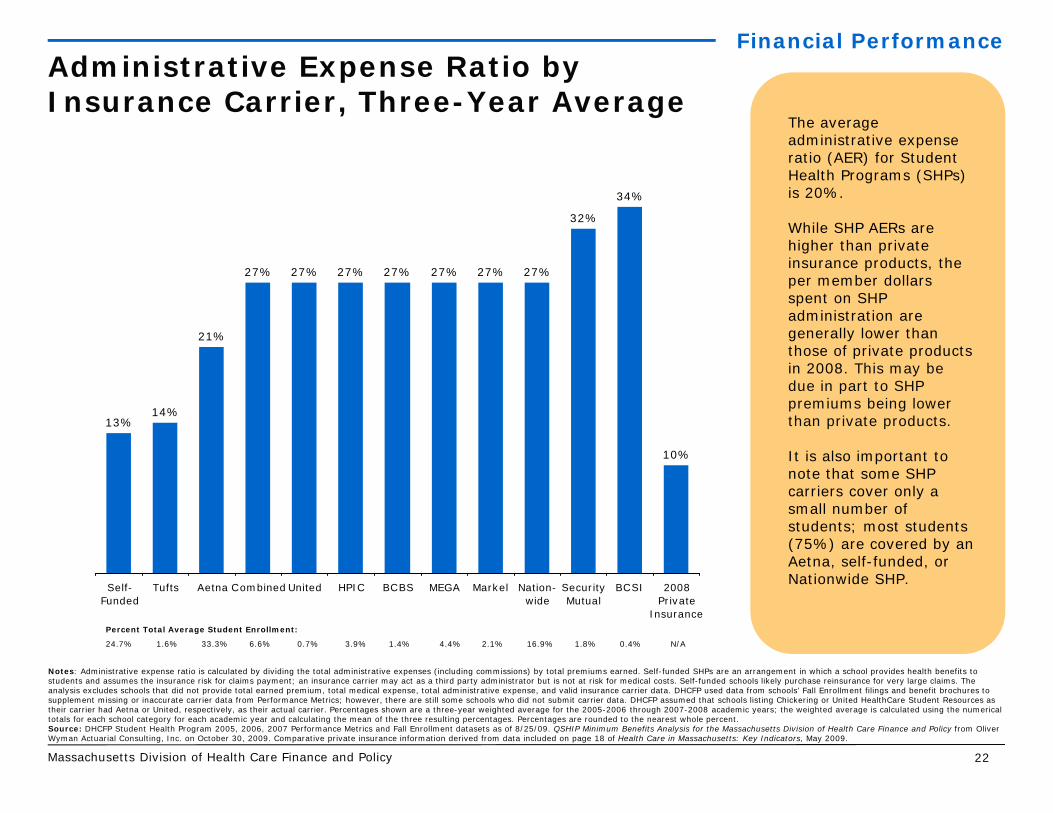
Administrative expense ratios (AER) show the portion of the total premiums paid by students that is used for Student Health Program (SHP) administration, including insurance broker commissions.
The average AER for schools is 20%. Only schools who self-fund their SHPs have a lower AER.
SHP AERs are higher than those of private insurance products; however, the per member dollars spent on administrative expenses are generally lower for SHPs than private insurance products.
25% 25%
20%
13%
24%
20%
10%
CommunityColleges
StateColleges
UMassSchools
Self-FundedSchools
OtherSchools
All Schools 2008 PrivateInsurance
Administrative Expense Ratio by School Category, Three-Year Average
Financial Performance
Notes: Administrative expense ratio is calculated by dividing the total administrative expenses (including commissions) by total premiums earned. Self-funded SHPs are an arrangement in which a school provides health benefits to students and assumes the insurance risk for claims payment; an insurance carrier may act as a third party administrator but is not at risk for medical costs. Self-funded schools likely purchase reinsurance for very large claims. The analysis excludes schools that did not provide total earned premium, total medical expense, and total administrative expense data. Northeastern University is categorized as an other school for the 2005-2006 academic year and as a self-funded school for the 2006-2007 and 2007-2008 academic years. Percentages shown are a three-year weighted average for the 2005-2006 through 2007-2008 academic years; the weighted average is calculated using the numerical totals for each school category for each academic year and calculating the mean of the three resulting percentages. Percentages are rounded to the nearest whole percent.Source: DHCFP Student Health Program 2005, 2006, 2007 Performance Metrics dataset as of 8/25/09. QSHIP Minimum Benefits Analysis for the Massachusetts Division of Health Care Finance and Policy from Oliver Wyman Actuarial Consulting, Inc. on October 30, 2009. Comparative private insurance information derived from data included on page 18 of Health Care in Massachusetts: Key Indicators, May 2009.
Percent Total Average Student Enrollment:
8.1% 3.7% 13.6% 25.0% 49.6% 100.0% N/A
Massachusetts Division of Health Care Finance and Policy 22
The average administrative expense ratio (AER) for Student Health Programs (SHPs) is 20%.
While SHP AERs are higher than private insurance products, the per member dollars spent on SHP administration are generally lower than those of private products in 2008. This may be due in part to SHP premiums being lower than private products.
It is also important to note that some SHP carriers cover only a small number of students; most students (75%) are covered by an Aetna, self-funded, or Nationwide SHP.
13%14%
21%
27% 27% 27% 27% 27% 27% 27%
32%
34%
10%
Self-Funded
Tufts Aetna Combined United HPIC BCBS MEGA Markel Nation-wide
SecurityMutual
BCSI 2008Private
Insurance
Administrative Expense Ratio by Insurance Carrier, Three-Year Average
Financial Performance
Notes: Administrative expense ratio is calculated by dividing the total administrative expenses (including commissions) by total premiums earned. Self-funded SHPs are an arrangement in which a school provides health benefits to students and assumes the insurance risk for claims payment; an insurance carrier may act as a third party administrator but is not at risk for medical costs. Self-funded schools likely purchase reinsurance for very large claims. The analysis excludes schools that did not provide total earned premium, total medical expense, total administrative expense, and valid insurance carrier data. DHCFP used data from schools’ Fall Enrollment filings and benefit brochures to supplement missing or inaccurate carrier data from Performance Metrics; however, there are still some schools who did not submit carrier data. DHCFP assumed that schools listing Chickering or United HealthCare Student Resources as their carrier had Aetna or United, respectively, as their actual carrier. Percentages shown are a three-year weighted average for the 2005-2006 through 2007-2008 academic years; the weighted average is calculated using the numerical totals for each school category for each academic year and calculating the mean of the three resulting percentages. Percentages are rounded to the nearest whole percent.Source: DHCFP Student Health Program 2005, 2006, 2007 Performance Metrics and Fall Enrollment datasets as of 8/25/09. QSHIP Minimum Benefits Analysis for the Massachusetts Division of Health Care Finance and Policy from Oliver Wyman Actuarial Consulting, Inc. on October 30, 2009. Comparative private insurance information derived from data included on page 18 of Health Care in Massachusetts: Key Indicators, May 2009.
Percent Total Average Student Enrollment:
24.7% 1.6% 33.3% 6.6% 0.7% 3.9% 1.4% 4.4% 2.1% 16.9% 1.8% 0.4% N/A
Massachusetts Division of Health Care Finance and Policy 23
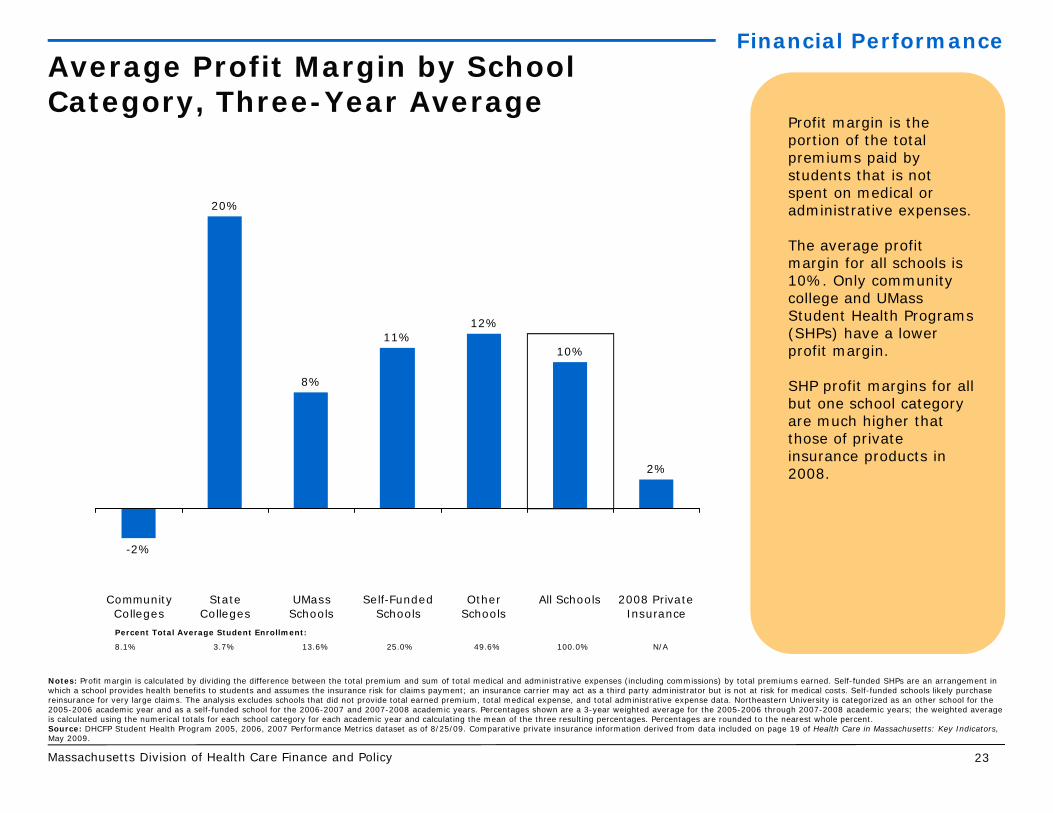
Profit margin is the portion of the total premiums paid by students that is not spent on medical or administrative expenses.
The average profit margin for all schools is 10%. Only community college and UMass Student Health Programs (SHPs) have a lower profit margin.
SHP profit margins for all but one school category are much higher that those of private insurance products in 2008.
-2%
20%
8%
11%12%
10%
2%
CommunityColleges
StateColleges
UMassSchools
Self-FundedSchools
OtherSchools
All Schools 2008 PrivateInsurance
Average Profit Margin by School Category, Three-Year Average
Financial Performance
Notes: Profit margin is calculated by dividing the difference between the total premium and sum of total medical and administrative expenses (including commissions) by total premiums earned. Self-funded SHPs are an arrangement in which a school provides health benefits to students and assumes the insurance risk for claims payment; an insurance carrier may act as a third party administrator but is not at risk for medical costs. Self-funded schools likely purchase reinsurance for very large claims. The analysis excludes schools that did not provide total earned premium, total medical expense, and total administrative expense data. Northeastern University is categorized as an other school for the 2005-2006 academic year and as a self-funded school for the 2006-2007 and 2007-2008 academic years. Percentages shown are a 3-year weighted average for the 2005-2006 through 2007-2008 academic years; the weighted average is calculated using the numerical totals for each school category for each academic year and calculating the mean of the three resulting percentages. Percentages are rounded to the nearest whole percent.Source: DHCFP Student Health Program 2005, 2006, 2007 Performance Metrics dataset as of 8/25/09. Comparative private insurance information derived from data included on page 19 of Health Care in Massachusetts: Key Indicators, May 2009.
Percent Total Average Student Enrollment:
8.1% 3.7% 13.6% 25.0% 49.6% 100.0% N/A

Massachusetts Division of Health Care Finance and Policy 24
The average profit margin for all plans is 10%. The lowest profit margin is -13%. The highest profit margin is 27%.
Student Health Program (SHP) profit margins are generally much higher than those of private insurance products in 2008.
It is also important to note that some SHP carriers cover only a small number of students; most students (75%) are covered by an Aetna, self-funded, or Nationwide SHP.
-13%
2%
7%
9%11% 11%
17%18%
22%
26%27%
2%
-2%
BCSI Tufts BCBS Nation-wide
M EGA Aetna Self-Funded
M arkel Combined SecurityM utual
HPIC United 2008Private
Insurance
Profit Margin by Insurance Carrier,Three-Year Average
Financial Performance
Notes: Profit margin is calculated by dividing the difference between the total premium and sum of total medical and administrative expenses (including commissions) by total premiums earned. Self-funded SHPs are an arrangement in which a school provides health benefits to students and assumes the insurance risk for claims payment; an insurance carrier may act as a third party administrator but is not at risk for medical costs. Self-funded schools likely purchase reinsurance for very large claims. The analysis excludes schools that did not provide total earned premium, total medical expense, total administrative expense, and valid insurance carrier data. DHCFP used data from schools’ Fall Enrollment filings and benefit brochures to supplement missing or inaccurate carrier data from Performance Metrics; however, there are still some schools that did not submit carrier data. DHCFP assumed that schools listing Chickering or United HealthCare Student Resources as their carrier had Aetna or United, respectively, as their actual carrier. Percentages shown are a three-year weighted average for the 2005-2006 through 2007-2008 academic years; the weighted average is calculated using the numerical totals for each school category for each academic year and calculating the mean of the three resulting percentages. Percentages are rounded to the nearest whole percent.Source: DHCFP Student Health Program 2005, 2006, 2007 Performance Metrics and Fall Enrollment datasets as of 8/25/09. Comparative private insurance information derived from data included on page 19 of Health Care in Massachusetts: Key Indicators, May 2009.
Percent Total Average Student Enrollment:
0.4% 1.6% 1.4% 16.9% 4.4% 33.3% 24.7% 2.1% 6.6% 1.8% 3.9% 0.7% N/A
Massachusetts Division of Health Care Finance and Policy 25
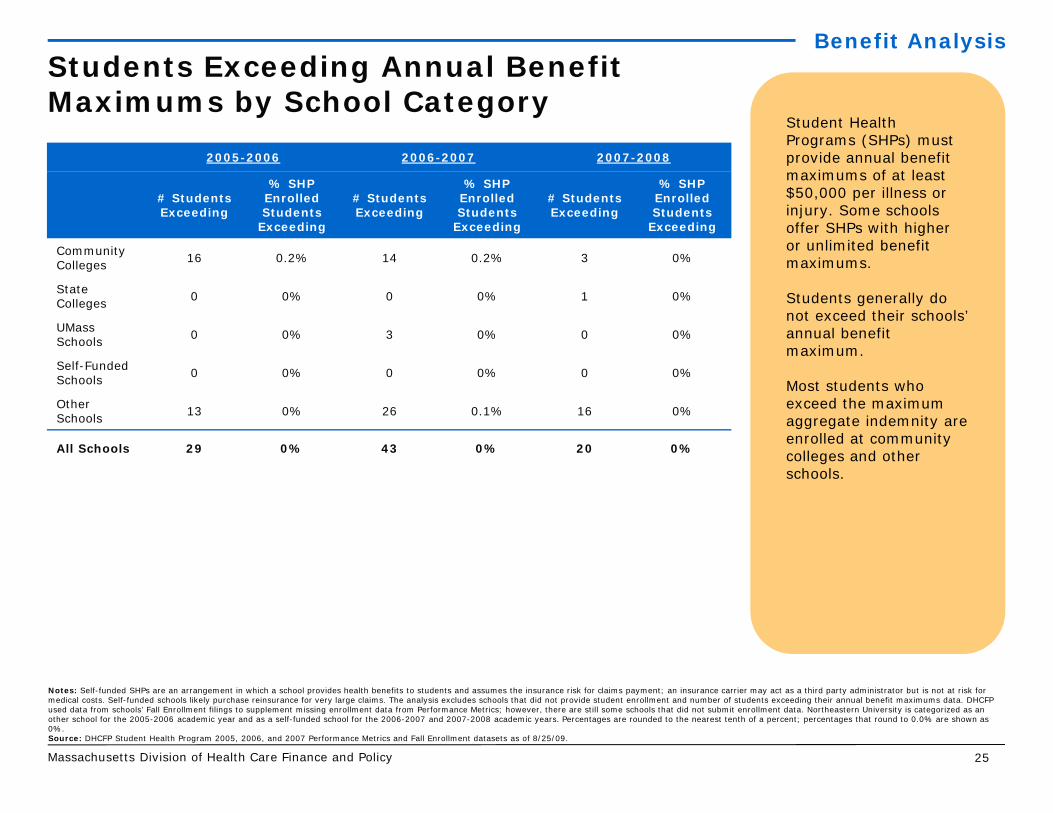
Students Exceeding Annual Benefit Maximums by School Category
2005-2006 2006-2007 2007-2008
# Students Exceeding
% SHP Enrolled Students
Exceeding
# Students Exceeding
% SHP Enrolled Students
Exceeding
# Students Exceeding
% SHP Enrolled Students
Exceeding
Community Colleges 16 0.2% 14 0.2% 3 0%
State Colleges 0 0% 0 0% 1 0%
UMass Schools 0 0% 3 0% 0 0%
Self-Funded Schools 0 0% 0 0% 0 0%
Other Schools 13 0% 26 0.1% 16 0%
All Schools 29 0% 43 0% 20 0%
Student Health Programs (SHPs) must provide annual benefit maximums of at least $50,000 per illness or injury. Some schools offer SHPs with higher or unlimited benefit maximums.
Students generally do not exceed their schools’ annual benefit maximum.
Most students who exceed the maximum aggregate indemnity are enrolled at community colleges and other schools.
Benefit Analysis
Notes: Self-funded SHPs are an arrangement in which a school provides health benefits to students and assumes the insurance risk for claims payment; an insurance carrier may act as a third party administrator but is not at risk for medical costs. Self-funded schools likely purchase reinsurance for very large claims. The analysis excludes schools that did not provide student enrollment and number of students exceeding their annual benefit maximums data. DHCFP used data from schools’ Fall Enrollment filings to supplement missing enrollment data from Performance Metrics; however, there are still some schools that did not submit enrollment data. Northeastern University is categorized as an other school for the 2005-2006 academic year and as a self-funded school for the 2006-2007 and 2007-2008 academic years. Percentages are rounded to the nearest tenth of a percent; percentages that round to 0.0% are shown as 0%.Source: DHCFP Student Health Program 2005, 2006, and 2007 Performance Metrics and Fall Enrollment datasets as of 8/25/09.

Massachusetts Division of Health Care Finance and Policy 26
Students Exceeding Annual Benefit Maximums by Insurance Carrier
2005-2006 2006-2007 2007-2008
# Students Exceeding
% SHP Enrolled Students
Exceeding
# Students Exceeding
% SHP Enrolled Students
Exceeding
# Students Exceeding
% SHP Enrolled Students
Exceeding
Aetna 2 0% 6 0% 0 0%
BCBS 0 0% 0 0% 0 0%
BCSI 0 0% 0 0% - -
Combined 0 0% 4 0.1% 9 0.1%
HPIC - - - - 0 0%
Markel 0 0% 11 0.4% 1 0.1%
MEGA 0 0% 3 0% 0 0%
Monumental 0 0% 0 0% 0 0%
Nationwide 23 0.1% 16 0.1% 10 0.1%
Pioneer - - 1 0.3% - -
Security Mutual 4 0.2% 2 0.1% 0 0%
Self-Funded 0 0% 0 0% 0 0%
Tufts 0 0% 0 0% 0 0%
United - - 0 0% 0 0%
All Insurance Carriers 29 0% 43 0% 20 0%
Student Health Programs (SHPs) must provide annual benefit maximums of at least $50,000 per illness or injury. Some schools offer SHPs with higher or unlimited benefit maximums.
A relatively small number of students exceed the annual benefit maximum for their SHP; however, students who exceed this benefit maximum may be exposed to significant out-of-pocket expenses.
Most of the students who exceeded this benefit limit were enrolled in Nationwide SHPs.
Notes: Self-funded SHPs are an arrangement in which a school provides health benefits to students and assumes the insurance risk for claims payment; an insurance carrier may act as a third party administrator but is not at risk for medical costs. Self-funded schools likely purchase reinsurance for very large claims. The analysis excludes schools that did not provide student enrollment, number of students exceeding their annual benefit maximums, and valid insurance carrier data. DHCFP used data from schools’ Fall Enrollment filings and benefit brochures to supplement missing enrollment and missing or inaccurate carrier data from Performance Metrics; however, there are still some schools that did not submit enrollment or carrier data. DHCFP assumed that schools listing Chickering or United HealthCare Student Resources as their carrier had Aetna or United, respectively, as their actual carrier. Percentages are rounded to the nearest whole percent.Source: DHCFP Student Health Program 2005, 2006, and 2007 Performance Metrics and Fall Enrollment datasets as of 8/25/09. QSHIP Minimum Benefits Analysis for the Massachusetts Division of Health Care Finance and Policy from Oliver Wyman Actuarial Consulting, Inc. on October 30, 2009.
Benefit Analysis
Massachusetts Division of Health Care Finance and Policy 27
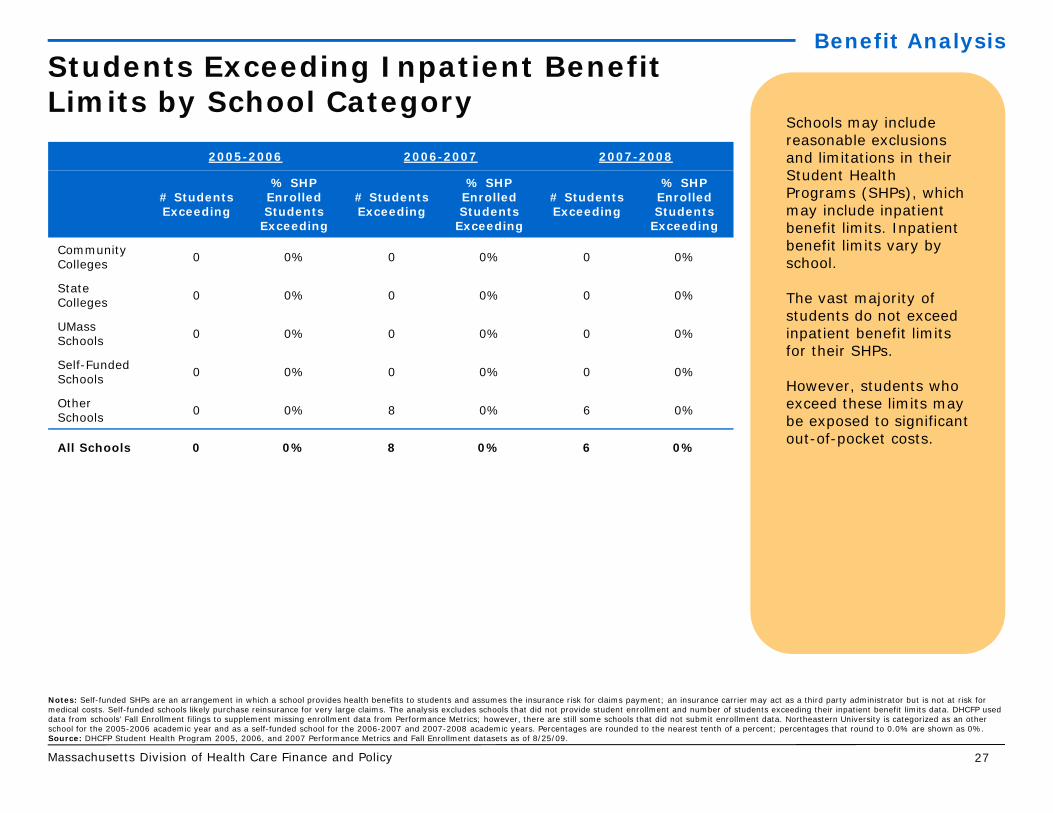
Students Exceeding Inpatient Benefit Limits by School Category
2005-2006 2006-2007 2007-2008
# Students Exceeding
% SHP Enrolled Students
Exceeding
# Students Exceeding
% SHP Enrolled Students
Exceeding
# Students Exceeding
% SHP Enrolled Students
Exceeding
Community Colleges 0 0% 0 0% 0 0%
State Colleges 0 0% 0 0% 0 0%
UMass Schools 0 0% 0 0% 0 0%
Self-Funded Schools 0 0% 0 0% 0 0%
Other Schools 0 0% 8 0% 6 0%
All Schools 0 0% 8 0% 6 0%
Schools may include reasonable exclusions and limitations in their Student Health Programs (SHPs), which may include inpatient benefit limits. Inpatient benefit limits vary by school.
The vast majority of students do not exceed inpatient benefit limits for their SHPs.
However, students who exceed these limits may be exposed to significant out-of-pocket costs.
Notes: Self-funded SHPs are an arrangement in which a school provides health benefits to students and assumes the insurance risk for claims payment; an insurance carrier may act as a third party administrator but is not at risk for medical costs. Self-funded schools likely purchase reinsurance for very large claims. The analysis excludes schools that did not provide student enrollment and number of students exceeding their inpatient benefit limits data. DHCFP used data from schools’ Fall Enrollment filings to supplement missing enrollment data from Performance Metrics; however, there are still some schools that did not submit enrollment data. Northeastern University is categorized as an other school for the 2005-2006 academic year and as a self-funded school for the 2006-2007 and 2007-2008 academic years. Percentages are rounded to the nearest tenth of a percent; percentages that round to 0.0% are shown as 0%.Source: DHCFP Student Health Program 2005, 2006, and 2007 Performance Metrics and Fall Enrollment datasets as of 8/25/09.
Benefit Analysis
Massachusetts Division of Health Care Finance and Policy 28
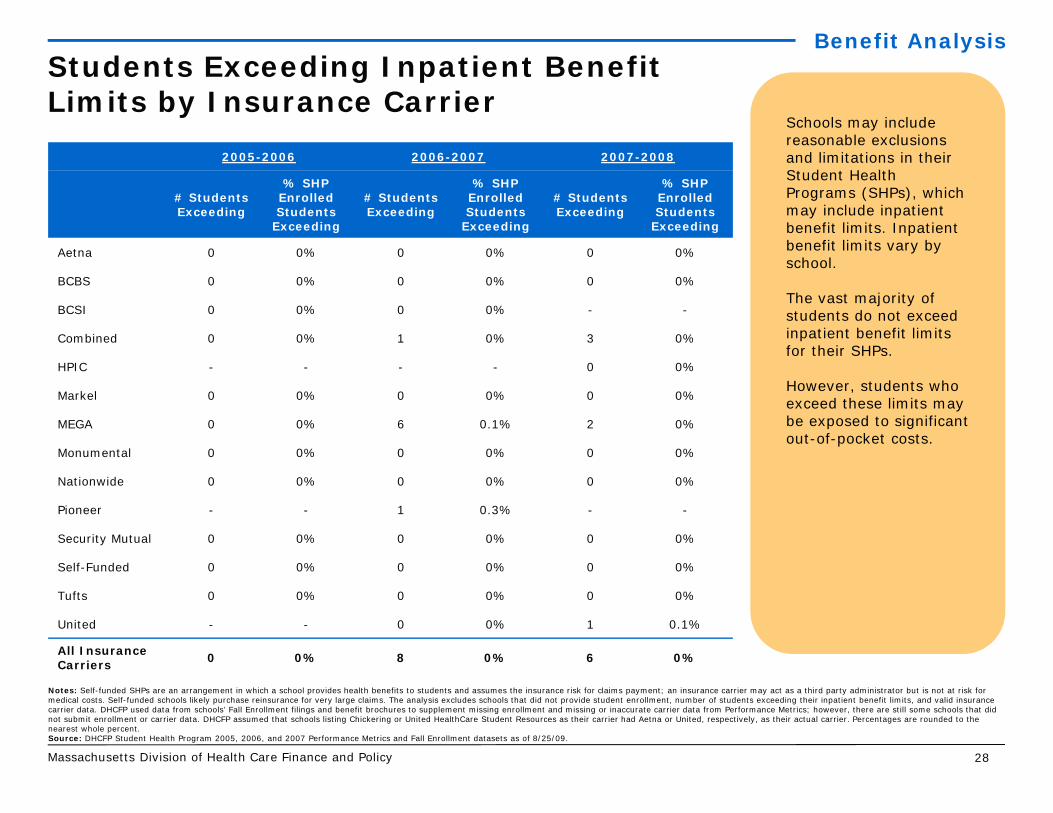
Students Exceeding Inpatient Benefit Limits by Insurance Carrier
2005-2006 2006-2007 2007-2008
# Students Exceeding
% SHP Enrolled Students
Exceeding
# Students Exceeding
% SHP Enrolled Students
Exceeding
# Students Exceeding
% SHP Enrolled Students
Exceeding
Aetna 0 0% 0 0% 0 0%
BCBS 0 0% 0 0% 0 0%
BCSI 0 0% 0 0% - -
Combined 0 0% 1 0% 3 0%
HPIC - - - - 0 0%
Markel 0 0% 0 0% 0 0%
MEGA 0 0% 6 0.1% 2 0%
Monumental 0 0% 0 0% 0 0%
Nationwide 0 0% 0 0% 0 0%
Pioneer - - 1 0.3% - -
Security Mutual 0 0% 0 0% 0 0%
Self-Funded 0 0% 0 0% 0 0%
Tufts 0 0% 0 0% 0 0%
United - - 0 0% 1 0.1%
All Insurance Carriers 0 0% 8 0% 6 0%
Schools may include reasonable exclusions and limitations in their Student Health Programs (SHPs), which may include inpatient benefit limits. Inpatient benefit limits vary by school.
The vast majority of students do not exceed inpatient benefit limits for their SHPs.
However, students who exceed these limits may be exposed to significant out-of-pocket costs.
Notes: Self-funded SHPs are an arrangement in which a school provides health benefits to students and assumes the insurance risk for claims payment; an insurance carrier may act as a third party administrator but is not at risk for medical costs. Self-funded schools likely purchase reinsurance for very large claims. The analysis excludes schools that did not provide student enrollment, number of students exceeding their inpatient benefit limits, and valid insurance carrier data. DHCFP used data from schools’ Fall Enrollment filings and benefit brochures to supplement missing enrollment and missing or inaccurate carrier data from Performance Metrics; however, there are still some schools that did not submit enrollment or carrier data. DHCFP assumed that schools listing Chickering or United HealthCare Student Resources as their carrier had Aetna or United, respectively, as their actual carrier. Percentages are rounded to the nearest whole percent.Source: DHCFP Student Health Program 2005, 2006, and 2007 Performance Metrics and Fall Enrollment datasets as of 8/25/09.
Benefit Analysis

Massachusetts Division of Health Care Finance and Policy 29
Students Exceeding Outpatient Benefit Limits by School Category
2005-2006 2006-2007 2007-2008
# Students Exceeding
% SHP Enrolled Students
Exceeding
# Students Exceeding
% SHP Enrolled Students
Exceeding
# Students Exceeding
% SHP Enrolled Students
Exceeding
Community Colleges 334 3.6% 257 3.1% 188 3.1%
State Colleges 62 1.6% 48 1.3% 44 1.3%
UMass Schools 156 1.2% 155 1.2% 28 0.2%
Self-Funded Schools 185 0.9% 197 0.8% 83 0.3%
Other Schools 802 2.3% 866 1.9% 608 1.3%
All Schools 1,539 1.8% 1,523 1.5% 951 0.9%
Schools may include reasonable exclusions and limitations in their Student Health Programs (SHPs), which may include outpatient benefit limits. Outpatient benefit limits vary by school.
Many more students exceed their SHP’s outpatient benefit limits than inpatient benefit limits.
Although the percent of total students is quite small, students who exceed this benefit limit may be exposed to significant out-of-pocket expenses.
Notes: Self-funded SHPs are an arrangement in which a school provides health benefits to students and assumes the insurance risk for claims payment; an insurance carrier may act as a third party administrator but is not at risk for medical costs. Self-funded schools likely purchase reinsurance for very large claims. The analysis excludes schools that did not provide student enrollment and number of students exceeding their outpatient benefit limits data. DHCFP used data from schools’ Fall Enrollment filings to supplement missing enrollment data from Performance Metrics filings; however, there are still some schools that did not submit enrollment data. Percentages are rounded to the nearest tenth of a percent; percentages that round to 0.0% are shown as 0%.Source: DHCFP Student Health Program 2005, 2006, and 2007 Performance Metrics and Fall Enrollment datasets as of 8/25/09.
Benefit Analysis

Massachusetts Division of Health Care Finance and Policy 30
Students Exceeding Outpatient Benefit Limits by Insurance Carrier
2005-2006 2006-2007 2007-2008
# Students Exceeding
% SHP Enrolled Students
Exceeding
# Students Exceeding
% SHP Enrolled Students
Exceeding
# Students Exceeding
% SHP Enrolled Students
Exceeding
Aetna 731 2.0% 400 1.3% 233 0.8%
BCBS 0 0% 0 0% 0 0%
BCSI 0 0% 0 0% - -
Combined 0 0% 217 3.2% 106 1.7%
HPIC - - - - 43 1.2%
Markel 0 0% 25 1.0% 9 0.7%
MEGA 3 5.3% 147 2.1% 47 1.1%
Monumental 26 2.1% 31 2.0% 42 2.7%
Nationwide 529 2.9% 454 2.7% 350 2.4%
Pioneer - - 24 7.1% - -
Security Mutual 65 2.9% 28 1.8% 16 1.1%
Self-Funded 185 0.9% 197 0.8% 83 0.3%
Tufts 0 0% 0 0% 0 0%
United - - 0 0% 22 1.5%
All Insurance Carriers 1,539 1.9% 1,523 1.6% 951 1.0%
Schools may include reasonable exclusions and limitations in their Student Health Programs (SHPs), which may include outpatient benefit limits. Outpatient benefit limits vary by school.
When combining data over the three school years, Aetna and Nationwide have the highest number of students exceeding their SHP’s outpatient benefit limits.
Although the percent of total students is quite small, students who exceed this benefit limit may be exposed to significant out-of-pocket expenses.
Notes: Self-funded SHPs are an arrangement in which a school provides health benefits to students and assumes the insurance risk for claims payment; an insurance carrier may act as a third party administrator but is not at risk for medical costs. Self-funded schools likely purchase reinsurance for very large claims. The analysis excludes schools that did not provide student enrollment, number of students exceeding their outpatient benefit limits, and valid insurance carrier data. DHCFP used data from schools’ Fall Enrollment filings and benefit brochures to supplement missing enrollment and missing or inaccurate carrier data from Performance Metrics; however, there are still some schools that did not submit enrollment or carrier data. DHCFP assumed that schools listing Chickering or United HealthCare Student Resources as their carrier had Aetna or United, respectively, as their actual carrier. Percentages are rounded to the nearest whole percent.Source: DHCFP Student Health Program 2005, 2006, and 2007 Performance Metrics and Fall Enrollment datasets as of 8/25/09.
Benefit Analysis
Massachusetts Division of Health Care Finance and Policy 31
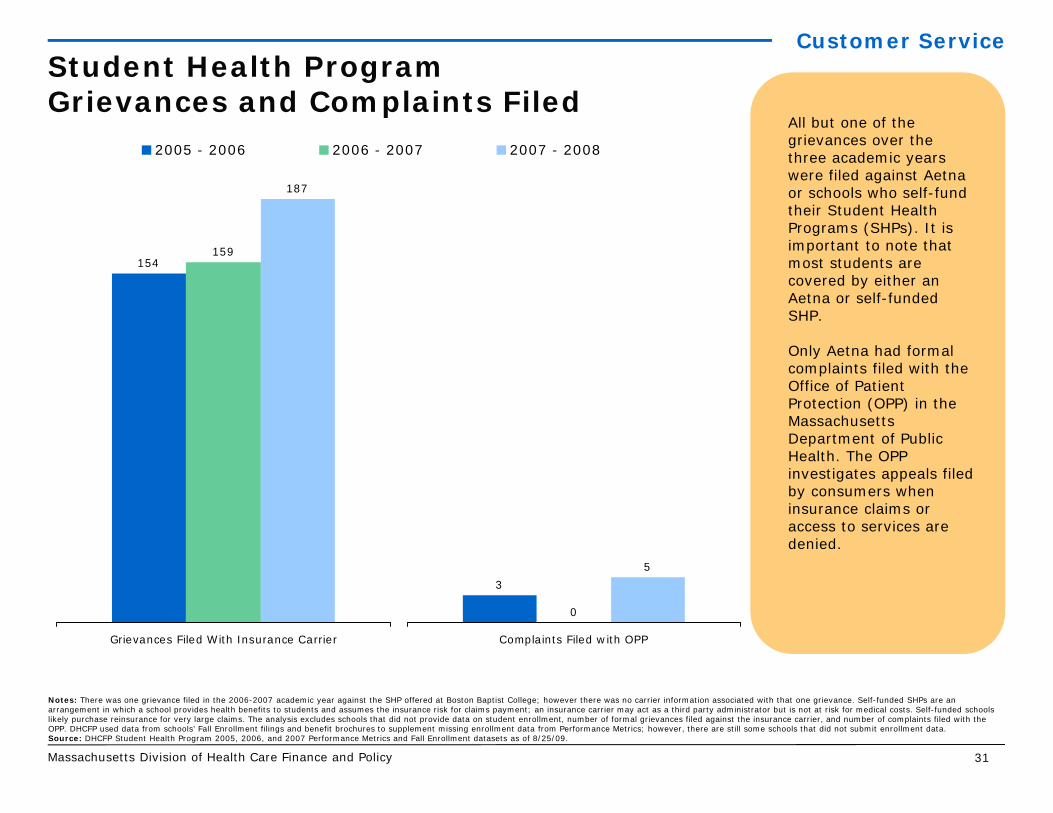
All but one of the grievances over the three academic years were filed against Aetna or schools who self-fund their Student Health Programs (SHPs). It is important to note that most students are covered by either an Aetna or self-funded SHP.
Only Aetna had formal complaints filed with the Office of Patient Protection (OPP) in the Massachusetts Department of Public Health. The OPP investigates appeals filed by consumers when insurance claims or access to services are denied.
154159
187
Grievances Filed With Insurance Carrier
Student Health ProgramGrievances and Complaints Filed
Customer Service
0
53
Complaints Filed with OPP
2005 - 2006 2006 - 2007 2007 - 2008
Notes: There was one grievance filed in the 2006-2007 academic year against the SHP offered at Boston Baptist College; however there was no carrier information associated with that one grievance. Self-funded SHPs are an arrangement in which a school provides health benefits to students and assumes the insurance risk for claims payment; an insurance carrier may act as a third party administrator but is not at risk for medical costs. Self-funded schools likely purchase reinsurance for very large claims. The analysis excludes schools that did not provide data on student enrollment, number of formal grievances filed against the insurance carrier, and number of complaints filed with the OPP. DHCFP used data from schools’ Fall Enrollment filings and benefit brochures to supplement missing enrollment data from Performance Metrics; however, there are still some schools that did not submit enrollment data. Source: DHCFP Student Health Program 2005, 2006, and 2007 Performance Metrics and Fall Enrollment datasets as of 8/25/09.

Massachusetts Division of Health Care Finance and Policy 32
Methodology
The Division of Health Care Finance and Policy (DHCFP) analyzed Student Health Program (SHP) data submitted by schools for the 2005-2006, 2006-2007, and 2007-2008 academic years. The report shows aggregated three-year trends to minimize year-to-year data fluctuations. Schools who have changed carriers or funding structures during the three years are grouped by their SHP experience for each year; thus, the number of schools in any category may vary from year to year.
Fall Enrollment DatasetSchools are required to submit enrollment and basic insurance carrier information to DHCFP by November 1 of each academic year. This survey includes questions on SHP enrollment, student waivers, and basic SHP information including premiums and insurance carriers.
The response rate for the fall enrollment submission varies by year. In 2005, 95% of schools submitted data. In 2006, 97% of schools submitted data. In 2007, 82% of schools submitted data.
Performance Metrics DatasetDHCFP solicited SHP enrollment, annual premiums (without health center or administrative fees), financial performance, benefit limit, and customer service information from schools through a special data request in June 2009. Schools did not include services provided at student health centers in the data submitted.
This was the first time DHCFP collected such information. Schools were required to submit data on a survey (developed by DHCFP, in consultation with the SHP Technical Advisory Group which includes schools, students, consumer advocates, carriers, and brokers) for the 2005-2006, 2006-2007, and 2007-2008 academic years. DHCFP did not ask for data for the 2008-2009 academic year because SHP coverage for the year was still ongoing at the time the survey was due.
The response rate from schools was 95%. However, not all schools who submitted a survey provided information for all data elements requested.
Appendix
Massachusetts Division of Health Care Finance and Policy 33
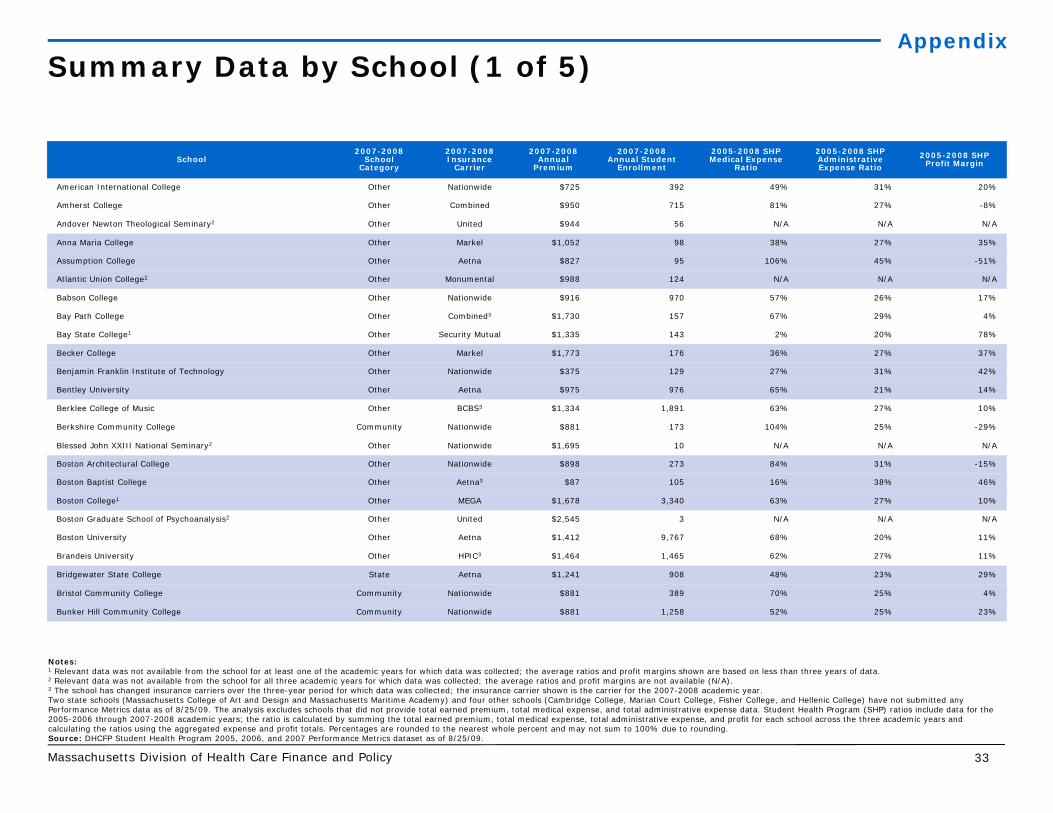
Summary Data by School (1 of 5)Appendix
School2007-2008
School Category
2007-2008Insurance
Carrier
2007-2008Annual
Premium
2007-2008Annual Student
Enrollment
2005-2008 SHP Medical Expense
Ratio
2005-2008 SHP Administrative Expense Ratio
2005-2008 SHP Profit Margin
American International College Other Nationwide $725 392 49% 31% 20%
Amherst College Other Combined $950 715 81% 27% -8%
Andover Newton Theological Seminary2 Other United $944 56 N/A N/A N/A
Anna Maria College Other Markel $1,052 98 38% 27% 35%
Assumption College Other Aetna $827 95 106% 45% -51%
Atlantic Union College2 Other Monumental $988 124 N/A N/A N/A
Babson College Other Nationwide $916 970 57% 26% 17%
Bay Path College Other Combined3 $1,730 157 67% 29% 4%
Bay State College1 Other Security Mutual $1,335 143 2% 20% 78%
Becker College Other Markel $1,773 176 36% 27% 37%
Benjamin Franklin Institute of Technology Other Nationwide $375 129 27% 31% 42%
Bentley University Other Aetna $975 976 65% 21% 14%
Berklee College of Music Other BCBS3 $1,334 1,891 63% 27% 10%
Berkshire Community College Community Nationwide $881 173 104% 25% -29%
Blessed John XXIII National Seminary2 Other Nationwide $1,695 10 N/A N/A N/A
Boston Architectural College Other Nationwide $898 273 84% 31% -15%
Boston Baptist College Other Aetna3 $87 105 16% 38% 46%
Boston College1 Other MEGA $1,678 3,340 63% 27% 10%
Boston Graduate School of Psychoanalysis2 Other United $2,545 3 N/A N/A N/A
Boston University Other Aetna $1,412 9,767 68% 20% 11%
Brandeis University Other HPIC3 $1,464 1,465 62% 27% 11%
Bridgewater State College State Aetna $1,241 908 48% 23% 29%
Bristol Community College Community Nationwide $881 389 70% 25% 4%
Bunker Hill Community College Community Nationwide $881 1,258 52% 25% 23%
Notes:1 Relevant data was not available from the school for at least one of the academic years for which data was collected; the average ratios and profit margins shown are based on less than three years of data.2 Relevant data was not available from the school for all three academic years for which data was collected; the average ratios and profit margins are not available (N/A).3 The school has changed insurance carriers over the three-year period for which data was collected; the insurance carrier shown is the carrier for the 2007-2008 academic year. Two state schools (Massachusetts College of Art and Design and Massachusetts Maritime Academy) and four other schools (Cambridge College, Marian Court College, Fisher College, and Hellenic College) have not submitted any Performance Metrics data as of 8/25/09. The analysis excludes schools that did not provide total earned premium, total medical expense, and total administrative expense data. Student Health Program (SHP) ratios include data for the 2005-2006 through 2007-2008 academic years; the ratio is calculated by summing the total earned premium, total medical expense, total administrative expense, and profit for each school across the three academic years and calculating the ratios using the aggregated expense and profit totals. Percentages are rounded to the nearest whole percent and may not sum to 100% due to rounding.Source: DHCFP Student Health Program 2005, 2006, and 2007 Performance Metrics dataset as of 8/25/09.

Massachusetts Division of Health Care Finance and Policy 34
Summary Data by School (2 of 5)Appendix
School2007-2008
School Category
2007-2008Insurance
Carrier
2007-2008Annual
Premium
2007-2008Annual Student
Enrollment
2005-2008 SHP Medical Expense
Ratio
2005-2008 SHP Administrative Expense Ratio
2005-2008 SHP Profit Margin
Cape Cod Community College Community Nationwide $881 305 152% 25% -77%
Caritas Laboure College2 Other United $1,330 7 N/A N/A N/A
Clark University Other Nationwide $1,021 582 65% 28% 8%
College of the Holy Cross2 Other Monumental $685 318 N/A N/A N/A
Conway School of Landscape Design2 Other United $1,305 5 N/A N/A N/A
Curry College Other Aetna3 $505 351 83% 35% -17%
Dean College Other Nationwide $807 276 53% 29% 17%
Eastern Nazarene College1 Other Nationwide $736 171 75% 27% -2%
Elms College Other Security Mutual $1,425 76 58% 30% 12%
Emerson College Other Aetna $1,035 1,153 66% 20% 14%
Emmanuel College Other Nationwide $1,495 161 53% 29% 18%
Endocott College Other Markel $923 214 73% 27% 0%
Episcopal Divinity School2 Self-Funded Self-Funded $2,788 26 N/A N/A N/A
FINE Mortuary College2 Other United $1,305 0 N/A N/A N/A
Fitchburg State College State Aetna $1,241 307 62% 23% 15%
Framingham State College State Aetna $1,241 199 103% 23% -26%
Gibbs College-Boston1 Other Monumental3 $436 148 79% 34% -13%
Gordon College Other Security Mutual $1,140 248 59% 30% 11%
Gordon-Conwell Theological Seminary1 Other Nationwide $1,255 488 88% 26% -14%
Greenfield Community College Community Nationwide $881 255 114% 25% -39%
Hampshire College1 Other Combined $1,129 661 62% 21% 16%
Harvard University Self-Funded Self-Funded $1,362 13,819 78% 12% 10%
Hebrew College2 Other United $944 38 N/A N/A N/A
Holyoke Community College Community Nationwide $881 321 82% 25% -7%
Notes:1 Relevant data was not available from the school for at least one of the academic years for which data was collected; the average ratios and profit margins shown are based on less than three years of data.2 Relevant data was not available from the school for all three academic years for which data was collected; the average ratios and profit margins are not available (N/A).3 The school has changed insurance carriers over the three-year period for which data was collected; the insurance carrier shown is the carrier for the 2007-2008 academic year. Two state schools (Massachusetts College of Art and Design and Massachusetts Maritime Academy) and four other schools (Cambridge College, Marian Court College, Fisher College, and Hellenic College) have not submitted any Performance Metrics data as of 8/25/09. The analysis excludes schools that did not provide total earned premium, total medical expense, and total administrative expense data. Student Health Program (SHP) ratios include data for the 2005-2006 through 2007-2008 academic years; the ratio is calculated by summing the total earned premium, total medical expense, total administrative expense, and profit for each school across the three academic years and calculating the ratios using the aggregated expense and profit totals. Percentages are rounded to the nearest whole percent and may not sum to 100% due to rounding.Source: DHCFP Student Health Program 2005, 2006, and 2007 Performance Metrics dataset as of 8/25/09.

Massachusetts Division of Health Care Finance and Policy 35
Summary Data by School (3 of 5)Appendix
School2007-2008
School Category
2007-2008Insurance
Carrier
2007-2008Annual
Premium
2007-2008Annual Student
Enrollment
2005-2008 SHP Medical Expense
Ratio
2005-2008 SHP Administrative Expense Ratio
2005-2008 SHP Profit Margin
Hult International Business School Other Aetna $1,400 104 53% 35% 12%
ITT Technical Institute-Norwood and Woburn1 Other Security Mutual $1,180 233 15% 30% 55%
Lasell College Other Combined3 $1,330 168 37% 28% 35%
Lesley University Other Combined $1,379 695 48% 27% 25%
Longy School of Music Other Markel3 $1,971 118 67% 28% 5%
Massachusetts College of Liberal Arts State Aetna $1,241 203 55% 23% 22%
Massachusetts College of Pharmacy and Health Sciences2 Other Monumental $1,460 946 N/A N/A N/A
Massachusetts Institute of Technology Self-Funded Self-Funded $1,440 7,260 75% 13% 12%
Massachusetts School of Law Other Nationwide $2,180 45 37% 31% 32%
Massachusetts School of Professional Psychology2 Other United $1,596 28 N/A N/A N/A
Massasoit Community College Community Nationwide $881 303 64% 25% 11%
MassBay Community College Community Nationwide $881 420 90% 25% -16%
Merrimack College Other Combined3 $1,223 168 41% 27% 32%
MGH Institute of Health Professions2 Other BCBS $5,389 130 N/A N/A N/A
Middlesex Community College Community Nationwide $881 357 81% 25% -6%
Montserrat College of Art Other Aetna $1,089 58 42% 35% 23%
Mount Holyoke College Other Combined $1,530 933 49% 27% 24%
Mount Ida College Other Combined $1,087 327 45% 27% 28%
Mount Wachusett Community College Community Nationwide $881 260 69% 25% 6%
New England College of Finance2 Other N/A N/A N/A N/A N/A N/A
New England College of Optometry2 Other HPIC $950 260 N/A N/A N/A
New England Conservatory of Music1 Other Combined3 $1,572 367 56% 27% 16%
New England School of Acupuncture Other Nationwide $3,100 34 54% 29% 17%
New England School of Law Other Aetna $1,941 458 63% 26% 11%
Notes:1 Relevant data was not available from the school for at least one of the academic years for which data was collected; the average ratios and profit margins shown are based on less than three years of data.2 Relevant data was not available from the school for all three academic years for which data was collected; the average ratios and profit margins are not available (N/A).3 The school has changed insurance carriers over the three-year period for which data was collected; the insurance carrier shown is the carrier for the 2007-2008 academic year. Two state schools (Massachusetts College of Art and Design and Massachusetts Maritime Academy) and four other schools (Cambridge College, Marian Court College, Fisher College, and Hellenic College) have not submitted any Performance Metrics data as of 8/25/09. The analysis excludes schools that did not provide total earned premium, total medical expense, and total administrative expense data. Student Health Program (SHP) ratios include data for the 2005-2006 through 2007-2008 academic years; the ratio is calculated by summing the total earned premium, total medical expense, total administrative expense, and profit for each school across the three academic years and calculating the ratios using the aggregated expense and profit totals. Percentages are rounded to the nearest whole percent and may not sum to 100% due to rounding.Source: DHCFP Student Health Program 2005, 2006, and 2007 Performance Metrics dataset as of 8/25/09.
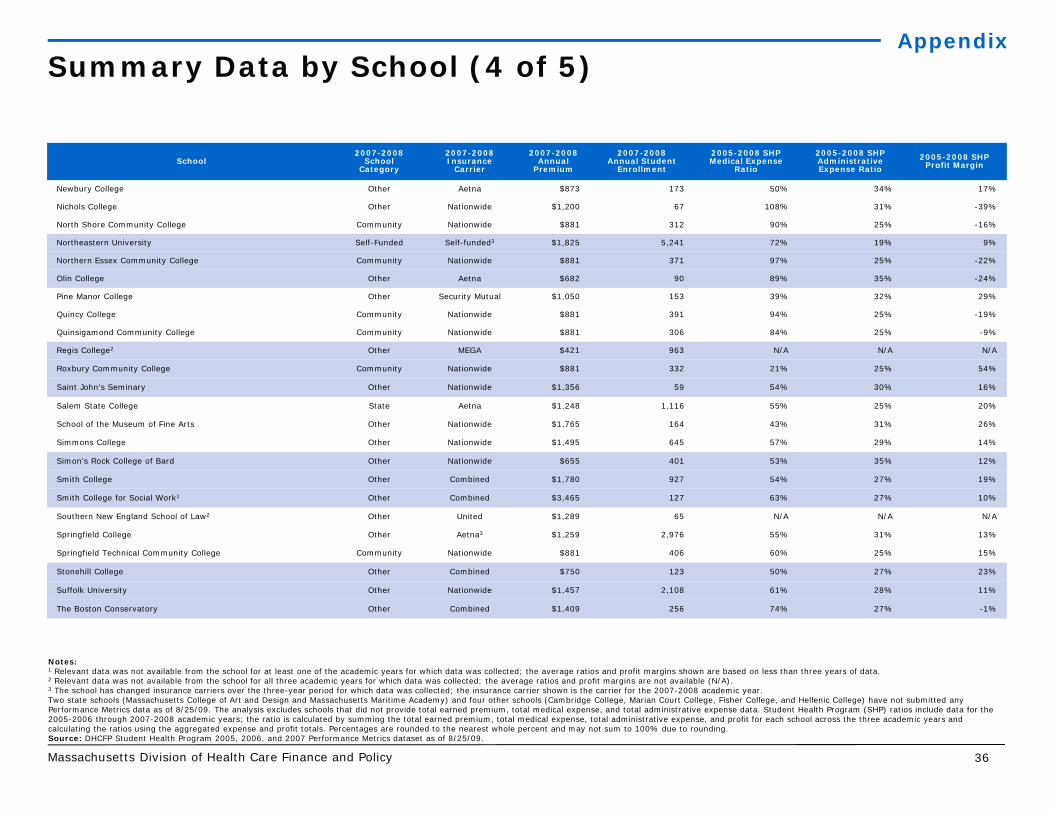
Massachusetts Division of Health Care Finance and Policy 36
Summary Data by School (4 of 5)Appendix
School2007-2008
School Category
2007-2008Insurance
Carrier
2007-2008Annual
Premium
2007-2008Annual Student
Enrollment
2005-2008 SHP Medical Expense
Ratio
2005-2008 SHP Administrative Expense Ratio
2005-2008 SHP Profit Margin
Newbury College Other Aetna $873 173 50% 34% 17%
Nichols College Other Nationwide $1,200 67 108% 31% -39%
North Shore Community College Community Nationwide $881 312 90% 25% -16%
Northeastern University Self-Funded Self-funded3 $1,825 5,241 72% 19% 9%
Northern Essex Community College Community Nationwide $881 371 97% 25% -22%
Olin College Other Aetna $682 90 89% 35% -24%
Pine Manor College Other Security Mutual $1,050 153 39% 32% 29%
Quincy College Community Nationwide $881 391 94% 25% -19%
Quinsigamond Community College Community Nationwide $881 306 84% 25% -9%
Regis College2 Other MEGA $421 963 N/A N/A N/A
Roxbury Community College Community Nationwide $881 332 21% 25% 54%
Saint John’s Seminary Other Nationwide $1,356 59 54% 30% 16%
Salem State College State Aetna $1,248 1,116 55% 25% 20%
School of the Museum of Fine Arts Other Nationwide $1,765 164 43% 31% 26%
Simmons College Other Nationwide $1,495 645 57% 29% 14%
Simon’s Rock College of Bard Other Nationwide $655 401 53% 35% 12%
Smith College Other Combined $1,780 927 54% 27% 19%
Smith College for Social Work1 Other Combined $3,465 127 63% 27% 10%
Southern New England School of Law2 Other United $1,289 65 N/A N/A N/A
Springfield College Other Aetna3 $1,259 2,976 55% 31% 13%
Springfield Technical Community College Community Nationwide $881 406 60% 25% 15%
Stonehill College Other Combined $750 123 50% 27% 23%
Suffolk University Other Nationwide $1,457 2,108 61% 28% 11%
The Boston Conservatory Other Combined $1,409 256 74% 27% -1%
Notes:1 Relevant data was not available from the school for at least one of the academic years for which data was collected; the average ratios and profit margins shown are based on less than three years of data.2 Relevant data was not available from the school for all three academic years for which data was collected; the average ratios and profit margins are not available (N/A).3 The school has changed insurance carriers over the three-year period for which data was collected; the insurance carrier shown is the carrier for the 2007-2008 academic year. Two state schools (Massachusetts College of Art and Design and Massachusetts Maritime Academy) and four other schools (Cambridge College, Marian Court College, Fisher College, and Hellenic College) have not submitted any Performance Metrics data as of 8/25/09. The analysis excludes schools that did not provide total earned premium, total medical expense, and total administrative expense data. Student Health Program (SHP) ratios include data for the 2005-2006 through 2007-2008 academic years; the ratio is calculated by summing the total earned premium, total medical expense, total administrative expense, and profit for each school across the three academic years and calculating the ratios using the aggregated expense and profit totals. Percentages are rounded to the nearest whole percent and may not sum to 100% due to rounding.Source: DHCFP Student Health Program 2005, 2006, and 2007 Performance Metrics dataset as of 8/25/09.

Massachusetts Division of Health Care Finance and Policy 37
Summary Data by School (5 of 5)Appendix
School2007-2008
School Category
2007-2008Insurance
Carrier
2007-2008Annual
Premium
2007-2008Annual Student
Enrollment
2005-2008 SHP Medical Expense
Ratio
2005-2008 SHP Administrative Expense Ratio
2005-2008 SHP Profit Margin
The National Graduate School of Quality Management2 Other N/A N/A N/A N/A N/A N/A
The New England Institute of Art Other Security Mutual $635 558 56% 34% 10%
Tufts University Other Aetna $1,535 2,186 63% 22% 14%
Tufts University School of Medicine Other Tufts $2,940 1,588 88% 14% -2%
University of Massachusetts at Amherst UMass Aetna $2,061 6,120 76% 20% 4%
University of Massachusetts Boston UMass Aetna $1,335 3,533 68% 20% 12%
University of Massachusetts Dartmouth1 UMass BCBS3 $1,173 1,163 62% 20% 18%
University of Massachusetts Lowell UMass HPIC3 $930 2,110 53% 22% 25%
University of Massachusetts Medical School1 UMass BCBS3 $2,917 681 75% 20% 5%
University of Phoenix2 Other United $857 17 N/A N/A N/A
Urban College of Boston2 Other United $1,305 0 N/A N/A N/A
Wellesley College Other United3 $1,280 860 43% 27% 30%
Wentworth Institute of Technology Other Nationwide $777 676 63% 31% 6%
Western New England College1 Other Markel $1,785 412 50% 27% 23%
Westfield State College State Nationwide $1,270 250 56% 26% 18%
Wheaton College Other Markel $1,023 447 54% 27% 19%
Wheelock College Other Nationwide $1,495 100 66% 29% 5%
Williams College Other Combined3 $1,011 784 56% 27% 17%
Woods Hole Oceanographic Institution2 Other BCBS $402 5 N/A N/A N/A
Worcester Polytechnic Institute2 Other United $940 456 N/A N/A N/A
Worcester State College State Nationwide $1,280 283 49% 29% 22%
Notes:1 Relevant data was not available from the school for at least one of the academic years for which data was collected; the average ratios and profit margins shown are based on less than three years of data.2 Relevant data was not available from the school for all three academic years for which data was collected; the average ratios and profit margins are not available (N/A).3 The school has changed insurance carriers over the three-year period for which data was collected; the insurance carrier shown is the carrier for the 2007-2008 academic year. Two state schools (Massachusetts College of Art and Design and Massachusetts Maritime Academy) and four other schools (Cambridge College, Marian Court College, Fisher College, and Hellenic College) have not submitted any Performance Metrics data as of 8/25/09. The analysis excludes schools that did not provide total earned premium, total medical expense, and total administrative expense data. Student Health Program (SHP) ratios include data for the 2005-2006 through 2007-2008 academic years; the ratio is calculated by summing the total earned premium, total medical expense, total administrative expense, and profit for each school across the three academic years and calculating the ratios using the aggregated expense and profit totals. Percentages are rounded to the nearest whole percent and may not sum to 100% due to rounding.Source: DHCFP Student Health Program 2005, 2006, and 2007 Performance Metrics dataset as of 8/25/09.

Division of Health Care Finance and Policy
Two Boylston Street
Boston, Massachusetts 02116
Phone: (627) 988-3100
Fax: (617) 727-7662
Website: www.mass.gov/dhcfp
Publication Number: 09-309-HCF-01
Authorized by Ellen Bickelman, State Purchasing Agent
Printed on Recycled Paper