student outcomes transparency - inside higher ed
TRANSCRIPT

1 I Monroe College August 1, 2016
Ms. Jean-Didier Gaina August 1, 2016
Office of Postsecondary Education
U.S. Department of Education
400 Maryland Avenue SW, Room 6W232B
Washington, DC 20202
RE: DOCKET NUMBER ED-2015-OPE-0103
Dear Ms. Gaina:
As the Executive Vice President of Monroe College, I write regarding the proposed Defense to
Repayment Rule (“Rule”) as published in the Notice of Proposed Rulemaking on June 13, 2016.
At Monroe College, we have consistently championed an approach to higher education that
focuses on:
• Student outcomes across all institution types
• Constructive policies that encourage and permit responsive actions from institutions
that positively impact students
• Transparency in data and process
Our comments on the Rule focus on two areas:
• A concern that the proposed Repayment Rate Warning does not adequately protect or
inform students and reflects a flawed approach that jeopardizes the entire Rule
• Risks stemming from an overly broad Borrower Defense Framework will lead to
unintended consequences that harm community colleges, HBCUs, and other
institutions that provide access to underrepresented students
For 83 years, Monroe College has consistently produced some of the best outcomes in the
country for urban and low-income minority students. We have one of the highest graduation
rates and one of the lowest default rates for the populations we serve. We are proud of the
recognition we have earned as a model for increasing student access and the resources we
allocate to student support services, including financial literacy, student loan counseling, remediation and career services.
Given that Monroe is located in the poorest congressional zip code in the country, we are a laboratory for many of the great higher education policy debates, particularly those that relate
to access for minorities and low-income students, graduation rates, student debt, college
readiness, or employment outcomes. We relentlessly work to serve our students’ best interests
first, and have created an institutional culture and academic framework that enable us to support their personal and academic development needs beyond traditional classroom learning.
2 I Monroe College August 1, 2016
Monroe College has a strong history of partnering with the Department whenever possible to
share our insights and feedback. Given our location and the student populations we serve, we
have a particular vantage point on how national policy impacts underrepresented students, and
value the opportunities given to share our observations and perspectives. These comments are
consistent with that practice, and are submitted in a spirit of collegiality to produce the most
fair and effective higher education policy.
u u u
Under the Obama Administration, there has been considerable policy attention and regulatory
might focused on the for-profit sector for reasons well-covered by the national media. Institutions with weak outcomes or unscrupulous practices warrant a swift, punitive response
from the Department, whatever sector they are in.
Our concern and, indeed, our primary purpose in submitting this public comment, however,
is that this regulation will impact far more institutions than the bad actors in the proprietary
sector, which is its core target. Many community colleges and HBCUs are also rendered
vulnerable for reasons to be outlined shortly, and that could potentially stifle access for countless students already underrepresented on campuses nationwide.
The Department’s discordant philosophies on higher education policy for the proprietary sector versus all other institution types are already resulting in separate and unequal protection of students and the institutions themselves. Generally, students at for-profit institutions with weak outcomes are afforded far more compassion, public outcry, and regulatory protection than their counterparts at public or non-profit colleges. Whereas there is a clear sense of paternalism with respect to students at for-profit institutions, that same level of protectionism and interventionism is lacking when it comes to students at other higher education providers.
We respectfully ask the Department to carefully weigh the comments and insights that follow,
and examine how recent regulatory actions might be adversely impacting the “wrong” students
and colleges and not holding accountable institutions whose poor student outcomes strongly
suggest they are not deserving of such favor.
A detailed discussion of our perspectives and observations follows.

3 I Monroe College August 1, 2016
Deficiencies in the Proposed Borrower Defense to Repayment Rule
I. The proposed Loan Repayment Warning fails to adequately protect or inform students, and does not provide the necessary data to judge institutional quality. Such flaws jeopardize the Rule’s integrity.
A. The Department’s multiple repayment rate formulas are causing significant confusion and are insufficiently transparent. There needs to be a single, accurate, and fair formula that has been subject to review before a punitive regulatory framework is implemented.
The Department of Education has already devised and implemented three repayment rate
formulas — one affiliated with the College Scorecard, for which some limited data are available to the public, and one for the 2014 Gainful Employment Rule, for which no supporting data
have ever been published. In addition, the Department proposed an alternate repayment rate
formula in the first Gainful Employment Rule. Accordingly, the formula proposed in the current NPRM used to calculate “repayment rates” would represent the fourth unique repayment rate
formula. (See Appendix A: Multiple Repayment Rate Formulas)
The multitude of formulas, their complexity, and the lack of transparent data on which to
judge their validity should give the Department reason to pause before implementing a new repayment scheme, especially one that is punitive in nature and applicable to only one
segment of higher education.
B. The argument that only students at for-profit colleges deserve warnings about low repayment rates does not withstand scrutiny.
The Department justifies its proposal that only students at for-profit institutions deserve the benefit of low repayment warnings by arguing that weak repayment outcomes are concentrated in that sector and that the “administrative burden” for the other sectors does
not justify requiring warnings from those other institution types, regardless of how low their repayment rates may be. This position does not serve students well.
To justify singling out only one sector, the Department states:
“For instance, a preliminary Department analysis of the College Scorecard five-year undergraduate repayment rates (using a comparable threshold of 50 percent of borrowers or fewer making progress on their loans) shows that more than 70 percent of institutions with a repayment rate below the threshold are proprietary institutions, and those institutions represent more than two in five of all proprietary institutions.”
Unfortunately, the Department’s analysis fails to tell the whole story.

4 I Monroe College August 1, 2016
For your consideration:
1. Almost 75% of HBCUs have five-year repayment rates below 50% because they serve low-income students, including some very high-performing institutions such as Grambling State and Morgan State, which have repayment rates of 40% and 47%, respectively. (See Appendix B: HBCUs with Repayment Rates 50% or Less)
From College Scorecard data: Sixty-one (61) of 85 HBCUs serving 90,434 borrowers have
five-year repayment rates below 50%.
HBCUs with lowest five-year repayment rates:
Institution 5 Year Repayment RateArkansas Baptist College 20%Lane College 22%Texas College 24%Central State University 28%Livingstone College 29%
2. Many public colleges also have low repayment rates because they serve low-income students.
From College Scorecard data: One hundred and fifty-one (151) public colleges serving 165,939 borrowers in repayment have five-year repayment rates at or below 50%. (See Appendix C: Public Colleges with Repayment Rates 50% or Less)
3. Private non-profit colleges serving low-income students are not immune to low repayment rates either.
From College Scorecard data: Seventy-one (71) private two- and four-year colleges serving
70,505 borrowers in repayment have five-year repayment rates below 50%. (See Appendix D: Private Colleges with Repayment Rates 50% or Less)
Repayment rate data across all institution types clearly show that the problem is not unique to the for-profit sector and that student demographics play a role. For this reason, the Department should abandon the Repayment Rate Warning requirement.

5 I Monroe College August 1, 2016
C. The five-year data are unreliable. Using three- or seven-year repayment data is more appropriate.
One of the most interesting aspects of the Scorecard data relates to the trend of three- and
five-year repayment rates. Generally, one would expect repayment rates to improve each year as borrowers’ earnings increase. Yet, surprisingly, that’s not what we found looking at the data.
• Forty-three percent (43%) of private, non-profit colleges (541 out of 1,246) have five-year repayment rates that are lower than their three-year repayment rates.
• Twenty-five percent (25%) of public colleges (370 out of 1,497) have five-year repayment rates that are lower than their three-year repayment rates.
Monroe College’s three-year repayment rate is 57%. Our five-year rate is 50% and our seven-year rate is 57%.
A look at the schools with the largest variance in three- and five-year Scorecard rates demonstrates the pattern:
Top Five Variances in 3- and 5- Year Scorecard Repayment RatesInstitution Scorecard 3-Year Scorecard 5-Year VarianceMacCormac College 69% 34% -35%Universidad Del Este 49% 18% -31%Remington College-Colorado Springs 70% 42% -28%Opportunities Industrialization Center 63% 42% -21%Pontifical Catholic University of Puerto Rico-Arecibo 62% 44% -18%
There’s a counter-intuitive anomaly with the data that needs closer inspection and verification by the Department before it implements penalties associated with a five-year repayment rate.
D. It is unclear whether the repayment rate data presented in the Scorecard are accurate.
When the Department published the Scorecard repayment rates, Monroe College attempted
to verify our published rate by replicating the data the Department presented. To date,
we have been unable to reproduce the Department’s published rate. The explanation that
accompanies the Scorecard Repayment data states that it reflects:
“The share of students who have repaid at least $1 of the principal balance on their federal loans within three years of leaving school.”
Although somewhat opaque, the statement is commonly taken to mean that the repayment
percentage published on the Scorecard represents the percentage of students in repayment
who have lowered their principal loan balance at the end of three years.

6 I Monroe College August 1, 2016
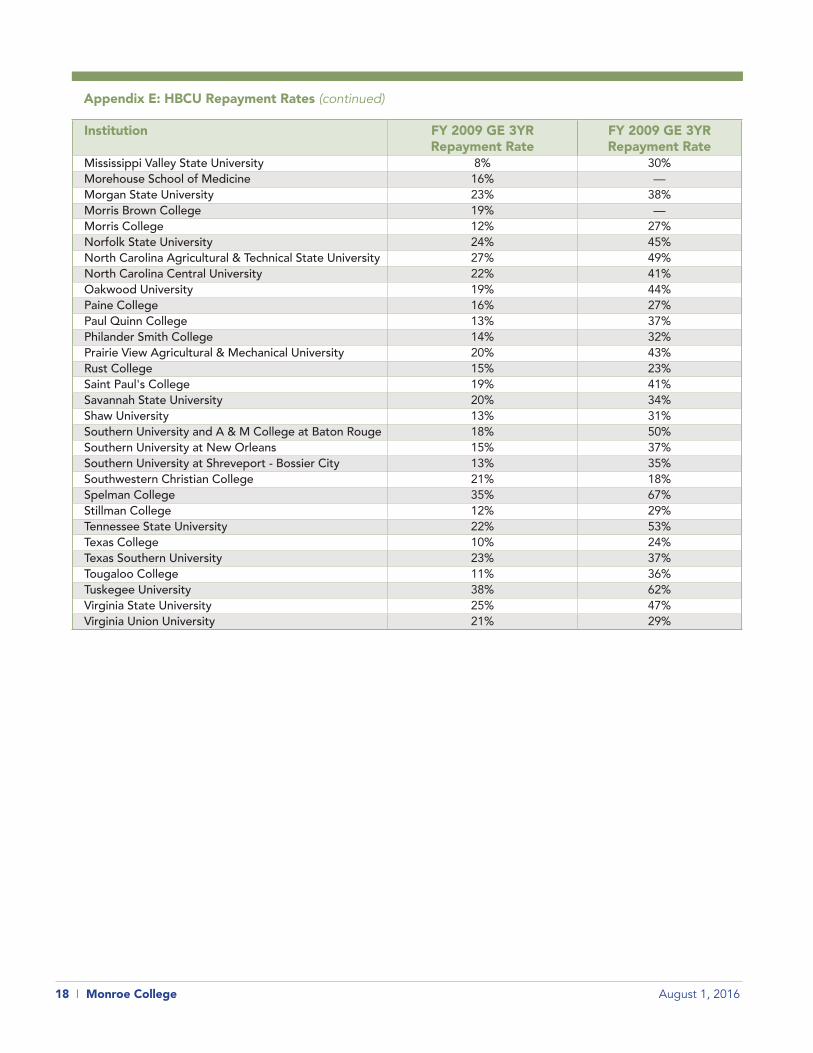
The FY 2009 repayment data published in 2010 during the first Gainful Employment negotiations should give the Department reason to pause. That Rule required a repayment
rate of 35% to pass and measured the total dollars in loans that positively amortized against all that were in repayment for three years.
With that data, the Department also identified the number of students who positively amortized their loans versus all students in repayment. What we cannot reconcile is how the loan repayment results from that FY 2009 data doubled (or more) under the Scorecard formula.
To illustrate, we compared the repayment rates for HBCUs.
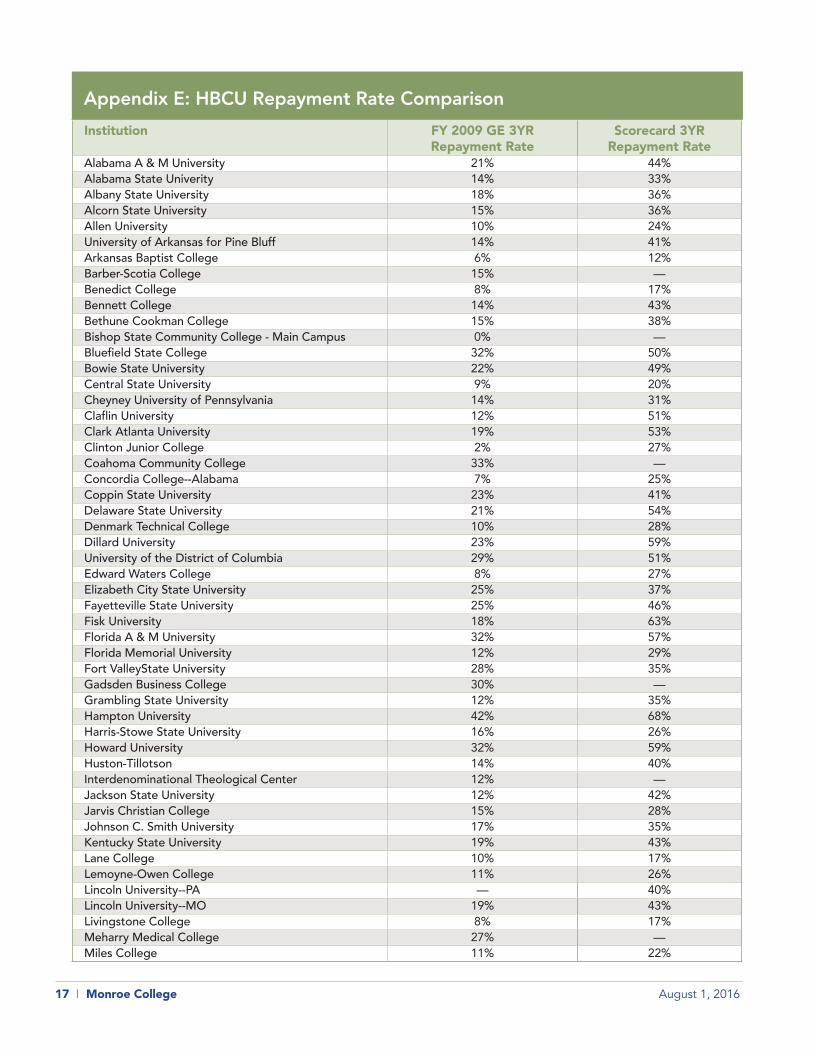
The rates for Alabama A&M more than doubled from 21% to 44%, Grambling University almost tripled from 12% to 35%, and our rate at Monroe College went from 25% to 57%. (See Appendix E: HBCU Repayment Rate Comparison)
We are unsure of what accounts for the dramatic increase in published repayment rates from
the FY 2009 GE repayment rate data as, to our knowledge, no explanation has been provided.
In addition, the data presented in A Crisis in Student Loans?, by Looney and Yannelis1 of the U.S.
Department of the Treasury and NYU’s Stern School of Business, respectively, seems to contradict
the Scorecard data. In Table 8 of their paper, they report that in 2012:
• 57% of all students had negative amortization two years out
• 74% of students at for-profit colleges had negative amortization two years out
• 64% of students at public and nonprofit two-year colleges had negative amortization two years out
This data are hard to reconcile with the three-year Scorecard data illustrated below, which
shows that:
• 93% of private non-profit colleges have repayment rates above 50%
• 83% of public institutions have repayment rates above 50%
• 55% of for-profit institutions have repayment rates above 50%
With respect to the variation in the Scorecard’s published repayment rates, our staff surmises
that the actual repayment rate includes students who are making payments, but are enrolled
in income-driven and other repayment plans that are negatively amortizing.
We respectfully seek the Department’s response and clarification on the incongruities.
1. Looney and Yannelis, A Crisis in Student Loans? https://www.brookings.edu/bpea-articles/a-crisis-in-student-loans-how-changes-in-the-characteristics-of-borrowers-and-in-the-institutions-they-attended-contributed-to-rising-loan-defaults/

7 I Monroe College August 1, 2016
E. The proposed repayment rate formula inappropriately penalizes institutions for students choosing income-driven repayment plans.
The Department’s methodology fails to properly account for the impact of special repayment
plans that financially savvy borrowers are selecting in increasing numbers. These Income-Driven Repayment Plans (IDRs) enable students to reduce their payments based on their family
size and income levels. For example, a non-traditional student with a $25,000 loan, three dependents, and an income of $50,000 would pay $113 monthly with an IDR as opposed to $265 monthly without one. During the Gainful Employment comment period, the Department took the position that schools with large populations of borrowers opting for IDRs must be low-
performing. While we are not sure of the rationale for this assumption, we feel compelled to
point out that choosing an IDR is, in many cases, a wise financial decision.
Given the financial benefits, it was no surprise to the College when students began to select IDRs in large numbers in 2013. Two years later, in 2015, New York State introduced a new
program called Get on Your Feet, which entitles students to have New York State make their
monthly payments for two years as long as they select an IDR and meet certain other criteria.
This new program makes the selection of an IDR almost a given in New York State for a
non-traditional student. As such, schools like Monroe College that serve a large population
of these students saw an uptick in the number of students choosing IDRs; those institutions will
have difficulty meeting the 50% repayment threshold. Looking at Monroe as an example, we estimate that 35 out of every 100 students in our 2014 loan cohort will select IDRs in order to
reap all of the benefits identified above.
F. Repayment rates reflect student demographics, not institutional quality.
As a Gainful Employment negotiator in 2013, I spent many, many hours researching repayment rates.
Working with Mark Schneider of College Measures, we analyzed the FY 2009 Institutional Repayment Rates the Department issued in 2010. Around the country and across sectors, the findings clearly showed that low-income students are less likely to repay the principal on their student loans.
The oft-quoted Looney and Yannelis2 study notes how non-traditional borrowers are much more likely
to struggle with repayment, while high-income students are more likely to repay the principal on their
student loans. Thus, institutions that enroll a higher percentage of high-income students who borrow
will have higher repayment rates while institutions that enroll a higher percentage of students receiving
Pell will have lower repayment rates. This Rule does not take these established patterns into account.
According to the College Scorecard data, Monroe College had a 57% three-year repayment rate and a 50% five-year repayment rate, which is just on the cusp of failing this formula. If we enroll 10% more high-income students who borrow, the repayment rate is going to increase. Our institution will not have changed at all, other than the addition of more high-income borrowers in
the classrooms. Such an “easy fix” could not have been the Department’s intention.
2 http://www.brookings.edu/about/projects/bpea/papers/2015/looney-yannelis-student-loan-defaults

8 I Monroe College August 1, 2016
G. For repayment data to be meaningful, the demographic of the students in repayment should be transparent.
Since student loan repayment characteristics should logically match broader consumer loan
repayment trends, one would expect that the higher the percentage of low-income students in
the pool, the lower the repayment rate. The Rule does not account for this in a way that allows
for a true reflection of institutional performance.
For example, at Monroe College, our Title IV student population is more than 80% “Pell-eligible” and our five-year repayment rate is 50%. Assume the students in repayment perfectly reflect our Title IV population. Looking downtown at New York University, its five-year repayment rate is 91%. However, the data do not reflect what percent of those students in repayment are Pell-eligible, obscuring how those low-income students perform repaying their
loans. The repayment rate formula masks this important information.
A college with a repayment pool consisting of 70% Pell recipients with a repayment rate of 49% is performing much better than a college with a repayment pool consisting of 20% Pell recipients with a repayment rate of 55%. Yet, the proposed methodology does not take this into consideration.
For repayment rates to be meaningful, we respectfully suggest that the Department, at the
very least, disclose the percentage of Pell recipients in the repayment pool or, preferably,
adjust the threshold to reflect a higher percentage of Pell recipients at an institution.
H. Contrary to the Department’s assertion, the proposed repayment rate methodology does not correspond to the five-year Scorecard data and is much more punitive.
The Department has offered very little explanation or justification for introducing a fourth formula to calculate repayment rates. The only guidance offered is a statement indicating that
results under this new formula would roughly reflect the College Scorecard five-year rates3.
The Department indicated that the 50% threshold was set after an analysis of the Scorecard’s five-year undergraduate repayment rates showed that 70 percent of institutions with 50 percent of borrowers or fewer making progress on their loans were proprietary institutions.
If analysis of the Scorecard data is the basis for the 50% threshold in the proposed regulation, the repayment rate should be calculated with the same methodology. The Department’s
decision to construct a new methodology makes the stated basis for the threshold illogical and
puts the entire regulation in jeopardy.
3 Source: NPRM, June 13, 2016: “For instance, a preliminary Department analysis of the College Scorecard five-year undergraduate repayment rates (using a comparable threshold of 50 percent of borrowers or fewer making progress on their loans) shows that more than 70 percent of institutions with a repayment rate below the threshold are proprietary institutions, and those institutions represent more than two in five of all proprietary institutions.”

9 I Monroe College August 1, 2016
II. Risks stemming from an overly broad Borrower Defense Framework will lead to unintended consequences that harm community colleges, HBCUs, and other institutions that provide access to underrepresented students.The Department’s rhetoric suggests that it invisions all defense to repayment claims to be aimed
at for-profits. The data and arguments below illustrate how public and non-profit institutions would be vulnerable to student claims.
A. Institutions that provide access to non-traditional and underrepresented students will be at risk.On July 21, a group representing the interests of HBCUs sent a letter to Secretary John King
outlining their concerns, which we share. The letter states:
“This regulation could undermine financial viability and potentially put them [HBCUs] out of business….Should a disgruntled former or current student at an HBCU feel “misrepresented” by their institution by any means, the broad language outlined in the proposed ED rule could open the floodgates for frivolous lawsuits that will only adversely affect the greater HBCU student body.”
We believe that this risk to HBCUs is real, especially if one sets aside their historic mission of
providing access for underserved communities and looks systematically at their Scorecard data
for graduation rates, default rates, repayment rates, and debt-to-earnings rates.
B. Schools with default rates higher than graduation rates are at risk.The chart on the next page illustrates the risk should a disgruntled student claim that his or
her institution should have warned, for example, that student borrowers there are more likely
to default on their loans than graduate (or that students are unlikely to be able to repay their
loans based on repayment rates below 50%).
A little more than two years ago, The New York Times published an editorial that called for
the loss of Title IV eligibility for proprietary institutions where default rates surpass graduation
rates.4 From that piece:
“…But a startling analysis released in the Spring by The Institute for College Access and Success, a nonprofit research group, found that even some programs where defaults outnumber diplomas would remain eligible for aid under the proposed rules.”
Interestingly, neither the Times nor TICAS noted that, according to a July 2013 USA Today article, College Default Rates Higher than Graduation Rates5, there are 58 community colleges
with default rates higher than graduation rates. In addition, close to one out of five HBCUs have default rates higher than graduation rates. The outcomes data for many of these institutions are worse than that of Corinthian College, where the Department has approved to date more than $170 million in borrower defense to repayment claims.
4 The New York Times, July 8, 2014: “Lessons of a For-Profit College Collapse” (http://www.nytimes.com/2014/07/09/opinion/lessons-of-a-for-profit-college-collapse.html?_r=0)
5 USA Today, July 2, 2013: “College Default Rates Higher than Grad Rates” (http://www.usatoday.com/story/news/nation/2013/07/02/college-default-rates-higher-than-grad-rates/2480295/)
10 I Monroe College August 1, 2016
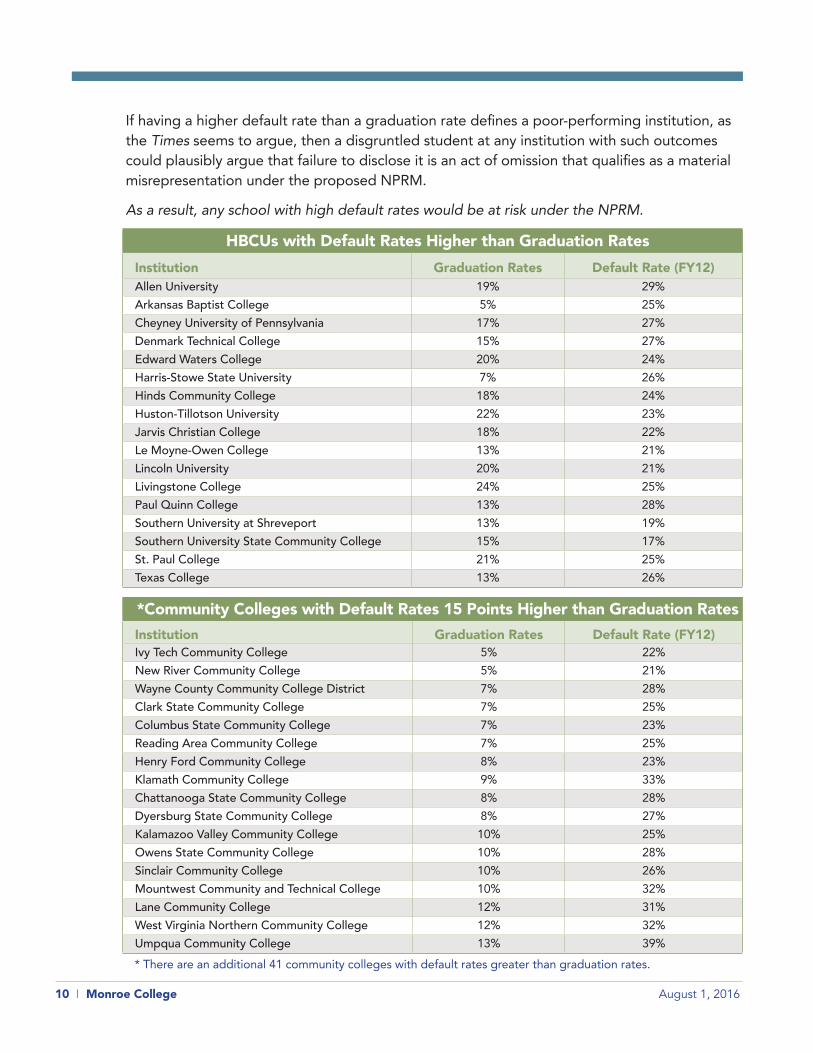
If having a higher default rate than a graduation rate defines a poor-performing institution, as the Times seems to argue, then a disgruntled student at any institution with such outcomes
could plausibly argue that failure to disclose it is an act of omission that qualifies as a material misrepresentation under the proposed NPRM.
As a result, any school with high default rates would be at risk under the NPRM.
HBCUs with Default Rates Higher than Graduation RatesInstitution Graduation Rates Default Rate (FY12)Allen University 19% 29%Arkansas Baptist College 5% 25%Cheyney University of Pennsylvania 17% 27%Denmark Technical College 15% 27%Edward Waters College 20% 24%Harris-Stowe State University 7% 26%Hinds Community College 18% 24%Huston-Tillotson University 22% 23%Jarvis Christian College 18% 22%Le Moyne-Owen College 13% 21%Lincoln University 20% 21%Livingstone College 24% 25%Paul Quinn College 13% 28%Southern University at Shreveport 13% 19%Southern University State Community College 15% 17%St. Paul College 21% 25%Texas College 13% 26%
*Community Colleges with Default Rates 15 Points Higher than Graduation RatesInstitution Graduation Rates Default Rate (FY12)Ivy Tech Community College 5% 22%New River Community College 5% 21%Wayne County Community College District 7% 28%Clark State Community College 7% 25%Columbus State Community College 7% 23%Reading Area Community College 7% 25%Henry Ford Community College 8% 23%Klamath Community College 9% 33%Chattanooga State Community College 8% 28%Dyersburg State Community College 8% 27%Kalamazoo Valley Community College 10% 25%Owens State Community College 10% 28%Sinclair Community College 10% 26%Mountwest Community and Technical College 10% 32%Lane Community College 12% 31%West Virginia Northern Community College 12% 32%Umpqua Community College 13% 39%* There are an additional 41 community colleges with default rates greater than graduation rates.

11 I Monroe College August 1, 2016
C. Schools with high default rates and numbers of defaulters are at risk.
Nothing is more catastrophic for a student borrower than default. As one website put it,
“If education debt is evil, then defaulting on your student loans is a one-way ticket to hell.”6
The consequences are indeed severe. A student borrower that defaults faces any number of
long-term financial challenges, including ruined credit, possible wage garnishment, a debt that is non-dischargeable in bankruptcy, the inability to seek future grant aid, and problems
securing employment due to bad credit.
There are 27 HBCUs with default rates above 20%, as well as 392 other public and non-profit colleges with default rates above 20%.
We believe that the consequences associated with default are so much more severe than those
associated with low repayment rates, that warnings for defaults would be more appropriate
than warnings for low repayment rates.
The 10 Community Colleges with the Highest Number of DefaultersInstitution Cohort Default Rate Number of DefaultersIvy Tech Community College of Indiana 22% 4,269
Columbus State Community College 23% 2,052
Owens State Community College 28% 1,449
Wayne county Community College District 28% 1,120
Kirkwood Community College 23% 1,061
Austin Community College 22% 1,037
Lansing Community College 26% 980
Sinclair Community College 26% 970
Portland Community College 20% 972
Columbia Gorge Community College 20% 972
6 FastWeb, May 28, 2015: “The Horrors of Defaulting on Education Debt” (http://www.fastweb.com/financial-aid/articles/the-horrors-of-defaulting-on-education-debt)

12 I Monroe College August 1, 2016
D. Public and nonprofit colleges with high institutional debt-to-earnings ratios are at risk.
With its Gainful Employment Rule, the Department concluded that academic programs at
certain institutions where students’ monthly payments on their debt exceeds 8% of their monthly earnings are so deficient that they warrant closure. Despite multiple requests to produce similar data for degree programs at public and nonprofit colleges, the Department has refused. Fortunately, the Scorecard provides median debt and median earnings on an
institutional basis.
There are well over 100 non-profit institutions with institutional debt-to-earnings rates above 8%. There are 28 public institutions with debt-to-earnings rates above 8%. Again, the GE Rule has set a quality measure precedent that will boomerang back under Borrower Defense to
Repayment to hurt programs that are exempt under the former but beholden to the latter.
(See Appendix F: Public D/E Rates and Appendix G Non-Profit D/E Rates.)
u u u
Without question, students who have been misled or defrauded by their higher education
providers deserve relief from the burden of onerous student loan debts that they took on
in good faith. However, the community colleges, HBCUs, and private colleges serving low-
income students that would now be put at risk by this well-intended, but too broadly written
regulation deserve the Department’s consideration and protection as well. To do otherwise
would be counter to the Administration’s heightened focus on improving access for the very
student populations these institutions serve.
While the Department has made some data available through the Scorecard, we believe the
data have not been properly vetted. That concern, coupled with the inability to replicate the
published figures and the lack of a universal repayment rate formula, makes clear that the metric should be abandoned as a punitive yardstick.
We respectfully submit the above comments, concerns and observations to the Department in
the spirit of collegiality and with the hope that they will be carefully considered as it finalizes its Borrower Defense to Repayment Rule.
Regards,
Marc M. Jerome
Executive Vice President

13 I Monroe College August 1, 2016
2011 Gainful Employment Regulation
Methodology: Based on 3-4 years after entering repayment. Calculation utilized full dollar of loans being repaid.
Negatives: By utilizing the full dollar amount of loans being repaid in the numerator, the repayment rate could be skewed by the size of the loans being repaid. Time period of 3-4 years was too short, given that many borrowers opt for plans with reduced payments early in the repayment period.
Positives: Repayment Rate was expressed as a percentage, which made it both measurable and intuitive. Limited consideration was given to Income Driven Repayment Plans.
2014 Gainful Employment Regulation
Methodology: Based on 3-4 years after entering repayment. Calculation was based on numbers of students repaying loans.
Negatives: Time period of 3-4 years was too short, given that many borrowers opt for plans with reduced payments early in the repayment period. No consideration was given to students in Income Driven Repayment Plans.
Positives: Repayment rate was expressed as a percentage, which made it both measurable and intuitive.
College Scorecard
Methodology: Based on three years after entering repayment. Calculation based on numbers of students “who have repaid at least $1 of the principal balance on their federal loans within three years of leaving school.”
Negatives: Time period of 3-4 years is too short, given that many borrowers opt for plans that reduce payments early in the repayment period. No consideration was given to students in Income Driven Repayment Plans.
Positives: Repayment rate was expressed as a percentage, which made it both measurable and intuitive.
Borrower Defense NPRM Methodology: Based on five years after entering repayment. Calculation based on dollars, being repaid, using a Median percentage.
Negatives: The rate calculation is not intuitive, not easily replicated and almost impossible for the institution to monitor and predict. It is not consumer friendly. Medians could cause many scenarios where the outcome is misleading. No consideration was given to students in Income Driven Repayment Plans. 5 year rates often decline from 3 year rates.
Positives: Longer time period than other methodologies.
Appendix A: Multiple Repayment Rate Formulas

14 I Monroe College August 1, 2016
Appendix B: HBCUs with Repayment Rates 50% or Less
Institution Scorecard % of Borrowers Repaying After 5 Yrs (FY08 & FY09 cohorts)
Arkansas Baptist College 20%Lane College 22%Texas College 24%Central State University 28%Livingstone College 29%Miles College 29%Harris-Stowe State University 30%Paul Quinn College 31%Benedict College 32%Morris College 32%Southern University at Shreveport 33%Jarvis Christian College 33%Stillman College 34%Florida Memorial University 35%Rust College 35%Le Moyne-Owen College 36%Philander Smith College 36%Denmark Technical College 36%Cheyney University of Pennsylvania 36%Mississippi Valley State University 38%Alabama State University 39%Shaw University 39%Allen University 39%Bethune-Cookman University 39%Texas Southern University 40%Grambling State University 40%Edward Waters College 40%Paine College 40%Johnson C Smith University 41%Hinds Community College 41%Huston-Tillotson University 41%Alcorn State University 42%University of Arkansas at Pine Bluff 43%North Carolina Central University 43%Kentucky State University 45%Tougaloo College 45%Jackson State University 46%Southern University at New Orleans 47%Virginia Union University 47%Morgan State University 47%Savannah State University 47%Elizabeth City State University 48%Albany State University 48%Fort Valley State University 49%Coppin State University 49%Alabama A & M University 49%Oakwood University 49%Claflin University 49%Average of failing institutions 39%Average of passing institutions 61%
Note: This group of 49 institutions represents 57% of all HBCU’s
15 I Monroe College August 1, 2016
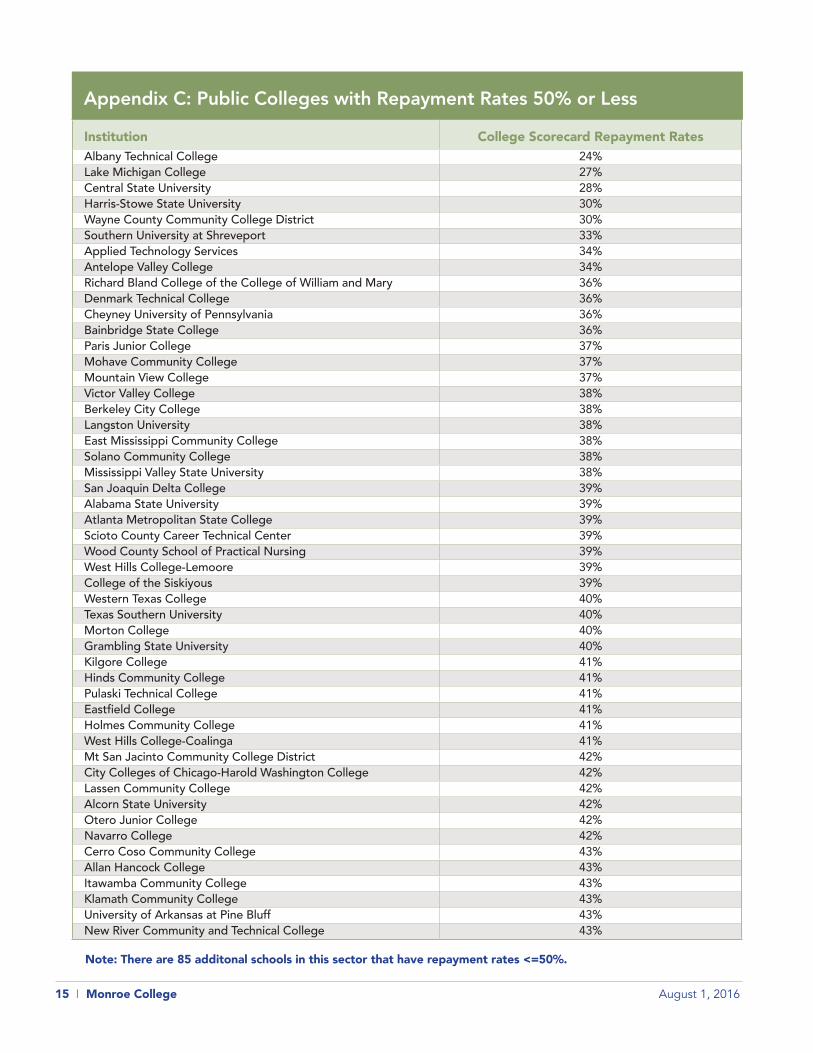
Appendix C: Public Colleges with Repayment Rates 50% or Less
Institution College Scorecard Repayment RatesAlbany Technical College 24%Lake Michigan College 27%Central State University 28%Harris-Stowe State University 30%Wayne County Community College District 30%Southern University at Shreveport 33%Applied Technology Services 34%Antelope Valley College 34%Richard Bland College of the College of William and Mary 36%Denmark Technical College 36%Cheyney University of Pennsylvania 36%Bainbridge State College 36%Paris Junior College 37%Mohave Community College 37%Mountain View College 37%Victor Valley College 38%Berkeley City College 38%Langston University 38%East Mississippi Community College 38%Solano Community College 38%Mississippi Valley State University 38%San Joaquin Delta College 39%Alabama State University 39%Atlanta Metropolitan State College 39%Scioto County Career Technical Center 39%Wood County School of Practical Nursing 39%West Hills College-Lemoore 39%College of the Siskiyous 39%Western Texas College 40%Texas Southern University 40%Morton College 40%Grambling State University 40%Kilgore College 41%Hinds Community College 41%Pulaski Technical College 41%Eastfield College 41%Holmes Community College 41%West Hills College-Coalinga 41%Mt San Jacinto Community College District 42%City Colleges of Chicago-Harold Washington College 42%Lassen Community College 42%Alcorn State University 42%Otero Junior College 42%Navarro College 42%Cerro Coso Community College 43%Allan Hancock College 43%Itawamba Community College 43%Klamath Community College 43%University of Arkansas at Pine Bluff 43%New River Community and Technical College 43%
Note: There are 85 additonal schools in this sector that have repayment rates <=50%.

16 I Monroe College August 1, 2016
Appendix D: Private Colleges with Repayment Rates 50% or Less
Institution College Scorecard Repayment RatesCentro de Estudios Multidisciplinarios-San Juan 19%Arkansas Baptist College 20%College America-Flagstaff 20%Lane College 22%Wright Career College 22%Talladega College 22%Texas College 24%Metropolitan Career Center Computer Technology Institute 26%Clinton College 26%Concordia College Alabama 26%Donnelly College 27%Livingstone College 29%Southwestern Christian College 29%Miles College 29%Remington College-Tampa Campus 29%Martin University 30%East-West University 30%Expertise Cosmetology Institute 31%Paul Quinn College 31%Benedict College 32%Morris College 32%College America-Denver 32%Chatfield College 33%Jarvis Christian College 33%CET-San Diego 34%Stillman College 34%Northwest HVAC/R Training Center 34%Florida Memorial University 35%Rust College 35%Le Moyne-Owen College 36%Philander Smith College 36%Shaw University 39%Caribbean University-Bayamon 39%Allen University 39%Saint Augustine's University 39%Beulah Heights University 39%Virginia University of Lynchburg 39%Bethune-Cookman University 39%Orleans Technical Institute 39%Wiley College 39%Edward Waters College 40%Paine College 40%Johnson C Smith University 41%City College-Fort Lauderdale 41%Hallmark College 41%Huston-Tillotson University 41%EDP University of Puerto Rico Inc-San Sebastian 41%Metropolitan College of New York 41%NTMA Training Centers of Southern California 42%Marygrove College 42%
Note: There are 26 additonal schools in this sector that have repayment rates <=50%.
17 I Monroe College August 1, 2016
Appendix E: HBCU Repayment Rate Comparison
Institution FY 2009 GE 3YR Repayment Rate
Scorecard 3YR Repayment Rate
Alabama A & M University 21% 44%Alabama State Univerity 14% 33%Albany State University 18% 36%Alcorn State University 15% 36%Allen University 10% 24%University of Arkansas for Pine Bluff 14% 41%Arkansas Baptist College 6% 12%Barber-Scotia College 15% —
Benedict College 8% 17%Bennett College 14% 43%Bethune Cookman College 15% 38%Bishop State Community College - Main Campus 0% —
Bluefield State College 32% 50%Bowie State University 22% 49%Central State University 9% 20%Cheyney University of Pennsylvania 14% 31%Claflin University 12% 51%Clark Atlanta University 19% 53%Clinton Junior College 2% 27%Coahoma Community College 33% —
Concordia College--Alabama 7% 25%Coppin State University 23% 41%Delaware State University 21% 54%Denmark Technical College 10% 28%Dillard University 23% 59%University of the District of Columbia 29% 51%Edward Waters College 8% 27%Elizabeth City State University 25% 37%Fayetteville State University 25% 46%Fisk University 18% 63%Florida A & M University 32% 57%Florida Memorial University 12% 29%Fort ValleyState University 28% 35%Gadsden Business College 30% —
Grambling State University 12% 35%Hampton University 42% 68%Harris-Stowe State University 16% 26%Howard University 32% 59%Huston-Tillotson 14% 40%Interdenominational Theological Center 12% —
Jackson State University 12% 42%Jarvis Christian College 15% 28%Johnson C. Smith University 17% 35%Kentucky State University 19% 43%Lane College 10% 17%Lemoyne-Owen College 11% 26%Lincoln University--PA — 40%Lincoln University--MO 19% 43%Livingstone College 8% 17%Meharry Medical College 27% —
Miles College 11% 22%
18 I Monroe College August 1, 2016
Appendix E: HBCU Repayment Rates (continued)
Institution FY 2009 GE 3YR Repayment Rate
FY 2009 GE 3YR Repayment Rate
Mississippi Valley State University 8% 30%Morehouse School of Medicine 16% —
Morgan State University 23% 38%Morris Brown College 19% —
Morris College 12% 27%Norfolk State University 24% 45%North Carolina Agricultural & Technical State University 27% 49%North Carolina Central University 22% 41%Oakwood University 19% 44%Paine College 16% 27%Paul Quinn College 13% 37%Philander Smith College 14% 32%Prairie View Agricultural & Mechanical University 20% 43%Rust College 15% 23%Saint Paul's College 19% 41%Savannah State University 20% 34%Shaw University 13% 31%Southern University and A & M College at Baton Rouge 18% 50%Southern University at New Orleans 15% 37%Southern University at Shreveport - Bossier City 13% 35%Southwestern Christian College 21% 18%Spelman College 35% 67%Stillman College 12% 29%Tennessee State University 22% 53%Texas College 10% 24%Texas Southern University 23% 37%Tougaloo College 11% 36%Tuskegee University 38% 62%Virginia State University 25% 47%Virginia Union University 21% 29%

19 I Monroe College August 1, 2016
Appendix F: Public Colleges With Institutional D/E Rates Above 8%
Institution Debt-to Earnings-RatioGrambling State University 14.9%Mississippi Valley State University 14.1%Jackson State University 13.0%Lincoln University of Pennsylvania 12.2%Southern University and A & M College 11.2%Southern University Law Center 11.2%Alabama State University 10.8%South Carolina State University 10.7%Albany State University 10.6%Central State University 10.6%Massachusetts College of Art and Design 10.4%Alabama A & M University 10.2%Texas Southern University 9.5%Langston University 9.4%Southern University at New Orleans 9.4%Norfolk State University 9.3%North Carolina Central University 9.2%Savannah State University 8.9%University of North Carolina School of the Arts 8.9%SUNY at Purchase College 8.8%Francis Marion University 8.7%Winthrop University 8.6%Elizabeth City State University 8.4%Johnson State College 8.2%Winston-Salem State University 8.2%North Carolina A & T State University 8.1%Edinboro University of Pennsylvania 8.1%Fayetteville State University 8.0%

20 I Monroe College August 1, 2016
Appendix G: Non-Profit Colleges with Institutional D/E Rates Above 8%
Institution Debt-to Earnings-RatioThe Boston Conservatory 14.5%Naropa University 13.5%Manhattan School of Music 13.2%Florida Memorial University 13.2%Pennsylvania Academy of the Fine Arts 13.1%Beulah Heights University 12.8%The University of the Arts 12.8%Claflin University 12.7%Johnson C Smith University 12.7%The Juilliard School 12.5%Fisk University 12.3%Tougaloo College 12.1%Goddard College 11.9%Columbia College 11.8%Columbus College of Art and Design 11.8%Bennett College for Women 11.7%Berklee College of Music 11.6%Memphis College of Art 11.5%California Institute of the Arts 11.5%Marlboro College 11.4%Marlboro College Graduate School 11.4%Marygrove College 11.4%Maine College of Art 11.3%Oakwood University 11.1%Minneapolis College of Art and Design 10.9%Kansas City Art Institute 10.9%Bennington College 10.8%Coker College 10.8%Moore College of Art and Design 10.8%The New England Conservatory of Music 10.8%Cleveland Institute of Art 10.7%Ringling College of Art and Design 10.6%Chester College of New England 10.6%Benedict College 10.5%Earlham College 10.5%Clark Atlanta University 10.5%Bethune-Cookman University 10.5%Valley Forge Christian College 10.4%Jones College-Jacksonville 10.3%Pacific Northwest College of Art 10.2%Hampshire College 10.2%Milwaukee Institute of Art & Design 10.2%Montserrat College of Art 10.1%CBD College 10.1%Talladega College 10.1%Unity College 10.1%School of the Art Institute of Chicago 10.0%California College of the Arts 10.0%Saint Augustines College 10.0%Lawrence University 10.0%Olivet College 10.0%

21 I Monroe College August 1, 2016
Institution Debt-to Earnings-RatioArt Academy of Cincinnati 9.9%Maryland Institute College of Art 9.9%Beloit College 9.9%Burlington College 9.9%College of the Atlantic 9.9%Paine College 9.9%Warren Wilson College 9.9%College of Visual Arts 9.8%Oberlin College 9.7%Wright Career College 9.7%Woodbury University 9.7%Cornish College of the Arts 9.7%Knox College 9.6%Hollins University 9.6%Green Mountain College 9.6%Philander Smith College 9.6%Lincoln Christian University 9.6%Savannah College of Art and Design 9.5%Lycoming College 9.5%Marylhurst University 9.4%Wells College 9.4%Cleveland Institute of Music 9.3%Northland College 9.3%Bard College 9.3%Oral Roberts University 9.3%Transylvania University 9.2%Fontbonne University 9.2%Southern Wesleyan University 9.2%Marywood University 9.1%Point Park University 9.1%Ohio Wesleyan University 9.1%Alma College 9.1%Columbia International University 9.1%Alverno College 9.1%Allegheny College 9.1%Antioch University-New England 9.0%Antioch University-Los Angeles 9.0%Antioch University-Midwest 9.0%Antioch University-Santa Barbara 9.0%Antioch University-Seattle 9.0%Shaw University 9.0%Tuskegee University 9.0%Sojourner-Douglass College 9.0%Columbia College-Chicago 9.0%City College-Fort Lauderdale 8.9%City College-Gainesville 8.9%City College-Miami 8.9%Limestone College 8.9%Cornell College 8.8%Art Center College of Design 8.8%Otis College of Art and Design 8.8%
Appendix G: Non-Profit Colleges with Institutional D/E Rates Above 8% (continued)