student performance and student engagement in …...international baccalaureate middle years...
TRANSCRIPT
Student Performance and Student Engagement in the
International Baccalaureate
Middle Years Programme
April 2011
Julie Wade

International Baccalaureate Middle Years Programme i
Table of Contents
Executive Summary ....................................................................................................................... iii
Background and Evaluation Questions ...................................................................................... iii
Key Findings .............................................................................................................................. iv
Recommendations ...................................................................................................................... vi
Background ..................................................................................................................................... 1
Literature Review.............................................................................................................................2
Scope of the Study ...........................................................................................................................3
Evaluation Questions ....................................................................................................................3
Methodology ....................................................................................................................................3
Findings............................................................................................................................................6
Characteristics of the Sample Schools .........................................................................................6
Student Achievement ...................................................................................................................7
Student Engagement .....................................................................................................................9
Student and Parent Ratings of School Environment ..................................................................12
Relationship of Student Engagement to Academic Performance ..............................................13
Principal Interviews: Summary of Findings ..............................................................................15
Discussion ......................................................................................................................................17
Recommendations and Next Steps.................................................................................................18
Acknowledgements ........................................................................................................................18
References ......................................................................................................................................19
Appendix A ....................................................................................................................................21
Appendix B ....................................................................................................................................22
Appendix C ....................................................................................................................................24
International Baccalaureate Middle Years Programme ii
List of Tables
Table 1 The International Baccalaureate Middle Years Program: Characteristics of
Participants in MYP Schools and Comparison Schools, 2009–2010 ....................................6
Table 2 Characteristics of MYP Schools and Comparison Schools, 2009–2010 ...............................7
Table 3 Percentage of Students Scoring Proficient or Advanced on Mathematics, Reading,
and Science in MYP Schools and Comparison Schools, 2009–2010 ...................................8
Table 4 Mean RIT Scores for Students in MYP Schools and Comparison Schools, Fall
2009 and Spring 2010 ............................................................................................................8
Table 5 Mean Attendance and Suspension Rates for Students in MYP Schools and
Comparison Schools, Spring 2010 ........................................................................................9
Table 6 Mean Ratings of School Engagement in MYP Schools and Comparison Schools .............10
Table 7 Mean Ratings of School Engagement in MYP Schools with Most Years in
Program and MYP Schools with Fewest Years in Program ...............................................10
Table 8 Percent of Students Agreeing with Survey Items in MYP Schools and Comparison
Schools ................................................................................................................................11
Table 9 Percent of Students Agreeing with Items on Survey of School Environment in
MYP Schools and Comparison Schools ..............................................................................12
Table 10 Percent of Parents Agreeing with Items on Survey of School Environment in MYP
Schools and Comparison Schools .......................................................................................13
Table 11 Relationship between Ratings of School Engagement and Measures of
Performance in MYP Schools and Comparison Schools ....................................................14
International Baccalaureate Middle Years Programme iii
Executive Summary
A study of the performance and engagement of students in the International Baccalaureate
Middle Years Programme (IB MYP) was conducted in a large, socioeconomically diverse
district of rural, urban, and suburban communities. The study was requested by the school
district office overseeing the program in collaboration with the International Baccalaureate (IB).
Funding for the study was provided by the IB. The study examined the engagement and
performance of students enrolled in five middle schools with IB MYP, and compared them with
students in five demographically similar middle schools without IB MYP.
Background and Evaluation Questions
The Middle Years Programme (hereafter MYP) employs an inquiry-based approach to teaching
and learning with an emphasis on interdisciplinary instruction. The program strives to encourage
students to become lifelong learners and active citizens with a global perspective. Three
fundamental concepts support and strengthen all areas of the curriculum in an MYP school:
intercultural awareness, holistic learning, and communication (IB, 2011a). Five middle schools
in the school district have implemented MYP; all use a whole-school model (i.e., all teachers and
students in the school participate in the program).
This study examined the performance and engagement of students enrolled in the five middle
schools with MYP and five demographically similar middle schools without MYP. The
following questions guided the study:
1. What are the characteristics of the five MYP schools and five non-MYP comparison
schools?
2. How did students in MYP and non-MYP schools perform on state and local assessments?
3. What were the levels of school engagement in MYP and non-MYP schools, as measured
by Middle Grades Survey of Student Engagement, and by student attendance and
suspensions?
4. How did students and parents in the MYP and non-MYP schools rate their schools on a
survey of school environment?
5. What was the relationship between student engagement and student performance in MYP
and non-MYP schools?
6. What were the experiences and perceptions of administrators in MYP and non-MYP
schools regarding school climate and student engagement?
Summary of Methodology
To answer these questions, a mixed-methods evaluation study was conducted. Qualitative and
quantitative data were collected to examine student performance, student engagement, student
and parent perceptions of school climate, and reported experiences of school principals.
Outcome measures for students in MYP schools were compared with those of students in
comparison schools, and differences in students’ background characteristics were controlled in
two ways: 1) by design, in the selection of demographically similar comparison schools, and
2) by statistical procedures, controlling for student background characteristics.

International Baccalaureate Middle Years Programme iv
Sample of schools. All five of the district middle schools with MYP were included in the study.
Five comparison schools were selected from among the district middle schools without MYP
based on their similarity on a composite of demographic variables.
Measures. Student performance was measured with annual state assessments, Measures of
Academic Progress-Reading (MAP-R), and report card grades. Student engagement was
measured with the Middle Grades Survey of Student Engagement, developed by Indiana
University’s Center for Evaluation and Education Policy, as well as with attendance and
suspension data. Student and parent ratings of school climate were assessed with a survey of
school environment administered by the school district. Interviews were conducted with the
principal of each of the study schools, both MYP and non-MYP, to gain a deeper understanding
of the school context.
Procedures for analyses. Outcome measures were compared for students in MYP schools and
students in non-MYP comparison schools using both statistical significance tests and effect sizes.
In all analyses of student performance and student engagement, differences in student
characteristics were controlled for, including race/ethnicity, receipt of Free and Reduced-price
Meal System (FARMS) services, receipt of special education services, enrollment in English for
Speakers of Other Languages (ESOL) classes, gender, and when possible, previous test
performance.
Key Findings
Student performance. A higher percentage of students in MYP schools achieved a proficient
or advanced performance level on mathematics and science assessments compared with their
counterparts in five comparison schools, after controlling for differences in background and
previous year’s test performance (only mathematics performance was available for the previous
year). The analyses revealed small but practically meaningful effect sizes. Comparisons of
performance in reading, both on the state assessments and fall-to-spring MAP-R, revealed no
significant differences between students in MYP schools and comparison schools.
Student engagement. At all grade levels, students in MYP schools and students in the
comparison schools did not differ in their ratings on the three dimensions of the Survey of
Student Engagement. Moreover, students in schools with the highest number of years in MYP
did not respond significantly differently from students in schools with the lowest number of
years in MYP. On individual survey items identified to address students’ perceptions of school
climate, one item, ―Overall, I feel good about being in this school,‖ revealed statistically
significant differences in favor of MYP for students in Grade 6 and Grade 8.
Student and parent ratings of school environment. Student and parent responses to the
Survey of School Environment administered by the school district provided further information
about school climate, particularly in terms of a welcoming atmosphere and school efforts at
promoting positive relationships. Parent and student responses to individual survey items
addressing aspects of school climate did not differ between MYP and non-MYP schools.
However, student overall ratings of their school in the form of a ―grade‖ between ―A‖ and ―D‖
International Baccalaureate Middle Years Programme v
were more positive in the MYP schools than in the comparison schools, both for Grade 6 and
Grade 8 students. Higher percentages of students in MYP schools compared with students in
non-MYP schools gave their school a grade of ―A‖ or ―B‖ (71% vs. 63% in Grade 6, and 56%
vs. 48% in Grade 8).
Relationship of student engagement to academic performance. The relationship between
students’ ratings of school engagement and their academic performance was examined
controlling for demographic variables and, when possible, previous year’s performance. Overall,
the analyses showed a positive association between student engagement and some measures of
student performance, both among students in MYP schools and students in comparison schools.
Analyses at each grade level did not reveal differences in the engagement-performance
relationship between the two groups of students in MYP and comparison schools.
Experiences of principals. Interviews were conducted with principals in both the five MYP
schools and the five comparison schools to learn more about the programs and strategies in place
at their schools and how they may influence school climate and student engagement. The
positive influences of a variety of programs—MYP and others—reported by principals in both
MYP and comparison schools may help explain the similar ratings of school engagement and
school climate by students in both groups of schools.
One strategy reported by MYP principals in particular, however, was interdisciplinary learning.
It was this approach that most distinguished the interviews of MYP principals from those of the
comparison school principals. All five principals in MYP schools noted interdisciplinary learning
as a positive influence in their school related to MYP.
In addition, four of the five MYP principals identified teacher training and the support of the
MYP coordinator as important benefits of the program. All teachers in MYP schools receive
initial and continuing training in the program’s instructional approach.
Overall summary and discussion. Some evidence of student achievement benefits from MYP
was suggested by the data; specifically, performance in mathematics and science were slightly
but significantly higher for MYP students compared with students in similar non-MYP schools.
Ratings of student engagement, for the most part, were similar for students in MYP and
comparison schools. An overall rating of school environment, however, was higher for MYP
students compared with non-MYP students, and a higher percentage of MYP students agreed that
―Overall, I feel good about being in this school,‖ compared with non-MYP students. Reported
experiences of principals in MYP and comparison schools provide insights that may help in the
understanding of these findings.

International Baccalaureate Middle Years Programme vi
Recommendations
Study findings suggest the following recommendations:
Continue to examine the performance of MYP students through their years of participation in
the program to substantiate and further understand the effects found for mathematics and
science.
Survey students with questions directly addressing their experience in MYP. In areas of
MYP emphasis, such as acquiring a global perspective, or learning through an
interdisciplinary approach to instruction, teachers and administrators may learn how
effectively the program is advancing these goals by asking questions of students.
Solicit feedback and input from teachers in MYP schools. Four of five MYP principals
expressed concern that teachers have adequate professional development and support from
the MYP coordinator to align the MYP aims and objectives with the district curriculum and
the core curriculum. Receiving and using input from teachers may help with schoolwide
incorporation of MYP structures and expectations.
Assess teachers’ perceptions of the MYP training. Since teacher training was reported by
MYP principals as an important benefit of the program, soliciting information from teachers
about how the MYP training has impacted their work in the classroom may inform
instructional practice.
International Baccalaureate Middle Years Programme 1
Student Performance and Student Engagement
in the International Baccalaureate Middle Years Programme
Background
The International Baccalaureate (IB) offers challenging and innovative programs to students at
three levels: the IB Primary Years Programme (PYP), the IB Middle Years Programme (MYP),
and the Diploma Programme (DP). Currently, the IB works with over 3,000 schools in 140
countries to offer IB programs to over 900,000 students (IB, 2011a).
The school district in which the study was conducted is a large, socioeconomically diverse
district of rural, urban, and suburban communities. Across the district, 14 IB programs have
been authorized and established: one PYP, five MYPs in middle schools, and eight DPs in high
schools. Three of the high schools with DPs also have the MYP for students in grades 9 and 10.
The focus of this study was the IB Middle Years Programme in five of the district’s middle
schools. The first MYP in the district was established in 2003; since then, four other middle
schools have launched MYPs, with the most recent MYP authorized in 2008. Over 4,000
students in Grades 6 through 8 currently are enrolled in the five district middle schools with
MYP. All MYP schools in the district use a whole-school model (i.e., all students and teachers
in the school participate in the program).
The Middle Years Programme (hereafter MYP) employs an inquiry-based approach to teaching
and learning with an emphasis on interdisciplinary instruction; the program strives to encourage
students to become lifelong learners and active citizens with a global perspective (IB, 2011a).
The IB mission statement says:
The International Baccalaureate aims to develop inquiring, knowledgeable and caring
young people who help to create a better and more peaceful world through intercultural
understanding and respect (IB, 2011a).
At all program levels, IB works in four areas to address its mission: 1) development of
curriculum, 2) assessment of students, 3) training and professional development of teachers, and
4) authorization and evaluation of schools (IB, 2011a). Three fundamental concepts support and
strengthen all areas of the curriculum in an MYP school—intercultural awareness, holistic
learning, and communication. MYP provides opportunities for interdisciplinary learning and
critical thinking through its curricular framework. Involvement in community service and
developing a global outlook are key elements of the program (IB, 2011b). All teachers in MYP
schools participate in IB’s professional development, and all MYP schools have an MYP
coordinator to support the program on site.
IB authorization is at least a three-year process for the school, beginning with a year-long
feasibility study and followed by two or more years of application development and review,
including submission of a five-year plan, development of course outlines, teacher training, and
IB visits with stakeholders. During the authorization process, an MYP coordinator is brought on
to support the program in the school. Reauthorization by IB is required every five years and
International Baccalaureate Middle Years Programme 2
ongoing monitoring of assessment, with submission of course materials and assessments,
including graded student work, is required each year for rotating grades and course subjects. The
systematic evaluation and monitoring by IB ensures that each IB school is implementing the
program with fidelity (IB, 2011a).
Literature Review
Studies of IB programs have been primarily descriptive and on a small scale, and few have
focused on academic outcomes. A notable exception, however, is a pair of longitudinal studies
conducted by Kiplinger (2005a; 2005b) which looked at both achievement and growth in reading
and mathematics among students in IB programs and students not in IB programs. Performance
was higher among the students in IB programs than among students not in IB programs, both at
middle school and high school levels, with greater differences in mathematics. The effect of IB
on rates of improvement, however, was modest, and for some groups, absent. The author noted
that benefits of the IB program may accrue, because the study found that longer IB participation
was associated with greater academic gains, although the size of the effect was small
(Kiplinger, 2005a).
In qualitative studies of IB programs, teachers have reported that the adoption of the IB
curriculum often results in a more positive school climate and increased student engagement
(Powell, 2002; Rose, 2007). In an effort to quantify the examination of IB student engagement, a
recent study compared IB and non-IB students on their levels of school engagement (IB and
Indiana University, 2010). The study used the High School Survey of Student Engagement
(HSSSE), a national survey measuring the academic, social, and emotional engagement of high
school students (see Yazzie-Mintz, 2010). Analysis of survey responses from IB students and
non-IB students revealed the largest effect size on Social/Behavioral/Participatory Engagement.
The study also compared survey responses of IB students and non-IB students within the same
school; IB students had higher ratings of engagement on all three dimensions. Finally, the study
compared responses of all students in schools with IB programs with responses of students in
schools without IB programs; results of these analyses showed smaller effect sizes in general.
Both school climate and student engagement have been shown to be positively related to student
achievement (Felner, Seitsinger, Brand, Burns, & Bolton, 2007; Fredericks, Blumenfeld, &
Paris, 2004; Singh, Granville, & Dika, 2002). In both implicit and explicit ways, the pedagogical
approach embedded in the MYP aims to promote a positive school climate and to enhance
student engagement in learning. MYP’s emphasis on interdisciplinary instruction and inquiry-
based teaching and learning creates a structure for interactive, engaged learning (IB, 2011b).
Examining the relationship between engagement and achievement among MYP students may
help further an understanding of the experience of students in the program.
Assessing the impact of IB program participation, however, is complicated by issues of selection,
since most IB students are high achieving even before they participate in an IB program. This
problem was highlighted by Kiplinger (2005a; 2005b) and discussed in an IB publication
(IB, 2008). Studies of effects associated with IB programs must contend with the fact that IB
students, particularly at the high school level, are often high-performing students who have opted
to take the most demanding courses. Although the philosophy of the IB program extends beyond
International Baccalaureate Middle Years Programme 3
academics, aiming to promote a sense of intercultural awareness and global citizenship in its
students, it is difficult to measure the impact of IB, academic or otherwise, because of self-
selection in most IB programs (IB, 2008).
The whole-school model of the MYP in the school district conducting the study provided a
research sample not confounded by student self-selection factors. All students enrolled in the
five MYP schools in the district participate in MYP, and the student outcomes in this evaluation
study were measured for all students in MYP schools, as well as for all students in five non-MYP
comparison schools. Thus, although at the school level some selection factors may be at play
(i.e., the schools were not randomly assigned to MYP or comparison group), the students within
schools did not elect whether or not to be in MYP, as has been the case in some earlier studies.
Scope of the Study
This study examined the student engagement and student performance of students enrolled in
five middle schools with the MYP and five demographically similar middle schools without the
MYP. The study also examined student and parent ratings of school climate in the two groups of
schools. The relationship between student engagement and student performance in MYP schools
and non-MYP comparison schools was an additional focus of the study.
The questions guiding the study included:
1. What are the characteristics of the five MYP schools and five non-MYP comparison
schools?
2. How did students in MYP and non-MYP schools perform on state and local assessments?
3. What were the levels of school engagement in MYP and non-MYP schools, as measured
by Middle Grades Survey of Student Engagement, and by student attendance and
suspensions?
4. How did students and parents in the MYP and non-MYP schools rate their schools on a
survey of school environment?
5. What was the relationship between student engagement and student performance in MYP
and non-MYP schools?
6. What were the observations and perceptions of administrators in MYP and non-MYP
schools regarding school climate and student engagement?
Methodology
Multiple methods were used to answer the study questions: standardized tests and report card
grades were used to assess student performance; surveys, as well as attendance and suspension
data, were used to measure student engagement; and interviews were conducted with principals
to gain a deeper understanding of the school context. Data were compared for two groups of
students—students enrolled in five MYP schools and students enrolled in five demographically
similar comparison schools. In addition, the relationship between student performance and
student engagement was examined within the sample of students in MYP schools and separately
for students in comparison schools. The study was conducted using two levels of control to
International Baccalaureate Middle Years Programme 4
reduce the selection bias: 1) by design, in the selection of demographically similar comparison
schools; and 2) by statistical procedures, controlling for student background characteristics.
Sample of schools. All five MYP schools were included in the study. Five comparison schools
were selected from among the non-MYP schools in the district, based on their similarity on a
composite of demographic variables: percentage of students enrolled in English for Speakers of
Other Languages (ESOL) classes; percentage of students receiving Free and Reduced-price
Meals System (FARMS) services; percentage of students identified as Asian American, African
American, Hispanic, or White; percentage of students receiving special education services; and
number of students in the school. Schools with special programs requiring applications were not
included among the comparison group of schools.
Measures of student performance. Student performance data were obtained from student
records. The annual state reading and mathematics tests (and in Grade 8, science) were
examined for students in MYP and non-MYP schools. Reading and mathematics scores
achieved during the study year and in the previous year were used. In addition, scores on the
Measures of Academic Progress-Reading (MAP-R)1 were used to measure fall to spring progress
during the study year. Finally, average report card grades for students in MYP and non-MYP
schools were examined for the study year.
Measures of Student Engagement. Student engagement was measured using the Middle
Grades Survey of Student Engagement. This survey, developed by Indiana University’s Center
for Evaluation and Education Policy, is based on the High School Survey of Student Engagement,
and taps three distinct dimensions of student engagement:
1. Cognitive/Intellectual/Academic Engagement describes students’ effort, investment, and
strategies for learning—the work students do and the ways students go about their work.
Survey developers refer to this dimension as ―engagement of the mind.‖
2. Social/Behavioral/Participatory Engagement captures students’ actions in social,
extracurricular, and non-academic school activities, including interactions with other
students—the ways in which students interact within the school community. Survey
developers refer to this dimension as ―engagement in the life of the school.‖
3. Emotional Engagement emphasizes students’ feelings of connection (or disconnection) to
their school—how students feel about where they are in school, the ways and workings of
the school, and the people within their school. This dimension is described by survey
developers as ―engagement of the heart.‖ In addition to examination of student responses
on the three dimensions described here, responses to survey items tapping school climate
were analyzed for the two groups of students.
The survey was administered during one class period in a two-week window in April 2010.
Prior to administering the survey, teachers sent home a permission form to parents describing the
study and the survey. Response rates were 88% for the MYP schools and 82% for the
comparison schools. Further descriptions, including sample items, of the three dimension scores
are shown in Appendix A.
1 MAP-R is a computer-adaptive test that administers test items according to a student's ability.
International Baccalaureate Middle Years Programme 5
In addition to the survey assessment of engagement, student attendance and suspension data were
used to further address student engagement.
Student and parent perceptions of school environment. A measure of school climate was
obtained from responses to the district Survey of School Environment. The Survey of School
Environment is administered systemwide to students and parents in each school every spring.
Students complete the surveys online in a classroom. Parents are invited to respond to an online
survey; if a translated version of the parent survey is requested, a paper version is provided by
mail. Both student and parent surveys are anonymous, but students identify their grade. In the
middle schools, students in Grades 6 and 8 are surveyed and samples of parents of students in all
grades are surveyed. In 2010, the average response rate for students in the five MYP schools
was 86% and for students in the five comparison schools was 88%. The average response rate
for parents, however was far lower, and comparable to the overall 2010 district middle school
parent response rate on the Survey of School Environment of 21%. The response rate of parents
in the five MYP schools was 21% and of parents in the five comparison schools was 18%.
Principal interview. To gain a more nuanced understanding of MYP and other programs, and
how they may relate to school climate and student engagement, interviews were conducted with
the principal of each of the study schools—five principals in MYP schools and five principals in
non-MYP schools. Principals in MYP schools were asked to discuss the positive impacts of
MYP, the challenges of MYP implementation, and how MYP influences school climate and
school engagement. Principals in comparison schools were asked to discuss the positive impacts
of major programs or areas of focus in their schools, challenges related to major programs, and
influences of programs on school climate and school engagement. A research staff member
conducted the semi-structured interviews during April and May, 2010. A copy of each of the
interview instruments can be found in Appendix B.
Procedures for analysis. Data analytic procedures varied according to the research question
being asked as well as the format of the data (e.g., binary or continuous outcome variable).
Outcome measures were examined separately for each grade. Both statistical significance tests
and measurement of effect size were used in the study. In all analyses of student performance
and student engagement, differences in student characteristics were controlled for, including
race/ethnicity, receipt of FARMS services, receipt of special education services, enrollment in
ESOL classes, gender, and, when possible, previous test performance. The following analytic
procedures were used in the study:
Logistic regression was used to examine whether students in the MYP schools had higher
rates of proficiency on math, reading, and science assessments than students in the
comparison schools, as well as for comparison of suspensions.
Repeated Measures Analysis of Variance was used to compare the fall and spring reading
scores of students in the two groups of schools on the MAP-R assessment.
Analysis of covariance (ANCOVA) was used to examine differences in ratings of school
engagement in the MYP schools and the comparison schools, as well as attendance rates
for students in the two groups of schools.
Partial correlations were used to examine the relationships between measures of
performance and school engagement in the MYP schools and in the comparison schools.

International Baccalaureate Middle Years Programme 6
In analytic procedures, sample size influences statistical significance, such that with a large
sample, even small differences may be significant. Therefore, effect sizes were used to judge
whether the observed differences and relationships were large enough to be of practical
significance to educators (American Psychological Association, 2010). Appendix C describes
the computation of effect sizes associated with the analytic procedures used in this evaluation.
Findings
Characteristics of the Sample Schools
Characteristics of students as well as school-level characteristics were examined for the two
groups of schools. Table 1 shows the demographic characteristics of students in the MYP and
non-MYP schools.
Student characteristics in the two sets of schools were similar overall. The percentage of African
American students in the MYP schools was somewhat higher than in the comparison schools
(26% vs. 21%), and the percentage of Asian students was somewhat lower in the MYP schools
than in the comparison schools (13% vs. 20%), but other differences in demographic
characteristics were less than five percentage points.
Table 2 describes school-level characteristics of the five MYP schools and the five comparison
schools, including staff experience, number of years in MYP, and other programs. At the school
Table 1
The International Baccalaureate Middle Years Programme:
Characteristics of Participants in MYP Schools and Comparison Schools, 2009–2010
Demographic Characteristics
% Students in
MYP Schools
(5 middle schools)
(N = 4,201)
% Students in
Comparison Schools
(5 middle schools)
(N = 3,847)
Gender Male 51.1 52.4
Female 48.9 47.6
Grade 6 29.8 31.8
7 36.2 33.0
8 34.0 35.2
Ethnicity African American 25.7 20.6
American Indian 0.3 0.2
Asian American 12.5 20.1
Hispanic 29.5 26.0
White 32.0 33.0
Economically
Disadvantaged FARMS (current) 37.2 34.9
ESOL ESOL enrollment, any level 6.8 5.9
Special Education Special Education, any level 11.9 11.1
International Baccalaureate Middle Years Programme 7
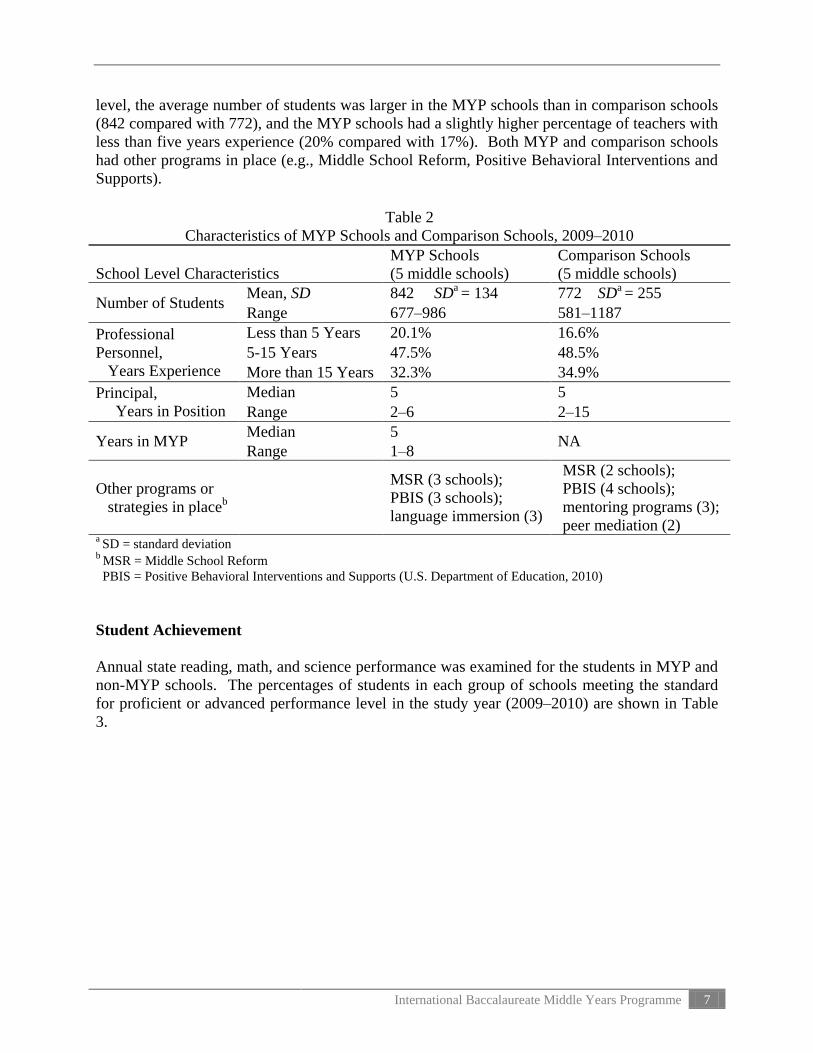
level, the average number of students was larger in the MYP schools than in comparison schools
(842 compared with 772), and the MYP schools had a slightly higher percentage of teachers with
less than five years experience (20% compared with 17%). Both MYP and comparison schools
had other programs in place (e.g., Middle School Reform, Positive Behavioral Interventions and
Supports).
Student Achievement
Annual state reading, math, and science performance was examined for the students in MYP and
non-MYP schools. The percentages of students in each group of schools meeting the standard
for proficient or advanced performance level in the study year (2009–2010) are shown in Table
3.
Table 2
Characteristics of MYP Schools and Comparison Schools, 2009–2010
School Level Characteristics
MYP Schools
(5 middle schools)
Comparison Schools
(5 middle schools)
Number of Students Mean, SD 842 SD
a = 134 772 SD
a = 255
Range 677–986 581–1187
Professional
Personnel,
Years Experience
Less than 5 Years 20.1% 16.6%
5-15 Years 47.5% 48.5%
More than 15 Years 32.3% 34.9%
Principal,
Years in Position
Median 5 5
Range 2–6 2–15
Years in MYP Median 5
NA Range 1–8
Other programs or
strategies in placeb
MSR (3 schools);
PBIS (3 schools);
language immersion (3)
MSR (2 schools);
PBIS (4 schools);
mentoring programs (3);
peer mediation (2) a SD = standard deviation
b MSR = Middle School Reform
PBIS = Positive Behavioral Interventions and Supports (U.S. Department of Education, 2010)
International Baccalaureate Middle Years Programme 8
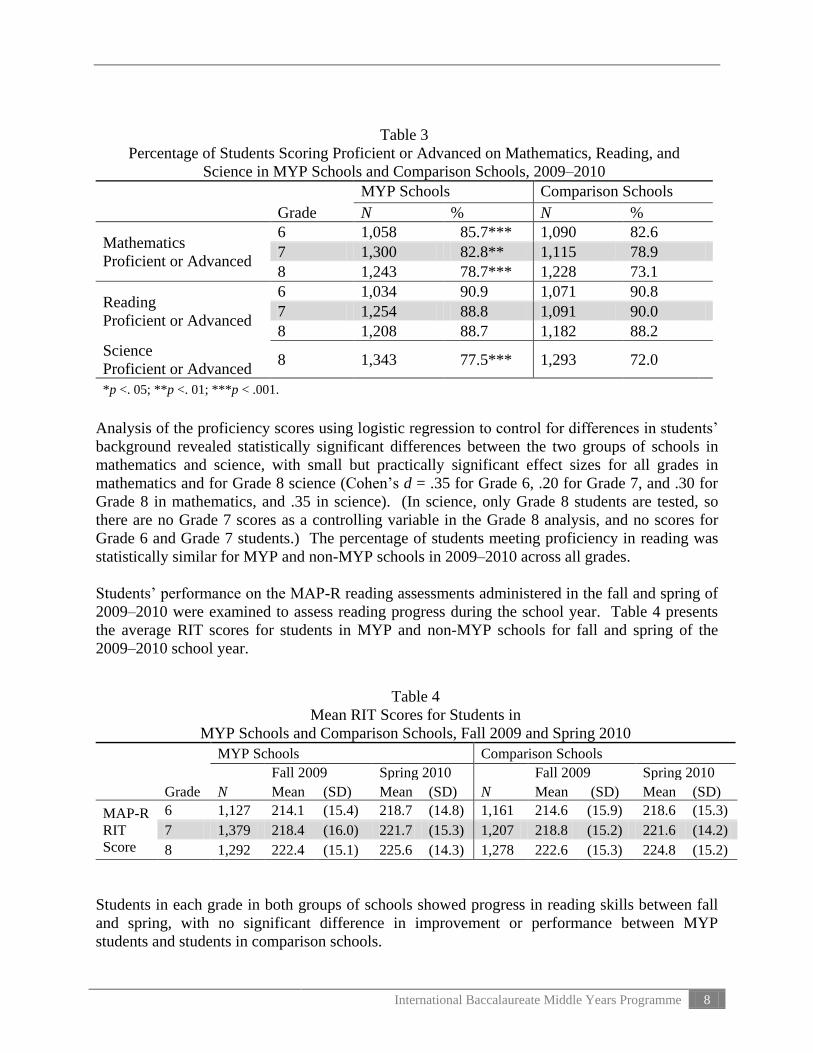
Analysis of the proficiency scores using logistic regression to control for differences in students’
background revealed statistically significant differences between the two groups of schools in
mathematics and science, with small but practically significant effect sizes for all grades in
mathematics and for Grade 8 science (Cohen’s d = .35 for Grade 6, .20 for Grade 7, and .30 for
Grade 8 in mathematics, and .35 in science). (In science, only Grade 8 students are tested, so
there are no Grade 7 scores as a controlling variable in the Grade 8 analysis, and no scores for
Grade 6 and Grade 7 students.) The percentage of students meeting proficiency in reading was
statistically similar for MYP and non-MYP schools in 2009–2010 across all grades.
Students’ performance on the MAP-R reading assessments administered in the fall and spring of
2009–2010 were examined to assess reading progress during the school year. Table 4 presents
the average RIT scores for students in MYP and non-MYP schools for fall and spring of the
2009–2010 school year.
Students in each grade in both groups of schools showed progress in reading skills between fall
and spring, with no significant difference in improvement or performance between MYP
students and students in comparison schools.
Table 3
Percentage of Students Scoring Proficient or Advanced on Mathematics, Reading, and
Science in MYP Schools and Comparison Schools, 2009–2010
MYP Schools Comparison Schools
Grade N % N %
Mathematics
Proficient or Advanced
6 1,058 85.7*** 1,090 82.6
7 1,300 82.8** 1,115 78.9
8 1,243 78.7*** 1,228 73.1
Reading
Proficient or Advanced
6 1,034 90.9 1,071 90.8
7 1,254 88.8 1,091 90.0
8 1,208 88.7 1,182 88.2
Science
Proficient or Advanced 8 1,343 77.5*** 1,293 72.0
*p <. 05; **p <. 01; ***p < .001.
Table 4
Mean RIT Scores for Students in
MYP Schools and Comparison Schools, Fall 2009 and Spring 2010
MYP Schools Comparison Schools
Fall 2009 Spring 2010 Fall 2009 Spring 2010
Grade N Mean (SD) Mean (SD) N Mean (SD) Mean (SD)
MAP-R
RIT
Score
6 1,127 214.1 (15.4) 218.7 (14.8) 1,161 214.6 (15.9) 218.6 (15.3)
7 1,379 218.4 (16.0) 221.7 (15.3) 1,207 218.8 (15.2) 221.6 (14.2)
8 1,292 222.4 (15.1) 225.6 (14.3) 1,278 222.6 (15.3) 224.8 (15.2)
International Baccalaureate Middle Years Programme 9
Student Engagement
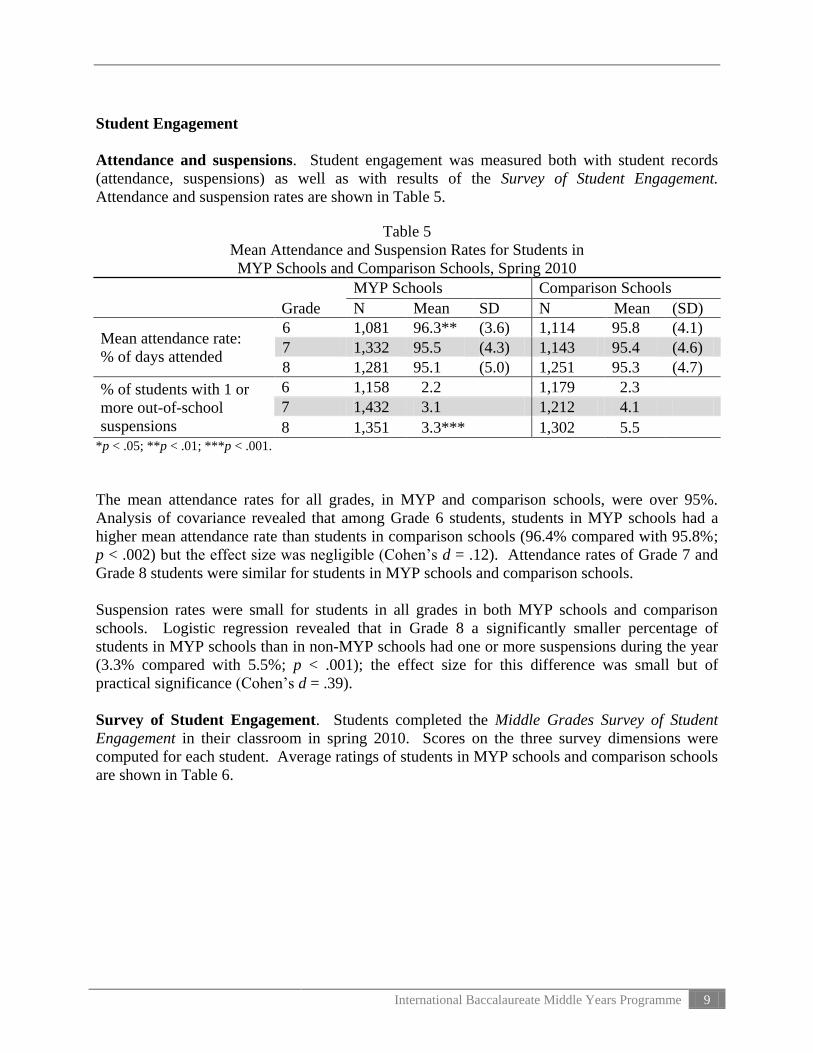
Attendance and suspensions. Student engagement was measured both with student records
(attendance, suspensions) as well as with results of the Survey of Student Engagement.
Attendance and suspension rates are shown in Table 5.
*p < .05; **p < .01; ***p < .001.
The mean attendance rates for all grades, in MYP and comparison schools, were over 95%.
Analysis of covariance revealed that among Grade 6 students, students in MYP schools had a
higher mean attendance rate than students in comparison schools (96.4% compared with 95.8%;
p < .002) but the effect size was negligible (Cohen’s d = .12). Attendance rates of Grade 7 and
Grade 8 students were similar for students in MYP schools and comparison schools.
Suspension rates were small for students in all grades in both MYP schools and comparison
schools. Logistic regression revealed that in Grade 8 a significantly smaller percentage of
students in MYP schools than in non-MYP schools had one or more suspensions during the year
(3.3% compared with 5.5%; p < .001); the effect size for this difference was small but of
practical significance (Cohen’s d = .39).
Survey of Student Engagement. Students completed the Middle Grades Survey of Student
Engagement in their classroom in spring 2010. Scores on the three survey dimensions were
computed for each student. Average ratings of students in MYP schools and comparison schools
are shown in Table 6.
Table 5
Mean Attendance and Suspension Rates for Students in
MYP Schools and Comparison Schools, Spring 2010
MYP Schools Comparison Schools
Grade N Mean SD N Mean (SD)
Mean attendance rate:
% of days attended
6 1,081 96.3** (3.6) 1,114 95.8 (4.1)
7 1,332 95.5 (4.3) 1,143 95.4 (4.6)
8 1,281 95.1 (5.0) 1,251 95.3 (4.7)
% of students with 1 or
more out-of-school
suspensions
6 1,158 2.2 1,179 2.3
7 1,432 3.1 1,212 4.1
8 1,351 3.3*** 1,302 5.5
International Baccalaureate Middle Years Programme 10
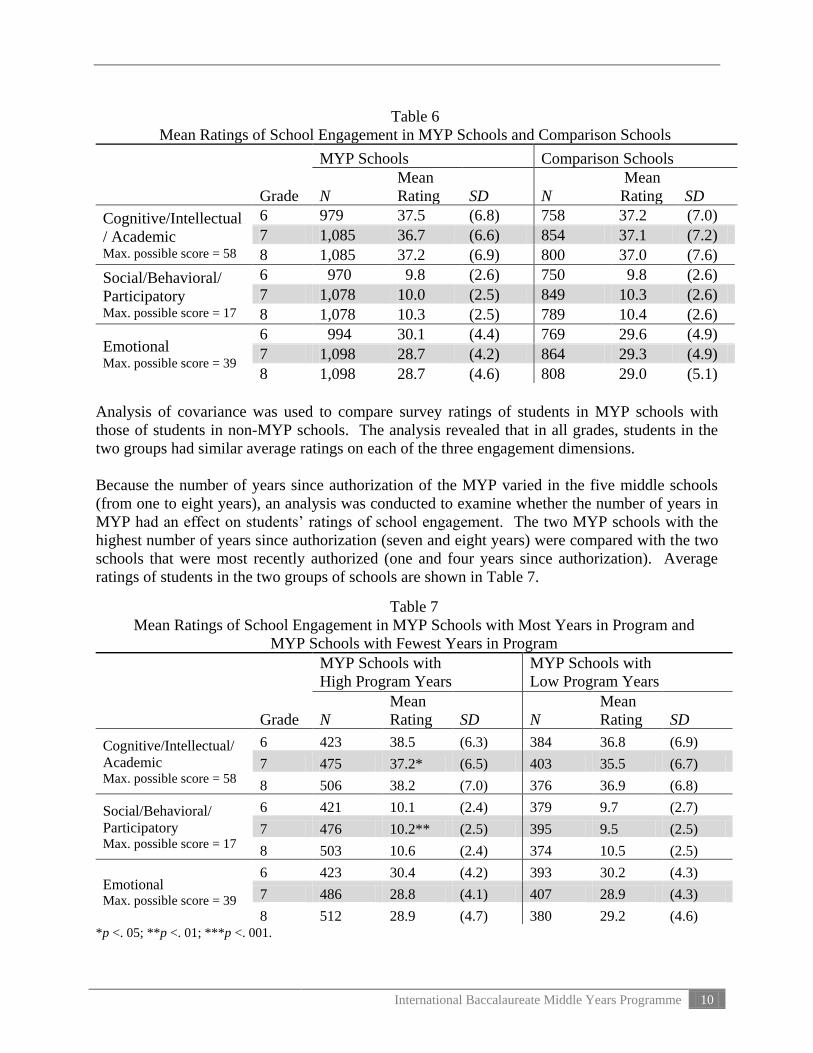
Analysis of covariance was used to compare survey ratings of students in MYP schools with
those of students in non-MYP schools. The analysis revealed that in all grades, students in the
two groups had similar average ratings on each of the three engagement dimensions.
Because the number of years since authorization of the MYP varied in the five middle schools
(from one to eight years), an analysis was conducted to examine whether the number of years in
MYP had an effect on students’ ratings of school engagement. The two MYP schools with the
highest number of years since authorization (seven and eight years) were compared with the two
schools that were most recently authorized (one and four years since authorization). Average
ratings of students in the two groups of schools are shown in Table 7.
*p <. 05; **p <. 01; ***p <. 001.
Table 6
Mean Ratings of School Engagement in MYP Schools and Comparison Schools
MYP Schools Comparison Schools
Grade N
Mean
Rating SD N
Mean
Rating SD
Cognitive/Intellectual
/ Academic Max. possible score = 58
6 979 37.5 (6.8) 758 37.2 (7.0)
7 1,085 36.7 (6.6) 854 37.1 (7.2)
8 1,085 37.2 (6.9) 800 37.0 (7.6)
Social/Behavioral/
Participatory Max. possible score = 17
6 970 9.8 (2.6) 750 9.8 (2.6)
7 1,078 10.0 (2.5) 849 10.3 (2.6)
8 1,078 10.3 (2.5) 789 10.4 (2.6)
Emotional Max. possible score = 39
6 994 30.1 (4.4) 769 29.6 (4.9)
7 1,098 28.7 (4.2) 864 29.3 (4.9)
8 1,098 28.7 (4.6) 808 29.0 (5.1)
Table 7
Mean Ratings of School Engagement in MYP Schools with Most Years in Program and
MYP Schools with Fewest Years in Program
MYP Schools with
High Program Years
MYP Schools with
Low Program Years
Grade N
Mean
Rating SD N
Mean
Rating SD
Cognitive/Intellectual/
Academic Max. possible score = 58
6 423 38.5 (6.3) 384 36.8 (6.9)
7 475 37.2* (6.5) 403 35.5 (6.7)
8 506 38.2 (7.0) 376 36.9 (6.8)
Social/Behavioral/
Participatory Max. possible score = 17
6 421 10.1 (2.4) 379 9.7 (2.7)
7 476 10.2** (2.5) 395 9.5 (2.5)
8 503 10.6 (2.4) 374 10.5 (2.5)
Emotional Max. possible score = 39
6 423 30.4 (4.2) 393 30.2 (4.3)
7 486 28.8 (4.1) 407 28.9 (4.3)
8 512 28.9 (4.7) 380 29.2 (4.6)

International Baccalaureate Middle Years Programme 11
The number of years with the program had a small but significant effect on Grade 7 students’
engagement ratings. Statistically significant differences between students in MYP and
comparison schools were found on ratings of the Cognitive/Intellectual/Academic and
Social/Behavioral/Participatory dimensions. The effect size associated with the difference in
ratings on the Cognitive/Intellectual/Academic dimension was negligible (Cohen’s d = .15); the
effect size for the difference in Social/Behavioral/Participatory ratings was small but of practical
significance (Cohen’s d = .20).
In addition to students’ ratings on the three engagement dimensions of the Middle Grades Survey
of Student Engagement, responses to individual survey items related to school climate were
examined. Table 8 shows ratings for the two groups of students on items identified as reflecting
school climate.
aPercent Agree represents students marking ―Strongly Agree‖ or ―Agree‖ on a four-point scale.
Across all grade levels, responses to many of the survey items tapping school climate were
similar for students in the two groups of schools. Logistic regression analytic procedures were
used to compare the responses of the two groups while controlling for differences in the
students’ background. One item—―Overall, I feel good about being in this school‖—revealed
statistically significant differences in favor of MYP for students in Grade 6 and Grade 8, with
Table 8
Percent of Students Agreeing with Survey Items
in MYP Schools and Comparison Schools
MYP Schools Comparison Schools
Survey Item Grade
N
Percent
Agreea
N
Percent
Agreea
Overall, I feel good about
being in this school.
6 1,035 90.0*** 828 86.4
7 1,140 85.4 892 83.6
8 1,115 84.2** 831 81.2
This school makes me feel
confident about who I am.
6 1,029 72.8 827 71.9
7 1,133 69.7 889 72.4
8 1,112 69.4 831 69.1
I am an important part of
my school community.
6 1,018 62.4 824 60.4
7 1,130 57.9 881 59.4
8 1,106 57.6 824 60.6
There is at least one adult
in this school who cares
about me.
6 1,026 86.4 825 87.0
7 1,132 84.2 887 85.2
8 1,111 87.3 829 87.5
I can be who I am at this
school.
6 1,022 75.9 816 73.4
7 1,125 73.8 884 75.2
8 1,109 75.7 826 73.8
All students are treated
equally at this school.
6 1,013 54.3** 816 47.7
7 1,122 47.4 873 51.1
8 1,098 46.5 818 50.6

International Baccalaureate Middle Years Programme 12
small but practically significant effect sizes (Cohen’s d = .27 for Grade 6 and .20 for Grade 8).
On an additional survey item—―All students are treated equally at this school‖—Grade 6 MYP
students showed higher levels of agreement than Grade 6 non-MYP students, but the effect size
was negligible (Cohen’s d = .18).
Student and Parent Ratings of School Environment
Responses to the district Survey of School Environment were used to examine perceptions of
students and their parents toward their schools. Survey items relating to a welcoming
atmosphere and school efforts in building positive relationships, as well as an overall ―grade‖
rating of the school, were chosen to provide data most relevant to school climate. Table 9
presents a summary of responses from surveyed students (Grades 6 and 8) in MYP and
comparison schools.
aPercent Agree represents students marking ―Strongly Agree‖ or ―Agree‖ on a four-point scale.
Responses to the Survey of School Environment are reported descriptively, since the surveys are
anonymous and no comparisons or controls of respondent demographic characteristics can be
made (although comparison schools were selected to be demographically similar to MYP
schools). On specific survey items about feeling welcomed and about school efforts at
promoting positive relationships, students in MYP schools and students in comparison schools
responded with similar levels of agreement. However, on a broader question asking students to
assign a ―grade‖ to their school—from ―A‖ to ―D‖—a higher percentage of students from MYP
schools than from comparison schools gave their school an ―A‖ or a ―B‖ (71% vs. 63% among
Grade 6 students; 56% vs. 48% among Grade 8 students), an eight percentage point difference in
both cases.
Table 9
Percent of Students Agreeing with Items on Survey of School Environment
in MYP Schools and Comparison Schools
MYP Schools Comparison Schools
Survey Item Grade N
Percent
Agreea N
Percent
Agreea
I feel welcomed at this
school.
6 850 81.2 1,022 78.3
8 1,135 77.9 1,191 76.1
School staff encourages
students to respect others.
6 842 91.8 1,012 91.9
8 1,135 88.2 1,184 85.8
This school encourages
students to help one
another.
6 833 81.6 1,007 78.9
8 1,132 73.2 1,178 71.1
Percent
Rating A or B
Percent
Rating A or B
What grade would you give
your school?
6 849 71.2 1,018 63.2
8 1,138 56.4 1,194 48.1

International Baccalaureate Middle Years Programme 13
Table 10 shows the average ratings from parents of students in the MYP schools and comparison
schools who responded to Survey of School Environment. A sample of parents of students in all
grades was sampled; respondents were not identified by grade.
aPercent Agree represents parents marking ―Strongly Agree‖ or ―Agree‖ on a four-point scale.
Responses from parents of students in MYP schools and parents of students in the comparison
schools were similar on the survey items examined. Over ninety percent of parents in each
group of schools agreed that they felt welcomed at their school and that their school does a good
job welcoming families of diverse cultures, and over three quarters of parents in MYP schools
and in comparison schools gave their school an ―A‖ or a ―B‖ on a scale from ―A‖ to ―F.‖
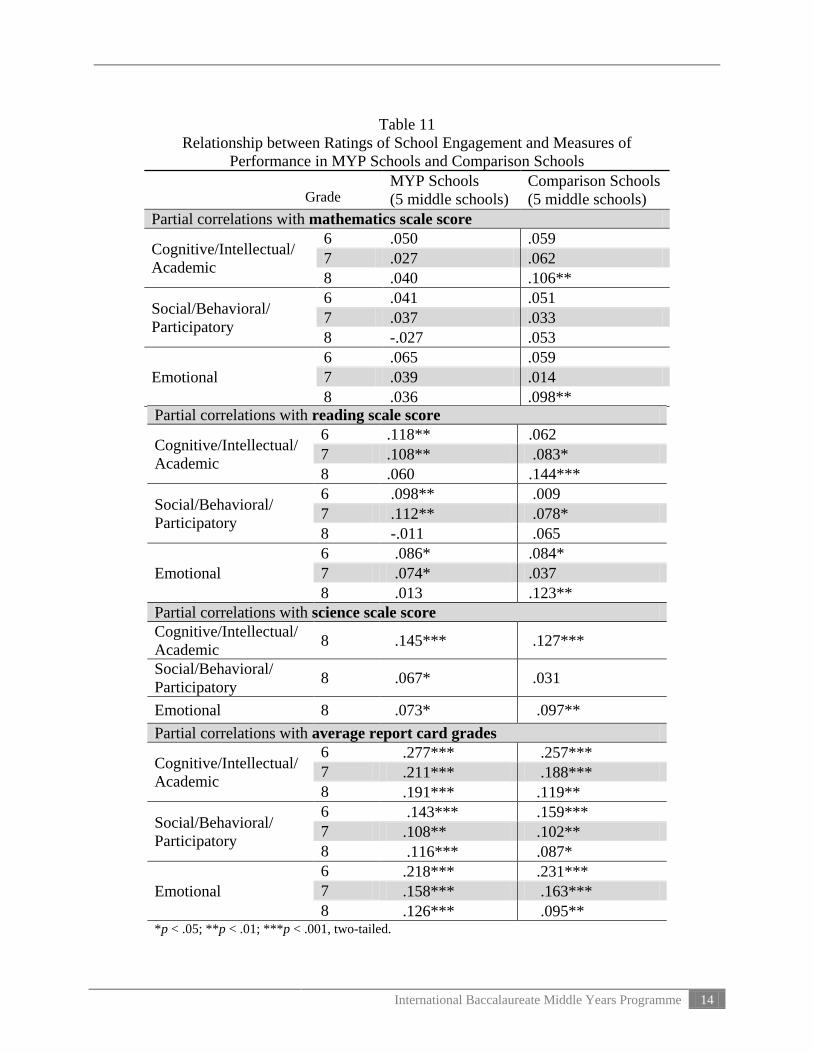
Relationship of Student Engagement to Academic Performance
The relationship between students’ ratings on the Survey of Student Engagement and their
academic performance was examined separately for students in MYP schools and students in
comparison schools. Partial correlations from multiple regression procedures were used to
examine relationships between the engagement ratings and four measures of student
performance—annual state assessment scores in mathematics, reading, and science, and average
report card grades. Separate analyses were conducted for each outcome measure and each grade
level.
In each analysis, the following demographic variables were controlled: receiving FARMS
services, enrollment in ESOL classes, receiving special education services, race, and gender. In
all analyses except those examining the relationship between engagement ratings and science
scores and engagement ratings and Grade 6 report card averages, the previous year’s score
(mathematics score, reading score, or report card grade average) was included as a control
variable. Thus, the correlations represent the relationships of the engagement rating with the
performance measure, after controlling for last year’s performance and student background
characteristics. Table 11 summarizes the findings of these analyses.
Table 10
Percent of Parents Agreeing with Items on Survey of School Environment
in MYP Schools and Comparison Schools
MYP Schools Comparison Schools
Survey Item N
Percent
Agreea N
Percent
Agreea
I feel welcomed at this school. 355 90.4 313 92.6
This school does a good job of
welcoming families of diverse cultures 301 96.4 270 96.3
Percent
Rating A or B
Percent
Rating A or B
What grade would you give your school? 354 83.3 309 79.3
International Baccalaureate Middle Years Programme 14
Table 11
Relationship between Ratings of School Engagement and Measures of
Performance in MYP Schools and Comparison Schools
Grade MYP Schools
(5 middle schools)
Comparison Schools
(5 middle schools)
Partial correlations with mathematics scale score
Cognitive/Intellectual/
Academic
6 .050 .059
7 .027 .062
8 .040 .106**
Social/Behavioral/
Participatory
6 .041 .051
7 .037 .033
8 -.027 .053
Emotional
6 .065 .059
7 .039 .014
8 .036 .098** Partial correlations with reading scale score
Cognitive/Intellectual/
Academic
6 .118** .062
7 .108** .083*
8 .060 .144***
Social/Behavioral/
Participatory
6 .098** .009
7 .112** .078*
8 -.011 .065
Emotional
6 .086* .084*
7 .074* .037
8 .013 .123**
Partial correlations with science scale score
Cognitive/Intellectual/
Academic 8 .145*** .127***
Social/Behavioral/
Participatory 8 .067* .031
Emotional 8 .073* .097**
Partial correlations with average report card grades
Cognitive/Intellectual/
Academic
6 .277*** .257***
7 .211*** .188***
8 .191*** .119**
Social/Behavioral/
Participatory
6 .143*** .159***
7 .108** .102**
8 .116*** .087*
Emotional
6 .218*** .231***
7 .158*** .163***
8 .126*** .095** *p < .05; **p < .01; ***p < .001, two-tailed.
International Baccalaureate Middle Years Programme 15
Partial correlations between engagement ratings and performance (controlling for demographic
variables and, when possible, previous year’s performance) revealed significantly positive
relationships in MYP schools and in comparison schools across grade levels. However, caution
should be exercised when interpreting the results, since the significance levels (p values) of the
correlations are greatly affected by the large study sample size. In these analyses, engagement
ratings showed the strongest relationships with report card grades for students in all grades in
both MYP schools and non-MYP schools. Using Cohen’s (1988) guidelines (see Appendix D),
most of the associations between engagement ratings and report card grades would be interpreted
as small but practically significant effect sizes. In addition, the associations between
Cognitive/Intellectual/Academic ratings and science scores in both MYP and non-MYP schools
yielded small but significant effect sizes.
Overall, the data show some association between the ratings of student engagement and
measures of student performance. However, the analyses did not show a difference between the
MYP schools and the comparison schools in their engagement/performance relationships. In
both groups of schools, engagement ratings showed positive associations with report card grades.
Principal Interviews: Summary of Findings
To gain a more nuanced understanding of MYP and other programs, and how they may relate to
school climate and student engagement, interviews were conducted with the principal of each of
the study schools—five principals in MYP schools and five principals in non-MYP schools.
Principals in MYP schools were asked to discuss the positive impacts of MYP, the challenges of
MYP implementation, and how MYP influences school climate and school engagement.
Principals in comparison schools were asked to discuss the positive impacts of major programs
or areas of focus in their schools, challenges related to major programs, and influences of
programs on school climate and school engagement.
As noted in Table 2, the major programs in place in the five MYP schools (in addition to MYP)
were: Middle School Reform (MSR) (three schools), Positive Behavioral Interventions and
Supports (PBIS) (three schools), and language immersion (three schools). The major programs
in place in the five comparison schools were: MSR (two schools), PBIS (four schools),
mentoring programs (three schools), and peer mediation (two schools).
Principal comments from MYP Schools. The positive impact identified most frequently by
principals in the MYP schools was the opportunity for interdisciplinary learning. All five MYP
principals reported that teachers collaborate in interdisciplinary units and students are making
connections between disciplines and with the world outside of school. One MYP principal sums
up MYP in this way: ―It gets kids to be good thinkers and good people.‖
A second area that four of the five MYP principals identified as a benefit of the program was
teacher training and the support of the MYP coordinator. Describing the program impact on
teachers, one principal explained, ―The [MYP] training is extremely beneficial and the dedicated
MYP coordinator, who provides in-house professional development, has been beneficial to
teachers.‖
International Baccalaureate Middle Years Programme 16
In addition to specific changes in instructional approach and to the accompanying staff training
and support, three principals noted that the community and the students like the program. The
students recognize characteristics of the MYP philosophy in various activities at school, and they
are proud to attend an MYP school. One principal describes the effect of MYP on students in
this way: ―...they know when they walk in the door that they’re going to be an IB MYP student.‖
The challenge identified most frequently by principals (four of five principals reported) was the
additional effort required for teachers to balance and coordinate the objectives of MYP with the
requirements and timelines of the district curriculum. Training and support also was mentioned
as a concern by three of five MYP principals because there are fewer resources to train staff who
are new to the program, so turnover becomes an issue.
Principals also were asked to discuss the influence of MYP on school climate and student
engagement in learning. Three principals referred to the interdisciplinary nature of MYP and
the increased collaboration among teachers as having an effect on climate and engagement. Two
of the five MYP principals reported that the emphasis on rigorous instruction has influenced
school climate, one noting that ―MYP has given us an umbrella of rigorous instruction for all of
our students.‖
Principal Comments from Non-MYP Comparison Schools. Principals in the comparison
schools were asked to discuss the major programs or curricular interventions in place at their
schools and the influence the programs have on school climate and student engagement. Positive
Behavioral Interventions and Supports was identified as having a positive effect on school
climate by all four principals in schools with PBIS; the principals noted that a reduction of
behavior issues using PBIS has improved school climate. The two principals in Middle School
Reform schools reported that the professional development in MSR, as well as a wider course
selection, has helped to increase student engagement. Three of the five principals in comparison
schools reported increased collaboration as a positive impact of the programs at their schools.
Similarities in Perceptions of MYP and non-MYP Principals. Principals from both groups of
schools reported ways that the programs and strategies in place at their schools influence school
climate and student engagement. Collaboration among teachers was identified as a positive
influence on school climate and student engagement in both MYP and non-MYP schools.
Principals from both groups of schools reported that the expanded curriculum in Middle School
Reform, with more interesting electives offered to students, is more engaging for students. One
principal from an MYP school explained, ―The MSR new curriculum is very engaging for the
adolescent learner and [it is] complimentary to MYP. There is more student-to-student
discourse, and hands-on, authentic activities that appeal to students.‖
Observations Specific to MYP Schools. One strategy influencing school climate and student
engagement that was reported by MYP principals in particular was interdisciplinary learning.
The opportunity for students to make connections between classroom disciplines and with the
world outside of school was described by all five MYP principals as significantly contributing to
student engagement in learning. One principal described it in this way: ―It's making connections
between disciplines, between the curriculum and real life, making things relevant, student
centered, and having more of a global look ... not just learning things in a vacuum.‖
International Baccalaureate Middle Years Programme 17
Discussion
This study examined student engagement and student performance, as well as student and parent
perceptions of school climate in five middle schools with the MYP and in five demographically
similar middle schools without the MYP. The relationship between student engagement and
student performance in MYP schools and non-MYP comparison schools was an additional focus
of the study.
Some evidence of student achievement benefits from MYP was suggested by the data;
specifically, performance in mathematics and science were slightly but significantly higher
among MYP students compared with students in similar non-MYP schools. Previous research
(Kiplinger, 2005a; 2005b) also found a slightly greater effect in mathematics than in reading, and
the same study suggested that the benefits of an IB curriculum may compound over years in the
program. Given the previous findings (2005a), and the effects for mathematics and science in
the present study, it may be informative to continue examining the academic performance of
students who are enrolled for multiple years in MYP and IB programs.
Student engagement ratings were similar for students in MYP and comparison schools. In
addition, relationships (partial correlations) between the student engagement ratings and
measures of performance were similar for the MYP and comparison school groups. Given the
MYP emphasis on interdisciplinary learning and communication, it might be expected that
students in MYP schools would show greater engagement than students in non-MYP schools,
and that their engagement would connect more directly with their academic performance (i.e.,
engagement/performance relationships would be stronger in MYP schools). What might account
for the lack of such findings? It is possible that the comparison schools have programs in place
that emphasize some of the same qualities and values that underlie the MYP, so that levels of
engagement may be high for both groups of students. Indeed, interviews with principals in both
MYP and non-MYP schools reported the positive influence of other programs in place,
particularly Middle School Reform.
The Survey of Student Engagement was developed for high school students and the present study
is among the first to use the middle school version, so scores from a national middle school
sample are not yet available. Comparing the engagement ratings from the present study with a
larger national group, when available, would provide a broader context in which to view the
level of engagement of the district’s MYP students as well as students in the comparison schools.
Finally, higher percentages of MYP students gave their school an ―A‖ or ―B‖ on a survey of
school environment and agreed that ―Overall, I feel good about being in this school‖ on the
engagement survey, compared with non-MYP students. These ratings suggest that students in
MYP schools have positive feelings about their school that are not being picked up by other
specific survey questions about student engagement and school climate. These findings, in
conjunction with reports from MYP principals, suggest that students in MYP schools may
experience a sense of pride based on their school’s involvement in the program. Three of the
five MYP principals named the positive feelings and pride of the community and the students
toward the program as one of the positive impacts of MYP. Assigning a higher ―grade‖ and
feeling good about being in their school may be a reflection of the pride felt by students in MYP
schools.
International Baccalaureate Middle Years Programme 18
Recommendations and Next Steps
The following recommendations are suggested by the findings:
A small but significant effect for MYP was shown in mathematics and science performance.
To substantiate and further understand this effect, it is recommended that performance of
MYP students continue to be examined through their years of participation in the program.
It may be informative to survey students with questions directly addressing their experience
in MYP. In areas of MYP emphasis, such as acquiring a global perspective, or learning
through an interdisciplinary approach to instruction, teachers and administrators may learn
how effectively their program is advancing these goals by surveying students with questions
relevant to MYP objectives.
Solicit feedback and input from teachers in MYP schools. Four of five MYP principals
expressed concern that teachers have adequate professional development and support from
the MYP coordinator to align the MYP aims and objectives with the district’s curriculum and
the core curriculum. Receiving and using input from teachers may help with schoolwide
incorporation of MYP structures and expectations.
Assess teachers’ perceptions of the MYP training. Since teacher training was reported by
MYP principals as an important benefit of the program, soliciting information from teachers
about how the MYP training has impacted their work in the classroom may inform
instructional practice.
International Baccalaureate Middle Years Programme 19
References
American Psychological Association. (2010). Publication manual of the American
Psychological Association (6th ed.). Washington, DC: Author.
Cohen, J. (1988). Statistical power for the behavioral sciences (2nd ed.). Hillsdale, NJ:
Erlbaum.
Connell, J. P., Spencer, M. B., & Aber, J. L. (1994). Educational risk and resilience in African-
American youth: Context, self, action, and outcomes in school. Child Development, 65,
493-506.
Felner, R. D., Seitsinger, A. M., Brand, S., Burns, A., & Bolton, N. (2007). Creating small
learning communities: Lessons from the project on high-performing learning
communities about "What Works" in creating productive, developmentally enhancing,
learning contexts. Educational Psychologist, 42(4), 209–221.
Fredericks, J. A., Blumenfeld, P. C., & Paris, A. H. (2004). School engagement: Potential of
the concept, state of the evidence. Review of Educational Research, 74(1), 59–109.
International Baccalaureate. (2011a). About the International Baccalaureate.
http://www.ibo.org/general/who.cfm. Accessed 1 February 2011.
International Baccalaureate. (2011b). The Middle Years Programme. http://ibo.org/myp/.
Accessed 1 February 2011.
International Baccalaureate. (2008). A review of research relating to the IB Diploma
Programme. http://ibo.org/research/resources/documents/dpresearchreview.pdf.
Accessed 1 February 2011.
International Baccalaureate and Indiana University. (2010). Research summary. High school
engagement among IB and non-IB students in the United States: A comparison study. IB
Global Policy & Research Team, in collaboration with the Center for Evaluation and
Education Policy, Indiana University.
Kiplinger, V. L. (2005a). Effects of IB Participation on Mathematics Achievement and Growth,
2001–2004 in Academy School District Twenty. Unpublished report.
Kiplinger, V L. (2005b). Effects of IB Participation on Reading Achievement and Growth,
2000–2004. Academy School District Twenty. Unpublished report.
Kline, R. B. (2004). Beyond significance testing. Washington, D.C.: American Psychological
Association.
Powell, K. E. (2002). The International Baccalaureate Middle Years Programme: A model of
program implementation and school reform. Unpublished Doctoral Dissertation.
International Baccalaureate Middle Years Programme 20
Rose, T. (2007). A Qualitative Study of Student Achievement and Growth Associated with the
International Baccalaureate Program in Academy School District 20. Unpublished
report.
Singh, K., Granville, M., & Dika, S. (2002). Mathematics and science achievement: Effects of
motivation, interest, and academic engagement. Journal of Educational Research, 95(6),
323–333.
U.S. Department of Education, Office of Special Education Programs. (2010) Schoolwide
Positive Behavioral Intervention and Supports. Information at: http://www.pbis.org.
Valentine, J. C. & Cooper, H. (2003). Effect size substantive interpretation guidelines: Issues in
the interpretation of effect sizes. Washington, DC: What Works Clearinghouse.
Yazzie-Mintz, E. (2010). Charting the path from engagement to achievement: A report on the
2009 High School Survey of Student Engagement. Bloomington, IN: Center for
Evaluation & Education Policy.

International Baccalaureate Middle Years Programme 21
Appendix A
Dimension Scores from the Survey of Student Engagement
The High School Survey of Student Engagement (HSSSE), developed by the School of Education
at Indiana University, was based on the National Survey of Student Engagement, a survey
assessing the engagement of college students. Since the survey’s inception in 2003, over
500,000 students nationally have participated in the HSSSE.
The Middle School Survey of Student Engagement (MSSSE), used in this study, was developed
by the Center for Evaluation and Education Policy at Indiana University. MSSSE was based on
the high school version (HSSSE), and taps the same three dimensions of student engagement.
The following descriptions of survey dimensions and sample items are adapted from the
Research Summary produced by IB and Indiana University (2010).
The survey taps into three broad dimensions of student engagement: 1) Cognitive/Intellectual/
Academic Engagement; 2) Social/Behavioral/Participatory Engagement; and 3) Emotional
Engagement.
Sample items from the Cognitive/Intellectual/Academic Engagement domain include:
How many hours are spent in a typical week reading and studying for class?
To what extent do teachers try to engage [you] in classroom discussions?
How often have you worked on a paper or project that required you to do research outside
of assigned texts?
How often have you connected ideas or concepts from one class (or subject area) to
another in doing assignments or participating in class discussions?
Items tapping into students’ level of Social/Behavioral/Participatory Engagement include:
How important is participating in school-sponsored activities to you?
[To what extent does your] school emphasize participating in school events and
activities?
[To what degree has] school contributed to growth in gaining awareness of conditions in
the community outside of school?
Items related to Emotional Engagement include:
[To what extent do you] feel supported by the following people at this school: teachers,
administrators, counselors, other students?
[To what degree do] adults in this school want [you] to succeed?
[To what degree has the] school contributed to growth in understanding yourself?
[To what degree has the] school contributed to growth in treating people with respect?

International Baccalaureate Middle Years Programme 22
Appendix B
Interview Protocol for MYP School Administrator (Principal)
I. School Background [NOTE: Publicly available background information on school will be collected
beforehand (racial/ethnic breakdown, school size, student mobility, etc.)]
How long have you (the principal) been at the school in your current position? What was
your familiarity with MYP/IB before coming to this school?
Give us a little bit of background on the school’s admin and faculty – recent turnover,
average experience, etc.
In addition to the IB, what are some of the other major programs and/or curricular
interventions at your school? Tell us a little bit about each major program/intervention.
What are the primary areas of focus in your school improvement plan? (For IB schools: To
what extent is the MYP a focus of the school’s improvement plan?) Can we get a copy of the
plan for our records?
II. Middle Years Programme
When was the MYP authorized at your school? What was the candidacy phase like?
What are some of the positive impacts of MYP implementation at your school?
What are some of the challenges of MYP implementation you have observed at your school?
Based on your experience and observations, do you believe the introduction of MYP at your
school has influenced the climate of the school? In what ways? By school climate, we mean
very broadly, the “quality and character of school life.” This includes the “norms, goals,
values, interpersonal relationships, teaching, learning, leadership practices, and
organizational structures” that contribute to staff and student experiences within a school."
Do you believe the introduction of MYP at your school has influenced student engagement
in learning? In what ways?
Outside of the MYP, what are some other key characteristics or features of your school that
influence school climate? Student engagement?
Is there anything else you would like to share about the MYP in your school?

International Baccalaureate Middle Years Programme 23
Interview Protocol for Non-MYP School Administrator (Principal)
I. School Background [NOTE: Publicly available background information on school will be collected
beforehand (racial/ethnic breakdown, school size, student mobility, etc.)]
How long have you (the principal) been at the school in your current position?
Give us a little bit of background on the school’s admin and faculty – recent turnover,
average experience, etc.
What are some of the major programs and/or curricular interventions at your school? Tell us
a little bit about each major program/intervention.
What are the primary areas of focus in your school improvement plan? Can we get a copy of
the plan for our records?
II. Middle Years Programme
What are some of the positive impacts of these major programs or areas of focus in your
school?
What are some of the challenges of these major programs or areas of focus you have
observed in your school?
Based on your experience and observations, do you there is anything in particular that has
influenced the climate of the school? In what ways? By school climate, we mean very
broadly, the “quality and character of school life.” This includes the “norms, goals, values,
interpersonal relationships, teaching, learning, leadership practices, and organizational
structures” that contribute to staff and student experiences within a school."
Is there anything in particular that has influenced student engagement in learning at your
school? In what ways?
What are some other key characteristics or features of your school that influence school
climate? Student engagement?
Is there anything else about your school’s major focuses, school climate or student
engagement that you would like to share?
International Baccalaureate Middle Years Programme 24
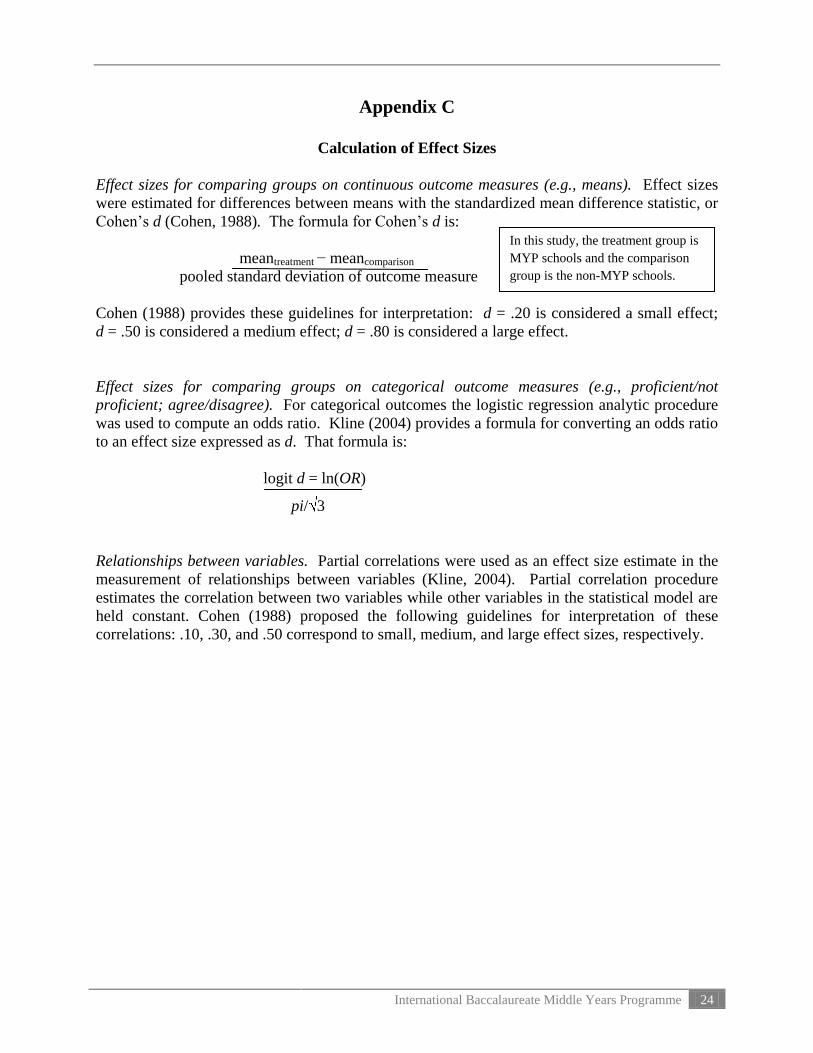
Appendix C
Calculation of Effect Sizes
Effect sizes for comparing groups on continuous outcome measures (e.g., means). Effect sizes
were estimated for differences between means with the standardized mean difference statistic, or
Cohen’s d (Cohen, 1988). The formula for Cohen’s d is:
meantreatment − meancomparison
pooled standard deviation of outcome measure
Cohen (1988) provides these guidelines for interpretation: d = .20 is considered a small effect;
d = .50 is considered a medium effect; d = .80 is considered a large effect.
Effect sizes for comparing groups on categorical outcome measures (e.g., proficient/not
proficient; agree/disagree). For categorical outcomes the logistic regression analytic procedure
was used to compute an odds ratio. Kline (2004) provides a formula for converting an odds ratio
to an effect size expressed as d. That formula is:
logit d = ln(OR)
pi/ 3
Relationships between variables. Partial correlations were used as an effect size estimate in the
measurement of relationships between variables (Kline, 2004). Partial correlation procedure
estimates the correlation between two variables while other variables in the statistical model are
held constant. Cohen (1988) proposed the following guidelines for interpretation of these
correlations: .10, .30, and .50 correspond to small, medium, and large effect sizes, respectively.
In this study, the treatment group is
MYP schools and the comparison
group is the non-MYP schools.