student reading introduction to the grand bay national ... · the grand bay national estuarine...
TRANSCRIPT

Student Reading Introduction to the Grand Bay National Estuarine Research Reserve
About the Estuary
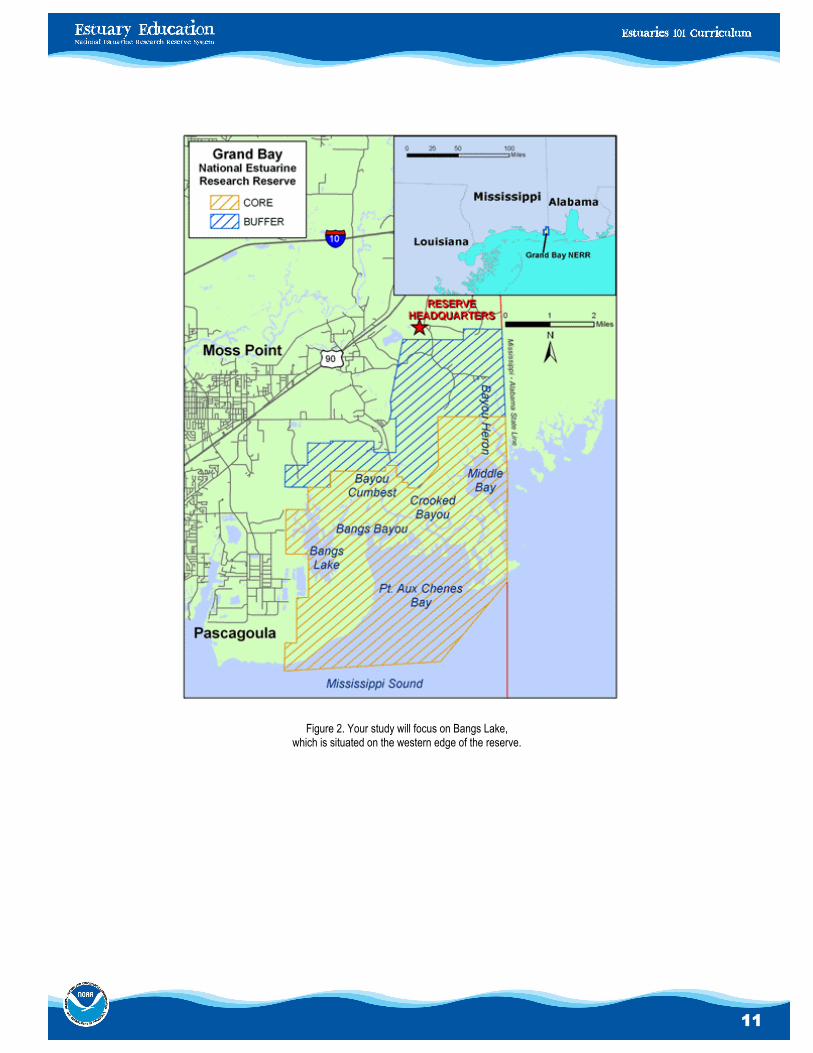
The Grand Bay National Estuarine Research Reserve (GNDNERR) is a protected marine area located in extreme southeastern Mississippi in Jackson County (see Figure 2). The Grand Bay NERR is comprised of ap-proximately 18,000 acres, found chiefly within the Grand Bay National Wildlife Refuge and the Grand Bay Savanna Coastal Preserve. This reserve contains a variety of wetland hab-itats, both tidal and non-tidal, such as pine savannas, salt marshes, saltpans, bays and bayous as well as terrestrial habitats that are unique to the coastal zone like maritime forests.
oysters, abound here. Sea turtles, bottlenose dolphin and, on occasion, manatees can be found in the deeper waters of the reserve. Many species of carnivorous plants and orchids can be found in the higher savanna habitats.
The lands within the Grand Bay NERR are classified as either core areas or buffer areas. The core area (outlined in yellow on Figure 2) consists of approximately 12,800 acres of: estuarine tidal marsh, tid-al creeks or bayous; shallow, open-water habitats; oyster reefs; seagrass beds; maritime forests; salt flats; sandy beaches; and shell middens. These habitats supply nutrients for many marine species. They also serve as buffer zones for hurricane protection and places of shelter for animals. Tidal marsh regions function as filters, removing pollutants such as sewage and surface run-off that otherwise would flow into the Mississippi Sound and degrade valuable marine aquatic resources.
The buffer area (outlined in blue on Figure2) consists of approximately 5,600 acres of tidal marsh, scrub shrub, pine flatwood and wet pine savanna habitats. Buffer areas are defined as “areas adjacent to the core areas that provide additional protection for estuarine-dependent species.” Additionally, a small portion of intertidal marshes located adjacent to the boat ramp at Bayou Heron is also included in the buffer area. This disturbed area currently provides the only publicly-owned, waterway access point within the boundaries of the Grand Bay NERR.
Figure 1. Grand Bay NERR is composed of diverse habitats for estuarine plants and animals.
Healthy estuarine salt marshes and fire-maintained pine savannas are some of the most diverse habitats in North America, and the reserve is fortunate enough to contain considerable amounts of both. These habitats support many important species of fish and wildlife. Commer-cially and recreationally important species of finfish and shellfish, such as brown shrimp, speckled trout and
Adapted from the Grand Bay NERR website.
URL:http://grandbaynerr.org/our-estuary. Accessed: 2017-01-21. (Archived by WebCite® at http://www.webcitation.org/65dG7WG5X)
10
11
Figure 2. Your study will focus on Bangs Lake, which is situated on the western edge of the reserve.
12
Student Reading A Terrible Spill in Grand Bay:
A Case Study of an Environmental Disaster
The Massive Spill
In 2005, a catastrophic pollution event occurred at Bangs Lake along the western border of Grand Bay NERR, MS. The spill occurred when the walls of retaining ponds filled with wastewater collapsed at a fertilizer manufacturing company located 1.1 km from the lake. Approximately 17.5 million gallons of polluted water were released from the ponds and subsequently flowed into the estuary. The released wastewater had the follow-ing characteristics:
The spill was sudden and organisms in the estuary felt the effects immediately.
Sources of the Pollution
The contaminants of the spill came from two sources that are produced in the creation of phosphates for fertilizer: calcium sulfate (or gypsum) and wastewater that was contaminated with phosphoric acid and other pollutants. In order to get useable phosphate for fertilizer, phosphate ore is reacted with sulfuric acid to produce phosphoric acid. A byproduct of the reaction is calcium sulfate (CaSO4.2H20), commonly called gypsum. The gypsum is piled in mounds or “stacks” which are used to create walls that surround and contain pools of wastewater. The wastewater contains a dilute mixture of residual phosphoric and sulfuric acids, so the pH of the water is close to 2.0. The water may also contain con-taminants such as ammonia, fluoride, selenium, chromium, copper, cadmium, nickel, aluminum and even uranium, all of which can be toxic.
The Effect on the Estuary
Water quality data from the spill was captured at a monitoring station 3.0 km (1.9 mi) from where the spill entered the lake. The monitoring stations that measure the data are about 9 m from the bottom of the lake. When measured, chlorophyll-a, a measure of primary productivity, was non-existent. Two to three weeks later, large algal mats covered the surface of some shallow, enclosed areas of the lake.
The wastewater caused immediate damage to estuarine flora and fauna.
Who is at Fault?
The phosphate company, Mississippi Phosphate, claims that the gypsum stack holding the wastewater failed because of heavy rainfall. It was also claimed that the company tried to increase the capacity of the ponds and built the retaining walls too large and put them up too fast. The gypsum stacks are ringed by a moat-like ditch-and-berm system, which environmental permits say should be designed to capture such spills. The Mississippi Department of Environmental Quality (MDEQ) believed that the levees around the gypsum stacks weren’t sufficient to catch the pond spill before it poured into the lake.
The company’s permits from MDEQ specify that the waste ponds must be designed to withstand a storm producing about 11 inches in a 24-hour period, according to the standard calculations produced by the National Oceanic and Atmospheric Administration for this part of the Gulf Coast. Weather information from the Southern Climate Data Center indicates that there was no rainfall in Pascagoula on the two days before the spill occurred. Weather service radar and Southern Climate Data Center reports indicate that two weeks before the spill, an area along the Mississippi/Alabama border may have received about 8 inches of rain, the largest rainfall the Climate Data Center reported for that month. NOAA records indicate a storm of that intensity could be expected about once every five years along the Mississippi coast.

13
Figure 3. The gypsum walls containing the wastewater are seen in this image taken before the collapse.
Figure 4 . Phosphate processing facility adjacent to gypsum stacks in Polk County, FL.
(Image: Grand Bay National Estuarine Research Reserve)
Figure 5. Algae bloom and dead marsh grass, Bangs Lake, Grand Bay National Estuarine Research Reserve
(Image: Grand Bay National Estuarine Research Reserve)

14
Student Worksheet A Terrible Spill in Grand Bay
Part 1 — Modeling a Chemical Spill
To make a model that represents the spill in Grand Bay, you will pour a chemical mixture into a basin of brackish water representing the estuary. You will predict the effects of the chemical mix on the water quality of your sample. You will then consider the effects of the actual spill.
IMPORTANT NOTE: The chemicals in the wastewater you will make are much safer than those in the actual spill, but you must still use care and wear goggles and gloves because these chemicals can harm your eyes and may irritate your skin. Make sure you clean up and wash your hands carefully.
1a. Measure and record the following water quality indicators in your 1 liter sample of brackish water:
• salinity _________________________________________
• temperature _________________________________________
•. pH _________________________________________
• dissolved oxygen (if equipment is available)_________________________
• conductivity (if equipment is available) ___________________________
Add 300ml of tap water to a 500 ml beaker.
Measure 20 g of gypsum, add it to the tap water, and stir until all the plaster is well mixed with the water.
Measure 6 g of citric acid and add it to the gypsum and water mixture. This will be your model of a wastewater or chemical spill.
1b. Measure and record the following water quality indicators of the wastewater:
• salinity _________________________________________
• temperature _________________________________________
15
• pH _________________________________________
• dissolved oxygen (if equipment is available)_________________________
• conductivity (if equipment is available) ___________________________
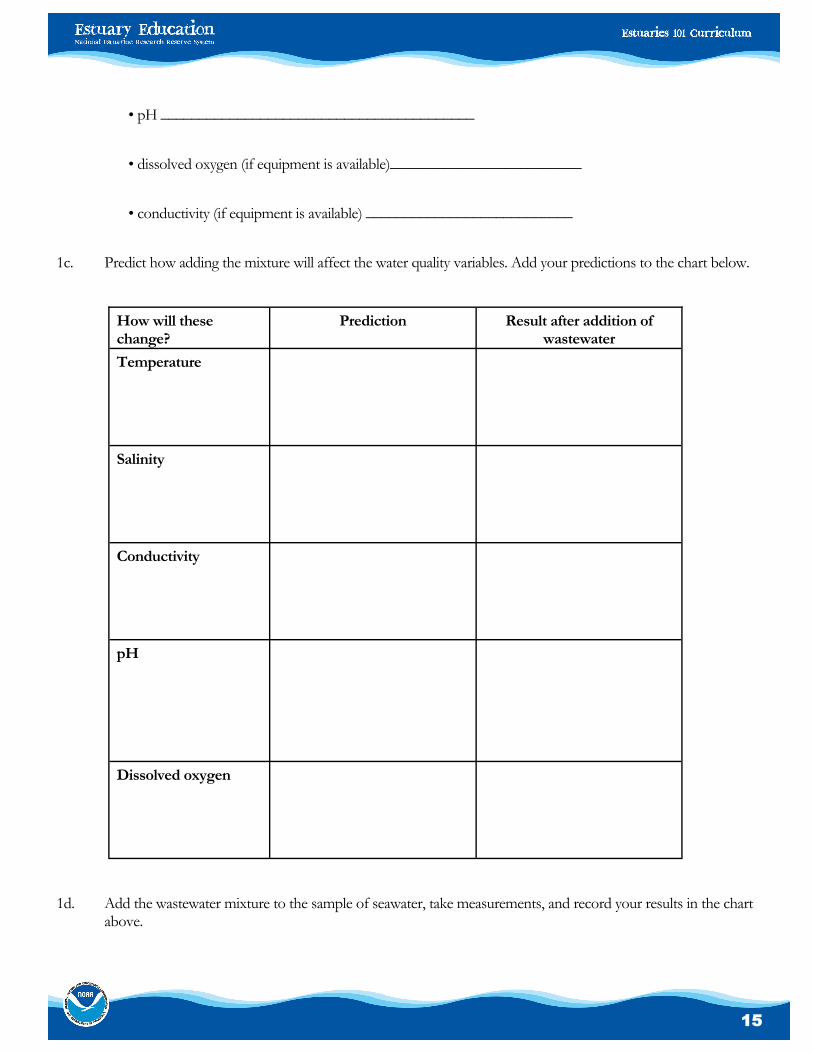
1c. Predict how adding the mixture will affect the water quality variables. Add your predictions to the chart below.
1d. Add the wastewater mixture to the sample of seawater, take measurements, and record your results in the chart above.
How will these change?
Prediction Result after addition of wastewater
Temperature
Salinity
Conductivity
pH
Dissolved oxygen

16
1e. What do your new readings indicate about how the mixture might affect estuarine life?
1f. If a similar chemical mixture spilled into an estuary, how do you think the water quality would change over a week? Over a month?
1g.. How is this experiment different from an actual spill in an estuary? Explain why you may get different results in this experiment than the results that would occur in an estuary.
Part 2 — Learning More about the Spill
Read the Student Reading—Introduction to Grand Bay and watch the PowerPoint presentation showing the Grand Bay NERR before and after the phosphate spill.
2a. Think about what went into the estuary water. How could the different chemicals affect the water quality and plant and animal life in the estuary? Update your predictions of how the spill would affect the estuary in the short and the long-term. Explain in terms of specific water quality variables.

17
Part 3 — Analyzing Data Before and After the Spill
In this final part of the activity, you will analyze actual data related to the spill. The data are provided on the Student Data Sheet—Data on Conditions in Grand Bay.
How would these indicators Explain reason for change or no change
Temperature
Salinity
Conductivity
pH
Dissolved oxygen
Phosphates
Nitrates

18
3a. Determine the month in 2005 during which the spill occurred. Look for extremes that may suggest something out of the ordinary happened.
Note: Some extremes can be caused by natural conditions, but they are still worth looking into. Try to see if there are dates when several factors seem to be higher or lower than ordinary. Also, keep in mind that the quick charts and trend analysis graphs show averages for each day. On any one of those days, actual values at any given time could be much lower or much higher than those averages. You will not know until you look at the actual results for a particular day.
3b. Complete the following chart
Typical average values for this month
Average values for spill month 2005
Salinity
Temperature
Dissolved oxygen
pH
Chlorophyll-a
Total Dissolved phosphorous
Orthophosphates

19
3c. Determine exactly when during the month the spill occurred and identify the dates and effects of the spill on water quality.
The spill occurred on which date?____________________________________________________
3d. Why do you think so? Which variables seem to suggest this?
3e. Look at actual daily records of water quality and nutrient data for the month during which the spill occurred in 2005. Describe these values during that time. What were the most extreme values?
3f. When did the measures look “normal” again? What might be some reasons for the time it took to attain
normalcy of water quality?
3g. Look at the charts on the following pages to determine what the effects would be on various fish in the estuary and the four life forms listed in the Chart 1.

20
Chart 1
Limits of Tolerance to Environmental Factors for Selected Organisms
Oysters
• Grow best in water with a salinity of 12 ppt and above, perish if salinity is below 5 ppt or above 15ppt
• Spawn only when the water temperature hits 18°C for four hours
• Spawn much more prevalent when salinity is over 20 ppt
• Need a DO level of around 4 mg/l
• Best growth when pH is between 7.5 and 8.5
Clams
• Grow best when the water salinity is above 15 ppt
• Spawn only when the water temperature hits 24°C for four hours
• Clam eggs die when the salinity is below 20 ppt
• Need a DO level of around 4 mg/l
• Optimal growth occurs between 10° and 25°C
Blue Crab
• Needs a DO level of 3 mg/l or more for survival, optimal at 5 mg/l
• Thrives if pH is between 6.8 and 8.2

21
Chart 2
Limits of Tolerance to Environmental Factors for Aquatic Animals
Figure 6. Minimum amount of DO needed for species to survive.
Chesapeake Bay Program Accessed: 2017-01-21. URL: http://www.chesapeakebay.net/discover/bayecosystem/dissolvedoxygen. (Archived by WebCite® at http://www.webcitation.org/65dH8QPes) Accessed: . 2017-01-21. r
22
Student Data Sheet Activity 3: Data on Conditions on Grand Bay
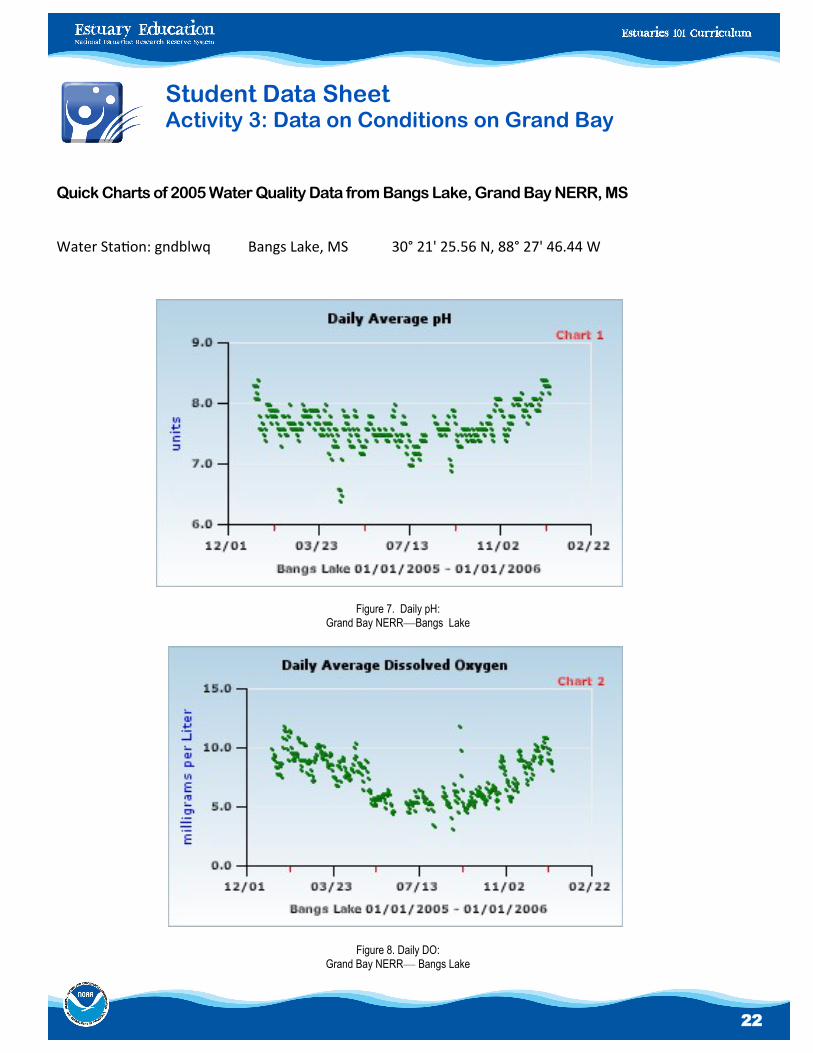
Quick Charts of 2005 Water Quality Data from Bangs Lake, Grand Bay NERR, MS
Water Station: gndblwq Bangs Lake, MS 30° 21' 25.56 N, 88° 27' 46.44 W
Figure 7. Daily pH: Grand Bay NERR—Bangs Lake
Figure 8. Daily DO: Grand Bay NERR— Bangs Lake

23
Figure 9. Daily Salinity: Grand Bay NERR— Bang's Lake
Figure 10. Daily Water Temperature: Grand Bay NERR— Bangs Lake

24
Figure 11. Daily Phosphorus: Grand Bay NERR— Bangs Lake
Figure 12. Daily Orthophosphate: Grand Bay NERR— Bang's Lake

25
Figure 13. Daily Chlorophyll a: Grand Bay NERR— Bangs Lake
Figure 14. Daily Turbidity: Grand Bay NERR— Bangs Lake

26
Month of Spill
Water Quality Readings, Bang's Lake, Great Bay NERR
NOTE: Even though the scale indicates a four-fold increase in phosphorous, the reading is actually 1,000X greater than normal. During May through August, phosphorous levels remained 100X normal.
Figure 16. Total Dissolved Phosphates and Orthophosphates: Grand Bay NERR—Bangs Lake
Total Dissolved Phosphates and Orthophosphates, March, April & May Replicates
0
0.5
1
1.5
2
2.5
3
3.5
4
4.5
5
Total Dissolved Phosphates Orthophosphates
A BA B
mg/L Reactive Phosphorus
Bangs Lake
0.000
1.000
2.000
3.000
4.000
5.000
Marc
hApr
ilM
ay
June
July
Aug
ust
Sep
tem
ber
Oct
ober
Nove
mbe
r
Dece
mbe
r
mg/L
Figure 15. Reactive Phosphorous (mg/L): Grand Bay NERR—Bangs Lake
27
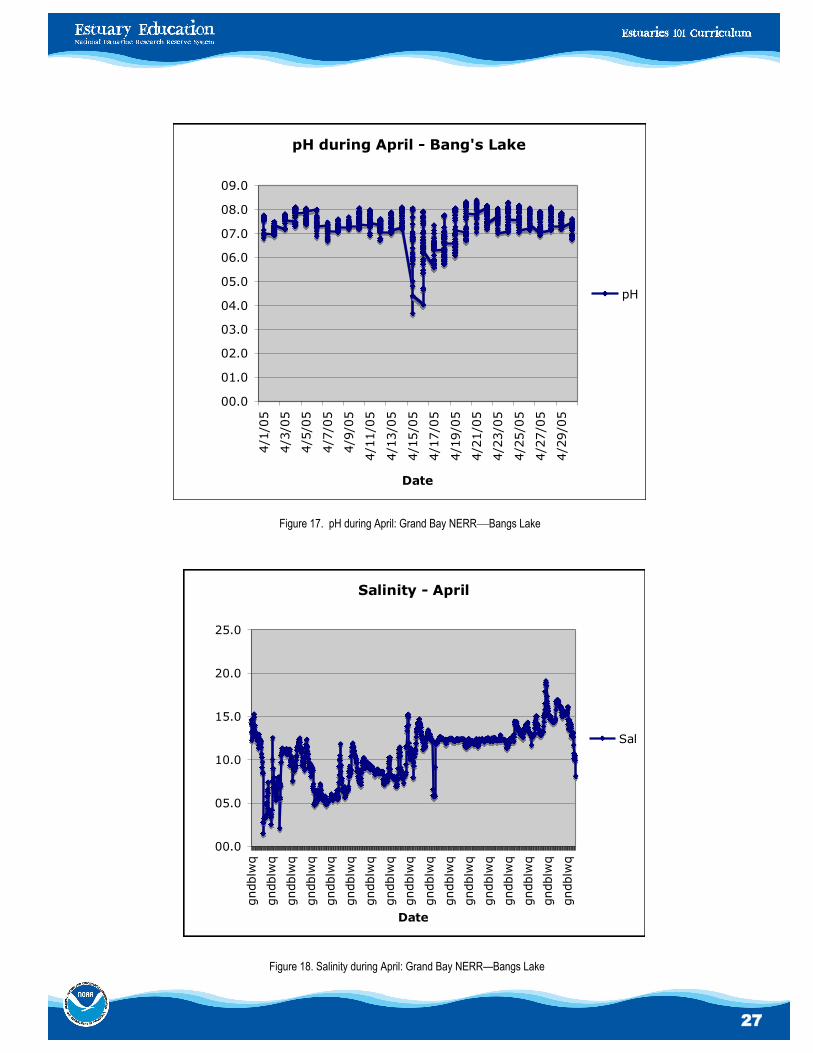
Figure 17. pH during April: Grand Bay NERR—Bangs Lake
pH during April - Bang's Lake
00.0
01.0
02.0
03.0
04.0
05.0
06.0
07.0
08.0
09.0
4/1/05
4/3/05
4/5/05
4/7/05
4/9/05
4/11/05
4/13/05
4/15/05
4/17/05
4/19/05
4/21/05
4/23/05
4/25/05
4/27/05
4/29/05
Date
pH pH
Salinity - April
00.0
05.0
10.0
15.0
20.0
25.0
gndblwq
gndblwq
gndblwq
gndblwq
gndblwq
gndblwq
gndblwq
gndblwq
gndblwq
gndblwq
gndblwq
gndblwq
gndblwq
gndblwq
gndblwq
gndblwq
gndblwq
Date
sali
nit
y(p
pt)
Sal
Figure 18. Salinity during April: Grand Bay NERR—Bangs Lake

28
Figure 19. DO% during April: Grand Bay NERR—Bangs Lake
DO% - April
000.0
020.0
040.0
060.0
080.0
100.0
120.0
140.0
160.0
180.0
4/1/05
4/8/05
4/15/05
4/22/05
4/29/05
Date
%D
O
DO_pct
DO concentration - April
00.0
02.0
04.0
06.0
08.0
10.0
12.0
14.0
4/1/05
4/8/05
4/15/05
4/22/05
4/29/05
Date
DO
(m
g/L)
DO_mgl
Figure 20. DO Concentration during April: Grand Bay NERR—Bangs Lake

29
Turbidity - April
0000
0050
0100
0150
0200
0250
0300
0350
4/1/05
4/3/05
4/5/05
4/7/05
4/9/05
4/11/05
4/13/05
4/15/05
4/17/05
4/19/05
4/21/05
4/23/05
4/25/05
4/27/05
4/29/05
Date
Tu
rbid
ity
(N
TU
s)
Turb
Figure 22. Temperature during April: Grand Bay NERR—Bangs Lake
Temperature - April
00.0
05.0
10.0
15.0
20.0
25.0
30.0
4/1/05
4/3/05
4/5/05
4/7/05
4/9/05
4/11/05
4/13/05
4/15/05
4/17/05
4/19/05
4/21/05
4/23/05
4/25/05
4/27/05
4/29/05
Date
Tem
peratu
re
(C
)
Temp
Figure 21.Turbidity during April: Grand Bay NERR—Bangs Lake

30
Final Assessment
Create a timeline from the month of the spill to 6 months after the spill that explains the effects on the estuary that resulted from the spill. Include the following components:
• Dates that show extreme values of the water quality parameters you analyzed in the activity.
• The following terms: pH, phosphorous, phosphate, salinity, dissolved oxygen, rainfall, algae blooms,marsh grass, oysters, clams, crabs, and fish.
• Recommendations to the state Department of Environmental Quality for the future. Explain whatshould be done to prevent any future environmental impacts from the fertilizer plant. Place therecommendations in the form of a letter and attach it to your poster board presentation.