student report notebook kit (cover, binder spine, divider ... · chapter 1: introduction ... 2.35...
TRANSCRIPT

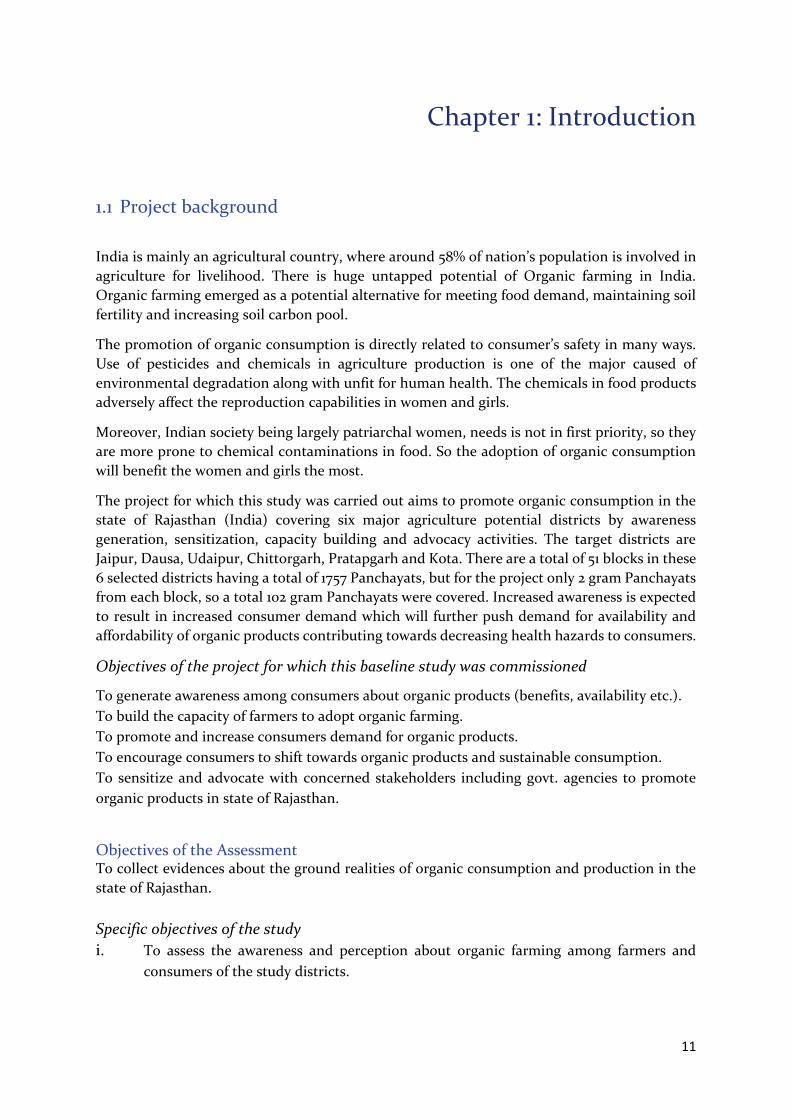
PROJECT REPORT
ACTION RESEARCH UNDER
PRO-ORGANIC FARMING
An Assessment in Six District of
Rajasthan
Vimarsh Development Solutions Pvt. Ltd. 445, Udyog Vihar, Phase -III, Gurgaon – 122016 Haryana
Telephone: 91-124-4264900- 05 Fax: 91-124-4264906
E-Mail: [email protected]
Study Conducted By:-

Table of Contents
List of Map ..................................................................................................................................... …3
List of Tables.................................................................................................................................. …3
List of Graphs ............................................................................................................................... …5
Executive Summary ...................................................................................................................... …6
The four pillers of organic farming .............................................................................................. …9
Chapter 1: Introduction ................................................................................................................ …11
1.1 Project Background ................................................................................................................. 11
Objectives of the Assessment .................................................................................................. 11
Coverage .................................................................................................................................. 12
1.2 Approach and Methodology ................................................................................................. 12
Sample Design ............................................................................................................................ 13
Assessment Matrix .................................................................................................................. 13
1.3 Data Collection & Analysis .................................................................................................... 15
Study Tools ............................................................................................................................. 15
Data Analysis .......................................................................................................................... 16
1.4 Team Composition ................................................................................................................ 16
Chapter 2: Key Findings of the Assessment .................................................................................. 17
2.1 Perception of Consumers towards Organic Produce ........................................................... 17
Socio –Economic profile of Consumers .................................................................................... 17
Awareness Level of Consumer for Organic Products.............................................................. 22
2.2 Perception of Farmers towards Organic Farming ...............................................................35
Socio –Economic profile of Farmers ......................................................................................... 35
Awareness Level of Farmer for Organic Farming .................................................................... 37
2.3 Achievement ........................................................................................................................ 52
District ................................................................................................................................... 52
State ........................................................................................................................................ 52
2.4 Challenges: ........................................................................................................................... 54
District ................................................................................................................................... 54
State ........................................................................................................................................ 54
Gaps and challenges: ................................................................................................................. 55
Chapter 3: Way Forward ............................................................................................................... 57
3.1 Recommendations ........................................................................................................... 57
State Level .............................................................................................................................. 57

2
District ................................................................................................................................... 58
3.2 Facilitating Factors .............................................................................................................. 59
State ........................................................................................................................................ 59
District ................................................................................................................................... 60
Chapter 4: Conclusion ................................................................................................................... 62
Annexure 1 ..................................................................................................................................... 63
In-Depth Interview Schedule for Department Officials/ Organisations ................................ 63
Annexure 2 ..................................................................................................................................... 69
Team Composition .................................................................................................................... 69
Annexure 3 ...................................................................................................................................... 71
Four Pillars of Organic Farming ................................................................................................ 71

3
List of Map
Figure No. Legend Page No.
1 Map of districts covered in the study 12
List of Tables
Table No. Contents Page No.
2.1 Gender and district wise number of responses. 17
2.2 Age wise and gender wise percentages of respondents 18
2.3 Educational qualification details of respondents 18
2.4 Status of Current Activities of Respondents 20
2.5 District wise Economic Status of Respondents 20
2.6 Monthly Household Expenditure on Fruits/Vegetables & Grocery Items by Respondents
21
2.7 Awareness towards ill effects of consuming fruits/ vegetable grown through use of inorganic fertilizer, pesticides and other in farming
23
2.8 Awareness of organic produce such as fruit/ vegetable/grains 23
2.9 Responses obtained on awareness of organic produce such as fruit/vegetable/grains
23
2.10 Awareness of Organic Product Availability in Market 24
2.11 Points from where Respondents Purchased Organic Products 25
2.12 Respondents by gender and Awareness of fixed/authorized centre or shop for organic products
25
2.13 Awareness level of Respondents about Recognizing Organic Products 25
2.14 District wise awareness level of Respondents about Recognizing Organic Products
26
2.15 Reason for organic product to be better than inorganic product 27
2.16 District wise responses on purchase of any organic product ever 27
2.17 Respondents by gender on ever purchased any organic product and on cost of organic products as compare to inorganic products
27
2.18 Respondents by gender on reasons for not purchased of organic food products 28
2.19 District wise responses on reasons for not purchased of organic food products 28
2.20 District wise responses on suggestions for increasing use of organic food products
31
2.21 List of organic products purchased in last one month 32
2.22 Gender and district wise number of responses 35
2.23 Age wise and gender wise percentages of respondents 35
2.24 Educational qualifications wise details of respondents 36

4
2.25 Status of Current Activities 36
2.26 District wise economic status of respondents 37
2.27 District wise details of types of fertilizer/pesticide/weedicide used 38
2.28 List of material used on farming such as fertilizer/ pesticide / weedicide 38
2.29 District wise responses on awareness of bad effects of chemical fertilizers/ pesticides/ weedicides on soil and quality of crop produce
39
2.30 Reasons for using chemical base material for farming 39
2.31 District wise responses on practicing organic farming 41
2.32 District wise responses on actual practices of organic farming 42
2.33 Responses on less cost of organic farming compared to traditional farming practice
43
2.34 List of input material for self-preparing organic fertilizer 44
2.35 Response on higher cost of organic agri inputs 45
2.36 Responses on coverage of additional cost from assistance and time of assistance received
46
2.37 District wise response on awareness of farmer’s club 47
2.38 District wise response on awareness of organic product certification 47
2.39 Responses on reason for not getting higher value for organic produce 48
2.40 Responses on barriers / challenges for organic farming 49
2.41 District wise responses on barriers / challenges for organic farming 50
2.42 Respondents who have indicated willingness to practice organic farming, if necessary assistance is provided thereof
50
2.43 Suggestions for extending organic farming 51
2.44 District wise response on suggestions for extending organic farming 51
2.45 Achievement mentioned at district level 52
2.46 Achievement mentioned by at the state level 52
2.47 Challenges as perceived by government officials at district level 54
2.48 Challenges as perceived by government officials at state level 54
2.49 Recommendations on organic farming at state level 58
2.50 Recommendations on organic farming district level 58
2.51 Facilitating factors of organic farming at state level 59
2.52 Facilitating factors of organic farming at district level 60

5
List of Graphs
Chart No. Legend Page No.
1.1 Gender and district wise percentage of responses 17
1.2 Educational qualification details of respondents 19
1.3 Respondents by gender and location of grocery items purchased 21
1.4 Respondents by gender and location of fruits/vegetables purchased 22
1.5 Awareness towards ill effects of consuming fruits/vegetables grown through use of inorganic fertilizer, pesticides & other in farming
22
1.6 Awareness of organic farming practiced by farmer 24
1.7 Reason for organic product to be better than inorganic product 26
1.8 Responses on technique of recognizing organic products 29
1.9 Respondents by gender and responses on technique of recognizing organic products
29
1.10 Respondents by gender and reasons for not easy availability of organic products
30
1.11 Respondents by gender and suggestions to increase use of organic products 30
1.12 Respondents by gender and satisfaction level from quality of organic products 32
1.13 District wise responses on satisfaction level from quality of organic products 33
1.14 Respondents by gender and whether certification made mandatory 33
1.15 Respondents by gender and whether recommend organic products to others 34
1.16 Gender wise economic status of respondents 36
1.17 Monthly household income of farmers 37
1.18 Type of fertilizer/ pesticide/ weedicide used 38
1.19 Awareness of bad effects of chemical fertilizers/ pesticides/ weedicides on soil and quality of crop produce
39
1.20 Whether organic foods are healthier than normal foods 40
1.21 Awareness of benefits of organic products 40
1.22 Farmers practicing organic farming 41
1.23 Gender wise responses on actual practices of organic farming 42
1.24 Farmers response on rise of organic product demand 43
1.25 Responses on less cost of organic farming compared to traditional farming practice
43
1.26 Training received on organic farming 44
1.27 Farmer response on purchase of Organic Agri input such as organic pesticide/ vermin compost
44
1.28 Years of use of organic inputs in farming 45
1.29 Response on assistance received from any Govt. agency 45
1.30 Gender wise response on awareness of farmer’s club 46
1.31 Farmers response on self consumption of their organic produce 48
1.32 Response on received higher value of organic product than normal product 48
1.33 Farmers response on quality of their organic produce 49

6
Executive Summary
Background
Organic farming is gaining gradual momentum across the world. However, it is not a new
concept to India, since Indian agriculture is traditionally organic and has its roots in traditional
agricultural practices that evolved in countless villages and farming communities over the
millennium. The farmers were following organic cultivation till the middle of the last century
(1950). But, gradually they changed to chemical based cultivation since Green Revolution in
1950’s. However, the growing awareness of health and environmental issues in agriculture has
demanded production of organic food which is emerging as an attractive source of rural income
generation.
India is endowed with types of naturally available organic form of nutrients in different parts of
the country and it will help for organic cultivation of crops substantially. There is diversity in
climates 100-10,000 mm rainfall, hill, desert, strong traditional farming system crop tree-animal,
innovative farmers, vast dry lands (60% agriculture land), and least use of chemicals. In fact, the
rain fed, tribal, north east and hilly regions, of the country where negligible chemicals used are
practicing subsistent agriculture for a long period. The areas are organic by default. There are
around more than 10 lakh ha of organic farm land in India.
The state of Rajasthan, according to a case study of Rajasthan in 2004-05, has 5631.3 (7.4%) ha
organic with unique cropping pattern. Presently, this state is promoting organic farming
vigorously.
CUTS-International desired to conduct an assessment study about the ground realities of
organic consumption and production in the state of Rajasthan.
CUTS - International
Consumer Unity & Trust Society (CUTS) International, established in 1984, is a non-profit, non-
governmental organization working on public interest issues with a vision, i.e. Consumer
sovereignty in the framework of social justice and equality, within and across borders.
CUTS-International mainly works in five programme areas:
i. Consumer protection
ii. International trade & development
iii. Competition, Investment & Economic Regulation
iv. Human Development
v. Consumer Safety
The organization is accredited to the UNCTAD and the United Nations Commission on
Sustainable Development (UNCSD).

7
CUTS also works with several regional, national and international organizations such as
consumers international (CI), the international centre for trade and sustainable development
(ICTSD), South Asia Watch on trade, economics & environment (SAWTEE), the consumer
coordination council (CCC) of India, etc. It also serves on several policy making bodies of
Government of India.
The project for which this baseline study was carried out aims to promote organic consumption
in the state of Rajasthan (India) covering six major agriculture potential districts by awareness
generation, sensitization, capacity building and advocacy activities. The target districts are
Jaipur, Dausa, Udaipur, Chittorgarh, Pratapgarh and Kota.
Vimarsh has undertaken this assessment study for CUTS-International with the following
objectives:
General objective To collect evidences about the ground realities of organic consumption and production in the
state of Rajasthan.
Specific objectives
i. To assess the awareness and perception about organic farming among farmers and consumers of the study districts.
ii. To analyse the components of system in place to promote organic farming like
availability of technical knowhow, provision of market avenues, process of
certification, investments, storage and supply chain.
iii. To study the barriers and issues impeding adoption of organic farming among the
farmers and adoption of organic consumption among the consumers.
Coverage The assessment was conducted in the state of Rajasthan. The six districts that were covered for
the assessment are Chittorgarh, Dausa, Jaipur, Kota, Pratapgarh and Udaipur.
Sample Design
There are a total of 51 blocks in 6 selected districts having a total of 1757 Panchayat. For the
project, 2 gram Panchayats from each block, so a total 102 gram Panchayats was covered.
Further, two groups of respondents, i.e. farmers and consumers, equal number of farmers and
consumers were covered (23 each per Gram Panchayat). The study covered Urban as well as
Rural covering both genders in its sample frame.
Methodology
The methodology comprised of secondary data review, primary data collection and data
analysis. The data collection was done through survey with farmers & consumers and in-depth-
interviews with two types of stakeholders, i.e. Government and Non-Government at two levels
viz. district and state. The Government stakeholders include officials from the Agriculture
Department and Kisan Vikas Kendra. While, the non-government stakeholders include PRI
members, farmers, accreditation and certification authorities and representative from
CSO/NGOs. The assessment used the in-depth interview guideline/checklist (IDI) to capture
feedback of various stakeholders on the project.

8
Findings of the Study
The main key findings that come out quite strikingly from the quantitative as well as the
qualitative study are on:
Creating awareness about the usage of organic products
Generating market linkages to enable farmers sell their produce thus enabling
easy availability of organic produce
Need for training needs
Spread of awareness about the availability of organic products
Ease the process of certification
Interdisciplinary approach including all stakeholders like the government,
NGOS/VOs, farmer organizations, research organizations and certification
agencies
Sustaining the farmers during the period of transition towards organic farming
Suggestions of farmers and consumers
Recommendations
Based on the above key findings, the recommendations suggested are:
Create awareness camps through training and promotional activities
Generate market linkages by building cooperative mode of support
Interdisciplinary linkage of all stake holders by designating one single nodal
agency such as a “Directorate of Organic farming”
Mobilize youth and women force in creating awareness on the use organic
products
Enable Make educational/teaching/research organizations act as change agents
in pushing awareness about use of organic products
Conclusion
Based on the overall observations through the assessment that organic farming has its
downsides mostly due to the way it is perceived by farmers and lack of focus by key players
however by mainstreaming it like other agricultural activities organic farming will gain more
acceptability. A structured approach towards organic farming could help in popularizing it
amongst farmers.

9
The four pillars of organic farming are:
1) Organic standards
2) Certification/Regulatory mechanism
3) Technology packages
4) Market network (Elaborate note in annexure 3)
Background on organic farming in India i. Organically cultivated soils are relatively better attuned to withstand water stress
and nutrient loss. Their potential to counter soil degradation is high and several experiments in arid areas reveal that organic farming may help to combat desertification. It is reported that about 70 hectares of desert in Egypt could be converted into fertile soil supporting livestock through organic and biodynamic practices. India, which has some areas of semi-arid and arid nature, can benefit from the experiment.1
ii. Organic agricultural practices are based on a maximum harmonious relationship
with nature aiming at the non-destruction of the environment. The developed nations of the world are concerned about the spreading contamination of poisonous chemicals in food, feed, fodder and fibre. Naturally, organic farming system is looked upon as one of the means to remedy these maladies there. However, the major problem in India is the poor productivity of our soils because of the low level content of the organic matter. The efficiency of the organic inputs in the promotion of productivity depends on the organic contents of the soil. There were many resemblances of organic farming principles in the traditional agriculture of India. But the former gives a more open and verifiable scientific foundation than the latter.
Main Principle of Organic Farming2
1 Occasional Paper – 38, 2005, Organic Farming in India: Relevance, Problems and Constrains, Dr. Naryanan, S., NABARD 2 Indian Journal of Fertilisers. Vol. 1 (9). December 2005. PP.111-123(13 pages), Current Status of Organic Farming in India and other Countries, Bhattacharya P. and Chakraborty G., National Centre of Organic Farming, Ghaziabad.
The main principles of organic farming are the followings:
i) To work as much as possible within a closed system, and draw upon local resources.
ii) To maintain the long-term fertility of soils.
iii) To avoid all forms of pollution that may result from agricultural techniques.
iv) To produce foodstuffs of high nutritional quality and sufficient quantity.
v) To reduce the use of fossil energy in agricultural practice to a minimum.
vi) To give livestock conditions of life that confirm to their physiological need.
vii) To make it possible for agricultural producers to earn a living through their work and
develop their potentialities as human being.

10
iii. The introduction of Green Revolution agricultural technology in the 1960’s reached the main production areas of the country; there were still certain areas (especially mountain areas) and communities (especially certain tribes) that did not adopt the use of agro-chemicals. Therefore, some areas can be classified as organic by default. 3
iv. India has competitive advantages in the world markets due to low production costs and availability of diverse climates to grow a large number of crops round the year. Organic products are mainly exported to EU, US, Australia, Japan, Switzerland and Middle East.
3 Journal of Rice Research Vol.3 No 1, Status of Organic Farming and Research experience in Rice, Surekha K, Directorate of Rice Research, Hyderabad.
11
Chapter 1: Introduction
1.1 Project background
India is mainly an agricultural country, where around 58% of nation’s population is involved in
agriculture for livelihood. There is huge untapped potential of Organic farming in India.
Organic farming emerged as a potential alternative for meeting food demand, maintaining soil
fertility and increasing soil carbon pool.
The promotion of organic consumption is directly related to consumer’s safety in many ways.
Use of pesticides and chemicals in agriculture production is one of the major caused of
environmental degradation along with unfit for human health. The chemicals in food products
adversely affect the reproduction capabilities in women and girls.
Moreover, Indian society being largely patriarchal women, needs is not in first priority, so they
are more prone to chemical contaminations in food. So the adoption of organic consumption
will benefit the women and girls the most.
The project for which this study was carried out aims to promote organic consumption in the
state of Rajasthan (India) covering six major agriculture potential districts by awareness
generation, sensitization, capacity building and advocacy activities. The target districts are
Jaipur, Dausa, Udaipur, Chittorgarh, Pratapgarh and Kota. There are a total of 51 blocks in these
6 selected districts having a total of 1757 Panchayats, but for the project only 2 gram Panchayats
from each block, so a total 102 gram Panchayats were covered. Increased awareness is expected
to result in increased consumer demand which will further push demand for availability and
affordability of organic products contributing towards decreasing health hazards to consumers.
Objectives of the project for which this baseline study was commissioned
To generate awareness among consumers about organic products (benefits, availability etc.).
To build the capacity of farmers to adopt organic farming.
To promote and increase consumers demand for organic products.
To encourage consumers to shift towards organic products and sustainable consumption.
To sensitize and advocate with concerned stakeholders including govt. agencies to promote
organic products in state of Rajasthan.
Objectives of the Assessment To collect evidences about the ground realities of organic consumption and production in the
state of Rajasthan.
Specific objectives of the study
i. To assess the awareness and perception about organic farming among farmers and
consumers of the study districts.
12
ii. To analyse the components of system in place to promote organic farming like
availability of technical knowhow, provision of market avenues, process of certification,
investments, storage and supply chain.
iii. To study the barriers and issues impeding adoption of organic farming among the
farmers and adoption of organic consumption among the consumers.
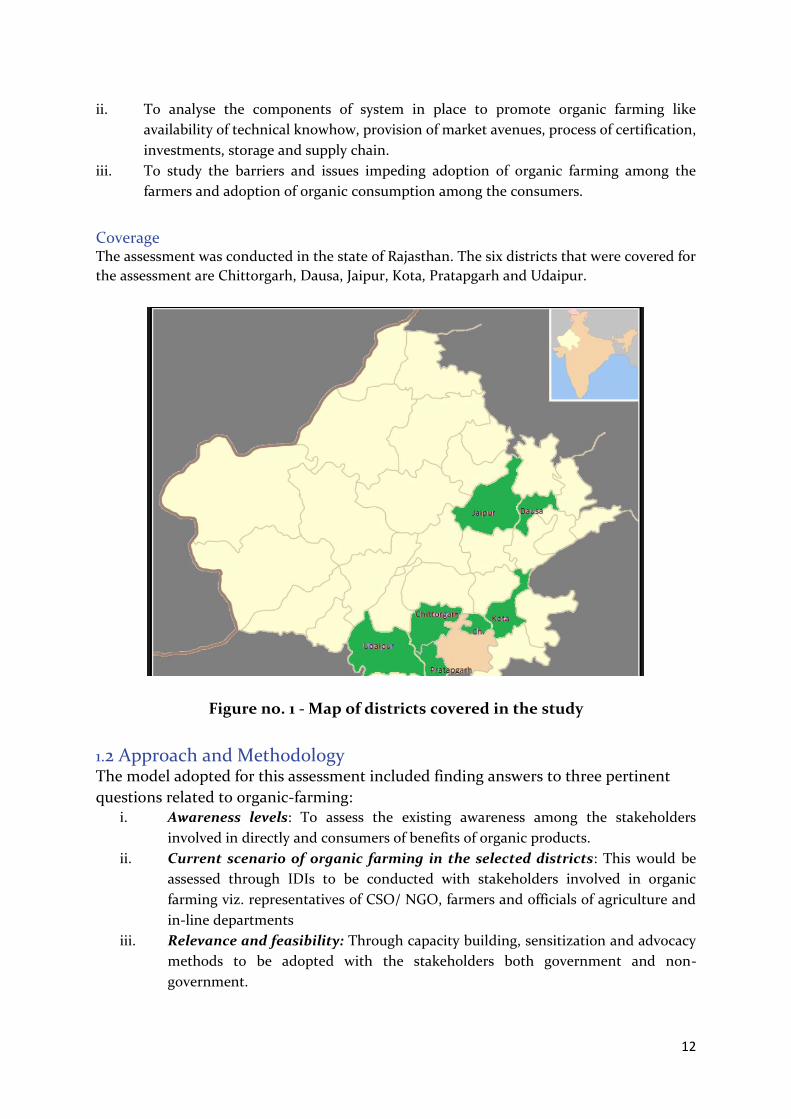
Coverage The assessment was conducted in the state of Rajasthan. The six districts that were covered for
the assessment are Chittorgarh, Dausa, Jaipur, Kota, Pratapgarh and Udaipur.
Figure no. 1 - Map of districts covered in the study
1.2 Approach and Methodology The model adopted for this assessment included finding answers to three pertinent
questions related to organic-farming: i. Awareness levels: To assess the existing awareness among the stakeholders
involved in directly and consumers of benefits of organic products.
ii. Current scenario of organic farming in the selected districts: This would be
assessed through IDIs to be conducted with stakeholders involved in organic
farming viz. representatives of CSO/ NGO, farmers and officials of agriculture and
in-line departments
iii. Relevance and feasibility: Through capacity building, sensitization and advocacy
methods to be adopted with the stakeholders both government and non-
government.

13
Sample Design From each of the 51 blocks, 2 Gram Panchayats (GP) were selected for the study. Since, we
intended to cover two groups of respondents, i.e. farmers and consumers, equal number of
farmers and consumers were covered (15 each per Gram Panchayat).
Quantitative Module:
List of selected GPs and villages within each GP were provided by CUTS.
Within a village selection of respondents: 1. All hamlets were covered according to the proportion 2. Sarpanch (around 80% of the time)/Aaganwadi Workers/ANMs/prominent elders were
consulted to help identify hamlets/pockets/spread of village to understand the
population/household spread of the village
3. Only household/population spread was considered while covering the village
4. This ensured that the village was well represented in the 23 samples covered in a village
– 15 farmers (Males 9/females 6) and 8 consumers (Males 5/females 3).
5. In urban locations, city/town was represented from all socio economic areas covering
residential areas covering 22 to 27 (60% male/40% females interviews per location)
Qualitative Module:
Respondents for the qualitative module were covered
from the various sources, like departments, various
NGOs/VOs, agencies in consultation with CUTS and its
partners at the district level.
1. Government Stakeholders - Agriculture, horticulture, government teaching and research institutes
2. Non-Government Stakeholders:
a. Jaipur
b. Dausa and Kota
c. Chittorgarh
d. Pratapgarh
e. Udaipur
Assessment matrix The collected responses have been entered in an excel sheet. Post compilation all responses
have been coded. As the sample size was moderate, it was feasible for the research team to adopt
this method and it helped in the detailed analysis of each IDI. IDI tools were designed to capture
information on knowledge levels and awareness on organic farming from various stakeholders.
The total Sample Size
for the Survey = 3000
Total no. of Gram
Panchayats to be
covered across 51
blocks in 6 districts =
102
Total respondents for
the survey per Gram
Panchayat = 3000/102
= 30 (approx.)

14
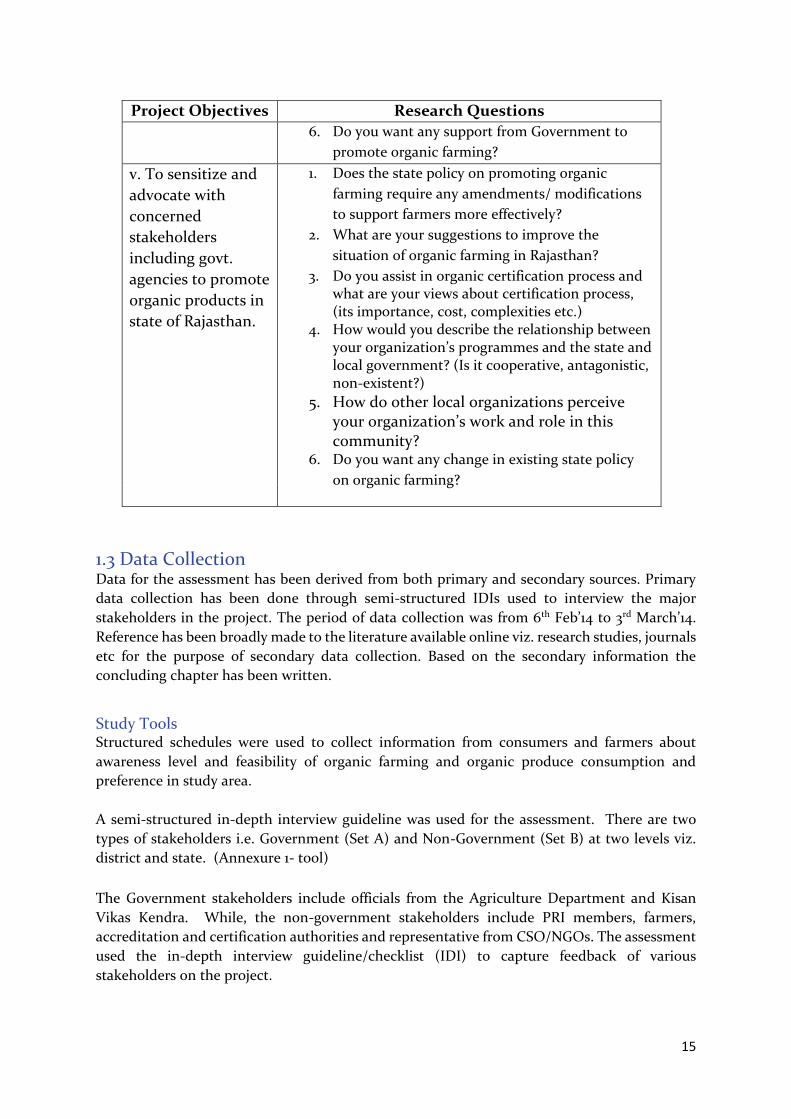
Research Questions for the In-Depth Interviews
Project Objectives Research Questions
i. To generate
awareness among
consumers about
organic products
(benefits,
availability etc.)
1. Do organic products have enough consumers to buy? What are consumers’ perceptions/concerns in buying organic products?
2. Do you do something to promote organic farming and consumption?
ii. To promote and
increase consumers
demand for organic
products.
1. Do organic products have enough consumers to buy? What are consumers’ perceptions/concerns in buying organic products?
2. Do you do something to promote organic farming
and consumption, if yes what?
iii. To encourage
consumers to shift
towards organic
products and
sustainable
consumption.
1. Do you do something to promote organic farming and consumption, if yes what?
2. How would you evaluate the success of organic
farming in the state / district?
3. How do you see the future of organic farming in
your district and at state level?
4. What you’re doing to control/decrease use
chemical fertilizers/pesticides/weedicides etc. by
farmers?
5. How do you see the future of organic farming in
Rajasthan?
6. What are some of the challenges you experience in your everyday work? What challenges you face in convincing farmers to adopt organic farming? What are the challenges faced by farmers, who adopt organic farming
7. How would you describe the community you work for: Are they receptive to the organization’s program and assistance?
iv. To build the
capacity of farmers
to adopt organic
farming.
1. How would you describe the relationship between
department and other farmer’s organization
working in the state?
2. How many farmers does your department reach?
3. Do you help famers in marketing/sale of their
organic products?
4. How would you describe the farmers you work
for: Are they receptive to the department’s
program and assistance on organic farming?
5. From the time you started promoting organic
farming, has the number of farmers you counsel,
guide & cooperate with increased, and to what
extent?
15
Project Objectives Research Questions
6. Do you want any support from Government to
promote organic farming?
v. To sensitize and
advocate with
concerned
stakeholders
including govt.
agencies to promote
organic products in
state of Rajasthan.
1. Does the state policy on promoting organic
farming require any amendments/ modifications
to support farmers more effectively?
2. What are your suggestions to improve the
situation of organic farming in Rajasthan?
3. Do you assist in organic certification process and what are your views about certification process, (its importance, cost, complexities etc.)
4. How would you describe the relationship between your organization’s programmes and the state and local government? (Is it cooperative, antagonistic, non-existent?)
5. How do other local organizations perceive your organization’s work and role in this community?
6. Do you want any change in existing state policy
on organic farming?
1.3 Data Collection Data for the assessment has been derived from both primary and secondary sources. Primary
data collection has been done through semi-structured IDIs used to interview the major
stakeholders in the project. The period of data collection was from 6th Feb’14 to 3rd March’14.
Reference has been broadly made to the literature available online viz. research studies, journals
etc for the purpose of secondary data collection. Based on the secondary information the
concluding chapter has been written.
Study Tools Structured schedules were used to collect information from consumers and farmers about
awareness level and feasibility of organic farming and organic produce consumption and
preference in study area.
A semi-structured in-depth interview guideline was used for the assessment. There are two
types of stakeholders i.e. Government (Set A) and Non-Government (Set B) at two levels viz.
district and state. (Annexure 1- tool)
The Government stakeholders include officials from the Agriculture Department and Kisan
Vikas Kendra. While, the non-government stakeholders include PRI members, farmers,
accreditation and certification authorities and representative from CSO/NGOs. The assessment
used the in-depth interview guideline/checklist (IDI) to capture feedback of various
stakeholders on the project.

16
Data analysis Each of the responses received from the interviewees both at district and the state level have
been coded and their frequency has been compiled in Microsoft excel. The responses have been
separately listed down for stakeholders for Set A and Set B.
To identify the most commonly appearing response, codes with frequency >2 have been used to
prepare tables. For some of the questions the responses received are equally distributed among
all codes.
Team Composition The training of the team was held over 2 days including field testing. This was a residential
training imparted in Jaipur on the 4th and 5th of Februar’2014. The training was imparted by
professionals from Vimarsh along with the senior team from CUTS
The core team for the assessment consisted of five members. The team was lead by a Team
Leader and an expert in organic farming as the technical advisor. A Project Coordinator was
responsible for coordination of the field team movement and timely completion of the data
collection phase. A data analyst and a research associate were also a part of the team.
Project Pro Organic – Training, 4th and 5th February’2014, Jaipur

17
Chapter 2: Key Findings of the Assessment 2.1 Perception of Consumers towards Organic Produce Total 1536 responses have been recorded to study the perception of consumers towards organic
produce in six districts of Rajasthan. Of total responses 64.2% respondents were male and 35.8%
were female respondents. Below table 2.1 shows district wise and gender wise counts of
respondents.
Table 2.1 - Gender and district wise number of responses.
District Male % (Male) Female % (Female) Total N % (Total N)
Jaipur 264 17.2 128 8.3 392 25.5
Dausa 131 8.5 49 3.2 180 11.7
Udaipur 194 12.6 135 8.8 329 21.4
Chittorgarh 212 13.8 120 7.8 332 21.6
Pratapgarh 91 5.9 60 3.9 151 9.8
Kota 94 6.1 58 3.8 152 9.9
Total N 986 64.2 550 35.8 1536 100.0
Chart 1.1 - Gender and district wise percentage of responses
Socio –Economic profile of Consumers
A broad view of socio-economic parameters of the respondents are studied here included age, education, current activity for livelihood, economic status, monthly expenditures, point of purchase and trend followed were some other variables studied as they have significant impact on decision making of the consumer with focus to organic product.
0.0
5.0
10.0
15.0
20.0
25.0
30.0
Male Female Total N
17.2%
8.3%
25.5%
8.5%
3.2%
11.7%12.6%
8.8%
21.4%
13.8%
7.8%
21.6%
5.9% 3.9%
9.8%
6.1%3.8%
9.9%
Total N - 1536 (Male-986 & Female-550)
Jaipur Dausa Udaipur Chittorgarh Pratapgarh Kota

18
Age of Respondents
Age of the consumer is a major determinant in taking innovative decision by him. The younger ones are generally expected to respond react and adapt faster than their elder counterparts. Table 2.2 shows the respondents with age class and gender wise. 63.22% respondents are of age class from 21-40 years. This age group is prominently involved in day to day market purchasing for the consumables items.
Table 2.2 - Age wise and gender wise percentages of respondents
Age Group Male % (Male) Female % (Female) Total N % (Total N)
Up to 20 Yrs. 72 7.30 33 6.00 105 6.84
21-30yrs 349 35.40 207 37.64 556 36.20
31-40yrs 266 26.98 149 27.09 415 27.02
41-50yrs 175 17.75 86 15.64 261 16.99
Above 50yrs 124 12.58 75 13.64 199 12.96
TOTAL (N) 986 100.00 550 100.00 1536 100.00
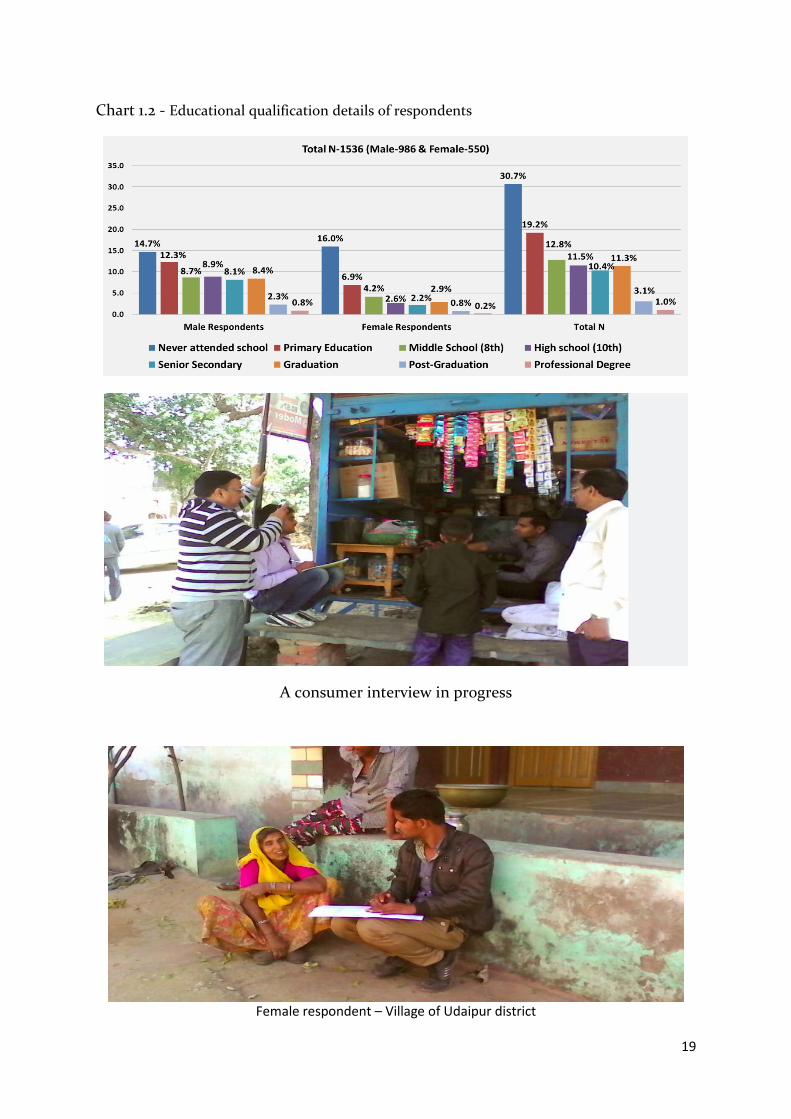
Education Level
The distribution of consumers on the basis of their formal educational qualification is presented
in Table 2.3. Of total respondents 30.66% have never attended school which corresponds to
14.7% male and 16% female. Table 2.3 below shows education qualification and gender wise
counts of respondents’ educational level plays an important role towards the awareness to the
various issues, capability of decision making.
Table 2.3 - Educational qualification details of respondents
Educational Qualifications
Male % (Male) Female % (Female) Total N % (Total N)
Never attended school 226 14.7 245 16.0 471 30.66
Primary Education 189 12.3 106 6.9 295 19.21
Middle School (8th) 133 8.7 64 4.2 197 12.83
High school (10th) 136 8.9 41 2.7 177 11.52
Senior Secondary 125 8.1 34 2.2 159 10.35
Graduation 129 8.4 45 2.9 174 11.33
Post-Graduation 35 2.3 12 0.8 47 3.06
Professional Degree 13 0.8 3 0.2 16 1.04
TOTAL (N) 986 64.2 550 35.8 1536 100.00
19
Chart 1.2 - Educational qualification details of respondents
A consumer interview in progress
Female respondent – Village of Udaipur district

20
Current Activity / Employment
The distribution of consumers on the basis of their current activity/ engagement is presented
in Table 2.4. Working class respondents attribute to 51.8% of responses followed by 29%
responses from household chores.
Table 2.4- Status of Current Activities of Respondents
Status of Current Activities
Male % (Male) Female % (Female) Total N % (Total N)
Working 608 61.7 187 34.0 795 51.8
Student 140 14.2 41 7.5 181 11.8
Household Chores 153 15.5 293 53.3 446 29.0
Retired 12 1.2 5 0.9 17 1.1
None of Above 73 7.4 24 4.4 97 6.3
TOTAL (N) 986 100.0 550 100.0 1536 100.0
Economic Status
Economic status has been captured through type of ration card availed by the
respondents. On basis of ration card respondents were classified into Above Poverty
Line (APL) and Below Poverty Line (BPL). The ratio of APL: BPL is 78.0%. 90% of
respondents from Jaipur are of APL category, highest among other districts. 43% of
respondents from Udaipur are of BPL category. District wise economic status of
respondents is shown below in table 2.5.
Table 2.5 District wise Economic Status of Respondents
Districts APL % (APL) BPL % (BPL) Total N % (Total N)
Chittorgarh 248 75 84 25 332 21.6
Dausa 153 85 27 15 180 11.7
Jaipur 352 90 40 10 392 25.5
Kota 134 88 18 12 152 9.9
Pratapgarh 124 82 27 18 151 9.8
Udaipur 187 57 142 43 329 21.4
Total N 1198 78.0 338 22.0 1536 100.0
Monthly Household Expenditure on Fruits/Vegetables & Grocery Items by
Respondents
The distribution of consumers on the basis of their monthly expenses is presented in Table 2.6.
458 respondents i.e. 29.8% are classified in monthly expense class of 2000-3000. The
expenditure pattern is essential to know about capacity of consumer to move on towards
consumption of organic products.
21
Table 2.6 - Monthly Household Expenditure on Fruits/Vegetables & Grocery Items by
Respondents
Monthly Household Expenditure (Rs.)
Male % (Male) Female % (Female) Total N % (Total N)
Less than 500 35 2.3 50 3.3 85 5.5
500 – 1000 104 6.8 54 3.5 158 10.3
1000 – 2000 147 9.6 96 6.3 243 15.8
2000 - 3000 286 18.6 172 11.2 458 29.8
3000 – 5000 241 15.7 92 6.0 333 21.7
5000 – 10000 127 8.3 68 4.4 195 12.7
More than 10000 46 3.0 18 1.2 64 4.2
TOTAL (N) 986 64.2 550 35.8 1536 100.0
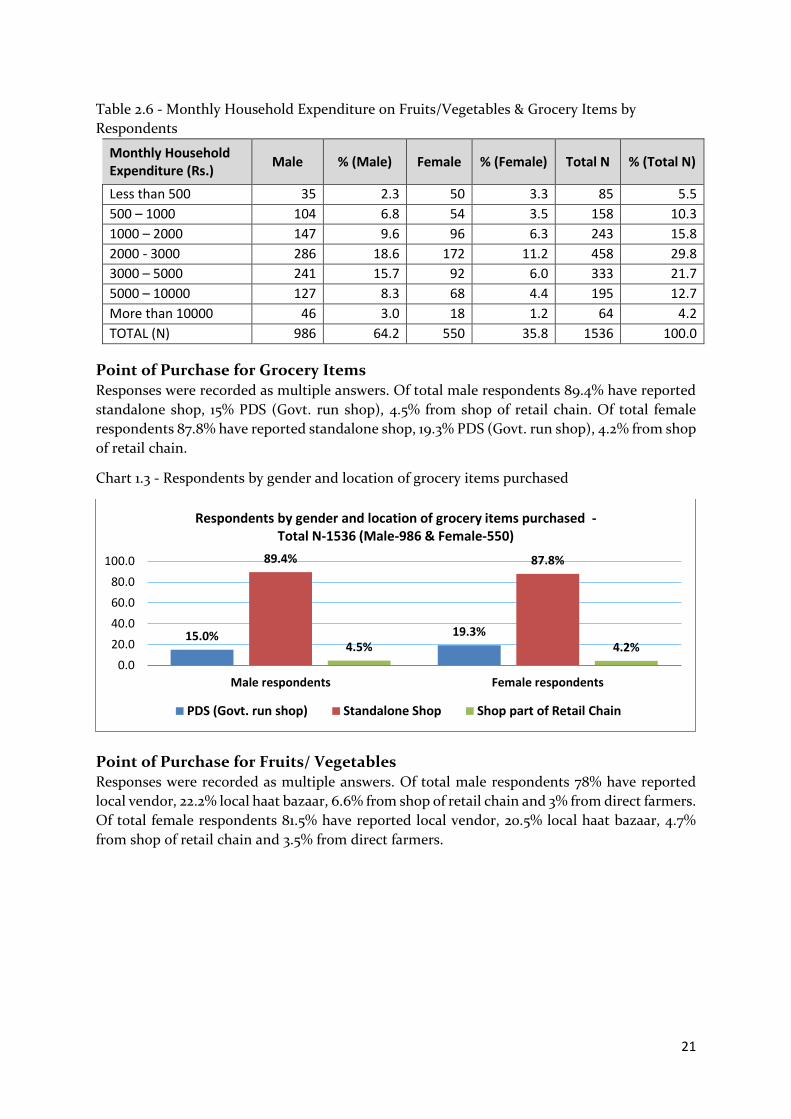
Point of Purchase for Grocery Items Responses were recorded as multiple answers. Of total male respondents 89.4% have reported
standalone shop, 15% PDS (Govt. run shop), 4.5% from shop of retail chain. Of total female
respondents 87.8% have reported standalone shop, 19.3% PDS (Govt. run shop), 4.2% from shop
of retail chain.
Chart 1.3 - Respondents by gender and location of grocery items purchased
Point of Purchase for Fruits/ Vegetables Responses were recorded as multiple answers. Of total male respondents 78% have reported
local vendor, 22.2% local haat bazaar, 6.6% from shop of retail chain and 3% from direct farmers.
Of total female respondents 81.5% have reported local vendor, 20.5% local haat bazaar, 4.7%
from shop of retail chain and 3.5% from direct farmers.
15.0% 19.3%
89.4% 87.8%
4.5% 4.2%
0.0
20.0
40.0
60.0
80.0
100.0
Male respondents Female respondents
Respondents by gender and location of grocery items purchased -Total N-1536 (Male-986 & Female-550)
PDS (Govt. run shop) Standalone Shop Shop part of Retail Chain

22
Chart 1.4 - Respondents by gender and location of fruits/vegetables purchased
Awareness Level of Consumer for Organic Food Products
A broad view of consumer perception, awareness towards organic products was recorded
through sets of question. The obtained responses have helped to identify current level of
awareness, perception and consumption trends for organic products viz. fruits, vegetables and
others.
Responses obtained on awareness towards ill effects of consuming fruits/ vegetable
grown through use of organic fertilizer, pesticides and other in farming.
Chart 1.5 - Awareness towards ill effects of consuming fruits/vegetables grown through use of
inorganic fertilizer, pesticides & other in farming
0.0
20.0
40.0
60.0
80.0
100.0
Male respondent Female respondent
22.2% 20.5%
78.0% 81.5%
6.6% 4.7%3.0% 3.5%
Respondents by gender and location of fruits/vegetables purchased -Total N-1536 (Male-986 & Female-550)
Local Haat Bazar local Vendor Shop part of Retail Chain Direct from Farmers
0
20
40
60
80
Male Respondents Female Respondents Total N (%)
50.5%
27.9%
78.4%
13.7%7.9%
21.6%
Awareness towards ill effects of consuming fruits/vegetables grown through use of inorganic fertilizer, pesticides & other in farming -
Total N-1536 (Male-986 & Female-550)
Yes No
23
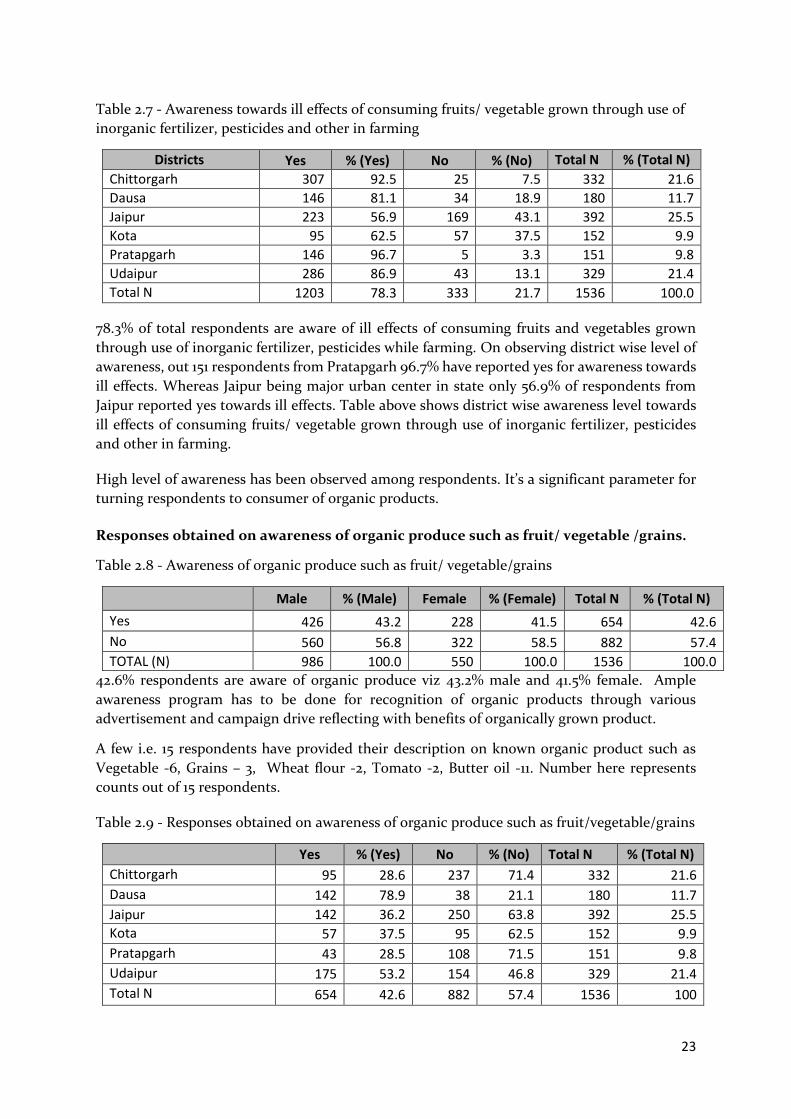
Table 2.7 - Awareness towards ill effects of consuming fruits/ vegetable grown through use of
inorganic fertilizer, pesticides and other in farming
Districts Yes % (Yes) No % (No) Total N % (Total N)
Chittorgarh 307 92.5 25 7.5 332 21.6
Dausa 146 81.1 34 18.9 180 11.7
Jaipur 223 56.9 169 43.1 392 25.5
Kota 95 62.5 57 37.5 152 9.9
Pratapgarh 146 96.7 5 3.3 151 9.8
Udaipur 286 86.9 43 13.1 329 21.4
Total N 1203 78.3 333 21.7 1536 100.0
78.3% of total respondents are aware of ill effects of consuming fruits and vegetables grown
through use of inorganic fertilizer, pesticides while farming. On observing district wise level of
awareness, out 151 respondents from Pratapgarh 96.7% have reported yes for awareness towards
ill effects. Whereas Jaipur being major urban center in state only 56.9% of respondents from
Jaipur reported yes towards ill effects. Table above shows district wise awareness level towards
ill effects of consuming fruits/ vegetable grown through use of inorganic fertilizer, pesticides
and other in farming.
High level of awareness has been observed among respondents. It’s a significant parameter for
turning respondents to consumer of organic products.
Responses obtained on awareness of organic produce such as fruit/ vegetable /grains.
Table 2.8 - Awareness of organic produce such as fruit/ vegetable/grains
Male % (Male) Female % (Female) Total N % (Total N)
Yes 426 43.2 228 41.5 654 42.6
No 560 56.8 322 58.5 882 57.4
TOTAL (N) 986 100.0 550 100.0 1536 100.0
42.6% respondents are aware of organic produce viz 43.2% male and 41.5% female. Ample
awareness program has to be done for recognition of organic products through various
advertisement and campaign drive reflecting with benefits of organically grown product.
A few i.e. 15 respondents have provided their description on known organic product such as
Vegetable -6, Grains – 3, Wheat flour -2, Tomato -2, Butter oil -11. Number here represents
counts out of 15 respondents.
Table 2.9 - Responses obtained on awareness of organic produce such as fruit/vegetable/grains
Yes % (Yes) No % (No) Total N % (Total N)
Chittorgarh 95 28.6 237 71.4 332 21.6
Dausa 142 78.9 38 21.1 180 11.7
Jaipur 142 36.2 250 63.8 392 25.5
Kota 57 37.5 95 62.5 152 9.9
Pratapgarh 43 28.5 108 71.5 151 9.8
Udaipur 175 53.2 154 46.8 329 21.4
Total N 654 42.6 882 57.4 1536 100

24
Awareness level of respondents from Dausa is higher than other districts. 78.9% of respondents
from Dausa reported yes for awareness towards organic produce. Udaipur trailing with 53.2% of
respondents reported yes.
Responses obtained on awareness of organic farming practiced by farmer these days.
42.6% respondents are aware of organic farming practiced by farmers viz 27.8% male and 14.8%
female. Continuous busy life and lack of agricultural practices knowledge consumer aware level
appeared to be low. Popularization of organic farming is much required among consumers.
Chart 1.6 – Awareness of organic farming practiced by farmer
Responses Obtained On Awareness of Organic Product Availability in Market
Table 2.10 – Awareness of Organic Product Availability in Market
Yes % (Yes) No % (No) Total N % (Total N)
Chittorgarh 65 19.6 267 80.4 332 21.6
Dausa 106 58.9 74 41.1 180 11.7
Jaipur 64 16.3 328 83.7 392 25.5
Kota 44 28.9 108 71.1 152 9.9
Pratapgarh 17 11.3 134 88.7 151 9.8
Udaipur 67 20.4 262 79.6 329 21.4
Total N 363 23.6 1173 76.4 1536 100
23.6% i.e. 363 of total respondents are aware of availability of organic products in market. Above
table shows district wise responses of organic product availability in market. Respondents from
Dausa being higher in number of awareness towards organic produce, also higher in awareness
of organic product availability in market i.e. 58.9% of respondents from Dausa.
Same set of respondents have reported that they purchase organic products. Table 2.11 shows
categorized points from where organic products are purchased by same respondents. From
responses it is observed that effective marketing strategy to be developed for significance rise in
0.0
20.0
40.0
60.0
Male RespondentsFemale Respondents Total N (%)
27.8%
14.8%
42.6%36.4%
21.0%
57.4%
Awareness of organic farming practised by farmer -Total N 1536 (Male-986 & Female-550)
Yes No

25
consumer as well as selling points. The table given below shows responses gender wise 251
(25.5%) male and 112 (20.4%) female.
Table 2.11 - Points from where Respondents Purchased Organic Products
Points of Purchase Male % (Male) Female % (Female) Total N (%) Total N
Grocery Shop 108 43.0 50 44.6 158 43.5
Retail Outlets / Company’s Retail Outlets
32 12.7 8 7.1 40 11.0
From Haat Bazaar/ Trade Fair
31 12.4 17 15.2 48 13.2
Never purchased 80 31.9 37 33.0 117 32.2
Total 251 100.0 112 100.0 363 100.0
Same set of respondents were asked on knowledge of fixed/ authorized center or shop for
organic products. 59.5% have reported to be aware of these shops viz 63.7% male and 50%
female. Female centric advertisement is highly required as females can play a lead role in
availing organic products for their family’s well being and good health.
Table 2.12 – Respondents by gender and Awareness of fixed/authorized centre or shop for
organic products
Male % (Male) Female % (Female) Total N % (Total N)
Yes 160 63.7 56 50.0 216 59.5
No 91 36.3 56 50.0 147 40.5
TOTAL (N) 251 100.0 112 100.0 363 100.0
Same respondents were asked how they recognized product to be organic. Responses were
categorized and shown table 2.13 below;
Table 2.13 - Awareness level of Respondents about Recognizing Organic Products
Recognized by Male % (Male) Female % (Female) Total N % (Total N)
By a Label of Organic Certificate on packing
47 18.7 26 23.2 73 20.1
By Descriptions written on packing
38 15.1 20 17.9 58 16.0
Faith on shopkeeper 151 60.2 58 51.8 209 57.6
Other 15 6.0 8 7.1 23 6.3
Total 251 100.0 112 100.0 363 100.0
Table 2.14 shows that 209 (57.6%) respondents purchase organic products on suggestion and
faith in the shopkeeper. The knowledge of labeling and other standard marks is still not relied
upon for the product to be judged as truly organic.

26
Table 2.14 – District wise awareness level of Respondents about Recognizing Organic Products
By a Label of Organic Certificate
on packing
By Descriptions written on packing
Faith on shopkeeper
Other Total N
Nos. % age Nos. % age Nos. % age Nos. % age Nos. % age
Chittorgarh 4 6.2 3 4.6 56 86.2 2 3.1 65 17.9
Dausa 10 9.4 18 17.0 71 67.0 7 6.6 106 29.2
Jaipur 42 65.6 8 12.5 10 15.6 4 6.3 64 17.6
Kota 5 11.4 22 50.0 17 38.6 0 0.0 44 12.1
Pratapgarh 3 17.6 2 11.8 12 70.6 0 0.0 17 4.7
Udaipur 9 13.4 5 7.5 43 64.2 10 14.9 67 18.5
Total N 73 20.1 58 16.0 209 57.6 23 6.3 363 100
District wise trend shows respondents way of recognizing organic products. Jaipur being major
urban center, majorly 65.6% of respondents from Jaipur believe on organic certificate.
Irrespective 57.6% of total respondents replied for faith of shopkeeper.
Responses obtained on considering organic product better than inorganic product
Chart 1.7 – Reason for organic product to be better than inorganic product
1195 (77.8%) of total respondents feels organic product to be better than inorganic product viz.
766 (64.1%) male and 429 (35.9%) female.
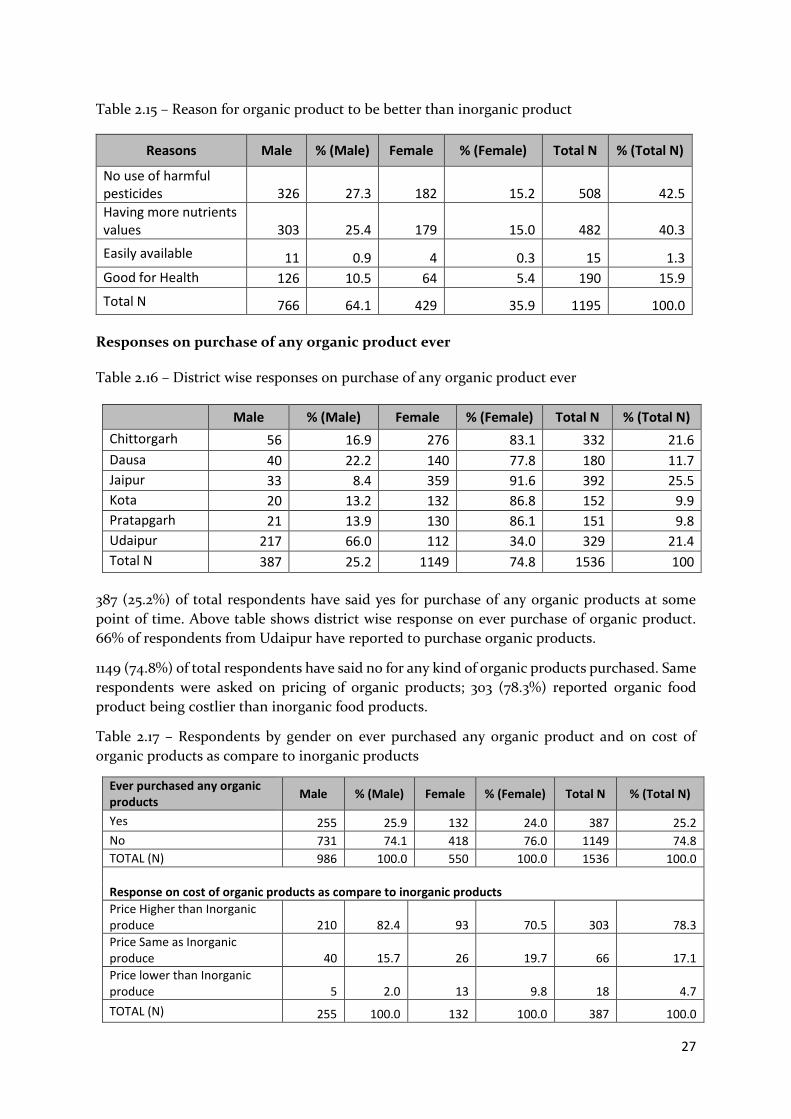
Same respondents have reported reason for organic product to be better. Reason 1- No use of
harmful pesticides (42.5%), reason 2 –having more nutrient value (40.3%), reason 3- Easy
available (1.3%), reason 4 – good for health (15.9%).
27
Table 2.15 – Reason for organic product to be better than inorganic product
Responses on purchase of any organic product ever Table 2.16 – District wise responses on purchase of any organic product ever
Male % (Male) Female % (Female) Total N % (Total N)
Chittorgarh 56 16.9 276 83.1 332 21.6
Dausa 40 22.2 140 77.8 180 11.7
Jaipur 33 8.4 359 91.6 392 25.5
Kota 20 13.2 132 86.8 152 9.9
Pratapgarh 21 13.9 130 86.1 151 9.8
Udaipur 217 66.0 112 34.0 329 21.4
Total N 387 25.2 1149 74.8 1536 100
387 (25.2%) of total respondents have said yes for purchase of any organic products at some
point of time. Above table shows district wise response on ever purchase of organic product.
66% of respondents from Udaipur have reported to purchase organic products.
1149 (74.8%) of total respondents have said no for any kind of organic products purchased. Same
respondents were asked on pricing of organic products; 303 (78.3%) reported organic food
product being costlier than inorganic food products.
Table 2.17 – Respondents by gender on ever purchased any organic product and on cost of
organic products as compare to inorganic products
Ever purchased any organic products
Male % (Male) Female % (Female) Total N % (Total N)
Yes 255 25.9 132 24.0 387 25.2
No 731 74.1 418 76.0 1149 74.8
TOTAL (N) 986 100.0 550 100.0 1536 100.0
Response on cost of organic products as compare to inorganic products
Price Higher than Inorganic produce 210 82.4 93 70.5 303 78.3
Price Same as Inorganic produce 40 15.7 26 19.7 66 17.1
Price lower than Inorganic produce 5 2.0 13 9.8 18 4.7
TOTAL (N) 255 100.0 132 100.0 387 100.0
Reasons Male % (Male) Female % (Female) Total N % (Total N)
No use of harmful pesticides 326 27.3 182 15.2 508 42.5
Having more nutrients values 303 25.4 179 15.0 482 40.3
Easily available 11 0.9 4 0.3 15 1.3
Good for Health 126 10.5 64 5.4 190 15.9
Total N 766 64.1 429 35.9 1195 100.0

28
Same respondents have also replied on reason for not purchased. Table 2.18 – shows the gender
wise reason for never purchasing any organic food product. Major reasons attribute to be
availability (49.3%) and secondly the price of organic food products (46.4%).
Table 2.18 – Respondents by gender on reasons for not purchased of organic food products
Reasons Male % (Male) Female % (Female) Total N % (Total N)
Price 338 46.2 195 46.7 533 46.4
Availability 360 49.2 207 49.5 567 49.3
Not useful 24 3.3 13 3.1 37 3.2
Not sure of actual quality/benefit
9 1.2 3 0.7 12 1.0
Total 731 100.0 418 100.0 1149 100.0
Price (46.4%) and availability (49.3%) comes out to be two major among total respondents for
never purchase of organic product. Jaipur and Kota being prominent city of State responses
recorded shows 87.2% and 83.3% respectively for availability of organic product. Whereas from
other districts response recorded as reason of Price.
Table 2.19 – District wise responses on reasons for not purchased of organic food products
District Price Availability Not useful
Not sure of actual
quality/benefit Total N
Nos. %age Nos. %age Nos. %age Nos. %age Nos. %age
Chittorgarh 241 87.3 18 6.5 17 6.2 0 0 276 24
Dausa 127 90.7 6 4.3 3 2.1 4 2.9 140 12.2
Jaipur 42 11.7 313 87.2 1 0.3 3 0.8 359 31.2
Kota 21 15.9 110 83.3 1 0.8 0 0 132 11.5
Pratapgarh 61 46.9 63 48.5 5 3.8 1 0.8 130 11.3
Udaipur 41 36.6 57 50.9 10 8.9 4 3.6 112 9.7
Total N 533 46.4 567 49.3 37 3.2 12 1.0 1149 100
Responses on technique of recognizing organic products
Responses on technique for recognizing organic product were obtained. 41.5% believe in retailer
statement. 39.5% feel flavor or taste of organic product is better than inorganic. 11.2% believe in
certified organic product. 4.8% on package labeling, 2.9% believe in organic food products only
sold at company outlet or big shops.

29
Chart 1.8 - Responses on technique of recognizing organic products
Chart 1.9 -Respondents by gender and responses on technique of recognizing organic products
Response received on easy availability of organic food products
1142 (74.3%) of total respondent viz 729 (63.84%) male and 413 (36.16%) female, reported that
they never able to find organic product easily. The major reason came from respondents are
categorized gender wise. 65.8% response was low awareness among consumer viz. 66.8% male
and 64.2% female. 26.9% response was less demand of organic product viz. 25.8% male and 28.8
female. 4.8% response was low production of organic product in our region. 2.9% prices are
higher than normal/ inorganic product.
41.5%
11.2%
39.5%
4.8%
2.9%
0.0 10.0 20.0 30.0 40.0 50.0
Belief in retailer/ vendors statement
Certified by a certification agency
Flavour /taste of organic produces is better thanInorganic Produces
Details available on the label/ packing of theproduce
Availability & sale of Organic Produces only inCompany's outlets/ big shops
Techniques for identifying organic products -Total N-1536
27.1%
7.0%
24.8%
3.0% 2.2%
14.4%
4.2%
14.7%
1.8% 0.7%0.0
10.0
20.0
30.0
40.0
50.0
Belief in retailer/vendors statement
Certified by acertification agency
Flavour /taste oforganic produces is
better than InorganicProduces
Details available onthe label/ packing of
the produce
Availability & sale ofOrganic Producesonly in Company'soutlets/ big shops
Techniques for identifying organic products -Total N - 1536
Male Respondents Female Respondents

30
Chart 1.10 – Respondents by gender and reasons for not easy availability of organic products
Reponses received on suggestions for increasing use of organic food products
60% of total respondents have suggested creating awareness among the community. 36.7%
responded to create awareness among farmers.
Only 1.2% have suggested for certification of all organic products.
A better extension program is required to serve the purpose for promoting organic product
among the community and farmers.
Chart 1.11 – Respondents by gender and suggestions to increase use of organic products
0.0
20.0
40.0
60.0
80.0
Male Respondents Female Respondents Total N
25.8% 28.8% 26.9%
66.8% 64.2% 65.8%
3.0% 2.7% 2.9%4.4% 4.4% 4.4%
Respondents by gender and reasons for not easy availability of organic products - Total N-1142 (Male-729 & Female-413)
Less demand of these products Low awareness among consumers
Prices are higher than normal products Low production in our region
61.0% 58.4% 60.0%
35.3%
39.3% 36.7%
2.1%1.5% 1.9%
1.4% 0.7% 1.2%0.2% 0.2% 0.2%0.0
10.0
20.0
30.0
40.0
50.0
60.0
70.0
Male Respondents Female Respondents Total N
Respondents by gender and suggestions to increase use of organic products -Total N-1536 (Male-986 & Female-550)
Create awareness among community Create awareness among farmersPrices of these produces should be reduced Certification on all available organic producesAny Other
31
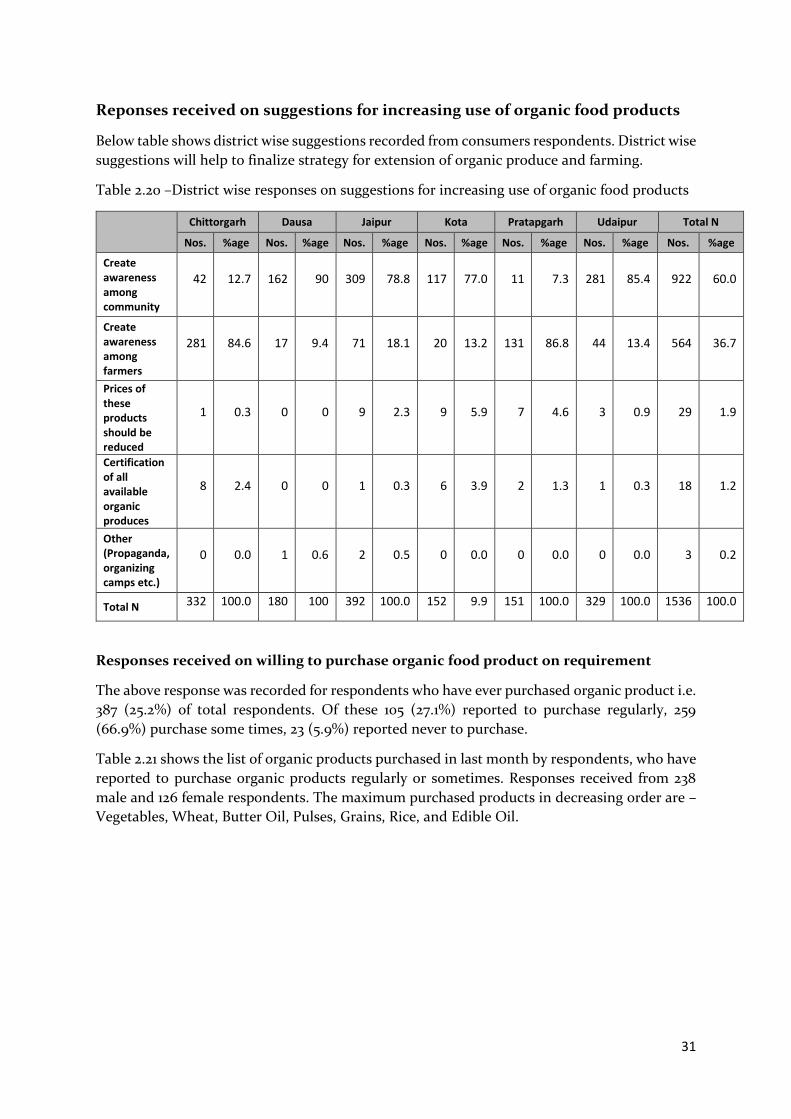
Reponses received on suggestions for increasing use of organic food products
Below table shows district wise suggestions recorded from consumers respondents. District wise
suggestions will help to finalize strategy for extension of organic produce and farming.
Table 2.20 –District wise responses on suggestions for increasing use of organic food products
Chittorgarh Dausa Jaipur Kota Pratapgarh Udaipur Total N
Nos. %age Nos. %age Nos. %age Nos. %age Nos. %age Nos. %age Nos. %age
Create awareness among community
42 12.7 162 90 309 78.8 117 77.0 11 7.3 281 85.4 922 60.0
Create awareness among farmers
281 84.6 17 9.4 71 18.1 20 13.2 131 86.8 44 13.4 564 36.7
Prices of these products should be reduced
1 0.3 0 0 9 2.3 9 5.9 7 4.6 3 0.9 29 1.9
Certification of all available organic produces
8 2.4 0 0 1 0.3 6 3.9 2 1.3 1 0.3 18 1.2
Other (Propaganda, organizing camps etc.)
0 0.0 1 0.6 2 0.5 0 0.0 0 0.0 0 0.0 3 0.2
Total N 332 100.0 180 100 392 100.0 152 9.9 151 100.0 329 100.0 1536 100.0
Responses received on willing to purchase organic food product on requirement
The above response was recorded for respondents who have ever purchased organic product i.e.
387 (25.2%) of total respondents. Of these 105 (27.1%) reported to purchase regularly, 259
(66.9%) purchase some times, 23 (5.9%) reported never to purchase.
Table 2.21 shows the list of organic products purchased in last month by respondents, who have
reported to purchase organic products regularly or sometimes. Responses received from 238
male and 126 female respondents. The maximum purchased products in decreasing order are –
Vegetables, Wheat, Butter Oil, Pulses, Grains, Rice, and Edible Oil.

32
Table 2.21 – List of organic products purchased in last one month
Organic Product Male respondents
Female respondents
Vegetables 63.45% 65.87%
Wheat 31.93% 31.75%
Butter Oil 27.73% 30.16%
Pulses 19.75% 19.05%
Grains 18.49% 15.08%
Rice 12.61% 10.32%
Edible Oil 11.76% 9.52%
Milk 10.50% 11.90%
Fruits 7.14% 5.56%
Not Responded 2.10% 2.38%
Tomato 1.68% 1.59%
Gram 1.26% 0.00%
Mustard 1.26% 0.00%
Oats 0.84% 0.79%
Spices 0.84% 0.79%
Barley 0.42% 0.00%
Cauliflower 0.42% 1.59%
Peas 0.42% 1.59%
Consumer responded on satisfaction level from quality of organic products
60.7% of respondents who have bought organic food products replied YES majorly, who has
shown willingness to purchase organic product. Secondly YES in minority was replied by 39%.
Only 1 respondent has reported being cheated by the farmer/ shopkeeper.
Chart 1.12 – Respondents by gender and satisfaction level from quality of organic products
0.0
10.0
20.0
30.0
40.0
50.0
60.0
70.0
Male Respondents Female Respondents Total N
63.4%55.6% 60.7%
36.6%43.7%
39.0%
0.0% 0.7% 0.3%
Respondents by gender and satisfaction level from quality of organic products -Total N-364 (Male-238 & Female-126)
Yes, Majorly Yes, minorly No, Farmer / Shopkeeper cheated

33
Below chart shows district wise satisfaction level of consumer from organic products. Udaipur
has shown higher (42.6%) of consumer to be satisfied. This higher value is observed as Udaipur
also higher number of consumer than other districts.
Chart 1.13 – District wise responses on satisfaction level from quality of organic products
Consumer responded on certification of organic product to be mandatory
98.6% of respondent who have shown willingness to purchase organic product replied YES. Chart 1.14 – Respondents by gender and whether certification made mandatory
0.0
10.0
20.0
30.0
40.0
50.0
Chittorgarh Dausa Jaipur Kota Pratapgarh Udaipur
3.0% 4.7%7.4%
2.7% 0.3%
42.6%
10.2%5.8%
0.8% 2.7% 4.1%
15.4%
0.0% 0.0% 0.0% 0.0% 0.0% 0.3%
Satisfaction level from quality of organic products - Total N - 364
Yes, Majorly Yes, Minorly No, Farmer/ shopkeeper cheated
0.0
20.0
40.0
60.0
80.0
100.0
Male Respondents Female Respondents TOTAL N
64.8%
33.8%
98.6%
0.6% 0.8% 1.4%
Respondents by gender and whether certification made mandatory -Total N-364 (Male-238 & Female-126)
Yes No

34
Consumer responded on suggesting use of organic products to others
93.1% of respondent who have shown willingness to purchase organic product replied YES.
Chart 1.15 – Respondents by gender and whether recommend organic products to others
0.0
20.0
40.0
60.0
80.0
100.0
Male Respondents Female Respondents TOTAL N
61.2%
31.9%
93.1%
4.2% 2.7% 6.9%
Respondents by gender and whether recommend organic products to others -Total N-364 (Male-238 & Female-126)
Yes No

35
2.2 Perception of Farmers towards Organic Farming Total 1529 responses have been recorded to study the perception of farmers in six districts of
Rajasthan. Of total responses 64.03% respondents were male and 35.97% were female
respondents. Below table 2.22 shows district wise and gender wise counts of respondents.
Table 2.22 - Gender and district wise number of responses.
District Male % (Male) Female % (Female) Total N % (Total N)
Jaipur 276 18.05 113 7.39 389 25.44
Dausa 105 6.87 75 4.91 180 11.77
Udaipur 209 13.67 121 7.91 330 21.58
Chittorgarh 208 13.60 120 7.85 328 21.45
Pratapgarh 93 6.08 58 3.79 151 9.88
Kota 88 5.76 63 4.12 151 9.88
Total N 979 64.03 550 35.97 1529 100
Socio –Economic Profile of Farmers A broad view of socio-economic parameters of the respondents are studied here included age,
education, current activity, religion, economic status, monthly income and trend followed were
some other variables studied as they have significant impact on decision making of the farmers.
Age of Respondents Age of the farmers is a major determinant in taking innovative decisions by them. The younger
ones are generally expected to respond react and adapt faster than their elder counterparts.
Table 2.23 shows the respondents with age class and gender wise. 54.15% respondents are of age
category 30-50 years.
Table 2.23 - Age wise and gender wise percentages of respondents
Age Group Male % (Male) Female % (Female) Total N % (Total N)
Below 20 yrs 9 0.59 10 0.65 19 1.24
20-30yrs 125 8.18 83 5.43 208 13.60
30-40yrs 229 14.98 179 11.71 408 26.68
40-50yrs 282 18.44 138 9.03 420 27.47
Above 50yrs 332 21.71 139 9.09 471 30.80
Not Known 2 0.13 1 0.07 3 0.20
Total 979 64.03 550 35.97 1529 100.00
Education Level
The distribution of farmers on the basis of their formal educational qualification is presented in
Table 2.24. Of total respondents 49.38% have never attended school which corresponds to
24.59% male and 24.79% female. Table 2.24 below shows education qualification and gender
wise counts of respondent’s educational level plays an important role towards the awareness to
the various issues, capability of decision making.

36
Table 2.24 - Educational qualifications wise details of respondents
Educational Qualifications
Male % (Male) Female % (Female) Total N % (Total N)
Never attended school 376 24.59 379 24.79 755 49.38
Primary Education 226 14.78 79 5.17 305 19.95
Middle School (8th) 141 9.22 37 2.42 178 11.64
High school (10th) 114 7.46 37 2.42 151 9.88
Senior Secondary 54 3.53 5 0.33 59 3.86
Graduation 52 3.40 10 0.65 62 4.05
Post-Graduation 16 1.05 3 0.20 19 1.24
Professional Degree 0 0.00 0 0.00 0 0.00
Total (N) 979 64.03 550 35.97 1529 100.00
Current Activity
The distribution of farmers on the basis of their current activity as farming and farm Labour in
Table 2.25. Farming class respondents attribute to 97.65% of all responses viz. 97.85% male and
97.27% female.
Table 2.25- Status of Current Activities
Status of Current Activities
Male % (Male) Female % (Female) Total N % (Total N)
Farming 958 97.85 535 97.27 1493 97.65
Farm- Labour 21 2.15 15 2.73 36 2.35
Total (N) 979 100.00 550 100.00 1529 100.00
Economic Status
Economic status has been captured through type of ration card and other documents like BPL
card or on door marking or as per status claimed by the respondents. Accordingly, the
respondents were classified into Above Poverty Line (APL) and Below Poverty Line (BPL). The
ratio of APL: BPL is 73.5:26.5. Whereas gender wise; male ratio is 74.1: 25.9 and female ratio 72.5:
27.5.
Chart 1.16 – Gender wise economic status of respondents
0.0
20.0
40.0
60.0
80.0
100.0
Male Respondents Female Respondents Total N
74.1% 72.5% 73.5%
25.9% 27.5% 26.5%
Gender wise economic status of respondents -Total N-1529 (Male-979 & Female-550)
APL BPL

37
Table 2.26 – District wise economic status of respondents
District APL % (APL) BPL % (BPL) Total % (Total)
Chittorgarh 289 88.1 39 11.9 328 21.5
Dausa 149 82.8 31 17.2 180 11.8
Jaipur 343 88.2 46 11.8 389 25.4
Kota 129 85.4 22 14.6 151 9.9
Pratapgarh 109 72.2 42 27.8 151 9.9
Udaipur 105 31.8 225 68.2 330 21.6
Total 1124 73.5 405 26.5 1529 100
District wise comparison of economic status of farmer is shown in table above. It is observed
that 88.2 % of respondents in Jaipur were of above poverty line ration card holder. Whereas 68.2
of respondents in Udaipur were of below poverty line ration card holder.
Monthly Household Income
The distribution of famer on the basis of their monthly income is presented in Chart 1.17. Max
1077 (70.44%) farmers have monthly income below Rupees 5000. Monthly household income is
major concern for farmer to adopt for organic farming.
Chart 1.17 - Monthly household income of farmers
Awareness Level of Farmer for Organic Farming Techniques and Practices A broad view of farmer perception and awareness towards organic products was recorded
through sets of question. The obtained responses have helped to identify current level of
awareness, perception and farming trends for organic products.
Responses obtained on type of fertilizer / pesticide / weedicide used
2.8% of total respondents have reported to use only organic type whereas 39.2% have reported
use of chemical base. Although maximum 57.9% have reported to use mix of both organic and
chemical.
44.5%
25.9%
70.4%
15.1%8.3%
23.4%
2.6% 1.2% 3.8%1.0%0.3% 1.3%0.7%
0.1% 0.7%0.2%0.1% 0.3%
0.0
20.0
40.0
60.0
80.0
Male Respondents Female Respondents Total N
Monthly household income of farmers -Total N-1529 (Male-979 & Female-550)
Below 5000 5000 -10000 10000-15000 15000 -20000 20000-25000 25000 and above

38
Chart 1.18 – Type of fertilizer/ pesticide/ weedicide used
Table 2.27 – District wise details of types of fertilizer/pesticide/weedicide used
District Chemical base Organic Both None of these Total N
Nos. %age Nos. %age Nos. %age Nos. %age Nos. %age
Chittorgarh 165 50.3 0 0.0 162 49.4 1 0.3 328 21.5
Dausa 86 47.8 5 2.8 89 49.4 0 0.0 180 11.8
Jaipur 177 45.5 17 4.4 195 50.1 0 0.0 389 25.4
Kota 73 48.3 0 0.0 78 51.7 0 0.0 151 9.9
Pratapgarh 54 35.8 0 0.0 97 64.2 0 0.0 151 9.9
Udaipur 44 13.3 21 6.4 265 80.3 0 0.0 330 21.6
Total N 599 39.2 43 2.8 886 57.9 1 0.1 1529 100
On district wise comparison of type of fertilizer /pesticide / weedicide used it is observed that
in Udaipur 80.3% of respondents have reported to use both, whereas chemical only 13.3% of
respondents which shows a higher number of farmers utilizing and aware of organic fertilizer /
pesticide /weedicide then other districts. Comparison is shown in table above.
Table 2.28 below shows list of material used.
Table -2.28 – List of material used on farming such as fertilizer/ pesticide / weedicide
Material % Male % Female % Total
Manure 28.85% 27.21% 28.28%
Urea 36.27% 38.15% 36.92%
DAP 32.00% 32.68% 32.24%
Potash 0.70% 0.66% 0.68%
Zinc 0.89% 0.66% 0.81%
Ash 0.31% 0.22% 0.28%
Super Phosphate 0.62% 0.36% 0.53%
Neem Leaves 0.19% 0.07% 0.15%
Vermi Compost 0.16% 0.00% 0.10%
0.0
20.0
40.0
60.0
Male Respondents Female Respondents Total N
23.4%15.8%
39.2%
1.8% 1.0% 2.8%
38.8%
19.2%
57.9%
Type of fertilizer/ pesticide/ weedicide used -Total N-1529 (Male-979 & Female-550)
Chemical base Organic Both
39
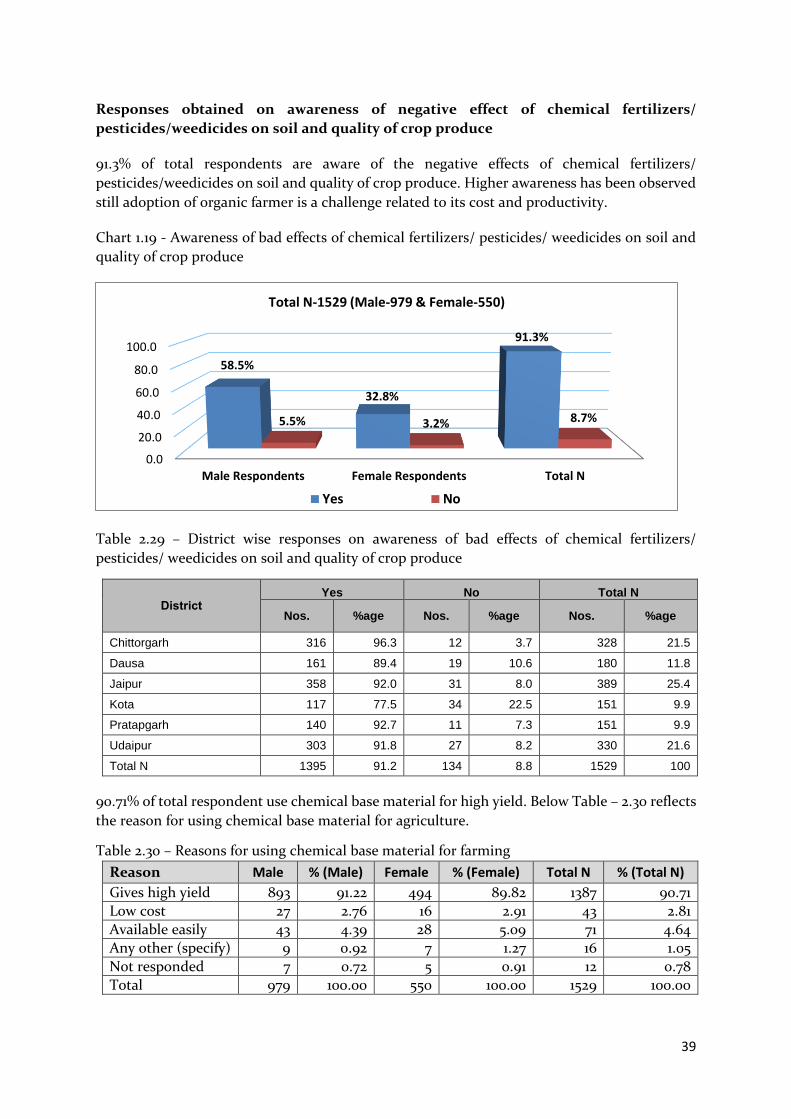
Responses obtained on awareness of negative effect of chemical fertilizers/
pesticides/weedicides on soil and quality of crop produce
91.3% of total respondents are aware of the negative effects of chemical fertilizers/
pesticides/weedicides on soil and quality of crop produce. Higher awareness has been observed
still adoption of organic farmer is a challenge related to its cost and productivity.
Chart 1.19 - Awareness of bad effects of chemical fertilizers/ pesticides/ weedicides on soil and
quality of crop produce
Table 2.29 – District wise responses on awareness of bad effects of chemical fertilizers/
pesticides/ weedicides on soil and quality of crop produce
District Yes No Total N
Nos. %age Nos. %age Nos. %age
Chittorgarh 316 96.3 12 3.7 328 21.5
Dausa 161 89.4 19 10.6 180 11.8
Jaipur 358 92.0 31 8.0 389 25.4
Kota 117 77.5 34 22.5 151 9.9
Pratapgarh 140 92.7 11 7.3 151 9.9
Udaipur 303 91.8 27 8.2 330 21.6
Total N 1395 91.2 134 8.8 1529 100
90.71% of total respondent use chemical base material for high yield. Below Table – 2.30 reflects
the reason for using chemical base material for agriculture.
Table 2.30 – Reasons for using chemical base material for farming
Reason Male % (Male) Female % (Female) Total N % (Total N)
Gives high yield 893 91.22 494 89.82 1387 90.71
Low cost 27 2.76 16 2.91 43 2.81
Available easily 43 4.39 28 5.09 71 4.64
Any other (specify) 9 0.92 7 1.27 16 1.05
Not responded 7 0.72 5 0.91 12 0.78
Total 979 100.00 550 100.00 1529 100.00
0.0
20.0
40.0
60.0
80.0
100.0
Male Respondents Female Respondents Total N
58.5%
32.8%
91.3%
5.5% 3.2% 8.7%
Total N-1529 (Male-979 & Female-550)
Yes No

40
1086 (71.03%) of respondents are aware that farmers these days are engaged in organic farming
of vegetable / fruits / grain and others. Higher replication is possible for organic farming
through various extension services model such farm visit, success stories and learning through
videos.
Responses obtained on organic food to be healthier than normal food
1388 (90.8%) respondents believed that organic food to be better than normal food. Strong
flavor and awareness of health benefits of organic foods can motivate farmers to adapt organic
farming.
Chart 1.20 - Whether organic foods are healthier than normal foods
Same respondent where further asked on the reasons of organic food to be better than normal
food. Multiple responses were recorded.
59.3% and 59.7% respondents have reported organic product better due to no use of harmful
pesticides and good for health respectively. 39.8% respondents belived that organic foods have
more nutrients value than other foods.
Chart 1.21 - Awareness of benefits of organic products
0.0
20.0
40.0
60.0
80.0
100.0
Male Respondents Female Respondents Total N
58.5%
32.2%
90.8%
5.5% 3.7% 9.2%
Whether organic foods are healthier than normal foods -Total N-1529 (Male-979 & Female-550)
Yes No
61.5% 56.6% 59.7%
38.4% 42.2% 39.8%
4.5% 4.5% 4.5%
60.3% 57.4% 59.3%
2.2% 2.4% 2.3%
0.0
10.0
20.0
30.0
40.0
50.0
60.0
70.0
Male Respondents Female Respondents Total N
Awareness of benefits of organic products -Total N-1388 (Male-895 & Female-493)
No use of harmful pesticides Having more nutrients values easily available
41
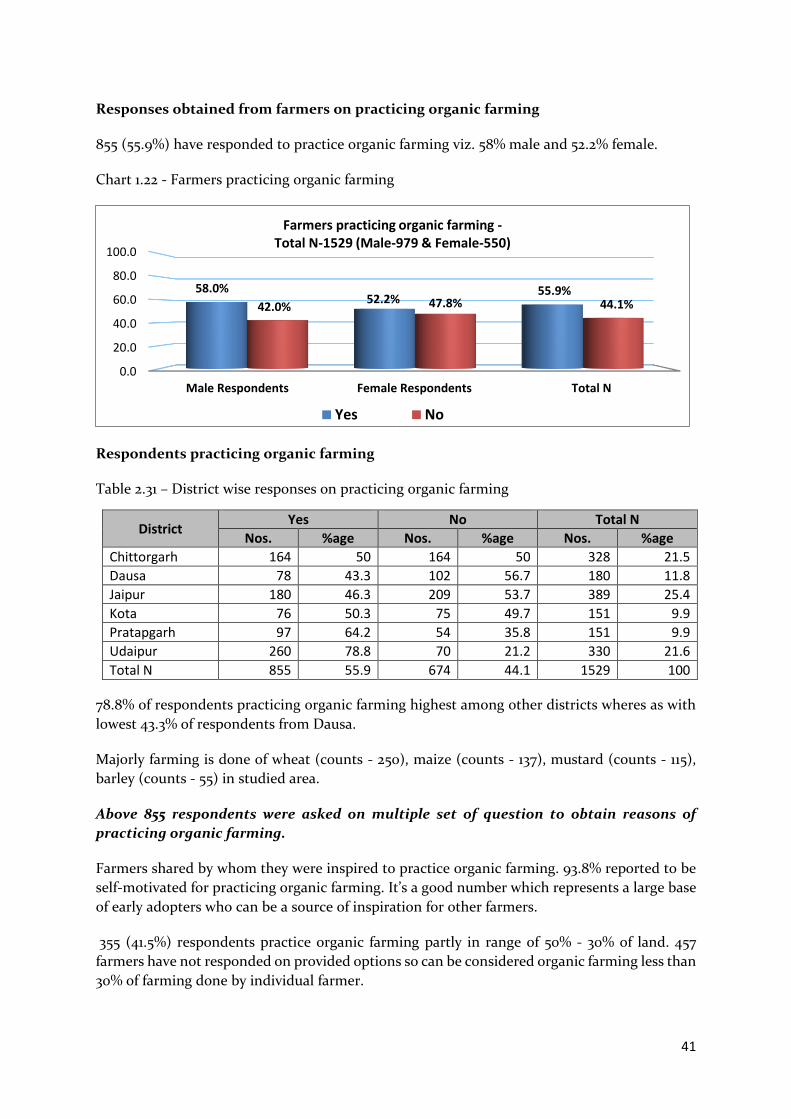
Responses obtained from farmers on practicing organic farming
855 (55.9%) have responded to practice organic farming viz. 58% male and 52.2% female.
Chart 1.22 - Farmers practicing organic farming
Respondents practicing organic farming
Table 2.31 – District wise responses on practicing organic farming
District Yes No Total N
Nos. %age Nos. %age Nos. %age
Chittorgarh 164 50 164 50 328 21.5
Dausa 78 43.3 102 56.7 180 11.8
Jaipur 180 46.3 209 53.7 389 25.4
Kota 76 50.3 75 49.7 151 9.9
Pratapgarh 97 64.2 54 35.8 151 9.9
Udaipur 260 78.8 70 21.2 330 21.6
Total N 855 55.9 674 44.1 1529 100
78.8% of respondents practicing organic farming highest among other districts wheres as with
lowest 43.3% of respondents from Dausa.
Majorly farming is done of wheat (counts - 250), maize (counts - 137), mustard (counts - 115),
barley (counts - 55) in studied area.
Above 855 respondents were asked on multiple set of question to obtain reasons of
practicing organic farming.
Farmers shared by whom they were inspired to practice organic farming. 93.8% reported to be
self-motivated for practicing organic farming. It’s a good number which represents a large base
of early adopters who can be a source of inspiration for other farmers.
355 (41.5%) respondents practice organic farming partly in range of 50% - 30% of land. 457
farmers have not responded on provided options so can be considered organic farming less than
30% of farming done by individual farmer.
0.0
20.0
40.0
60.0
80.0
100.0
Male Respondents Female Respondents Total N
58.0%52.2%
55.9%42.0% 47.8% 44.1%
Farmers practicing organic farming -Total N-1529 (Male-979 & Female-550)
Yes No
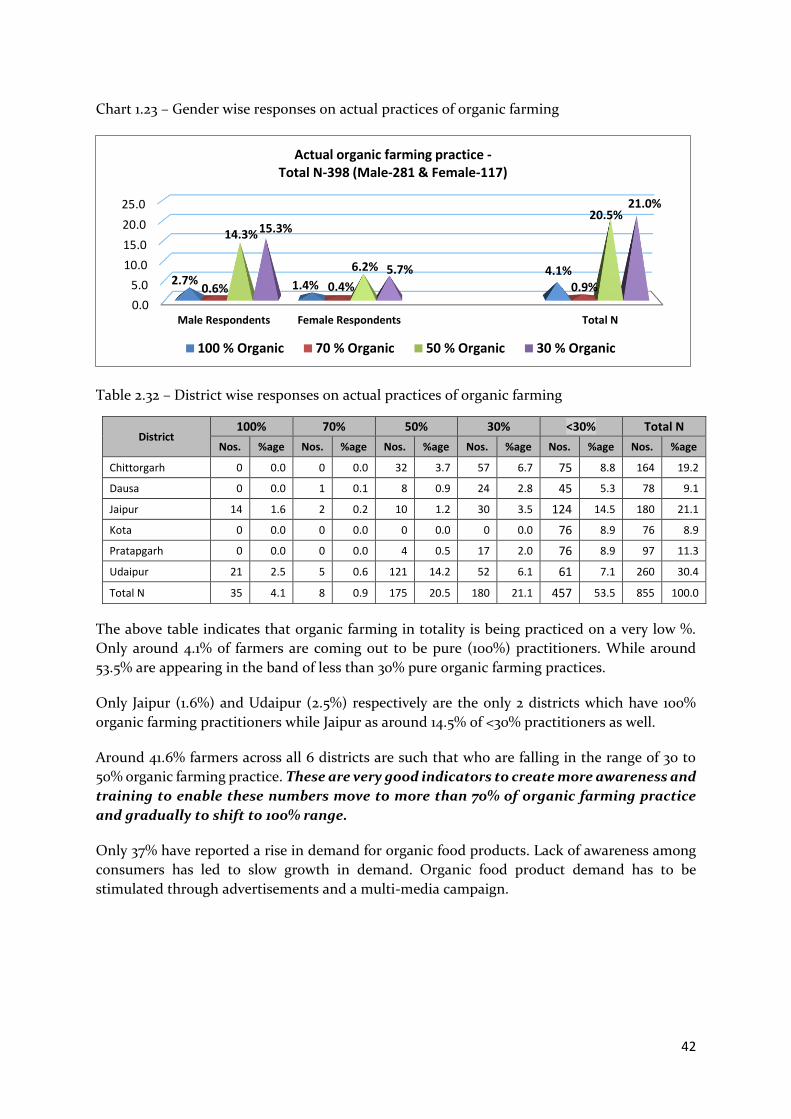
42
Chart 1.23 – Gender wise responses on actual practices of organic farming
Table 2.32 – District wise responses on actual practices of organic farming
District 100% 70% 50% 30% <30% Total N
Nos. %age Nos. %age Nos. %age Nos. %age Nos. %age Nos. %age
Chittorgarh 0 0.0 0 0.0 32 3.7 57 6.7 75 8.8 164 19.2
Dausa 0 0.0 1 0.1 8 0.9 24 2.8 45 5.3 78 9.1
Jaipur 14 1.6 2 0.2 10 1.2 30 3.5 124 14.5 180 21.1
Kota 0 0.0 0 0.0 0 0.0 0 0.0 76 8.9 76 8.9
Pratapgarh 0 0.0 0 0.0 4 0.5 17 2.0 76 8.9 97 11.3
Udaipur 21 2.5 5 0.6 121 14.2 52 6.1 61 7.1 260 30.4
Total N 35 4.1 8 0.9 175 20.5 180 21.1 457 53.5 855 100.0
The above table indicates that organic farming in totality is being practiced on a very low %.
Only around 4.1% of farmers are coming out to be pure (100%) practitioners. While around
53.5% are appearing in the band of less than 30% pure organic farming practices.
Only Jaipur (1.6%) and Udaipur (2.5%) respectively are the only 2 districts which have 100%
organic farming practitioners while Jaipur as around 14.5% of <30% practitioners as well.
Around 41.6% farmers across all 6 districts are such that who are falling in the range of 30 to
50% organic farming practice. These are very good indicators to create more awareness and
training to enable these numbers move to more than 70% of organic farming practice
and gradually to shift to 100% range.
Only 37% have reported a rise in demand for organic food products. Lack of awareness among
consumers has led to slow growth in demand. Organic food product demand has to be
stimulated through advertisements and a multi-media campaign.
0.0
5.0
10.0
15.0
20.0
25.0
Male Respondents Female Respondents Total N
2.7% 1.4%4.1%
0.6% 0.4% 0.9%
14.3%
6.2%
20.5%15.3%
5.7%
21.0%
Actual organic farming practice -Total N-398 (Male-281 & Female-117)
100 % Organic 70 % Organic 50 % Organic 30 % Organic

43
Chart 1.24 - Farmers response on rise of organic product demand
Response received from farmers who believed that cost of organic farming is comparatively low.
49.8% have responded ‘Other’ when providing details on how much organic farming costs less
than traditional farming. Table 2.33 below shows other responses categorized in ‘60% to 40%
less cost’ than normal farming.
Table 2.33 - Responses on less cost of organic farming compared to traditional farming
practice
Less Cost Male % (Male) Female % (Female) Total N % (Total N)
60% 31 5.5 15 5.2 46 5.4
50% 86 15.1 41 14.3 127 14.9
40% 166 29.2 90 31.4 256 29.9
Other 285 50.2 141 49.1 426 49.8
Total 568 100.0 287 100.0 855 100.0
Chart 1.25 – Responses on less cost of organic farming compared to traditional farming
practice
92.4% of farmers practicing organic farming responded that they have never received any
training on organic farming. While surveying, the need for training for organic cultivation came
to light.
0.00
20.00
40.00
60.00
80.00
Male Respondents Female Respondents Total N
25.7%
11.3%
37.0%40.8%
22.2%
63.0%
Farmers response on rise of organic product demand -Total N-855 (Male-568 & Female-287)
Yes No
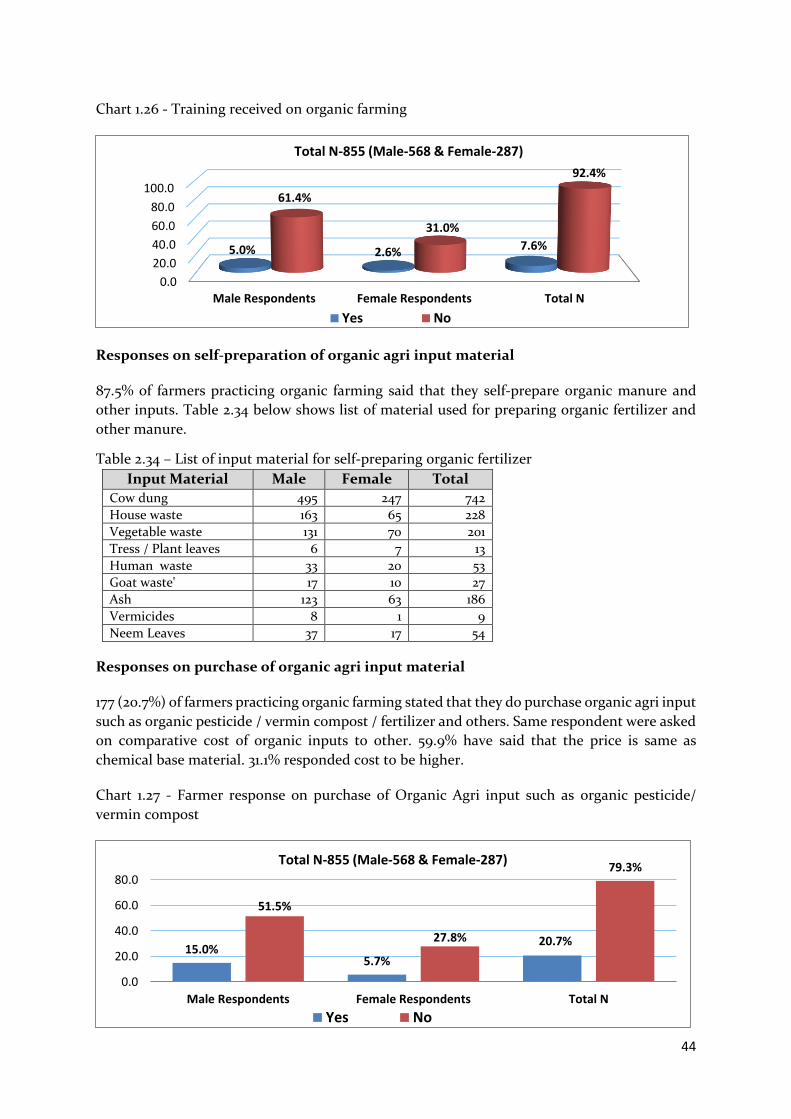
44
Chart 1.26 - Training received on organic farming
Responses on self-preparation of organic agri input material
87.5% of farmers practicing organic farming said that they self-prepare organic manure and
other inputs. Table 2.34 below shows list of material used for preparing organic fertilizer and
other manure.
Table 2.34 – List of input material for self-preparing organic fertilizer
Input Material Male Female Total
Cow dung 495 247 742
House waste 163 65 228
Vegetable waste 131 70 201
Tress / Plant leaves 6 7 13
Human waste 33 20 53
Goat waste' 17 10 27
Ash 123 63 186
Vermicides 8 1 9
Neem Leaves 37 17 54
Responses on purchase of organic agri input material
177 (20.7%) of farmers practicing organic farming stated that they do purchase organic agri input
such as organic pesticide / vermin compost / fertilizer and others. Same respondent were asked
on comparative cost of organic inputs to other. 59.9% have said that the price is same as
chemical base material. 31.1% responded cost to be higher.
Chart 1.27 - Farmer response on purchase of Organic Agri input such as organic pesticide/
vermin compost
0.0
20.0
40.0
60.0
80.0
100.0
Male Respondents Female Respondents Total N
5.0% 2.6% 7.6%
61.4%
31.0%
92.4%
Total N-855 (Male-568 & Female-287)
Yes No
15.0%5.7%
20.7%
51.5%
27.8%
79.3%
0.0
20.0
40.0
60.0
80.0
Male Respondents Female Respondents Total N
Total N-855 (Male-568 & Female-287)
Yes No

45
Table 2.35 – Response on higher cost of organic agri inputs
Higher cost of organic agri inputs
Male % (Male) Female % (Female) Total N % (Total N)
Price higher than chemical base material
38 29.7 17 34.7 55 31.1
Price same as chemical base material
78 60.9 28 57.1 106 59.9
Price lower than chemical base material
12 9.4 4 8.2 16 9.0
Total 128 100.0 49 100.0 177 100.0
62.1% of farmer purchasing organic agri inputs responded that they are using organic material
from more than five years. 15.82% responded to use from last 1-2 years.
Chart 1.28 - Years of use of organic inputs in farming
Responses received from farmer practicing organic farming on receiving any discount /
training / assistance
Chart 1.29 – Response on assistance received from any Govt. agency
6.8%2.2%
9.0%8.5% 7.3%15.8%
9.0%4.0%
13.0%
48.0%
14.1%
62.1%
0.0
20.0
40.0
60.0
80.0
Male Respondents Female Respondents Total N
Years of use of organic inputs in farming -Total N-177 (Male-128 & Female-49)
0-1 year 1-2 years 2-5 years More than 5 years
0.0
1.0
2.0
3.0
4.0
Male Respondents Female Respondents Total N
2.7%
0.8%
3.5%
0.2% 0.1%0.3%0.2%
0.0%0.2%
Assistance received (agency wise) -Total N-855 (Male-568 & Female-287)
State Government NABARD National Horticulture Mission

46
Out of 855 farmers only 3.5% reported to receiving some kind of discount/ training/ assistance
from one of the mentioned agencies. 4% farmers are very few in respect to total farmers
practicing organic farming.
30 farmers have received assistance from state government. Only 8 farmers have responded on
amount they received as assistance i.e. below Rs. 10000. Table 2.36 shows responses on coverage
of additional cost through assistance and time of assistance received. Majorly 18 farmer
responses that assistance amount covers cost to some extent. 22 farmers have responded to
receive assistance amount before buying the organic inputs.
Table 2.36 – Responses on coverage of additional cost from assistance and time of assistance received
Assistance cover additional cost
Male Female Total Time of receiving assistance
Male Female Total
Yes, all additional costs
7 1 8 Before buying the organics inputs
17 5 22
Some additional costs
14 4 18 After using the organic inputs on the field
5 1 6
Subsidy is very less
6 3 9 After cultivation 5 2 7
Total 27 8 35 Total 27 8 35
Responses received from farmer practicing organic farming on awareness of farmers
club and organic produce certification
Out 855 farmers practicing organic farming, 215 (25.1%) farmers are aware of farmers club. Out
of 215 (25.2%) farmers only 27 (3.2%) have responded as being a member of farmers club.
Chart 1.30 – Gender wise response on awareness of farmer’s club
More farmers have to be linked with farmers club. Farmer’s club act as resource centers for
farmer connecting them with new technology and other support systems.
16.0%6.0%
22.0%
2.5% 0.7% 3.2%
48.0%
26.9%
74.9%
0.0
20.0
40.0
60.0
80.0
Male Respondents Female Respondents Total N
Awareness of farmer's club -Total N-855 (Male-568 & Female-287)
Yes Yes, I am a member also No
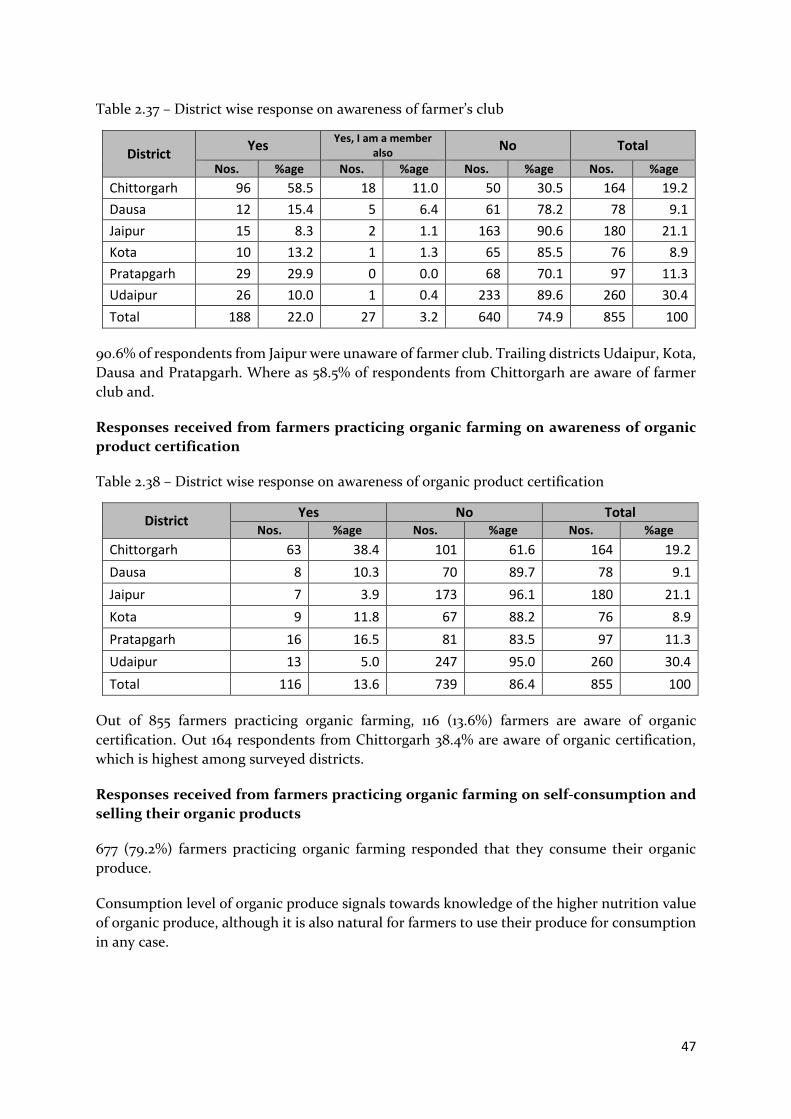
47
Table 2.37 – District wise response on awareness of farmer’s club
District Yes
Yes, I am a member also No Total
Nos. %age Nos. %age Nos. %age Nos. %age
Chittorgarh 96 58.5 18 11.0 50 30.5 164 19.2
Dausa 12 15.4 5 6.4 61 78.2 78 9.1
Jaipur 15 8.3 2 1.1 163 90.6 180 21.1
Kota 10 13.2 1 1.3 65 85.5 76 8.9
Pratapgarh 29 29.9 0 0.0 68 70.1 97 11.3
Udaipur 26 10.0 1 0.4 233 89.6 260 30.4
Total 188 22.0 27 3.2 640 74.9 855 100
90.6% of respondents from Jaipur were unaware of farmer club. Trailing districts Udaipur, Kota,
Dausa and Pratapgarh. Where as 58.5% of respondents from Chittorgarh are aware of farmer
club and.
Responses received from farmers practicing organic farming on awareness of organic
product certification
Table 2.38 – District wise response on awareness of organic product certification
District Yes No Total
Nos. %age Nos. %age Nos. %age
Chittorgarh 63 38.4 101 61.6 164 19.2
Dausa 8 10.3 70 89.7 78 9.1
Jaipur 7 3.9 173 96.1 180 21.1
Kota 9 11.8 67 88.2 76 8.9
Pratapgarh 16 16.5 81 83.5 97 11.3
Udaipur 13 5.0 247 95.0 260 30.4
Total 116 13.6 739 86.4 855 100
Out of 855 farmers practicing organic farming, 116 (13.6%) farmers are aware of organic
certification. Out 164 respondents from Chittorgarh 38.4% are aware of organic certification,
which is highest among surveyed districts.
Responses received from farmers practicing organic farming on self-consumption and
selling their organic products
677 (79.2%) farmers practicing organic farming responded that they consume their organic
produce.
Consumption level of organic produce signals towards knowledge of the higher nutrition value
of organic produce, although it is also natural for farmers to use their produce for consumption
in any case.

48
Chart 1.31 - Farmers response on self consumption of their organic produce
580 (67.8%) farmers practicing organic farming responded that they do not face any challenges
in marketing and selling of their organic produce.
129 (15.1%) have responded that they do receive higher value for their organic produce than
normal produce. This statistic point towards an unclear value proposition for the farmers, where
they are unsure of monetary gains from organic farming.
Chart 1.32 – Response on received higher value of organic product than normal product
Responses from 726 (84.9%) farmers responded that they do not receive higher value for their
organic produce. The reasons for low value to their product are categorized in table 2.39. 40.8%
have reported it’s due to less awareness among consumer and 39.1% for tepid demand of organic
products.
Table 2.39 – Responses on reason for not getting higher value for organic produce
Reason Male % (Male) Female % (Female) Total N % (Total N)
Less demand of these products
179 37.6 105 42 284 39.1
Low awareness among consumers
206 43.3 90 36 296 40.8
Prices higher than normal products
28 5.9 22 8.8 50 6.9
Low production in our region
63 13.2 33 13.2 96 13.2
Total 476 100.0 250 100 726 100.0
53.1%
26.1%
79.2%
13.3%7.5%
20.8%
0.0
20.0
40.0
60.0
80.0
100.0
Male Respondents Female Respondents Total N
Farmers response on self consumption of their organic produce -Total N-855 (Male-568 & Female-287)
Yes No
0.0
30.0
60.0
90.0
Male Respondents Female Respondents Total N
10.8% 4.3% 15.1%
55.7%
29.2%
84.9%
Total N-855 (Male-568 & female-287)
Yes No

49
Responses received from farmers practicing organic farming on the quality of their
produce
531 (62.1%) farmers practicing organic farming responded that they do find quality of their
organic produce as good to certain extent, followed by 284 (33.2%) satisfied with their organic
produce to greater extent.
Chart 1.33 - Farmers response on quality of their organic produce
649 (75.9%) farmers practicing organic farming responded that will surely advise other
farmer for practicing organic farming.
Significant numbers of farmer are in support of organic farming, which surely help in extension
of organic farming in all 6 districts of Rajasthan.
Responses obtained on barriers / challenges for organic farming
54.4% have stated that changing the entire field to make it organic is the major barrier for
adopting organic farming. It’s a tiring, time consuming and high cost activity to perform. 17.3%
attributes to no market and no price difference for organic product. Table 2.40 shows responses
categorized in five types of barriers and challenges.
Table 2.40 – Responses on barriers / challenges for organic farming
Barriers / Challenges Male % (Male) Female % (Female) Total N % (Total N)
Changing the entire field is difficult
531 54.2 301 54.7 832 54.4
Require at least three cycles of organic inputs for getting 100% organic outputs
78 8.0 43 7.8 121 7.9
Higher cost of cultivation 169 17.3 79 14.4 248 16.2
No market for organic produce/no price difference
164 16.8 101 18.4 265 17.3
Problems regarding organic certification
9 0.9 4 0.7 13 0.9
Less or no availability of organic manure/pesticides
28 2.9 22 4.0 50 3.3
Total 979 100.0 550 100.0 1529 100.0
23.7%9.5%
33.2%40.1%
22.0%
62.1%
2.6% 2.1% 4.7%
0.0
20.0
40.0
60.0
80.0
Male Respondents Female Respondents Total N
Farmers response on quality of their organic produce -Total N-855 (Male-568 & Female-287)
Yes, to a greater extent Yes, to a certain extent No

50
Less than 1% of farmers have reported that there is a problem regarding organic certification
which is not seen as a barrier probably because of the lack of knowledge if the procedure and
what it entails. As shared earlier, only 3 farmers have gone for organic certification for their
produce. Awareness towards certification process is thus much required. This could also be the
reason why organic cultivators are unable to realize a higher price for their produce in the
market.
Table 2.41 – District wise responses on barriers / challenges for organic farming
Barriers/ Challenges
Chittorgarh Dausa Jaipur Kota Pratapgarh Udaipur Total N
Nos. %age Nos. %age Nos. %age Nos. %age Nos. %age Nos. %age Nos. %age
Changing the entire field is difficult
258 16.9 150 9.8 156 10.2 63 4.1 84 5.5 121 7.9 832 54.4
Require at least three cycles of organic inputs for getting 100% organic outputs
31 2.0 16 1.0 3 0.2 6 0.4 31 2.0 34 2.2 121 7.9
Higher cost of cultivation
29 1.9 12 0.8 84 5.5 19 1.2 29 1.9 75 4.9 248 16.2
No market for organic produce/ no price difference
3 0.2 2 0.1 130 8.5 56 3.7 6 0.4 68 4.4 265 17.3
Problems regarding organic certification
0 0.0 0 0.0 7 0.5 0 0.0 0 0.0 6 0.4 13 0.9
Less or no availability of organic manure/ pesticides
7 0.5 0 0.0 9 0.6 7 0.5 1 0.1 26 1.7 50 3.3
Total N 328 21.5 180 11.8 389 25.4 151 9.9 151 9.9 330 21.6 1529 100.0
96.4% of respondents have shown favorable intention to practice organic farming if assistance
is provided to them. Jaipur (30.4%) followed by Chittorgarh (21.4%) respondents have shared
strong willingness. While Pratapgarh (only 8.0%) have shown willingness. This means that such
districts could be focus districts for awareness and training camps.
Table 2.42 – Respondents who have indicated willingness to practice organic farming, if
necessary assistance is provided thereof.
District Yes No Total N
Nos. %age Nos. %age Nos. %age
Chittorgarh 144 21.4 20 3.0 164 24.3
Dausa 102 15.1 0 0.0 102 15.1
Jaipur 205 30.4 4 0.6 209 31.0
Kota 75 11.1 0 0.0 75 11.1
Pratapgarh 54 8.0 0 0.0 54 8.0
Udaipur 70 10.4 0 0.0 70 10.4
Total N 650 96.4 24 3.6 674 100.0
Response obtained on suggestions for extending organic farming among farmers
1202 (78.6%) have suggested that creating awareness among community for organic products is
vital. Farmers strongly believe that by creating awareness among the community on benefits of
organic products, demand of organic produce can be increased which in turn will provide a
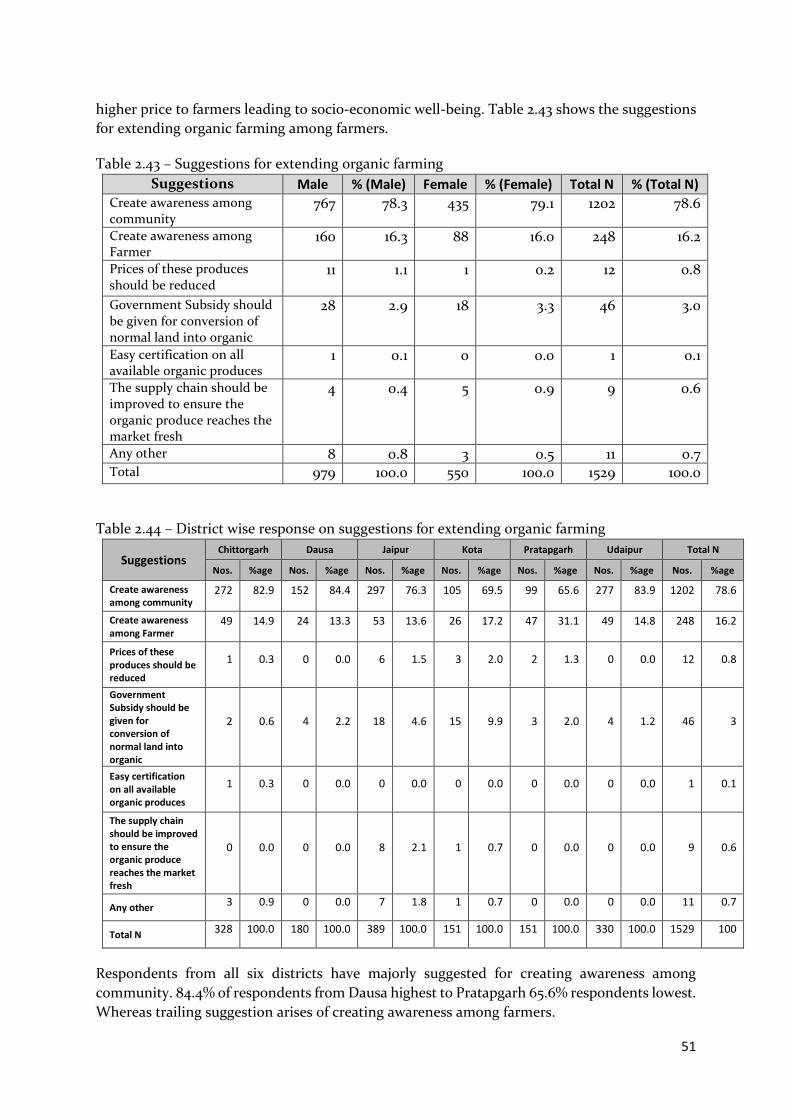
51
higher price to farmers leading to socio-economic well-being. Table 2.43 shows the suggestions
for extending organic farming among farmers.
Table 2.43 – Suggestions for extending organic farming
Suggestions Male % (Male) Female % (Female) Total N % (Total N) Create awareness among community
767 78.3 435 79.1 1202 78.6
Create awareness among Farmer
160 16.3 88 16.0 248 16.2
Prices of these produces should be reduced
11 1.1 1 0.2 12 0.8
Government Subsidy should be given for conversion of normal land into organic
28 2.9 18 3.3 46 3.0
Easy certification on all available organic produces
1 0.1 0 0.0 1 0.1
The supply chain should be improved to ensure the organic produce reaches the market fresh
4 0.4 5 0.9 9 0.6
Any other 8 0.8 3 0.5 11 0.7 Total 979 100.0 550 100.0 1529 100.0
Table 2.44 – District wise response on suggestions for extending organic farming
Suggestions Chittorgarh Dausa Jaipur Kota Pratapgarh Udaipur Total N
Nos. %age Nos. %age Nos. %age Nos. %age Nos. %age Nos. %age Nos. %age
Create awareness among community
272 82.9 152 84.4 297 76.3 105 69.5 99 65.6 277 83.9 1202 78.6
Create awareness among Farmer
49 14.9 24 13.3 53 13.6 26 17.2 47 31.1 49 14.8 248 16.2
Prices of these produces should be reduced
1 0.3 0 0.0 6 1.5 3 2.0 2 1.3 0 0.0 12 0.8
Government Subsidy should be given for conversion of normal land into organic
2 0.6 4 2.2 18 4.6 15 9.9 3 2.0 4 1.2 46 3
Easy certification on all available organic produces
1 0.3 0 0.0 0 0.0 0 0.0 0 0.0 0 0.0 1 0.1
The supply chain should be improved to ensure the organic produce reaches the market fresh
0 0.0 0 0.0 8 2.1 1 0.7 0 0.0 0 0.0 9 0.6
Any other 3 0.9 0 0.0 7 1.8 1 0.7 0 0.0 0 0.0 11 0.7
Total N 328 100.0 180 100.0 389 100.0 151 100.0 151 100.0 330 100.0 1529 100
Respondents from all six districts have majorly suggested for creating awareness among
community. 84.4% of respondents from Dausa highest to Pratapgarh 65.6% respondents lowest.
Whereas trailing suggestion arises of creating awareness among farmers.

52
2.3 Achievement District A total of thirty eight people were interviewed at the district level from both non-government
organization and government departments. The interviewees were asked questions on
awareness, organic farming practices prevailing in the district and farmers involvement in
organic farming.
Table 2.45 - Achievement mentioned at district level
Achievement Government Non-
Government
Awareness among people about organic farming 7
14
Good coordination among in-line departments 11
11
Training programs for farmers on OF 7
12
Information given on disadvantages of chemical farming 3
-
Some farmers already involved in OF 5
14
Organic farming is already being practiced by some farmers in the districts. There is also
awareness among farmers on advantages of organic farming. There are capacity building
program being held by government department. The in-line departments are also working in
close coordination and help in promotion of organic farming. Similar to the responses received
at the state level, the district level stakeholders too mentioned coordination with cooperative
committee, increasing number of farmers, spreading awareness on advantages of organic
farming as achievements.
State A total of thirteen people were interviewed at the state level were interviewed. The interviewees
were asked questions on functions of agriculture department, awareness, organic farming
practices prevailing in the districts and farmers involvement in organic farming.
Table 2.46 - Achievement mentioned by at the state level
Achievement Government Non-government
Promote organic farming 4 6
Information on advantages of Organic farming and disadvantages of chemicals
5 6
Awareness to farmers on organic farming
5 5
Good relationship with cooperatives
4 5
Discount to farmers 3 -
53
There is existing awareness among farmers on organic farming. The state is providing subsidies
to farming. The state agriculture department is involved in promoting organic farming in the
state. The NGOs and VOs have promoted organic farming in the state. Over the years they have
been able motivate larger number of farmers to take up organic farming. The responses on
prominent indicators have been selected hence for both district and state level the indicators
are similar. The responses against all indicators have been similar. The interviewees at the state
level stated good relations with cooperative committee, increasing number of farmers in organic
farmers and regular awareness drives as the major achievements.
Highlights of the responses under achievements/ status are as follows:
Though there weren’t many responses on proposal for formation of a separate directorate
for organic farming, it indeed is a great step towards achievement of set goals.
i. There is a plan to set-up a separate Directorate for Organic Farming.
ii. The number of farmers involved in organic farming is increasing.
iii. There are training and capacity building programme that are being held by the
agriculture department to enhance the knowledge levels of farmers on organic
farming. During these trainings information on disadvantages of using pesticides
and chemical farming is shared with the farmers.
iv. Government has adopted various strategies to promote organic farming viz. practical
demonstrations to explain the benefits of organic farming to farmers, organising
awareness campaigns and organise trainings.
v. Some small farmers are involved in traditional organic farming. These farmers
should be asked to share their experiences with more number of farmers.
vi. Network with organisations: Building network and liaison with various
organisations and government to meet the capacity building requirements. NGOs
are working on creating a partnership framework. These linkages help in
dissemination of information about organic farming.
vii. Farmers’ involvement: there has been increase in number of farmers and
involvement of other stakeholders. NGO and VO are also coming forward and
actively participating in the propagation of organic farming.
“Farmers are the final beneficiaries and we have built a network of 10,000 farmers.”
- Mr. Anant Sharma, President, CANS, Jaipur
viii. Awareness on aspects of organic farming: The NGOs and VOs have approached the concern towards organic farming holistically. They have spread information among farmers on certification and standards. Efforts have been made enable farmers through
orientation and capacity building activities.
“Organic farming has gained favourable response. It is one our successful programme
that includes trainings, capacity building, documentation and livelihood promotion.”
- Mr. Ambuj Kishore, ED, ARAVALI

54
2.4 Challenges
District Table 2.47 - Challenges as perceived by government officials at district level
Challenges Government Non-
Government
Lack of subsidies from government 6
13
No direct and regular contact with farmers/ consumers 5
14
Absence of market linkages
16
Current policies inadequate 5
11
Other gaps viz. motivation of government officials, farmers willingness, regular trainings also need to be addressed 7
13
The district level stakeholders highlighted that absence of subsidies for organic farming acts as
a major hindrance in way of promoting organic farming. Absence of a policy specific to organic
farming is also another challenge. The government needs to enhance its involvement with
farmers practicing organic farming. Lack of awareness among customers is also another
challenge faced by organic product producers.
State Table 2.48 - Challenges as perceived by government officials at state level
Challenges Government Non-government
Lack of government support from government
3 6
Absence of market linkages
4 4
Lack of awareness on certification
5 -
Lack of awareness among consumers
3 5
Current policies inadequate
- 5
Officials at the state level accepted the lack of support from government is one of major
hindrances in promotion of organic farming in the state. Other primary set-backs to organic
55
farming in the state are absence of market linkages and lack of awareness on certification
process. The state officials felt that along with promoting organic farming among farmers the
consumers too need to be appraised on advantages of organic farming.
The challenges identified by farmers at the state level are lack of subsidies, inadequate policy
on organic farming, absence of market linkages and no financial help or compensation for
farmers new to organic farming.
Gaps and challenges: Some of the frequently shared concerns have been listed below:
i. No policy document in place: From discussion with government officials it can be
inferred that there is no policy document that reads about promotion of organic
farming.
ii. Lack of market linkages: The discussions brought to light that the market linkages
are missing. There is a need to set-up market for sale and procurement of organic
products.
iii. Awareness generation: The awareness generation programmes need to be
structured. The sessions should adopt a ‘learning and sharing’ approach to
encourage more number of farmers to adopt organic farming. Along with farmers
there is a need to create awareness among consumers.
iv. Subsidies and rewards: like other programmes government should introduce higher
subsidies for organic farming. Organic farming is at a nascent stage hence subsidies
and additional rewards will definitely motivate farmers to take it up.
v. Low productivity: The farmers have been using chemical products for a long
duration and now shifting to organic farming will not give them good yield.
vi. Financial gain: Organic farming is cost extensive in comparison to inorganic
farming. This is the biggest hindrance in way of promotion of organic farming. In
the initial years of practising organic farming, the yield is less hence making it a
tough choice for farmers while choosing to shift to organic farming. Hence there
should be financial support from government.
“...financial gain is the focal point; farmers will be motivated to take up organic
farming only when they notice financial gains in the new venture.”
- Mr. Manu Sharma, Secretary, Saksham Vikas Sansthan, Jaipur -
vii. Lack of market: No market for the organic produce. Farmers are also unaware of what prices to quote while selling their produce. There is need of market to also procure certified organic seeds.

56
“Concerns like providing alternative to chemical fertilizers to farmers are big
challenge. Farmers focus is on getting avenues to sell their products at a
reasonable price.”
- Mr. Govind Narayan Vijay, Dy. Director, SWARAJ
viii. Certification process: Certification is one of primary concerns in relation to organic farming; however it has still not been streamlined with other activities.
ix. Government’s role: Government’s involvement is limited and hence a detrimental factor in low response towards implementation of organic farming. The government has a neutral attitude towards organic farming acts as a hindrance in their programme implementation. The local administration doesn’t give advice on matters related to organic farming. There are hardly any meetings with the government officials.
“There is no help of any sort from the side of the government.”
- Mr. Nirupesh Sharma, head, consumer forum
“Government somehow aims at achieving its targets, no assistance given to us.”
- Mr. Om Prakash Parekh, Chairman, Hanuman Gram Vikas Samiti, Dausa
“There is no assistance from government; rather it is very discouraging to meeting
them.”
x. Mr. Hari Sharma, Secretary, Gram Vikas Avam Paryanavaran Sansthan, Dausa
Diagram 1: Views on certification
View of NGO/VO on Certification
Tedious and a long process
Mandatory
Lack of awareness
among farmers

57
Chapter 3: Way forward
3.1 Recommendations
Recommendations at state level The interviewees made some suggestions that would definitely help in promotion and
scaling up of organic farming in Rajasthan. Few of the suggestions made by the
government officials are:
i. There is an urgent need to create market linkages. It should be created at micro-
level that would directly benefit the farmers for instance market at block level should be established where the farmers can sell their produce.
ii. During the trainings information on certification should be provided and
government should take steps to make the process of certification hassle free. Along with specific training programme farmers should be exposed to the existing success stories of farmers who are involved in organic farming and have witnessed escalation in production. Also an exposure visit of selected farmers from village could be helpful.
“Spread awareness, propagate, and disseminate information on organic farming.
Simplify the certification process to enable farmers to take up organic farming.”
- Mr. M.C. Tiwary, SCO (Org.), Certification Department, Rajasthan
iii. The state government needs to adopt a more holistic approach towards promotion
of organic farming. There is a need of constant dialoguing between the government and farmers for better understanding of ‘supply’ and ‘demand’.
“Spread of awareness on the certification process- its benefits, use and importance. The
Government itself has to improve the situation of organic farming to uphold the trust that
the farmers have on the government. Organic farming is established on trust, that trust
should not be broken.”
- Mr. K. C. Meena, Deputy Secy, Kisan Ayog Kendra, Jaipur -
iv. Livestock promotion should also be the focus: the preparation of compost is wholly dependent on availability of organic products like wet kitchen waste and dung; hence promotion of livestock along with organic farming would be beneficial.

58
Table 2.49 - Recommendations on organic farming at state level
Recommendations Government Non-government
Direct connection bet' livestock and Organic farming
3 5
Market linkages and compensation to farmers
5 5
Awareness among consumers
4 5
Policy on organic farming 2 4
Technical assistance to group and awareness on certification organization
5 6
The state level officials have highlighted the need to accept the direct connection between
livestock and organic farming. There is enough livestock in the state and they can be catalyst in
promotion of organic farming in the state. Amongst other recommendation the officials have
prioritized the need for technical assistance to farmers in relation to awareness on certification
organization and creation of market linkages.
The stakeholders at the state level have recommended making seeds and fertilizers available to
farmers. To promote organic farming there is a need to set-up market linkages for the benefit
and motivation of farmers. Other recommendations include involvement of government and
enhanced technical assistance to farmers.
Recommendations at the district level
Table2.50 - Recommendations on organic farming district level
Recommendation Government Non-
Government
Promote vermin-compost & provide seeds to farmers
3 17
Provide market on block level and farmers to be given compensation.
6 17
Village wise training program for farmers
6 12
More land should be brought under OF
5 -
Increase communication between department and farmers
6 16
New organic farming policy
3 7

59
At the district level recommendations include promotion of vermi-compost, organic seeds to
farmers, adequate compensation to farmers and market at block level. The stakeholders at
district level also felt that the land under organic farming cultivation can be increased as there
is availability of land in the state. To enable the farmers to take up organic farming there should
be effective communication between the department and farmers. The district level staffs also
recommend a separate policy on organic farming. Making seeds and fertilizers available to
farmers, to promote organic farming there is a need to set-up market linkages for the benefit
and motivation of farmers. Other recommendations include involvement of government and
enhanced technical assistance to farmers.
3.2 Facilitating Factors Facilitating factors at state level Along with recommendations from government officials it is important to note that they have
indicated their willingness to be involved and highlighted pertinent factors that will help them
to take forward the organic farming project. The responses related to such reactions have been
categorised as ‘facilitating factors’. Table 11 represents the indicators that will act as facilitating
factors.
Table 2.51 - Facilitating factors of organic farming at state level
Facilitating factors Government Non-government
Understanding problem of farmers
2 2
Train NGO and farmers on Organic farming
4 4
Good relation with department, cooperatives, committees
4 -
Awareness drive for consumers and farmers drive
4 4
Land and livestock available for use
- 5
At the state level the facilitating factors include the existing trainings for farmers and empathy
to problems faced by farmers. The cordial ties of the government department with the
cooperatives also add to the factors that would help in carrying forward organic farming. Along
with farmers the consumers are already also being oriented upon the advantages of organic
products.
The existing factors that will enable organic farming in the state. There is a favourable
environment for promotion of organic farming. The NGOs and VOs involved in organic farming
activities have been successful in its promotion. The understanding that farmers are facing
problem will definitely help in promoting organic farming.

60
Diagram 2: Areas of focus in future
The four pertinent areas of focus that were highlighted in the responses of the interviewees are
further emphasis on capacity building needs of the farmers, along with which there is an urgent
need to frame policy document that will make it compulsory for implementers to follow the
guidelines and set rules of organic farming. The other two areas of focus pointed out are setting-
up of market linkages and exposure to farmers to the best practices and innovations in organic
farming.
Facilitating factors at district level Table 2.52 - Facilitating factors of organic farming at district level
Facilitating factor Government Non-government
Availability of land for organic farming
5 8
Positive response from some farmers into organic farming
4 -
Farmers should be given appropriate compensation
5 7
The department periodically /as per need should run training
6 12
Farmers being given information on disadvantages of chemical farming and advantages of organic farming
8 9
Availability of land for organic farming comes across as a prominent facilitating factor. Even if
the number of farmers is small at the moment, they are convinced that the future of organic
farming in the district is promising. With the on-going trainings and sharing of information of
disadvantages of chemical farming, the awareness is spreading already.
Capacity buidling
Policy advocacy
Market Linkages
Best practices & innovations

61
The factors that will help propagate organic farming are:
i. Improved coordination: There are various NGOs and VOs involved in organic
farming, effort should be made to bring all such players on one platform to take forward the objectives of organic farming. Their contribution should also be recognized and encouraged by the local authorities.
ii. Schemes/ Programmes on organic farming: All organic farming related activities should be prioritized viz. availability of seeds and fertilizers at gram Panchayat, awareness of farmers through regular capacity building and orientation. Insurance should be introduced for organically grown crops.
iii. Certification: It one of the primary concerns for those farmers who are already involved in organic farming. There is also a suggestion that the process of certification of organic products should be included in food licence.
iv. Government’s role: Active involvement of government can solve many issues and concerns related to organic farming, for instance marking out separate zones for organic farming, creating market at block level, introduce schemes and programmes on organic farming, etc.
“Market to be created at block level for sale of organic products and along
with that buyers should also be made available.”
- Mr. Laxman Singh, President, Van Suraksha Samiti, Pratapgarh.
“The government should develop Jaivik (Organic) villages like Nirmal
Villages. Separate zone should be allotted for organic farming.”
- Mr. Nagendra Singh, project officer, WASCO, Pratapgarh
“Government should focus on other non-government organisations
working on organic farming and recognise their efforts.”
- Mr. Anant Sharma, President, CANS, Jaipur
There were a variety of responses that were received from the government and non-government
stakeholders at the district and state level. Their suggestions range from basic orientation to
farmers to issues like certification and policy at state level.

62
Chapter 4: Conclusion
Based on the overall observations through the assessment that organic farming has its downsides
mostly due to the way it is perceived by farmers and lack of focus by key players however by
mainstreaming it like other agricultural activities organic farming will gain more acceptability.
A structured approach towards organic farming could help in popularizing it amongst farmers.
There are organic products available in markets at present however most of them are labelled
as imported from other countries. This same market
can be made available to the locally produced organic
products. It will be a great encouragement to our local
farmers and provide them with a promising
opportunity to reach up to larger markets. Market
linkages need to be built from bottom to top.
Financial support to farmers engaged in organic
farming. Other than government subsidies and rebates,
organic farming can be integrated in the list of income
generating activities under micro-finance. Along with
being a source of income, organic farming also
guarantees sustainable development and use of natural
resources.
There is an immediate need to resolve all doubts that farmers have in relation to organic
farming. A streamlined strategy should be laid down to encourage farmers to shift to organic
farming. A participatory approach should be adopted to clear all doubts of farmers and other
stakeholders. Once their doubts are resolved, farmers will learn through exposure visits and
best practices. It is also important to focus on research and innovation in organic farming.
(http://www.aiofsindia.com/projects.php)
Global Scenario of Organic
Farming:
In approximately 100
countries of the world,
organic farming is being
practiced and the area under
organic management is
continuously growing.

63
Annexure 1
ACTION RESEARCH UNDER
PRO – ORGANIC PROJECT
In-Depth Interview Schedule for Department Officials/ Organization s
2014
CUTS INTERNATIONAL VIMARSH

64
INTERVIEW SCHEDULE FOR OFFICIALS OF DEPARTMENTS / ORGANIZATION S
2014
IDENTIFICATION
DISTRICT
NAME OF THE DEPARTMENT / ORGANIZATION
_____________________________________________________
NAME OF THE OFFICIAL ______________________________
DESIGNATION
TELEPHONE /MOBILE NUMBER __________________________
EMAIL_____________________________________
DATE OF INTERVIEW: DATE MONTH YEAR
NAME OF THE INVESTIGATOR
_________________________
SIGNATURE OF THE INVESTIGATOR
DATE:
NAME:
FIELD SUPERVISOR
_________
CONFIDENTIAL
FOR RESEARCH
PURPOSES
ONLY

65
{Will be translated in Hindi)
Greetings {use local terms},
My name is _____________________and I am working with VIMARSH Development Solutions.
We are conducting an action based research on organic products under CUTS supported Pro-
organic project in your district to know the level of awareness and satisfaction among consumers
for organic products.
The study is divided in two parts – 1. Quantitative survey by interviewing the farmers and
consumers who are either engaged in organic farming or using organic products & 2. Qualitative
survey by in depth interview with Policy makers/ relevant department officials etc.
With your consent, I will ask you about issues related to organic farming and request you to
answer the questions to the best of your knowledge.
The entire interview will take about 50 -60 minutes of your time. I want to assure you that the
information provided by you will be kept confidential. Views or opinions expressed by a
respondent would not be challenged by any officer or authority at any stage. Respondents are
therefore requested to share their views in a fare and frank manner without any fear.
Your name and contact details will be kept confidential and will not appear in study record or
report.
Your participation is voluntary and information provided by you is very valuable to us.
May I begin the interview now?
It is not compulsory, but I would be happy if you please sign this form.
SIGNATURE OF THE RESPONDENT (OPTIONAL) __________________________

66
In depth Interviews for
A. Department Officials at State / District level
1. For how long have you been working with this department?
2. In what capacity have you been part of this department?
3. What are main function of your department?
4. Do you do something to promote organic farming and consumption, if yes what?
5. What is your organization doing to control/decrease use chemical
fertilizers/pesticides/weedicides etc. by farmers?
6. How would you describe the farmers you work for: Are they receptive to the department’s
program and assistance on organic farming?
If yes, what are the reasons?
If no, what are the reasons?
7. How many farmers does your department reach?
8. From the time you started promoting organic farming, has the number of farmers you
counsel, guide & cooperate with increased, and to what extent?
9. How would you describe the relationship between department and other farmer’s
organization working in the state?
10. Is the state policy on promoting organic farming requires any amendments/
modifications to support farmers more effectively?
11. How would you evaluate the success of organic farming in the state / district?
12. How do you see the future of organic farming in Rajasthan?
13. What are your suggestions to improve the situation of organic farming in Rajasthan?
67
INTERVIEWER’S OBSERVATIONS: TO BE FILLED IN AFTER COMPLETING THE
INTERVIEW
__________________________________________________________________________________
__________________________________________________________________________________
__________________________________________________________________________________
__________________________________________________________________________________
Signature of Investigator
Name
Date:
B. Officials of Farmer’s Organization is engaged in promoting Organic farming
3. For how long have you been working with this farmer’ organizations?
4. In what capacity have you been part of this organization?
5. What motivated you to join this organization?
6. What are some of the challenges you experience in your everyday work?
7. How would you describe the community you work for: Are they receptive to the
organization’s program and assistance? Why
8. If not, what are the reasons?
9. How many farmers does your organization reach?
10. From the time you started this work, has the number of members and people you
cooperate with increased, and to what extent?
11. What challenges you face in convincing farmers to adopt organic farming?
12. What are the challenges faced by farmers, who adopt organic farming?
13. Do you assist in organic certification process and what are your views about certification
process, (its importance, cost, complexities etc?)

68
14. Does you help famers in marketing/sell of their organic products?
15. Do organic products have enough consumers to buy? What are consumers’
perceptions/concerns in buying organic products?
16. How would you describe the relationship between your organization’s programmes and
the state and local government? (Is it cooperative, antagonistic, non-existent?)
17. How do other local organizations perceive your organization’s work and role in this
community?
18. What could prevent your organization s Programme on organic farming from pursuing
its objectives?
19. Do you want any change in existing state policy on organic farming? If Yes, please explain
20. Do you want any support from Government to promote organic farming?
21. How would you evaluate the success of your Programmes?
22. How do you see the future of organic farming in your district and at state level?
23. What are your suggestions to improve the situation of organic farming in Rajasthan?
INTERVIEWER’S OBSERVATIONS: TO BE FILLED IN AFTER COMPLETING THE
INTERVIEW
__________________________________________________________________________________
__________________________________________________________________________________
__________________________________________________________________________________
__________________________________________________________________________________
Signature of Investigator
Name
Date:

69
Annexure 2
Team composition
Team composition-Vimarsh
Srl No
Name Role Education Experience
1 Dr. R. K Biswas Overall adviser, Research tool design and report
Ph. D and M.Sc. Agriculture
20+ years
2 Ashish Srivastava Inception design, Data management MBA 20+ years
3 Deewakar Srivastava
Project Management, Coordination MA, MBA 20+ years
4 Satyendra Keshri Data analysis M. Sc 7 years
5 Ashish Gupta State Coordinator-Quantitative and qualitative field management
MA 11 years
6 Shailendra Dubey State Coordinator-Quantitative and qualitative field management
Graduate 8 years
7 Suraj Brahmbhatt Quantitative field researcher
8 Sanjay Bhatt Quantitative field researcher
9 Brij Mohan Quantitative field researcher
10 Rinku Meena Quantitative field researcher
11 Chandra Mohan Quantitative field researcher
12 Sachin Kumar Quantitative field researcher
13 Manish Mangal Quantitative field researcher
14 Ankit Chauhan Quantitative field researcher
Entire team comprised of graduates with experience
15 Naresh Kumar Beniwal Quantitative field researcher ranging from 2 months to 6 years
16 Rajendra Meena Quantitative field researcher
17 Asif Md Quantitative field researcher
18 Vipin Dixit Quantitative field researcher
19 Vinay Kumar Maheshwari Quantitative field researcher
20 Anil Prajapati Quantitative field researcher
21 Moin Khan Quantitative field researcher
22 Rahul Quantitative field researcher
23 Ravi Quantitative field researcher
24 Yasin Mohammed Quantitative field researcher

70
List of CUTS District partners
SN District Coordinates
1. Dausa Mr.Om Prakash Parekh Chairman, Hanuman Gram Vikas Samiti
2 Kota Mr. Yudhisthir Chansi, Ram Krishan Shikshan Sansthan
3 Udaipur Mr. Mohan Dangi, Secretary, Prayatna Samiti
4 Chittorgarh and Pratapgarh
Mr.Dharmveer Yadav, Center Coordinator, CUTS Centre for Human Development (CUTS-CHD) Rawala, Village-Senthi, Chittorgarh. 312 001, India

71
Annexure 3
Four Pillars of Organic Farming
Standard and Certification4
The most important aspect in modern era of organic farming is certification programmes
which consist of standards (rule), inspection (checking whether the rules are
implemented) and certification (judgment). Only by this certification programme,
organic farming can be distinguished from other methods of sustainable agriculture.
These standards define what can be labeled 'certified organic' and sold commercially as
such. In fact, certification in organic agriculture generally refers to independent third
party certification. Third parts implies it is not done by either the producer (first party)
or the buyer (second party). The system includes farm inspector and audit trails
(checking of record). Certificate is valid only if it is done by accredited certifying agency.
Certification programme vary among countries or regions because of differences in
environmental, climatic, social and cultural factors. Needless to say, from a commercial
perspective it is not enough that product is produced organically, what is equally
important is that it should be certified as such.
Technology Packages
Conventional practices cannot be followed for growing crops organically. It includes
land preparation, selection of variety, organic fertilization, biological control of pest-
diseases-weed, harvest, storage etc. Some countries have developed package of practice
for some selected crops but there is ample scope to reframe this package with scientific
methods and practices.
Market Network
Organic farming has a place where there is a market to accept the produce at a higher
price as the growing interest in organic farming practice is due to an expectation of
higher premium for organically produced farm commodities. The basic focus of Organic
farming should be first to produce a farm products for the home (domestic) market and
second for the export market.
4 Indian Journal of Fertilisers. Vol. 1 (9). December 2005. PP.111-123(13 pages), Current Status of Organic Farming in India and other Countries, Bhattacharya P. and Chakraborty G., National Centre of Organic Farming, Ghaziabad.