student research project test of momentum … · the trading strategy has been ... which have been...
TRANSCRIPT
RPS/02/2012
STUDENT RESEARCH PROJECT
Test of Momentum Investment Strategy using
Constituents of CNX 100 index
Prepared by
Tejas Mankar
Student of PGDM Program of 2010-12
S P Jain Institute of Management & Research, Mumbai
Supervised by
Mayank Joshipura
Associate Professor and Head, Finance
S P Jain Institute of Management & Research, Mumbai
February 2012
2
Student Research Project
Test of Momentum Investment Strategy using
Constituents of CNX 100 index
Prepared by Tejas Mankar 1
February 2012
Abstract
By using the momentum investment strategy--a strategy of buying stocks that have performed
well in the past and selling stocks that have performed poorly in the past--to generate returns
over a 3 to 12-month holding period, this paper provides evidence against the weak form of
market efficiency theory which claims that superior returns cannot be produced on the basis of
investment strategies based on historical data and if any such returns are earned it may be a mere
compensation for the higher risk taken. The trading strategy has been tested using the
constituents of CNX 100 for a period between 2003 and 2011. The results of the study are in
sync with the findings of Jegadeesh and Titman (1993).
1 The author is currently a student at S.P. Jain Institute of Management and Research, Mumbai. The views expressed
in the paper are those of the author and not necessarily of the National Stock Exchange of India Ltd. The author
acknowledges the opportunity as well as the research grant provided by National Stock Exchange of India Limited
and also acknowledges the constant support and guidance provided by Dr. Mayank Joshipura for the preparation of
the paper. The author can be contacted at [email protected] or [email protected].
3
Test of Momentum Investment Strategy using Constituents of CNX
100 Index
I. Introduction
Investment strategies have received a lot of attention from the academic world over the last two
decades. Armed with vast databases and cheap computing power, researchers have explored
investment strategies across different asset classes; equities, in particular, have received a lot of
focus.
Momentum investment strategy involves buying stocks that have performed well in the past and
selling stocks that have performed poorly in the past. 2 The aim of this strategy is to generate
significant returns over the holding period. Interest in momentum investment strategies has not
just been limited to the researchers’ world. They have found applications in the real world of
asset management. Professional fund management companies in the United States (US) have
successfully employed momentum investment strategies and launched momentum-based fund
schemes. Some momentum-based funds have been running for over a decade and have billions
of dollars of assets under management.
The weak form of the market efficiency hypothesis dictates that abnormal profits cannot be
produced on the basis of investment strategies based on historical data and if any such returns are
earned it is a mere compensation for the higher risk taken. However, near zero-beta portfolios
have been created in the past, which have been found to produce superior absolute returns--
much higher than risk free rate of return. 3 Momentum profits have thus remained an anomaly in
the markets and provide fund managers with an excellent opportunity to create beta-neutral,
superior-return portfolios.
To date, no asset-pricing model has been able to explain short-term momentum returns fully.
Fama and French’s three-factor version of capital asset-pricing model could explain most of the
2 Selling of stocks can achieved through short sale or selling of futures depending on the regulations prevailing in
various markets. 3 A portfolio of assets so constructed as to have no systemic risk is referred to as a zero-beta portfolio. Systematic
risk measures a portfolio's sensitivity to market price movements. A zero-beta portfolio is similar to a risk-free asset.
4
anomalies including long-term contrarian profits but could not explain short-term momentum
returns. Grundy and Martin studied the risk sources of momentum strategies and concluded that
while factor models can explain most of the variability of momentum returns, they fail to explain
their mean returns. Momentum profits have also been shown to exist across various financial
markets. Some view this unexplained persistence of momentum returns throughout the last
several decades as one of the most serious challenges to the asset-pricing literature.
While momentum profits do exist, it is important to analyze whether the strategies based on the
momentum effect remain viable after transaction costs are taken into account. In this context,
Korajczyk and Sadka (2002) estimated that as much as 5 billion dollars can be invested in
momentum strategies before the apparent profit opportunities vanish due to price impact induced
by trades. 4
While many studies on momentum investment strategies have been undertaken in the developed
markets, very few studies have been done on Indian markets. The Indian market has undergone
many changes in the last couple of decades, the volumes and liquidity have improved
considerably over last two decades. The increasing role of institutional investors and the
introduction of online fully automated screen-based trading have resulted in improved efficiency
and effectiveness of the market. Turnover ratio has vastly improved from 32.7 percent in 1990-
91 to 81.8 percent in 2006-07. 5 Trading in derivatives such as stock index futures, stock index
options and futures and options in individual stocks was introduced to provide hedging options to
the investors and to improve the ‘price-discovery’ mechanism in the market. In India, factors
such as regulations allowing short sales in the cash market, reduction in transactions costs and
the improved liquidity augur well for the successful implementation of momentum trading
strategies.
This paper analyzes momentum investment strategy to generate significant returns over a 3 to 12
month holding period. For the purpose of this study, we have employed a methodology used
commonly by researchers studying momentum investment strategies (see Section III) and the
sample for the study consists of the constituent stocks from CNX 100 Index for the period 2003
to 2011. The latter serves the important purpose of not including any small cap or illiquid stock
4 Refer to ‘Explicit trading costs and price pressures’ under implementation issues/considerations section.
5 Reserve Bank of India – Equity and Corporate Debt Market Report.
5
and thus negates the hypothesis that profits generated in momentum investment strategies are
compensation for the risks associated with small and illiquid stocks.
Our study aims at testing for existence of momentum profits and thus testing weak form of
market efficiency which claims that superior returns cannot be produced on the basis of
investment strategies based on historical data and if any such returns are earned it may be a mere
compensation for the higher risk taken. While we essentially back-test the momentum
investment strategy in this paper under the assumption of zero transaction costs, fund managers
can actually test this strategy to examine its robustness in the real world.
The rest of the paper is organized as follows. Section II explains the momentum phenomenon.
Section III discusses the methodology of the study. Section IV describes results and analysis.
Section V discusses implementation issues. Finally, Section VI concludes the study summarizing
the results and observations.
II. Momentum phenomenon
In their 1985 paper, Debondt & Thaler tested the momentum hypothesis and found significant
momentum profits in the US market. In their subsequent 1987 paper, Debondt & Thaler studied
the risk and size characteristics of the winning or losing firms. They found that neither risk nor
size had any role to play in explaining the momentum effect. Jagdeesh & Titman (1993) studied
the stock data in the US market from 1965 to 1989 and found that the strategy, which selects
stocks, based on their past 6 months’ returns and holds them for 6 months, realizes a
compounded momentum return of 12.01 percent per year on average. Rouwenhorst (1998)
reported that the momentum profits documented by Jegadeesh and Titman for the US market
could also be obtained in the European markets. Chui, Titman, and Wei (2000) documented that
with the notable exception of Japan and Korea, momentum profits were also obtained in Asian
markets. A number of behavioral scientists have also attempted to explain the momentum
phenomenon. Daniel, Hirshleifer and Subrahmanyam (1998) attributed the momentum
6
phenomenon to two biases of informed investors: overconfidence and biased self-attribution. 6
Overconfidence induces them to have an exaggerated view on the precision of their private
signals about a stock’s value, leading them to overreact to such signals. Biased self-attribution on
the other hand causes informed investors to under-estimate public signals about value, especially
when the public signals contradict their private signals. This overreaction, however, persists only
in the short-run. With the passage of time as more information comes along, investors get a
realistic picture of the impact of past information and tend to realize their mistakes that lead to
reversals in the long run.
Providing a different explanation, Hong and Stein (1999) divided investors into two types-
"news-watchers" and "momentum traders”. The news-watchers rely purely on their private
information, while momentum traders rely exclusively on the information in past price changes.
Hence, price is driven initially by the news-watchers as they receive and react to their private
information as soon as they come. The news gradually gets transmitted to the market, where
chartists may get breakouts on their charts and react to the news. This means that there is a
period of under-reaction initially, that is, till the time momentum traders begin to react to the
news and subsequently, there is overreaction when momentum traders react to the news. In the
long-run, however, this overreaction disappears and the price reverts to its fundamental level. A
significant strand of the literature discusses the possible reasons for momentum profits, some
attributing it to investor behavior, while others attributing it to risk factors not captured by
CAPM or the Fama-French three-factor model.
III. Data and Methodology
Sampling
The sample for the study consists of the constituent stocks from CNX 100 index. It is a
diversified 100-stock index accounting for 38 sectors of the economy. CNX 100 is computed
using free-float market capitalization method. CNX 100 is owned and managed by India Index
6 Both are well known behavioral bias. Self-attribution bias occurs when people attribute successful outcomes to
their own skill but blame unsuccessful outcomes on bad luck.
7
Services and Products Ltd. (IISL), which is a joint venture between the NSE and CRISIL. The
CNX 100 Index has a base date of Jan 1, 2003 and a base value of 1000 (Source: NSE website).
The reason behind selecting S&P CNX 100 constituents stocks as sample is that in addition to
the index representing almost the entire market, it also helps avoiding issues associated with
small and illiquid stocks influencing the results.
Data Collection
Adjusted monthly closing prices of the stocks on NSE for the period starting January 2003 and
ending August 2011 were obtained from the Capitaline database. 7 This study is for the period
from January 2003 to August 2011, which includes the stock market rally from 2004 to 2008, the
global financial meltdown of 2008-2009, and the subsequent recovery and the consolidation
period beginning soon after. Thus, this period signifies all the major ups and downs in the Indian
equity markets over the last decade.
Selection of scrips 8
All stocks, which have been a part of the index at any point of time between January 2003 and
August 2011, have been considered for the study. Any stock where the previous six months stock
data is available (though it could be excluded from the index but continues to list on the NSE
during the period of portfolio testing) is considered for portfolio formation. Any stock whose
either last six months data is not available due to the stock being (a) unlisted during the portfolio
formation or (b) getting delisted during the testing period, is not considered for portfolio
formation. The number of CNX 100 stocks that qualify for 6 x 12 strategy according to the above
mentioned criteria for each month of the selected period are shown in Annexure 1.
7 Stock price is adjusted for stock splits, dividends/distributions, etc. which facilitates calculation of return without
any difficulty i.e. if current price of a stock is Rs. 100, the company has just gone ex bonus with bonus of 1:1,
which means price before the bonus may be say Rs.200. Now if we go by absolute price, then the last month’s
closing price may be somewhere around Rs. 200, while this month’s closing price is around Rs.100, which means
negative returns. However, that is not true as the stock has gone ex-bonus and therefore the price should be adjusted
to half of the price prevailing before the bonus of 1:1 to make it comparable to the price now. 8 Selection of scrips is done during the formation period.
8
Measurements of returns
Stock returns are measured monthly on adjusted monthly price of the companies by using the
formula ln(Pn/Pn-1) where Pn and Pn-1 are the adjusted closing prices of the last trading day of
the two relevant months. 9 The main advantage of using logarithmic returns is that it is not
affected by the base effect problem. For example, an investment of Rs.100 that yields an
arithmetic return of 20 percent followed by an arithmetic return of (-20) percent results in a final
value of Rs. 96; while an investment of Rs. 100 that yields a logarithmic return of 20 percent
followed by a logarithmic return of (-20) percent results in Rs. 100.
MxN strategy
Here, we specifically use a strategy that selects stocks on the basis of returns over the past M
months (i.e. formation period) and holds them for N months (holding period). This is called as
the M x N strategy. At the beginning of each month t, the candidate stocks are ranked in
descending order on the basis of their returns in the past M months. The top decile portfolio is
called the “winners” portfolio and the bottom decile is called the “losers” portfolio. This strategy
involves, simultaneously buying the winner portfolio and selling the loser portfolio and then
holding this position for N months (total number of months).
The strategies we consider in this paper involve selecting stocks based on their 3-month and 6-
month returns (for formation period). We then consider holding periods of 3, 6 and 12 months
for stocks selected on the basis of returns in 3-month formation period--thus generating trading
strategies: 3x3, 3x6, 3x12. On the basis of returns in 6-month formation period, however, we
consider a holding period of only 12 months, thus generating the 6x12 trading strategy.
Methodology
To test the momentum trading strategy for Indian market, we have followed the methodology
used by Debondt and Thaler (1985, 1987) and Jegadeesh and Titman (1993) with a slight
modification i.e. instead of using abnormal returns, we use actual returns for the analysis, so that
it serves two purposes. First, it does not have any adverse impact on robustness of analysis and
9 For e.g. The return of a stock for the period of January 2003 to March 2003 will be calculated as [ln(P1/P0) +
ln(P2/P1)] where P0, P1 and P2 are the adjusted closing prices for the last trading days for the months of January,
February and March.

9
second, it simplifies understanding and makes implementation easier. Another important aspect
to be noted about this strategy is that it uses overlapping portfolios. Jegadeesh and Titman (1993,
2001) suggest that using overlapping portfolios 10
helps reduce the effects of bid-ask bounce 11
and provides more robust results. Hence, we have considered overlapping portfolios for the four
trading strategies. Therefore, in any given month, the strategies hold a series of portfolios that are
selected in the current month as well as in the previous N-1 months, where N is the holding
period.
In this paper, we explain the methodology for 6 x 12 strategy for illustration purpose, although
similar methodology has been used in other strategies as well. The analysis is performed using
first six months data for portfolio formation and next twelve months for portfolio testing period
i.e. 6x12 strategy. As the study uses 104 months data (from January 2003 to August 2011), there
are 86 winner and loser portfolios each for the testing period. 12
The methodology for 6x12 strategy is explained below in various steps which are followed in the
formation period and the holding period.
A. Formation Period
In case of a 6x12 strategy, if the portfolio has to be formed for the month of August 2003, then
the cumulative returns of the selected stocks for last 6 months are calculated and then arranged in
a descending order. The six months CR (Cumulative Returns) of the CNX 100 constituents is
defined in equation (1). 13
For every stock i in the sample (CNX 100), the cumulative returns
(CR) for the prior 6 months will be calculated as:
10
Consider the 3 x 6 strategy. The portfolio formed at the end of June based on April – June returns would be held
till December. Similarly portfolios formed at the end of July, August, September, October, November, would be
held till the end of January, February, March, April and May respectively. Thus, in any given month t, the strategies
hold a series of portfolios that are selected in the current month as well as in the previous n – 1 months where n is
the holding period. 11
Suppose a stock trades at bid 950 and ask 1000. Suppose no news appears for ten minutes. But, over this period,
suppose that a buy order first comes in (at Rs.1000) followed by a sell order (at Rs. 950). This sequence of events
makes it seem that the stock price has dropped by Rs.50. Even when no news is breaking, when a stock price is not
changing, the `bid-ask bounce' is about prices bouncing up and down between bid and ask. These changes are
spurious. This problem is the greatest with illiquid stocks where the bid-ask spread is wide. 12
Number of winner or loser portfolios for the m x n strategy for a sample period of t months = t – m - n 13
Cumulative returns help in identifying the month-on-month pattern in return of the portfolio especially in studies
on momentum based strategies where there is reversal in the returns of the winner and loser portfolios over a period
of time.
10
CR � ∑ ����� (1)
where Rit is the return of the ith
stock for the tth
month. In simple words, cumulative returns are
the sum total of the logarithmic month-on- month returns of the stock prices in the past six
months.
i.e. CRi = ln(P1/P0) + ln (P2/P1) + ln(P3/P2)+ ln(P4/P3) + ln(P5/P4) + ln(P6/P5)
where P0, P1, P2, P3, P4, P5 , P6 and P7 are adjusted monthly closing prices for January, February,
March, April, May ,June and July respectively.
Based on the cumulative returns (CRi), the stocks are arranged in descending order. Based on
these rankings, ten decile portfolios are formed. Each decile portfolio consists of stocks weighed
equally in that decile. Top decile portfolio forms winner portfolio and bottom decile
portfolio forms loser portfolio.
It is to be noted that a portfolio is constructed by going long on the winner portfolio and short on
the loser portfolio. This is done on a monthly basis and the step is repeated 86 times for the
period starting August 2003 and ending on August, 2011 as mentioned above.
B. Holding Period
After the winner and loser portfolios are identified in a given month for a given formation
period, the following calculations are to be done for the holding period.
Step 1: Calculating month-on-month stock returns for all stocks selected in winner and
loser portfolio
The first step involves calculating month-on-month returns for all candidate stocks in the winner
and loser portfolio for each of the 12 months holding period (i.e. 1st month return, 2
nd month
return, 3rd
month…and 12th
month returns). 14
This is illustrated below with the help of Matrix 1.
14
As mentioned above, these returns are calculated using the logarithmic returns of adjusted monthly closing prices
during the month i.e. R(1,1) = ln(P6/P5)…. R(12,10) = ln(P11/P10) and so on.
11
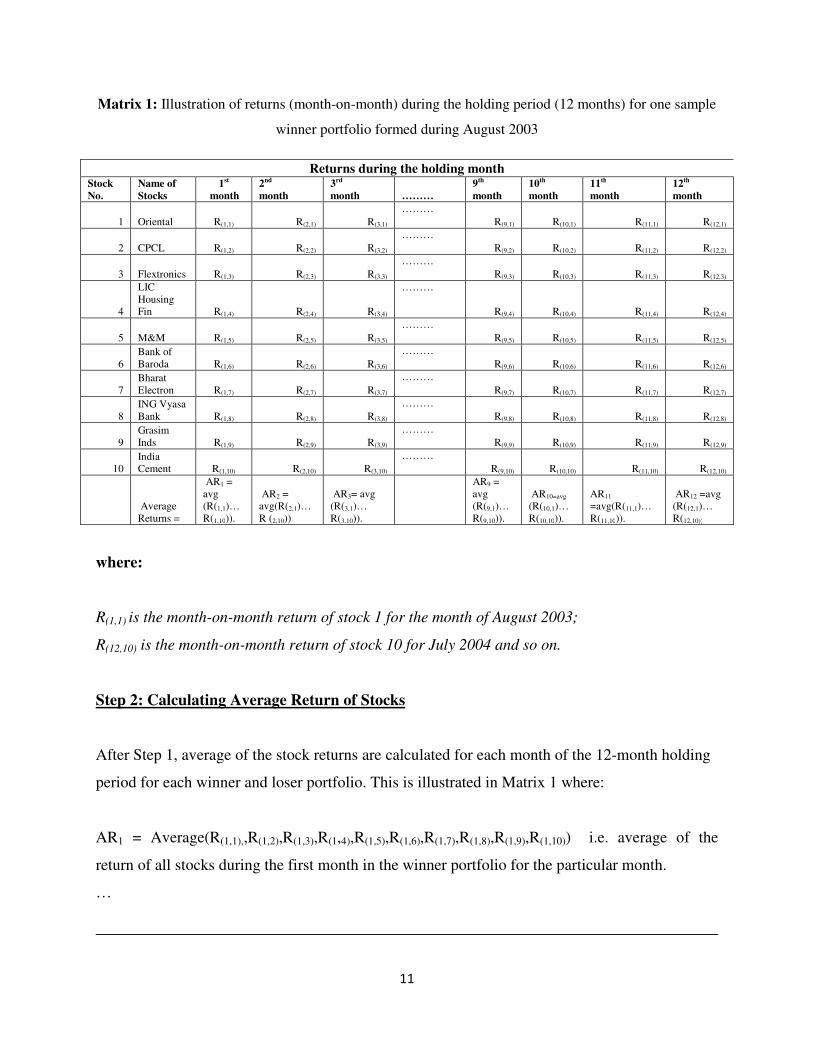
Matrix 1: Illustration of returns (month-on-month) during the holding period (12 months) for one sample
winner portfolio formed during August 2003
Returns during the holding month Stock
No.
Name of
Stocks
1st
month
2nd
month
3rd
month ………
9th
month
10th
month
11th
month
12th
month
1 Oriental R(1,1) R(2,1) R(3,1)
………
R(9,1) R(10,1) R(11,1) R(12,1)
2 CPCL R(1,2) R(2,2) R(3,2)
………
R(9,2) R(10,2) R(11,2) R(12,2)
3 Flextronics R(1,3) R(2,3) R(3,3)
………
R(9,3) R(10,3) R(11,3) R(12,3)
4
LIC
Housing
Fin R(1,4) R(2,4) R(3,4)
………
R(9,4) R(10,4) R(11,4) R(12,4)
5 M&M R(1,5) R(2,5) R(3,5)
………
R(9,5) R(10,5) R(11,5) R(12,5)
6
Bank of
Baroda R(1,6) R(2,6) R(3,6)
………
R(9,6) R(10,6) R(11,6) R(12,6)
7
Bharat
Electron R(1,7) R(2,7) R(3,7)
………
R(9,7) R(10,7) R(11,7) R(12,7)
8
ING Vyasa
Bank R(1,8) R(2,8) R(3,8)
………
R(9,8) R(10,8) R(11,8) R(12,8)
9
Grasim
Inds R(1,9) R(2,9) R(3,9)
………
R(9,9) R(10,9) R(11,9) R(12,9)
10
India
Cement R(1,10) R(2,10) R(3,10)
………
R(9,10) R(10,10) R(11,10) R(12,10)
Average
Returns =
AR1 =
avg
(R(1,1)…
R(1,10)).
AR2 =
avg(R(2,1)…
R (2,10))
AR3= avg
(R(3,1)…
R(3,10)).
AR9 =
avg
(R(9,1)…
R(9,10)).
AR10=avg
(R(10,1)…
R(10,10)).
AR11
=avg(R(11,1)…
R(11,10)).
AR12 =avg
(R(12,1)…
R(12,10))
where:
R(1,1) is the month-on-month return of stock 1 for the month of August 2003;
R(12,10) is the month-on-month return of stock 10 for July 2004 and so on.
Step 2: Calculating Average Return of Stocks
After Step 1, average of the stock returns are calculated for each month of the 12-month holding
period for each winner and loser portfolio. This is illustrated in Matrix 1 where:
AR1 = Average(R(1,1),,R(1,2),R(1,3),R(1,4),R(1,5),R(1,6),R(1,7),R(1,8),R(1,9),R(1,10)) i.e. average of the
return of all stocks during the first month in the winner portfolio for the particular month.
…
12
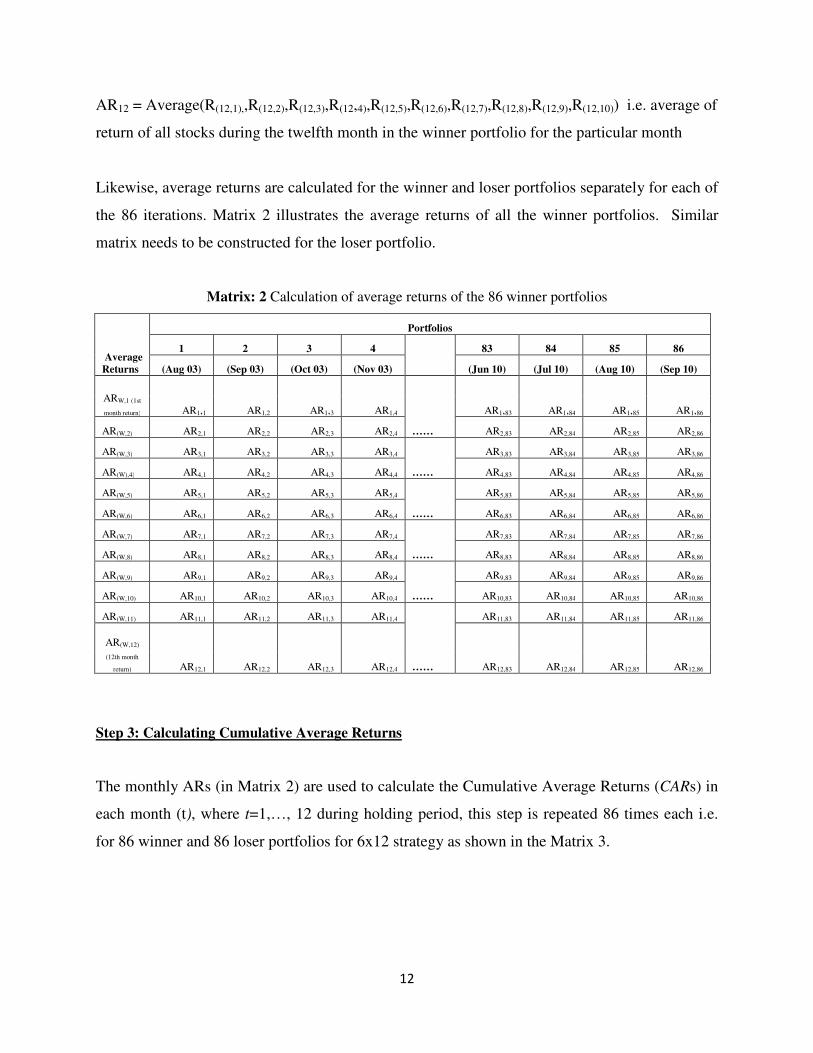
AR12 = Average(R(12,1),,R(12,2),R(12,3),R(12,4),R(12,5),R(12,6),R(12,7),R(12,8),R(12,9),R(12,10)) i.e. average of
return of all stocks during the twelfth month in the winner portfolio for the particular month
Likewise, average returns are calculated for the winner and loser portfolios separately for each of
the 86 iterations. Matrix 2 illustrates the average returns of all the winner portfolios. Similar
matrix needs to be constructed for the loser portfolio.
Matrix: 2 Calculation of average returns of the 86 winner portfolios
Average
Returns
Portfolios
1 2 3 4
83 84 85 86
(Aug 03) (Sep 03) (Oct 03) (Nov 03) (Jun 10) (Jul 10) (Aug 10) (Sep 10)
ARW,1 (1st
month return) AR1,1 AR1,2 AR1,3 AR1,4
……
AR1,83 AR1,84 AR1,85 AR1,86
AR(W,2) AR2,1 AR2,2 AR2,3 AR2,4 AR2,83 AR2,84 AR2,85 AR2,86
AR(W,3) AR3,1 AR3,2 AR3,3 AR3,4
……
AR3,83 AR3,84 AR3,85 AR3,86
AR(W),4) AR4,1 AR4,2 AR4,3 AR4,4 AR4,83 AR4,84 AR4,85 AR4,86
AR(W,5) AR5,1 AR5,2 AR5,3 AR5,4
……
AR5,83 AR5,84 AR5,85 AR5,86
AR(W,6) AR6,1 AR6,2 AR6,3 AR6,4 AR6,83 AR6,84 AR6,85 AR6,86
AR(W,7) AR7,1 AR7,2 AR7,3 AR7,4
……
AR7,83 AR7,84 AR7,85 AR7,86
AR(W,8) AR8,1 AR8,2 AR8,3 AR8,4 AR8,83 AR8,84 AR8,85 AR8,86
AR(W,9) AR9,1 AR9,2 AR9,3 AR9,4
……
AR9,83 AR9,84 AR9,85 AR9,86
AR(W,10) AR10,1 AR10,2 AR10,3 AR10,4 AR10,83 AR10,84 AR10,85 AR10,86
AR(W,11) AR11,1 AR11,2 AR11,3 AR11,4
……
AR11,83 AR11,84 AR11,85 AR11,86
AR(W,12)
(12th month
return) AR12,1 AR12,2 AR12,3 AR12,4 AR12,83 AR12,84 AR12,85 AR12,86
Step 3: Calculating Cumulative Average Returns
The monthly ARs (in Matrix 2) are used to calculate the Cumulative Average Returns (CARs) in
each month (t), where t=1,…, 12 during holding period, this step is repeated 86 times each i.e.
for 86 winner and 86 loser portfolios for 6x12 strategy as shown in the Matrix 3.
13
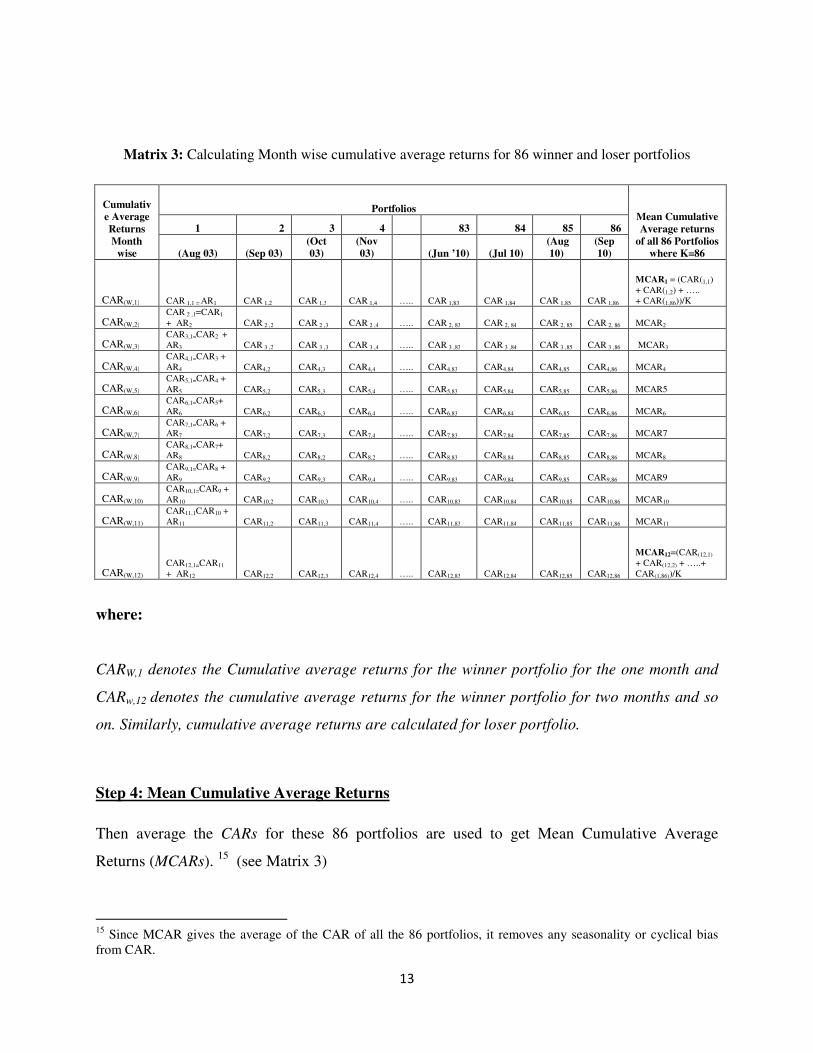
Matrix 3: Calculating Month wise cumulative average returns for 86 winner and loser portfolios
Cumulativ
e Average
Returns
Month
wise
Portfolios Mean Cumulative
Average returns
of all 86 Portfolios
where K=86
1 2 3 4 83 84 85 86
(Aug 03) (Sep 03)
(Oct
03)
(Nov
03) (Jun ’10) (Jul 10)
(Aug
10)
(Sep
10)
CAR(W,1) CAR 1,1 = AR1 CAR 1,2 CAR 1,3 CAR 1,4 ….. CAR 1,83 CAR 1,84 CAR 1,85 CAR 1,86
MCAR1 = (CAR(1,1)
+ CAR(1,2) + …..
+ CAR(1,86))/K
CAR(W,2) CAR 2 ,1=CAR1
+ AR2 CAR 2 ,2 CAR 2 ,3 CAR 2 ,4 ….. CAR 2, 83 CAR 2, 84 CAR 2, 85 CAR 2, 86 MCAR2
CAR(W,3) CAR3,1=CAR2 +
AR3 CAR 3 ,2 CAR 3 ,3 CAR 3 ,4 ….. CAR 3 ,83 CAR 3 ,84 CAR 3 ,85 CAR 3 ,86 MCAR3
CAR(W,4) CAR4,1=CAR3 +
AR4 CAR4,2 CAR4,3 CAR4,4 ….. CAR4,83 CAR4,84 CAR4,85 CAR4,86 MCAR4
CAR(W,5) CAR5,1=CAR4 +
AR5 CAR5,2 CAR5,3 CAR5,4 ….. CAR5,83 CAR5,84 CAR5,85 CAR5,86 MCAR5
CAR(W,6) CAR6,1=CAR5+
AR6 CAR6,2 CAR6,3 CAR6,4 ….. CAR6,83 CAR6,84 CAR6,85 CAR6,86 MCAR6
CAR(W,7) CAR7,1=CAR6 +
AR7 CAR7,2 CAR7,3 CAR7,4 ….. CAR7,83 CAR7,84 CAR7,85 CAR7,86 MCAR7
CAR(W,8) CAR8,1=CAR7+
AR8 CAR8,2 CAR8,2 CAR8,2 ….. CAR8,83 CAR8,84 CAR8,85 CAR8,86 MCAR8
CAR(W,9) CAR9,1=CAR8 +
AR9 CAR9,2 CAR9,3 CAR9,4 ….. CAR9,83 CAR9,84 CAR9,85 CAR9,86 MCAR9
CAR(W,10) CAR10,1=CAR9 +
AR10 CAR10,2 CAR10,3 CAR10,4 ….. CAR10,83 CAR10,84 CAR10,85 CAR10,86 MCAR10
CAR(W,11) CAR11,1CAR10 +
AR11 CAR11,2 CAR11,3 CAR11,4 ….. CAR11,83 CAR11,84 CAR11,85 CAR11,86 MCAR11
CAR(W,12) CAR12,1=CAR11
+ AR12 CAR12,2 CAR12,3 CAR12,4 ….. CAR12,83 CAR12,84 CAR12,85 CAR12,86
MCAR12=(CAR(12,1)
+ CAR(12,2) + …..+
CAR(1,86))/K
where:
CARW,1 denotes the Cumulative average returns for the winner portfolio for the one month and
CARw,12 denotes the cumulative average returns for the winner portfolio for two months and so
on. Similarly, cumulative average returns are calculated for loser portfolio.
Step 4: Mean Cumulative Average Returns
Then average the CARs for these 86 portfolios are used to get Mean Cumulative Average
Returns (MCARs). 15
(see Matrix 3)
15
Since MCAR gives the average of the CAR of all the 86 portfolios, it removes any seasonality or cyclical bias
from CAR.
14
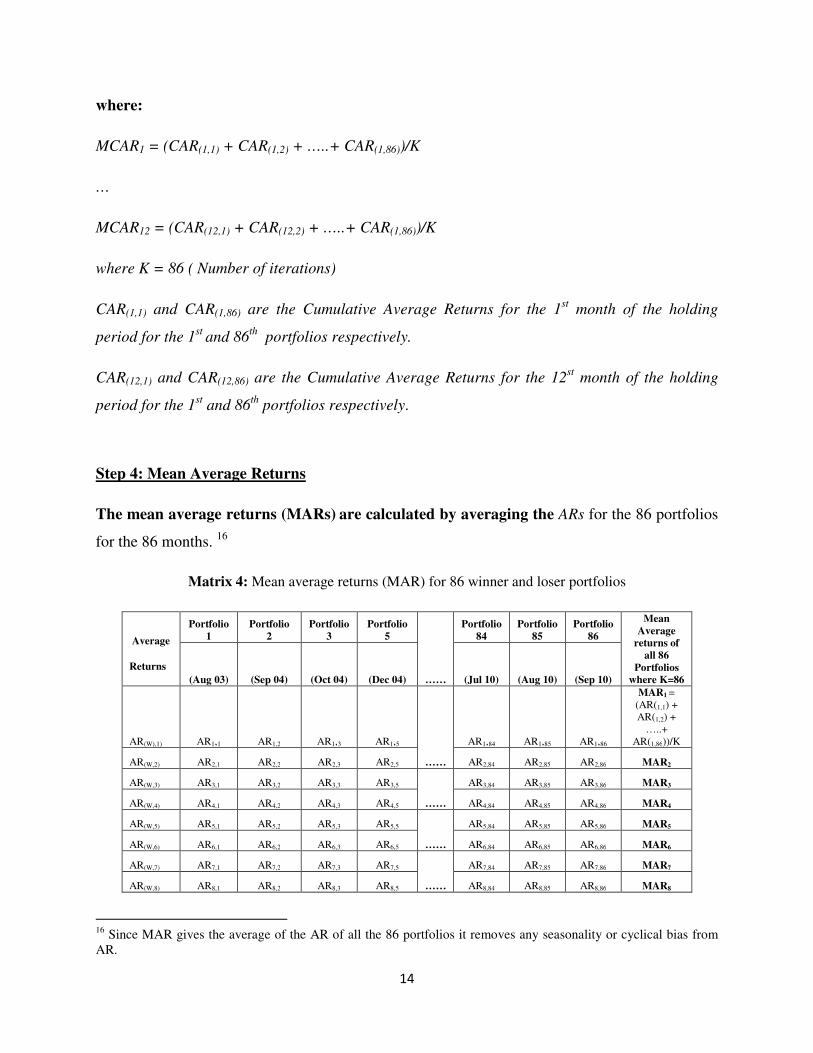
where:
MCAR1 = (CAR(1,1) + CAR(1,2) + …..+ CAR(1,86))/K
…
MCAR12 = (CAR(12,1) + CAR(12,2) + …..+ CAR(1,86))/K
where K = 86 ( Number of iterations)
CAR(1,1) and CAR(1,86) are the Cumulative Average Returns for the 1st month of the holding
period for the 1st
and 86th
portfolios respectively.
CAR(12,1) and CAR(12,86) are the Cumulative Average Returns for the 12st month of the holding
period for the 1st and 86
th portfolios respectively.
Step 4: Mean Average Returns
The mean average returns (MARs) are calculated by averaging the ARs for the 86 portfolios
for the 86 months. 16
Matrix 4: Mean average returns (MAR) for 86 winner and loser portfolios
Average
Returns
Portfolio
1
Portfolio
2
Portfolio
3
Portfolio
5
……
Portfolio
84
Portfolio
85
Portfolio
86
Mean
Average
returns of
all 86
Portfolios
where K=86 (Aug 03) (Sep 04) (Oct 04) (Dec 04) (Jul 10) (Aug 10) (Sep 10)
AR(W),1) AR1,1 AR1,2 AR1,3 AR1,5
……
AR1,84 AR1,85 AR1,86
MAR1 =
(AR(1,1) +
AR(1,2) +
…..+
AR(1,86))/K
AR(W,2) AR2,1 AR2,2 AR2,3 AR2,5 AR2,84 AR2,85 AR2,86 MAR2
AR(W,3) AR3,1 AR3,2 AR3,3 AR3,5
……
AR3,84 AR3,85 AR3,86 MAR3
AR(W,4) AR4,1 AR4,2 AR4,3 AR4,5 AR4,84 AR4,85 AR4,86 MAR4
AR(W,5) AR5,1 AR5,2 AR5,3 AR5,5
……
AR5,84 AR5,85 AR5,86 MAR5
AR(W,6) AR6,1 AR6,2 AR6,3 AR6,5 AR6,84 AR6,85 AR6,86 MAR6
AR(W,7) AR7,1 AR7,2 AR7,3 AR7,5
……
AR7,84 AR7,85 AR7,86 MAR7
AR(W,8) AR8,1 AR8,2 AR8,3 AR8,5 AR8,84 AR8,85 AR8,86 MAR8
16
Since MAR gives the average of the AR of all the 86 portfolios it removes any seasonality or cyclical bias from
AR.
15
Average
Returns
Portfolio
1
Portfolio
2
Portfolio
3
Portfolio
5
……
Portfolio
84
Portfolio
85
Portfolio
86
Mean
Average
returns of
all 86
Portfolios
where K=86 (Aug 03) (Sep 04) (Oct 04) (Dec 04) (Jul 10) (Aug 10) (Sep 10)
AR(W(L),9) AR9,1 AR9,2 AR9,3 AR9,5
……
AR9,84 AR9,85 AR9,86 MAR9
AR(W(L),10) AR10,1 AR10,2 AR10,3 AR10,5 AR10,84 AR10,85 AR10,86 MAR10
AR(W(L),11) AR11,1 AR11,2 AR11,3 AR11,5
……
AR11,84 AR11,85 AR11,86 MAR11
AR(W(L),12) AR12,1 AR12,2 AR12,3 AR12,5 AR12,84 AR12,85 AR12,86
MAR12 =
(AR(12,1) +
AR(12,2) +
…..+
AR(1,86))/K
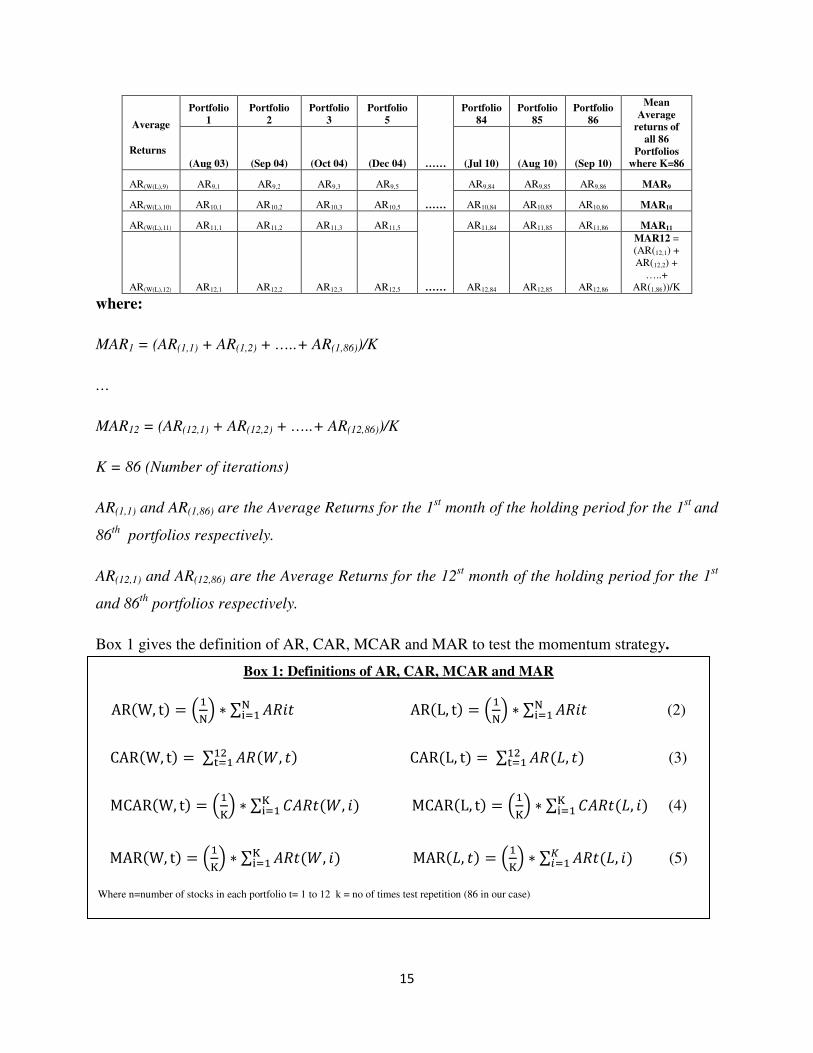
where:
MAR1 = (AR(1,1) + AR(1,2) + …..+ AR(1,86))/K
…
MAR12 = (AR(12,1) + AR(12,2) + …..+ AR(12,86))/K
K = 86 (Number of iterations)
AR(1,1) and AR(1,86) are the Average Returns for the 1st month of the holding period for the 1
st and
86th
portfolios respectively.
AR(12,1) and AR(12,86) are the Average Returns for the 12st month of the holding period for the 1
st
and 86th
portfolios respectively.
Box 1 gives the definition of AR, CAR, MCAR and MAR to test the momentum strategy.
Box 1: Definitions of AR, CAR, MCAR and MAR
AR�W, t� � ���� � ∑ �������� AR�L, t� � ���� � ∑ �����
��� (2)
CAR�W, t� � ∑ ����, ������ CAR�L, t� � ∑ ����, ����
�� (3)
MCAR�W, t� � �� � � ∑ !�����, �� ��� MCAR�L, t� � �� � � ∑ !�����, ��
��� (4)
MAR�W, t� � �� � � ∑ �����, �� ��� MAR��, �� � �� � � ∑ �����, ��"
#�� (5)
Where n=number of stocks in each portfolio t= 1 to 12 k = no of times test repetition (86 in our case)
16
Test of Significance
MCARW (MCARL) indicates how much cumulated returns stocks in the winner (loser) portfolio
earn on an average during 12 months in test period.
If markets are efficient but weak then MCARW minus MCARL must be equal to zero.
The momentum hypothesis implies that MCARw minus MCARL > 0.
The two tests -- MCAR and MAR are used to test the hypothesis. The test of MCAR verifies
significance of momentum returns and show if the returns grow stronger or are reversed at some
stage during holding period on a cumulative basis. The test of MAR helps one to identify on a
monthly basis whether the momentum returns are getting built up or reversed. Before analyzing
the results of momentum hypothesis from MCAR test and MAR test, it is to be noted that one
has to look at the returns of the momentum portfolio i.e. the return of the winner portfolio (W)
minus the return of the loser portfolio (L). 17
Therefore, if the momentum profits exist then
winners should always outperform losers irrespective of the direction of the market movement
and thereby generate absolute positive returns. Let us understand this by following two possible
scenarios.
Scenario 1: Market Goes Up
If the entire market goes up significantly say by 10 percent, both the winner as well as loser
portfolios would generate positive returns. The only difference being that winner portfolio would
outperform the market and may earn 12 percent returns whereas the loser portfolio would
underperform the market and may earn only 8 percent. Therefore, the momentum portfolio i.e.
W minus L would yield a return of 12 percent – 8 percent = 4 percent.
Scenario-2: Market Goes Down
If the entire market goes down by 10 percent, both the winner as well loser portfolios would
expectedly generate negative returns. The only difference being that the winner portfolio would
17
As mentioned earlier, in the momentum investment strategy one has to simultaneously buy the winner
portfolio(W) and sell the loser portfolio (L).
17
lose percent while the loser portfolio would underperform and may go down by 12 percent.
Therefore the momentum portfolio i.e. W minus L would yield a return of -8 percent -(-12
percent) = 4 percent.
Thus, an important point to be noted is that irrespective of direction of market movement, the
momentum portfolio (W minus L) would generate absolute positive return of 4 percent. This is
also known as a zero beta or non-directional strategy.
IV. Results and Analysis
In this section, we analyze the results of the 6 x 12 strategy using MCAR and MAR tests
explained in section IVA and IV B.
IVA. Mean Cumulative Average Returns Test
MCARt of a portfolio shows the cumulated returns of the portfolio till the tth
month (for example
MCAR3 denotes mean cumulative average returns of 86 winner and loser portfolios in the third
month).
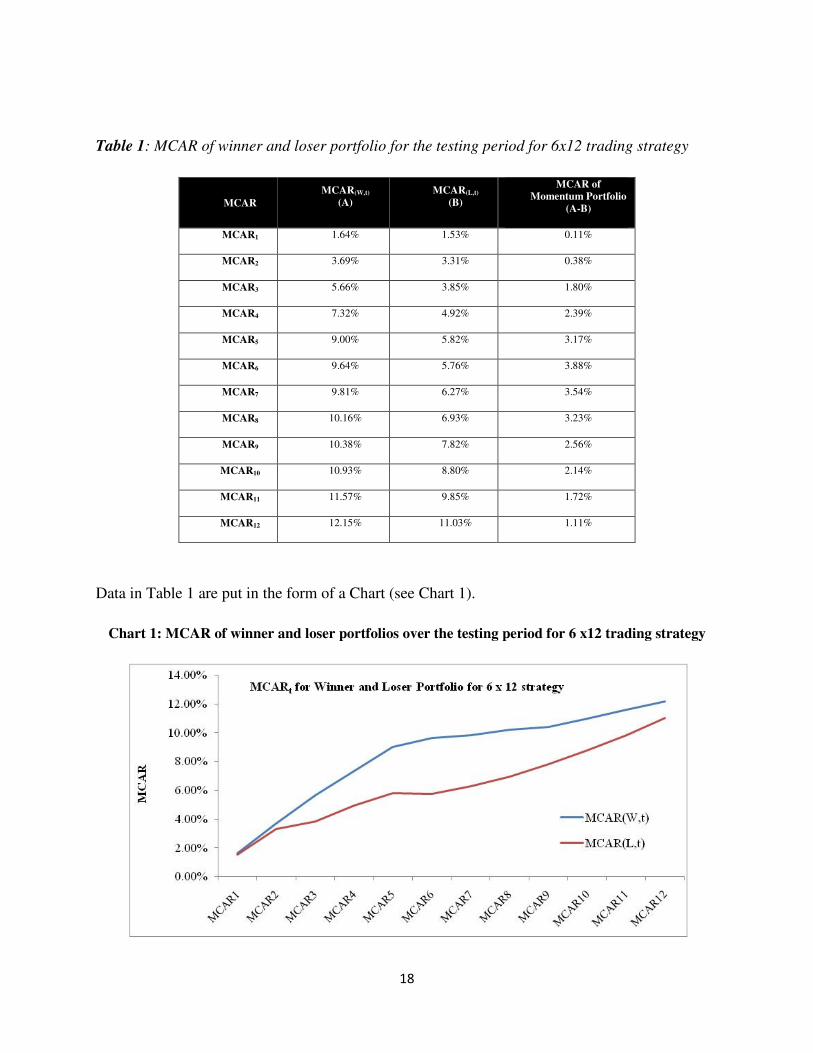
As shown in Table 1, the winner portfolio delivers a 1.64 percent return in the first month of
testing period that goes on increasing to 12.14 percent in the 12th
month of the testing period.
Similarly, the MCAR of loser portfolio in the 1st month of the testing period is 1.53 percent,
which increases to 11.03 percent at the end of the 12th
month of the testing period. Column 3 of
table 1 gives the mean cumulated average return of the long winner and short loser portfolio.
The return on the momentum portfolio i.e. the difference between MCARW and MCARL,
becomes 3.88 percent in the 6th
month, which is the highest in the 12 months testing period and
reduces to 1.11 percent at the end of the 12 month testing period. Interestingly in this 12 month
testing period, the MCAR of loser portfolio remains positive. This can be contributed to the fact
that in the test period of January 2003 to August 2011, the CNX 100 saw a huge rally during
which it climbed to a peak of 6204 on 4th
January 2008, fell to a low of 2456 on October 24,
2008 and rose again to close at 4921 on 30th
August 2011.
18
Table 1: MCAR of winner and loser portfolio for the testing period for 6x12 trading strategy
MCAR
MCAR(W,t)
(A)
MCAR(L,t)
(B)
MCAR of
Momentum Portfolio
(A-B)
MCAR1 1.64% 1.53% 0.11%
MCAR2 3.69% 3.31% 0.38%
MCAR3 5.66% 3.85% 1.80%
MCAR4 7.32% 4.92% 2.39%
MCAR5 9.00% 5.82% 3.17%
MCAR6 9.64% 5.76% 3.88%
MCAR7 9.81% 6.27% 3.54%
MCAR8 10.16% 6.93% 3.23%
MCAR9 10.38% 7.82% 2.56%
MCAR10 10.93% 8.80% 2.14%
MCAR11 11.57% 9.85% 1.72%
MCAR12 12.15% 11.03% 1.11%
Data in Table 1 are put in the form of a Chart (see Chart 1).
Chart 1: MCAR of winner and loser portfolios over the testing period for 6 x12 trading strategy
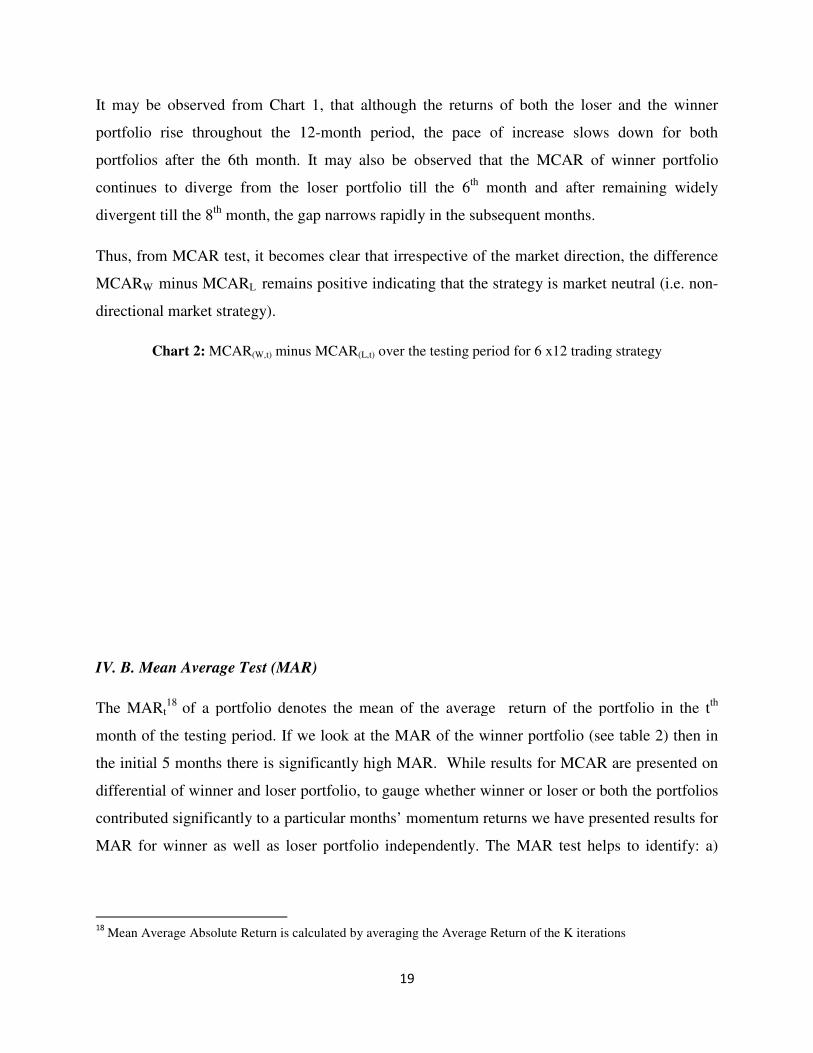
It may be observed from Chart 1
portfolio rise throughout the 12
portfolios after the 6th month.
continues to diverge from the loser portfolio
divergent till the 8th
month, the gap narrows rapidly in the subsequent months.
Thus, from MCAR test, it becomes clear that i
MCARW minus MCARL remains positive
directional market strategy).
Chart 2: MCAR(W,t) minus
IV. B. Mean Average Test (MAR)
The MARt18
of a portfolio denotes the mean of the average return of
month of the testing period. If we look at the
the initial 5 months there is significantly high
differential of winner and loser portfo
contributed significantly to a particular months
MAR for winner as well as loser portfolio independently.
18
Mean Average Absolute Return is calculated by averaging the Average Return of the K iter
19
It may be observed from Chart 1, that although the returns of both the loser and the winner
portfolio rise throughout the 12-month period, the pace of increase slows down for both
It may also be observed that the MCAR of winner portfolio
to diverge from the loser portfolio till the 6th
month and after rem
month, the gap narrows rapidly in the subsequent months.
Thus, from MCAR test, it becomes clear that irrespective of the market direction, the difference
remains positive indicating that the strategy is market neutral
minus MCAR(L,t) over the testing period for 6 x12 trading strategy
V. B. Mean Average Test (MAR)
of a portfolio denotes the mean of the average return of the portfolio in the t
month of the testing period. If we look at the MAR of the winner portfolio (see table
the initial 5 months there is significantly high MAR. While results for MCAR are presented on
differential of winner and loser portfolio, to gauge whether winner or loser or both the portfolios
contributed significantly to a particular months’ momentum returns we have presented results for
MAR for winner as well as loser portfolio independently. The MAR test helps to identify: a)
Mean Average Absolute Return is calculated by averaging the Average Return of the K iterations
, that although the returns of both the loser and the winner
month period, the pace of increase slows down for both
the MCAR of winner portfolio
fter remaining widely
rrespective of the market direction, the difference
strategy is market neutral (i.e. non-
over the testing period for 6 x12 trading strategy
the portfolio in the tth
(see table 2) then in
While results for MCAR are presented on
whether winner or loser or both the portfolios
momentum returns we have presented results for
helps to identify: a)
ations
20
whether it is the winner portfolio or loser portfolio that runs out of momentum and b) returns of
which portfolio (winner or loser) are reversed in the first instance.
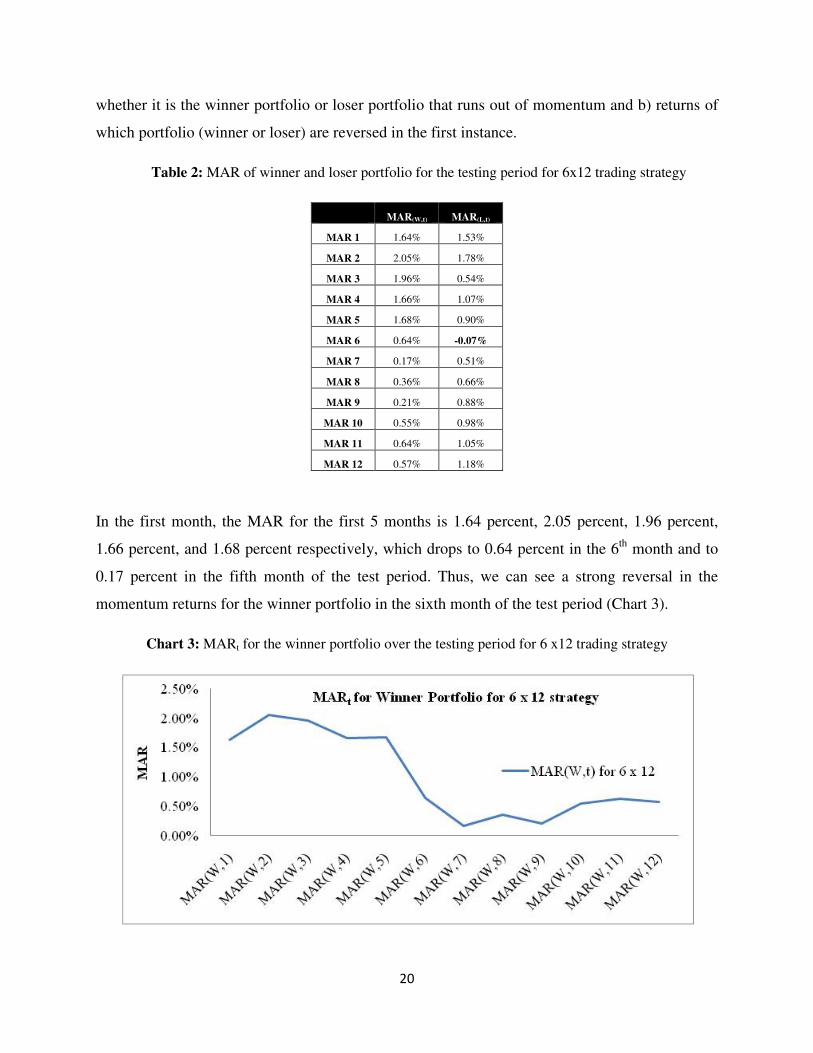
Table 2: MAR of winner and loser portfolio for the testing period for 6x12 trading strategy
MAR(W,t) MAR(L,t)
MAR 1 1.64% 1.53%
MAR 2 2.05% 1.78%
MAR 3 1.96% 0.54%
MAR 4 1.66% 1.07%
MAR 5 1.68% 0.90%
MAR 6 0.64% -0.07%
MAR 7 0.17% 0.51%
MAR 8 0.36% 0.66%
MAR 9 0.21% 0.88%
MAR 10 0.55% 0.98%
MAR 11 0.64% 1.05%
MAR 12 0.57% 1.18%
In the first month, the MAR for the first 5 months is 1.64 percent, 2.05 percent, 1.96 percent,
1.66 percent, and 1.68 percent respectively, which drops to 0.64 percent in the 6th
month and to
0.17 percent in the fifth month of the test period. Thus, we can see a strong reversal in the
momentum returns for the winner portfolio in the sixth month of the test period (Chart 3).
Chart 3: MARt for the winner portfolio over the testing period for 6 x12 trading strategy
21
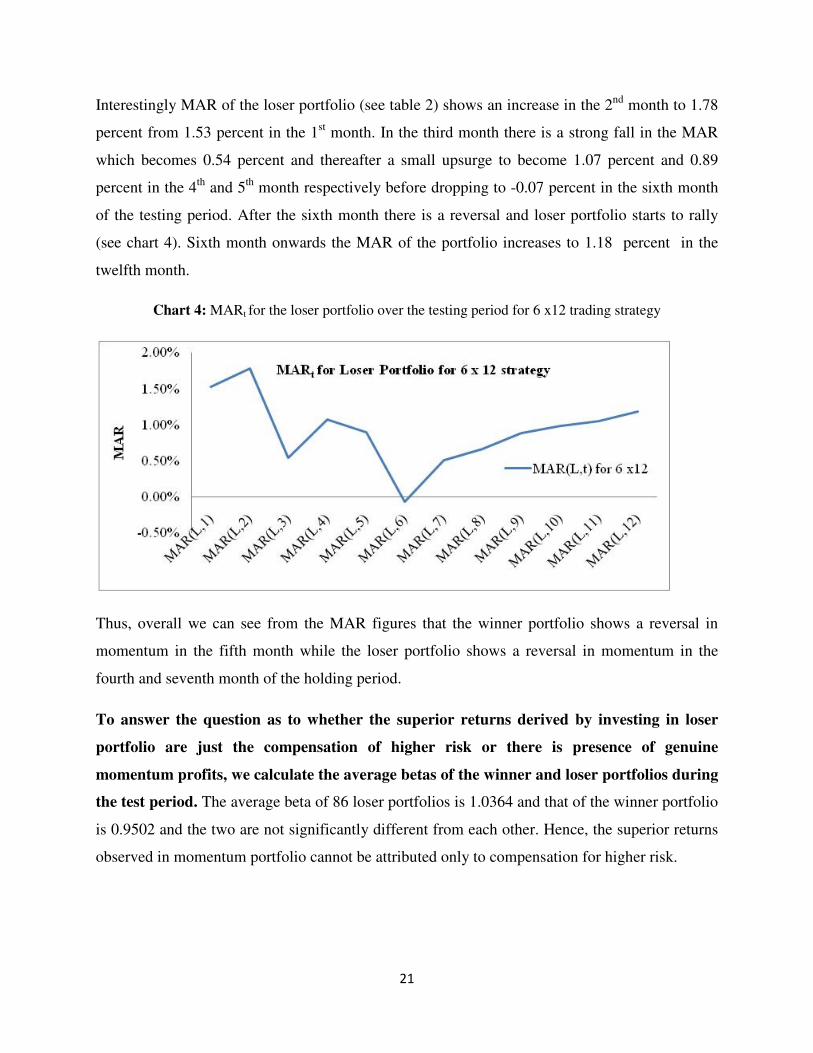
Interestingly MAR of the loser portfolio (see table 2) shows an increase in the 2nd
month to 1.78
percent from 1.53 percent in the 1st month. In the third month there is a strong fall in the MAR
which becomes 0.54 percent and thereafter a small upsurge to become 1.07 percent and 0.89
percent in the 4th
and 5th
month respectively before dropping to -0.07 percent in the sixth month
of the testing period. After the sixth month there is a reversal and loser portfolio starts to rally
(see chart 4). Sixth month onwards the MAR of the portfolio increases to 1.18 percent in the
twelfth month.
Chart 4: MARt for the loser portfolio over the testing period for 6 x12 trading strategy
Thus, overall we can see from the MAR figures that the winner portfolio shows a reversal in
momentum in the fifth month while the loser portfolio shows a reversal in momentum in the
fourth and seventh month of the holding period.
To answer the question as to whether the superior returns derived by investing in loser
portfolio are just the compensation of higher risk or there is presence of genuine
momentum profits, we calculate the average betas of the winner and loser portfolios during
the test period. The average beta of 86 loser portfolios is 1.0364 and that of the winner portfolio
is 0.9502 and the two are not significantly different from each other. Hence, the superior returns
observed in momentum portfolio cannot be attributed only to compensation for higher risk.
22
To test whether the momentum profits do exist in shorter formation and holding period, the study
is done for shorter duration formation and holding periods. The results for 3x3, 3x6 and 3x12
strategies are explained with the help of tables and charts in Annexure 2 and Annexure 3.
Clearly, the momentum returns do exist for almost all the combinations of formation and holding
periods. It is also evident from the discussion of 6x12 strategy that though MCAR remains
positive for the entire holding period, from seventh month onwards loser portfolio shows
superior MAR to the winner portfolio, implying that the trend of winner portfolio outperforming
loser portfolio is completely getting reversed. It shows that going by the results of this study, for
a momentum portfolio formed using six months returns, it is better to have a holding period for
six months rather than of 12 months. Because one can see, that momentum loses steam from
seventh month onwards. Having said that, it is worth mentioning here that this conclusion is
based on the result of current study only.
V. Implementation issues
Most studies on momentum investment strategies assume zero-cost portfolios, zero transaction
costs, ability to short-sale the desired stocks and ignores the impact of block deals on prices and
the constraints imposed by regulations. However, these factors affect implementation of
momentum-based investment strategies and have been classified as avoidable and unavoidable
factors and examined in some detail. 19
Unavoidable Factors
Explicit trading costs and price pressures
Scalability of momentum investment strategies is limited by explicit trading costs20
and price
pressures due to large trade blocks. Large funds trading on momentum strategy execute block
19
Bushee and Raedy (2005) divided these factors into two main categories—unavoidable, and avoidable.Though
many researcher before them have researched solely on one or the other factor affecting the strategy, have been
explained in this section.
20 Explicit trading costs include commissions, fees and taxes.
23
trades; however, the implicit price pressure costs of such trades reduce the expected returns from
this strategy. 21
Short Sale
In short sale, the stock to be shorted is borrowed by the short seller from a lender. In case a stock
is recalled by the lender, the portfolio manager has to take up additional transaction costs to
maintain his short position in the security, which reduces the return of the portfolio. The longer
the period of short position the greater is the probability of the stock being recalled. Thus, the
cost of borrowing stocks and the possibility of the borrowed stock being recalled by the lender
makes it difficult for funds to exploit the short-selling possibilities.
Futures market
Futures market provides another mechanism to short an individual stock. Advantages of futures
market include low transaction costs and high liquidity and therefore low impact costs. Roll-over
costs come into picture when a short position has to be maintained beyond three months since the
maturity period for futures contracts is three months.
Avoidable factors
Maximum portfolio weight constraint
Under Indian regulations, a mutual fund scheme cannot invest more than 10 percent of its NAV
in the equity shares/equity-related instruments of any company except in the case of an index
fund or an industry-specific scheme.22
Therefore, this constraint does not allow mutual funds to
build such portfolios where one needs to put more than 10 percent in a particular stock. This
point can be explained with the help of an example. In the strategy explained in this paper if
during a month we have 90 stocks which have to be divided into ten deciles, it means that we
will have nine stocks each in the winner and a loser portfolio. In such a case, if we have to create
equally weighted winner or loser portfolio (as required by this strategy) we need to put more
21
Many studies have documented significant price impact of large block trades. These studies done by Holthausen
(1987), Chan and Lakonishok (1993/1995), Keim and Madhavan (1997) found that price impact increases with
increasing transaction size and decreases with increasing stock price and market capitalization of the stock. 22
KPMG India Funds and Fund Management 2010
24
than ten percent in each stock and that may not be allowed under current set of regulations. This
constraint can however be avoided by creating portfolios of more than 10 stocks.
Fund management characteristics
Mutual funds can manage their portfolios using equally weighted investments or market
capitalization-weighted investments. While equally weighted portfolios tend to be biased in
favour of smaller firms as compared to larger (as it does not differentiate stocks based on their
relative size), market-cap weighted portfolios tend to be dominated by larger stocks. However,
portfolio managers can avoid such limitations by choosing an appropriate screening process. For
instance in this study, where we have used equally weighted portfolios, we have eliminated the
potential bias (exerted by small cap stocks) by using only the constitutes of CNX 100 (which are
the top 100 stocks).
VI. Conclusion
There is strong evidence of momentum profit for the short-term formation-test period. For each
of the trading strategies 3x3, 3x6, 3x12 and 6x12, we found presence of momentum profits.
After a period of 6 to 8 months, reversal in momentum takes place, as the winner and loser
portfolio returns start to converge. Further, it was found that the average risk of the winner
portfolios was not significantly different to loser portfolio, thus proving evidence that the
superior momentum returns are not only due to compensation for higher risk. In other words,
there is empirical evidence against weak form of market efficiency in the Indian market. These
results are consistent with those of the seminal studies by Jegadeesh and Titman (1993, 2001)
and De Bondt & Thaler (1985, 1987 and 1990) in the US markets. To conclude, the study
provides a strong evidence of short-term profits through the use of momentum strategy.
25
References
Barberis N. Shleifer A. and Vishny R. (1998). “A Model of Investor Sentiment.” Journal of
Financial Economics, 49, pp. 307-343.
Bushee B. and Raedy J. (2005). “Factors Affecting the Implementability of Stock Market
Trading Strategies.” Working Paper, University of Pennsylvania and University of North
Carolina, Chapel Hill.
Chan L. and Lakonishok J. (1993). “Institutional Trades and Intraday Stock Price Behavior.”
Journal of Financial Economics 33, pp. 173-200.
Chan L. and Lakonishok J. (1995). “The Behavior of Stock Prices around Institutional Trades.”
Journal of Finance, 50, pp. 1147-1174.
Chui A.C.W., Titman S., and Wei K.C.J. (2000). “Momentum, Legal Systems and Ownership
Structure: an Analysis of Asian Stock Markets.” Working paper, Hong Kong University of
Science and Technology.
Daniel K., Hirshleifer D., and Subrahmanyam A. (1998). "Investor Psychology and Security
Market Under and Overreactions." Journal of Finance, 53, pp.1839–1885.
De Bondt W. and Thaler R. (1985). “Does the Stock Market Overact ?” Journal of Finance, 40,
pp.793-808.
D’Avolio G. (2002). “The Market for Borrowing Stock.” Journal of Financial Economics, 66,
pp. 271-306.
Fama E. (1970). “Efficient Capital Markets: a Review of Theory and Empirical Work.” Journal
of Finance, 25 pp. 383-417.
26
Fama E. and French K. (1996). “Multifactor Explanations of Asset Pricing Anomalies.” Journal
of Finance, 51, pp. 55-84.
Grundy B. and Spencer M. (2001). “Understanding the Nature of the Risks and the Source of the
Rewards to Momentum Investing.” Review of Financial Studies, 14, pp. 29-78.
Hong H. and Stein J.C. (1999). “A Unified Theory of Underreaction, Momentum Trading, and
Overreaction in Asset Markets.” Journal of Finance, 54, pp. 2143-2184.
Holthausen R., Leftwich R., and Mayers D. (1987). “The Effect of Large Block Transactions on
Security Prices.” Journal of Financial Economics, 19, pp. 237-267.
Jegadeesh N. and Titman S. (1993). “Return to Buy Winners and Selling Losers: Implications for
Stock Market Efficiency.” Journal of Finance, 48, pp.65-91.
Keim D. and Madhavan A. (1997). “Transactions Costs and Investment Style: an Inter-Exchange
Analysis of Institutional Equity Trades.” Journal of Financial Economics 46, pp. 265-292.
Korajczyk R. and Sadka R. (2002). “Are Momentum Profits Robust to Trading Costs?” Working
paper 289, Kellogg Graduate School of Management, Northwestern University.
Rouwenhorst K.G. (1998). “International Momentum Strategies.” Journal of Finance, 53,
pp.267-284.
Sequin P. and Smoller M. (1997). “Share Price and Mortality: an Empirical Evaluation of Newly
Listed NASDAQ Stocks.” Journal of Financial Economic, 45, pp.333-363.
27
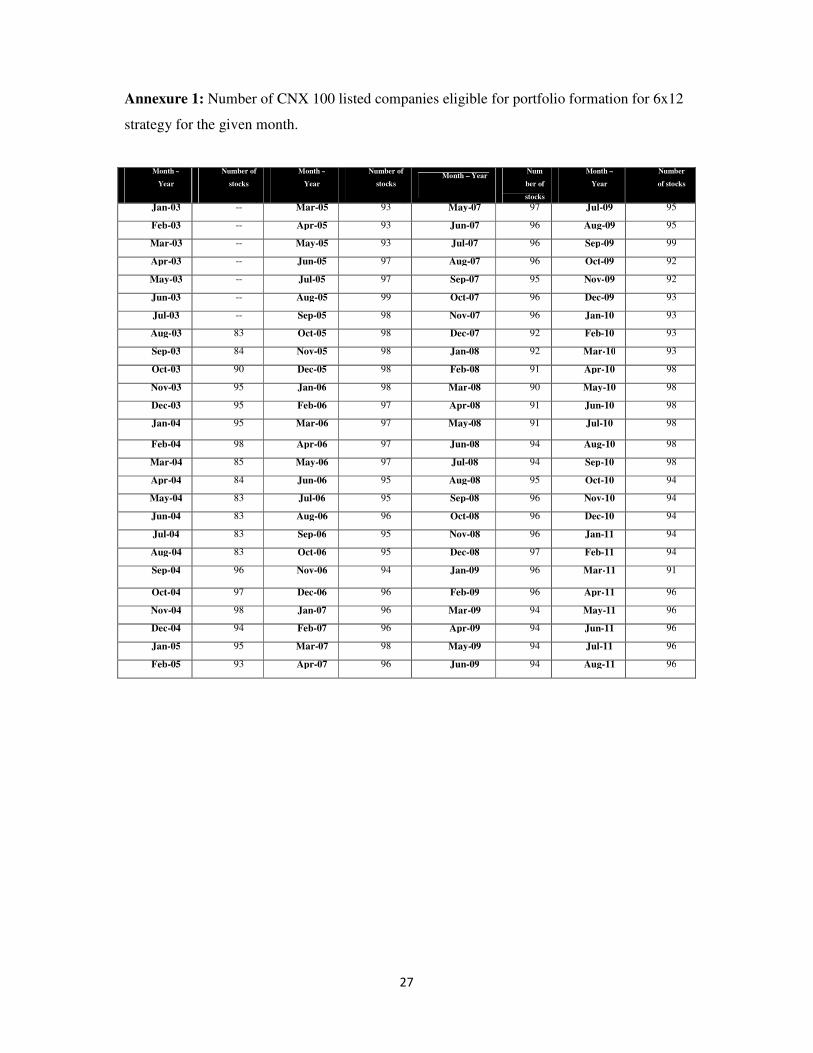
Annexure 1: Number of CNX 100 listed companies eligible for portfolio formation for 6x12
strategy for the given month.
Month –
Year
Number of
stocks
Month –
Year
Number of
stocks Month – Year
Num
ber of
stocks
Month –
Year
Number
of stocks
Jan-03 -- Mar-05 93 May-07 97 Jul-09 95
Feb-03 -- Apr-05 93 Jun-07 96 Aug-09 95
Mar-03 -- May-05 93 Jul-07 96 Sep-09 99
Apr-03 -- Jun-05 97 Aug-07 96 Oct-09 92
May-03 -- Jul-05 97 Sep-07 95 Nov-09 92
Jun-03 -- Aug-05 99 Oct-07 96 Dec-09 93
Jul-03 -- Sep-05 98 Nov-07 96 Jan-10 93
Aug-03 83 Oct-05 98 Dec-07 92 Feb-10 93
Sep-03 84 Nov-05 98 Jan-08 92 Mar-10 93
Oct-03 90 Dec-05 98 Feb-08 91 Apr-10 98
Nov-03 95 Jan-06 98 Mar-08 90 May-10 98
Dec-03 95 Feb-06 97 Apr-08 91 Jun-10 98
Jan-04 95 Mar-06 97 May-08 91 Jul-10 98
Feb-04 98 Apr-06 97 Jun-08 94 Aug-10 98
Mar-04 85 May-06 97 Jul-08 94 Sep-10 98
Apr-04 84 Jun-06 95 Aug-08 95 Oct-10 94
May-04 83 Jul-06 95 Sep-08 96 Nov-10 94
Jun-04 83 Aug-06 96 Oct-08 96 Dec-10 94
Jul-04 83 Sep-06 95 Nov-08 96 Jan-11 94
Aug-04 83 Oct-06 95 Dec-08 97 Feb-11 94
Sep-04 96 Nov-06 94 Jan-09 96 Mar-11 91
Oct-04 97 Dec-06 96 Feb-09 96 Apr-11 96
Nov-04 98 Jan-07 96 Mar-09 94 May-11 96
Dec-04 94 Feb-07 96 Apr-09 94 Jun-11 96
Jan-05 95 Mar-07 98 May-09 94 Jul-11 96
Feb-05 93 Apr-07 96 Jun-09 94 Aug-11 96
28
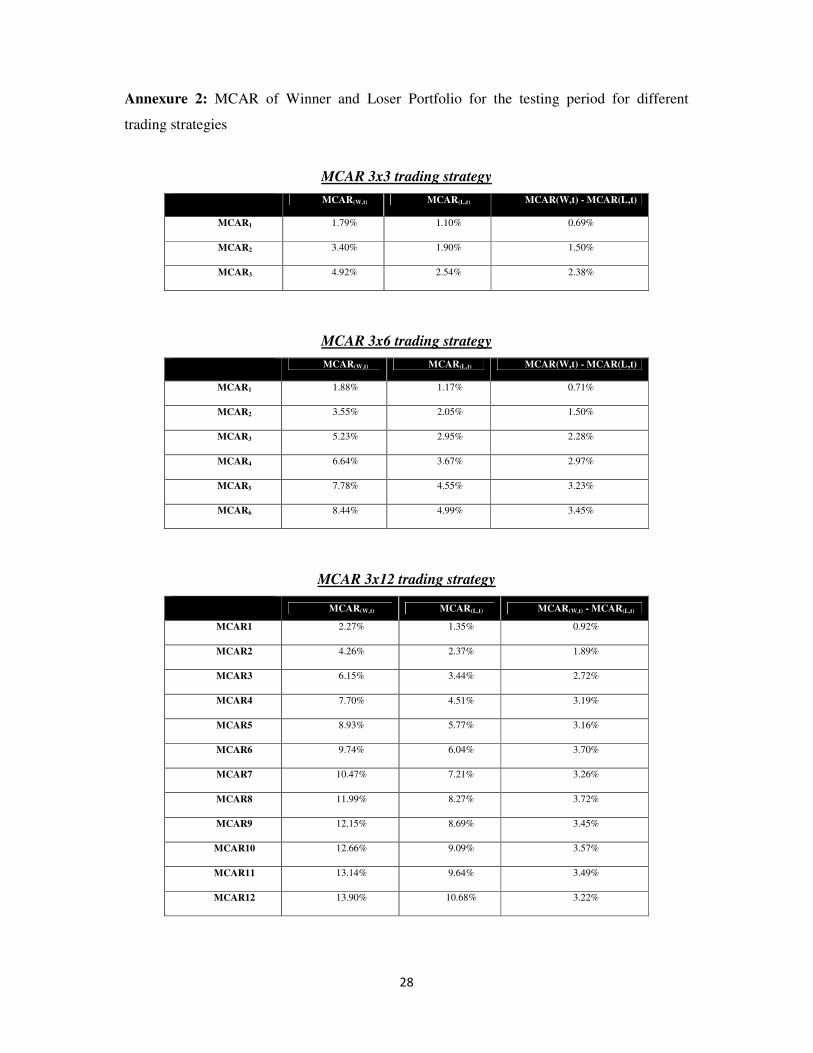
Annexure 2: MCAR of Winner and Loser Portfolio for the testing period for different
trading strategies
MCAR 3x3 trading strategy
MCAR(W,t) MCAR(L,t) MCAR(W,t) - MCAR(L,t)
MCAR1 1.79% 1.10% 0.69%
MCAR2 3.40% 1.90% 1.50%
MCAR3 4.92% 2.54% 2.38%
MCAR 3x6 trading strategy
MCAR(W,t) MCAR(L,t) MCAR(W,t) - MCAR(L,t)
MCAR1 1.88% 1.17% 0.71%
MCAR2 3.55% 2.05% 1.50%
MCAR3 5.23% 2.95% 2.28%
MCAR4 6.64% 3.67% 2.97%
MCAR5 7.78% 4.55% 3.23%
MCAR6 8.44% 4.99% 3.45%
MCAR 3x12 trading strategy
MCAR(W,t) MCAR(L,t) MCAR(W,t) - MCAR(L,t)
MCAR1 2.27% 1.35% 0.92%
MCAR2 4.26% 2.37% 1.89%
MCAR3 6.15% 3.44% 2.72%
MCAR4 7.70% 4.51% 3.19%
MCAR5 8.93% 5.77% 3.16%
MCAR6 9.74% 6.04% 3.70%
MCAR7 10.47% 7.21% 3.26%
MCAR8 11.99% 8.27% 3.72%
MCAR9 12.15% 8.69% 3.45%
MCAR10 12.66% 9.09% 3.57%
MCAR11 13.14% 9.64% 3.49%
MCAR12 13.90% 10.68% 3.22%
29
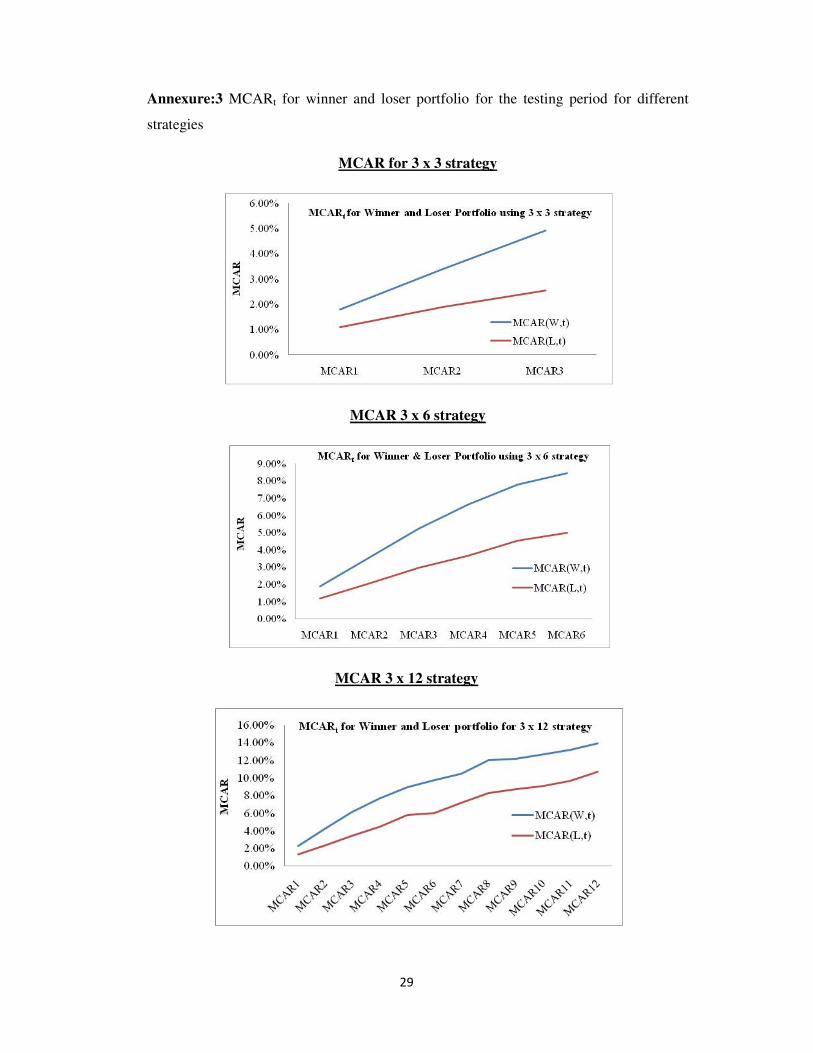
Annexure:3 MCARt for winner and loser portfolio for the testing period for different
strategies
MCAR for 3 x 3 strategy
MCAR 3 x 6 strategy
MCAR 3 x 12 strategy
30
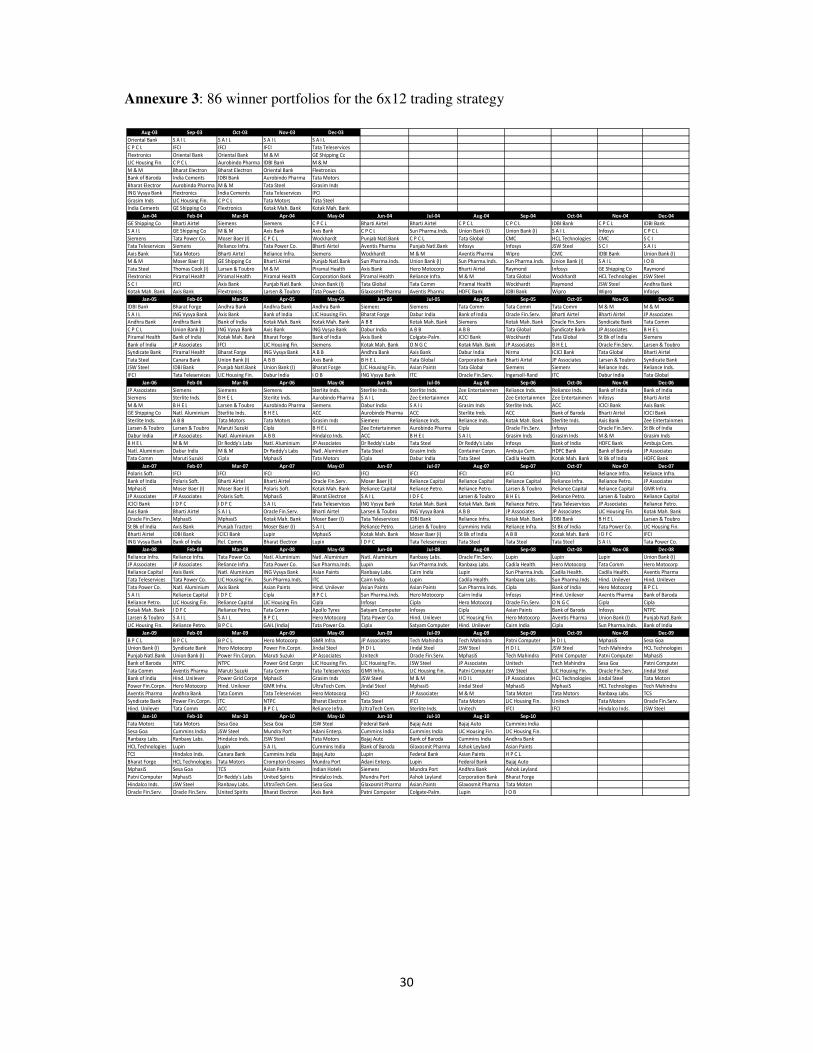
Annexure 3: 86 winner portfolios for the 6x12 trading strategy
Aug-03 Sep-03 Oct-03 Nov-03 Dec-03
Oriental Bank S A I L S A I L S A I L S A I L
C P C L IFCI IFCI IFCI Tata Teleservices
Flextronics Oriental Bank Oriental Bank M & M GE Shipping Co
LIC Housing Fin. C P C L Aurobindo Pharma IDBI Bank M & M
M & M Bharat Electron Bharat Electron Oriental Bank Flextronics
Bank of Baroda India Cements IDBI Bank Aurobindo Pharma Tata Motors
Bharat Electron Aurobindo Pharma M & M Tata Steel Grasim Inds
ING Vysya Bank Flextronics India Cements Tata Teleservices IFCI
Grasim Inds LIC Housing Fin. C P C L Tata Motors Tata Steel
India Cements GE Shipping Co Flextronics Kotak Mah. Bank Kotak Mah. Bank
Jan-04 Feb-04 Mar-04 Apr-04 May-04 Jun-04 Jul-04 Aug-04 Sep-04 Oct-04 Nov-04 Dec-04
GE Shipping Co Bharti Airtel Siemens Siemens C P C L Bharti Airtel Bharti Airtel C P C L C P C L IDBI Bank C P C L IDBI Bank
S A I L GE Shipping Co M & M Axis Bank Axis Bank C P C L Sun Pharma.Inds. Union Bank (I) Union Bank (I) S A I L Infosys C P C L
Siemens Tata Power Co. Moser Baer (I) C P C L Wockhardt Punjab Natl.Bank C P C L Tata Global CMC HCL Technologies CMC S C I
Tata Teleservices Siemens Reliance Infra. Tata Power Co. Bharti Airtel Aventis Pharma Punjab Natl.Bank Infosys Infosys JSW Steel S C I S A I L
Axis Bank Tata Motors Bharti Airtel Reliance Infra. Siemens Wockhardt M & M Aventis Pharma Wipro CMC IDBI Bank Union Bank (I)
M & M Moser Baer (I) GE Shipping Co Bharti Airtel Punjab Natl.Bank Sun Pharma.Inds. Union Bank (I) Sun Pharma.Inds. Sun Pharma.Inds. Union Bank (I) S A I L I O B
Tata Steel Thomas Cook (I) Larsen & Toubro M & M Piramal Health Axis Bank Hero Motocorp Bharti Airtel Raymond Infosys GE Shipping Co Raymond
Flextronics Piramal Health Piramal Health Piramal Health Corporation Bank Piramal Health Reliance Infra. M & M Tata Global Wockhardt HCL Technologies JSW Steel
S C I IFCI Axis Bank Punjab Natl.Bank Union Bank (I) Tata Global Tata Comm Piramal Health Wockhardt Raymond JSW Steel Andhra Bank
Kotak Mah. Bank Axis Bank Flextronics Larsen & Toubro Tata Power Co. Glaxosmit Pharma Aventis Pharma HDFC Bank IDBI Bank Wipro Wipro Infosys
Jan-05 Feb-05 Mar-05 Apr-05 May-05 Jun-05 Jul-05 Aug-05 Sep-05 Oct-05 Nov-05 Dec-05
IDBI Bank Bharat Forge Andhra Bank Andhra Bank Andhra Bank Siemens Siemens Tata Comm Tata Comm Tata Comm M & M M & M
S A I L ING Vysya Bank Axis Bank Bank of India LIC Housing Fin. Bharat Forge Dabur India Bank of India Oracle Fin.Serv. Bharti Airtel Bharti Airtel JP Associates
Andhra Bank Andhra Bank Bank of India Kotak Mah. Bank Kotak Mah. Bank A B B Kotak Mah. Bank Siemens Kotak Mah. Bank Oracle Fin.Serv. Syndicate Bank Tata Comm
C P C L Union Bank (I) ING Vysya Bank Axis Bank ING Vysya Bank Dabur India A B B A B B Tata Global Syndicate Bank JP Associates B H E L
Piramal Health Bank of India Kotak Mah. Bank Bharat Forge Bank of India Axis Bank Colgate-Palm. ICICI Bank Wockhardt Tata Global St Bk of India Siemens
Bank of India JP Associates IFCI LIC Housing Fin. Siemens Kotak Mah. Bank O N G C Kotak Mah. Bank JP Associates B H E L Oracle Fin.Serv. Larsen & Toubro
Syndicate Bank Piramal Health Bharat Forge ING Vysya Bank A B B Andhra Bank Axis Bank Dabur India Nirma ICICI Bank Tata Global Bharti Airtel
Tata Steel Canara Bank Union Bank (I) A B B Axis Bank B H E L Tata Global Corporation Bank Bharti Airtel JP Associates Larsen & Toubro Syndicate Bank
JSW Steel IDBI Bank Punjab Natl.Bank Union Bank (I) Bharat Forge LIC Housing Fin. Asian Paints Tata Global Siemens Siemens Reliance Inds. Reliance Inds.
IFCI Tata Teleservices LIC Housing Fin. Dabur India I O B ING Vysya Bank ITC Oracle Fin.Serv. Ingersoll-Rand ITC Dabur India Tata Global
Jan-06 Feb-06 Mar-06 Apr-06 May-06 Jun-06 Jul-06 Aug-06 Sep-06 Oct-06 Nov-06 Dec-06
JP Associates Siemens Siemens Siemens Sterlite Inds. Sterlite Inds. Sterlite Inds. Zee Entertainmen Reliance Inds. Reliance Inds. Bank of India Bank of India
Siemens Sterlite Inds. B H E L Sterlite Inds. Aurobindo Pharma S A I L Zee Entertainmen ACC Zee Entertainmen Zee Entertainmen Infosys Bharti Airtel
M & M B H E L Larsen & Toubro Aurobindo Pharma Siemens Dabur India S A I L Grasim Inds Sterlite Inds. ACC ICICI Bank Axis Bank
GE Shipping Co Natl. Aluminium Sterlite Inds. B H E L ACC Aurobindo Pharma ACC Sterlite Inds. ACC Bank of Baroda Bharti Airtel ICICI Bank
Sterlite Inds. A B B Tata Motors Tata Motors Grasim Inds Siemens Reliance Inds. Reliance Inds. Kotak Mah. Bank Sterlite Inds. Axis Bank Zee Entertainmen
Larsen & Toubro Larsen & Toubro Maruti Suzuki Cipla B H E L Zee Entertainmen Aurobindo Pharma Cipla Oracle Fin.Serv. Infosys Oracle Fin.Serv. St Bk of India
Dabur India JP Associates Natl. Aluminium A B B Hindalco Inds. ACC B H E L S A I L Grasim Inds Grasim Inds M & M Grasim Inds
B H E L M & M Dr Reddy's Labs Natl. Aluminium JP Associates Dr Reddy's Labs Tata Steel Dr Reddy's Labs Infosys Bank of India HDFC Bank Ambuja Cem.
Natl. Aluminium Dabur India M & M Dr Reddy's Labs Natl. Aluminium Tata Steel Grasim Inds Container Corpn. Ambuja Cem. HDFC Bank Bank of Baroda JP Associates
Tata Comm Maruti Suzuki Cipla MphasiS Tata Motors Cipla Dabur India Tata Steel Cadila Health. Kotak Mah. Bank St Bk of India HDFC Bank
Jan-07 Feb-07 Mar-07 Apr-07 May-07 Jun-07 Jul-07 Aug-07 Sep-07 Oct-07 Nov-07 Dec-07
Polaris Soft. IFCI IFCI IFCI IFCI IFCI IFCI IFCI IFCI IFCI Reliance Infra. Reliance Infra.
Bank of India Polaris Soft. Bharti Airtel Bharti Airtel Oracle Fin.Serv. Moser Baer (I) Reliance Capital Reliance Capital Reliance Capital Reliance Infra. Reliance Petro. JP Associates
MphasiS Moser Baer (I) Moser Baer (I) Polaris Soft. Kotak Mah. Bank Reliance Capital Reliance Petro. Reliance Petro. Larsen & Toubro Reliance Capital Reliance Capital GMR Infra.
JP Associates JP Associates Polaris Soft. MphasiS Bharat Electron S A I L I D F C Larsen & Toubro B H E L Reliance Petro. Larsen & Toubro Reliance Capital
ICICI Bank I D F C I D F C S A I L Tata Teleservices ING Vysya Bank Kotak Mah. Bank Kotak Mah. Bank Reliance Petro. Tata Teleservices JP Associates Reliance Petro.
Axis Bank Bharti Airtel S A I L Oracle Fin.Serv. Bharti Airtel Larsen & Toubro ING Vysya Bank A B B JP Associates JP Associates LIC Housing Fin. Kotak Mah. Bank
Oracle Fin.Serv. MphasiS MphasiS Kotak Mah. Bank Moser Baer (I) Tata Teleservices IDBI Bank Reliance Infra. Kotak Mah. Bank IDBI Bank B H E L Larsen & Toubro
St Bk of India Axis Bank Punjab Tractors Moser Baer (I) S A I L Reliance Petro. Larsen & Toubro Cummins India Reliance Infra. St Bk of India Tata Power Co. LIC Housing Fin.
Bharti Airtel IDBI Bank ICICI Bank Lupin MphasiS Kotak Mah. Bank Moser Baer (I) St Bk of India A B B Kotak Mah. Bank I D F C IFCI
ING Vysya Bank Bank of India Rel. Comm. Bharat Electron Lupin I D F C Tata Teleservices Tata Steel Tata Steel Tata Steel S A I L Tata Power Co.
Jan-08 Feb-08 Mar-08 Apr-08 May-08 Jun-08 Jul-08 Aug-08 Sep-08 Oct-08 Nov-08 Dec-08
Reliance Infra. Reliance Infra. Tata Power Co. Natl. Aluminium Natl. Aluminium Natl. Aluminium Ranbaxy Labs. Oracle Fin.Serv. Lupin Lupin Lupin Union Bank (I)
JP Associates JP Associates Reliance Infra. Tata Power Co. Sun Pharma.Inds. Lupin Sun Pharma.Inds. Ranbaxy Labs. Cadila Health. Hero Motocorp Tata Comm Hero Motocorp
Reliance Capital Axis Bank Natl. Aluminium ING Vysya Bank Asian Paints Ranbaxy Labs. Cairn India Lupin Sun Pharma.Inds. Cadila Health. Cadila Health. Aventis Pharma
Tata Teleservices Tata Power Co. LIC Housing Fin. Sun Pharma.Inds. ITC Cairn India Lupin Cadila Health. Ranbaxy Labs. Sun Pharma.Inds. Hind. Unilever Hind. Unilever
Tata Power Co. Natl. Aluminium Axis Bank Asian Paints Hind. Unilever Asian Paints Asian Paints Sun Pharma.Inds. Cipla Bank of India Hero Motocorp B P C L
S A I L Reliance Capital I D F C Cipla B P C L Sun Pharma.Inds. Hero Motocorp Cairn India Infosys Hind. Unilever Aventis Pharma Bank of Baroda
Reliance Petro. LIC Housing Fin. Reliance Capital LIC Housing Fin. Cipla Infosys Cipla Hero Motocorp Oracle Fin.Serv. O N G C Cipla Cipla
Kotak Mah. Bank I D F C Reliance Petro. Tata Comm Apollo Tyres Satyam Computer Infosys Cipla Asian Paints Bank of Baroda Infosys NTPC
Larsen & Toubro S A I L S A I L B P C L Hero Motocorp Tata Power Co. Hind. Unilever LIC Housing Fin. Hero Motocorp Aventis Pharma Union Bank (I) Punjab Natl.Bank
LIC Housing Fin. Reliance Petro. B P C L GAIL (India) Tata Power Co. Cipla Satyam Computer Hind. Unilever Cairn India Cipla Sun Pharma.Inds. Bank of India
Jan-09 Feb-09 Mar-09 Apr-09 May-09 Jun-09 Jul-09 Aug-09 Sep-09 Oct-09 Nov-09 Dec-09
B P C L B P C L B P C L Hero Motocorp GMR Infra. JP Associates Tech Mahindra Tech Mahindra Patni Computer H D I L MphasiS Sesa Goa
Union Bank (I) Syndicate Bank Hero Motocorp Power Fin.Corpn. Jindal Steel H D I L Jindal Steel JSW Steel H D I L JSW Steel Tech Mahindra HCL Technologies
Punjab Natl.Bank Union Bank (I) Power Fin.Corpn. Maruti Suzuki JP Associates Unitech Oracle Fin.Serv. MphasiS Tech Mahindra Patni Computer Patni Computer MphasiS
Bank of Baroda NTPC NTPC Power Grid Corpn LIC Housing Fin. LIC Housing Fin. JSW Steel JP Associates Unitech Tech Mahindra Sesa Goa Patni Computer
Tata Comm Aventis Pharma Maruti Suzuki Tata Comm Tata Teleservices GMR Infra. LIC Housing Fin. Patni Computer JSW Steel LIC Housing Fin. Oracle Fin.Serv. Jindal Steel
Bank of India Hind. Unilever Power Grid Corpn MphasiS Grasim Inds JSW Steel M & M H D I L JP Associates HCL Technologies Jindal Steel Tata Motors
Power Fin.Corpn. Hero Motocorp Hind. Unilever GMR Infra. UltraTech Cem. Jindal Steel MphasiS Jindal Steel MphasiS MphasiS HCL Technologies Tech Mahindra
Aventis Pharma Andhra Bank Tata Comm Tata Teleservices Hero Motocorp IFCI JP Associates M & M Tata Motors Tata Motors Ranbaxy Labs. TCS
Syndicate Bank Power Fin.Corpn. ITC NTPC Bharat Electron Tata Steel IFCI Tata Motors LIC Housing Fin. Unitech Tata Motors Oracle Fin.Serv.
Hind. Unilever Tata Comm ACC B P C L Reliance Infra. UltraTech Cem. Sterlite Inds. Unitech IFCI IFCI Hindalco Inds. JSW Steel
Jan-10 Feb-10 Mar-10 Apr-10 May-10 Jun-10 Jul-10 Aug-10 Sep-10
Tata Motors Tata Motors Sesa Goa Sesa Goa JSW Steel Federal Bank Bajaj Auto Bajaj Auto Cummins India
Sesa Goa Cummins India JSW Steel Mundra Port Adani Enterp. Cummins India Cummins India LIC Housing Fin. LIC Housing Fin.
Ranbaxy Labs. Ranbaxy Labs. Hindalco Inds. JSW Steel Tata Motors Bajaj Auto Bank of Baroda Cummins India Andhra Bank
HCL Technologies Lupin Lupin S A I L Cummins India Bank of Baroda Glaxosmit Pharma Ashok Leyland Asian Paints
TCS Hindalco Inds. Canara Bank Cummins India Bajaj Auto Lupin Federal Bank Asian Paints H P C L
Bharat Forge HCL Technologies Tata Motors Crompton Greaves Mundra Port Adani Enterp. Lupin Federal Bank Bajaj Auto
MphasiS Sesa Goa TCS Asian Paints Indian Hotels Siemens Mundra Port Andhra Bank Ashok Leyland
Patni Computer MphasiS Dr Reddy's Labs United Spirits Hindalco Inds. Mundra Port Ashok Leyland Corporation Bank Bharat Forge
Hindalco Inds. JSW Steel Ranbaxy Labs. UltraTech Cem. Sesa Goa Glaxosmit Pharma Asian Paints Glaxosmit Pharma Tata Motors
Oracle Fin.Serv. Oracle Fin.Serv. United Spirits Bharat Electron Axis Bank Patni Computer Colgate-Palm. Lupin I O B
31
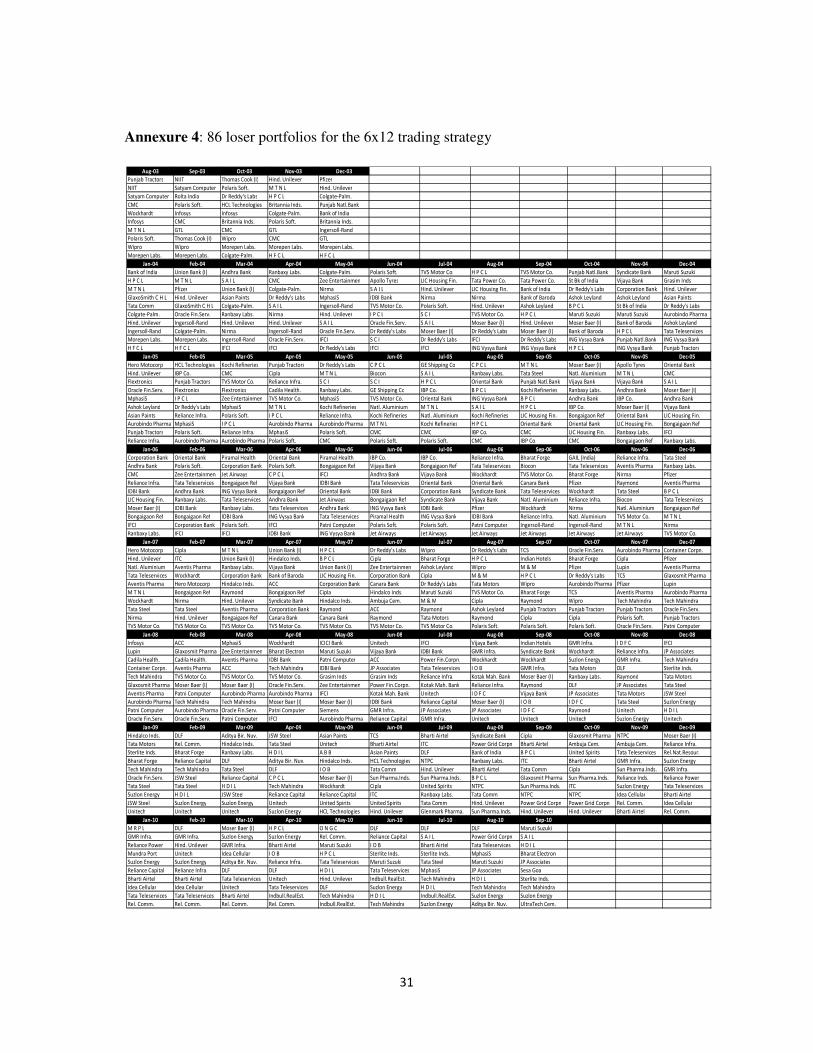
Annexure 4: 86 loser portfolios for the 6x12 trading strategy
Aug-03 Sep-03 Oct-03 Nov-03 Dec-03
Punjab Tractors NIIT Thomas Cook (I) Hind. Unilever Pfizer
NIIT Satyam Computer Polaris Soft. M T N L Hind. Unilever
Satyam Computer Rolta India Dr Reddy's Labs H P C L Colgate-Palm.
CMC Polaris Soft. HCL Technologies Britannia Inds. Punjab Natl.Bank
Wockhardt Infosys Infosys Colgate-Palm. Bank of India
Infosys CMC Britannia Inds. Polaris Soft. Britannia Inds.
M T N L GTL CMC GTL Ingersoll-Rand
Polaris Soft. Thomas Cook (I) Wipro CMC GTL
Wipro Wipro Morepen Labs. Morepen Labs. Morepen Labs.
Morepen Labs. Morepen Labs. Colgate-Palm. H F C L H F C L
Jan-04 Feb-04 Mar-04 Apr-04 May-04 Jun-04 Jul-04 Aug-04 Sep-04 Oct-04 Nov-04 Dec-04
Bank of India Union Bank (I) Andhra Bank Ranbaxy Labs. Colgate-Palm. Polaris Soft. TVS Motor Co. H P C L TVS Motor Co. Punjab Natl.Bank Syndicate Bank Maruti Suzuki
H P C L M T N L S A I L CMC Zee Entertainmen Apollo Tyres LIC Housing Fin. Tata Power Co. Tata Power Co. St Bk of India Vijaya Bank Grasim Inds
M T N L Pfizer Union Bank (I) Colgate-Palm. Nirma S A I L Hind. Unilever LIC Housing Fin. Bank of India Dr Reddy's Labs Corporation Bank Hind. Unilever
GlaxoSmith C H L Hind. Unilever Asian Paints Dr Reddy's Labs MphasiS IDBI Bank Nirma Nirma Bank of Baroda Ashok Leyland Ashok Leyland Asian Paints
Tata Comm GlaxoSmith C H L Colgate-Palm. S A I L Ingersoll-Rand TVS Motor Co. Polaris Soft. Hind. Unilever Ashok Leyland B P C L St Bk of India Dr Reddy's Labs
Colgate-Palm. Oracle Fin.Serv. Ranbaxy Labs. Nirma Hind. Unilever I P C L S C I TVS Motor Co. H P C L Maruti Suzuki Maruti Suzuki Aurobindo Pharma
Hind. Unilever Ingersoll-Rand Hind. Unilever Hind. Unilever S A I L Oracle Fin.Serv. S A I L Moser Baer (I) Hind. Unilever Moser Baer (I) Bank of Baroda Ashok Leyland
Ingersoll-Rand Colgate-Palm. Nirma Ingersoll-Rand Oracle Fin.Serv. Dr Reddy's Labs Moser Baer (I) Dr Reddy's Labs Moser Baer (I) Bank of Baroda H P C L Tata Teleservices
Morepen Labs. Morepen Labs. Ingersoll-Rand Oracle Fin.Serv. IFCI S C I Dr Reddy's Labs IFCI Dr Reddy's Labs ING Vysya Bank Punjab Natl.Bank ING Vysya Bank
H F C L H F C L IFCI IFCI Dr Reddy's Labs IFCI IFCI ING Vysya Bank ING Vysya Bank H P C L ING Vysya Bank Punjab Tractors
Jan-05 Feb-05 Mar-05 Apr-05 May-05 Jun-05 Jul-05 Aug-05 Sep-05 Oct-05 Nov-05 Dec-05
Hero Motocorp HCL Technologies Kochi Refineries Punjab Tractors Dr Reddy's Labs C P C L GE Shipping Co C P C L M T N L Moser Baer (I) Apollo Tyres Oriental Bank
Hind. Unilever IBP Co. CMC Cipla M T N L Biocon S A I L Ranbaxy Labs. Tata Steel Natl. Aluminium M T N L CMC
Flextronics Punjab Tractors TVS Motor Co. Reliance Infra. S C I S C I H P C L Oriental Bank Punjab Natl.Bank Vijaya Bank Vijaya Bank S A I L
Oracle Fin.Serv. Flextronics Flextronics Cadila Health. Ranbaxy Labs. GE Shipping Co IBP Co. B P C L Kochi Refineries Ranbaxy Labs. Andhra Bank Moser Baer (I)
MphasiS I P C L Zee Entertainmen TVS Motor Co. MphasiS TVS Motor Co. Oriental Bank ING Vysya Bank B P C L Andhra Bank IBP Co. Andhra Bank
Ashok Leyland Dr Reddy's Labs MphasiS M T N L Kochi Refineries Natl. Aluminium M T N L S A I L H P C L IBP Co. Moser Baer (I) Vijaya Bank
Asian Paints Reliance Infra. Polaris Soft. I P C L Reliance Infra. Kochi Refineries Natl. Aluminium Kochi Refineries LIC Housing Fin. Bongaigaon Ref Oriental Bank LIC Housing Fin.
Aurobindo Pharma MphasiS I P C L Aurobindo Pharma Aurobindo Pharma M T N L Kochi Refineries H P C L Oriental Bank Oriental Bank LIC Housing Fin. Bongaigaon Ref
Punjab Tractors Polaris Soft. Reliance Infra. MphasiS Polaris Soft. CMC CMC IBP Co. CMC LIC Housing Fin. Ranbaxy Labs. IFCI
Reliance Infra. Aurobindo Pharma Aurobindo Pharma Polaris Soft. CMC Polaris Soft. Polaris Soft. CMC IBP Co. CMC Bongaigaon Ref Ranbaxy Labs.
Jan-06 Feb-06 Mar-06 Apr-06 May-06 Jun-06 Jul-06 Aug-06 Sep-06 Oct-06 Nov-06 Dec-06
Corporation Bank Oriental Bank Piramal Health Oriental Bank Piramal Health IBP Co. IBP Co. Reliance Infra. Bharat Forge GAIL (India) Reliance Infra. Tata Steel
Andhra Bank Polaris Soft. Corporation Bank Polaris Soft. Bongaigaon Ref Vijaya Bank Bongaigaon Ref Tata Teleservices Biocon Tata Teleservices Aventis Pharma Ranbaxy Labs.
CMC Zee Entertainmen Jet Airways C P C L IFCI Andhra Bank Vijaya Bank Wockhardt TVS Motor Co. Bharat Forge Nirma Pfizer
Reliance Infra. Tata Teleservices Bongaigaon Ref Vijaya Bank IDBI Bank Tata Teleservices Oriental Bank Oriental Bank Canara Bank Pfizer Raymond Aventis Pharma
IDBI Bank Andhra Bank ING Vysya Bank Bongaigaon Ref Oriental Bank IDBI Bank Corporation Bank Syndicate Bank Tata Teleservices Wockhardt Tata Steel B P C L
LIC Housing Fin. Ranbaxy Labs. Tata Teleservices Andhra Bank Jet Airways Bongaigaon Ref Syndicate Bank Vijaya Bank Natl. Aluminium Reliance Infra. Biocon Tata Teleservices
Moser Baer (I) IDBI Bank Ranbaxy Labs. Tata Teleservices Andhra Bank ING Vysya Bank IDBI Bank Pfizer Wockhardt Nirma Natl. Aluminium Bongaigaon Ref
Bongaigaon Ref Bongaigaon Ref IDBI Bank ING Vysya Bank Tata Teleservices Piramal Health ING Vysya Bank IDBI Bank Reliance Infra. Natl. Aluminium TVS Motor Co. M T N L
IFCI Corporation Bank Polaris Soft. IFCI Patni Computer Polaris Soft. Polaris Soft. Patni Computer Ingersoll-Rand Ingersoll-Rand M T N L Nirma
Ranbaxy Labs. IFCI IFCI IDBI Bank ING Vysya Bank Jet Airways Jet Airways Jet Airways Jet Airways Jet Airways Jet Airways TVS Motor Co.
Jan-07 Feb-07 Mar-07 Apr-07 May-07 Jun-07 Jul-07 Aug-07 Sep-07 Oct-07 Nov-07 Dec-07
Hero Motocorp Cipla M T N L Union Bank (I) H P C L Dr Reddy's Labs Wipro Dr Reddy's Labs TCS Oracle Fin.Serv. Aurobindo Pharma Container Corpn.
Hind. Unilever ITC Union Bank (I) Hindalco Inds. B P C L Cipla Bharat Forge H P C L Indian Hotels Bharat Forge Cipla Pfizer
Natl. Aluminium Aventis Pharma Ranbaxy Labs. Vijaya Bank Union Bank (I) Zee Entertainmen Ashok Leyland Wipro M & M Pfizer Lupin Aventis Pharma
Tata Teleservices Wockhardt Corporation Bank Bank of Baroda LIC Housing Fin. Corporation Bank Cipla M & M H P C L Dr Reddy's Labs TCS Glaxosmit Pharma
Aventis Pharma Hero Motocorp Hindalco Inds. ACC Corporation Bank Canara Bank Dr Reddy's Labs Tata Motors Wipro Aurobindo Pharma Pfizer Lupin
M T N L Bongaigaon Ref Raymond Bongaigaon Ref Cipla Hindalco Inds. Maruti Suzuki TVS Motor Co. Bharat Forge TCS Aventis Pharma Aurobindo Pharma
Wockhardt Nirma Hind. Unilever Syndicate Bank Hindalco Inds. Ambuja Cem. M & M Cipla Raymond Wipro Tech Mahindra Tech Mahindra
Tata Steel Tata Steel Aventis Pharma Corporation Bank Raymond ACC Raymond Ashok Leyland Punjab Tractors Punjab Tractors Punjab Tractors Oracle Fin.Serv.
Nirma Hind. Unilever Bongaigaon Ref Canara Bank Canara Bank Raymond Tata Motors Raymond Cipla Cipla Polaris Soft. Punjab Tractors
TVS Motor Co. TVS Motor Co. TVS Motor Co. TVS Motor Co. TVS Motor Co. TVS Motor Co. TVS Motor Co. Polaris Soft. Polaris Soft. Polaris Soft. Oracle Fin.Serv. Patni Computer
Jan-08 Feb-08 Mar-08 Apr-08 May-08 Jun-08 Jul-08 Aug-08 Sep-08 Oct-08 Nov-08 Dec-08
Infosys ACC MphasiS Wockhardt ICICI Bank Unitech IFCI Vijaya Bank Indian Hotels GMR Infra. I D F C IFCI
Lupin Glaxosmit Pharma Zee Entertainmen Bharat Electron Maruti Suzuki Vijaya Bank IDBI Bank GMR Infra. Syndicate Bank Wockhardt Reliance Infra. JP Associates
Cadila Health. Cadila Health. Aventis Pharma IDBI Bank Patni Computer ACC Power Fin.Corpn. Wockhardt Wockhardt Suzlon Energy GMR Infra. Tech Mahindra
Container Corpn. Aventis Pharma ACC Tech Mahindra IDBI Bank JP Associates Tata Teleservices I O B GMR Infra. Tata Motors DLF Sterlite Inds.
Tech Mahindra TVS Motor Co. TVS Motor Co. TVS Motor Co. Grasim Inds Grasim Inds Reliance Infra. Kotak Mah. Bank Moser Baer (I) Ranbaxy Labs. Raymond Tata Motors
Glaxosmit Pharma Moser Baer (I) Moser Baer (I) Oracle Fin.Serv. Zee Entertainmen Power Fin.Corpn. Kotak Mah. Bank Reliance Infra. Raymond DLF JP Associates Tata Steel
Aventis Pharma Patni Computer Aurobindo Pharma Aurobindo Pharma IFCI Kotak Mah. Bank Unitech I D F C Vijaya Bank JP Associates Tata Motors JSW Steel
Aurobindo Pharma Tech Mahindra Tech Mahindra Moser Baer (I) Moser Baer (I) IDBI Bank Reliance Capital Moser Baer (I) I O B I D F C Tata Steel Suzlon Energy
Patni Computer Aurobindo Pharma Oracle Fin.Serv. Patni Computer Siemens GMR Infra. JP Associates JP Associates I D F C Raymond Unitech H D I L
Oracle Fin.Serv. Oracle Fin.Serv. Patni Computer IFCI Aurobindo Pharma Reliance Capital GMR Infra. Unitech Unitech Unitech Suzlon Energy Unitech
Jan-09 Feb-09 Mar-09 Apr-09 May-09 Jun-09 Jul-09 Aug-09 Sep-09 Oct-09 Nov-09 Dec-09
Hindalco Inds. DLF Aditya Bir. Nuv. JSW Steel Asian Paints TCS Bharti Airtel Syndicate Bank Cipla Glaxosmit Pharma NTPC Moser Baer (I)
Tata Motors Rel. Comm. Hindalco Inds. Tata Steel Unitech Bharti Airtel ITC Power Grid Corpn Bharti Airtel Ambuja Cem. Ambuja Cem. Reliance Infra.
Sterlite Inds. Bharat Forge Ranbaxy Labs. H D I L A B B Asian Paints DLF Bank of India B P C L United Spirits Tata Teleservices Rel.Nat.Resour.
Bharat Forge Reliance Capital DLF Aditya Bir. Nuv. Hindalco Inds. HCL Technologies NTPC Ranbaxy Labs. ITC Bharti Airtel GMR Infra. Suzlon Energy
Tech Mahindra Tech Mahindra Tata Steel DLF I O B Tata Comm Hind. Unilever Bharti Airtel Tata Comm Cipla Sun Pharma.Inds. GMR Infra.
Oracle Fin.Serv. JSW Steel Reliance Capital C P C L Moser Baer (I) Sun Pharma.Inds. Sun Pharma.Inds. B P C L Glaxosmit Pharma Sun Pharma.Inds. Reliance Inds. Reliance Power
Tata Steel Tata Steel H D I L Tech Mahindra Wockhardt Cipla United Spirits NTPC Sun Pharma.Inds. ITC Suzlon Energy Tata Teleservices
Suzlon Energy H D I L JSW Steel Reliance Capital Reliance Capital ITC Ranbaxy Labs. Tata Comm NTPC NTPC Idea Cellular Bharti Airtel
JSW Steel Suzlon Energy Suzlon Energy Unitech United Spirits United Spirits Tata Comm Hind. Unilever Power Grid Corpn Power Grid Corpn Rel. Comm. Idea Cellular
Unitech Unitech Unitech Suzlon Energy HCL Technologies Hind. Unilever Glenmark Pharma. Sun Pharma.Inds. Hind. Unilever Hind. Unilever Bharti Airtel Rel. Comm.
Jan-10 Feb-10 Mar-10 Apr-10 May-10 Jun-10 Jul-10 Aug-10 Sep-10
M R P L DLF Moser Baer (I) H P C L O N G C DLF DLF DLF Maruti Suzuki
GMR Infra. GMR Infra. Suzlon Energy Suzlon Energy Rel. Comm. Reliance Capital S A I L Power Grid Corpn S A I L
Reliance Power Hind. Unilever GMR Infra. Bharti Airtel Maruti Suzuki I O B Bharti Airtel Tata Teleservices H D I L
Mundra Port Unitech Idea Cellular I O B H P C L Sterlite Inds. Sterlite Inds. MphasiS Bharat Electron
Suzlon Energy Suzlon Energy Aditya Bir. Nuv. Reliance Infra. Tata Teleservices Maruti Suzuki Tata Steel Maruti Suzuki JP Associates
Reliance Capital Reliance Infra. DLF DLF H D I L Tata Teleservices MphasiS JP Associates Sesa Goa
Bharti Airtel Bharti Airtel Tata Teleservices Unitech Hind. Unilever Indbull.RealEst. Tech Mahindra H D I L Sterlite Inds.
Idea Cellular Idea Cellular Unitech Tata Teleservices DLF Suzlon Energy H D I L Tech Mahindra Tech Mahindra
Tata Teleservices Tata Teleservices Bharti Airtel Indbull.RealEst. Tech Mahindra H D I L Indbull.RealEst. Suzlon Energy Suzlon Energy
Rel. Comm. Rel. Comm. Rel. Comm. Rel. Comm. Indbull.RealEst. Tech Mahindra Suzlon Energy Aditya Bir. Nuv. UltraTech Cem.