student satisfaction and online teaching - equella · student satisfaction and online teaching ross...
TRANSCRIPT

Student satisfaction and online teaching
Ross Guest, Nicholas Rohde, Saroja Selvanathan and Tommy Soesmanto
No. 2017-07

Copyright © 2017 by the author(s). No part of this paper may be reproduced in any form, or stored in a retrieval system, without
prior permission of the author(s).
Student satisfaction and online teaching1
Ross Guest2, Nicholas Rohde3, Saroja Selvanathan4 and Tommy Soesmanto5
Abstract
This paper presents a preliminary analysis of the response of student satisfaction scores to
online delivery for courses at a large Australian university. Taking data on 2,653 courses
delivered since 2011 we employ a difference-in-differences estimator to evaluate the impact
of a transition from traditional face-to-face to online transmission on student satisfaction. We
estimate that on a five point scale, conversion to online learning lowers course satisfaction by
about 0.2 points and instructor satisfaction by about 0.15 points. These correspond to shifts
relative to the underlying distributions of about 25%-30% of a standard deviation. Some
implications of the (slight) relative unpopularity of online learning are discussed.
Key words: Student Evaluations, Online Teaching, Difference in Differences Estimation
JEL Codes: I21
1 We would like to thank Learning Futures for access to the data. Any errors are the sole responsibility of the authors. 2 Email [email protected]. Ph: 555 28783. 3 Corresponding author. Email [email protected]. Ph: 555 28243. 4 Email [email protected]. Ph: 373 57616. 5 Email [email protected]. Ph: 373 55311.

1
Introduction
Advances in technology have produced new opportunities for educational institutions to
deliver content in the teaching of undergraduate and postgraduate classes (Palloff and Pratt,
2007). One such innovation is online learning, where universities eschew the traditional
model of face-to-face lectures in favour of content delivery via electronic means. Typically
online learning packages consist of lectures that are pre-recorded or delivered live but
remotely, readings that are available for download, and tutorial sessions that are held in
internet chat rooms that allow for interaction between the instructor and students, or between
the students themselves (Anderson, 2004). Assessment is frequently conducted with quizzes,
which may be marked automatically, and essays or exams, which are submitted online but are
marked individually by teaching staff (Gaytan and McEwen, 2007).
This lectures-plus-tutorials-plus-readings style of content delivery, and the exam/assignment
form of assessment preserves much of the structure of more traditional forms of university
teaching. However there are a number of differences between modes that have the potential
to impact upon the effectiveness of the learning experience, for both the student (Kim and
Bonk, 2006), and for the instructor in the way the course is assessed (Bangert, 2008; Graham
et al., 2001). For example a negative characteristic of online courses is that they may only
allow for fairly superficial communications between students and instructors (Ke and Xie,
2009) which may impact upon the way that content is absorbed. Assessment is also difficult
in the online space as there is increased scope for students to plagiarize or to find other ways
of obtaining unfair advantages over their peers (Rowe, 2004). Nonetheless there are some
advantages to online delivery too. As online classes are highly scalable they may be offered
in large numbers at very low cost, which allows universities to provide access to wider ranges
of students, and also allows resources to be redirected to other activities such as research or
scholarship. Furthermore these courses are typically extremely convenient and can engaged
with in times and locations that are flexible. The fact that these courses can be fit into
students’ timetables in a way that is impossible for more standard forms of instruction is a
major benefit.
Currently, little is known about the way that online classes are viewed from the point-of-view
of the students that attend them. Developing such an understanding is important for university
administrators as pedagogical decisions must be made with respect to how content is
delivered and assessed. If online learning is popular with students and achieves good
outcomes with respect to learning objectives, then it makes sense for courses to be
increasingly delivered in this manner. Conversely if online courses are unpopular, result in
superficial learning or poor retention, then it may make more sense for universities to stick
with face-to-face styles of teaching.
The goal of this paper is to offer a brief snapshot of the effect of online on students’
satisfaction with their learning experiences. Our research thus adds to a large body of
literature that analyses student evaluations of teaching. In this sense the work corresponds
closely with the set of empirical studies that attempts to disentangle the effects of various
course and instructor characteristics on the way that teachers are assessed, although our core

2
motivation is a little different. Interestingly, and counter to common perceptions, the existing
literature has not found many substantial associations between a course’s valuations and other
variables that relate to its delivery. This makes our finding that online courses are a little less
satisfying somewhat unexpected. To place this result in context, consider that, for example,
instructor age does not appear to explain variations in evaluations (Marsh and Hocevar, 1991)
especially when controlling for experience (Centra, 2009). Similarly race and gender were
found to have little if any predictive power (Centra and Gaubatz, 2000; Feldman,1993) as
with indicators of research proficiency (Marsh and Hattie, 2002). However there are some
course level variables that do appear to have limited explanatory value. Higher level courses
get slightly better evaluations (Braskamp and Ory, 1994) and there is a tendency for smaller
classes (Hoyt and Lee, 2002a) and those in the arts and humanities ((Hoyt and Lee, 2002b) to
achieve better scores.6
Specific research on the evaluation of online courses has mostly focussed on structural
differences in the equations governing outcomes. One might expect that an online
environment might reward a different skill set 7 (e.g. technological competency vs
extraversion) however Benton and Cashin (2012) and McGhee and Lowell (2003) argue that
these differences are surprisingly small. In contrast to the results presented here Wang and
Newlin (2000) find little difference between online and face-to-face satisfaction scores,
however Benton et al. (2010) argue that lower response rates in online courses might result in
non-response biases that unduly favour online delivery.
As with all the studies presented above, our approach for tackling problems related to the
assessment of courses is purely quantitative. This is because case studies or anecdotal
analyses of satisfaction scores is unlikely to be informative about the true mechanisms that
determine course performance. Student evaluation scores are the product of a number of
interacting phenomena (i.e. they are determined by a large number of moving parts) including
factors such as the age, gender and personality of the lecturer, the content, the type and
difficulty of assessment, and natural variation amongst the student body. Disentangling these
effects is near to impossible without access to large data sets and either a solid design-based
econometric approach (Angrist and Pischke, 2009) as we have adopted here, or a wide variety
of exogenous control variables that can be assessed using statistical methods. To preview our
results we find that online delivery acts, probably causally, to diminish student course
satisfaction. The obvious implication of this result is that administrators at educational
institutions should be cautious about encouraging the growth of online instruction. However
our result comes with a number of caveats. The effect size we uncover is reasonably small
relative to the amount of natural variation that occurs anyway, and it is plausible that the
discrepancies are at least partially to do with teething problems associated with adapting to
this new learning environment.
6 The review by Benton and Cashin (2012) provides a detailed summary of these results. 7 E.g. Bangert (2008) advocates for more diverse assessments to account for these differences in skill
requirements.

3
The paper is structured as follows. The next section introduces the data and provides a
baseline analysis of the differences in satisfaction between online and face-to-face courses.
We then specify a difference-in-differences model which is used in an attempt to estimate the
causal effect of online delivery upon student satisfaction. The next section interprets the
results and discusses some implications for pedagogical decision making while the
conclusion summarizes the key findings.
Data and analysis
Our data come from student evaluations of courses taken at Griffith University from 2011-
2014. Griffith University is a large publicly funded institution that operates over several
geographically disperse locations in South East Queensland, with major campuses set up in
adjoining cities of Brisbane and the Gold Coast. The area is of relatively high socioeconomic
status and the university has a large body of international students, coming mostly from
Western Europe, Canada and South East Asia. One campus (Gold Coast) is the primary
university in the catchment region while the Brisbane campus competes with several other
large universities that provide students with access to similar services.
To study student attitudes to teaching at this university, we focus on two key variables
designed to capture two of the most important aspects of student perception from the point of
view of university administrators. The first variable asks students to assess on a five point
scale their overall satisfaction with the course, while the second uses the same Likert-style
framework and asks for their overall satisfaction with the instructor. We emphasize that while
these variables are correlated, they offer different perspectives on student experiences.
Indeed it is possible for students to be satisfied with a course but not the instructor, or vice
versa. Indeed circumstances when these indicators conflict are of considerable interest and
present a promising avenue for future research.
The variables we analyse are obtained by online surveys that are completed by students at the
completion of the formal teaching period, but typically prior to final assessment. All enrolled
students are invited to complete the questionnaires although response rates are typically less
than 50% (see Nulty (2007) for a thorough discussion of this issue). The surveys are
anonymous, and their timing is structured such that the impact of perceived performance is
minimised. The units we analyse in our regression models are based upon the average of
these scores across all students that completed the surveys. That is, the average evaluation
score is our dependant variable and thus we are ignoring the variability of these responses
within each course. Standard caveats about aggregation and other factors such as the potential
for non-response bias (and other issues associated with measurement error) all apply. The
data are arranged such that an evaluation of 5 is the highest possible score (and can only be
obtained by all respondents giving this assessment) while 1 is the poorest achievable
outcome. By averaging across these outcomes we are effectively imposing a linear structure
on our variables, an assumption that we feel is reasonable on pragmatic grounds but is
unlikely to hold perfectly.

4
One advantage of the data set we employ is its size and relative breadth. Both undergraduate
and postgraduate courses are used and our analysis is based upon offerings across the full
university. Thus our data consist of student assessments from frequently analyzed courses in
business, economics and finance, but also includes diverse fields such as engineering,
medicine, law, education, psychology and criminology. By casting the net this wide we are
able to ensure that our analysis is reflective of a major university in general (rather than just a
particular faculty) and exploit a data set that is unusually large – our sample size consists of
2,653 courses. The fact that we have so many observations allows us to exploit a data-hungry
estimation framework (difference in differences estimation) that is better suited to identifying
causal effects than more traditional modes of analysis such as naive linear regression.
We begin with a simple description of the data with the aim of highlighting differences in
student perceptions between traditional and online delivery modes. Figures 1-4 present the
distributions of observed outcomes for both educational modes and the means of these
distributions are discussed in text below.
Figure 1. Distribution of Course Satisfaction Scores – Traditional Delivery
Note: The horizontal axis gives the course satisfaction score for face-to-face delivery while the
vertical axis gives the raw frequency. Satisfaction scores based upon less that five responses are
excluded.
0
40
80
120
160
200
240
2.0 2.5 3.0 3.5 4.0 4.5 5.0
Course Satisfaction (Face-to-face)
Fre
quency

5
Figure 2. Distribution of Course Satisfaction Scores – Online Delivery
Note: The horizontal axis gives the course satisfaction score for online delivery while the vertical
axis gives the raw frequency. Satisfaction scores based upon less than five responses are
excluded.
Figure 3. Distribution of Instructor Satisfaction Scores – Traditional Delivery
Note: The horizontal axis gives the instructor satisfaction score for face-to-face delivery while the
vertical axis gives the raw frequency. Satisfaction scores based upon less than five responses are
excluded.
0
4
8
12
16
20
2.0 2.5 3.0 3.5 4.0 4.5 5.0
Course Satisfaction (Online)
Fre
qu
en
cy
0
40
80
120
160
200
240
2.0 2.5 3.0 3.5 4.0 4.5 5.0
Teaching Satisfaction (Face-to-face)
Fre
qu
en
cy
6
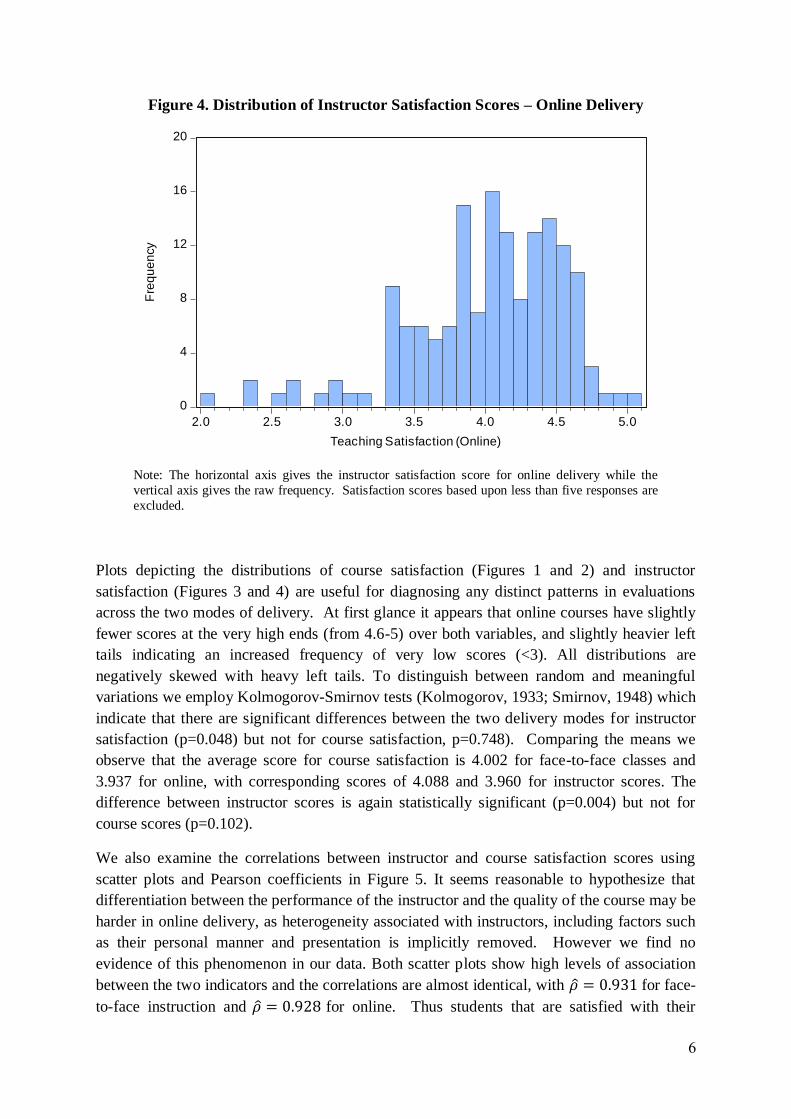
Figure 4. Distribution of Instructor Satisfaction Scores – Online Delivery
Note: The horizontal axis gives the instructor satisfaction score for online delivery while the
vertical axis gives the raw frequency. Satisfaction scores based upon less than five responses are
excluded.
Plots depicting the distributions of course satisfaction (Figures 1 and 2) and instructor
satisfaction (Figures 3 and 4) are useful for diagnosing any distinct patterns in evaluations
across the two modes of delivery. At first glance it appears that online courses have slightly
fewer scores at the very high ends (from 4.6-5) over both variables, and slightly heavier left
tails indicating an increased frequency of very low scores (<3). All distributions are
negatively skewed with heavy left tails. To distinguish between random and meaningful
variations we employ Kolmogorov-Smirnov tests (Kolmogorov, 1933; Smirnov, 1948) which
indicate that there are significant differences between the two delivery modes for instructor
satisfaction (p=0.048) but not for course satisfaction, p=0.748). Comparing the means we
observe that the average score for course satisfaction is 4.002 for face-to-face classes and
3.937 for online, with corresponding scores of 4.088 and 3.960 for instructor scores. The
difference between instructor scores is again statistically significant (p=0.004) but not for
course scores (p=0.102).
We also examine the correlations between instructor and course satisfaction scores using
scatter plots and Pearson coefficients in Figure 5. It seems reasonable to hypothesize that
differentiation between the performance of the instructor and the quality of the course may be
harder in online delivery, as heterogeneity associated with instructors, including factors such
as their personal manner and presentation is implicitly removed. However we find no
evidence of this phenomenon in our data. Both scatter plots show high levels of association
between the two indicators and the correlations are almost identical, with 𝜌 = 0.931 for face-
to-face instruction and 𝜌 = 0.928 for online. Thus students that are satisfied with their
0
4
8
12
16
20
2.0 2.5 3.0 3.5 4.0 4.5 5.0
Teaching Satisfaction (Online)
Fre
qu
en
cy

7
course are also typically satisfied with their instructor (and vice versa) and idiosyncratic
factors that are only apparent with traditional delivery do not disturb this empirical regularity.
Figure 5. Correlations Between Instructor and Course Satisfaction (Online and
Traditional Delivery)
Note: The left panel gives the association between teaching and course satisfactions scores for
online courses and the right panel shows the same relationship for face-to-face courses. In each
case teaching satisfaction is on the vertical axis and course satisfaction on the horizontal axis.
Econometric Estimation
Having observed that online courses are slightly less well received by students, and that there
is a strong degree of commonality in the indicators which we rely upon, we now turn to
estimating the effect that transitioning to online delivery has upon these variables. We begin
by noting that the raw differences highlighted in Table 1 should not be interpreted as causal
effects. For instance if online classes differ in other ways besides their mode of delivery and
these other factors also determine student satisfaction, then the raw differentials we observe
will reflect the sum of all such factors. Selection into online modes provides a clear example.
If only certain types of courses are suitable for online delivery, and if these courses are
typically more/less popular than average, then this composition effect will emerge as a bias in
our estimates.
A simple way to account for the unobserved heterogeneity in courses is to employ a
difference-in-difference estimator to evaluate the effect of transitions from traditional to
online learning. That is, we look at courses that were originally delivered in the traditional
face-to-face mode which were then restructured and delivered in a subsequent semester in the
1.5
2.0
2.5
3.0
3.5
4.0
4.5
5.0
5.5
1 2 3 4 5 6
SAT
TE
AC
H
1.6
2.0
2.4
2.8
3.2
3.6
4.0
4.4
4.8
5.2
1.6 2.0 2.4 2.8 3.2 3.6 4.0 4.4 4.8 5.2
SAT
TE
AC
H

8
online mode. As the course (and very often the instructor) were identical across the two
periods, any heterogeneity associated with either is automatically controlled for. This
econometric framework therefore produces estimates that are unaffected by our failure to
observe subtle phenomena associated with the type of course being delivered.
The equation we estimate is
𝑆 = 𝛽0 + 𝛾1𝐷 + 𝛾2𝐷∗ + 𝛿𝐷×𝐷∗ +∑𝛽𝑗𝑥𝑗 + 𝑒
𝑘
𝑗=1
where 𝑆 is the student satisfaction score, 𝐷 is a dummy indicating courses that were to be
delivered online, 𝐷∗ a dummy indicating periods before and after transition, and 𝑥1, … , 𝑥𝑘 a
series of control variables. Parameters 𝛽0, … 𝛽𝑘, 𝛾1, 𝛾2 and 𝛿 are to be estimated, and it is 𝛿
that is of particular interest. We interpret this parameter as the change in average satisfaction
scores for courses that went from face-to face to online, relative to a baseline constructed
from courses that did not change status. This estimate also controls for any exogenous
differences that were induced by changes in 𝑥1, … , 𝑥𝑘. The model is fitted by OLS and we use
robust standard errors throughout. We report parameter estimates in Table 1 for both sets of
satisfaction scores. In each case, we control for changes in the size of the classes, the number
of survey participants and the response rate. Ideally we would like to have more detail in our
data set such as information on the age, gender, race and years of experience of the instructor,
the type of content, historical failure rate etc. Unfortunately these data are unavailable
however they should not unduly affect the analysis provided that they are uncorrelated with
our central variables of interest.

9
Table 1. Difference-in Difference Models for the Effect of Online Delivery
Parameter Course Satisfaction Instructor Satisfaction
Constant 3.809*** 3.900***
Transition 0.013 0.010
Online -0.108* -0.100*
Transition*Online -0.191** -0.149
Enrolment 0.001** 0.001**
Participants -0.004*** -0.004***
Participants/Enrolment 0.530*** 0.552***
N 2653 2653
R-Squared 0.033 0.042
F 15.09 19.16
Note: Parameters are estimated by OLS with White (1980) robust covariance. ***, ** and *
indicate significance at 1%, 5% and 10% respectively.
Estimates in Table 1 show that the transition to online learning reduced affected courses by
0.191 units in terms of course satisfaction, a figure that is significant at the standard 𝛼 = 5%
level. Instructor satisfaction also declined however the magnitude is slightly smaller and
(0.149 units) and is not significant, although the p-value of 0.109 only just falls short of the
threshold of 𝛼 = 10%. In order to interpret the size of these shifts it is useful to benchmark
them relative to the standard deviations of the underlying satisfaction distributions, in which
case the effect sizes are approximately 30% and 25% of a single standard deviation. Given
the similarity of these results, and the fact that these two indicators are so closely correlated,
we conclude that switching to online teaching does seem to negatively impact upon a
student’s learning experience, although the magnitude of this effect is only modest and
appears more important for the course than the instructor. Thus it appears that students do
not completely hold their instructor responsible for a less satisfying experience if the course
is delivered online.
Turning to other features of the model we observe that the courses that were to be converted
to online delivery had significantly lower evaluations to begin with (0.108 and 0.100 across
the two indicators), classes with higher enrolments had significantly greater scores, and that
courses with higher participation rates had higher levels of satisfaction. Nonetheless the fits
of the models were quite poor, accounting for only 3% of the variation in course scores and
4% of the variation in instructors scores. Thus it appears that most of the factors which

10
influence these metrics remain unexplained, and a deeper dive into the idiosyncratic variables
that could potentially account for these variations is needed if the central factors driving
student satisfaction are to be properly understood.
Discussion
Our analysis highlights several stylized facts about student satisfaction scores and online
learning. Firstly online courses are somewhat less popular than face-to-face courses,
especially in terms of satisfaction with instructors. Nonetheless when we structure a model to
be able to estimate the causal effect of online learning it appears that students will punish
online courses for this mode of delivery to a significant degree, but not their instructors. How
can we reconcile this seemingly contradictory collection of findings? One possible
explanation is that poorer evaluations for instructors of online courses may be in part due to
self-selection issues where less high performing academics are called upon to teach these
courses. This depresses the average instructor scores for online deliveries, without
representing a causal effect. This phenomenon seems to occur alongside transitions to online
delivery which appear to lower both metrics. In these cases it would be reasonable for
university administrators to be concerned about the relative unpopularity of online courses,
but less so about this unpopularity unfairly influencing the performance metrics of their
instructors.
The key findings of the paper can be further unpacked. That is, while we have established
that there are some significant differences in satisfaction for both courses and instructors for
online courses, we have not considered some of the implications of these results. A frequent
caveat expressed in the literature on evaluations of teaching in the tertiary sector is that
satisfaction scores such as these might not be fully representative of the quality of the
learning experience. For example a course might be popular with students if it is
unchallenging or requires little effort, in which case the evaluation would be negatively
associated with the quality of the learning experience. Given that evaluations only act as a
proxy for true quality (i.e. they may lack validity – see Shevlin et al. (2000) or Sullivan and
Skanes (1974)) it would therefore be possible that learning experiences my actually increase
with online delivery, and that our results may reflect errors in measurement or other forms of
endogeneity bias. However it is equally plausible that any such error may be having the
reverse effect, and that online delivery is less effective than our results suggest, rather than
more so. Indeed given that much of the learning experience involves subtle communication
that is difficult to replicate in online classrooms it seems more likely that online courses are
likely to contain subtly reduced content, even controlling for explicit learning objectives,
which may bias students towards rather than away from this mode of learning.
A second issue to unpack is that our results only look at courses that have recently been
converted to online delivery. Since reconfiguring a course is a large project that requires
reformulating large amounts of content it is possible that our results are capturing teething
issues, rather than ingrained dissatisfactions with modes of delivery. Put another way, the

11
fact that (i) online classrooms are often new to both instructors and students, and (ii) are
usually prone to glitches and technological errors may make these courses appear worse than
they would be in the long run. Indeed it seems reasonable to assume that online courses may
improve at a greater rate than face-to-face courses. Developments in technology, increasing
student experience with online classrooms and the training of instructors with this educational
medium are all likely to provide scope for improvements that are unlikely to be matched in
other forms of instruction. Therefore the next step towards evaluating the relative merits of
online learning should focus on comparing mature, well established online courses to their
counterparts in face-to-face instruction.
Thirdly we have implicitly been invoking the assumption that ‘satisfaction’ means the same
thing for students who are taking online courses and those who attend classes in person. In
some senses this is doubtful – satisfaction is probably more likely to be assessed relative to a
baseline expectation rather than in absolute terms (Kahneman, 2011). If students have higher
expectations for in-person classes than those delivered remotely then our variables are not
directly comparable. A score of 4/5 for a face-to-face course may correspond to a much more
satisfying learning experience than an equivalent online experience (although a priori less
likely, the reverse may also be true). If this is the case our results will understate the
negatives features associated with online learning.
Conclusion
This paper has presented a preliminary analysis of student satisfaction scores of courses and
their instructors for online and face-to-face modes of delivery. We have found that
instructors of online courses are less popular than face-to-face instructors and that converting
a course from face-to-face to online seems to diminish the satisfaction of that course. The
effect sizes are meaningful (around 25%-30 of a standard deviation) but hardly
overwhelming. It seems that online teaching is less well received by students, but hardly
overwhelmingly so, conditional upon the assumption that our satisfaction scores are
meaningfully comparable across delivery modes. A conservative interpretation of our
findings is that while it is still in its infancy, online instruction is probably considered to be a
less satisfying learning experience for students. Educational administrators should weigh this
moderate disadvantage to online education against some of its well-known advantages.
References
Anderson, T. (2004). Toward a theory of online learning. In T. Anderson and F. Elloumi
(Eds), Theory and practice of online learning (pp.33-60). Athabasca, AB: Athabasca
University.
Angrist, J. and Pischke, J. (2009). Mostly Harmless Econometrics: An Empiricists
Companion. Princeton: Princeton University Press.

12
Bangert, A. (2008) The development and validation of the student evaluation of online
teaching effectiveness. Computers in the Schools, 25(1), 25-47.
Benton, S. L. and Cashin, W. E. (2012). Student ratings of teaching: A summary of research
and literature (IDEA Paper no. 50). Manhattan, KS: The IDEA Center.
Benton, S. L., Webster, R., Gross, A., and Pallett, W. (2010). IDEA Technical Report No. 15:
An analysis of IDEA Student Ratings of instruction in traditional versus online courses.
Manhattan, KS: The IDEA Center
Braskamp, L. A. and Ory, J. C. (1994). Assessing faculty work: Enhancing individual and
institutional performance. San Francisco: Jossey-Bass.
Centra, J. A. (2009). Differences in responses to the Student Instructional Report: Is it bias?
Princeton, NJ: Educational Testing Service.
Centra, J. A. and Gaubatz, N. B. (2000). Is there a gender bias in student evaluations of
teaching? Journal of Higher Education, 70, 17-33.
Feldman, K. A. (1993). College students’ views of male and female college teachers: Part II-
Evidence from students’ evaluations of their classroom teachers. Research in Higher
Education, 34, 151- 211.
Gaytan, J. and McEwen, B. C. (2007). Effective online instructional and assessment
strategies. American Journal of Distance Education, 21(3), 117-132.
Graham, C. Cagiltay, K. Byung-Ro, L. Craner, J. and Duffy, T. M. (2001) March/April.
Seven Principles of effective teaching: a practical lens for evaluating online courses.
Technology Source.
Hoyt, D. P. and Lee, E. (2002a). IDEA Technical Report No. 12: Basic data for the revised
IDEA system. Manhattan, KS: The IDEA Center.
Hoyt, D. P. and Lee, E. (2002b). Technical Report No. 13: Disciplinary differences in student
ratings. Manhattan, KS: The IDEA Center.
Kahneman, D. (2011). Thinking, Fast and Slow, Farrar, Straus and Giroux
Ke, F. and Xie, K. (2009). Toward deep learning for adult students in online courses. Internet
and Higher Education, 12(1), 136–145.
Kim, K. and Bonk, C. J. (2006). The future of online teaching and learning in higher
education: The survey says ... Educause Quarterly, 29(4), 22-30.
Kolmogorov, A. (1933): Sulla determinazione empirica di una legge di distribuzione. Inst.
Ital. Attuari, Giorn., 4, 1-11.
Marsh, H. W. and Hattie, J. (2002). The relation between research productivity and teaching
effectiveness. Journal of Higher Education, 73, 603-641.

13
Marsh, H. W. and Hocevar, D. (1991). Students’ evaluations of teaching effectiveness: The
stability of mean ratings of the same teachers over a 13-year period. Teaching and Teacher
Education, 7, 303-314.
McGhee, D. E. and Lowell, N. (2003). Psychometric properties of student ratings of
instruction in online and on-campus courses. In T. D. Johnson and D. L. Sorenson (Eds.),
Online student ratings of instruction: New Directions for Teaching and Learning, No. 96 (pp.
39-48). San Francisco: Jossey-Bass.
Nulty, D. (2007). The adequacy of response rates to online and paper surveys: what can be
done?. Assessment and Evaluation in Higher Education, 33: 1-13.
Palloff, R. and Pratt, K. (2007). Building online learning communities: Effective strategies
for the virtual classroom. San Francisco: John Wiley and Sons.
Rowe, N. (2004). Cheating in online student assessment: Beyond plagiarism. Online journal
of Distance Learning Administration, 7(2).
Shevlin, M. Banyard, P. Davies, M., and Griffiths, M. (2000). The validity of student
evaluation of teaching in higher education: Love me, love my lectures? Assessment and
Evaluation in Higher Education, 25, 397–405.
Smirnov, N. (1948). Table for estimating the goodness of fit of empirical distributions.
Annals of Mathematical Statistics, 19: 279–281.
Sullivan, A. and Skanes, G. (1974). Validity of student evaluation of teaching and the
characteristics of successful instructors. Journal of Educational Psychology, 66, 584-590.
Wang, A. and Newlin, M. (2000). Characteristics of students who enroll and succeed in
psychology web-based classes. Journal of Educational Psychology, 92, 137-143.
White, H. (1980). A heteroskedasticity-consistent covariance matrix estimator and a direct
test for heteroskedasticity. Econometrica. 48 (4): 817–838.