student satisfaction survey 2005. administered to 213 randomly selected lecture & lab courses,...
TRANSCRIPT

Student Satisfaction Survey
2005

• Administered to 213 randomly selected lecture & lab courses, including courses from all campuses and all levels (response rate = 89%)
• A total of 3,647 surveys were completed
• The gender and race/ ethnicity of the respondents was representative of the spring 2005 enrollment
• Students attending the Boca Raton Campus were slightly under-represented in the sample. Juniors and graduate students were over-represented.
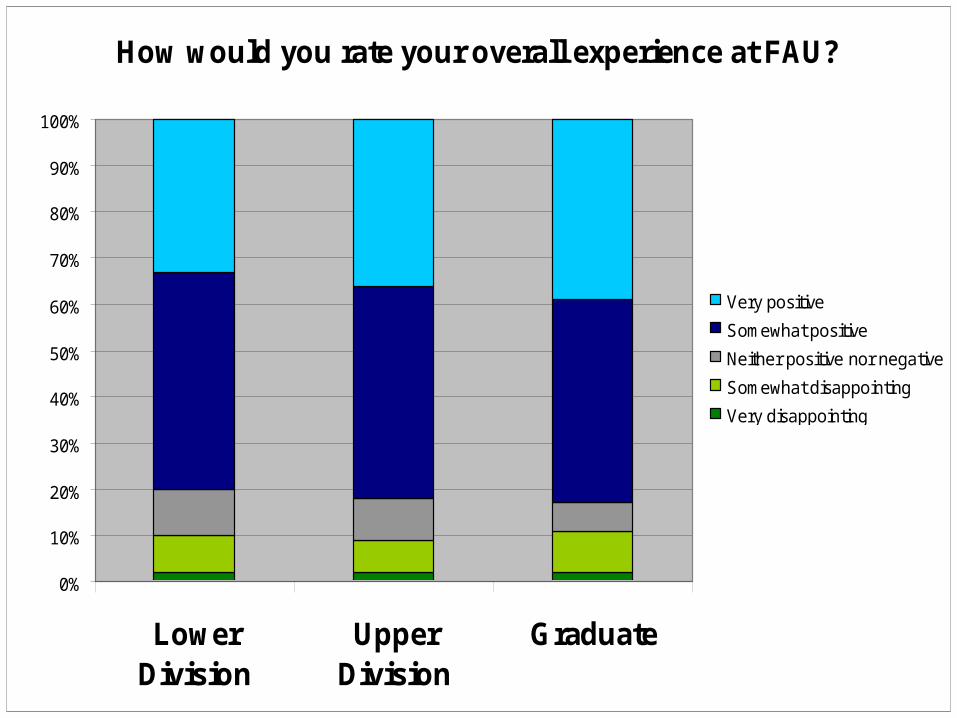
How would you rate your overall experience at FAU?
0%
10%
20%
30%
40%
50%
60%
70%
80%
90%
100%
LowerDivision
UpperDivision
Graduate
Very positive
Somewhat positive
Neither positive nor negative
Somewhat disappointing
Very disappointing

How would you rate your overall experience at FAU?
0%
10%
20%
30%
40%
50%
60%
70%
80%
90%
100%
Very positiveSomewhat positiveNeither positive nor negativeSomewhat disappointingVery disappointing

How would you rate your overall experience at FAU?
0%
10%
20%
30%
40%
50%
60%
70%
80%
90%
100%
Boca Raton Davie Ft. Lauderdale Port St. Lucie JupiterVery PositiveSomewhat PositiveNeither positive nor negativeSomewhat disappointingVery disappointing

Was FAU your first choice? (by current level)Percent responding "yes"
50%
48%
69%
75%
0% 10% 20% 30% 40% 50% 60% 70% 80% 90% 100%
Graduate Students
Juniors & Seniors(CC transfer)
Juniors & Seniors(native)
Freshman &Sophomores

What factors were important in your decision to attend FAU?
3%
12%
15%
18%
33%
37%
83%
0% 20% 40% 60% 80% 100%
Only school admitted
Size
Reputation
Financial aid
Academic programs
Low cost
Location
Which students report the most positive FAU experience?
• Those who chose FAU for its reputation for quality, and for academic programs.
• Those for whom FAU was first choice of institution.
• Those attending part-time.
• Those who attend the Port St. Lucie campus.
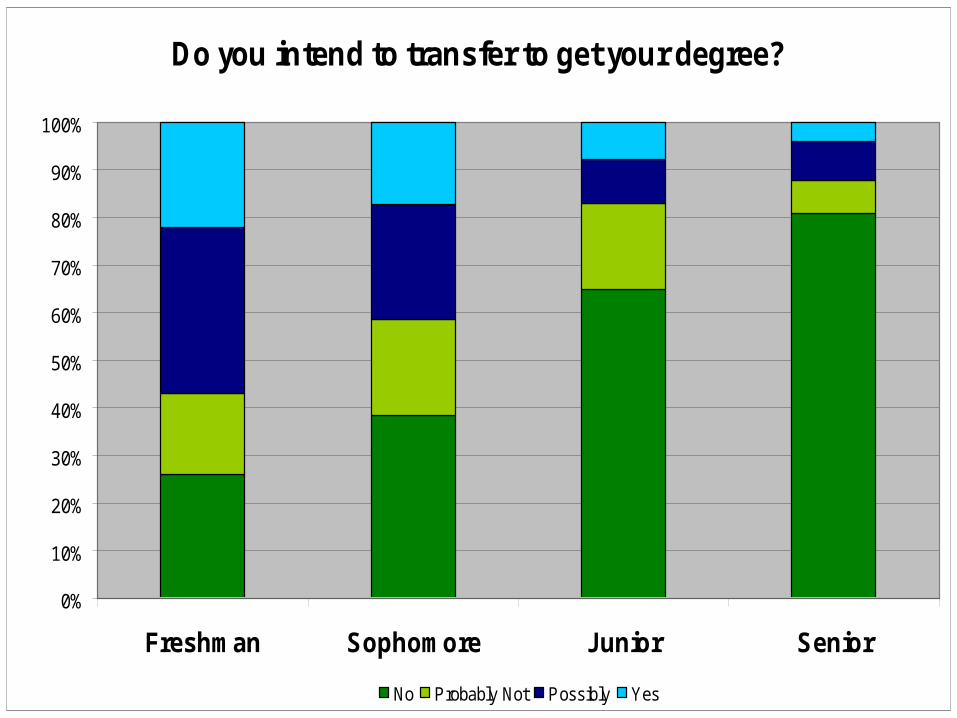
Do you intend to transfer to get your degree?
0%
10%
20%
30%
40%
50%
60%
70%
80%
90%
100%
Freshman Sophomore Junior Senior
No Probably Not Possibly Yes

Common reasons for wanting to transfer:
• To attend a better school with a stronger reputation
• To major in a program not offered at FAU• To be closer to home• To attend school of first choice• To earn a graduate degree at another school• Lack of school pride & campus activities at FAU• Not accepted into the Nursing program

Number of hours employed per week
0% 10% 20% 30% 40% 50% 60% 70% 80% 90% 100%
Lower division
Upper division
Graduate
None 1-20 21-39 40 or more
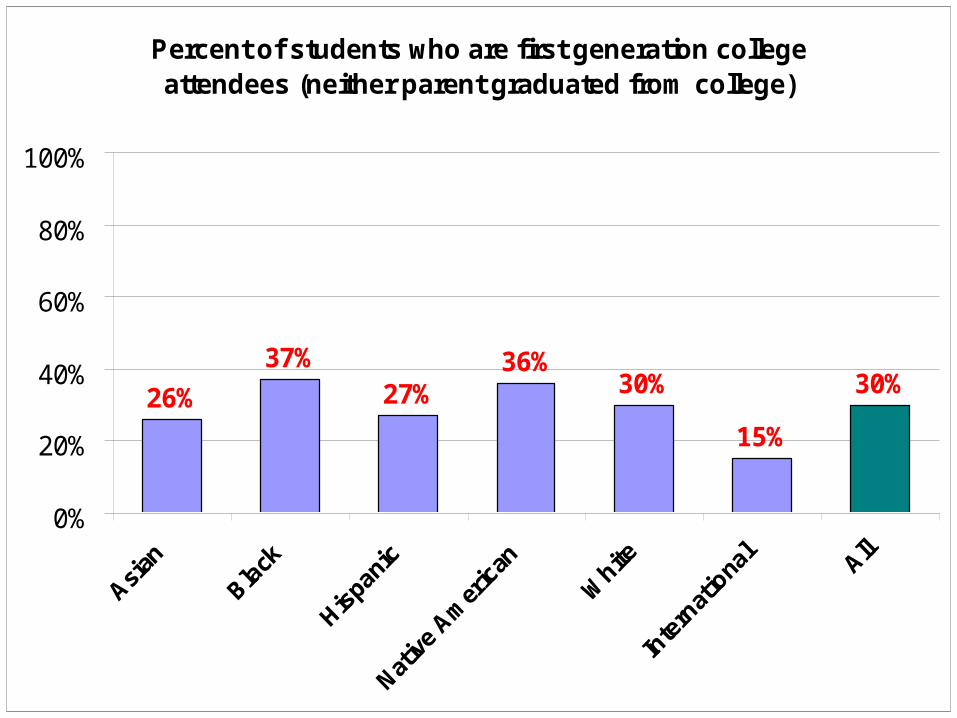
Percent of students who are first generation college attendees (neither parent graduated from college)
26%
37%27%
36%30%
15%
30%
0%
20%
40%
60%
80%
100%

Student Satisfaction with
AVAILABILITY
of FAU Programs and Services

Availability of:
0% 10% 20% 30% 40% 50% 60% 70% 80% 90% 100%
Health services
Freshman advising services
Food services
Advising in college advising office
Advising by faculty
Places to study
Campus bookstore
Computer services
Library services
Courses in your degree program
Faculty in your degree program
Excellent Good Fair Poor Unaware Did not use
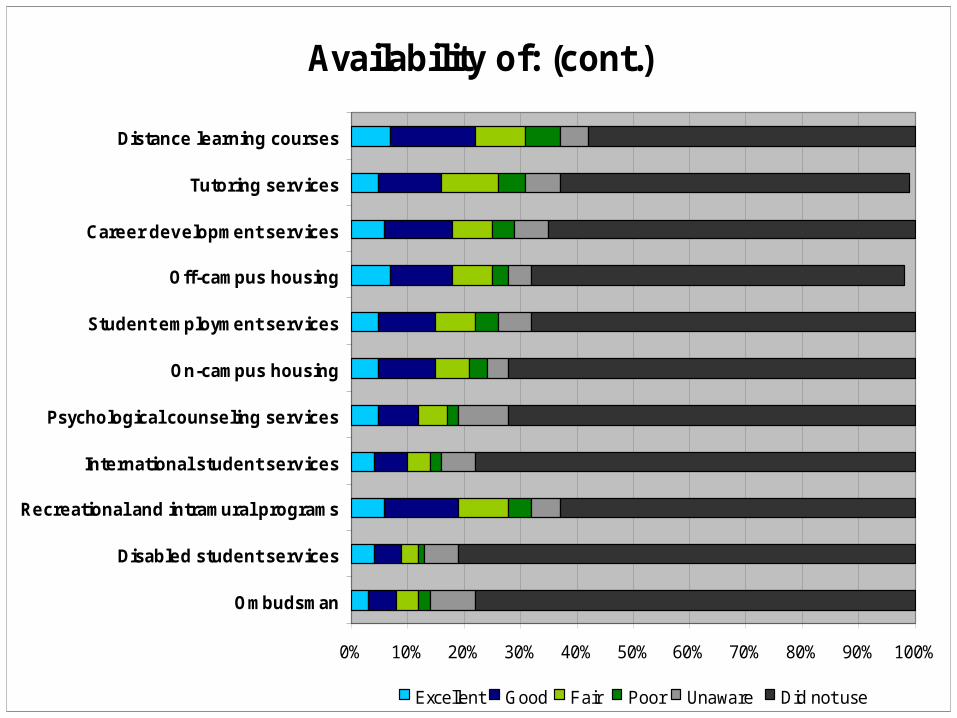
Availability of: (cont.)
0% 10% 20% 30% 40% 50% 60% 70% 80% 90% 100%
Ombudsman
Disabled student services
Recreational and intramural programs
International student services
Psychological counseling services
On-campus housing
Student employment services
Off-campus housing
Career development services
Tutoring services
Distance learning courses
Excellent Good Fair Poor Unaware Did not use

Availability of courses in your degree program(undergraduate)
0%
10%
20%
30%
40%
50%
60%
70%
80%
90%
100%
Excellent
Good
Fair
Poor

Availability of courses in your degree program(graduate)
0%
10%
20%
30%
40%
50%
60%
70%
80%
90%
100%
Excellent
Good
Fair
Poor

Availability of courses in your degree program(undergraduate)
0% 10% 20% 30% 40% 50% 60% 70% 80% 90% 100%
Jupiter
Port St. Lucie
Ft. Lauderdale
Davie
Boca Raton
Excellent Good Fair Poor
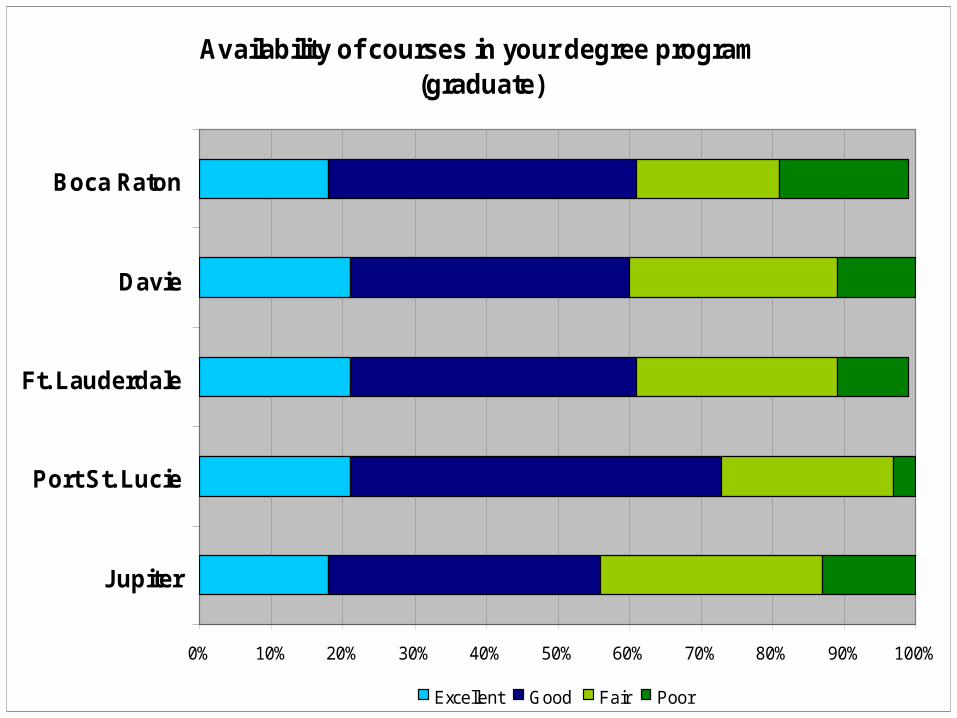
Availability of courses in your degree program(graduate)
0% 10% 20% 30% 40% 50% 60% 70% 80% 90% 100%
Jupiter
Port St. Lucie
Ft. Lauderdale
Davie
Boca Raton
Excellent Good Fair Poor

Availability of advising in college advising office(undergraduate)
0% 10% 20% 30% 40% 50% 60% 70% 80% 90% 100%
CAUPA
Science
Nursing
Honors
Engineering
Education
Business
Arts & Letters
Excellent Good Fair Poor Unaware Did not use
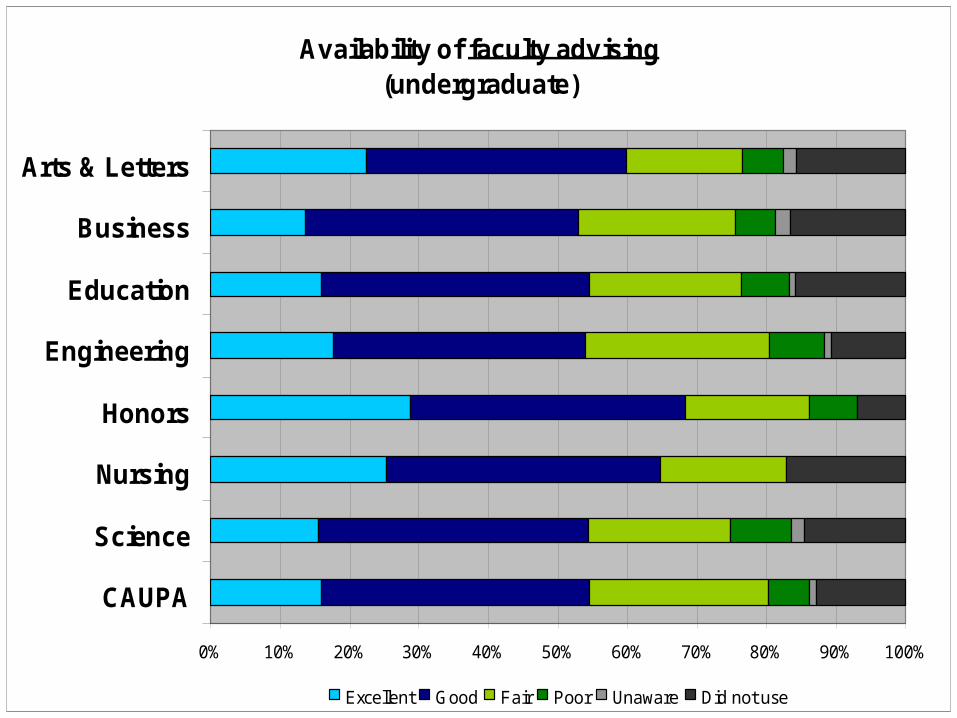
Availability of faculty advising(undergraduate)
0% 10% 20% 30% 40% 50% 60% 70% 80% 90% 100%
CAUPA
Science
Nursing
Honors
Engineering
Education
Business
Arts & Letters
Excellent Good Fair Poor Unaware Did not use

Availability of faculty advising(undergraduate)
0% 10% 20% 30% 40% 50% 60% 70% 80% 90% 100%
Jupiter
Port St. Lucie
Ft. Lauderdale
Davie
Boca Raton
Excellent Good Fair Poor Unaware Did not use

Availabilty of library services
0% 10% 20% 30% 40% 50% 60% 70% 80% 90% 100%
Jupiter
Port St. Lucie
Ft. Lauderdale
Davie
Boca Raton
Excellent Good Fair Poor Unaware Did not use

Availability of computer services
0% 10% 20% 30% 40% 50% 60% 70% 80% 90% 100%
Jupiter
Port St. Lucie
Ft. Lauderdale
Davie
Boca Raton
Excellent Good Fair Poor Unaware Did not use
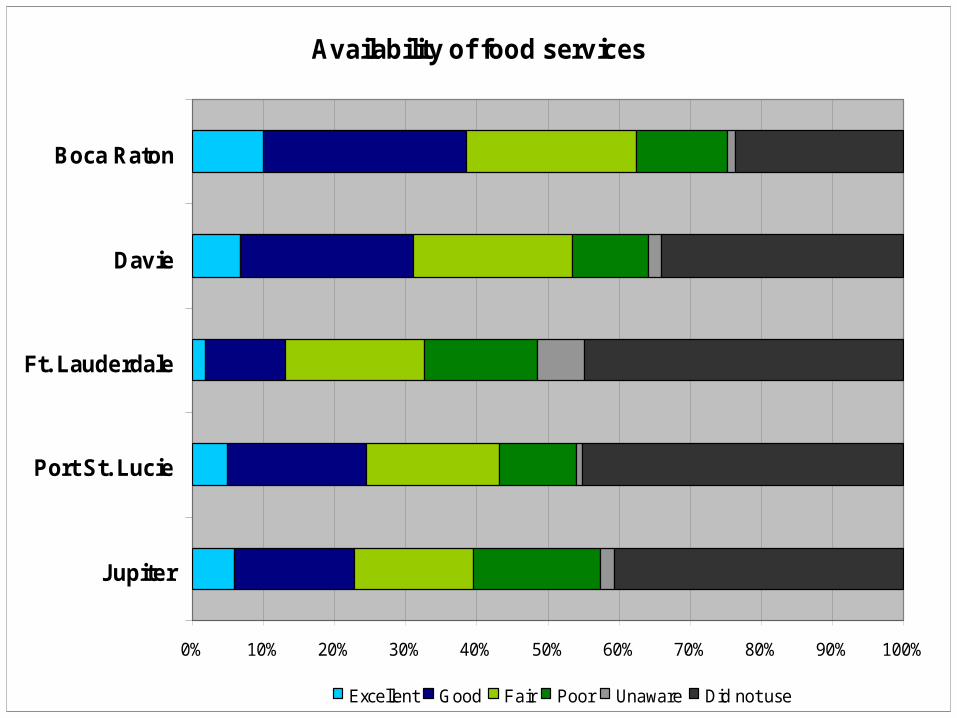
Availability of food services
0% 10% 20% 30% 40% 50% 60% 70% 80% 90% 100%
Jupiter
Port St. Lucie
Ft. Lauderdale
Davie
Boca Raton
Excellent Good Fair Poor Unaware Did not use
Student Satisfaction with
QUALITY
of FAU Programs and Services
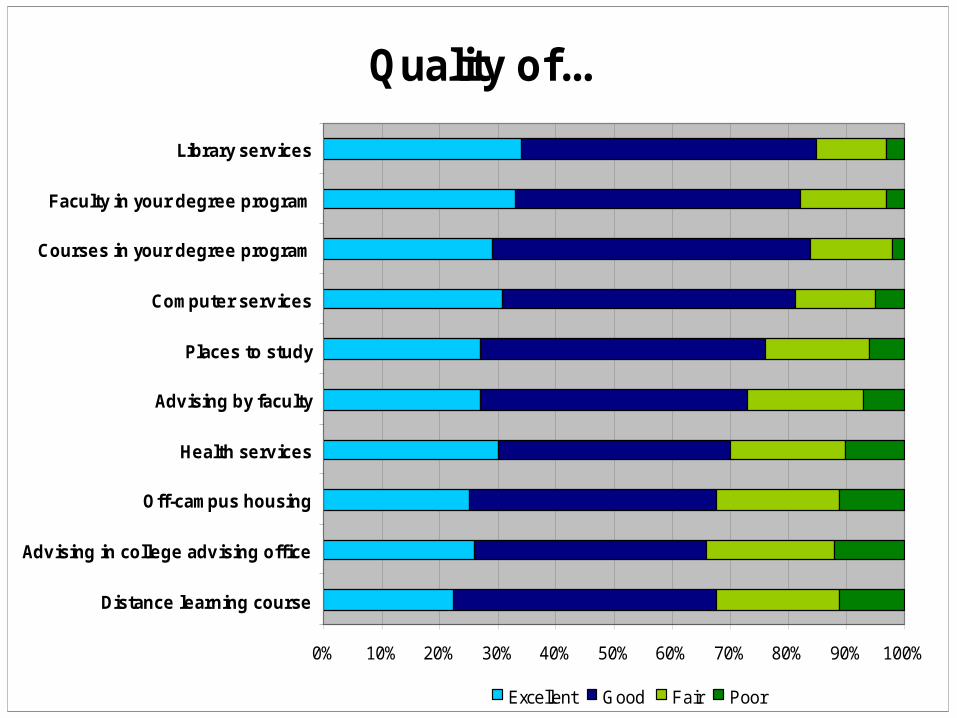
Quality of...
0% 10% 20% 30% 40% 50% 60% 70% 80% 90% 100%
Distance learning course
Advising in college advising office
Off-campus housing
Health services
Advising by faculty
Places to study
Computer services
Courses in your degree program
Faculty in your degree program
Library services
Excellent Good Fair Poor

Quality of… (cont.)
0% 10% 20% 30% 40% 50% 60% 70% 80% 90% 100%
Ombudsman
Food services
Tutoring services
International student services
Disabled student services
Freshman advising services
Student employment services
Psychological counseling services
On-campus housing
Career development services
Recreational and intramural programs
Campus bookstore
Excellent Good Fair Poor

Quality of courses in your degree program(undergraduate)
0% 10% 20% 30% 40% 50% 60% 70% 80% 90% 100%
CAUPA
Science
Nursing
Honors
Engineering
Education
Business
Arts & Letters
Excellent Good Fair Poor

Quality of courses in your degree program(graduate)
0% 10% 20% 30% 40% 50% 60% 70% 80% 90% 100%
CAUPA
Science
Nursing
Engineering
Education
Business
Arts & Letters
Excellent Good Fair Poor

Quality of faculty in your degree program(undergraduate)
0% 10% 20% 30% 40% 50% 60% 70% 80% 90% 100%
CAUPA
Science
Nursing
Honors
Engineering
Education
Business
Arts & Letters
Excellent Good Fair Poor

Quality of faculty in your degree program(graduate)
0% 10% 20% 30% 40% 50% 60% 70% 80% 90% 100%
CAUPA
Science
Nursing
Engineering
Education
Business
Arts & Letters
Excellent Good Fair Poor

Quality of advising in your college advising office(undergraduate)
0% 10% 20% 30% 40% 50% 60% 70% 80% 90% 100%
CAUPA
Science
Nursing
Honors
Engineering
Education
Business
Arts & Letters
Excellent Good Fair Poor

Quality of advising by faculty(undergraduate)
0% 10% 20% 30% 40% 50% 60% 70% 80% 90% 100%
CAUPA
Science
Nursing
Honors
Engineering
Education
Business
Arts & Letters
Excellent Good Fair Poor
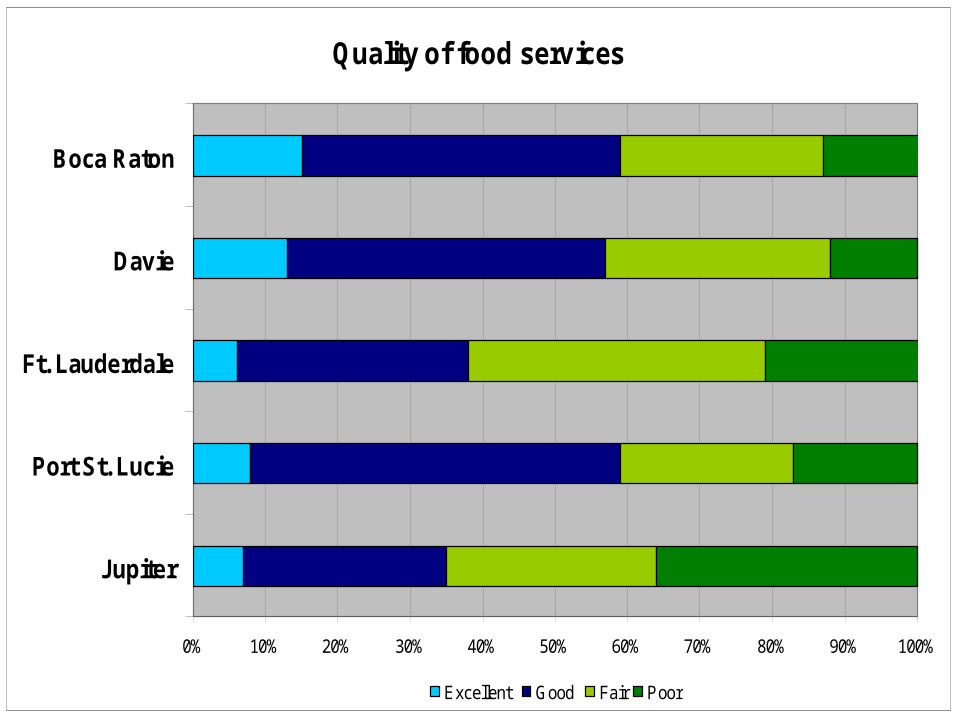
Quality of food services
0% 10% 20% 30% 40% 50% 60% 70% 80% 90% 100%
Jupiter
Port St. Lucie
Ft. Lauderdale
Davie
Boca Raton
Excellent Good Fair Poor

Quality of computer services
0% 10% 20% 30% 40% 50% 60% 70% 80% 90% 100%
Jupiter
Port St. Lucie
Ft. Lauderdale
Davie
Boca Raton
Excellent Good Fair Poor
SATISFACTION
with FAU Programs and Services

Satisfaction with:
0% 10% 20% 30% 40% 50% 60% 70% 80% 90% 100%
Quality of info on fin. aid.website
Faculty concern for you
Feeling of safety andsecurity
Fee payment process
Application/ admissionprocess
FAU information on theweb
Class size
Web registration
Very satisfied Satisfied Dissatisfied Very dissatisfied Did not use

Satisfaction with...(cont.)
0% 10% 20% 30% 40% 50% 60% 70% 80% 90% 100%
Availability of short termloans
Student government
Campus media
Social and culturalactivities
In-person registration
Involvement on campus
Helpfulness of staff
Purposes for student fees
Very satisfied Satisfied Dissatisfied Very dissatisfied Did not use

Satisfaction with class size(undergraduate)
0% 10% 20% 30% 40% 50% 60% 70% 80% 90% 100%
CAUPA
Science
Nursing
Honors
Engineering
Education
Business
Arts & Letters
Very satisfied Satisfied Dissatisfied Very dissatisfied
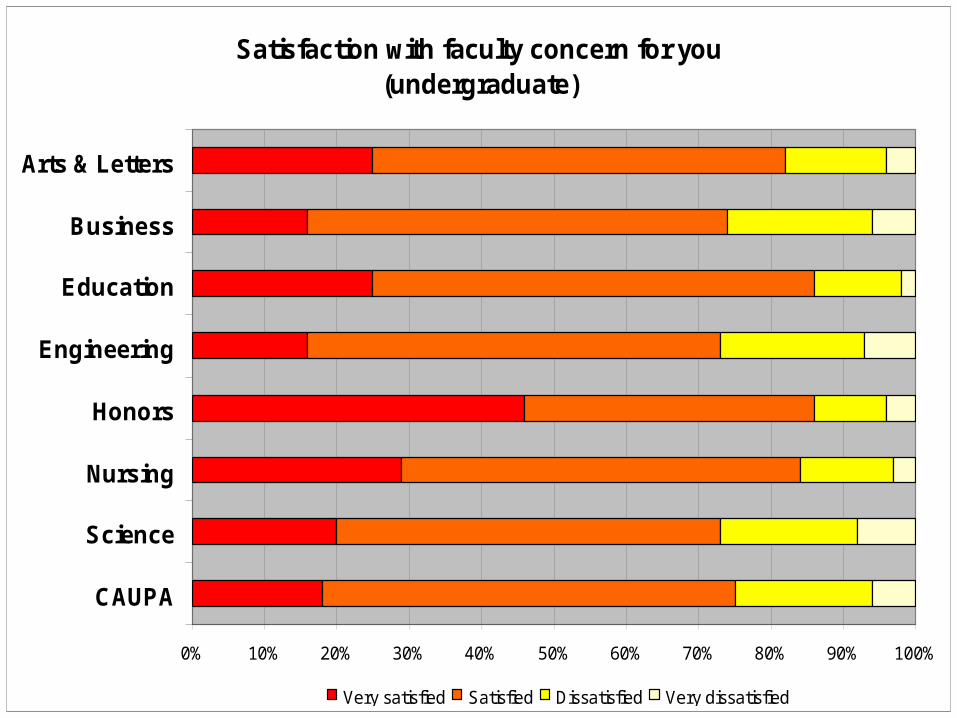
Satisfaction with faculty concern for you(undergraduate)
0% 10% 20% 30% 40% 50% 60% 70% 80% 90% 100%
CAUPA
Science
Nursing
Honors
Engineering
Education
Business
Arts & Letters
Very satisfied Satisfied Dissatisfied Very dissatisfied
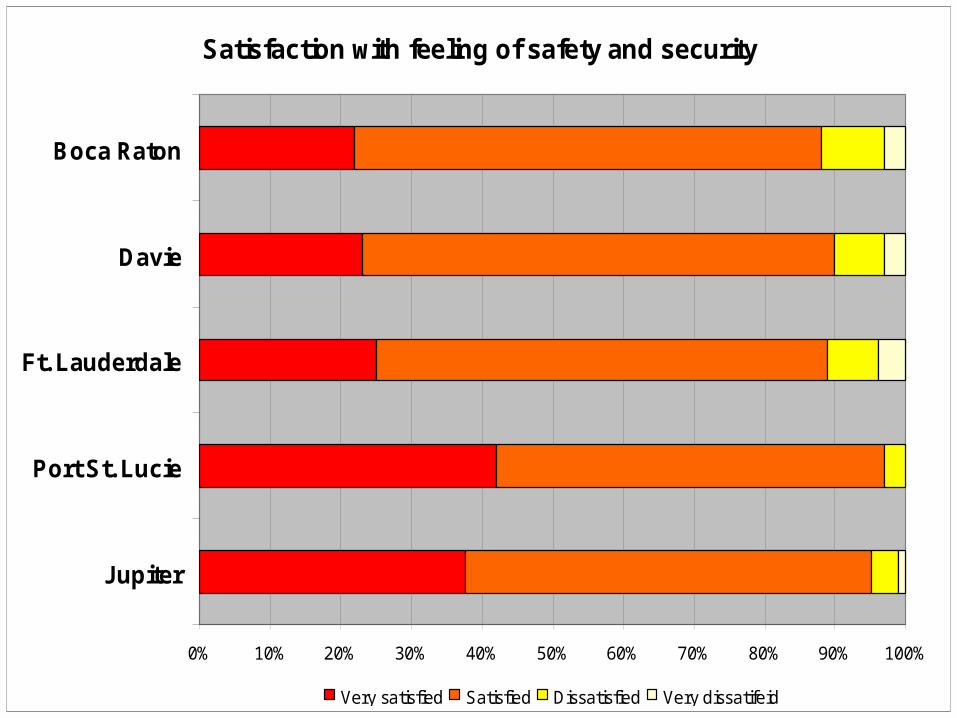
Satisfaction with feeling of safety and security
0% 10% 20% 30% 40% 50% 60% 70% 80% 90% 100%
Jupiter
Port St. Lucie
Ft. Lauderdale
Davie
Boca Raton
Very satisfied Satisfied Dissatisfied Very dissatifeid

Satisfaction with helpfulness of staff
0% 10% 20% 30% 40% 50% 60% 70% 80% 90% 100%
Jupiter
Port St. Lucie
Ft. Lauderdale
Davie
Boca Raton
Very satisfied Satisfied Dissatisfied Very dissatisfied

Trends in Student Satisfaction:
1998 - 2005

What factors were important in your decision to attend FAU?
0%
10%
20%
30%
40%
50%
60%
70%
80%
90%
100%
1998 2001 2003 2005
Low cost
Location
Reputation
Size
Academic Programs
Scholarship/ Financial Aid
Only school Admitted
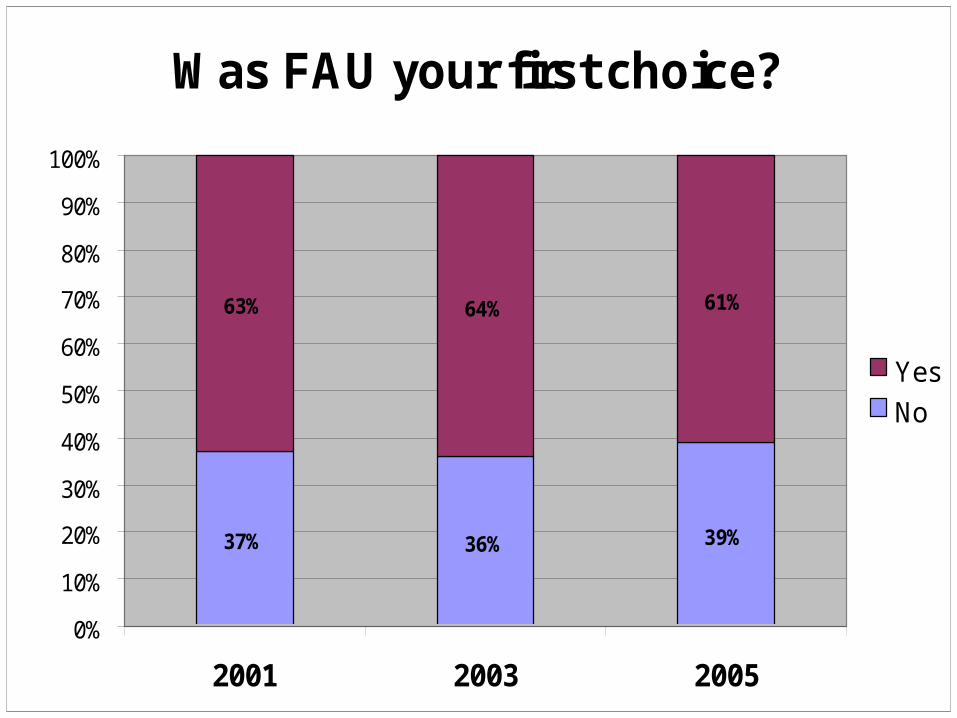
Was FAU your first choice?
37% 36% 39%
63% 64% 61%
0%
10%
20%
30%
40%
50%
60%
70%
80%
90%
100%
2001 2003 2005
Yes
No
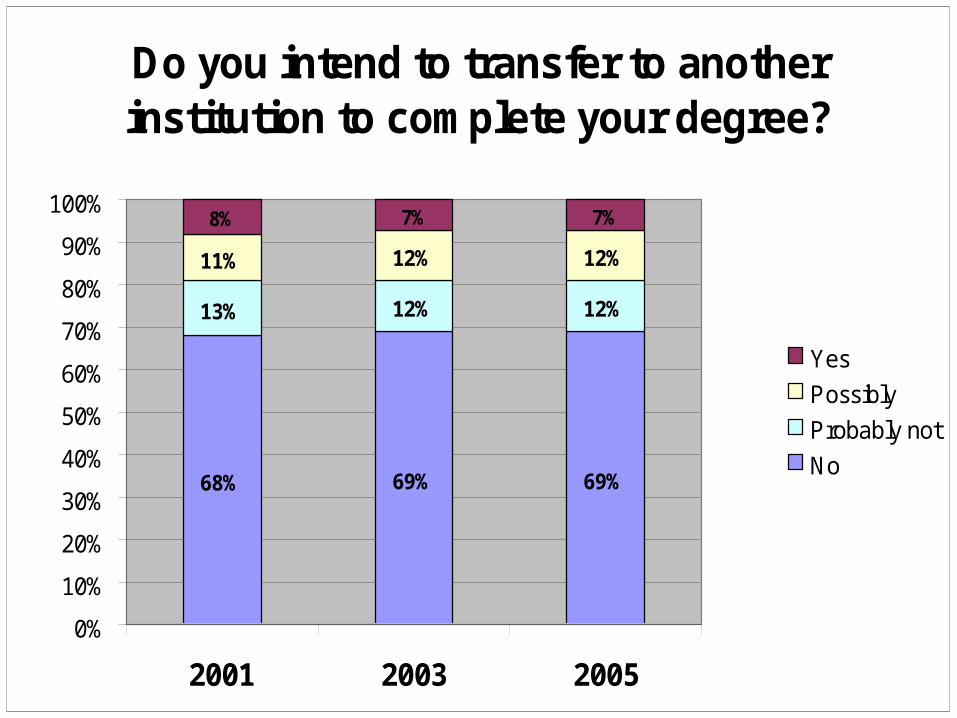
Do you intend to transfer to another institution to complete your degree?
68% 69%
13% 12% 12%
11% 12% 12%
8% 7% 7%
69%
0%
10%
20%
30%
40%
50%
60%
70%
80%
90%
100%
2001 2003 2005
Yes
Possibly
Probably not
No
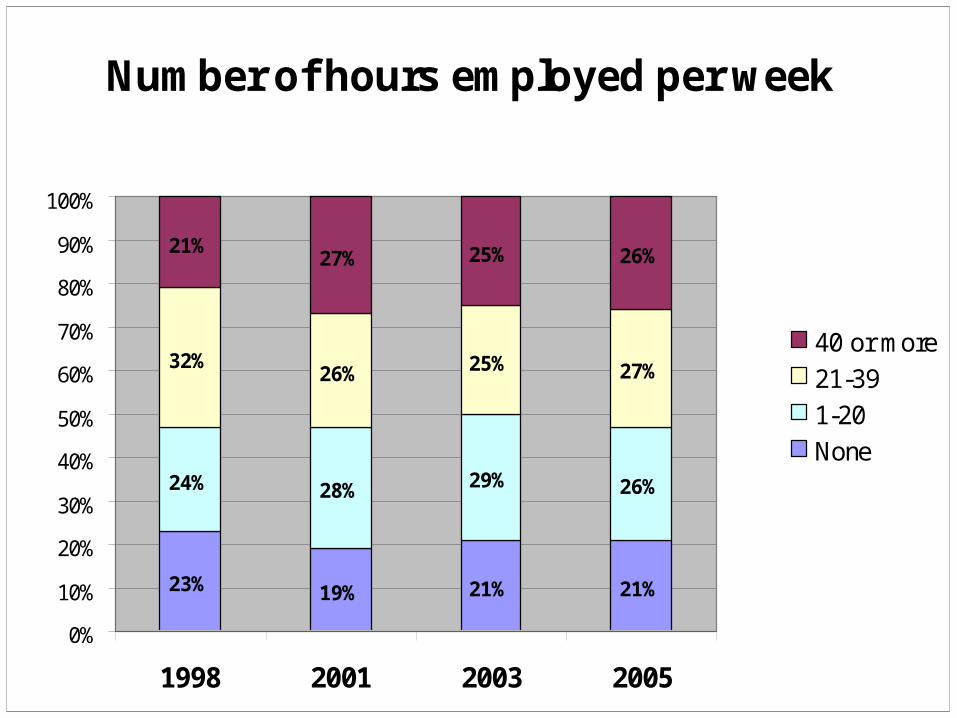
Number of hours employed per week
23% 19% 21% 21%
24% 28% 29% 26%
32%26% 25% 27%
21%27% 25% 26%
0%
10%
20%
30%
40%
50%
60%
70%
80%
90%
100%
1998 2001 2003 2005
40 or more
21-39
1-20
None

Availability 2001 to 2003* 2003 to 2005*
Library services 0 +
Instructors in your degree program + 0
Computer services 0 ++
Places to study 0 +
Advising by faculty 0 +
Student health services 0 +
Psychological counseling services 0 0
Courses in your degree program 0 0
Advising in college advising office + +
Career development Center services 0 +
Student employment services 0 0
Distance learning courses 0 +
Campus bookstore + 0
On-campus housing + ++
Freshman advising services - +
Tutoring Services 0 0
Food services + 0
*Change = Statistically significant difference at p<.05

Quality 2001 to 2003* 2003 to 2005*
Library services 0 +
Instructors in your degree program + 0
Courses in your degree program + 0
Computer services 0 ++
Places to study 0 +
Advising by faculty 0 +
Student health services 0 +
Advising in college advising office + +
Distance learning courses - ++
Campus bookstore + 0
Career development Center services - ++
On-campus housing 0 ++
Psychological counseling services - 0
Student employment services - 0
Freshman advising services - +
Tutoring Services 0 0
Food services 0 +
*Change = Statistically significant difference at p<.05

Satisfaction 2001 to 2003* 2003 to 2005*
Application/ admission process - +
Information on financial aid website 0 +
In- person registration procedures - +
FAU information on the web - +
Fee payment process + +
Class size 0 +
Faculty concern with student progress & success + 0
Helpfulness of campus non-teaching staff 0 +
Use of activity service fees - +
Sponsored social and cultural events 0 +
Student government + 0
Campus Media + 0
Feeling of safety and security on campus + 0
Opportunity for involvement on campus + 0
*Change = Statistically significant difference at p<.05
Trends in Student Satisfaction 1998 to 2005
• There are consistent patterns across the years in number of hours employed, intention to transfer, reasons for choosing FAU.
• A slightly greater proportion of students in 2005 indicated that FAU was not their first choice of institution.
• Students in 2005 were more satisfied with the availability and quality of most FAU programs and services. There were significant gains in satisfaction with advising, computer services, career development and housing, among others.
• Satisfaction increased in 2005 in areas where it had decreased in 2003, particularly admissions, registration, information on the web, and use of student fees.
• There were no significant declines in satisfaction with any area of FAU services and programs in 2005.