student special education placement. research on learning
TRANSCRIPT

DOCUMENT RESUME
ED 228 825 EC 151 683
AUTHOR Ysseldyke, James E.; And OthersTITLE Observed Changes in Instruction and Student
Responding as a Function of'Referral and Special
Education Placement.INSTITUTION Minnesota Univ., Minneapolis. Inst. for Research on
Learning Disabilities.SPONS AGENCY Office of Special Education and Rehabilitative
Services (ED), Washington, DC.REPORT NO IRLD-RR-95PUB DATE Oct 82CONTRACT 300-80-0622NOTE 120p.PUB TYPE Reports - Research/Technical (143)
EDRS PRICE'DESCRIPTORS
ABSTRACT
MF01/PC05 Plus Postage.*Disabilities; Elementary Education; *IndividualizedEducation Programs; *Referral; *Student Placement;*Time on Task
Four elementary students referred for specialeducation evaluation were observed'systematically for 2 entire days
each at three different times within the referral-to-placementprocess. Data were recorded on 53 variables within six categories in
10 second intervals to examine changes in the nature of instructionand academic responding time as a function of going through thereferral-to-placement process. Few consistent trends were observed,
and extreme variability among students was found. In some cases,changes observed 1 month after the indiVidualized education program(IEP) was written were no longer, evident 2 months after the IEPJwas
written. (Author/CL)
************************************************************************ Reproductions supplied by EDRS are the best that can'be,made *
from the original document.*******************************************W***************************
00
University of Minneso a
Research Report No. 95
-CA. DEPARTMENT OF EDUCATION
NATIONAL INSTITUfE OF EDLICATIONEDUCATIONAL RESOURCES INFORMATION
CENTER (ERIC)Zhia document has been reproduced asreceived from the person or organizationoriginating It.
Minor changes have boon model° improvireproduction quality.
Points of view or opinions stated in zhis clop-merit do not necessarily represent
official MEposition or policy.
OBSERVED CHANGES IN INSTRUCTION AND STUDENT RESPONDfNG AS.A
FUNCTION OF REFERRAL AND SPECIAL FflUCATION PLACEMENT
JaMes E. Ysseldylce; Martha L. Thurlow, Carol MeCklenburg,
,and Janet Graden
inttitute_..for-esearch. °-
Loa:Ming.Di$0011:1111,s-...
"PERMISSION TO REPRODUCE THISMATERIAL HAS BEEN GRANTED BY
J. Ysséldyke
HE EDUCATIONAL RESOURCESRMATION CENTE.R (ERICV:
Direttort James E. Ysseldyke
'
The Institute for Research on Learning Disabilities is supported by
a contract (300-80-062) with the Office of Special Education, Depart-ment of Education, through Title VI-G of Public Law 91-230. Institute
investigators are conducting research on the assessment/decision-making/
intervention process as it relates to learning disabled students.
During, 1980.1983, Institute research focuses:on four:majorareas:
Referral
Identification/Classification
Intervention Planning and Progress Evaluation
Outcome Evaluation
Additional information on the Institute's research objectives and
activities may be obtained by writing to the Editor at the Institute
(see Publications list for address).
The research reported herein was conducted under government spon-
sorship. Contractors are encouraged to express freely their pro-fessional judgment in the conduct of the project. Points of view
or opinions stated do not, therefore, necessarily, represent the
official position of the Office of Special Education.

Research Report No. 95
OBSERVED CHANGES IN INSTRUCTION AND STUDENT RESPONDINGAS.A
FUNCTION OF REFERRAL AND SPECIAL EDUCATION pLACEMENT
James E. YsSeldyke, Martha L: ThurlOw,-Carol ecklenburg,
and Janet Graden
Institute for Research on Learning Disabilities
Untversity Of Minnesota
October, 1982

Abstract
Four students were observed systematically for two entire school
days each at three different times within the referral-to-placement
process. Data were recorded on 53 variables within six categories'in'I 1
10-second intervals to examine changes in the nature of instruction
and academic responding time as a function, of going through the
referral-to-placement process. Few consistent trends were observed
and extreme variability among students was found. IP some cases,
changes observed one month:after the IEP was Written were nO longer
evident two months after the IEP was written. Limitations and
implications of the study are discussed.

TOle of Contents
Introduction
Method
SubjectsObservation SystemObserversProcedures
.
Page
1
4
4
4
'6
7
Observer training 7
Data collection 8
Reliability. . . . 9
Achievement-testing 11
Averege Observed Times for LD and Non-LD Studentt . . . 11
Results , 13
13Case 1
Time 1 14
Time 2 16
Time 3 17
Achievement 18
SuMmary 19
Case 2 20
Time I 20
Time, 2 , 22
Time 3 23
Achievement 24
Summary 24
Case 3 . . 25
Time 1 . .. &
25
Time 2 27
Time 3 28
Achievement . . ..... . . . . . . 30
Summary 30
Case 4 30
Time 1 31
Time 2 32
Time 3 ............ .. . .. . 34
Achievement. 35
. .Summary. . .. . . .35
Highlights of Findings Across Cases 35

Discussion
References . OOOOOOOOOO . . . . 42 '
Footnote 44
Tables 45
Figures 71
Appendices
' A. Definitions and Examples of CISSAR EventsB. Optical Scanner Coding Sheet'C. Guidelines for Anetdotal Recordings
.6

ObServed Changes in Instruction and Student Responding As a
Function of Referral and Special Education Placement
Current practices of referral ahd plaCement in speCial education
are based upon the premise that Certain students have instructional:
needs that can be met better through special programming than through
standard educational practices. Typically,- once a student is
referred, there is an extremely high probab1 lity that the student will
6be tested and placed (Algozzine, Christ nson, & Ysseldyke, in press).
It is thought that students who are rePerred, assessed, and declared
eligible for special treatment will experience some significant change
in their instructional programs.
Describing how students spend their time in classrooms is a
necessary element in understanding factors that affect academic
success or failure, one which should have important implications for
assessment, decision making, and intervention with students,
especially those students who reportedly display educational
difficulties. Leonard (1981) suggested that time is a critical issue
to consider in providing an appropriate education to all stu*nts as
required by Public Law 94-142, and Bloom (1980) argued that time is art
"alterable variable" available to all students. Previous
observational research has demonstrated that the instructional ecology
of a classroom differs for each student (Berliner, 1980; Good &
Brophy, 1974) and that one variable of importance to academic
achievement is amount of time spent by a student in active academic
responding (Borg, 1980; Hall, Delquadri, Greenwood, & Thurston, 1982;
Stallings, 1980).,
How the referral-to-placement process affects instructional

2
ecology and active responding time for individual students has not
been addressed in previous work. In an initial attempt to address
this question, the Minnesota Institute for Research on Learning
Disabilities (IRLD) followed four elementary school children from the
time of their referral through IEP writing to two.months following
placement. Data were collected at three different times during the
referral-to-placement process: (a) following referral but prior to
the child study meeting, (b) one month following the IEP meeting, and
(c) two months following the IEP meeting. Other IRLD studies have
focused on observations of instructional ecology and student
responding for large groups of regular education and learning disabled
students with the goal of describing group similarities and
differences (cf. Graden, Thurlow, & Ysseldyke, 1982; Graden, Thurlow,'
Ysseldyke, & Algozzine, 1982; Greener, Thurlow, Graden, & Ysseldyke,
1982; Thurlow, Graden, Greener, & Ysseldyke, 1982; Thurlow, Ysseldyke,
& Graden, 1982; Thurlow, Ysseldyke, Graden, Greener, & Mecklenburg,
1982). The current study was an effort to ascertain the extent to
which any changes in instruction or responding occurred for students
involved in the referral process. The following questions guided this
research effort:
1. To what extent are there changes in time allocated tovarious activities as a function of students goingthrough the referral-to-placement process?
2. To what extent are there changes in time allocated tovarious tasks as a function of students going throughthe referral-to-placement process?
3. To what extent are there changes in time allocated tovarious teaching structures as a function of studentsgoing through the referral-to-placement process?
9 tvip

4. To what extent are there changes in time allocated tovarious-teacher locations within the classroom as a
. function of students going.through the referral-to,placement process?
To what extent are there changes in time allocated tovarious teacher activities as a function of stUdentsgoing through the referral-to-placement 'process?
6. To what extent are there changes in student time engagedin various responses as a function of students goingthrough the referral-to-placement process?
7. To what extent are there changes in time allocated toacademic versus non-academic activities as a function ofstudents going through the referral-to-placementprocess?
. To what extent are there changes in student time engagedin academic responding, task management, andinappropriate behaviors as a function of students goingthrough the.referral-to-placement process?
9. What is the extent of variability among individuals inthe changes observed as a function of students goingthrough the referral-to-placement process?
The above questions focus on allocated and engaged timesas opposed to
scheduled times. Allocated times were measured by direct observations
of how much time actually was spent in various class activities,
taskst4tructures, teacher locations, and teacher activifies. Engaged
times -were assessed by direct observation of time spent by each
student making different kinds of responses. Engaged times that
involved active, observable learning responses are referred to as
active academic responding tim-es. It has been demonstrated that
engaged time is a stronger correlate of achievement than allocated
time (Borg, 1980); further, it has been argued that a student must
actually be engaged in practice (active academic responding) to learn
(cf. Hall et al., 1982).
Method
Sub ects
Four students fromtfour classrooms in three elementary schools in
a suburban school district served as subjects; 'The students had been
referred by their teachers to their schools' child study teams for
consideration for special education. evaluations. Three of the
students were males and one was female; they were in grades 1 (N=1), 2
(N=1), and 3 (N=2). All of the referring' teachers were female. .
All teachers and students were volunteer participants in the
observational study. At the beginning of the school year, principals
in 10 schools were informed of the study and asked to notify Institute
researchers when a referral was sdbmitted by a teacher who was willing
to have observers in his or her class. It was planned that at least
one student would be observed in each school. However, Institute
researchers were notified of only eight cases in six schools. Consent
forms were obtained from the techer and for all students within these
classes before observations were initiated. Observations were started
in the eight classes; however, complete data were obtained for only
four students. Data on the other four students were incomplete either
because (a) the principal and teacher decided they did not wish the
student to continue in the study (N=1), or (b) the school year ended
before final observations could be completed within the predetermined
schedule (N=3).
Ohservation System
The CISSAR (Code for Instructional Structure and Student Academic
Response) observation system was used in this study. The version of
11

5
the system employed/was developed by the Juniper Gardens Children's-
Project in Kansas City, Kansas (Greenwood, Delquadri, & 1978).
The system focused the observation on the behavior of one target
student (rather than sampling behaviors of several students) and
allowed observers to record six event areas: (a) activity (12,codes),
(b) task (8 codes), (c) teaching structure (3 codes), (d) teacher
location (6 codes), (e) teacher activity (5 codes), and (f) student
response (19 codes). Seventeen stop codes also were used to record
reasons for termination of observation. Table 1 is a summary of the
definitions of the event areas and the specific events recorded within
each area. Detailed definitions and examples are presented in
Appendix A. Excluding the stop codes, a total of 53 different events
could be recorded with the CISSAR system.
Insert Table 1 about here
An-interval time sampling technique was used to direct the
recording of events. Three event areas were recorded every 10 seconds
over the entire school day while the student was in the classroom.
Coding was structured into blocks of seven 10-second inte als.
During the first 10-second interval, activity, task, a teaching
structure were recorded. During each of the next six 10-second
intervals, teacher location, teacher activity, and student-resrionse
were reco
observation.
An auditory electronic timer attached to a clipboard was used to
This pattern was maintained throughout the

6
signal the 10-second intervals. The timer was equipped with an
earplug so that only the observer could hear the signal (a short beep
sound). The clipboard was used to hold coding sheets and to provide a
hard surface for marking'events.
The coding sheets, modeled after those used by the Juniper
Gardens Children's Project (Stanley & Greenwood, 1980), were designed
at Minnesota's Institute so that they could bp read automatically by
an optical scanner (see Appendix 8). To ,be read correctly by the,
scanner, the circles on the coding sheet had to be very dark and
completely filled. In addition to spaces for coding student
identification and start and stop times, each, sheet contained three
blocks representing 70 seconds each. Each completed sheet represented
3.5 minutes of observation time.f!
Observers
Eleven individuals served as observers. Eight,of the observers
were responsible for the majority of the observations. The other
three observers were substttutes who filled in when the other
observers' schedules were full, and in cases of sickness, make-up
observations, and so on. These substitute observers were Institute
staff members who conducted observer training sessions and monitored
the regular observers. The regular observers were all females who had
been selected from a pool of 50 female applicants who had responded to
an ad in a local newspaper. A prerequisite for consideration was that
the applicant not have a background in education; the goal was to
minimize biases that might be brought to the classroom setting.
Additional selection criteria included average or above average
13

7
reading ability and performance on selected parts of a general office
skills test. A personal interview with one of two Institute staff
members comprised the final step of selection.
Of the eight selected observers, three had attended college for
at least one year, and one had a BA. Two others had completed a
business or vocational school program. Previous employment varied
01'
greatly, including sales, clerical, foster parent, own business, and
. social worker. All but one ob'server had .a child or children in
elementary or secondary hool. Observers did not work in schools in--e-
which their children were enrolled.
Procedures
Observer training. Training of observers in the observation
system was accomplished through the use of an Observer and Trainer's
Manual (Stanley & Greenwood, 1980). The manual presented eight units
that, according to the authors, were sequenced in terms of the
complexity of the recording skills covered. Training required
observers to read materials and then practice coding small numbers of
events through the use of a variety of other media, including
flashcards, overheads, and videotapes. Exercises and quizzes were
presented throughout the manual. Mastery (100% correct) of the
material in each unit was required before continuing in the training
to the next unit.
Training in the system was conducted by four Institute staff
members. Two weeks of half-day training sessiohs were required to
cover the material presented in the manual. This was followed by two
to three days of practice coding within actual classrooms.
Data collection. The trained educational observers coded
activities on either a whole-day (one observer all day) or half-day
(one observer for morning, another for afternoon) basis. Typically,
observers did not ccide continuously for a period of more than 11/2 - 2
hours because of breaks within the school day. Observations were not
conducted during breaks, such as lunch, recess, or bathroom. Also,A
observers did not code during physical education, music, or special
assembly programs since the observation system did not apply,to these
situations. Observers did follow target students when they left their
homerooms to go to other classrooms for certain subjects (typically
reading and/or mathematics), or when they went to the LD teacher for
special instruction. Coding was conducted in these other classrooms
in the same manner as in homerooms. Regardless of the physical
setting, observers attempted to position themselves to be unobtrusive
and to avoid revealing the identity of target students to the target
students themSelves or to other students.
Use of the optical scanner coding sheets%typically required
observers to mark only slashes in the appropriate circles while
observing because the 10-second interval did not provide enough time
for circles to be darkened sufficiently to be read accurately by the
optical scanner. As a result, observers darkened the slashed circles
after the actual observation was completed, either %during break
periods, in the evenings, or on the weekends. This procedure tended
to reduce errors in the coding of data.
Frequently, the coded observational data were supplemented with
an anecdotal recording. GeneraFly, anecdotal recordings were used to

9
provide a description of the classroom setting and anyth ng unusual
that may have occurred during observations. The obse vers were
provided with guidelines for anecdotal recordings (see App ndix C) to
help them determine when they were needed and.what they should cover.
Each target student was observed for six full da s by the
observers. The first two days of data were collected before the child
study team met to consider the referral. The next two day of data
were collected approximately one month after an IEP had bee written
for the student. The last two days of data were sollected
approximately two months after the IEP had been specifie . 'The
decision to collect two days of data at each point in the asSessment
process was based on stability analyses presented by Greenwood,
Delquadri, Stanley, Terry, and Hall (1981), in which they foOnd one
day of observation predicting 62% and 92% of the variance for adtivity
and student response, respectively. Because of variability in the
time taken to write IEPs for the observed students, the period within
which the six observations were made varied from three months to
nearly six months.
It was impossible to keep observers blind as to the type of
students being observed. Similarly, teachers were aware of the
identity of the students being observed since they were being observed
as a result of the referral. Observers were instructed to note any
behaviors that might indicate that the teacher's activities were being
altered as a result of.the observer's presence. No such changes were
detected for the subjects in the present study.
Reliability. Reliability checks were conducted to detect any

10
inconsistencies in coding among observers or between an observer and
the established code definitions. The reliability -checks were
conducted by another observer (designated the "reliability observer")
who joined the observer in the classroom and coded events on the
target student for approximately 14 minutes (4 pages of observation).
During this study, 16 reliability checks were conducted.
Two types of reliability were checked: (a) behavioral and (b)
sequential. Behavioral reliability was a measure of observer
agreement on a specific event being observed; behavioral reliabilities
were calculated for (a) teacher position, (b) teacher activity, and
(c) student response. The second type of reliability, sequential
reliability, was a measure of observer agreement on a sequence of
items; this measure was designed to document that observers were
coding in the sequence required by the observation system. According
to the CISSAR training manual, the desired levels of reliability were
90% for behavioral reliability and 85% for sequential reliability.
Table 2 is a summary of the reliabilities obtained.
-Insert Table 2 about here
To maintain adequate levels of reliability throughout the study,
meetings were held to discuss coding problems, reliability
disagreements, and so on. These were held on a weekly basis for the
first two weeks of the study, and then on a biweekly basis after that.
At the meetings, definitions were reviewed and any disagreements were
resolved.
7

Achievement testing. The Peabody Individual- Achievement Test
(PIAT; Dunn & Markwardt, 1970) was administered by LD personnel within
the school system to three of the students shortly after they were
referred. Additionally, end-of-the-year PIAT scores were obtained by
school personnel for two of these students.
Average Observed Times for LD and Non-LD Students
°In previous work (Thurlow, Graden et al., 1982), observations
were conducted on 17 LD and 17 non-LD students matched for sex and
class. The mean times obtained in that study are presented here as a
group-based framework within whieh to consider the 'data collected on
the four referred students.
No significant differences were found between LD and non-LD
students in time allocated to various activities. The activity
allocated the largest portion of a school day was reading (63.2 min),
followed by math (43.2 min), and language (27.9 min). Social studies
(17.7 min), science (11.3 min), spelling (10.4 min), and arts/crafts
(10.6 min) were the only other activities tp occur for more than 10
minutes per day on the average.
The only significant difference between groups in time allocated
to tasks was for other media (e.g., films, teaching games). LD
students received more instruction using other. media (46.0 min) than
non-LD students (31.5 min). For both groups, time allocated to other
media was second only to time allocated to readers (67.1 min).
Workbooks (38.8 min)4 worksheets (28.6 min), and paper and pencil
tasks 422.1 min) each occupied students for more than 20 minutes per
day.
18y

12
Although both groups spent the majority of their day in entire
group structures, LD students were allocated significantly more time
for individual structures (34.4 min) than non-LD students (3.0 min),
while non-LD students.\\Were allocated significantly more time for
entire group structures (166.4 min) than LD students (134.8 min).
LD students were allocated more time with the teacher beside them
(19.8 min) than were non-LD students (2.6 min). Time allocated to
other teacher locations did not differ for the two groups. Most time
was spent among students (74.0 min), followed by in front of the class
(43.0 min), .and at the teacher's desk (37.8 min).
The majority of the student's.day consisted of the teacher making
no response to the target student (109.2 min). About one hour,per. day
involved the teacher making teaching responses to the target student,'
(61.9 min). The only statistical difference between groups was in the
amount of approval received from the teacher (LD = 0.6 min; non-LD =
0.2 min).
Student responses showgd the greatest number of significant
differences between groups. Writing (LD = 22.4 Min; non-LD =.30.1
min), playing academic games (LD = 3.4 min; non-LD = 1.0 min), reading
aloud (LD = 3.7 min; non-LD = 0.7 min), talking academics (LD = 5.6
min; non-LD =2.0 min) answering academic questions (LD = 2.1 min;
non-LD = 0.7 min), and asking academic questions (LD = 1.1 min; non-LD
= 0.4 min) :all showed statistically significant differences between
the two groups. With the'exception of writing, these were all low
rate behaviors and the magnitude of the actual time. differences is
small. Both groups spent the greatest amount of time making passive

13
responses such as waiting and listening (75.2 min), followed by
writing (26.2 min), looking around (15.3 min), and reading silently
(10.6 min). All other student behaviors occurrted less °than 10 minkes
per day on the average for both ebups.
The data presented by Thurlow, Graden et al. (1982) provide a
standard against which to compare the data.from the four observed
students. One hypothesis that may be proposed is that the times
observed for students at the time of their referral to the child study
team would be similar to those of the non-LD students, and then would
become similar to those of the LD students after they began receiving
special education services.
Results
Although the goal was to obtain data on 10 referred students,
problems in obtaining subjects and completing all observations reduced
the number of subjects with usable data to four. Therefore, findings
are presented in a case-study format. This approach is advantageous
in that it allows a focus on individual differences. Highlights of
findings across cases also are provided.
Case 1
The first student observed was a third grade female, Jane (not
her real name), who was described by observers as pleasant looking and
somewhat sky. Jane consistently was seated in the back of the
classroom and occasionally taunted by the boys sitting around her.
According to anecdotal reporti, she was "wiggly" but attentive. She
appeared to work at assigned tasks, but with little accuracy. The
initial reason for her referral was parental concern about her lack of

14
achievement in reading. The observational data for Jane are presented
in Tables 3-8.
Insert. Tables 3-8 about here
Time I. During the two days of observation following referral
but prior to action by the child study team Jane's classroom
environment was different in many respects from that of average LD and
non-LD students. For Jane, the greatest portion of the school day
(see Table 3) was allocated to instruction in mathematics (56 min),
followed by language (33 min). No time was allocated to either
reading or Social studies during the two days of observation. The
average time allocated to reading for LD and non-LD students was over
one hour, and an average of 18 minutes was allocated to social
studies. Of the time Jane was observed, about 78% was allocated to
academic activities and,22% to non-academic activities; this is in
contrast to the 85%/I5% observed for both LD and non-LD students.
Jane spent most of her time working on Worksheets (37 min),
followed by readers (25 min),4listening to lecture (26 min), and other
media (26 min). This distribution of instructional tasks (see Table
4) represents.quite A bit more listening to lecture than averages for
LD and non-LD groups (4 min) and much less time allocated to the use
of readers than for LD and non-LD groups (67 min).
The class structure for Jane (see Table 5) included less time in
small group structures than the average for 4D and non-LD StudentS.
No time was allocated to individual teaching structures for Jane

15
during:the two days of observation. This is in sharp contrast to the
half hour (34 min) of individual instruction allocated for LD
students, but is similar to the small amount (3 min) allocated to
individual structures for non-LD students.
. Janes teacher was, in front of the class most of the day (75
min); this was almost twice the average time observed by Thurlow,
Graden et al. (1982). Time allocated to other teacher locations in
the room (see Table 6) was less than that observed in previous
studies. The teacher was beside Jane for almost 8 minutes; this is
below the 20 minutes that the teacher was beside an average LD student
but over twice as much time as observed for the average non-LD student
(3 min).
Jane received considerably less time of the teacher making no
response to her (53 min) than the average LD or non-LD student*(109
r,
min). The teacher was teaching one hour per day (see Table 7), about
the same as the nom. The 36 seconds of approval received by Jane was
similar to the amount received by LD students (36 sec), an amount
significantly above that received by non-LD students (12 sec).
However Jane also received almost 5 minutes of disapproval from her
teacher over the course of an average day, an amount much greater than
that received by either the LD s,ydents (1 min) or non-LD students (48
\
sec) observedlby Thurlow, Graden e al. (1982).
In gene6l, Jane!s. pattern of responding (see Table 8) was
similar to the average. Most time was spent engaged in passive
responses such as waiting ahd looking at the teacher (53 min),
followed by looking around (17 min). Jane spent m ch less time
16
writing (13 min) and reading silently (1 min) than the LD (writing =
22 min;" reading silently = 8 min) or non-LD students (writing = 30
min; reading silently = 3 min). Overall, Jane engaged in academic,
responses for 14.8% of the time she was observed; she was engaged in
task management responses for 59.9% ofiKis time, and in inappropriate
responses for 25.3% of this time. The task management percentage for
Jane corresponds to that observed for LD and non-LD students, but the
academic response percentage is below' the norm (26%) while the
inappropriate response percentage is above the norm (17%).
Time 2. One month following the child study team meeting at
which an IV was written for Jane and she was placed in Level LD'
services, some dramatic changes were observed in her program. Time
allocated to reading increased from zero to 76.minutes per day (see
Table 3). As a result, the perceniage of observed time allocated to
academic activities increased to 86%; a percentage similar to the norm
(85%).
Several changes occurred in the times allocated to various tasks
for Jane (see Table 4). Time spent listening to lectures decreased
from 26 to 2 minutes; writing tasks, including workbook, worksheet,
and paper and pencil, each increased by about 30 minutes per day.
Times allocated to various teaching structures also changed (see
Table 5). Both small group and, individual structures were used for
greater amounts of time following the team meeting, with individual
instruction increasing from no time to almost 92 minutes.
Teacher location changed as %1 ll (see Table 6). The teacher
spent less than half as much time in front of the class, and greatly

17
increasedilhe amount of time spent among the students in the
classroom. The amount of time Jane spent wit the teacher beside her
1increased from less than 10 minutes to almost 5 minutes.,
Teacher activities directed to 3ane changed also (see Table 7).
Time allocated to both no response from the teacher and teaching
increased. A notable drop occurred in the amount of other talk and
disapproval directed to Jane.
Despite the several changes that occurred in Jane's instructional--
environment, few student responses changed appreciably following IEP
writing (see Table 8). The amount of time Jane engaged in writing
increased by about 20 minutes and the amount of time Jane engaged in
passive responding increased by about 35 minutes. However, Jane
increased the overall percentage of time she engaged in academic,
.
responses ,from 15% at time 1 to 31% at time 2, and decreased
inappropriate responses from 25% at time 1 to 11% at time 2. The time
2 percentages are more in line with averages found for LD and non-LD
students.
Time 3. Jane continued in Level 3 LD services throughout the
year. The increase in time allocated to reading observed at time 2
was maintained two months following the writing of the IEP (see Table,
3). In addition, social studies increased from zero minutes at times
1 and 2 to 12 minutes at time 3. Time allocated to business
management and arts/crafts decreased to 1 minute per day. Overall,
94% of the observed time was allocated to academic activities.
Changes observed in time allocated to workbooks and listening to
lecture from time 1 to time 2 were maintained (see Table 4). However,

18
worksheet and paper and pencil tasks reverted to pre-IEP times. Use
of readers increased from time 2 to time 3 by almost 20 minutes.
Time allocated to small group structures decreased at time 3 to a
level below that observed prior to the 'child study team meeting (see
Table 5). Individual instruction time also decreased to about one
hour, still considerably above that observed at time 1.
Two months after the IEP was written (time 3), the teacher's
location in relation to Jane was largely the same-as that observed one
month earlier (see Table 6); with the exception that time spent among
students decreased from 79 to 59 minutes a day, still greater than the
time spent in this location prior to IEP writing (29 min). The amount
of time the teacher spent beside Jane remained about the same as at
time 2.
Changes also were noted in the teacher s activities (see Table
7). Decreased times were observed for the teacher making both no
response and teaching responses but both remained above pre-IEP
levels.
Jane's responding times were very stable from time 2 to time 3
(see Table 8). Little change was observed in the percentage of
observed time that Jane engaged in academic responses (30%); task
management responses decreased some (from 58% to 55%) while
inappropriate responses increased some (from 11% to 14%).
Achievement. Achievement data were obtained from Jane at time 1
and at the end of the school year (time between tests = 51/2 mos).
These data are presented in .Table 9. Jane's raw score increased on
all subtests except the .General Information subtest. In terms of

19
standard scores, however, increases occurred only for reading'
recognition and reading comprehension.
.inert Table 9 about here
Summary. For' 'Jane, the refer'ral-to-placement process was
accompanied by some changes in her aeademic environment. Most of
the4e changes served to bring her typical day, closer.to the average
times reported by Thurlow, Graden et al. (1982). Time allocated to
reading angi social studies increased after placement and was
maintained at the two-month follow-up observation. Use of readers and
workbooks increased while time spent listening to lectures decreased.
Individual instruction increased across the three observations; the
increase in small group instruction observed at one month following
IEP writing had disappeared at the two-month observation. Decreases
in the amount of time the teacher directed nonacademic talk and
disapproval toward Jane were noted following the writing of the IEP.
In light of these programmatic changes, some of which were very large
in magnitude, the observed stability in the actual- amounts of time
Jane engaged in variotis student resOonses is surprisfng. The student
responses that changed most were,writing and passive responses,.
both increased at times 2 and 3. Jane's classroom expprience appeared
to change as a function of the assessment-IEP process, with some
corresponding changes in her academie responding time. Further,
changes did occur in the percentage of observed time that Jane engaged
tn academic and inappropriate responses. Academic responses increased

20
at time 2 and were maintained at the higher leveT at time 3, while
inappropriate responses decreased at time 2 and increased only
slightly at time 3; task management responses remained relatively
constant.
Case 2
The second student observed was a first grade male, Greg (not his
real name). He was described in anecdotal reports as pleasant and on
task, and as needing more teacher approval than peers. The classroom
arrangement was raditional, with desks: in roWs at time. 1 and irL
clusters at time 2. No reason for referral was specified, tor Greg:
The observatiOnal data for Greg are presented ln Table$ 10-15.
Insert Tables 10-15 about here
Time 1. Prior to the child studyllem meeting, Greg's school day
was composed almost entirely of reading (111 min), math (25 min), and
handwriting (23 min). Only about 30 minutes of the observed day were
allocated to other activities (see Table 10). Science, language,
social studies, and spelling received no allocated time on the two
days of observation. This picture differs from the average.times
observed for LD and non-LD students. (However, LD and non-LD students
were third and fourth graders, while Greg was a first grader; this may
account for scae differences, noted.) Specifically, Greg was allocated
nearly twice as much time for reading as the average, but appaeently
at the expense of other activities that usually are allocated front 9
to 30 minutes of the day. Of the time Greg was observed, about 83% of
21
his day was allocated to academic activities and 17% to non-academic
activities; these percentages are similar, to those observed for both
L0 and non-LD students.
The tasks that occupied Greg for the greatest portion of the day
(see Table 11) were worksheets (51 min) and other media (52 min),
quite a bit more than the averages for LD or non-LD students
(worksheets = 29 min, other media = 39 min). Greg's instruCtion
involved use of a reader 20 minutes per day, ,considerably less than
the average time for LD (58 min) and non-LD (76 min) students.
Greg received more instruction in a small group structure (92
min) than the average (45 min). In fact, entire group and small group
structures were allocated equal times for Greg (see Table 12). , About
9 minutes were allocated to individual structures; this amount of time
was above that +allocated for non-LD students (3 min) b t considerably
below that for LD students (34 min).
The teacher's location in the classroom reflected the averages
(see Table 13), except that much less time was allocated to
instructing fram the teacher's desk (48 sec vs. 38 min). The 10
minutes that the teacher was beside Greg fell between that observed
for''LD (20 min) and non-LD students (3 min).
Jtie teacher's activities also 'were similar to the average (see
Table 14). Most time was spent teaching (79 min) followed by no
Tesporise to the target student (70 min). The amount of both approval,.
(2..Min) and: disapproval (2 Min),received by' .Greg were above those,
Observed for LD and non-tD students.
Greg's responseS at time 1 (see Table 15) Were close to the .
.o
22
averages for LD and non-LD students. The o 1.yexeption was for
silent reading, which was low at 1 minute compared with minu es for
LD students and 13 minutes for non-LD students. Overall, Greg engaged
in academic responses for 23.9% of the time he was observed, a
percentage stmilar to that of tD and non-LD students (26%). Task
management responses comprised 58.0% of Greg's responding time, agn
comparable to the norm (56%). Similarly, the percentage of time Greg
engaged in inappropriate responses (18.1%) was consistent with the
norm (17%).
Thus, despite considerable deviations from the norm in time
allocated to various class activities (due probably to his grade
level), Greg's school day was much like the average with respect to
task, structure, teacher location, teacher activity, and student
responding times.
Time 2. At one month following the placement of Greg in Title I
and speech/language services, time allocated to math increased from 25
to 42 minutes per day and language and social studies went from zero
to 10 minutes (see Table 10). The amount of time allocated to reading
remained at the same high level as at time 1.
Use of readers and other media increased considerably from time 1
to time 2 (see Table 11). Time allocated to workbooks decreased by
Over 10 minutes, and listen to lecture dropped from 10 minutes to no
time:
Class structures were relatively stable from time 1 to time 2
(see Table 12). Teacher location in the classroom changed little,
although the teacher did increase ttme spent among the students from
28

23
99 to 123 minutes (see Table 13). The number of minutes during which
the teacher was making no respOnse to Greg increased:from 69 .0 103
minutes (see Table 14), jeaching time increased also, from 79 to 93
minutes. Approval from the teacher decreased from 2.4 minutes to 54
seconds.
Greg's responding times remained relatively constant (see Table
15), e)ccept forthe passive response category, mhich almost doubled
(from 64 to 112 minutes). A decrease was noted in the amount of time
Greg engaged in non-academic talk. Overall, the percentage of'
observed time that Greg engaged in active acAdemic responses decreased
from -(23.9% to 14.8%; inappropriate responses decreased also, from
18.1% to 11.7%. On the other hand, the percentage of time that Greg
engaged in task management responses increased from 5p.o% to 73.4%.
In general, instructional changes from time 1 to time 2 Were
minor. Similarly, changes in Greg's responding times were few. Those
that 'did occur resulted in increased task management time and
decreased active academic responding time.
Time 3. Two months' after Greg's placement was implemented,
Greg s program included less time in handwriting (see Table.10), the
addition of 5 minutes of science per day, 'and the return to zero time
allocated to language. Overall the percentages of 'observed time
allocated to academic activities (80.2%) and non-academic activities
(19.8%) were nearly identical to.those observed at,time 2.
Time allocate'd to various tasks generally returned to time 1
levels ,(see Table 11). Both the use of readers and other media
decreased to near time 1 levels; time allocated to workbooks Increased

24
almost to the time 1 level, as did time allocated to fetch and put
away materials.
Changes in times allocated to various class structures (see Table
12) reflected an increase in small group time. Time allocated to
individual structures fell from 10 minutes to no time.
The teacher spent fewer minutes in front of the class (see Table
13) and at Greg's side at time 3 than at time 2. Time spent in the
°back of the class increased from 3 minutes to 24 minutes. The teacher
was teaching fewer minutes per day at this observation than at either
of the others (see Table 14), averaging less than one hour per day.
Again, with the exception of decreaies in the amount of time
Greg engaged in passive responding (see Table 15), and an increase in
non-academic talk, Greg's,responding times did not change appreciably.
Only a small change occurred in the percentage of time Greg engaged in
inappropriate responses; this change reflected am increase from 11.7%
at time 2 to 17.3% at time 3, which was very close to the time 1
percentage (18.1%). The increase :in inappropriate responding was
countered by a decrease in task management responses from time 2
(73.4%) to time 3 (69.6%) and a slight decrease in active academic
responding from time 2 (14.8%) to time 3 (13.0%).
AchieveMent.: Achievement data Were not obtained for Greg at both
time 1 and the end of the school year. Thus, changes in achievement'
could not be assessed.
Summary. Although some:minor changes in class structure were
, observed, the most pronounced characteristic of Greg's case Was the
relatively few observed changes, .even though Title I services and

speech/language .serviCes were initiated. His behavior was quite
stable throughout the time period considered, and those changes that
did occur usually were decreases in academic respOnses and increases
in either task managementoor inappropriate responses. Further, many
of the changes in times reflected the fact that Greg was observed for
a greater period of time at time 2 because of fewer breaks and/or
special classes (mdsic, physical education) and special assemblies.
Some minor differences were noted between Greg's program and the norm,
a finding that might be expected since Greg was in the first grade
while the LD and non-LD students were third and fourth graders.
Despite this, Greg's behavior at each point was quite consistent with
that displayed by the LD and non-LD students.
Case 3
Jim not his real name) was a third.grader who was described by
observers as well liked by.peers, pleasant, and a good worker under
the right conditions. Jim's homeroom was reported to be very
disorganized, with the teacher having little control. The cited
reasons for his referral were deficits in math and reading, especially
reading comprehension. The observational data for Jim are presented
in Tables 16-21.
Insert Tables 16-21 about here
Time 1. Prior-to the child study team meeting, Jim's school day
consisted of 61 minutes of readihg, 23 minutes of math, and 25 minutes
of spelling (see Table 16). Nearly 22 minutes per day were allocated

26
to business management, compared to an average of about 6 minutes for
LD and non-LD students (Thurlow, Graden et al, 1982). Handwriting,
science, and social studies received no time, and language was
allocated considerably less than the average (4 min vs. 27 min).
Overall, 70.4% of the observed day was allocated to academic
activities (compared to 85% for the norm), while 29.6% was allocated
to non-academicactivities (compared to 15% for the norm);
'Time allocated to various instructional tasks used with Jim also
differed from that for LD and non-LD students (see Table 17). More
time was allocated to worksheets (43 min vs. 28 min) and less to other
media (21 min vs. 38 min) than average. Jim also used readers much
less than students in previous studies (18 min vs 66 min).
Jim received most of his instruction in an entire group structure
(123 min), followed by small group (38 min), with no time spent in
individual instruction (see Table 18). This pattern is similar to
that for non-LD students, but differs from that for LD students who
received an average of 34 minutes per day in individual structures.
With the exception of the small amount of time tiie teacher was
among students (29 min vs 73 min), the teacher's location in the
classroom (see Table 19) was similar to averages for LD and non=LD
students, with most time spent in front of the class (56 min),
followed by at the teacher s desk (33 min). The time the teacher
spent beside Jim (2.2 min) was comparable to that observed for non-LD
students (2.6 min), but much Tess than that observed for LD students
(19.8 min).
Jim's teacher directed noh-academic talk toward him (see Table

27
20) for more minutes of the day than average (21 min vs 5 mil*: She
made no response to Jim for 58 minutes and taught for 49 minutes per
day, both less than average (109 minutes of no response and 61 minutes
of teaching toward LD and non-LD students). The teacher directed
disapproval toward Jim for over 4 minutes per day, a level much above
that observed for either LD (1.2 min) or non-LD students (48 sec).
Jim's responding times were similar in most respects to the
averages for LD and non-LD students (see Tabie 21). He read silently
somewhat less than the norm (1 min vs 10 min) and engaged in passive
responses for about one half hour less per day than the average (51
min vs 75 min). Overall, Jim engaged in academic responses for 25.8%
of the observed day, a level comparable, to the norm (26%). The 23.0%
level of inappropriate responding was above that observed for other
students (17%)-, while the 51.2% level of task management was below
that observed for other students (60%).
Time 2. One month following implementation of an IEP for Jim and
his placement in Level 3 LD services, time allocated to spelling was
reduced from 25 to 9 minutes (see Table 16); language instruction
increased from 4 to 27 minutes per day, and science (12 min) and
social studies (19.min) were allocated time during the days he was
observed. Academic activities made up 85.6% of the observed day (up
from 70..4%) -while.non-academic activities made up 14.4% (down from
29.6%).' These percentages are very close to those observed for LD,and,
non-LD students.
Changes also occurred in time allocated to.varioUs taSks (see.
Table 17)t Use of Teaders-:expanded- from 18 to 42 mtnutes per day.and

28
use of other media increased from 21 to 53 minutes, bringing tasks
used in his instructional program closer to the norm.
Individual instruction time was added to Jim s day at time 2 (9
min). The time allocated to other structures (see Table 18) remained
relatively constant. Teacher location (see Table 19) and teacher
activities (see Table 20) als& changed somewhat. The teacher spent
one hour more per day among the students (29 to 86 min), while
decreasing time spent at the teacher's desk (56 to 34 min). The
teacher spent less time in other talk (21 to 4 min) and more time
teaching. (49 to 60 min) and making no response (58 to 100 min).
Disapproval time dropped greatly (4.4 to 0.9'min).
Jim's responding times were basically stable from time 1 to ftme
2. The only category that changed more than 10 minutes per day,
passive responding, increased from 51 to 78 minutes. The percentages
of time in which Jim engaged in 'academic (22.4%), task management
(59.3%), and inappropriate responses (18.3%) also were relatively
unchanged.
Time 3. Two months following implementation of Jim's IEP and his
Level 3 LD placement, times allocated to various activities had
reverted to pre-IEP levels for all categories except.math, which was
allocated 16 minutes more per day (see Table 16) and business
management, which decreased from 21 to 7 minutes. Overall percentages
remained unchanged also, with academic activities allocated 86.3% of
the observed day and non-academic activities allocated 15.9%.
Use of readers went back down to the pre-IEP level (see Table 17)
and use of other media decreased from 53 to 36 minutes. Worksheet

use, which was stable across
29
the first two observations, decreased
from 43 to 24 minutes daily, while workbooks were used more (20 to 44
min).
Changes occurred in time allocated to various teaching structures
(see Table 18). Instruction within the entire group decreased (156.to
106 min) and Jim received more time in'an individual structure (8 to
29 min). .
The teacher spent considerably less time in front of the class at
time 3 (see Table 19). Time spent among students Aecreased from time
2 (86 min) to time 3 (67 min), but was still much greater than the
pre-IEP level (30 min). Time spent beside Jim increased even further,
from 5 minutes at time 2 to 10 minutes at time 3.
Teacher aCtivities were stable except that time spent teaching
decreased to a level below that of time 1 (see Table 20). Approval
from the teacher increased somewhat, but was still less than 1 minute
per day. Further, disappeoval increased from time 2 (54 sec) to time
3 (1.5-min), but was still less than half the disapproval, observed at
time 1 (4.4 min).
Changes in Jim's responding times generally reflected a return to
pre-IEP levels (see Table 21). Although decreases were observed ih
most active academic responding times, silent reading, academic talk,
and asking academic questions did increase-somewhat. Similarly,
most inappropriate responses increased, non-academic talk and looking
around decreased. The largest change that occurred in Jim's
responding times was in passive responding, which dropped. Overall,
at time 3, 25.0% of Jim's responses were academic, 50.2% were task

30
management, and 24.8% were inappr priate. These per entages are
close to those observed at time 1
Achievement. Achievement ata were obtained fr m Jim at tAme 1
and at the end of the school ye r (tim between tests = 5 mos) These
data are presented in Table 2. Ji s raw scor increased on all
subtests. These increases were reflectled in increased standard scores
for all except the General Information isubtest.
Insert Table 22 about here
Summary. For Jim the referral-to placement proc ss seems to have
resulted in several short-term chang n the daily p ogram. However,
most of these changes were absent tw piths followin implementation
of the IEP; his responding.times as coded by CISSAR were basically
unaffected by the program change . He began and remained within a few
minutes of average for almost all categories of student respondi,ng.
Further, the percentage of time he engaged in ac demic responses
decreased at time 2-and'did pot quite return to the time I level two
months after the IEP had be/en written. Howeveracro$ the three. sets
of observations, ttMe spent reading silently showed a 'iteady increate,
a change that may relOte to some of the observed increaseS in
achievement.
Case 4
Bob (not his real'name) was a-seCond grade student iva school*
that wat structurally rore open th n the others in which students were
observed. Re was d scribed by bservers as needjng.somewhat more

31
attention than other students, and as having the social skills to get
such attention without disrupttng class. The cited reason for
referral was that Bob was low academically in math and reading. The
teacher indicated that she did not feel the student could learn in the
reading curriculum used by the school. The observational data for Bob
are presented in Tabfes 23-28.
Insert Tables 23-28 about here
Time 1. Prior to the child study meeting, Bob's day was
dominated by reading (113 min), which was allocated almost twice as
much time as the average for LD and non-LD students (63 min). (Agen,
observed LD and non-LD students were third and fourth graders while
Bob was a second grader; this difference in grades may account for
some noted differences). The activity allocated the next greatest
amount of time' (see Table 23) was social studies (17 min). Math
occupied 10 minutes, considerably lower than the norm (42 min), and
language, which averaged 26 minutes a day for LD and non-LD students,
was not allocated any time during the time 1 observations.
Instructional tasks also were distributed somewhat differently
than the norm for Bob (see Table 24). The task used for the greatest
portion of the day was worksheets (54 min). This task occupied twice
as much time as the Average for LD and non-LD students. Other media
followed at a level comparable to the norm. Readers, workbooks, and
paper and pencil tasks were used less often than average (readers: 22
min vs. 66 min; workbooks: 6 min vs 27 Min; paper and pencil: 5 min

32
vs 22 min).
Bob's class structure (see Table 25) included more small group
and less entire group time than obserVed for LD and nonA.D students.
In fact, more of the day was spent in a.small group str.ucture (98 min):ea
than in an entire group structure (82 min).
The teacher's location in the classroom (see Table 26) mes very
similar to the norm. !Most time was spent among the students (99 min),
followed by in front of the class (49 min). The teacher was beside
Bob for 3.8 minutes .per day, a level comparable to that fo non-LD
students (2.6 min).
Teacher.activities (see Table 27) also were'similar t previously
observed averages. The teacher made no direct response to TOb for 75
minutes of the day and made specific teaching responses for 71
minutes. Both approval and disapproval from the teather occurred
relatively infrequently.
Times for all categories of student response (see Ta le 28) mere
within 10 minutes of LD and non-LD averages, except writing, which was
low (12 min vs 26 min), and passive responding, which was also low (58
min vs 75 min). Despite these two deviations in actual times, the
22.6% academic responses, 61.4% task management responses and 16.0%
inappropriate responses were quite similar to the normative
percentages.
Time 2. One month following implementation of an IEP for Bob and
his placement in Level 3 LD services, several changes tn daily
activity had occurred (see Table 23). Oeading time decreased
drastically froM 113 to 24 minutes per'day, and spelling, which had

received 13 mindtes at:time '1, was now allocated no time. Math
instruction increased frfr 10 to 25 minutes per day and language ment
from,zero to 18 minutesi Other increased ttmes included free time (0
to 22 min), business maniOment (1 to 14 min), and transition (3 to 17
min).
everal changes also occurred in times allocated to various tasks
(see Table 24). Use of readers and workbooks dropped even lower
relative to norms (readers: 22 to 7 min; workbooks: 6 to 0 min),
while other media and paper and pencil tasks occupied more time (other
media: 43 to 64 min; paper and pencil: 5 to 16 min). Use of
worksheets dropped below other media as the predominant task.
At time 2 individual instruction increased for Bob (see Table
25)., However, about 70 minutes of the day that had been spent in
small group structures were now spent in an'entire group structure
(small group: 98 to 29 min; entire group: 82 to 138 min)..
Teacher location in the classroom remained basically unchanged
(see Table 26). Teacher activities (see Table 27) included more
minutes of no response to Bob than before (78 to 96 min) and less time
teaching (71 to 37 min). Time spent in other talk, approval and
disapproval increased as well.
Bob's responding times were very stable, with few categories
changing by more than 5 minutes (see Table 28); Writing was down by
about 5 minutes (12 to 7 min), reading silently decreased to almost
zero (6 to 0.6 min), talk academic occurred less frequently (7 to 1
min) .and:patSive.reSpOnding increased-(58 to 65 min). .The magnitude-
of these changes Was small. In terms of percentage's however, -task_.

34
management responses increased from 61.4% to 71.4%, while active
academic responding decreased from 22.6% to 8:8%.
Time 3. Two months after his placement in Level 3 LD services
and the writing of the IEP, time allocated to reading for Bob
increased by almost one hour per day, still below pre-IEP levels (see
Table 23), but above the average for LD and non-LD students. Language
time reverted to zeki, and social studtes and free time'disappeared as
well. Overall, aCademic activities were allocated 87.6% of° the
observed day, a level very close to'the average observed for LD and
.non-LD students.
Ase of readers decreased even more, to 4 minutes, and paper and
pencil tasks returned to near time 1 levels (see.Table 24). Use of
otherjredia-remained highest, even though worksheets regained some
daily time. During this observation, tone hour lees per day was spent
in the entire group (see Table 25). Time allocated to individual
instruction increased by over 30 minutes to 43 minutes, an amount
above tlyat,observed for LD students observed previously.
Teacher location changed also (see Table 26)-. Time Spent in
front and among students decreased (in front: 25 ,to 8 min, among
students: 105 to 57 min), while time spent at desk and out of the
room increased (at desk: 6.to 30 min, out: 0 to 15 min). Time spent
beside Bob continued to increase to 9.4 minutes at time 3, but was
still below the average observed for the LD students (19.8 min).
Teacher activity remained quite stable (see Table 27), with a
small decrease in no response (96 to 85 min).- Approval time decreased
from 1 .3 minutes to 18 seconds; disapproval time decreased also (1.4

35
bin to 54 sec).
All but two academic responses (academic games and academic talk)1
increased from time 2 to time 3. Further, all -task management and
inappropriate responses decreased from time 2 to time 3. However;
Bob's responding times changed by less than 5 minutes from time 1 to
time 3,in every category except talk academic and look for materials
(see Table 28). Bob engaged.in active academic responses for 21.0% of
the time he was observed, up from the 8.8% at time 2, but still below
the 22.6% at time 1. Task management reiponses (64.9%) fell from
71.4% at time 2 to a level just above that at time 1 (61.4%), and
inappropriate responses at time 3 (14.1%) fell from 19.9% to a level
below that at time 1 (16.0%).
Achievement. Achievement data were not obtained for Bob at both
time 1 and at the end of the school year. Thus, changes fri
achievement could not be assessed.
Summary. The referral-to-placement process for.Bob resulted in
several short-term changes in his academic program, most of.which
disappeared by the time observations were made two months following
the development of the 1EP. His responses remained stable across
time, with the small changes that had appeared,at time 2 reverting te47.4
pre-IER levels by time 3. Some of the stable differences between
Bob's school day and previous norms may be consequences of the open
school format in which he was placed.'
Highlights of Findings Across Cases
Examination of the observed times for the four referred students
on those variables for which significant differences were found

36
between LD and non-LD students in the same school district reveals the
inconsistent effects of the referral-to-placement proCess, Figure 1
is a °graphic representation of the times allocated to individual
structures for the four referred students. The amount of time:
allocated to individual structures increased dramatically'from time 1
to time 2 for Jane and moderately for Jim and Bob, but almost not at
all for Greg. Two students were allocated less-individual structure
time at time 3 compared to time 2, while two other Itudents were
allocated more time. For three of the four students, time allocated
to individual structures two months after the IEP,had been written was
similar to that of previously observed LD students, bUt for one
student individual structure time was below that observed for non-LD
students.
Insert Figure 1 about here
Figure 2 is a display of times allocated to _entire group
structures. The lines depicting changes in allocated time were fairly,
parallel for three of the students. In contrast; the tiMe allocated
to entire group structures for Jane first decreased bdt then increased
again. Few of the points in the figure reflected the average times
observed for either LD or non-LD students.
Insert Figure 2.about here
Times allocated to other media tasks are presented in Figure 3.
37
Again, the variability among students is present even though the
trends in time changes are similar. .There was no,relationship among
the .times allocated to-other: Media tasks at yariods points in the
refeftal process and the average times ailoCated to other nedia tasks' -
fon LD andnOn-LD students.
Insert Figure 3 about here
Similar examples of variability among students and inconsistent
changes across the referral-to-placement process were observed for the
other variables on which LD and non-LD students were found to differ
significantly. An example of the variability and inconsistency found
for student responses is presented in Figure 4. For .the active
academic response of writing, all students except Jim started out at
levels lower thah those obser:ved for both LO and non-LO students.
Only one student, Jane, approached those levels by two months'after
the IEP had been written. Across time, two students showed increases
in the amount of time engaged in writing and two students showed
decreases.
Insert FigUre 4 about here
Another variable of interest is the time allocated to reading.
Almost exclusively, the reasons the students were referred were
related to reading problems. Figure 5 is a display of times allocated
to reading activities. The extreme variability in allocated times is'
38
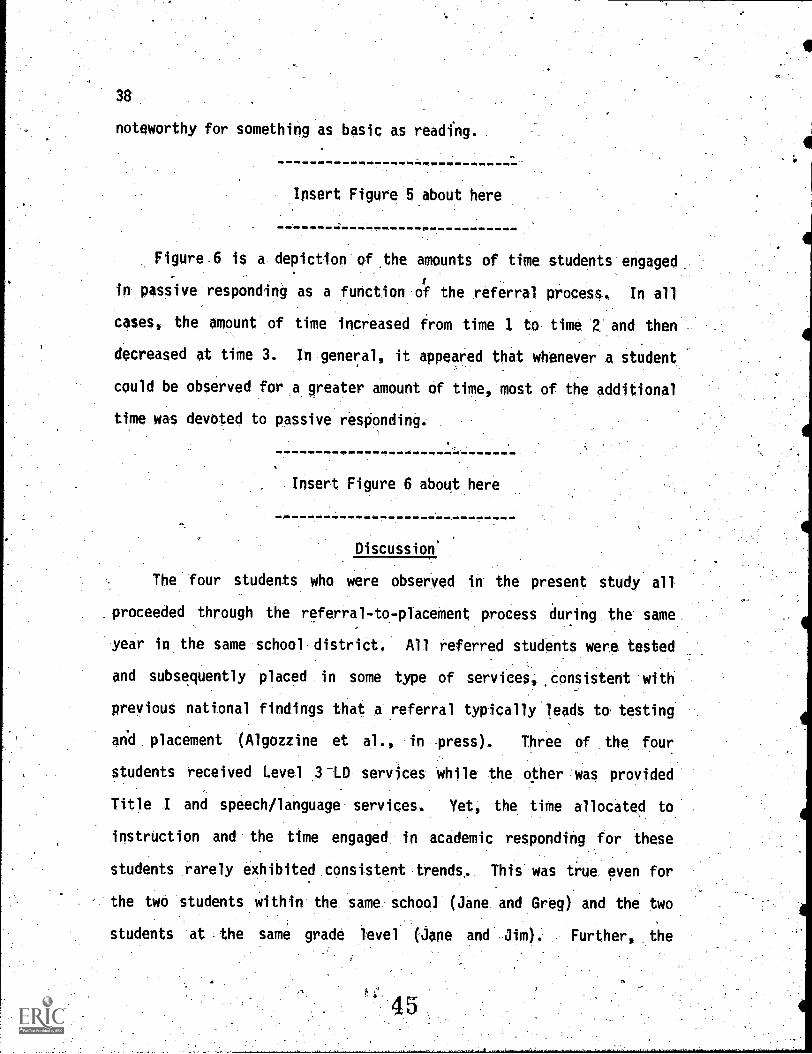
noteworthy for something as basic as readfng.
Insert Figure5 about here
Figure 6 is a depiction of ,the amounts of time students engaged.
in Passive responding as a function of the referral process. In all
cases, the amount of time increased from time I to time 2 and then
decreased at time 3. In general, it appeared that whenever a student
could be observed for a greater amount of time, most of the additional
time was devoted to passive resOonding.
Insert Figure 6 about here
Discussion'
The four students who were observed in the present study all
proceeded through the referral-to-placement process during the same
year in the same school district. All referred students were tested
and subsequently placed in some type of services, °consistent with
previous national findings that a referral typically leads to testing
and placement (Algozzine et al., in press). Three of the four
students received Level 3-LD services while the other was provided
Title I and speech/language services. Yet, the time allocated to
instruction and the time engaged in academic responding for these
students rarely exhibited consistent trends. This was true even for
the two students within the same school (Jane and Greg) and the two
students at the same grade level (Jane and Jim). Further, the

39
hypothesis that the times observed for students at the time of their
referral would be similar to those of non-LD students observed
previously and then would become similar to those.cf LD students as
they began receiving special education services was not supported.
An examination of the figures depicting changes across the
students reveals that despite the observed individual differences,
some limited generalizations can be made. First, in many instances,
change that-was observed from the period prior to the child team study
meeting (time 1) to one month following the writing of the IEP (time
2) often disappeared by the time of observation 'at two months
following writing of the IEP (time 3). This trend can be seen in the
triangular shape of many of the graphs.
Second, in most cases, the lines defining change for the observed
- students,intersected with those defining averages foi. LD and -non-LD
students. This suggests that the school day for these four students
was not greatly different from group norms. In those cases where
averages and observed times did not intersect, the difference was
between averages for non-LD students and the observed students (no
response by teacher, readers silent reading, entire group structure,
teacher at desk), indicating that this sample was more similar to a
group of LD students than to non-LD students. This is not an
unexpected finding given that three of the four students received LD
,placements.
Third, while change was observed in several aspects of the
students' classroom experience, these changes 'generallY were not
reflected in changes in the .studentS' responding times. Although .the.

referral-to-placement process may serve to alter some aspects of the
daily, routine, things seem to resettle with time into patterns
remarkably similar to those observed prior to intervention. Perhaps
of greatest importance is the finding that, for most students, those
changes that are made are not effective in bringing about persistent
changes in student responding, including active academic engaged time.
The study Presented here is limited by the sample size and the
absence of any assessment of quality of time. For example, no
assessment Was made of the appropriateness or difficulty level of work
completed by the student. However, we can propose on the basis of our
evidence that current practice in the referral-to-placement procedure
does not appear to effectively change engaged time for some students,
despite changes observed in classroom instructional ecology. Future
work with larger samples should address methods of effecting change in
engaged time for both regular class and special class students. Since
it has been demonstrated that academic engaged time is related to
achievement (Greenwood, et al., 1981; Hall et al., 1982) and can be
manipulated by changes made in classroom structure, and. procedure
(8ergan & Schnaps, undated), it is worthy of consideration in the
assessment and intervention planning for LD students.
Finally, although this study is limited by the small sample size,
the lack of any persistent, positive increase in student academic
engaged time as a function of special placement raises the question of
what benefits, if any, students accrue from special services
placement. Current practices, which lead to nearly automatic testing
ana placement when a student is referred, may need to be re-examined

41
in. light of these preliminary, findings which- suggest that special
services do not necessarily lead to positive increases in academic
responding time, a variable that is highly related to achlevement. A
More useful educational directionJhan current referral-to-placement
practices would be to focus oh a referral-to-intervention paradig6,-
with intervention efforts aimed at methods of increasing student
academic responding time both in regular and special education
classrooms. Such a focus on increasing time spent engaged in learning
is seen as a positive direction in both research and practice, as time
spent learning is a variable that can be altered by teachers (Bloom,
1980), is a resource available to all students, relates positively to
achievement (Borg, 1980) and can be a focus of intervention programs
(Bergan & Schnaps, in press; Muir, 1980; Noli, 1980).

42
References
Algozzine, B., Christenson, S., & Ysseldyke, J. E. Probabilitiesassociated with the referral-to placement.,process. TeacherEducation and Special Education, in press.
Berliner, D. Using research on teaching for the tmprovement ofclassroom practice. .Theory into Practice, 1980, 19, 302-308.
Bergan, J. R., & Schnaps, A. A model for instructional consultation.In J. L. Alpert & J. Meyers (Eds.), Training in consultation.Springfield, IL: Charles Thomas, in press.
BlOom, B. The new direction in educational research: Alterablevariables. Phi Delta Kappan, 1980, 61, 382-385.
Borg, W. Time and school learning. In C. Denham & A. Lieberman(Eds.), Time to learn. Washington, D. C.: National Instituteof Education, 1980.
Dunn, L.'M., & Markwardt, F. C. Peabody individual achievementtest. Circle Pines, MN: American Guidance Service, 1976.
Good, T., & Brophy, J. Teacher-student relations: Causes andconsequences. New York:. Holt & Rinehart, 1974.
o
Graden, J., Thurlow, M. L., & Ysseldyke, J. E. Instructional ecologyand academic responding.time for students at three levels of .
teather-perceived behavioral competence (Research Report No. 73).Minneapolis: University of Minnesota, Institute for Researchon Learning Disabilities, 1982.
Graden, J. L., Thurlow, Ysseldyke, J. E., & Algozzine B.Instructional ecology and academic responding time for studentsin different reading groups (Research Report No, 79).Minneapolis: University of Minnesota, Institute for Researchon Learning Diabilities, 1982.
Greener, J: W., Thurlow, M. L., Graden, J. L., & Ysseldyke, J. E.The educational environment and students' responding times as,a function of students' teacher-perceived academic competence(Research Report No. 86). Minneapolis: University ofMinnesota, Institute for Research on Learning Disabilities, 1982.
Greenwood, C. R.,,Delquadri, J., & Hall, R. Mr. Code for instructionalstructure and student academic response: CISSAR. Kansas City,KS: Juniper Gardens Children's Project, Bureau of ChildResearch, University of Kansas, 1978.
Greenwood, C., Delquadri, J.* Stanley, S., Terry, B., k Hall, R.Process-product study of relationships among instructionalecology, student response, and academic athieyement. Unpublishedmanuscript, Juniper Gardens Children's Project, 1981.

Hall, R. V., Delquadri, J. Greenwood, C. R., & Thurston, L.The importance of opportunity to respond in children's academicsuccess. In E. B. Edgar, N.'G. Haring,' J. R. Jenkins, &C. G. Pions (Eds.), Mentally handicapped children: Education
and training. Baltimore: University Park Press, 1982.
Leonard, J. 180 day barrier: Issues and concerns. ExceptionalChildren, 1981, 47, 246-253.
Muir, R. A teacher implements instructional changes using the BTESframework. In C. Denham & A. Lieberman (Eds.), Time to learn.Washington, D.C.: National Institute of Education, 1980.
Noli, P. A principal implements BTES. In C. Denham & A. Lieberman(Eds.), Time to learn. Washington, D.C.: National Instituteof Education, 1980.
Stallings, J. Allocafed academic time revisited, or beyond timeon task. Educational Researcher; 1980, 9,.11-16.
4
Stanley, S. O., & Greenwood, C. R. CISSAR: Code for instructionalstructure and student academic response: Observer's manual.Kansas City, KS: Juniper Gardens Children's Project, Bureauof Child Research, University of Kansas, 1980.
Thurlow, M. L., Graden, J., Greener, J. 1449 &,Ysieldyke, J. E.Academic responding time for LD and nOn-LD students (Research'Report No. 72). Minneapolis: University of Minnesota,Institute for Research on Learning Disabilities, 1982.
Thurlow, M. L., Ysseldyke, J. E., & Gradeh,'J. L. LD students' activeacademic responding in regular and resource-classrooms (ResearchReport No. 90). -Minneapolis: University of Minnesota,Institutefor Research on Learning Oisabilities, 1982.
Thurlow, M. L., Ytseldyke, J. E., Graden, J., Greener, J. W..81,Mecklenburg, C. Academic responding time for LD students,receiving different levels of specjal,education services(Research Report No. 78). Minneapolis: liniversity of Minnesota,
Institute for Research on Learning Disabilities, 1982.
to,
44
The.observational research reported here wAs partof-an extensive
project that could nothavetheen compl ed without the cooperation and
help of numerous individuals, oremost among these were the .
administrators, teachers, and stude ts in the school district in which
the research was conducted. Equally important to the successful
completion of the research were the observers; listed alphabeticallY,
,they were:. Barbara Flykt, Eileen Mevissen, Donna, Miller, Rose Marie
Plant, Cheryl Randklev, //Judith Rygwall, Yvonne Shafranski, Wendy
Studer, and Geraldine Webster In addition, the assistance of Sandra
Christenson during cthierver training and Jean Greener for coordination
of observations is gratefully,acknowledged. The special assistance of
Charles Greenwood and Sandra Stanley, University of Kansas, in the4..
implementation of their CISSAR observational system was appreciated
greatly, as was tF data analysis expertise provided by Matthew McGue
and Jing Jen Wan Also essential to the completion of the project
were the contri utions of psychometric assistants Barbara Anderson,
Lisa Boyum, Ye ta Levine, and Cathy Walters. Further, the excellent
secretarial s rvices provided by Audrey Thurlow and Marilyn Hyatt made
the entire research Process a success.
5

Tabl e .1
C/I/sSAR Event Areas. and SOeci ffc Events Codeda
Event, Area
_Activity - typ of instrt.ction beingprovicied/esablished by teacher
Task - curriculum task or verbal,tructiOn mode in which student
s expected to engage
Teachi ng Struc:ure - physical arrange-ment of stucent in class
Teacher Position - location of teacher
Teacher Aztivity - -response of teachertc,target szt,dent
Student Response - behavior in which.student is engaged
SpeCific,Events Coded
R - Reading Li - Math S -
T. - Language SE - ScienZetic .; Arts/crafts Ft - Free
Management Tn - Jransition
Rr
Om
Spelling H - HandwritingSociaT Studies
Ttme Bm - Class Business/
Readers lib -,Vorkbooks Ws - Worksheets- Paper and. Pencil Ll Litiin to Teacher Lecture- Other Media Tsd -"Teacher-Student Discussion- Fetch/Put Away
11.9. - Entire group Si- Small group .1- IndiVidUal
IF - In Front of Class AD - At Desk AS - Among Students0 - Out of Room S - Side B - Back
NR - No Response T - Teaching OT - Other TalkA - Approval D - iTisapproval
W - Writing G - Playing AcademicAame RA - Reading AloudTqS - Silent Reading 4 TA - Talking About Academics
- Answers Academic Question ASK Asks AcademicQuestion AT - Passive Response WI - Raising Hand
1-1k1 - Looking for Materials M - Moves to')New Academic Station
PA - Play Appropriate DI - Iiisruptioiit' PI - Play Inappro-
priate IT - Inappropriete Task TNA filling About Non-academies IL - Inappropriate Locale LA - Look AroundSST - Self-Stimulation
Based on Stan:ay & Greenwood's (1930) CISSAR: Code for instructional structure and student academic
response: Observer's manLial . Within the Student Response Event Area, themAT event, which was designatedas "Attending" by Stanley and GreenWood, was renamed as "Passive Response" in the present investigationto avoid-inappropriate connotations of the responses included within that event.'
n

Table 2.7.
Summary of Reliabilitfes 'CalCUlated During the.Stud?
Rel la Wity Mean Range
Behavioral
,Teacher tOcatiOn 90,3 58-100
Teacher' Behavior 92.8 82-100
Student Response 87.0 :65,100
Sequential 91.4 74,99
aAl3 reliabilities are expressed as percentages.

47
Tabl e 31
Time Allocated to Attivities for Jane at Three OointS in
the Referral-to-PI aceilient j)rocessa
Activity Time 1 Time 2
Academic 119.9 201.0
Reading.
0.0 75.9.
Math 56.0 56.0
Spelling 16.5 9.5Handwriting 6.0 18.2
Language 33.3 32.6
Science 8.1 8.8
Social Studies 0.0 0.0
Non-Academic 33.4 32.0
Arts/Crafts 13.0 18.6
Free Time 1.1 . 0.7
Business Management 10.5, 4,6
Transition 8.8 , 8.1
Time 3
186.7
67.6
43.8
7-7
18.2
37.8
0.0
11.6
12.7
1.1
0.0
1.8
,9.8
dEntries are the average number of minutes for one day, based on .
two days of observation.

48
Table 4
Time Allocated to Tasks for Jane at Three Points in
athe Referral-to-Placement Process
Task Time 1 Tim6 2 Time 3
Readers - 25.2 29.8 47.3
Workbooks 15.8 48.0 58.8
Worksheets 36.8 60.2 33.3
Paper & Pencil 5.3 36.1 6.0
Listen to Lecture 26.3 2.5 0.0
Other Media 26.3 37.5 26.3
Teacher-Student Discussion _ 6.3 11.6 16.5
Fetch & Put Away 11..2 13.3 11.2
aEntries are the average number of minutes for one day, basedon twodays of obs rvation.

Table 5
Time Allocated to Teaching Structures for Jane at Three
Points in the Referral-fa-Placement Processa
49 .
Structure Time 1 Time 2 Time 3
Eiltire Group 147.0 121.8 131.3
SmaT1 Group 6.0 24.5 4.2
Individual 0.0 91.7 64.1
aEntries are the average number of minutes for one day,days'ofobservafiOn.,
gr-
.?
4Sed,on two
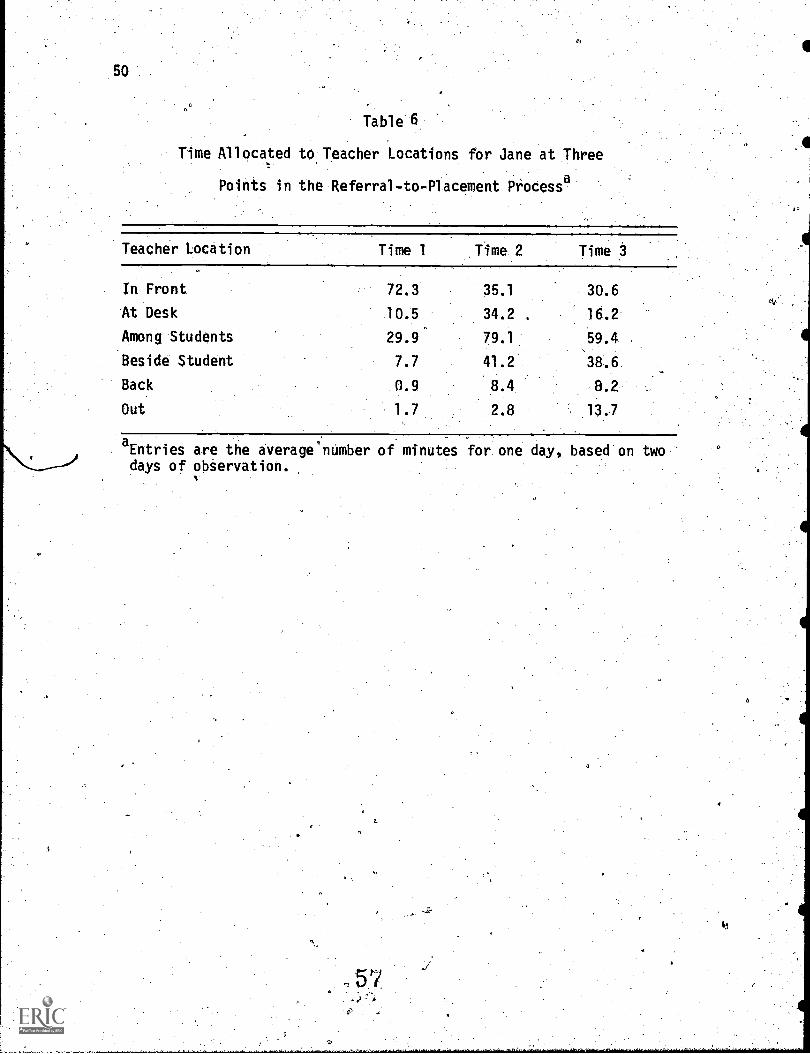
50
Table 6
Time Allocated to. Teacher Locations for Jane at Three
Points in the Referral-to-Placement Processa
Teacher Location Time 1 .Time 2 Time
In Front 72.3 35.1 30.6
At Desk 10.5 34.2 . 16.2
Among Students 29.9 79.1 59.4
'Beside Student 7.7 41.2 38.6
Back 0.9 8,4 8.2
Out 1.7 2.8 13.7
aEntries are the averagelnumber of minutes for one day, based on twodays of observation.

Table 7
Time Allocated to Teacher. Activities for,Jane at Three.
Points in the Referral to-Placement Processa
Teacher Activity Time 1 Time 2 Time 3
No Response 53.1 103.9 91.2
Teaching 60.3 93.7 71.4
Other Talk 7.4 1.2 2.7
Approval 0.6 0.4 0-3
Disapproval 4.6 1.4 1.0
aEntries are the average number of minutes for one day, based on two
days of observation.

Table 8
Time Jane Engaged in Various Responses at Three
Points in the Réferral-to..Placement Processa
Student Relponse Time 1 Time 2 Time 3
AcadeMic 18.6 61.1 50.2
Writing 13.2 32.5 27.4
Acad Game 0.5 7.5 3.4
°Read Aloud D.3 3.9 3.2
Read Silently 1.1 3.9 7.7
Talk Acad 1.5 4.6 5.4
Ask Acad Q 1.4 , 6.4 2.7
Ans Acad Q 0.6 '2.3 0.4
Task Management k 75.5 114.0 91.6
Passive Response 53.8 87.5 73.6
Raise Hand 3.8 1.8 1.5
Look for Mats 8.1 6.2 8.4
Move 3.6 3.8 3.9
Play. Appr 6.2 14.7 4.2
Inappropriate 31.9 21.3 23.8
Disruption 0,4 0.0 0.0
Play Innapr 8.4 7.6 3.5
Innapr Task 3.9 2.8 0.0
Talk Non-Acad 1.2 2:7 1.8
Inappr Locale o.a 0.0 0.0
Look Around 17.2 8.0 18.4
Self-Stimulation 0.0 0.2 0.1
aEntries are the average number of minutes for one days based on twodays of observation.

53.
'Tabl e 9
PIAT Data' for, Jane
Subtest Raw. Score Standard Score
Time 1 Time 2 Time 1 Time 2
Mathematics 30 31 97 91
Read i ng Recognition 29 36 98 100
Readi ng Comprehension 22 31 88 95
Spel 1 i ng 28 30 95 91
General I nformati on 26 18 104 89
Total 135 146 96 92
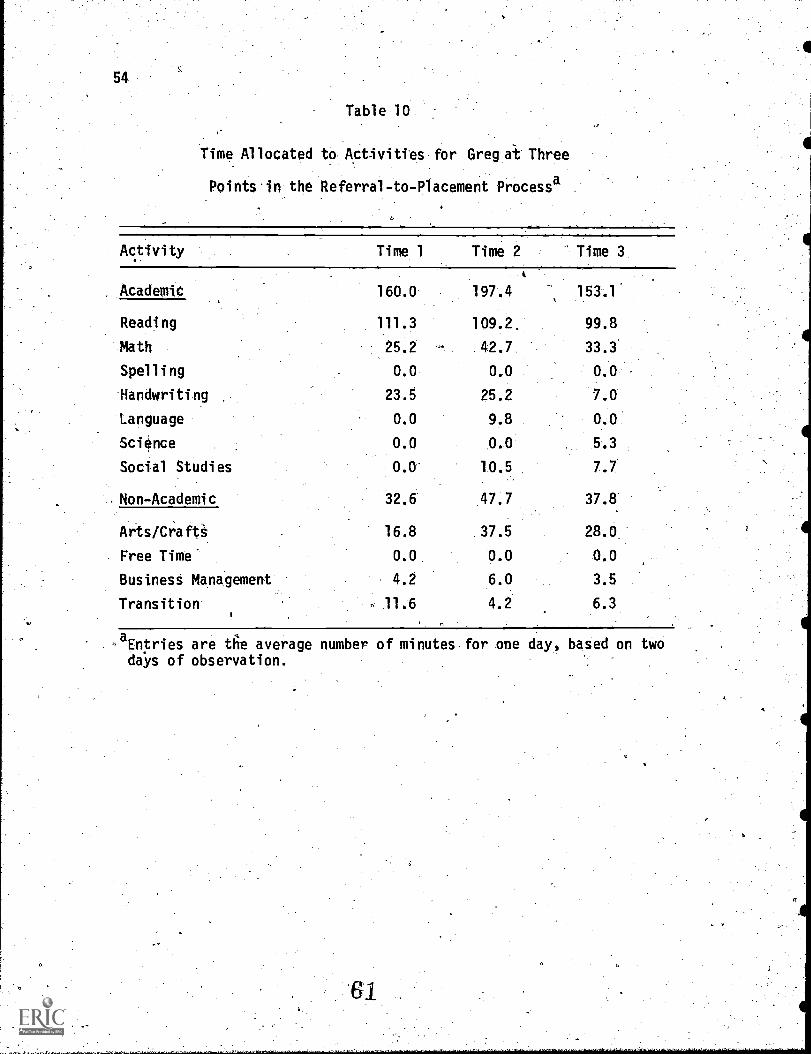
54.
Table 10.
Time Allocated to Activities for Greg it Three
Points in the Referral-to-Placement Processa
Activity Time 1 Time 2 Time 3
t
Academic 160.0 197.4 153.1
Reading 111.3 109.2, 99.8
Math 25.2 42.7 33.3
Spelling 0.0 0.0 0.0
Handwriting 23.5 25.2 7.0
Language 0.0 9.8 0.0
SciOnce 0.0 0.0 5.3
Social Studies 0.0 10.5 7.7
,Non-Academic 32.6 47.7 37.8
Arts/Crafts 16.8 37.5 28.0
Free Time 0.0 0.0 0.0
Business Management 4.2 6.0 3.5
Transition . 11.6 4.2 6.3
-aEntries are de average number of minutes for one day, based on twodaYs of observation.

55
.Table 11
Time Allocated to Tasks for Greg af Three
Points, in the Referral-to-Placement Processa
Task Time 1 'Time 2 Time 3
Readers 20.3 61.3 33.3
Workbooks 29.1 16.8 25.2
Worksheets 51.5 49.7
Paper & Pencil 11.6 16.8 15.1
Listen to Lecture 10.5 0.0 4.2
Other Media 52.5 84.7 42.7
Teacher-Student Discussion 3.5 8.8 6.0
Fetch & Put Away 14.0 6.3 13.0
aEntries are the average number of minutes for one day, based on twodays of observation.
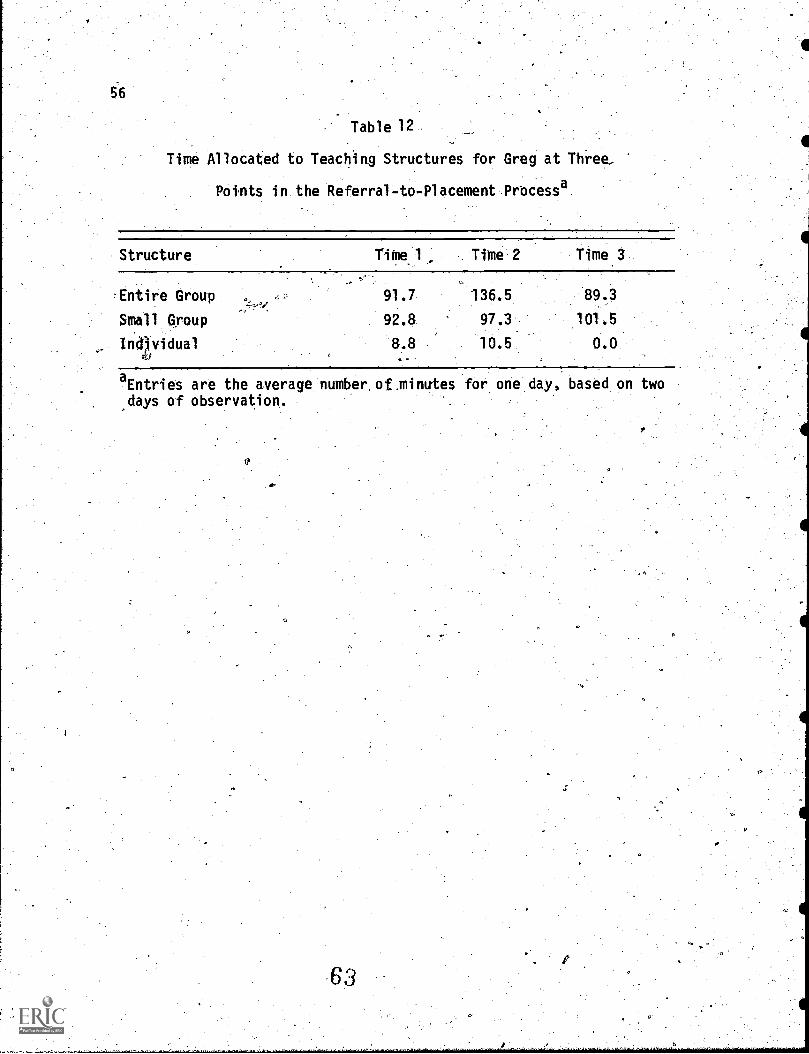
Table 12
Time Allocated to Teaching Structures for Greg at Three,
Potnts in the Referral-to-Placement Process°
Structure Time 1 Time 2 Time 3
'Entire Group
Small PYoup
InOvidual
91.7
92.8
8.8
136.5
10.5
89.8
101.5
0.0
aEntries are the average number of.minutes for one day, based on twodays of observation.

Tablt 13
Time Allocated to Teacher Locations for Greg at Three
jloints in the Referral-tO-Placement.Procest
Teacher Location.
-Time 1 Timt 2
In Front 42.0 53.2
At Deska
0.8 7.8
Among Students 99.4 123.8
Beside Student 9.8 14.0
-Back 8.8 3.6-
Out 0.7 0.6
Time 3
10.5
7.7 P
113.5
\N24. \
0.2
a Entries are the average number of minutes for one day, based on two
days of observation.

58
Table 14
Time Allocated to T acher Activities for. Greg at Three
Points in the eferal-to-Placement Process
Teacher Activity Time 1 Time 2 Time 3'
, No Response
Teaching
Other Talk
ApProval
Disapproval
a
163.4
92.8
4.6
97.9
55.1
3.4
Entrtes ate the average nqm er of;minutes for one day, based on twodays of observation.

Table 15
Time Greg Engaged in Various Responses at Three
Points in the Referral-to-Placement Process
tudent ReSponse.
Academic
Writing
Acad Game
Read Aloud
Read Silently
Talk Acad
Ask Acad Q
Ans Acad Q
Task Management
Passive Response
Raise Hand'
Look for Mats
-Move
Play Appr
'Inappropriate
Disruption
Play Inappr
Inappr Task
Talk Non-Acad
Inappr Locale
Look Around
Self-Stimulation
Time 1 Time 2 Time
38.6 30.2 20.5
16.9 11.6 10.7
7.3 3.8 0.8
2.0 2.9 2.5
1.1 2.6 1.6
7.5 5.2 3.4
3.4 3.7 1.0
0.4 0.4 0.5
93.7 149.4 109.4
64.6 112.4 79.5
1.4 1.1 1.2
8.1 6.8 4.2
4.2 4.4 3.3
15.4 24.7 21.2
29.3 23.9 27.2
0.2 0.1 0.6
3.1 1.9.
1.7
3.5 0.1 0.3
, 8.7 2.8 10.4
\1.4 1.6 1.2
12.3 17.4 12.9
0.1 0.0 0.1
aEntries are the average number of minutes for one day, based on two
days.of Observation.

Table 16
Time Allocated to Activities for Jim at Three Points in
the Referral-to-Placement Processa
Activity Time 1 Time 2 Time 3
Academic 114.2 171.0 141.5
Reading 61.3 64.8 71.1
Math 23.5 38.5 39.6
Spelling 25:2 8.8 20.3
Handwriting 0.0 0.0 0.0
Language 4.2 27.3 2.8
Science 0.0 12.3 0.0
Social Studies 0.0 19.3 7.7
Non-Academic 48.0 28.8 22.5
Arts/Crafts 14.0 0.0 0.0
Free Time 6.0 0.0 6.0
Business Management 21.7 15.8 7.0
/Transition 6.3 13.0 9.5
aEntries are the average number of minutes for one day, based ontwo days of observation.
a>

61
Time Allocated to Tasks for Jim at Three Points in
the Referral-to-Placement Processa
Task Time 1 Time 2 Time 3
Readers 18.6 42.0 12.3
Workbooks 25.2 20.3 44.5
Worksheets 43.1 43.1 24.5
Paper & Pencil 16.5 8.8 22.1
Listen to Lecture 3.5\
2.8 4.2
Other Media- 21.0 53.6 36.1
Teacher-Student 17.5 15.8 8.8
Discussion
Fetch & Put Away 11.6 13.0 9.5
aEntries are the average number of minutes for one day, based ontwo days of observation.

62
Tab lei8
Time Allocated to Teaching Structures for Jim at Three Points in
the Referral-to-Placement Processa
'Structure Time 1 Time 2 Time 3
Entire Group 123.2 156.8 106.8
Small Group 38.5 33.9 27.3
Individual 0.0 8.8 29.1
aEntries are the average number of minutes for one day, based ontwo days of observation.
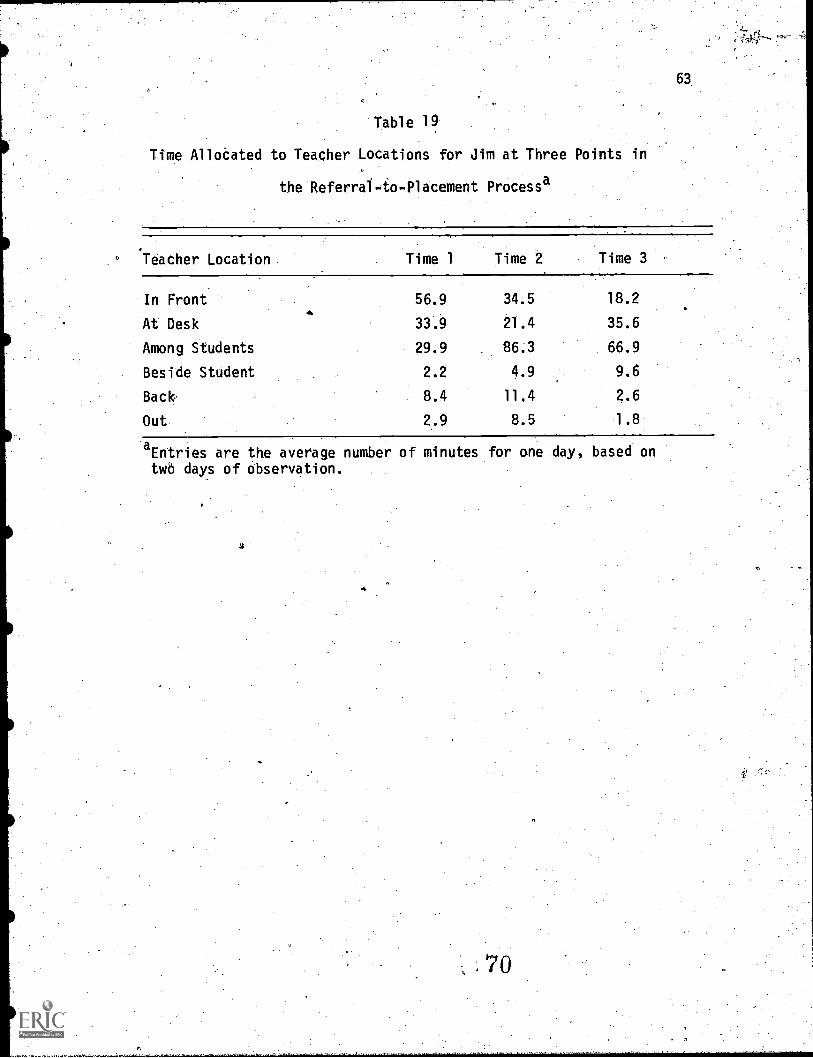
63.
Table 19
Time AlloCated to Teacher Locations for Jim at Three Points in
the Referral-to-Placement Processa
Teacher Location Time 1 Time 2 Time 3
In Front 56.9 34.5 18.2
At Desk 33.9 21.4 35.6
Among Students 29.9 86.3 66.9
Beside Student 2.2 4.9 9.6
Back- 8.4 11.4 2.6
Out 2.9 8.5 1.8
aEntries are the average number of minutes for one day, based ontwo days of observation.

64
Table 20P.
Time Allocated to Teacher Activities for Jim at Three Points in
the Referral-to-Placement Processa
Teacher Activity Time 1 Time 2 Time 3
,
No Reiponse 58.8 100,7, 87.8
Teaching ,G,
49.1 606 37,9
Other Talk 21.6 413 7.2
APproval 0.3 0.5 O.
-Disapproval 4.4 0.9 1.5
aEntries are the average number of minutes for one day, based ontwo days of observation.

65
Table T2l
Time Jim Engaged in Variou4 Responses at Three Points in
:
the Referral-to-Placement Processa
Student Response Time 1 Time 2 Time 3
Academic 34.6 37.4 35.0
Writing 26.9 22.5 154
Acad Game'. 1.5 3.1 0.9
Read AloUd 0.8 2.0 0.8
Read Silently 1.5 5.9 7.9
Talk Acad 1.6 2.1 2.8
Ask Acad Q 2.1 1.1 2.2
Ans Acad Q 0.2 0.7 0.5
Task Management 68.8 99.1 70.3
Passive RespOnse 51.2 78.2 50.3
Raise Hand 4.3 2.0 3.2
Look for Mats 3.9 3.4 4.2
Move 4.9 6.1 5.3
Play Appr 4.5 9.4 7.3
Inappropriate 30.9 30.6 34.7
Disruption 0.0 0.1 0.9
Play Inappr 3.7 3.9 13.8
Inappr Task 2.7 1,9 3.2
Talk Non-Acad 8.5 4.0 2.1
Inappr Locale 6.5 3.4 4.7
took Around 8.7 17.2 9.7
Self-Stimulation 0.8 0.1 0.3
aEntries are the average number of minutes for one day, based on
two dayS of observation.
72

66
Table 22
PIAT Data for Jim
ubtest Raw Score Standard ScoreTime 1 Time 2 Time ) Time 2
6, A
Mathematics 27 4r 89 103
Reading.Recognition 23 29 .80 92.
Reading Comprehension 26 30 90 94
Spelling7 25 28 -85 87
General. InfbrmatioW. 31 36 106- 104
Total 134 163 10 95
73

'Table 23
Time Allocated to Activities for Bob at Three Points i
the Referral-to-Placement Processa
.
Activity Time 1 Time 2 Time 3
Academic 178.3 121.6 129.0
Reading 113.1 24.5 81.6
Math 10.5 25.2 29.8
Spelling 13.3 0.0 , 0.0
Handwriting 15.8 18.6 '8.1
Language 0.0 1.8.2 0.0
Science 8.1 18.6 9.5
Social Studies 17.5 16.5 0.0
Non-Academic 4.6 57.8 18.2
Arts/Crafts 0.0 4.2 0.0
Free Time 0.0 22.1 0,0
Business Management 1.1 14.0 7.7
Transition 3.5 17.5 10.5
67
.
aEntries are the average number of minutes for one day, based ontwo days of observation.
\.
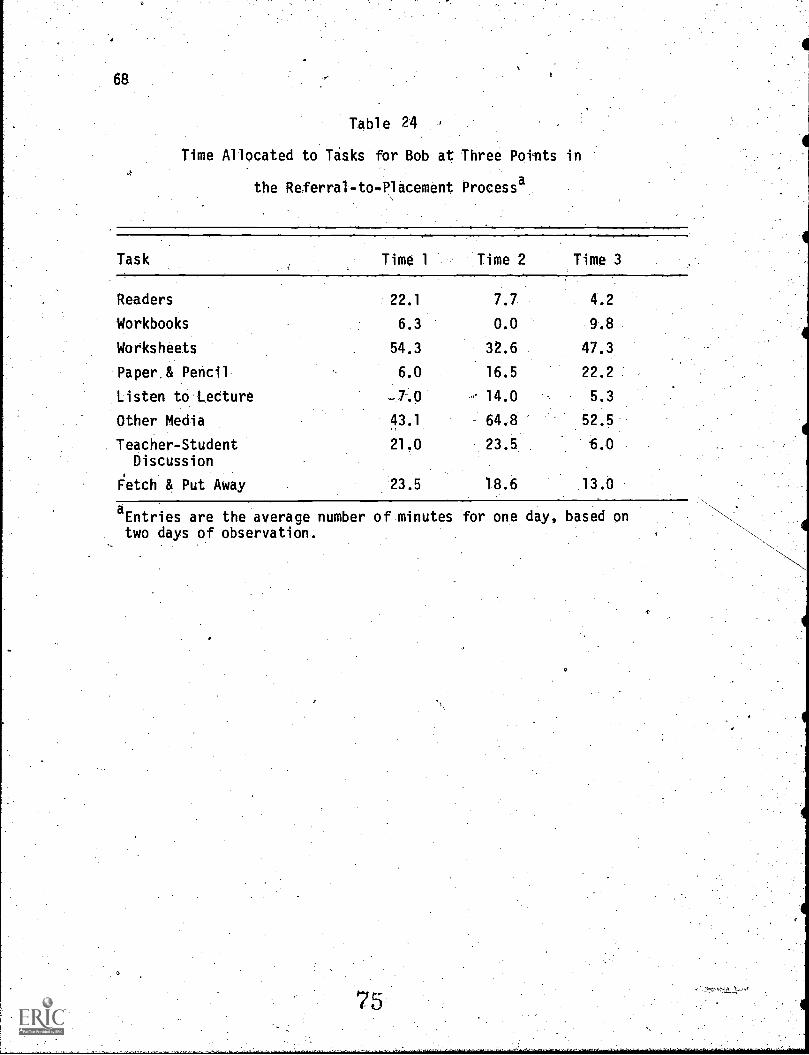
68
Table 24
Time Allocated to Tasks for Bob at Three Potnts in
the Referral-to-Placement Processa
Task Time 1 Time 2 Time 3
Readers 22.1 7.7 4.2
Workbooks 6.3 0.0 9.8
Worksheets 54.3 32.6 47.3
Paper.& Pencil 6.0 16.5 22.2
Listen to Letture 14.0 5.3
Other Media 43.1 64.8 52.5
Teacher-Student 21.0 23.5 6.0Discussion
Fetch & Put Away 23.5 18.6 13.0
aEntries are the average number of minutes for one day, based ontwo days of observation.
75

69
Table 25 '
Time Allocated to Teaching Structures for Bob at Three Points in
the Referral-to-Placement Processa
Structure Time 1 Time 2 Time 3
Entire Group 82.9 138.9 70.7
Small Grolip 98.7 29.1 35.0
Individual 1.1 11.6 43.1
aEntries are the average number of minutes.for one day, based ontwo days of observation;

70
Table 26
Time Allocafed to Teacher Locations for Bob at Three Points in
the Referral-to-Placement Processa
Teacher Location. Time 1 Time 2 Time 3
In Front 39.4 26.6 8.4.
At Desk 9.0 6.8 30.9
Among Students 99.3 105.8 57.8
Beside Student 3.8 5.4 9.4
Back 1.9 1.1 0.1
Out 0.7 0.6 15.6
aEntries are the average number of minutes for one day, based ontwo days of observation.
77

71
Table27
Time Allocated to Teacher Activities for Bob at Three Points in
the Referral-to-Placement Processa
Teacher Activity Time 1 Time 2 Time 3
No Response 78.1 96.6 85.4
Teaching 71.6 37.3 31.4
Other Talk 3.0 10.1 4.3
Approval 0.4 1.3 0.3
Disapproval 0.9 1.9 0.9
aEntries are the average number of minutes for one day, based ontwo days of observation.
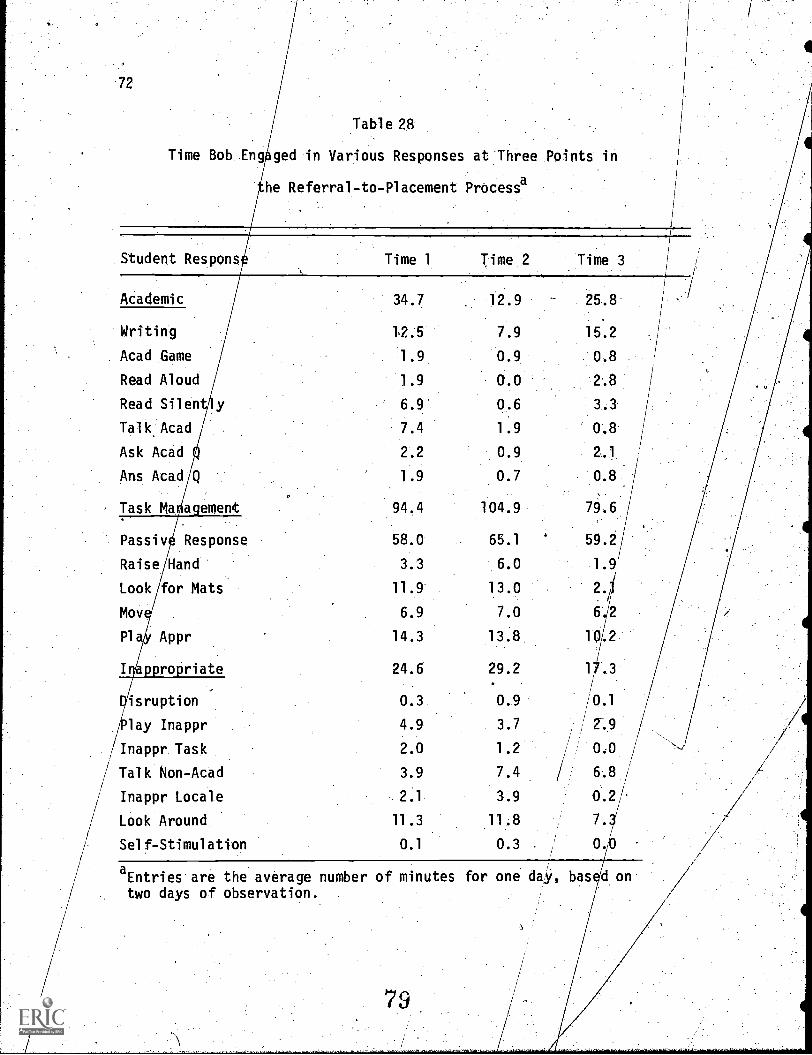
72
Table 28
Time Bob Eng g d in Various Responses at Three Points in
Student Respons
Academic
Writing
Acad Game
Read Aloud
Read Silen
TalkAcad
Ask Acad
Ans Acad Q
Task Ma a ement
Passiv Response
Raise Hand
Look for Mats
Mov
P1a4 Appr
ro riate
isruption
lay Inappr
Inappr Task
Talk Non-Acad
Inappr Locale
Look Around
Self-Stimulation
he Referral-to-Placement Processa
Time 1 Time 2 Time 3
34.7 12.9 25.8
12.5 7.9 15.2
1.9 0.9
1.9 0.0
6.9 0.6
7.4 1.9 0.8
2.2 0.9 2,1.
1.9 0.7 0.8
94.4 104-.9 79.6
58.0 65.1.
59.2
3.3 6.0 1.9
11.9 13.0 2.
6.9 7.0 6 2
14.3 13.8 10.2
24.6 29.2 1 .3
0.3 0.9 0.1
4.9 3.7, / 2'9
2.0 1.2 0.0
3.9 7.4 6.8
2.1 3.9 0.2
11.3 11.8 7.
0.1 0.3 . O.
aEntries are the average number of minutes for one daY, bas d ontwo days of observation.
79

Figure
Observation
Times Allocated to Individual Structures as a Function of theReferralrto-Placement Process.

soss .40
Jane
Greg
Jim
Bob
2
Observation
Figure 2. Times Allocated to Entire GroUp Structures aS a Function ofthe Referral-to-PlaceMent'Process.
81

90-
80 -
70.
60
2 50
W
kJ 40 .5=
30.
20
10 .
Ffgure
2
Observation
Times Allocated to Other Media Tasks as a Function of theReferral-to-Placement Process.

76
60
50
40
24-,==
Minn MED OMB =ND
ci
Jane
Greg
Jim
Bob
Non-LD
--LD20
TO
2
Observation
Figure 4. Times Students Engaged in Writing as a Function of theReferral to Plcement Procgss.

120-
100-
80
60-
44:1
20-
.77
Jane
Greg
----- Jim
-. Bob
2
Observation
Non-LD
LD
INV
Figpre 5. Times Allocated to Reading as a Function of the Referral-to-Placement Process,
84

78
.111111111.111
woo mwe 111 Moe ma
Jane
Greg
Jim
Bob
Observation
Figure 6. Times:Students Engaged fp Passive Responding as a Functionof the Referre-to-Placement Process.
Non-LD
LO

APPENDIX A
Definitions. and Examples of CISSAR Events

instructional Activity
(Subject area of learning experience being provided'to targetteacher; aide, or peer tutor or by target student to tutee.)
student by
I.
Note: Anytime the activity changes, move toea new coding block
Activity/Code Definition EXamples Special Notes
Reading (R)
Math (M)
Spelling (S)
Randwriting (H)
Reading inntructions or activity;oral and silent reading from'books, discussion of words, sounds,vowels, consonants, phonics
Math instrUctions or aCtivity;numibers, geometry, time, weights,metrics, measurement, storyproblems
Spelling instruction or activity;copying spelling work, spellingtest
Handwriting instruction or activity;focus on mechanics of writing letters or words (print, cursive, etc.);
how to hold pencil, how to move arm,discussion of size of letters, lines
on paper
reading library booktalking about ch Soundsittidg at reading tabledraw picture ibout story
working time worksheetmeasuring each other's
. heightwriting math problem on
boardfinds examples of "less
than"find number of -days in
2 years
taking spelling testplaying.spelling bee game
looking up correct spelling of missed word
practice penmanshipmatches capital and lower
case letters .
Include:how to use dictionary,
encyclopedia,....(reference books)
learning ABC's Out., Rotwhen learning how to.write)
dra0 picture Of what read;act out story..
Include:use of dictionary to findspelling of word

Instructional Activity - cont.
Activity Definition .Examples Special Notes
.Language (L)
Science (St)
Language instruction or actiVitY;locus on speech, vocabulary, andlanguage meaning.(words, physicalrelationships, etc.); creatiVewriting; listening exercises;other languageS
Science instruction or activity;science-related topics (chemistry,electricity, space travel, elec-tronics, nature, insects, weather,matmals, body, exercise, personalhygiene)
Social Studies Social studies instruction or
(Ss) -activityl cultures, ways of life,jobs, roles; maps; mpsic topics(instruments, singing, scalee, notes)
Arts/Crafts (Ac) Art-related instruction or activity;coloring, drawing, cutting, pasting
writing boOk rePort onstory in reader
points to-"on top,""under," etc.
learns how to say "thankyou" in 5 languages
-discuss weatherperform experimentationon electricity
school nurse talks abouthygiene
reads Weekly Reader arti-cle about insects
talk about sex biasessing Thanksgiving songslabel map of U.S.listen to lecture on-CivilWar
make poster of primarycolors
draw picture of selfwatch slidei of'sculpturea
Include:book reporte (writing or:reading)
looking up definition indictionary
el public speaking exercises
Include:watching or doing experimentexerciies in tlassroomsex education (phytical -
aspects-not relationships)speakers on drugs/Alcoholacience article in_Weekly,
Reader
Include: .
sex education - relationshipsin general
unit on friendshipsspecial education topics -relations with handicapped
customs; holidajrshistory
Include:viewing art (own or others)decorating (bulletin board,'
classroom)Within Ac time, putting away orgetting new materials is stillAc4 only change to Tn at begina-
ning ot end of Ac time.
90

;Pstructional Activity - cont.
ActivityDefinition ExaMples Special Notes
Free Time (Ft) !eriod during which student may .choose activity:7 can be academie;
study time
Class Business/ Activity focused on scheduling,
Management (em) discipline, rules; usually occursregularly at start of day; show
and tell
Transition (Tn)
-Can't Tell (CT)
91
Time between two other activities;teacher signals end of one (putaway) and time to prepare for new
activity. Ends when teacherstarts instruCtion in new activity
Activities that do not seem to fit
in other categories. See coordina-tor to discuss - must chinge to
another code. .
works:math when told to do-anything wants to do
after student finiShesassignment, is inlibrary area reading
picks up lunch ticketsclass talks about fightop playground during.
recesssaY nhere"Auring atten-
dance .check
Class breaks into groupsline up to go to recestput away readers and get
out math books
Include:extra-credit work,
If everyone has free time,but target student is toldwhat he/she must do, do not
code Ft. Code the subjectarea which he is required to
do.
Include: 7.
Pledge.of Allegiance,morting.songs
sex,-relationships, drugs,etc-when related tospecifie problem in sdhoOl
taking attendence
For arts/crafti, Tn is cededonly.befote And after entire
activity
Hake note of activity onseparate sheet so willremetber aVents to discuss
with coordinator
92
(.4

Academie Task
(Materi ls sed by target student for instructional activity)
Note: time the task changes, move to a new coding block
Task/Code Def nition Examples - Special Notes
Readers (Rr)- Printed book,: bound material
Workbooks (Wb) Paperback/material in which studentcould write .(eveo if Student is,required/by teacher tO write onseparate paper or in noteboOk)
1
Worksheets (Ws) Separ te prepared teacher sheets(usu4ly ditto or photocopy) onwhici students write; _blackboardwriting by student
Tasks where student writes onpaper using pencil, pen, crayon,etc.; includes writing in note-book
Paper and Penell
(PP)
Listen to TeacherLecture (L1)
?
9 3
Teacher talking or writing onboard, and student expected tolook and listen
library bookmath textbook'coMic book /
Spelling workbook.language_ werkbook ;
-handwriting workbook
student practices letterson blackboard
dittoed crossword puzzle
piece.for
of notebook paperspelling test
Include:magazines, Weekly Readerreference books (diction-ary, encyclopedia)
4", 1 page torn from workbdokwriting Weekly ReadereXercite
teacher made or printedtests
If students are taking notes:- during teacher lecture to
remember points, code Ll
watches teacher demon-strate exercises
listens to teacher talkabout telling time
takes notes as teacherpresents ideas for field
field trip
Code Ll even if student. is
taking notes

Academic Task - cont.
Task/Code Definition Exampless
Special Notei
Other Media (Oa
Teacher-StudentDiscussion (Tsd)
Special materials; film,.taperecorder, game, arts and craftsmaterials, clocks, telephone,play/drama
Student talking with teacher;ask-answer question
All other tasks take precedence
Fetch/Put away Students changing materials-
(FP) 'putting away and.getting,cleaning up
watches movie.listens to tape recorderworks oft.calculatOractS mit story part
student answeri teacherquestion
students in Class talkwith teacher about .friendS
student tutors anotheron ABC's
student reads bookreport to class'
-line up for lunchpicks up materials to
throw away before com-pleting art project
student hands outWorksheet$
Include:calculatoranimals
Include:elmer tutoring unleas
other materialsettident verbal presently-
tions (including readingbook report)
All.other tasks take: pre-cedence over Tsd.
Take cue from teacher forchange fromll to Tsd.
When student hat absolutely nonaterials, and is not supposedto have any materials (such aswhen hag free time), -cude FP.
9 6

Structure
(How. student Is grouped for- instructional activity)
INote: Any time the structure changes, movetto a new coding block .
Structure/Code "Definition Examples Special Notes
Entire Group (Eg)
Small Group (Ss)
Individual (I)
Student reCeiving instruction'with all other students inclassroom,
Student is in part of classthat has' been separated from
rest
Student is alone (in -corral,at table) or working one-to-one with teacher or aide
class lectureclass freetibe
reading groupdiscussion groupstudents in pairs
"student. working on Science,experiment alone whileother.read from text.
aide tutors.student
9
For Eg, teaching (or freetime ii for everyone)
Number is not the criterion. :
- if class has 5 stUdentsand instrUction'is directedto all of,theM, code Eg
Include:two students workingtogether away from rest
' of class
Does not occur during free-time exce0t. when free
time Was created esPeciallyfor Student

Teacher Position
(Place of teacher in relation to all students)
Teacher Position/Code
Definition Examples Special Notei
In Front/IF
At Desk/AD
Among Students/AS
Side/S
Back/B
tot of RooM/0
in front of majority of
students
standing or seated at teacher'sdesk
standing or seated amongstudents
standing to the side ofstudents and not AS
standing or sitting in backof classroom away frommajority of studenta
out of the room
- standing at blackboard- at front bulletin board
- looking in desk for note-book
- at desk collecting lunch
money
- walking around classchecking student work
- seated with reading group
- student leaning overchild's desk
- talking to student athis desk
- working at isolated deskin back of room
- putting up art pictures onback bulletin board,
- inhall talking to parent-2in teacher's lounge
9 8
- working individuallywith a student

Teacher.Activity
(Coded in relation to target student or group in which he is a member)y.
Teacher Behavior/Code
Definition Examples Special Notes
No Response/NR
Teaching/T
Other Talk/0T
Approval/A
Disapproval/D
111
makes no observable response
instruction or giving alesson.io students-
child must have opportunityto learn
- talking about class business,rules, schedules, future
activities- all teadher talk that is not
approval, disapproval, orteaching
expresseS praise for studentwork or conduct
expresses dislike or disgustwith student work, appear-ance or conduct
- at desk grading papers'- out of room
- explaining at blackboard- asking question- talking about academics,
e.g. giving directions
. .
- talking about recess- talking about mother's
hospital stay- collecting lunch money
- teacher hugs student- teacher smiles'- "Your map.looks great"
- frowns at student- that is the wrong answer- "You're not trying"
- working individuallywith another student
- key is active involve7cent by teacher -
includes verbal Connments, gestnret,,physical behaviors
- includes verbal com-'ments, gestures,and phytical behaviors
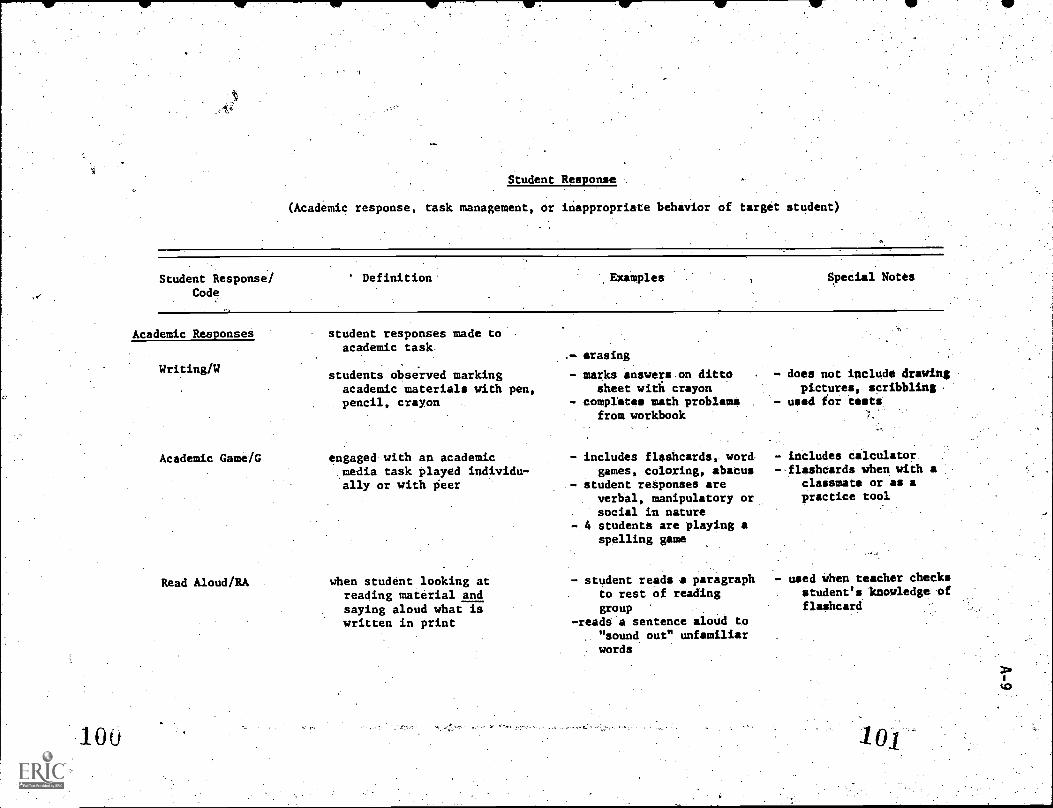
Student Response:
(Academic response, task management, or inappropriate behavior of target student)
Student Response/Code
" Definition Examples Special Notes
Academic Responses
Writing/W
Academic Game/G
Read Aloud/RA
student responses made toacademic task.
students observed markingacademic materials with pen,pencil, crayon
engaged-with an academic,media task played individu-ally or with fieer
when student looking atreading material andsaying aloud what iswritten in print
.- erasing
- marks answers on dittosheet with crayon
- completss Math problamefrom workbook
- includes flashcards, word-games, coloring, abacus
,- student responses areverbal, manipulatory orSocial in nature
- 4 studentS are playing aspelling game
- student reads a paragraphto rest of readinggroup
-reads a sentence aloUd to"sound out" unfamiliar
. words
- does not include drawingpictures, scribbling
- used for tests.
- includes calculator.-.flashcards when with a
claismate or as apractice tool
used When teacher checksstudent's knowledge pfflishcard
lOup
1101

StUdent Response continued
Student Response/Code
Definition Examples Special Notes
eading Silent/RS
Talk About Academics/TA
Answer AcademicQuestion/ANQ
Ask Academic Question/. Ask
looking at reading materialfor at least 2 seconds, and/oreye movements indicate scanningmaterials on desk (3' radius)or held in student's hands.Readers musthe open to a page.
talk back and forth aboutacademic materials orassignment
student either verballyor gesturally responds.
.to teacher's academicqueition
verbally ask the.teacher aquestion related to
academics
- student is reading direc-tions in language workbook
- student istscanning work-book for familiar words
- student reads to self aset of numbers from mathbook
- Student tells classmateanswer to math question
student talks during showand tell
student recites a-poemhe's memorized
- student says "I don'tknow" to teacher'squestion .
- student spells a word for
teacher
"Is 3 + 4 to 7?"
102
- reading words ornumbers.
- not rapid flipping
- only cede when reading ,
materials include-several pages (not
(worksheet)
.- child may be talking tohimself,or A peer. .
coded only when targetstudent talking, notwhen listening _der\
When reciting a poem7or'story from memory
student doing all workin limelight
- answer may be corrector incorrect
- answer should be alMostimmediate
- muSt be nn academicquestion: When isjt time for lunch?is not ASK
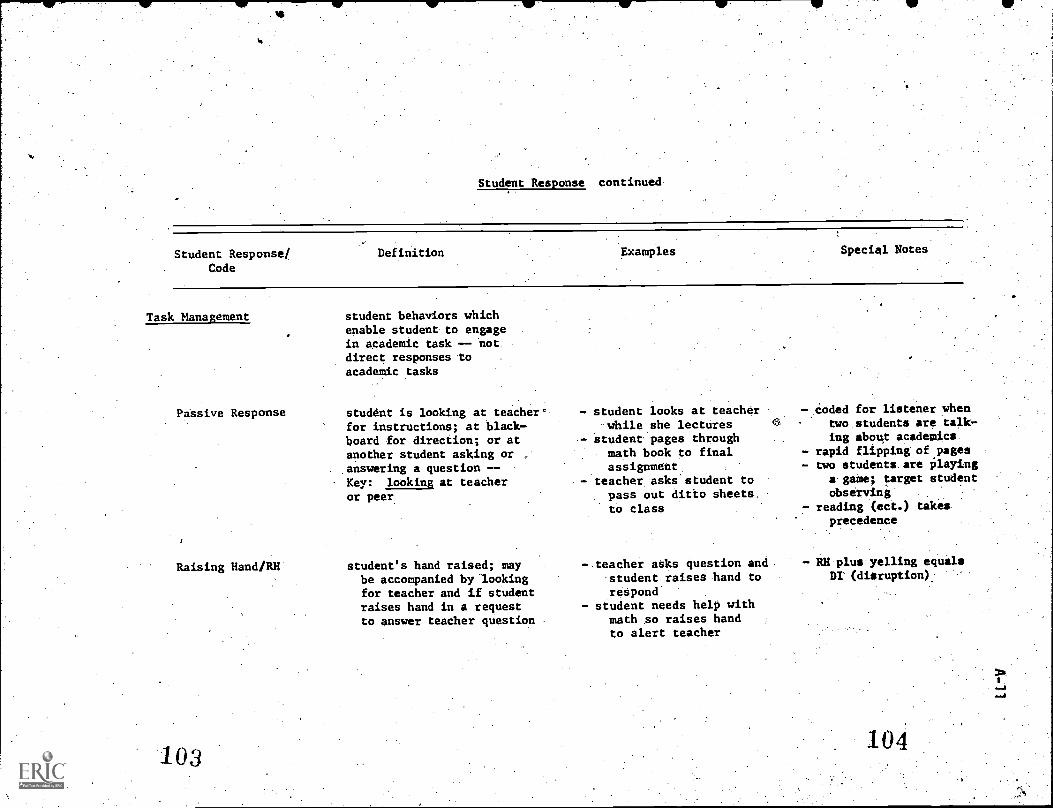
NIF
Student Response continued
Student Response/Code
Definition Examples Special Notes
Task Management
Pa.ssive Response
Raising Hand/RH
103
student behaviors whichenable student to engagein academic task -- not.direct responses to
academic tasks
student is looking at teacher-for instructions; at black,-board for direction; or atanother student asking or ,
answering a question --Key: looking at teacher
or peer
student's hand raised; maybe acconpanied by-lookingfor teacher and if studentraises hand in a requestto answer teacher question
- student looks at teacher-while she lecturesstudent pages throughmath book to finalassignment
- teacher askastudent topass out ditto sheets.to class
- COded for listener when0 two students are talk-
ing about acadep4cs.- rapid flipping' of pages ,
two students:are Playing&gable; target studentobserving
reading (eet.) takes.
precedence
- teacher aSks question and.
-student raises band toreSpond.
- student needs help withmath so raises handto alert teacher
- RH plus-yelling equalsDr (disruption)
104

Student Response cOntinued
Student Response/Code
Definition ExaMples Special Notes
Look for Materials/.LM
student Observed looking foror putting away materials;includes use of miterialsaway from desk '(e.g. an-swer sheets, reference bookS)
-Moves to New Academic student moves to new area as
Station/M station for next activitY-activity is in transitiOn
Play ApproPriate/PA engaged in playbehaviorsapproved by teacher
may involve toys from hoMe;may be strictly social
Inappropriate behavior
Disruption/DI
10
behaviors which are aggressiveor produce loud noises; in-
cludes loud talk
- student goes to teacher's
"desk for correctionsheet
- student returns dictionary
to shelf7 student loOks for paper.'
and pencil
- student moves toJlearningcenter during free-time
- students lining up for
recesa
-.students playalusical.chairs during party,
- students play Monopolyduring free-time
- trips another* student
shakes fist at:other
student- yells
- poke another stUdent
- may includeuse ofreference materials.away from4esk; lookup word in diceionarysharpening pencilstapling
inclUdeS"lining up and'moving when in com-pliance with teacherrequest
code G if play becomesan academic game,.
- code When student pUtshead On desk when 'toldto or when haa 'free timedrawing, coloringdTinking water, washinghands
DI takes precedence overinappropriate locale
106

Student" Redponse continued:
Student Response/Code
Definition Examples Special Notes.
Play Inappropriate/PI
Inappropriate Task/IT
play not approved by teacher
engaged in task without teacher
- play involving squirtguns, toys hidden in desk
- shoots rubber bands; paperairplanes
- student colOrs to avoidmath assignment
+ reads story during
- includes scribbling ordrawing at wrong times-
- code when student putthead on desk when isnot supposed to
- avoidance of assignedtask is keyapproval; not related to task
assignedSocial Studies
Ialk Non-Academic/ talks aloud to peer about - students talk about after - can be, direCted to teach-
TNA nom-academic materials not school plana er or student
related to aSsignment - "What time-is lunch?" - includes passing notes
Inappropriate Locale/ child out of 'seat and away - student goes to bathroom
IL from instruction sitelooses contact with seat
.without permission- student becomes angry
and leaVes school- student stand's on desk
Look Around/LA student looking away from - child looks out window - code AT if student
academic task - looks at floor then ceiling looking at classmateand answering qdestion
Self Stimulation/ active behaviors of child like - student rocks back 61 forth - single major feature of -
SST rapid rocking or shaking; - rapidly moves his pencil child's behavior
maintained for 2 to 3 seconds back and forth academic responses takevrecedence over SST .

APPENDIX V
Optical Scanner Coding Sheet
7.
108

. ... ,
ton ID PAGE STATI1 1 STOP 1 START 2 STOP g START 3 STOP 3 OBS X
.4. - ..... __;._ _ ......... - ..... - ..........- -. ..... -...- .-.0. 0 .0 0 0 . t/ 1, u 0 u 0 o 0 11. .0 . 'o o o 0.14 u 0
1 1 1 1 1 - - '1 - I. 1. (1.-.1 ', ',.1' I.,+:' 1 'I I' I
1 ? 2 7 2 2 . 2 2 2 2 2 2 ..2 2 i . 47324 '1 1 '1 3 3 J 1 3. '1 3 ..3 t ,3 3 3 '.'.3 3
4 4 4 4 4 4 . 4 4 4 4 4 4 ) 4,44 '
5 ' I 2 2 5 5 2 t. 5 2 5 5, ..2 t 2 .5: 5 5 t.
b I. 4 . 1. 11. to Icy .4. ;lb. ,G; C.11:; y', .41
f '1 ,1. "i I. (41 '..7.) Li
U 5 5, 4, 6, ..11 .1I 14 4 C . (y . ,41 (71 ) (: ,41)
9 5 0. y .11 9 v, 1.11. (I. 4.;13 0.1 .
.............-. - -..........0 0 0 0 0 0 0
, I I I s' t I s
2 2 ' 2 2 2 2
3 3 3 3
4.44 4 4 4
% 5 5 5
6 5 .6 I.*,..7 . 7 7
'I. 'I03 . , a ,.61 6
on r7.1:17.1=sts=51,7.17`....W.L7,41:L.:711;1.14, .1"....i.,2=041..AZILIZZoo.'''' '''....alLZITZ 9311;MIINELCME2=13211C1=A.
wit Institute tor Research- 1 on Learning Disabilities1
University of Minnesotammzi CISSAR Coding Sheet
"Aa....aiTiArla:Zig:a1MQZTO.r.jcWBrITA&Ciiarca=rAW=Vjg:
II N S H I Ss Ss Ac Ii Eno Ct P. WE Ws Pp LI Dn Tsd fp Ey Sp 1
sow
.3.4 ss
INN
IF AL) AS S U 0 NH T OT A 0'
W G RA RS TA A.:7 ASK AT RH IM Al PA UI Pf IT 114A . 11 TA $ST
11" IF An AS S 8 0 NR T (11 A 0 W 6 RA RS TA ANO ASK AT 101 TM RI PA 01 PI IT TNA a 1.115ST
MI
1
. -
Stt,p Code .A 11 C. 0r o14 L PA 44 0I. 0
1" If AD tr. S 8 0 BR T OT A 0 W G RA RS TA ANO ASK AT 1111 TM IA PA DI PI IT TNA IL LA SST START 1
or I. ; k .) 'S./
IIM If AO AS S I 0 NH 1 OT A IT W G RA RS TA ANO ASK Al RH LSI IA PA OF PI IT TNA IL TA SST
. ... / ; i (-, ( .. . .. . .
l ;.'s .''' ..,
01 PI IT TM IL LA SST STOP 1
mow, IF AN AS S II 0 NR T OT A 0 W 6 RA RS TA AND ASK AT RH TM NI PA
No ', ; ..,;;: o(,)( %. / ( ; k.,/ (';' ...'.....''...; O O ,,.'-1
II AO AS S I 0 NH I OT A U W G RA 115 TA ANO ASK AT RH TM M PA DI PI IT TilA IL LA SST
,)f.' 1. '. .
- : -
"11 Fl IA S II L Sc Ss Ac FI Om to ct nf WI, Ws Pp 11 Dm Tsd I p Ty Sg I
Am .
.
im If AU AS S I 0 NH T oi A U W G RA ns TA AND ASK AT RII LTA M PA Of PI IT INA It TA SST
(,)t,)i...r. )(,) () t_.) CIO(' f., ......) 1..,:..)0-.. , ,
'1 If AU AS S 8 0 NR T DT A 0 W G RA 115 TA AND' ASK AT R11 IM M PA DI PI IT TM II LA SST
! I.: ;(*,,i'4
1.. '0 : , .. .
. .. _.
e" II AN AS S U 0 NII 1 UT A U .1V G RA IIS TA AITO ASK AT 1111 IM M PA 01 PI IT, TIM It LA SST START 2
, . ,.. './ ..,...) ; ..,'. )( ; 1.: );,) '.. .; i..,,.' G. ;::. ', : ( .. ... ; ......: 1..... .t
u " If AD AS S 8 0 till T OT A 0 W G nn RS IA AM ASK Af RH lAI M PA II PI 11 1NA 11. IA SST
um '
olo II AC A,: S 11 LI OR T OT A 0 W . G rui IIS TA AND ASK At 1111 I M PA PA DI PI IT TNA IL IA 551 STOP 2
. 1. t...))13; .1./ (.1 ;....
um IF AfI AS S A 0 NR T 01 A 0 W G RA RS TA ANO ASK AT RH 111 M PA CI PI 11 11lA. IL LA SST
no . ,. ,o ' .. ' ;
Stop Code .
A 0 4. 0 EF 14 1
'IC L M 1.4 o
p
01,In° R IA S Il L Sc Ss Ac It Rho To CI Rs 'NEWS Pp LI Um Tut Fp Ty Sg 1
um o ' . .'t. : , ' t o ,.
IF AU AS S 8 0 NH T OT A 0 W 11 NA IIS 7A . ANU ASK AT IIN LIA M PA .. DI PI 11 TNA IL LA SST
, ,'...., ....(..31.3 (..,JUI..,ILI) 1/4..,s () ( ,) %. ./ . 7 , ...; ( .. (.... .. .' s.)...):..)
IF AO AS S II 0 NR r OT A 0, W G RA RS TA ANO A$K AT RH TM M PA '0,11 P1 IT TM IL LA SST
611 , t ). t. ( . t . I . . , . ,. .
Mill ii An AS 5 8 0 NII I OT- A 0 W G F1A RS TA AND ASK AT ROLM M :PA Ot PI IT TM II LA SST START 3
1. i C.: ; 1. '..% ..,:
4./ um It AV AS S I 0 /JR T OT A 0 W "G IA RS T'A AND 'ASK AT FIll EM M PA 01 PI IT TNA IL LA SST
ocos Pio
I . 1. ', I
. .
° I'M IF AO AS S B 0to
. IR I 01 A. 0 W G RA.RS TA ANO ASK AT 1:111141 M PA' 01 Pl n 1141, IL LA SST
II amL.
'...i.st,...1....,:,..) UL,,../L;(..;....1 C.) '.../ t....,....,..)%.;0....1 Cir."-..1:: ."; '....' ..is,..,1..)
t IN IF AU AS 5 I '0 IsR T OT A 0 W G RA BS TA AND' ASK AT 1111 IN M PA Olo PI IT INA IL LA SST
ss111111: ". . .. P., )... s .
( )(. )( "KJ). .
( Tc/(.1 ) I ( / l ./ ( )1..)t )1. ) 1- f ( POO
Stop Code .
A P4. IA I J
Pt E. "VI N
P
109
STOP 3
APPENDIX C
Guidelines for Anecdotal Recordings
110
9

Observer Number
Observation Pages ,
Guidelines for Anecdotal Recordings
School # Class # Student #
Classroom Procedures (Note general class arrangement, schedule,.andatmosphere. Anything unusUal?)
Target Student (Comment briefly on eaCh of the following areas for thetarget student observed.)
Location (where does the child sit in relation to.where teacherdoes'most teaching?)
Physical appearance (is child's appearance similar to peer group?)
. .
Teacher-student relationship (are interactions between teacher and .
student similar to those of teacher with Other students?)11
Peer relationships (are interactions between target student andother students similar to those-among mott students'in clsss'I)
Attention to task (how ddes target student compare to other students?)
Other (is thereanything about the target student that seems differentfrom other students in the class?)
Validity of Observation (Is there any reason why yOu would believe thatthe observation is not a.valid'reflection of typical classroom activities,interactiOns, etc?) .
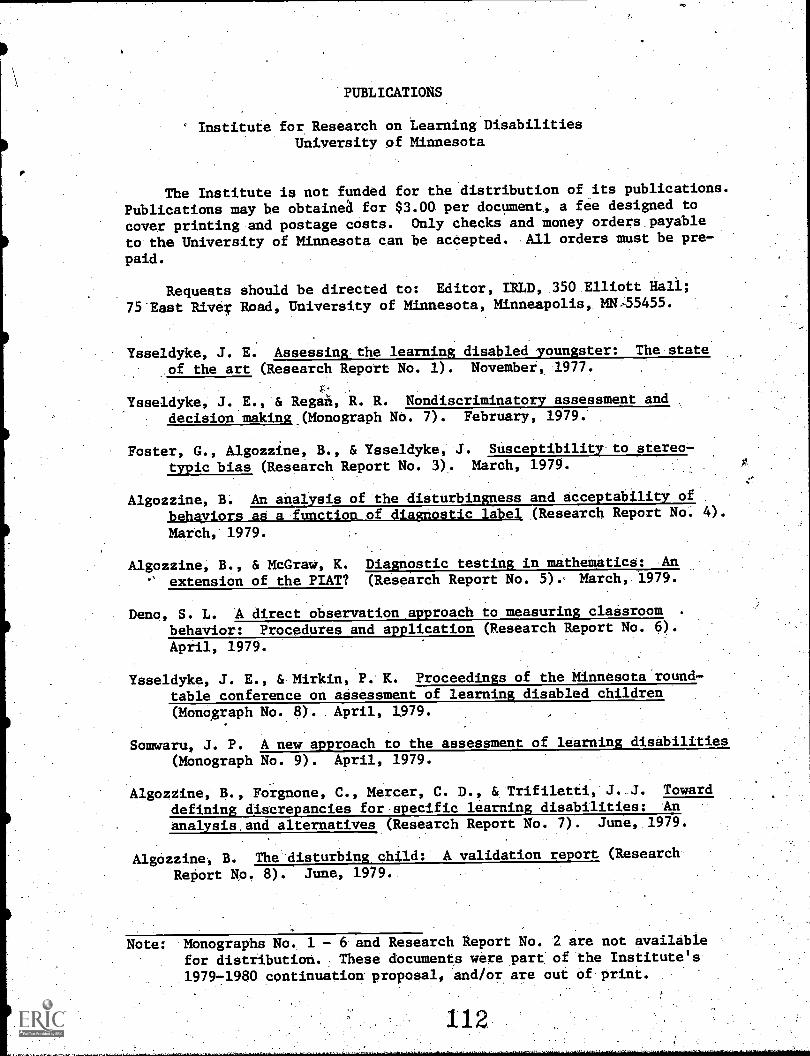
'PUBLICATIONS
° Institute for. ReSearch on Learning DisabilitiesUniversity of Minnesota
The Institute is not funded for the distribution of its publications.
Publications may be obtainea for $3.00 per document, a fee designed to
cover printing and postage costs. Only checks and money orders payable
to the University of Minnesota can be accepted. All orders must be pre-
paid.
Requests should be directed to: Editor, IRLD, 350 Elliott Hall;
75 East River Road, University of Minnesota, Minneapolis, MN,55455.
Ysseldyke, J. E. Assessing the learning disabled youngster: The state
of the art (Research Report No. 1). November, 1977,
Ysseldyke, J. E., & Regah, R. R. Nondiscriminatory assessment and
decision making (Monograph No. 7). February, 1979.
Foster, G., Algozzine, B., & Ysseldyke, J. Susceptibility to stereo-
typic bias (Research Report No. 3). March, 1979.
Algozzine, B. An analysis of the disturbingness and acceptability of
behayiors as a function of diagnostic label (Research Report No. 4).
March, 1979.
Algozzine, B., & McGraw, K. Diagnostic testing in mathematics: An
' extension of the PIAT? (Research Report No. 5).. March, 1979.
Deno, S. L. A direct observation approach to measuring classroom .
behavior: Procedures and application (Research Report No. 6).
April, 1979.
Ysseldyke, J. E., & Mirkin, P. K. Proceedings of the Minnesota round-table conference on assessment of learning disabled children(Monograph No. 8). April, 1979.
Somwaru, J. P. A new approach to the assessment of learning disabilities(Monograph No. 9). April, 1979.
Algozzine, B., Forgnone, C., Mercer, C. D., & Trifiletti, J. J. Toward
defining discrepancies for-specific learning disabilities: An
analysis.and alternatives (Research Report NO. 7). June, 1979.
Algozzine., B. The disturbing child: A validation report (Research
Report No. 8). June, 1979.
Note: Monographs No. 1 - 6 and Research Report No. 2 are not availablefor distribution. , These documents were part of the Institute's1979-1980 continuation 'proposal, and/or are out of print.

Ysseldyke, J.' E., Algozzine, B., Regan, R., & Potter, M. Technicaladequacy of tests used by professionals in simulated decisionmaking (Research Repori No. 9). July, 1979.
Jenkins, J. R., Deno, S. L., & Mirkin, P. K. Measuring pupil progresstoward the least restrictive environment (Monograph No. 10).August, 1979.
Mirkin, P. K., & Deno, S. L. Formative evaluation in the classroom: AnApproach to improving instruction (Research Report No. 10). August,1979,
Thurlow, M. L., & Ysseldyke, J. E. Current assessment and decision-m4ingpractices in model programs for the learning disabled (Research ReportNo. 11). August, 1979.
Deno, S. L., Chiang, B., Tindal, G., & Blackburn, M. Experimental analysisof program components: Aniipproach to research in CSDC's (ResearchReport No. 12). August, 1979.
Ysseldyke, J. E., Algozzine, B., Shinn, M., .6c McGue, M. Similarities anddifferences between underachievers and students 'labeled learningdisabled: Identical twins with different mothers (Research ReportNo. 13). September, 1979.
Ysseldyke, J., & Algozzine, R. Perspectives on assessment of learningdisabled students (Monograph No. 11). October, 1979.
Poland, S. F., Yeseldyke, J. E., Thurlow, M. L., & Mir in, P. K. Currentassessment and decision-making practices in school settings as reportedby directors of special education (Research Report No. 14). November,
1979.
McGue, M., Shinn, M., & Ysseldyke, J. Validity of the Woodcock-Johnsonpsycho-educational battery with learning disabled students (ReseardiReport No. 15). zNovember, 1979.
Deno, S., Mirkin, P., & Shinn, M. Behavioral perspectives on the assess-ment of learning disabled children (Monograph No. 12). November, 1979.
Sutherland, J. H., Algozzine, B., Ysseldyke, J. E., & Young, S. 'What'Can I say after I say LD? (Research Report No. 16). December, 1979.
Deno, S. L., & Mirkin, P. K. Data-based IEP developnent: An approach?, to substantive compliance CMonograph No. 13). December, 1979.
Ysseldyke, J Algozzine, B., Regan, R., & McGue, M. The influence of .
test scores and naturally-occurring pupil characteristics on psycho-educational decision making with children (Research Report No. 17).December, 1979.
Algozzine, B., & Ysseldyke, J. E. Decision makers prediction ofstudents' academic difficulties as a function of referral informa-tion (Research Report No. 18). December, 1979.
.
0
Ysseldyke, J. E., Algozzine, B., Regan, R. R., Potter, 11., Richey, L.,& Thurlow, M. L. Psychoeducational assessment and decision making;A computer-simulited investigation (Research Report No. 32).July, 1980.
Ysseldyke, J. E., Algozzine, B., Regan, R. R., Potter, M., & Richey, L.Psychoeducational assessment and decision making: Individual casestudies (Research Report No. 33). July, 1980.
Ysseldyke, J. E., Algozzine, B., Regan, R., Potter, M., & Richey, L.Technical supplement for computer-simulated investigations of thepsychoeducational assessment and decision-making process.(ResearchReport No. 34). July, 1980.
Algozzine, B., Stevens, L., Costello, C., Beattie, J., & Schmid, R.Classroom perspectives of LD and other special education teachers(Research Report No. 35). July, 1980.
Algozzine, B., Siders, J., Siders,.J., Ee'Beattie, J. Using asSessmentinformation to plan reading instructional prograns: Error analysisand word attack skills (Monograph No: 14), July, 1980.
Ysseldyke, J., Shihn. M., & Epps, S. A comparison of the WISC-R andihe Woodcock-Johnson Tests of Cognitive Ability (Research ReportNo. 36). July, 4.980. .
Algozzine, B., & Ysseldyke, J. E. An analysis of difference score relia-bilities on three measures with a sample of low achieving youngsters(Research ReportNo. 37). August, 1980.
Shinn, M., Algozzine, p., Marston, D., & Ysseldyke, J. A theoreticalanalysis of the performance of learning disabled students on theWoodcock-Johnson Psycho-Educational Battery (Research Report No. 38).August, 1980.
Richey, L. S., Yeseldyke, J., Potter, M.., Regan, R. R., & Greener, J.Teachers' attitudes and expectations for siblings of learning dis-abled children (Research Report No. 39). August, 1980.
Ysseldyke, J. E., Algozzine, B., & Thurlm, M. L. (Eds.). A naturalistic'investigation of special education team meetings (Research Report No.40). August, 1980.
Meyers, B., Meyers, J., & Deno, S. Formative evaluation and teacher deci-sion making: A follow-up investigation (Research Report Np. 41).September, 1980.
Fuchs, D., Garwick, D. R., Feathertone, N., & Fuchs, L. S. On the deter-.
minants and prediction of handicapped children's differential testperformance with familiar and unfamiliar examiners (Research ReportNo. 42). September, 1980.

Ysseldyke, J. E., & Algozzine, B. Diagnostic classification decisions
as a function of referral information (Research Report No. 19).
January, 1980,
Deno, S..L., Mirkin, P. K., Chiang, B., & Lowry, L. Relationships
among simple measures of.reading and ,performance on standardizedachievement tests (Research Report No. 20), January, 1980.
Deno, S. L., Mirkin, P. K., Lowry, L., & Kuehnle; K. Relationshipsamong simple meaSures of spelling and performance on standardized
.achievement tests (Research RepOrt No.. 21). january; 1980.
Deno, S. L., Mirkin, P. K., & Marston, D. Relationships among simplemeasures of written expression and performance on standardizedachievement tests (Research Report No. 22). January, 1980.
Mirkin, P. K., Deno, S. L., Tindal, G., & Kuehnle, K. Formative evalua-
tion: Continued development of data utilization systens (Research
Report No. 23). January, 1980. a, ),
Deno, S. L., Mirkin, P.,71., Robinson, S., & Evans, P. Relationshipsamotg classroom opservations of social adjustment and sociometric
rating scales (Reaearch Report No. 24). January, 1980.
Thurlow, M. L., eYsseldyke, J. E. Factors influential on the psycho-educational decisions reached by teams of educators (Research Report
No. 25). February, 1980.
Ysseldyke, J. .E & Algozzine, B. Diagnostic decision making in indivi-.duals susceptible:to biasing infOrmation presented in-the referralcase folder (Research Report No. 26). March, 1980.
Thurlow, M.-L., & Greener, J.. W. Preliminary evidence .on information -
considered.useful in instructional 'planning (Research Report No.. 27).
March, 1980.
Ysseldyke, J. E., Regan, R. R & Schwartz, S. Z. The use of technicallyadequate tests in psychoeducational decision making (Research ReportNo. 28). April, r980.
Richey, L., Potter, Mw, & Ysseldyke, J. Teachers' expectations for thesiblings of learning disabled and non-learning disabled students:A pilot study (Research Report No. 29). May, 1980.
Thurlow, M. L., & Ysseldyke, j. B. Instrtictional,planning: InfOrmationcollected*by achOol psycholOgists vs, information considered use-.
ful by teacher& (Research Report No. 30). Junei.1980..
Algozzine, B., Webber, J.i Campbell, IC, Moore, S.i It Gilliam, J.
ClassrOom.decision Making as a funCtion of dieghostiCiabels and'
perceived competence (Research Report No. 31). June, 1980..

Algozzine, B., & Stoller, L. Effects of labels and competence onteachers' attributions for a student (Research Report No. 43).
-September, 1980.
Ysseldyke, J. E., & Thurlow, M. L. (Eds.)6, The special education
asSessment and decision-making process: Seven case studieS
(Research Report No.- 44). Septeriber, 1980.
Ysseldyke, J. E., Algozzine, B., Potter, M., & Regan, R. A descriptive
study of students enrolled in a program for the severely learning
disabled (Research Report No. 45).. Septetber, 1980:
Marston, D. Analysis of subtesc.scatter.on the tests of cognitive
ability ftom-the Woodnock-Johnson "Psycho-Educational Battery
(Research Report No. 46). October, 1980.
Algozzine, B., Ysseldyke, J. E., & Shinn, M. Identifying children with
learning disabilities:* When is a discrepancY severe (ReSearch
Report No. 47), November, 1980..
Fuchs, L., Tindal, J., 4 Deno, S. Effects of.varying item,domain and
sample duration on technical characteristics of daily measures
in,reading:(Researth Report No. 48).. January, 1981,-
Marston, D.,-Lowry, L.., Deno, S., & Mirkin, P. An analysis of learning
trends in simple measures of reading, spelling, and written expression:
A longitudinal study (Research Report No. 49). January, 1981.
Marston, D., & Deno, S. The reliability of simple, direct measures of
written expression (Research Report No. 50). January, 1981.
Epps, S., McGue, M., & Ysseldyke, J. E. Inter-judge agreement in classi-
fying students as learning disabled (Research Report No. 51). Fe13-'
ruary, 1981.
Epps, S., Ysseldyke, J. E., & McGue, M. Differentiating LD and non-LD
students: "I ktiow one when I see one" (Research Report No. 52).
March, 1981.
Evans, P.. R., & Peham, M. A. S. Testing and measurement in aCcupational
therapy. A review of current practice with special emphasis on the
Southern California. Sensory Integration Tests (Monograph No. 15).
April, 1981.
Fuchs, L., Wesson, C., Tindal, G.', & Mirkin, P. Teacher efficiency in
continuous evaluation of IEP goals .(Research Report No. 53). June,
1981.
Fuchs, D., Featherstone, N., Garwick, D. R., & Fuchs, L. S. The impor-
tance of situational factors and task demands to handicapped chil-
dren's test performance (Research Reporf No. 54). June, 1981.

Tindal, G., & Deno, S. L. Daily measurement of reading: Effects ofvarying, the size of the item pool (Research'Report No. 55). July,1981.
Fuchs, L. S., & Deno, S. L. A comparison of teacher judgment, standard-ized tests, and curriculum-based approaches to reading placement(Research Report No. 56). August,, 1981.
Fuchs, L.., & Deno, S. The relationship between curriculum7-based masterymeasures and standardized achievement tests in reading (Research'Report No. 57). August, 1981.
Christenson, S Pottet, M & Ysseldyke, J. Current researchon psychoeducational assessMent and decision making: Implicationsfor training and practice (Monograph No. 16). ;.September, 1981.
Christenson, S., Ysseldyke, J., & Algozzine,- B. Institutional constraintsand external pressures influencing referral decisions.(ResearchReport No. 58). October, 1981.
-T
Fuchs, L., Fuchs, D., & Deno, S. Reliability and validity of curriculum-based informal reading inventories (Research Report No. 59). Octo-
ber, 1981.
Algozzine, B., Christenson, S., & Ysseldyke, J. Probabilities associatedwith the referral-to-placement process (Research Report No. 60).November, 1981.
Tindal, G., Fuchs, L. Christenson, S., Mirkin, P., & Deno, S. The rela-tionship between student achievement and teacher assessment of short-or long-term goals (Research Report No. 61). November, 1981.
Mirkin, P., Fuchs, L., Tindal, G., Christenson, S., & Deno, S. The effectof IEP monitoring strategies on teacher behavior (Research Report No.62). December, 1981.
Wesson, C., Mirkin, P., & Deno, S. Teachers' use of self instructionalmaterials for learning procedures for developing and monitoringprogress on IEP goals (Research Report No. 63). January', 1982.
FuChs, L., Wesson, C., Tindal,G., Mirkin, P., &'Deno, S. Instructionalchanges, student performanCe, and teacher preferences:' The.effectsof specific measurement And evaluation procedures (Research ReportNo. 64). January, 1982. '
Potter, M.,& Instructional planning and iMplementatiOnpractices of elementary and secondary resource room teachers..Is there a:differenCe?:(Research Report No. 65)'.- January, 1982.
Ihurlow, M. L.', & Ysseldyke,.J. E. Teachers' beliefs about LD students(Research Report No. 66). January, 1982.
Thurlow, N. L.,: & Ysseldyke, J. E. Acadedic engage&timeand its relationship to learning:: A review of the literature(Monograph No. 17). January,'1982.
King, R., Wesson, C., & Deno, S. Direct and frequent measurement ofstudent performance: Does it take too much time? (Research
Report No. 67),- Februar.Y, 1982..
Greener', J. & hurlow0f. L. Teacher opinions about professionaleducation trajLning programs earch Report-Na.. 68). March,
1982.
Algozzine, B., & Y seldyke, J. Learning disabilities as:a subset ofschool failure. The oversophistication of a concept (ResearchReport No. 69),I March, 1982.
FUchS,- D., Zern, D. S., & Fuchs, L. S. A microanalysis of participant.-behaviOrAn familiar and unfamiliarteat conditiona (ResearchReport No. 70). March, 1982.
Shinn, M. g., Ysseldyke, J Deno, 8., & Tindal, G. A-comparisOn Ofpsychometric and functional differences between students labeledlearning disabled and low achieving (ReSearch Repott No.: 71).March, 1982.
Thurlow, M. L. Graden, J., Greener, J. W., & Ysseldyke, J. E. Academicresponding time for LD and zon-LD students (Research Report No.72). April, 1982.. .
Graden, 3., Thurlow, M., & Ysseldyke,,J. Instructional ecology andacademic responding time for students at three levels of teachei7.perceived behavioral. competence (Research Report No. 73). April,,1982.
Algozzine, B., Ysseldyke, J.,teachers' tolerances forratings.of a third gradeApril, 1982.
& Christenson, S. The influence ofspecific kinds of behaviors on theirstudent (Research Report No. 74).
Wesson, C., Deno, S., & Mirkin, P. Research on' developing and monitor-ing progress.on.IEP goals: Current findings and implications forpractice.(Modograph No. 18). 'April, 1982.
Mirkid, P., Marston,,D., & Demi:S. L. Direct and repeated measurementof.academic skills: An alternative to traditional screening, re-ferral, and identification of learning disabled students (ResearchReport No. 75),. Say, 1982.
Algozzine, B.; Ysseldyke, J., Christenson, S., & Thurlow, M. Teachets': intervention choices for children exhibiting different behaviors
In school (Research Report NO. 76). June, 1982.
Tucker, J.,,Stevens, L. J., A Ysseldyke, J.E. Learning. disabilities:
The eXperts speak out (Reseaich Report No. 77). June, 1982.
Thurlow, M. L., Ysseldyke, J. E.,-Graden, J., Greener; J. W., &.Mecklenberg,.C. Academic responding time for LD students receivingdifferent levels of special education serVices (Research Report'No. 78). June, 1982.
Graden, J. L., Thurlow, M. L., Ysseidyke, J. E., & Algozzine, B. Instruc-tiOnal ecology and academic responding time for students ih differ.-ent reading groups (Research Report No. 79). July, 1982.
Mirkin,.P. K., & Potter, M. L. A survey of programhplanning and imple-..mentation practices of' LD teachers (Research Report No. 80). July,
1982..
Fuchs, L. S., Fuchs, D., & Warren, L. M. Special education practice. in eValtating student progress toward goals (Research Report Nw.81). Zuly, 1982..
Kuehnle, K., Deno, S. L., & Mirkin, P. K. Behavioral measurement ofsocial adjustment: What behaviors? What setting? (ResearchReport No. 82). July, 1982.
Fuchs, D., Dailey, Ann Madsen, & Fuchs, L. S. Examiner familiarity andthe relataon between qualitative and quantitative indices of ex-pressive language (Research Report No. 83). July, 1982.
Videen, J., Deno, S., & Marston, D. Correct word sequences: A validindicator of proficiency in written expression (Research ReportNo. 84). July, 1982.
Potter, M. L. Application of a decision theory model to eligibilityand classification decisions in Special education (Research ReportNo. 85).. July, 1982.
Greener, J. E., Tburlow, M. L., Graden, J. L., & Ysseldyke, J. E. Theeducational environment and. students' responding times as a functionf.ostudents1 teacher-perceived academic competence (Research Report
No. 86). -August, 1982.
Deno, S., Marston, D., Mirkin, Ii., ,Lowty,The use of standard tasks to measureand written-expression: A normativeReport 'No. .87Y. August, 1982.
R.,Wesson, C., & Deno, S. L.the use of formative evaluation
compatison (Research Report No.
L., Sindelar, P., A Jenkins,.J.achievement in reading, spelling,and developmental Study (Research
'The effects.of training teachers inin readinv An expprimental-tbutrol '88). September, 1982.

Martson, D., Tindal, C., A Deno, S. L. Eligibility for learning diga-bility services: A direct and repeated measureMent.approach(Research Report No. 89), September, 1982.
r't
Thurlow, M. L., Ysseldyke, J. E., & Gradeni J. L.. LD students' activeacademic responding in regular and resource classrOoms (Resenrch.Report No. 90). September, 1982.
Ysseldyke, J. E., Christenson, S., Planta, R., Thurlow, M. L., & Algozzine,B. An a9alysis of current practice in referring students for psycho,educational evaluation,: Implications for Change (Research Report'No.91)-. October, 1982.
Ysseldyke, J. E., Algozzine, & Epps, S. A logical and empiricalanalysis of current prattices in classifying students as handicapped(Research Report NO. 92). October, 1982.
Tindal, G., Marston, D.,.Deno, S. L., le Germann, G. CurticuluM differ.,ences in direct repeated measUres of reading (Research Report No,93). October, 1982:'
Fuchs, L.S., Deno, S. L.-, & Marston, D. Use of aggregation to improve-.
the .reliability_of simple directmeasures of academic performance(Research Report No, 94)-. October, 1902,,
,
Ysseldyke, J. E., Thurlow, M. L., Mecklenburg; C., &,Graden, J.-Observedchanges An instruction and.student responding as a fnnction.Of-referral and special education placement (Research Report No. 95).October, 1982.