student success: college and career readiness …€¦ · was used to determine if college and...
TRANSCRIPT

Chapter 3
Methodology
A quantitative experimental design approach
was used to determine if college and career
readiness initiatives implemented from August
2009-June 2013 increased student achievement and attendance participation for both cohort
groups.
Setting/Organizational Profile
A quantitative comparison of the academic achievement and attendance participation of two cohort groups of students (C1 and C2) was analyzed to answer two research questions. The term Cohort was used to describe the approach used by College and Career Readiness participants. A whole grade-level approach was used in program treatments.
Cohort 1(C1), the experimental group, was comprised of students who participated in the college bound track and program treatments for three years. This cohort of students began their freshman year in 2009 and graduated from high school in 2013 on the Distinguished Achievement Plan(DAP).
Cohort 2(C2), the comparison group, was comprised of students who participated in the career tech cohort track. This cohort of students began their freshman year in 2009 and graduated from high school in 2013 on the Recommended High School Plan(RHSP).

Demographics of Cohort
Groups
50% HA & 50% AA
90% at-risk of not graduating
from high school and
advancing on to college
90% qualified as low SES
College and Career Initiatives
(Pre-college Interventions)
College Board/GEAR UP Partnerships
Chamber of Commerce/Tenneco Oil Partnership
Community partnerships consisting of stakeholders(i.e. parents, students, staff faculty)
*Block scheduling in ELA and Math for C1 cohort
*Rigorous, AP course offerings for College Bound cohort group(C1)-DAP
Intense SAT/ACT prep as well as college and career awareness thru college fairs
Participant Selection Method
Sample size (N) included a convenience
sampling of approximately 350 freshman
students.
In an effort to maintain fidelity to the
program model and key participants,
informed consent was obtained from
district personnel to gain access to the
high schools’ archived data-internal
database from 12th grade Admin.
Research Instruments
Historical district data from the 2009-2013 school years (TAKS ELA & MAT posttests were analyzed)
The high schools’ internal database included data for cohorts sorted by grade level, graduation rates, Exit level achievement scores, economic disadvantaged status and attendance participation.
Data Collection
An independent samples t-test was used to
explore the impact of the academic achievement
on TAKS ELA & MAT posttests for both the
experimental and comparison cohort groups.
A second parametric test, an ANOVA was also
used in contrast to the t-test to strengthen and/or
validate findings.
Results
Results of this study were only generalized to the high school participating in the study. In a true experiment design, some confounding variables may threaten internal validity.
These threats include history, statistical regression, selection, high mobility rate of participants, testing, instrumentation, and design contamination.
Quant. experimental designs fare quite well when evaluated on their ability to control threats to internal validity. With the exception of history, the other threats can be controlled by the presence of the series of pre-measures.
Procedures for Data Analysis
The researcher was the only person with knowledge
of data stored on a scanned disc.
The researcher obtained permission from the Research and Evaluation Department of the participating district. The researcher will submit an external research application to the Research and Evaluation Department.
Before approval was granted by the school district, the Research and Evaluation Department requested the approval from the Institutional Review Board (IRB) (Appendix A).
Once permission was obtained by the IRB, the Research and Evaluation Committee released the data.
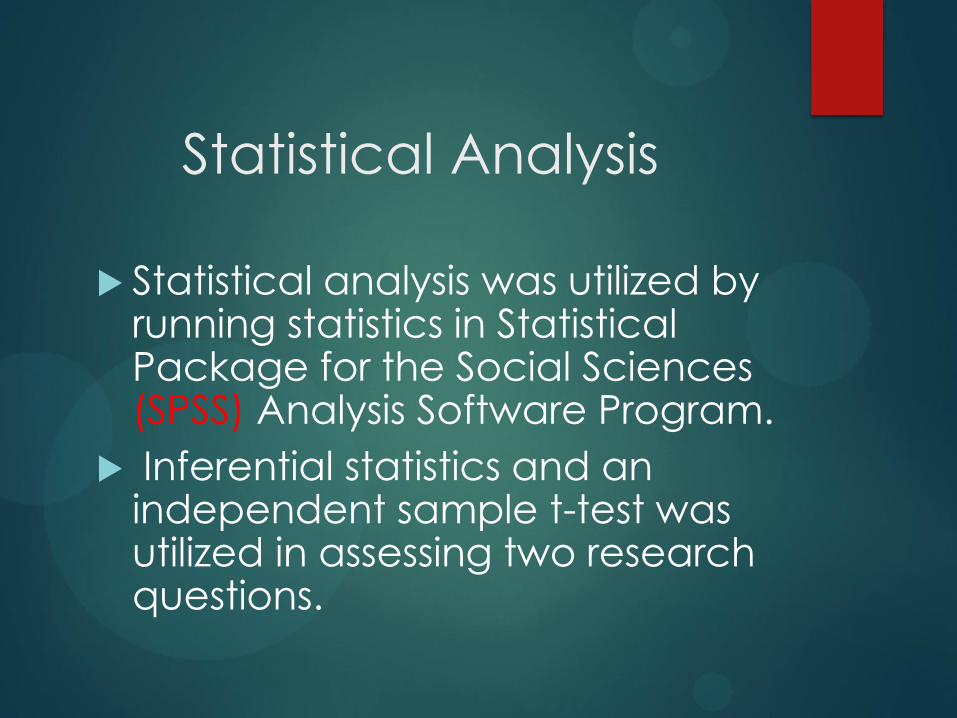
Statistical Analysis
Statistical analysis was utilized by running statistics in Statistical Package for the Social Sciences (SPSS) Analysis Software Program.
Inferential statistics and an independent sample t-test was utilized in assessing two research questions.
Chapter 4: Findings & Analysis
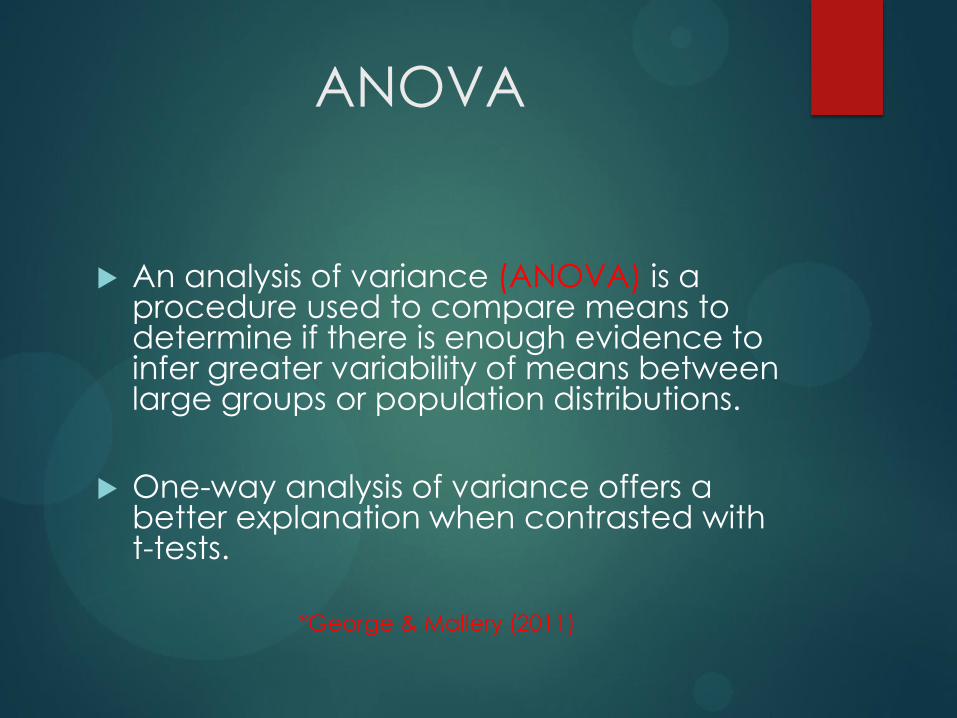
ANOVA
An analysis of variance (ANOVA) is a procedure used to compare means to determine if there is enough evidence to infer greater variability of means between large groups or population distributions.
One-way analysis of variance offers a better explanation when contrasted with t-tests.
*George & Mallery (2011)
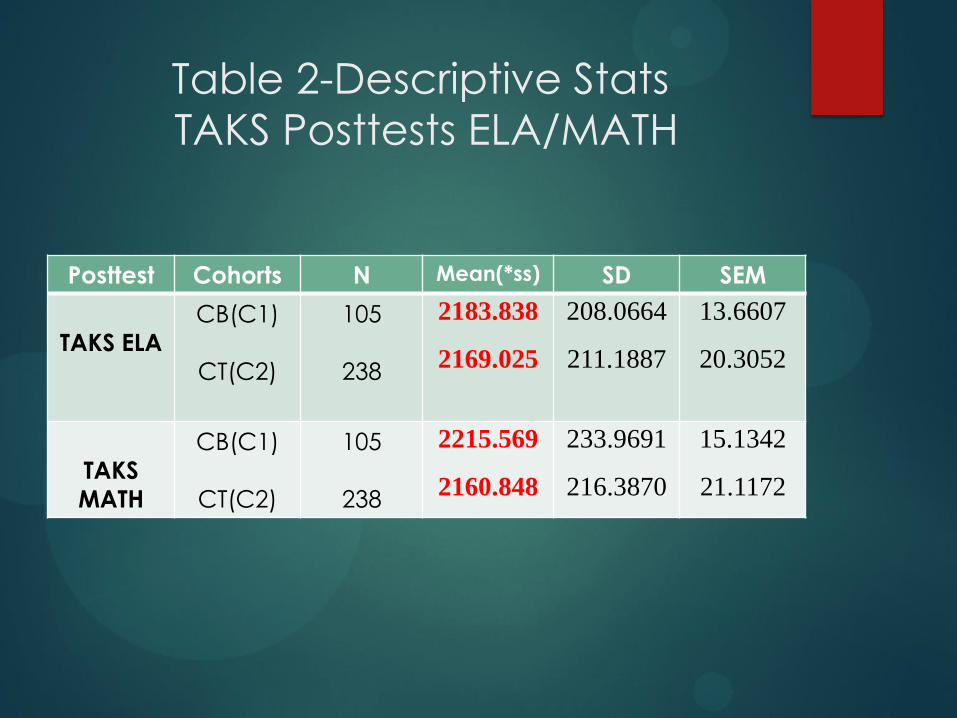
Table 2-Descriptive Stats
TAKS Posttests ELA/MATH
Posttest Cohorts N Mean(*ss) SD SEM
TAKS ELA
CB(C1)
CT(C2)
105
238
2183.838
2169.025
208.0664
211.1887
13.6607
20.3052
TAKS
MATH
CB(C1)
CT(C2)
105
238
2215.569
2160.848
233.9691
216.3870
15.1342
21.1172
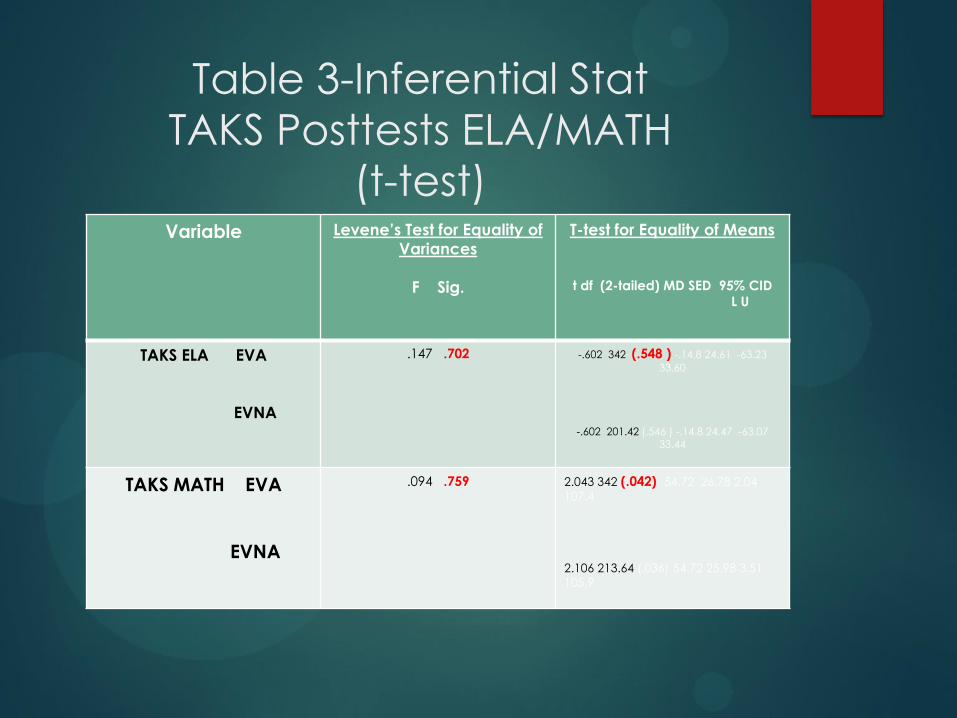
Table 3-Inferential Stat
TAKS Posttests ELA/MATH
(t-test) Variable Levene’s Test for Equality of
Variances
F Sig.
T-test for Equality of Means
t df (2-tailed) MD SED 95% CID
L U
TAKS ELA EVA
EVNA
.147 .702
-.602 342 (.548 ) -.14.8 24.61 -63.23
33.60
-.602 201.42 (.546 ) -.14.8 24.47 -63.07 33.44
TAKS MATH EVA
EVNA
.094 .759
2.043 342 (.042) 54.72 26.78 2.04
107.4
2.106 213.64 (.036) 54.72 25.98 3.51
105.9
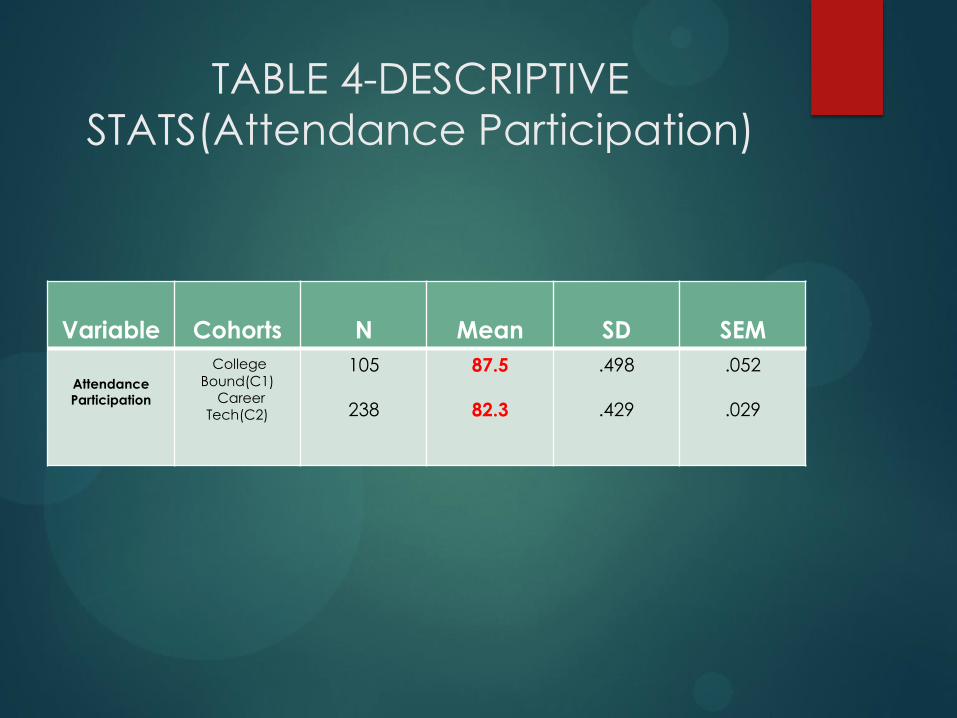
TABLE 4-DESCRIPTIVE
STATS(Attendance Participation)
Variable
Cohorts
N
Mean
SD
SEM
Attendance
Participation
College
Bound(C1) Career Tech(C2)
105
238
87.5
82.3
.498
.429
.052
.029
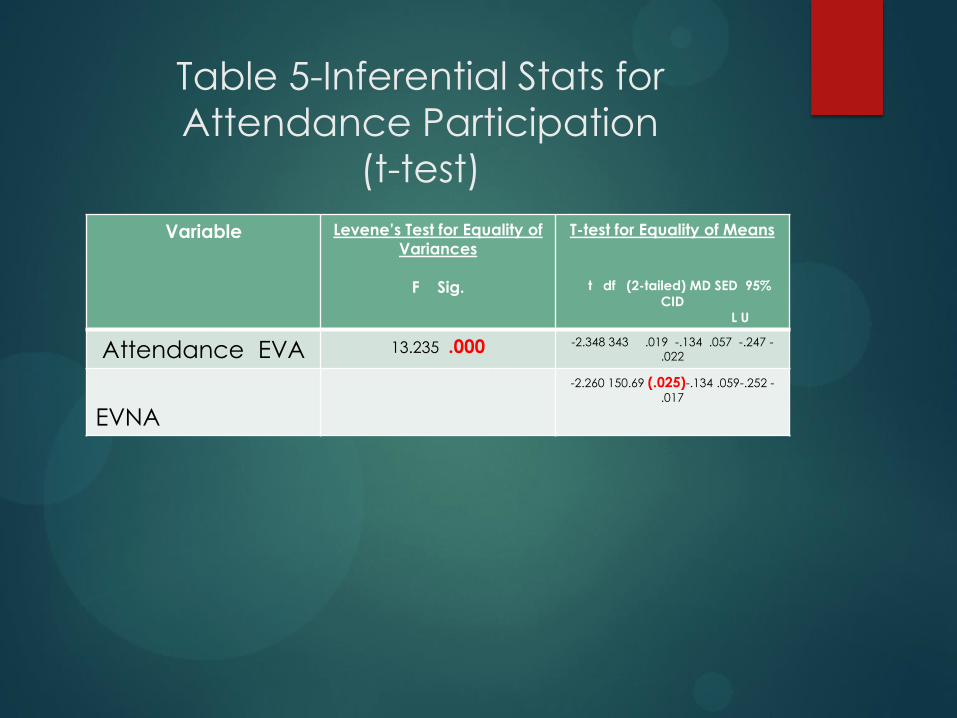
Table 5-Inferential Stats for
Attendance Participation
(t-test)
Variable Levene’s Test for Equality of
Variances
F Sig.
T-test for Equality of Means
t df (2-tailed) MD SED 95%
CID
L U
Attendance EVA 13.235 .000 -2.348 343 .019 -.134 .057 -.247 -
.022
EVNA
-2.260 150.69 (.025)-.134 .059-.252 -
.017
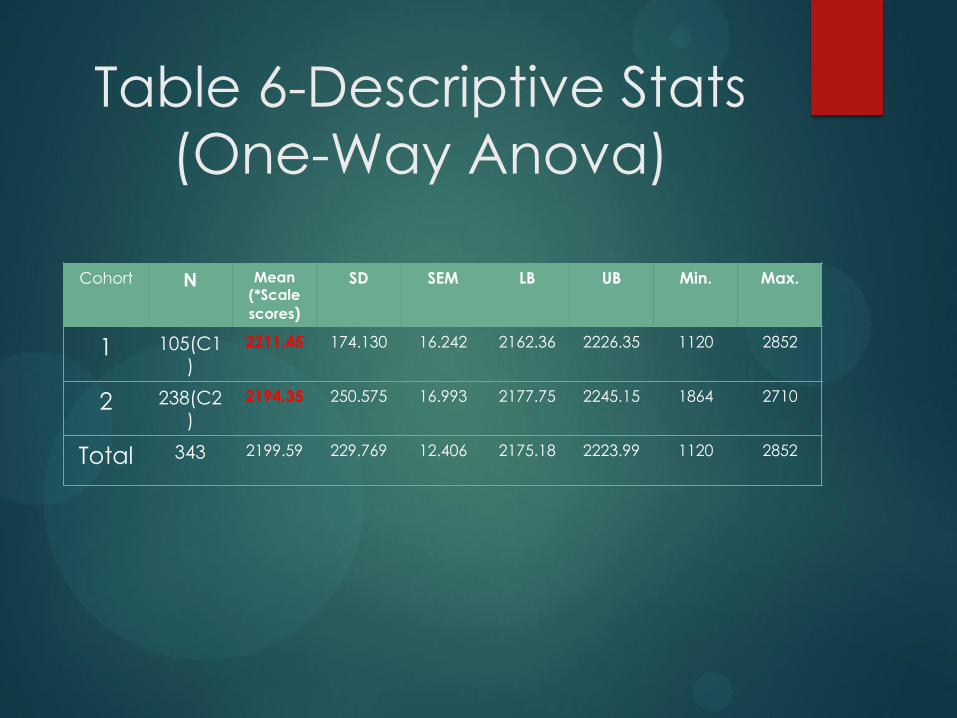
Table 6-Descriptive Stats
(One-Way Anova)
Cohort N Mean (*Scale
scores)
SD SEM LB UB Min. Max.
1 105(C1)
2211.45 174.130 16.242 2162.36 2226.35 1120 2852
2 238(C2)
2194.35 250.575 16.993 2177.75 2245.15 1864 2710
Total 343 2199.59 229.769 12.406 2175.18 2223.99 1120 2852
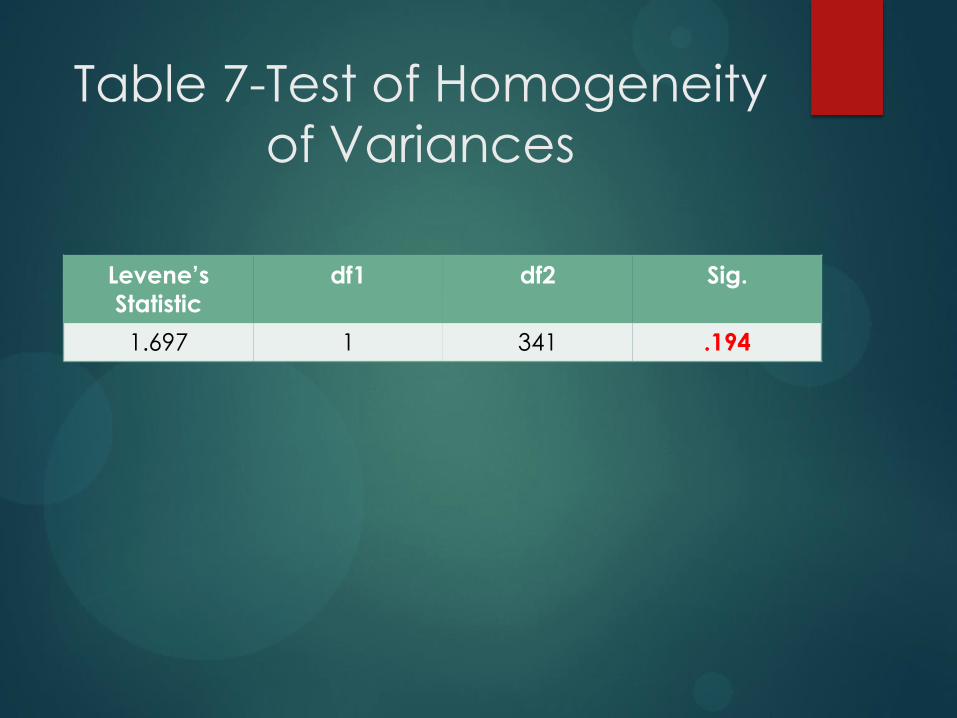
Table 7-Test of Homogeneity
of Variances
Levene’s
Statistic
df1 df2 Sig.
1.697 1 341 .194
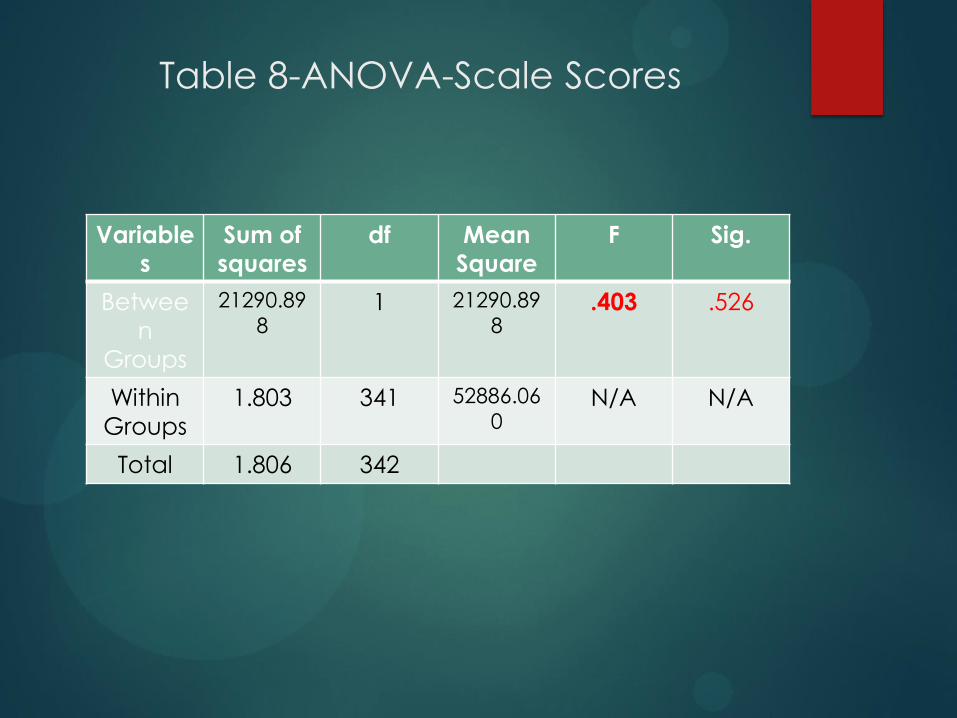
Table 8-ANOVA-Scale Scores
Variable
s
Sum of
squares
df Mean
Square
F Sig.
Betwee
n
Groups
21290.89
8 1 21290.89
8 .403 .526
Within
Groups
1.803 341 52886.06
0 N/A N/A
Total 1.806 342
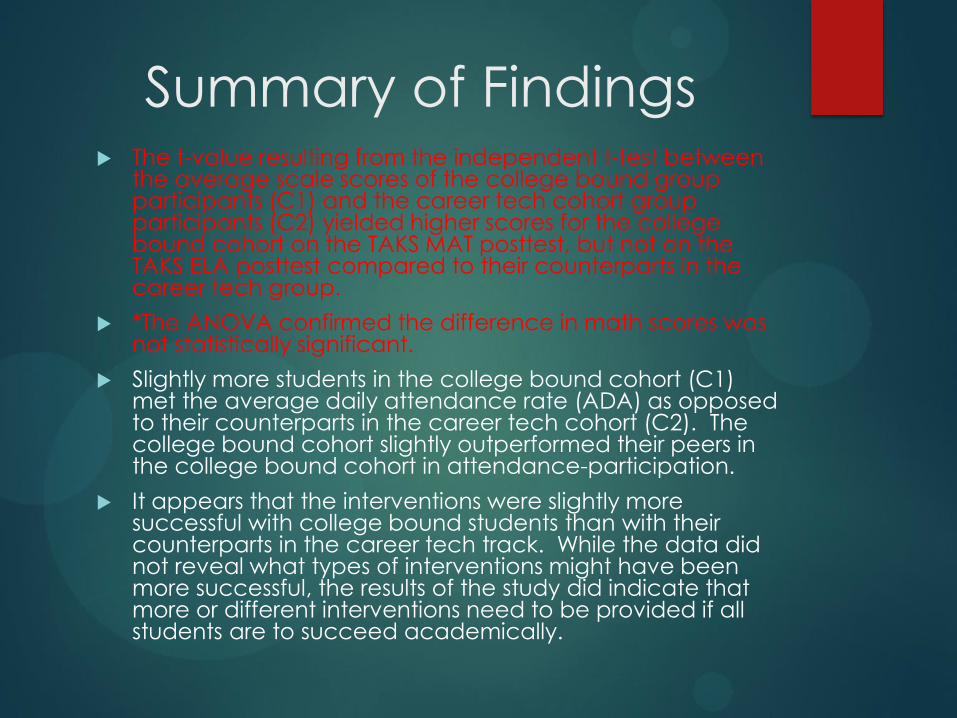
Summary of Findings
The t-value resulting from the independent t-test between the average scale scores of the college bound group participants (C1) and the career tech cohort group participants (C2) yielded higher scores for the college bound cohort on the TAKS MAT posttest, but not on the TAKS ELA posttest compared to their counterparts in the career tech group.
*The ANOVA confirmed the difference in math scores was not statistically significant.
Slightly more students in the college bound cohort (C1) met the average daily attendance rate (ADA) as opposed to their counterparts in the career tech cohort (C2). The college bound cohort slightly outperformed their peers in the college bound cohort in attendance-participation.
It appears that the interventions were slightly more successful with college bound students than with their counterparts in the career tech track. While the data did not reveal what types of interventions might have been more successful, the results of the study did indicate that more or different interventions need to be provided if all students are to succeed academically.

Chapter 5:
Recommendations
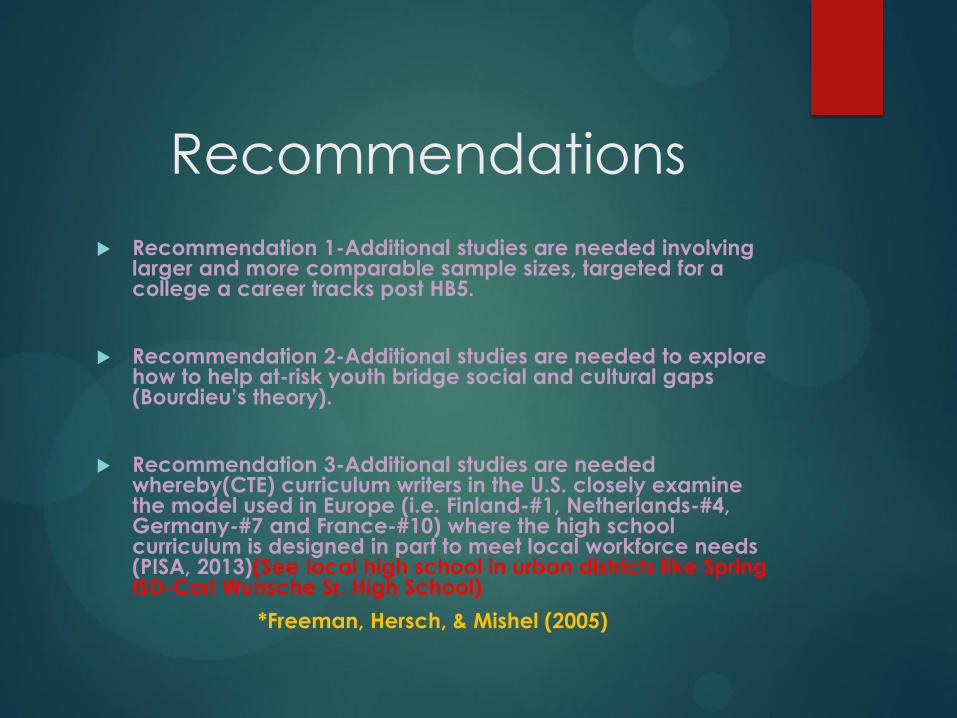
Recommendations
Recommendation 1-Additional studies are needed involving larger and more comparable sample sizes, targeted for a college a career tracks post HB5.
Recommendation 2-Additional studies are needed to explore how to help at-risk youth bridge social and cultural gaps (Bourdieu’s theory).
Recommendation 3-Additional studies are needed whereby(CTE) curriculum writers in the U.S. closely examine the model used in Europe (i.e. Finland-#1, Netherlands-#4, Germany-#7 and France-#10) where the high school curriculum is designed in part to meet local workforce needs (PISA, 2013)(See local high school in urban districts like Spring ISD-Carl Wunsche Sr. High School)
*Freeman, Hersch, & Mishel (2005)
Future Research
This study expanded on the research of James
and Cabrera
The aforementioned study (J & C, 2007) also explored the impact of increased student
achievement and attendance in a college and
career preparatory program.
However, part of the problem is the limited
number of multi-year studies in which researchers
compare the effectiveness of pre-college
interventions and activities with at-risk youth in
high schools in urban districts.
Future Research cont’d.
Results of this study and other multi-year studies will help increase awareness regarding the need for curriculum change which strengthens and supports HB5 (which ultimately will impact, transform, and inform the decision making process as it relates to changing curriculum better suited for our at-risk high school youth attending urban districts).
Better meet high school students’ skill-set, students should increase their academic achievement, which will in turn positively impact graduation rates (AYP).
Catalyst for change in other urban districts.
References Ahmnad, S.C. (2005). Optimizing Historical Black Colleges and Universities Entrance
Rates. The Network Journal, 8(1),73-82.
American Recovery and Reinvestment Act of 2009, S. 17, 111-5 Cong. (2009).
Balfanz, V., Bridgeland, G., Bruce, E. & Fox, H. (2013). Building A Grad Nation:
Progress and Challenge in Ending the High School Dropout Epidemic. Alliance
for Excellent Education, 45(12),89.
Bensimon, E.M.(2005). Closing the achievement gap in higher education: An
organizational learning perspective. Organizational learning in Higher Ed
131(3). San Francisco: Jossey-Bass.
Bourdieu, P. (2001). Social Capital: Its Origins and Applications in Modern Sociology.
Dept. of Sociology, Princeton University: New Jersey 08540.
Bourdieu, P. (1977). The Peculiar History of Scientific Reason. Sociological Forum,
6(1),3.
Bourdieu, P. (1984). The Peculiar History of Scientific Reason. Sociological Forum,
48(9), 18.
Bourdieu, P., & Passeron, J. (1977). Social Capital Theory: Two Concepts. Dept. of
Sociology, Princeton University: New Jersey.
Bruner, A. (2011). Jeff Davis Historical Data. Houston ISD, AEIS Report. Retrieved from
http://www. houstonisd/aeis.edu.

Cabrera, A., Nora, A., & Asker, E. H. (2003). Part I: Revising Tiato's Theory: Economic
Influences on Persistence Reconsidered. Reworking the Student Departure Puzzle
(pp. 29-47). Vanderbilt University Press.
Carnoy, M. (1994). Making the Grade. Dissent (00123846), 51(4),93.
Carnoy, M., Loeb, S., & Smith, T. (2001). Do Higher Test Scores in Texas Make for
Better High School Outcomes? Educational Measurement: Issues and Practice,
24(4), 19-31.
Chen, A., & Kaufman, P. (2009). Dropouts who complete high school with a diploma or
GED. Paper presented at annual meeting of the American Educational Research
Association,San Francisco, Calif., March.
Chubb, A., & Loveless, T. (2002). Comparing New School Effects in Charter and
Traditional Public Schools. The American Journal of Education, 118(4), 427-
453.
Coleman, E. (1966). The Coleman Report. The American Journal Of Sociology, 109( 2).
Coleman, J. (1987). Social Capital and the Creation of Human Capital. The American
Journal Of Sociology, 94( 1).
Coleman, J. (1988). Social Capital and the Creation of Human Capital. The American
Journal Of Sociology.102(30).
Creswell, J.W. (2008). Educational research: Planning, Conducting, and Evaluating
Quantitative and Qualitative Research, 59-62, Saddle River, NJ:
Pearson Prentice Hall.

Darling-Hammond, L., & Vasquez-Heilig, C. (2008). Restoring Our Schools: The Quest
For Equity in the United States. Education Canada, 51(5), 14-18.
Dworkin, T., & Toenjes, R. (2002). Efficacy of Test Scores. Applied Measurement In
Education, 13(2), 139-160. doi:10.1207/S15324818AME1302_2.
Education Commission of the States. (2010). The Condition of Education. 2010 (NCES
2010-045). Retrieved from http://www.nces.ed.gov/pubs2010/2010006.pdf.
Education Trust. (1999). The American Achievement Gap 1999 (NCES
1999-07). Retrieved from http://www.educationtrust.gov.
Federal Reserve Bank of Dallas Report. (2005, October 25) [Clipping from an
unidentified Dallas, TX newspaper]. Copy in possession of author.
Foley, M. W., McCarthy, B.W. & Chaves, T. (2001). Much Ado about Social Capital.
Contemporary Sociology, 30(3), 227-230.
Gittell, M. & Thompson, V. (2001). Social Capital and Social Change. Urban Affairs
Review, 36(2), 123-147.
Goddard, R. (2003). A Social Capital’s Perspective on Student’s Chance for Success.
Educational Evaluation and Policy Analysis, 25(1), 59-74.
Gomperts, J. (2013). National Grad Report. Alliance Schools Report. Retrieved from
http://www.allianceschoolsreport.com.
Greene, J., & Forrester, H. (2003). Graduation Statistics: Caveat Emptor. Education
Week, 21(18), 52-53.
Greismer, M. (2011). Dropout Statistics in Texas, Education Week, 78(9), 101-109.