students’ perception of service quality in higher education
TRANSCRIPT

8/12/2019 STUDENTS’ PERCEPTION OF SERVICE QUALITY IN HIGHER EDUCATION
http://slidepdf.com/reader/full/students-perception-of-service-quality-in-higher-education 1/31
SCHOOL OF MANAGEMENT
STUDENTS’ PERCEPTION OF
SERVICE QUALITY IN HIGHER
EDUCATION Minor Project Report in
SERVICE OPERATIONS MANAGEMENT
Submitted by:
Ashish Vishwananth Prakash
Niranjan N Naik
Prashanth Kumar
Submitted To:
Prof. Yogesh Pai

8/12/2019 STUDENTS’ PERCEPTION OF SERVICE QUALITY IN HIGHER EDUCATION
http://slidepdf.com/reader/full/students-perception-of-service-quality-in-higher-education 2/31
Introduction
Service quality has attracted considerable attention within the higher education sector. Although
many works have been carried out in this particular area, there are many areas of disagreement in
the debate over how to measure service quality, and recent research has raised many questions
over the principles on which the existing instruments are founded. Many generic instruments
have been tested with some degree of success in wide-ranging service industries, but their
replication in higher education sector is still hazy. Recent Literature also tells about industry
specific scales to measure service quality. In this present study one of such scales (jain et al.,
2012) have been chosen to measure service quality in manipal university. This research also tries
to figure ou the relationship between service quality, satisfaction and behavioral intentions in a
typical education sector.
1.1 Defining service
Palmer (2011) defines a service as “The production of an essentially intangible benefit, either in
its own right or as a significant element of a tangible product, which through some form of
exchange, satisfies an identified need.” Alternatively, Lovelock & Wright (1999) adopt a more
infor mal approach, defining a service as “Something that may be bought and sold but that cannot
be dropped on your foot.” According to some researchers service is basically the creation of
value for the buyer that attracts the buyer to try it and it cannot be commented until tested (Guo,
2002; Awan, et al., 2008; Ham, et al., 2003; Wang,et al., 2008).
According to Valarie Zeithaml & Mary Jo Bitner (1996) services are deeds, processes, and
performances. James Fitzsimmons defines service as a time-perishable, intangible experience
performed for a customer acting in the role of a co-producer. Despite more than 25 years of
study, scholars in the field of services management do not agree on what a service is. Indeed,
instead of coming closer to a definition they seem to be less certain Farmer and Nollet (1999).
1.2 Importance of service sector
According to Zeithaml et al. (1993), services marketing did not emerge as a distinct research
discipline until the late 1970s. In less than four decades services have become the dominant form
of economic activity and are now playing an increasingly important role in the economy of many

8/12/2019 STUDENTS’ PERCEPTION OF SERVICE QUALITY IN HIGHER EDUCATION
http://slidepdf.com/reader/full/students-perception-of-service-quality-in-higher-education 3/31
nations (Abdullah, 2006a). There appears to be a positive relationship between economic
development of a country and its service sector; developed economies are increasingly more
service orientated (Palmer, 2011).In conjunction to this trend, the construct of service quality has
become an extremely topical issue within the services literature (Baron et al., 2009). The
provision of good service quality is commonly associated with increased profitability, customer
satisfaction, customer loyalty, customer retention, customer attraction and positive word of
mouth (Abdullah, 2006a; Nadiri et al., 2009; Voss et al., 2007).
1.3 Higher Education as a Service
DeShields et al. (2005) argue that it is essential for higher education management to apply
market-orientated principles and strategies that are used in profit-making institutions. According
to Oldfield and Baron (2000), higher education can be seen as a “pure service,” suggesting that it
possesses all the unique characteristics of a service .More recently, Gruber et al. (2010) assert
that higher education is a service that is predominantly intangible, perishable and heterogeneous.
1.4 The Student as the Primary Stakeholder
In higher education, the definition of customer is quite different from the manufacturing or
general services since groups such as students, employers, academic staff, government and
families are all customers of the education system with a diversity of requirements. Identifying
the primary stakeholder in higher education is problematic (Cuthbert, 1996a) .Hill (1995) claims
that students are the primary stakeholders of higher education services in the UK. In British
higher educations, students must now be considered ‘primary customers’ (Crawford,
1991).Gruber et al. (2010) contend that students are the specific and primary target audience,
stressing the need for academic administrators to focus on understanding their requirements.
Furthermore, it is important to satisfy students, since satisfied students will recommend the
service to other prospective students and will also be more likely to continue the relationship
with the service provider (Munteanu et al., 2010).
1.5 Defining Service Quality
Many researchers have termed service quality an ‘elusive’ and ‘indistinct’ construct that is
difficult to define and measure (Bolton and Drew, 1991; Carman, 1990; Cronin and Taylor,
8/12/2019 STUDENTS’ PERCEPTION OF SERVICE QUALITY IN HIGHER EDUCATION
http://slidepdf.com/reader/full/students-perception-of-service-quality-in-higher-education 4/31
1992; Parasuraman et al., 1988).Crosby (1979 ) provides one of the earliest definitions of quality,
suggesting that it is “the conformation to specifications. Lewis and Booms (1983, p. 100) were
one of the first to define quality in terms of services, defining service quality as: “a measure of
how well the service level delivered matches customer’s expectations.” This definition was
further developed by Parasuraman et al. (1988), who argue that service quality stems from a
comparison of a consumer’s general expectations with their actual perceptions of a firm.
Alternatively authors such as Berry et al. (1988), propose that service quality is an overall
evaluation similar to an attitude.
Due to the subjective nature of service quality (Rust and Oliver, 1994), the services marketing
literature focuses on quality in terms of perceived service quality (Nadiri et al., 2009). Perceived
service quality results from the comparison of customer service expectations with their
perceptions of actual performance (Zeithaml et al., 1990).Athiyaman (1997) extended this idea,
claiming that perceived service quality is an overall evaluation of the goodness or badness of a
product or service. Hill (1995) adds to the complexity of perceived service quality, stating that
the service does not just depend on the service provider, but also on the performance of the
consumer. The co-production of services is of greatest concern to an organization when
customers are more involved in the production process (Palmer, 2011). This is extremely
significant in the context of higher education, as the participation of the student is vital since they
play a large role in determining the success of the service.
1.6 Importance of service quality
Baron et al., (2009, p. 167) maintain that Service quality is the single most researched area in
services marketing to date.Poor quality places the firm at a disadvantage to the rest of the
competition, potentially driving away dissatisfied customers (Lovelock and Wirtz, 2011). Where
there is competition, the quality of the service experience becomes an important factor in buyer
decision-making (Cuthbert, 1996a).Improving service quality is crucial for gaining a competitiveadvantage (Baron et al., 2009; Parasuraman et al., 1985).
Service quality is particularly important for organisational growth and differentiating one service
experience from another (Parasuraman et al., 1985). Researchers over the years claims that
service quality is the most researched topic due to its supposed relationship with costs (Crosby,

8/12/2019 STUDENTS’ PERCEPTION OF SERVICE QUALITY IN HIGHER EDUCATION
http://slidepdf.com/reader/full/students-perception-of-service-quality-in-higher-education 5/31
1979), profitability (Rust and Zahorik, 1993), customer satisfaction (Cronin and Taylor, 1992),
customer retention (Bolton and Drew, 1991), and positive word-of-mouth (Stodnick and Rogers,
2008).
1.7 Service Quality in Higher Education
A number of different definitions has been given concerning quality in Higher Education, each
one representing a different view, including: exceptional, perfection, as fitness for purpose, value
for money (Harvey and Green, 1993), the stakeholder perspective of quality (Middlehurst, 1992),
degree to which the previously set objectives are met (Vroeijenstijn, 1992).
According to Sultan and Wong (2010), service quality research in the higher education sector is
relatively new, at least when compared to that of the commercial sector. With significant changes
taking place in higher education institutions over the last decade, it seems that higher education
should be regarded as a business-like service industry, which focuses on meeting and exceeding
the needs of students (Gruber et al., 2010). Students look for evidence of quality of services
when making an uncertain and high risk decision of choosing a university (Angell et al., 2008;
Donaldson and McNicholas, (2004). The customer-centric approach (or student-centred
approach) of service quality in educational literature has gained momentum as the increasing
cost of education has created a new generation of students with greater awareness than ever
before (Stodnick and Rogers, 2008).
Abdullah, (2006) states that achieving quality has become an important goal for most higher
education institutions knowing the strengths and weaknesses of different factors and their
relative influence may lead to better allocation of resources, resulting in students being provided
with an improved service . Aly & Akpovi,(2001) says that service quality is essential not only for
success but at times for survival as well, even in case of higher education. Nadiri et al. (2009)
point out that it is crucial for higher education providers to understand students’ expectations and
perceptions of what constitutes a quality service in order to attract students and serve their needs.
1.8 Measurement models of service quality
“There does not seem to be a well-accepted conceptual definition and model of service quality
nor is there any generally accepted operation definition of how to measure service quality.” Seth
8/12/2019 STUDENTS’ PERCEPTION OF SERVICE QUALITY IN HIGHER EDUCATION
http://slidepdf.com/reader/full/students-perception-of-service-quality-in-higher-education 6/31
et al. (2005) .The constant struggle to measure the service quality has led to the creation of many
models. From 1988 to 2008, many Service Quality Measurement Models have been developed.
Despite numerous attempts by academics, no single model of service quality is universally
accepted (Clewes, 2003). Some of the important models are discussed below.
The Perceived Service Quality Model
It is based on the disconfirmation paradigm where the consumer compares their expectations
with their perceptions, and the quality of the service is determined by the outcome of this
evaluation process. Gronroos (1984) claims that two types of service quality exist, namely,
technical quality and functional quality. Technical quality relates to what is provided during the
service process (e.g. knowledge, tangibles and technical solutions). These are the relatively
quantifiable aspects of the service, which the customer and supplier can easily measure
(Gronroos, 1984). On the other hand, functional quality refers to how the service is provided and
the interpersonal behaviours contributed by the service employee during the service encounter. It
is more difficult to measure than technical quality (Gronroos, 1984). Gronroos (2007) proposes
that the gap between the expected service and perceived service is of utmost importance and that
it is vital for a service organisation to keep this gap as small as possible. In addition, it is
important for managers to understand how the technical quality and functional quality of a
service is influenced, and how customers perceive these quality dimensions (Gronroos, 2007) to
ensure perceived service quality is maximized.
SERVQUAL MODEL
In 1988, Parasuraman, et al. developed a model to measure Quality in service sector. The model
was named as “SERVQUAL” relating to service quality. Parasuraman, et al. (1988, p.17)
configured different factors that define quality in service sector and narrowed them to 10
dimensions namely, ‘(a) tangible, (b) reliability, (c) responsiveness, (d) communication, (e)
credibility, (f) security, (g) competence, (h) courtesy, (i) understanding and knowing the
customer and ( j) access’. The concept of Service Quality explained by Parasuraman, et al. (1988,
p.16) as, ‘service quality as perceived by the customer, stems from a comparison of what they
feel service firm should offer (i.e. from their expectations) with their perceptions of the
performance of firms providing the services’. Eventually five dimensions were formed in the end

8/12/2019 STUDENTS’ PERCEPTION OF SERVICE QUALITY IN HIGHER EDUCATION
http://slidepdf.com/reader/full/students-perception-of-service-quality-in-higher-education 7/31
of the empirical research. Three of the dimensions were original taken whereas the two were
correlated and the rest of the dimensions were discarded. Parasuraman, et al. (1998, p.23)
defined five dimensions as ‘(a) Tangibles: Physical facilities, equipment and appearance of
personnel, (b) Reliability: Ability to perform the promised service dependably and accurately, (c)
Responsiveness: Willingness to help customers and provide prompt service, (d) Assurance:
Knowledge and courtesy of employees and their ability to convey trust and confidence, (e)
Empathy: Caring, individualized attention the organization provides to its customers’.
One of the most controversial issues is the reliability of SERVQUAL (Nadiri et al., 2009).
Firstly, the dimensions are not generic; that is, the applicability of the SERVQUAL scale to
different service settings is questionable (Abdullah, 2006a). Secondly, it is argued that the five
dimensions are not universal, since the number of dimensions comprising service quality is
contextualised (Buttle, 1995). criticisms aimed at SERVQUAL, as an instrument for general use,
is that Parasuraman et al. (1994) did not include some services, which are high in customer
contact or intervention.
SERVPERF Model
Cronin and Taylor (1992) were one of the first authors to criticise the reliability and validity of
the SERVQUAL model. In response to the limitations of the SERVQUAL model, Cronin and
Taylor (1992) developed the SERVPERF scale, which was born out of the inadequacies of
SERVQUAL.
This led to the development of a more direct form of measurement that utilised an attitudinal
rather than a disconfirmation paradigm (Cronin and Taylor, 1992). The SERVPERF approach
requires the customer to rate only the service provider’s performance in a particular service
encounter. Empirical results suggest that SERVPERF offers better reliability than SERVQUAL,
illustrating that expectations can be disregarded for assessment (Cronin and Taylor, 1992). In
response to this, Parasuraman et al. (1994) defended the inclusion of expectations suggesting that
the diagnostic value of SERVQUAL offsets the instrument loss of predictive power. Despite this,
a recent study concluded that both the SERVPERF and SERVQUAL scales are adequate
predictors of overall service quality (Carrillat et al., 2007). .Evidence of the application of the
SERVPERF model in the higher education context can be uncovered. Many researchers have
8/12/2019 STUDENTS’ PERCEPTION OF SERVICE QUALITY IN HIGHER EDUCATION
http://slidepdf.com/reader/full/students-perception-of-service-quality-in-higher-education 8/31
preferred this methodology to SERVQUAL and have used an adapted performance version of
SERVQUAL to measure the perceptions of service quality and evaluate students’ course
experience (see e.g. Abdullah, 2006a; Hill, 1995; McElwee and Redman, 1993; Oldfield and
Baron, 2000; Rigotti and Pitt, 1992).
The HEdPERF Model
Despite the emergence of the SERVQUAL and SERVPERF models, it has been suggested that
industry-specific service quality measures may prove more relevant (Carman, 1990; Cronin and
Taylor, 1992; Zeithaml et al., 1985). Generic measures (e.g. SERVQUAL and SERVPERF) of
service quality may not be totally suitable for assessing perceived quality in higher education
(Abdullah, 2006a), creating the need for an instrument specific to the higher education sector.
The model is an adaptation of the standard SERVPERF model (see e.g. Cronin and Taylor,
1992), adopting a perceptions-only approach. Abdullah (2006a) states that the aim of this model
is to capture a context specific view of service quality in higher education, enabling the whole
student experience to be measured. The instrument measures 41-items and each item have been
tested for reliability and validity, using both types of factorial analysis, exploratory and
confirmatory (Abdullah, 2006a). comparative results show that the HEdPERF scale captures
more variance relative to that of the SERVPERF scale (Sultan and Wong, 2010).
In particular, research findings confirm that students’ perceptions of service quality can be
determined by evaluating six dimensions, specifically, non-academic aspects, academic aspects,
reputation, access, programme issues and understanding.
EDUQUAL Model
Mahapatra and Khan (2007) proposed the “EduQual,” an instrument to measure service quality
in technical education with the following dimensions, namely, learning outcomes,
responsiveness, physical facilities, personality development and academics. This model was a
modified version of the previous SERVQUAL model. Purpose of this model was to measure the
influence of individual cultural values on student service expectations of quality in cross border
higher education.

8/12/2019 STUDENTS’ PERCEPTION OF SERVICE QUALITY IN HIGHER EDUCATION
http://slidepdf.com/reader/full/students-perception-of-service-quality-in-higher-education 9/31
Chapter 2 Research design
Objectives:
1. To assess the students perception of service quality in Manipal university using a scale
developed by jain et al.,( 2012).
2. To identify the important dimensions of service quality.
3. To examine the relationship between service quality dimensions and students satisfaction.
4. To examine the relationship between satisfaction and behavioral intentions.
Research methodology
This study was carried out to analyse the students perception of service quality among students
of manipal university under various streams of study.
Research frame work
As per this particular frame work (Atheeyaman,2007), service quality is an independent variable
which invokes satisfaction and further behavioral intentions are influenced by dependent variable

8/12/2019 STUDENTS’ PERCEPTION OF SERVICE QUALITY IN HIGHER EDUCATION
http://slidepdf.com/reader/full/students-perception-of-service-quality-in-higher-education 10/31
satisfaction. This model also take into consideration the influence of service quality on the
behavioral intentions.
Research instrument
A Structured questionnaire consisting of 40 items for measuring service quality (Jain et al.,
2012),6 items for measuring satisfaction (Atheeyaman,2007),3 items for measuring behavioral
intentions (Atheeyaman,2007) and a global item to measure overall service quality was
administered to 300 respondents using convenience sampling method.
Sample size
Questionnaire was administered to 300 repondents by using convenience sampling method .Only
287 among 300 respondents filled the questionnaire. Previous studies conducted in similar area
used 170 (Angell et al., 2008) ,100 (Hussain et al., 2009),155 (Sumaedi, et al., 2012) as sample
size.
Analysis and interpretation
The data was analyzed using SPSS package. Pearson’s Correlation was used to identify the
relationship between dimensions of service quality and overall service quality and between
satisfaction, overall service quality and behavioral intentions. Reliability of scale was tested
using cronbach’s alpha test. Factor analysis was also done to examine the construct validity.

8/12/2019 STUDENTS’ PERCEPTION OF SERVICE QUALITY IN HIGHER EDUCATION
http://slidepdf.com/reader/full/students-perception-of-service-quality-in-higher-education 11/31
Chapter 3 Data analysis and interpretation
Demographic Profile
The personal profile of the respondents is vital to the study as it forms a basis of comparison
respondents with different demographic profile. The expectation and habit may vary among
respondents of different demographic profile.
Interpretation:
In our research we obtained the data, the analysis of which is as above. From this we
infer that majority of the respondents are female which constitutes 55.05% and 44.95% male.
8/12/2019 STUDENTS’ PERCEPTION OF SERVICE QUALITY IN HIGHER EDUCATION
http://slidepdf.com/reader/full/students-perception-of-service-quality-in-higher-education 12/31
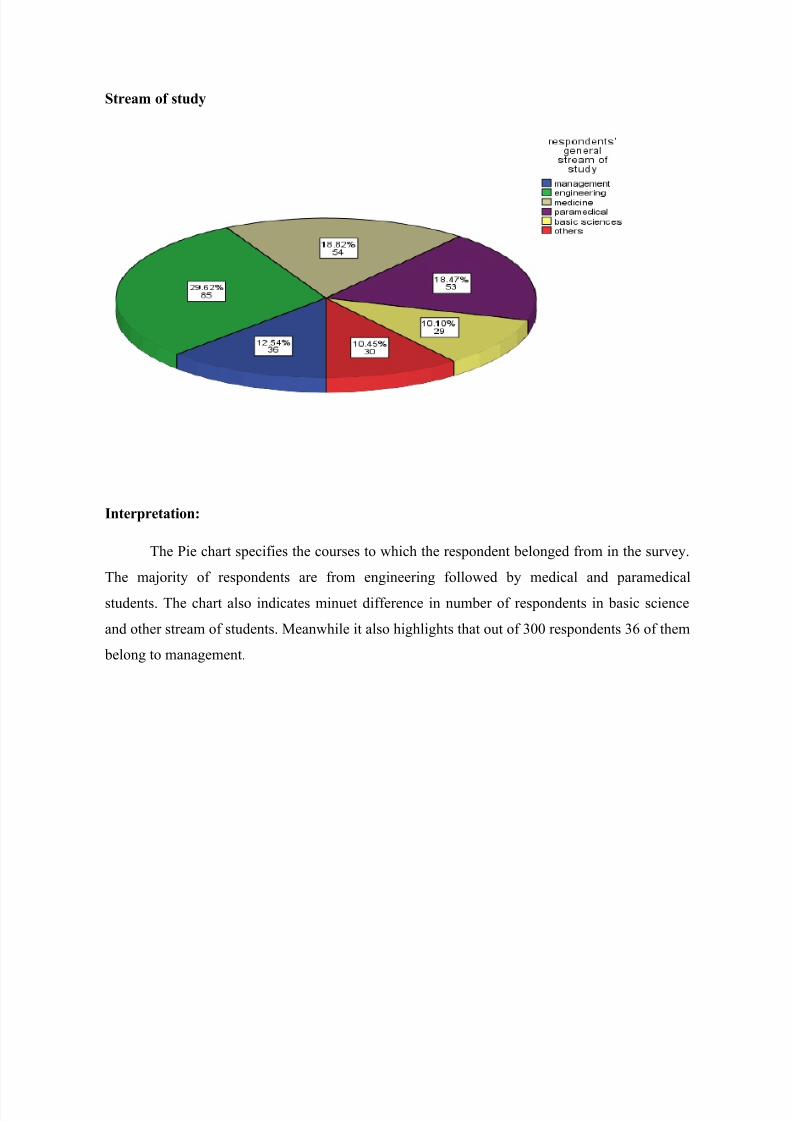
Stream of study
Interpretation:
The Pie chart specifies the courses to which the respondent belonged from in the survey.
The majority of respondents are from engineering followed by medical and paramedical
students. The chart also indicates minuet difference in number of respondents in basic science
and other stream of students. Meanwhile it also highlights that out of 300 respondents 36 of them
belong to management.

8/12/2019 STUDENTS’ PERCEPTION OF SERVICE QUALITY IN HIGHER EDUCATION
http://slidepdf.com/reader/full/students-perception-of-service-quality-in-higher-education 13/31
Overall service quality
Interpretation:
From the above graph we have found that the mean value is 3.32. If the mean is more
than 3, then that mean result falls in the range in between agree and neither agree nor disagree.

8/12/2019 STUDENTS’ PERCEPTION OF SERVICE QUALITY IN HIGHER EDUCATION
http://slidepdf.com/reader/full/students-perception-of-service-quality-in-higher-education 14/31
Overall service quality is high * gender of the respondents Cross tabulation
Count
gender of the
respondents
Total
male female
overall service quality
is high
strongly disagree 5 8 13
disagree 22 34 56
neither agree nor
disagree40 47 87
agree 44 43 87
strongly agree 18 26 44Total 129 158 287
Overall service quality is high * respondents' general stream of study cross tabulation
Respondents' general stream of study Total
Management Engineering Medicine Paramedical Basic
sciences
Others
Overall service
quality is high
Strongly
disagree4 2 2 0 2 3 13
Disagree 6 14 13 12 5 6 56
Neither agree
nor disagree14 23 12 18 9 11 87
Agree 11 30 13 16 9 8 87
Strongly
agree1 16 14 7 4 2 44
Total 36 85 54 53 29 30 287
8/12/2019 STUDENTS’ PERCEPTION OF SERVICE QUALITY IN HIGHER EDUCATION
http://slidepdf.com/reader/full/students-perception-of-service-quality-in-higher-education 15/31
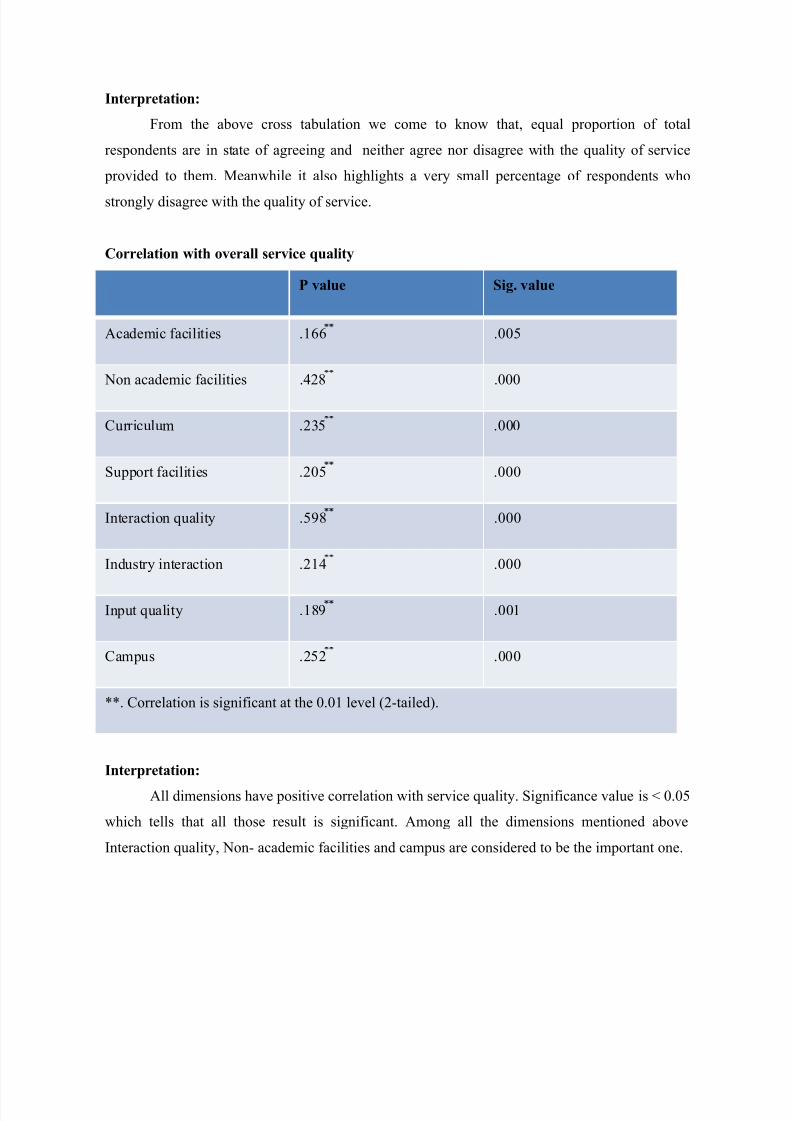
Interpretation:
From the above cross tabulation we come to know that, equal proportion of total
respondents are in state of agreeing and neither agree nor disagree with the quality of service
provided to them. Meanwhile it also highlights a very small percentage of respondents who
strongly disagree with the quality of service.
Correlation with overall service quality
P value Sig. value
Academic facilities .166 .005
Non academic facilities .428 .000
Curriculum .235 .000
Support facilities .205 .000
Interaction quality .598 .000
Industry interaction .214 .000
Input quality .189 .001
Campus .252 .000
**. Correlation is significant at the 0.01 level (2-tailed).
Interpretation:
All dimensions have positive correlation with service quality. Significance value is < 0.05
which tells that all those result is significant. Among all the dimensions mentioned above
Interaction quality, Non- academic facilities and campus are considered to be the important one.

8/12/2019 STUDENTS’ PERCEPTION OF SERVICE QUALITY IN HIGHER EDUCATION
http://slidepdf.com/reader/full/students-perception-of-service-quality-in-higher-education 16/31
Service quality * satisfaction
H01: service quality is not related to satisfaction
satisfaction
P value Sig. value
Overall service quality .540 .000
Interpretation :
In this study we have found out the correlation between service quality and satisfaction, we set a
null (H01) hypothesis saying service quality is not correlated with satisfaction of students. But
our study data proved that there is high positive correlation between service quality and
satisfaction with 0.540 as P value which is higher than 0.0 and significance level is less than (<)
0.05 that is 0.000 indicates that result is significant.
Service quality * behavioral intention
H02: service quality is not related to behavioral intention.
Service quality
P value Sig. value
Behavioral intention .348 .000
8/12/2019 STUDENTS’ PERCEPTION OF SERVICE QUALITY IN HIGHER EDUCATION
http://slidepdf.com/reader/full/students-perception-of-service-quality-in-higher-education 17/31
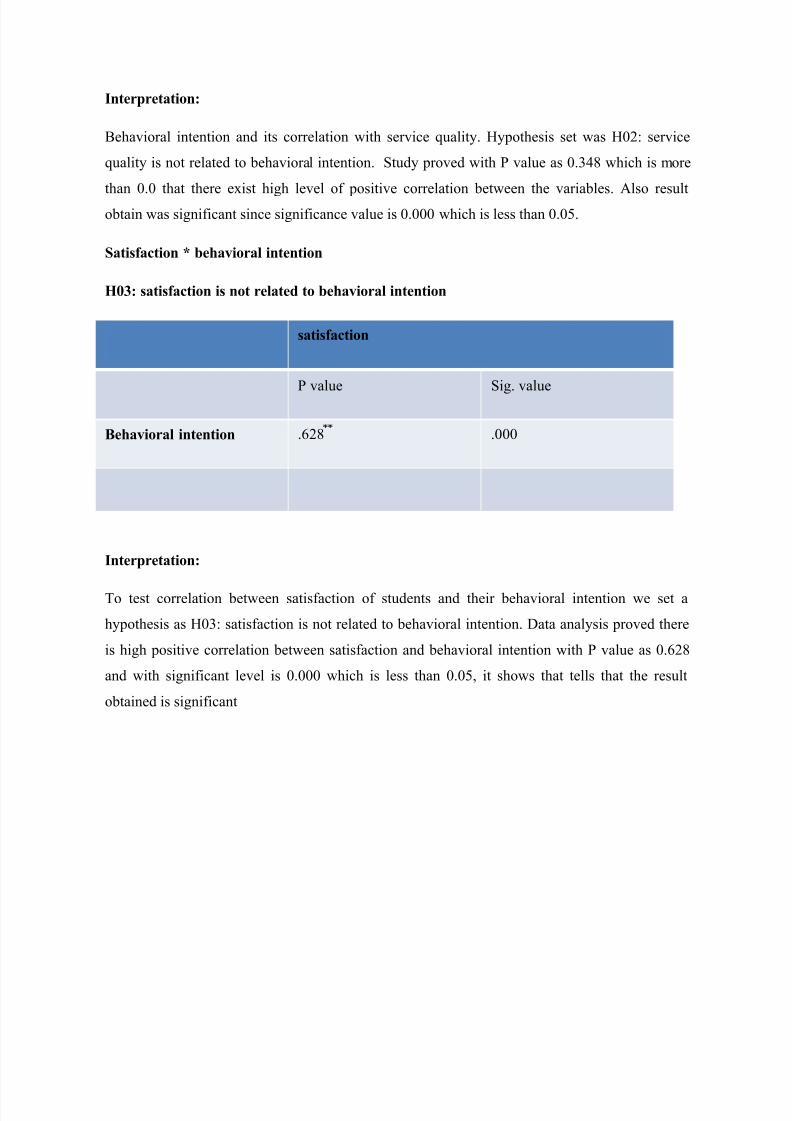
Interpretation:
Behavioral intention and its correlation with service quality. Hypothesis set was H02: service
quality is not related to behavioral intention. Study proved with P value as 0.348 which is more
than 0.0 that there exist high level of positive correlation between the variables. Also result
obtain was significant since significance value is 0.000 which is less than 0.05.
Satisfaction * behavioral intention
H03: satisfaction is not related to behavioral intention
satisfaction
P value Sig. value
Behavioral intention .628 .000
Interpretation:
To test correlation between satisfaction of students and their behavioral intention we set a
hypothesis as H03: satisfaction is not related to behavioral intention. Data analysis proved there
is high positive correlation between satisfaction and behavioral intention with P value as 0.628
and with significant level is 0.000 which is less than 0.05, it shows that tells that the result
obtained is significant
8/12/2019 STUDENTS’ PERCEPTION OF SERVICE QUALITY IN HIGHER EDUCATION
http://slidepdf.com/reader/full/students-perception-of-service-quality-in-higher-education 18/31
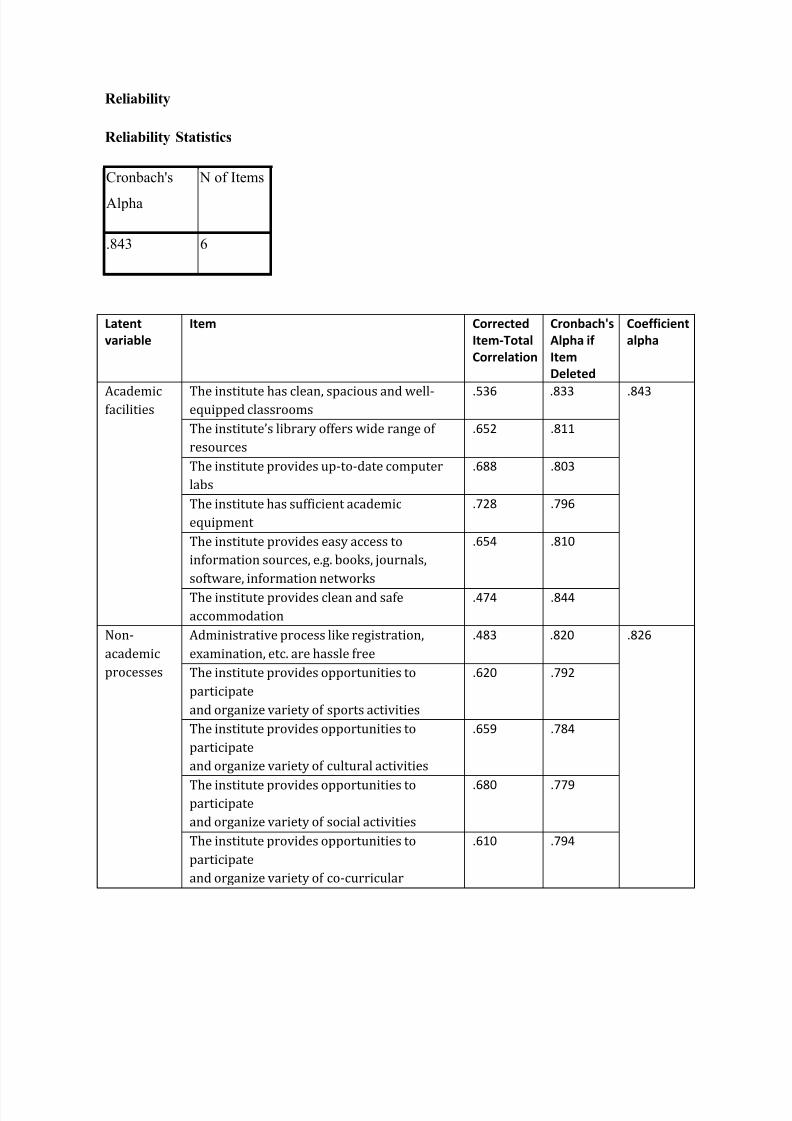
Reliability
Reliability Statistics
Cronbach's
Alpha
N of Items
.843 6
Latent
variable
Item Corrected
Item-Total
Correlation
Cronbach's
Alpha if
Item
Deleted
Coefficient
alpha
Academic
facilities
The institute has clean, spacious and well-
equipped classrooms
.536 .833 .843
The institute’s library offers wide range of
resources
.652 .811
The institute provides up-to-date computer
labs
.688 .803
The institute has sufficient academic
equipment
.728 .796
The institute provides easy access to
information sources, e.g. books, journals,
software, information networks
.654 .810
The institute provides clean and safe
accommodation
.474 .844
Non-
academic
processes
Administrative process like registration,
examination, etc. are hassle free
.483 .820 .826
The institute provides opportunities to
participate
and organize variety of sports activities
.620 .792
The institute provides opportunities to
participate
and organize variety of cultural activities
.659 .784
The institute provides opportunities to
participate
and organize variety of social activities
.680 .779
The institute provides opportunities to
participate
and organize variety of co-curricular
.610 .794
8/12/2019 STUDENTS’ PERCEPTION OF SERVICE QUALITY IN HIGHER EDUCATION
http://slidepdf.com/reader/full/students-perception-of-service-quality-in-higher-education 19/31
activities
The institute provides career information and
guidance
.512 .814
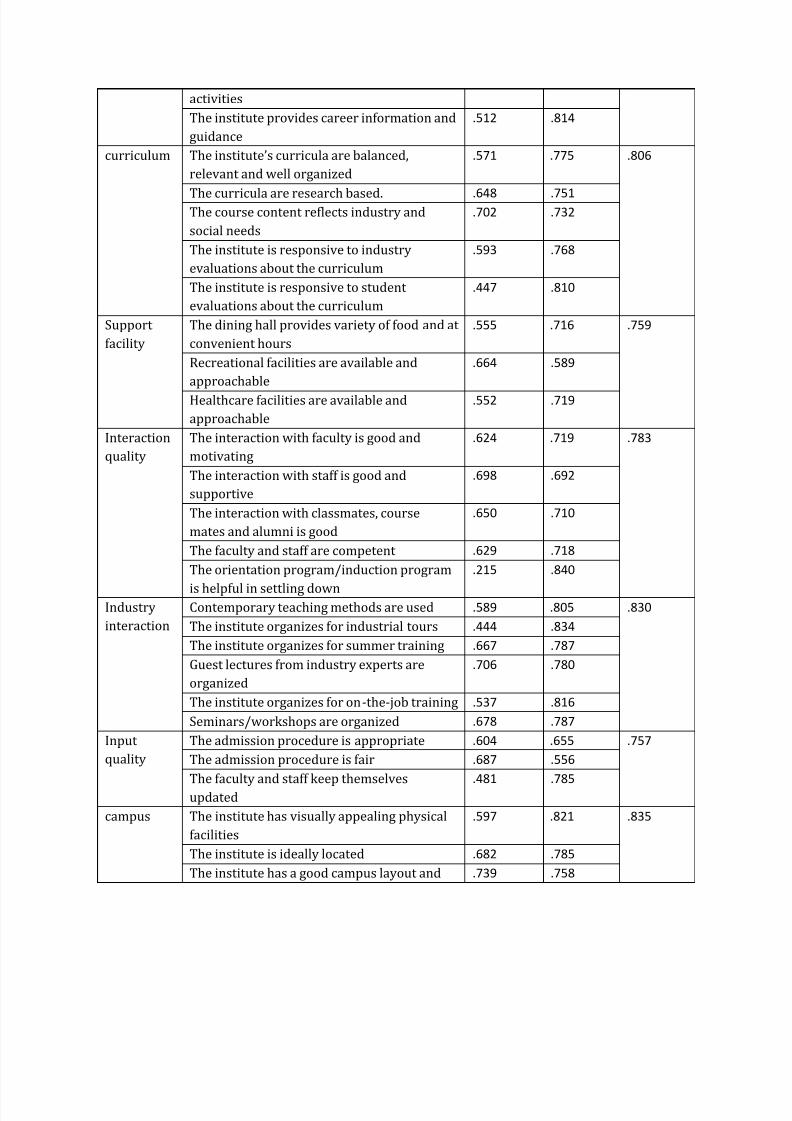
curriculum The institute’s curricula are balanced,
relevant and well organized
.571 .775 .806
The curricula are research based. .648 .751
The course content reflects industry and
social needs
.702 .732
The institute is responsive to industry
evaluations about the curriculum
.593 .768
The institute is responsive to student
evaluations about the curriculum
.447 .810
Support
facility
The dining hall provides variety of food and at
convenient hours
.555 .716 .759
Recreational facilities are available and
approachable
.664 .589
Healthcare facilities are available and
approachable
.552 .719
Interaction
quality
The interaction with faculty is good and
motivating
.624 .719 .783
The interaction with staff is good and
supportive
.698 .692
The interaction with classmates, course
mates and alumni is good
.650 .710
The faculty and staff are competent .629 .718
The orientation program/induction programis helpful in settling down
.215 .840
Industry
interaction
Contemporary teaching methods are used .589 .805 .830
The institute organizes for industrial tours .444 .834
The institute organizes for summer training .667 .787
Guest lectures from industry experts are
organized
.706 .780
The institute organizes for on-the-job training .537 .816
Seminars/workshops are organized .678 .787
Input
quality
The admission procedure is appropriate .604 .655 .757
The admission procedure is fair .687 .556The faculty and staff keep themselves
updated
.481 .785
campus The institute has visually appealing physical
facilities
.597 .821 .835
The institute is ideally located .682 .785
The institute has a good campus layout and .739 .758
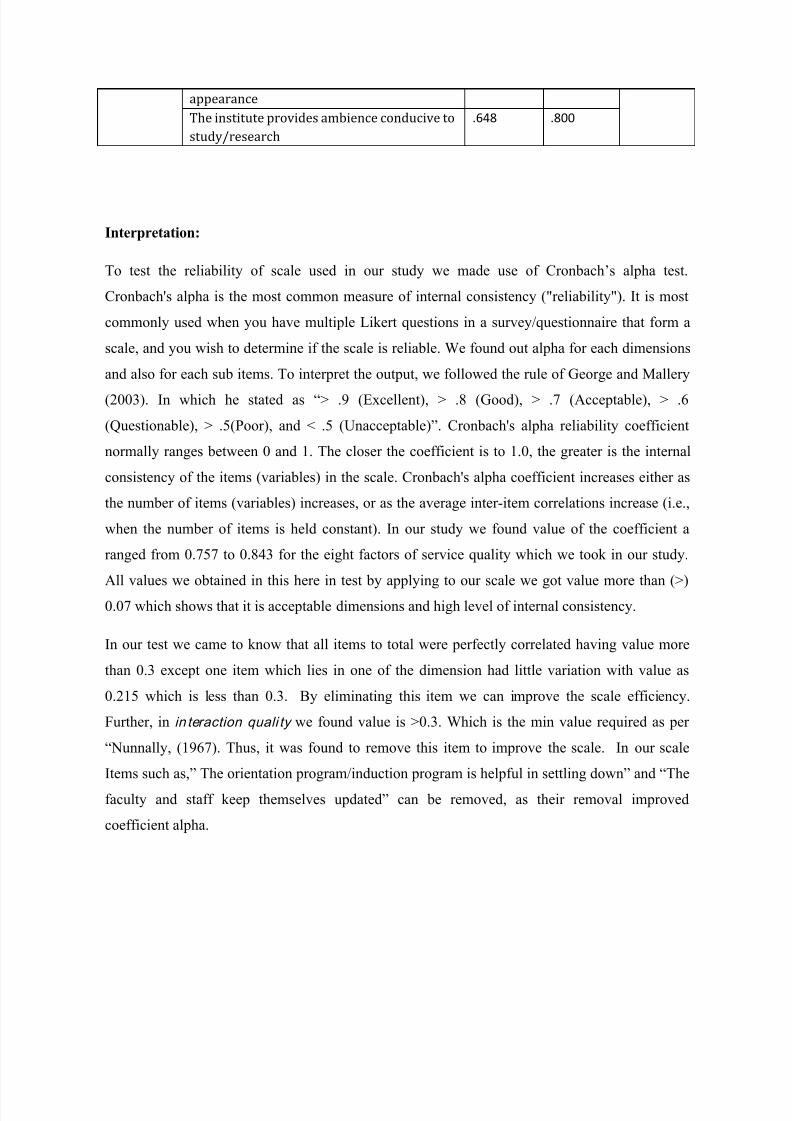
8/12/2019 STUDENTS’ PERCEPTION OF SERVICE QUALITY IN HIGHER EDUCATION
http://slidepdf.com/reader/full/students-perception-of-service-quality-in-higher-education 20/31
appearance
The institute provides ambience conducive to
study/research
.648 .800
Interpretation:
To test the reliability of scale used in our study we made use of Cronbach’s alpha test.
Cronbach's alpha is the most common measure of internal consistency ("reliability"). It is most
commonly used when you have multiple Likert questions in a survey/questionnaire that form a
scale, and you wish to determine if the scale is reliable. We found out alpha for each dimensions
and also for each sub items. To interpret the output, we followed the rule of George and Mallery(2003). In which he stated as “> .9 (Excellent), > .8 (Good), > .7 (Acceptable), > .6
(Questionable), > .5(Poor), and < .5 (Unacceptable)”. Cronbach's alpha reliability coefficient
normally ranges between 0 and 1. The closer the coefficient is to 1.0, the greater is the internal
consistency of the items (variables) in the scale. Cronbach's alpha coefficient increases either as
the number of items (variables) increases, or as the average inter-item correlations increase (i.e.,
when the number of items is held constant). In our study we found value of the coefficient a
ranged from 0.757 to 0.843 for the eight factors of service quality which we took in our study.
All values we obtained in this here in test by applying to our scale we got value more than (>)
0.07 which shows that it is acceptable dimensions and high level of internal consistency.
In our test we came to know that all items to total were perfectly correlated having value more
than 0.3 except one item which lies in one of the dimension had little variation with value as
0.215 which is less than 0.3. By eliminating this item we can improve the scale efficiency.
Further, in in teraction quali ty we found value is >0.3. Which is the min value required as per
“Nunnally, (1967). Thus, it was found to remove this item to improve the scale. In our scale
Items such as,” The orientation program/induction program is helpful in settling down” and “The
faculty and staff keep themselves updated” can be removed, as their removal improved
coefficient alpha.

8/12/2019 STUDENTS’ PERCEPTION OF SERVICE QUALITY IN HIGHER EDUCATION
http://slidepdf.com/reader/full/students-perception-of-service-quality-in-higher-education 21/31
Factor Analysis
KMO and Bartlett's Test
Kaiser-Meyer-Olkin Measure of Sampling
Adequacy..857
Bartlett's Test of
Sphericity
Approx. Chi-Square 5921.461
df 703
Sig. .000
Interpretation:
The KMO statistics varies between 0 and 1. A value of 0 indicates that the sum of partial
correlation is large relative to sum of correlation. A value close to 1 indicates that the pattern of
correlations is relatively compact. Any value greater than 0.5 is acceptable. In this study the
value is 0.857 which is good and factor analysis could be done for this study.
Rotated Component Matrix
a
Component
1 2 3 4 5 6 7 8 9 10
staffsupportive .840
facultymotivating .809
classmates .765
inductionpgm .676
administrativeproce
ss.665
industrialtour .808
onthejobtraining .789
summertraining .764
studentevaluation .626
coursecontent .800
curricularesearchba
sed.786

8/12/2019 STUDENTS’ PERCEPTION OF SERVICE QUALITY IN HIGHER EDUCATION
http://slidepdf.com/reader/full/students-perception-of-service-quality-in-higher-education 22/31
curriculabalanced .690
industryevaluation .644
facultyupdated .554 .553
complab .803
library .791
cleanspaciousclass .690 .433
campuslayout .799
ambiencetostudy .446 .719
location .701
physicalfacilities .626 .522
socialactivities .838
culturalactivities .757
cocuricular .670
admisionfair .815
admissionapproprai
te.805
facultycompetent .730
accesstoinfo .762
accomodation .738
dininghall .672
academicequipmen
t.563 .599
careerguidance .748
healthcarefacility .668
recreationalfacility .410 .635
sportsopportunity .546 .595
seminar .806
teachingmethod .748
guestlecture .539 .560
Interpretation :
Factor analysis results suggested that unlike the previous study where items were grouped into 8
dimensions, the factor loading as per the present study suggests creation of two more dimensions.
The dimensions of this study has to be restructured into ten as per the results.
The items loaded in facror 1 suggest that it should be renamed to ‘ease of academic process’

8/12/2019 STUDENTS’ PERCEPTION OF SERVICE QUALITY IN HIGHER EDUCATION
http://slidepdf.com/reader/full/students-perception-of-service-quality-in-higher-education 23/31
The items loaded in factor 2 suggest that it should be renamed to ‘industry interaction’
The items loaded in factor 3 suggest that it should be renamed to ‘curriculum relevance’
The items loaded in factor 4 suggest that it should be renamed to ‘academic facilties’
The items loaded in factor 5 suggest that its name should be retained as ‘campus’
The items loaded in factor 6 suggest that its name should be retained as ‘non academic process ’
The items loaded in factor 7 suggest that its name should be retained as ‘input quality ’
The items loaded in factor 8 suggest that its name should be retained as ‘support facilities ’
The items loaded in factor 9 suggest that its name should be renamed as ‘support process’
The items loaded in factor 10 suggest that its name should be retained as ‘ pedagogy’
8/12/2019 STUDENTS’ PERCEPTION OF SERVICE QUALITY IN HIGHER EDUCATION
http://slidepdf.com/reader/full/students-perception-of-service-quality-in-higher-education 24/31
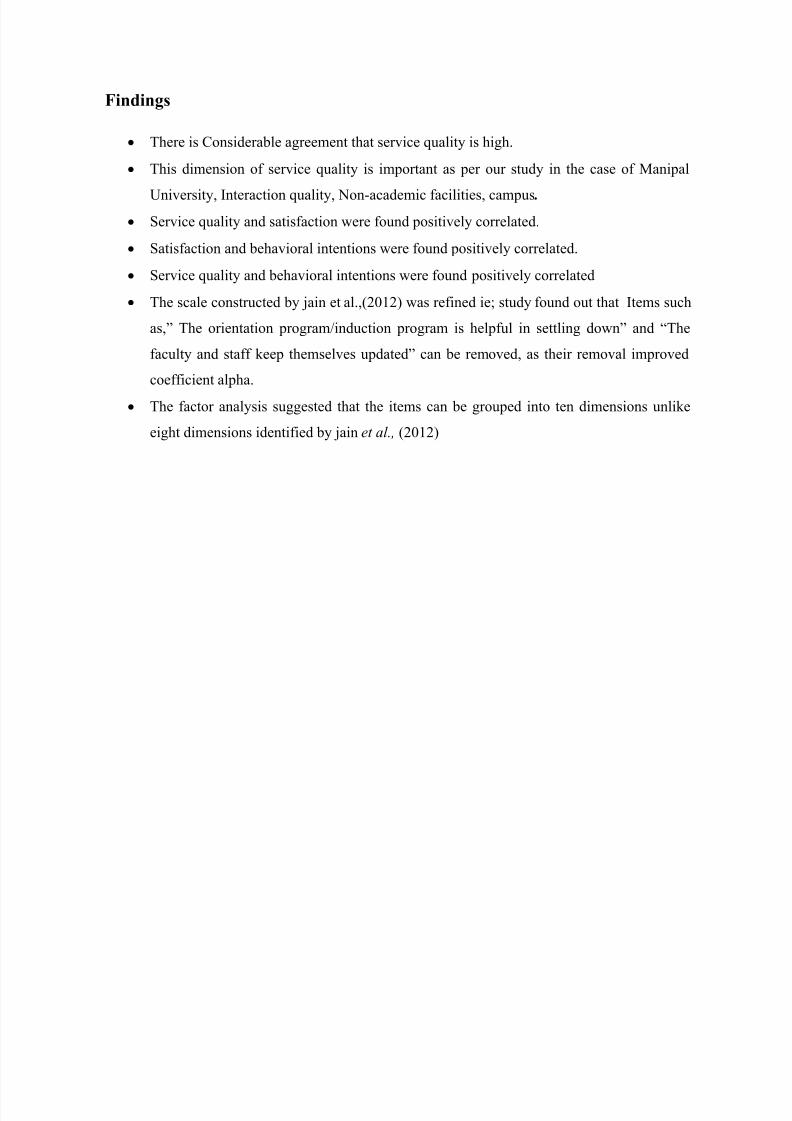
Findings
There is Considerable agreement that service quality is high.
This dimension of service quality is important as per our study in the case of Manipal
University, Interaction quality, Non-academic facilities, campus.
Service quality and satisfaction were found positively correlated.
Satisfaction and behavioral intentions were found positively correlated.
Service quality and behavioral intentions were found positively correlated
The scale constructed by jain et al.,(2012) was refined ie; study found out that Items such
as,” The orientation program/induction program is helpful in settling down” and “The
faculty and staff keep themselves updated” can be removed, as their removal improved
coefficient alpha.
The factor analysis suggested that the items can be grouped into ten dimensions unlike
eight dimensions identified by jain et al., (2012)

8/12/2019 STUDENTS’ PERCEPTION OF SERVICE QUALITY IN HIGHER EDUCATION
http://slidepdf.com/reader/full/students-perception-of-service-quality-in-higher-education 25/31
Bibliography
Abdullah, F. (2006). Measuring service quality in higher education: HEdPERF versus
SERVPERF. Marketing Intelligence & Planning, 24(1), 31-47.
Abdullah, F. (2006). The development of HEdPERF: a new measuring instrument of
service quality for the higher education sector. International Journal of Consumer
Studies, 30(6), 569-581
Angell, R. J., Heffernan, T. W., & Megicks, P. (2008). Service quality in postgraduate
education. Quality Assurance in Education, 16 (3), 236-254.
Atheeyaman, A. (1997) Linking student satisfaction and service quality perceptions: the
case of university education. European Journal of Marketing , 31(7), 528-540.
Athiyaman, A. (1997). Linking student satisfaction and service quality perceptions: the
case of university education. European Journal of Marketing, 31(7), 528-540. Baines, P.,
Fill, C., & Page, K. (2008). Marketing . New York: Oxford University Press.
Awan, M. U., Azam, S. and Asif, M. 2008, ‘Library Services Quality Assessment’,
Journal of Quality and Technology Management, Vol.4, No.1, pp.51-64.
Baron, S., Harris, K., & Hilton, T. (2009). Services marketing: text and cases. 3rd ed.
Basingstoke: Palgrave Macmillan.
Berry, L. L., Parasuraman, A., & Zeithaml, V. A. (1988). The Service-Quality Puzzle.
Business Horizons, 31(5), 35-43. Bitner, M. J. (1990). Evaluating service encounters: the
effects of physical surroundings and employee responses. The Journal of Marketing ,
54(2), 69-82.
Bolton, R. N., & Drew, J. H. (1991). A longitudinal analysis of the impact of service
changes on customer attitudes. The Journal of Marketing , 55(1), 1-9.
Carrillat, F., Jaramillo, F., & Mulki, J. P. (2007). The validity of the SERVQUAL and
SERVPERF scales: A meta-analytic view of 17 years of research across five continents.
International Journal of Service Industry Management, 18(5), 472-490.
8/12/2019 STUDENTS’ PERCEPTION OF SERVICE QUALITY IN HIGHER EDUCATION
http://slidepdf.com/reader/full/students-perception-of-service-quality-in-higher-education 26/31
Clewes, D. (2003). A Student-centred Conceptual Model of Service Quality in Higher
Education. Quality in Higher Education, 9(1), 69-85.
Corneliu Munteanu, Ciprian Ceobanu, Claudia Bobaˆlca˘ and Oana Anton,An analysis of
customer satisfaction in a higher education context,International Journal of Public Sector
Management Vol. 23 No. 2, 2010 pp. 124-140
Crawford, F. (1991) Total Quality Management . Committee of Vice-Chancellors and
Principals Occasional Paper,London, December 1991.
Cronin Jr, J. J., & Taylor, S. A. (1992). Measuring service quality: a reexamination and
extension. The Journal of Marketing , 56(3), 55-68.
Cronin Jr, J. J., & Taylor, S. A. (1994). SERVPERF versus SERVQUAL: reconciling
performance-based and perceptions-minus-expectations measurement of service quality.
The Journal of Marketing , 58(1), 125-131.
Crosby, L. A. (1991). Expanding the Role of CSM in Total Quality. International
Journal of Service Industry Management , 2(2), 5-19.
Crosby, P. B. (1979). Quality is free: The art of making quality certain. New York:
McGraw-Hill New York.
Cuthbert, P. F. (1996a). Managing service quality in HE: is SERVQUAL the answer?
Part 1. Managing Service Quality, 6 (2), 11-16.
Cuthbert, P. F. (1996b). Managing service quality in HE: is SERVQUAL the answer?
Part 2. Managing Service Quality, 6 (3), 31-35.
Daniel J B,Anna G,Service Quality in Higher Education:The students’ viewpoint,(not
published).
Fawad Husain, Suhaiza Hanim, Yudi Fernando, Mostafa Nejati,Education Service
Delivery and Students’Satisfaction: A Study of Private Colleges in Malaysia,GBMR Vol.
1, No. 1, 2009 pp. 64-72

8/12/2019 STUDENTS’ PERCEPTION OF SERVICE QUALITY IN HIGHER EDUCATION
http://slidepdf.com/reader/full/students-perception-of-service-quality-in-higher-education 27/31
Gronroos, C. (1978). A Service-Orientated Approach to Marketing of Services. European
Journal of Marketing, 12(8), 588-601.
Gronroos, C. (1982). An applied service marketing theory. European Journal of
Marketing. 16(7), 30-41.
Gronroos, C. (1984). A Service Quality Model and its Marketing Implications. European
Journal of Marketing, 18(4), 36-44.
Gronroos, C. (2007). Service management and marketing: customer management in
service competition. 3rd ed. Chichester: John Wiley & Sons.
Guo, C. 2002, ‘Market orientation and business performance: A framework for service
organizations’, European Journal of Marketing, Vol.36, No.9, pp.1154-1163
Halil Nadiria, Jay Kandampullyb ,Kashif Hussain,Students’ perceptions of service quality
in higher education,Total Quality Management Vol. 20, No. 5, May 2009, 523 – 535
Ham, C. L., Johnson, W., Weinstein, A., Plank, R. and Johnson, P. L. 2003, ‘Gaining
Competitive Advantages: Analyzing the Gap between Expectations andPerceptions of
service quality’, International Journal of Value Based Management, Vol.16, No.2,
pp.197-203
Hill, F. M. (1995). Managing service quality in higher education: the role of the student
as primary consumer. Quality Assurance in Education, 3(3), 10-21.
Josep Gallifa,Pere Batalle,Student perceptions of service quality in a multi-campus
highereducation system in Spain,Quality Assurance in Education Vol. 18 No. 2, 2010 pp.
156-170
Lewis, R. C., & Booms, B. H. (1983). The marketing aspects of service quality, in Berry
L., Shostack G. & Upah, G (Eds), Emerging Perspectives on Services Marketing , AMA,
Chicago, IL, 99-107.
Lovelock, C. H., & Wirtz, J. (2011). Services marketing: people, technology, strategy.
7th ed. London: Pearson.

8/12/2019 STUDENTS’ PERCEPTION OF SERVICE QUALITY IN HIGHER EDUCATION
http://slidepdf.com/reader/full/students-perception-of-service-quality-in-higher-education 28/31
Maria Pereda,David Airey , Marion Bennett,Service Quality in Higher Education: The
Experience of Overseas Students,Journal of Hospitality, Leisure, Sport and Tourism
EducationVol. 6, No. 2.ISSN: 1473-8376
Maria Tsinidou, Vassilis Gerogiannis,Panos Fitsilis,Evaluation of the factors that
determine quality in higher education: an empirical study,Quality Assurance in Education
Vol. 18 No. 3, 2010 pp. 227-244
Nadiri, H., Kandampully, J., & Hussain, K. (2009). Students' perceptions of service
quality in higher education. Total Quality Management & Business Excellence, 20(5),
523-535.
Palmer, A. (2011). Principles of services marketing . 6th ed. Maidenhead: McGraw-Hill
Education.
Parasuraman, A., Zeithaml, V. A., & Berry, L. L. (1985). A conceptual model of service
quality and its implications for future research. The Journal of Marketing , 49(1), 41-50.

8/12/2019 STUDENTS’ PERCEPTION OF SERVICE QUALITY IN HIGHER EDUCATION
http://slidepdf.com/reader/full/students-perception-of-service-quality-in-higher-education 29/31
Annexure :
QUESTIONNAIRE
This study is conducted to evaluate the student’s perception of service quality in higher education. The
data obtained will only be used for research purpose.
Please indicate your response by ticking in the appropriate boxes, to indicate level of agreement to
the each statement in reference to your Institute
Statement Strongly
Agree
Agree Neither agree
nor disagree
Disagree Strongly
Disagree
Part A 5 4 3 2 1
The admission procedure is appropriate.
The admission procedure is fair.
The faculty and staff are competent.
The faculty and staff keep themselves updated.
The institute’s curricula are balanced, relevant and wellorganized.
The curricula are research-based.
The course content reflects industry and social needs.
The Institute is responsive to industry evaluations about
the curricula.
The Institute is responsive to student evaluations about
the curricula.
The Institute organizes for On The Job Training.
The Institute organizes for Industrial tours.
The Institute organizes for Summer Training.
The Institute organizes for guest lectures from industryexperts.
The Institute uses Contemporary teaching methods.
The Institute organizes for Seminars/workshops
The Institute has visually appealing physical facilities.
The Institute is ideally located.
The Institute has good campus layout and appearance
The Institute provides ambience conducive to
study/research
The Institute has clean, spacious, and well equipped
classrooms.
The library offers wide range of resources.The Institute provides up-to-date computer
Laboratories
The Institute has sufficient academic equipment,
e.g. laboratories, workshops.
The Institute provides easy access to information
sources, e.g. books, journals, software,
Information networks.

8/12/2019 STUDENTS’ PERCEPTION OF SERVICE QUALITY IN HIGHER EDUCATION
http://slidepdf.com/reader/full/students-perception-of-service-quality-in-higher-education 30/31
The institute provides clean and safe
Accommodations
The institute’s dining-hall provides variety of food
and at convenient hours.
Recreational facilities are available and
approachable.Healthcare facilities are available and
approachable.
The institute provides career information and guidance. 5 4 3 2 1
Statement Strongly
Agree
Agree Neither agree
nor disagree
Disagree Strongly
Disagree
The institute provides opportunities to participate
or organize variety of sports activities.
The institute provides opportunities to participate
or organize variety of cultural activities.
The institute provides opportunities to participate
or organize variety of social activities.The institute provides opportunities to participate
or organize variety of co-curricular activities.
The institute’s administrative process like
registration, examination etc are hassles free.
The interaction with faculty is good and
motivating.
The interaction with staff is good and supportive.
The interaction with classmates, course mates
and alumni is good.
The institute’ orientation program/ induction
program is helpful in settling downI will rate the Institute high on overall service
quality.
I am satisfied with my decision to attend this college
If have a choice to do it all over again, I still will enroll in thiscollege
My choice to enroll in this college is a wise one
I am happy on my decision to enroll in this college
I did the right decision when I decided to enroll in this college
I am happy that I enrolled in this college
I like talking about my college to my friends.
I like helping potential students by providing them with
information about my college and its courses.
People ask me for information about courses offered at
my college
Part B:
Please fill in your personal details: Course: --------------------------------------------
Gender: Male [ ] Female [ ] Institute: --------------------------------------------

8/12/2019 STUDENTS’ PERCEPTION OF SERVICE QUALITY IN HIGHER EDUCATION
http://slidepdf.com/reader/full/students-perception-of-service-quality-in-higher-education 31/31