studies of base pair sequence effects on dna solvation
TRANSCRIPT
Studies of base pair sequence effects on DNA solvation basedon all-atom molecular dynamics simulations
SURJIT B DIXIT1, MIHALY MEZEI
2 and DAVID L BEVERIDGE1,*
1Chemistry Department and Molecular Biophysics Program, Wesleyan University,Middletown, CT 06457, USA
2Department of Structural and Chemical Biology, The Mount Sinai School of Medicine,New York, NY 10029, USA
*Corresponding author (Fax, 860-685-2211; Email, [email protected])
Detailed analyses of the sequence-dependent solvation and ion atmosphere of DNA are presented based on moleculardynamics (MD) simulations on all the 136 unique tetranucleotide steps obtained by the ABC consortium using theAMBER suite of programs. Significant sequence effects on solvation and ion localization were observed in thesesimulations. The results were compared to essentially all known experimental data on the subject. Proximity analysiswas employed to highlight the sequence dependent differences in solvation and ion localization properties in the groovesof DNA. Comparison of the MD-calculated DNA structure with canonical A- and B-forms supports the idea that the G/C-rich sequences are closer to canonical A- than B-form structures, while the reverse is true for the poly A sequences, withthe exception of the alternating ATAT sequence. Analysis of hydration density maps reveals that the flexibility of solutemolecule has a significant effect on the nature of observed hydration. Energetic analysis of solute–solvent interactionsbased on proximity analysis of solvent reveals that the GC or CG base pairs interact more strongly with water molecules inthe minor groove of DNA that the AT or TA base pairs, while the interactions of the AT or TA pairs in the major grooveare stronger than those of the GC or CG pairs. Computation of solvent-accessible surface area of the nucleotide units in thesimulated trajectories reveals that the similarity with results derived from analysis of a database of crystallographicstructures is excellent. The MD trajectories tend to followManning’s counterion condensation theory, presenting a regionof condensed counterions within a radius of about 17 Å from the DNA surface independent of sequence. The GC and CGpairs tend to associate with cations in the major groove of the DNA structure to a greater extent than the AT and TA pairs.Cation association is more frequent in the minor groove of AT than the GC pairs. In general, the observed water and ionatmosphere around the DNA sequences is the MD simulation is in good agreement with experimental observations.
[Dixit SB, Mezei M and Beveridge DL 2012 Studies of base pair sequence effects on DNA salvation based on all-atom molecular dynamicssimulations. J. Biosci. 37 399–421] DOI 10.1007/s12038-012-9223-5
1. Introduction
Solvation plays an integral role in stabilizing the structure ofthe DNA molecule in condensed phase. DNA–ligand affinityand specificity in solution is sensitive to solvation sincesolvent reorganization and release on binding make impor-tant thermodynamic contributions. The solvation of DNA atthe most elementary level consists of water molecules andmobile ions, some of which are known to be ‘structured’ by
the interactions with the ionic, hydrophilic and hydrophobicsites on the sugar–phosphate backbone and in the major andminor groove of the double helix. Beyond this, the detailedmolecular structure of DNA solvation depends on nucleotidebase pair sequence, both via direct interactions and indirectlyvia sequence preferences for various DNA conformations.Thus, knowledge of the magnitude and extent of sequenceeffects on solvation is important in fully understanding DNAstructure and function at the molecular level.
http://www.ias.ac.in/jbiosci J. Biosci. 37(3), July 2012, 399–421, * Indian Academy of Sciences 399
Keywords. ABC simulations; hydration of DNA; ion atmosphere; proximity criterion
Supplementary materials pertaining to this article are available on the Journal of Biosciences Website at http://www.ias.ac.in/jbiosci/jul2012/supp/mezei.pdf
Published online: 25 June 2012

The four canonical nucleotide bases in DNA give rise to 10unique dinucleotide base pair steps. The structure of each basepair step may depend as well on sequence context, as in the caseof the ubiquitous A-tracts implicated in DNA bending. Consid-ering only first neighbour bases of each step, the minimumlength of sequence required for detailed study of sequence-dependent DNA structure is a contiguous sequence of fournucleotide base pairs (tetranucleotide steps). Thus, a comprehen-sive description of sequence effects on DNA requires consider-ation of at least all 136 unique tetranucleotide steps, i.e. the 10unique nucleotide base pair steps in all unique sequence contexts.
The available experimental data on DNA structure is frag-mentary with respect to tetranucleotide steps, and does not yetencompass all unique dinucleotide steps, much less all se-quence contexts. With the latest advances in high-performance computing, the problem of sequence effects onDNA structure and solvation can be addressed by molecularsimulation. The method of choice is molecular dynamics (MD)simulation in which an all-atom model can be treated includingexplicit consideration of water and ions and provides a descrip-tion of structure as a function of time. This article describes astudy of sequence-resolved B-DNA solvation based on MDsimulations on all 136 oligonucleotide tetramers. MD predic-tions of sequence-dependent DNA hydration and ion solvationare compared with available experimental data from diversebiophysical measures and from crystallography. The generalfeatures of DNA solvation are obtained, and a quite plausibledescription of the structures adopted by water molecules andions in the vicinity of the B-form duplex is provided. Furtheranalysis of the results reveals considerable new knowledge ofthe sequence-dependent nature of DNA solvation.
2. Background
2.1 DNA hydration
The importance of hydration on the structure of DNA wasrecognized quite early in the history of structural biology(Franklin and Gosling 1953). However, due to the complex-ity of the problem with respect to DNA structure and func-tion, the nature of DNA solvation at the molecular levelremains an open question even today. The literature on thistopic is extensively described in texts (Saenger 1984; Westhofand Beveridge 1989; Berman and Schneider 1999) andarticles (Leikin et al. 1993; Eisenstein and Shakked 1995;Umrania et al. 1995; Chalikian and Breslauer 1998; Egliet al. 1998). There is experimental evidence that the stabilityand conformational preferences of the DNA double helixdepends on the relative humidity of fibres (Leslie et al.1980) and water activity in solution (Malenkov et al.1975). In fibres, the A-form of DNA is preferred underconditions of lower relative humidity (~76%), while increas-ing the relative humidity to ~86% stabilizes the B-form
(Saenger 1984). Osmotic stress experiments confirm thatthe water activity around DNA is directly correlated to the freeenergy required to deform the double helix (Ruggiero et al.2001). A conformational transition from B-DNA to theA-form can also be induced by increased ionic strength(Nishimura et al. 1986). Excess salt in GC-rich sequencesmay cause a transition to the left-handed Z-form (Jovin et al.1987). We restrict our attention here to the right-handedforms of DNA, essentially the family of B-form structurescharacteristic of right-handed duplexes. However, in B-formsequences of DNA, structures may locally adopt an A-form orbe situated along the continuum of structures of right-handedDNA from A to B, and this is believed to have functionalsignificance in DNA recognition. Thus, the hydration of A-form structures as well as B-form is relevant to this study. Theterminology used to discuss DNA hydration is not consistentfrom one paper to another in the literature, and we take careherein to formally define our terms with the hope of moreuniformity on this matter in subsequent research.
The basic idea that solvent water in the immediate vicinityof DNA adopts a structure incompatible to crystallizationwith bulk water was first reported by Kuntz (Kuntz et al.1969), and this result subsequently posed questions about thenature and extent of water structures around DNA. There isnow extensive experimental data on DNA hydration frommolar volumes, densities and compressibilities (Chalikianand Breslauer 1998), dielectric relaxation (Umehara et al.1990), neutron diffraction (Shotton et al. 1997) and molec-ular spectroscopy (Halle and Denisov 1998). The essentialpicture that emerges from this data is that the anionic, hy-drophilic and hydrophobic constituents of DNA interactstrongly with waters in the neighbourhood of the duplexand result in local water structures distinct from that of bulkwater. This local structure extends a considerable distancefrom the surface of a DNA duplex and consists of regions inwhich the local density is somewhat higher than that of bulkwater (Chalikian et al. 1994). The nature of DNA hydrationis also reflected in the mobilites of the molecules and ionsinvolved. Spectroscopic studies of ultrafast dynamics ofDNA hydration indicate two time constants, one at ~1 psbehaving bulk-like, and the second at ~12 ps indicative ofwater molecules with reduced mobility (Pal et al. 2003). Anissue of interpretation is that various experiments probe differ-ent regions and aspects of the structured hydration. In thisarticle, we adopt the terminology that the structured hydrationconsists of solvation shells demarcated in principle by thepeaks and valleys in DNA–water radial distribution functions.Within the boundary of the first solvation shell, some fraction(but now all) of the solvent water molecules and ions are indirect contact with DNA atoms, and referred to as ‘bound’.
The concept of structured hydration applies of course toboth the A-form and B-form of DNA, but at a higher level ofresolution there are significant differences. Spectroscopic,
400 SB Dixit, M Mezei and DL Beveridge
J. Biosci. 37(3), July 2012

gravimetric and volumetric studies indicate that the localhydration of a B-form duplex consists of ~30 water mole-cules per nucleotide base pair (bp) and about 28.7 structuredwaters per nucleotide in the A-form DNA. Dielectric relax-ation measurements (Umehara et al. 1990) indicate at least18–19 waters in the B-form and ~13–15 waters in the A-form. X-ray diffraction and optical microscopy measure-ments on fibre DNA indicate 27 water molecules per GCbase pair and 44 waters per AT pair (Albiser et al. 2001). Inthese studies about 11 water molecules per nucleotide pairare observed in A-form structures irrespective of the se-quence composition. Variations in the reported number ofwater molecules in the hydration layer are anticipated be-cause of the differences in experimental settings and the factthat the experiments might be looking at different aspects ofsolvation properties. Buoyant density experiments on DNAfibres indicate that AT pairs involve 2 more water moleculesthan GC pairs (Tunis and Hearst 1968). This is in contrast ofapparent molar volume and compressibility measurements(Chalikian et al. 1994), which indicate that GC base pairs aresolvated more strongly than the AT base pairs in DNAsequences. Mixed AT/GC sequences while favouring B formDNA have been noted to be ‘less hydrated’ than homopol-ymers (Chalikian et al. 1994). DNA molecules are alwayshydrated to some extent, and thus the ‘extent’ or ‘degree’ ofhydration need to be made more precise and quantitative tobe useful. There is a well-established propensity of AT-richsequences for B-form DNA and GC-rich sequences for A-form structures (Pilet and Brahms 1972). The correlationbetween the base sequence composition of DNA and prefer-ential stability has been focus of a number of experimentaland theoretical studies, and there is a considerable literatureon A- and B-philicity scales (Mazur et al. 1989; Hunter1993; Ivanov and Minchenkova 1994; Basham et al. 1995;Tolstorukov et al. 2001), which have proved to be useful inthis study for validating the accuracy of MD on DNA.
The most detailed experimental data on DNA hydration atthe molecular level comes of course from crystallography.Analysis of residual electron densities obtained from diffrac-tion experiments yields information about waters which arecrystallographically ordered, typically those which makedirect non-covalent contacts with the DNA. One problemin establishing the significance of these observations is thatcrystallographically ordered water is a fraction of the totalstructured water around DNA but thermodynamic stabilityinvolves the entire consort. Schneider and Berman(Schneider et al. 1992, 1993, 1998; Schneider et al. 1993;Schneider and Berman 1995) have carried out a comprehen-sive statistical survey of crystallographic hydration of DNAbased on optimally aligned electron density distributions forall available B-form oligonucleotide crystal structures. Theyhave investigated the extent to which hydration sites show ahigh degree of transferability, and demonstrated that a
generic description of hydration localized at the base pairlevel could successfully predict the hydration of a dodeca-nucleotide sequence. Well-defined hydration sites are delin-eated for the hydrophilic donor and acceptors sites in themajor and minor grooves of the duplex, cones of hydrationaround anionic phosphates.
Specifically, crystallographic hydration sites for B-formDNA were found in the minor groove at purine N3, pyrim-idine O2 atoms and at purine N6/O6 and N7, and pyrimidineN4/O4 atoms in the major groove. Other major groove sitesare purine C6 and G N2, which may be a shared site with CO2. These hydration sites also provide the critical functionalgroups required to make direct recognition at the protein-nucleic interface (Seeman et al. 1976), thereby linking theenergetics of desolvation to the thermodynamics of bindingand recognition (Privalov et al. 2007). While our focus inthis article is on B-form DNA, within B-form structures,some steps, especially those with high GC content, mayexhibit A-form-like local structures or structures betweenB-form and A, depending on sequence. Hydration and tran-sition between different DNA forms affects the sequence-specific local deformability of DNA, which is another factorcontributing to specificity during ligand recognition (Olsonet al. 1998).Water molecules in A-DNA crystals reveal ahighly ordered network with some performing the role of astereospecific ‘handle’ in the recognition by cognate protein(Eisenstein and Shakked 1995; Schwabe 1997; Reddy et al.2001). The crystallographic hydration sites are similar butmore complex in A-form DNA, and in addition G O6 and CC5 are mentioned, the latter in alternating C/G sequences(Egli et al. 1998). In A-form structures, the typical inter-phosphate distance is optimal for accommodating a singlewater molecule bridging the two PO2
− groups and it has beenproposed that this so-called ‘economic’ use of a water mol-ecule may be significant in relative stability of the A-form atlower water activity (Saenger et al. 1986). In case of B-DNAstructures, the phosphate groups are separated to the extentthat only the second shell water molecules can bridge thegroups (Schneider et al. 1998). It is more common to ob-serve water bridges between PO2
− groups and hydration siteson nucleotide bases. Anionic phosphates dominate the hy-dration of the sugar–phosphate backbone at the expense ofester oxygen hydration.
In a number of cases, there is crystallographic evidencefor hydration structures in which the sites form networkssuch as spines, filaments, polygons and even more elaboratetwo- and three-dimensional networked structures. The minorgroove spine in AT-rich tracts of B-form DNA is the mostcelebrated of these hydration structures, and has been direct-ly linked to thermodynamic stability (Chen and Prohofsky1993), supported by the results of a novel grand canonicalMC simulation (Guarnieri and Mezei 1996). Beyond this,there has been considerable speculation about the role of
DNA hydration 401
J. Biosci. 37(3), July 2012
higher-order solvation structures in DNA stability, but this isa complicated matter since the definition of these structuresis not unique and also must be defined with respect tostatistical weights to make a convincing argument. As aconsequence, it has not generally been possible to linkhigher-order solvation structures unequivocally to thermo-dynamic stability, but this remains a desirable outcome.
2.2 DNA ion atmosphere
DNA is a polyanion in solution at neutral and physiologicalpH, and counterions are required to achieve electroneutrality.Typical experimental conditions and cellular environmentsinvolve even higher levels of ionic strength. Positivelycharged counterions associate with the negatively chargedphosphates on the DNA backbone and, analogous to thestructured hydration, exhibit a structured distribution encom-passing the DNA surface and are generally referred to as the‘ion atmosphere.’ The ion atmosphere was predicted theo-retically (Manning 1978; Anderson and Record Jr 1982) andshown to generally account for a considerable amount ofobserved behaviour of DNA in solution. An important resultfrom these studies is the idea of ‘counterion condensation’.The idea is that no matter how dilute the solution, a numberof counterions remain in close proximity to the DNA asopposed to being dissociated as in the case of small ionpairs. Condensed counterions were predicted to compensatefor a large fraction of phosphate charges, predicted by Man-ning to be ~76% and independent of concentration. Thisfollows from a simple argument based on molecular thermo-dynamics (Jayaram and Beveridge 1990, 1991; Jayaram et al.1991). Parallel studies of this problem carried out based onPoisson–Boltzmann calculations are in substantial accordwith the basic ideas (Jayaram et al. 1989). The initial pre-dictions about the nature and extent of the ion atmosphere ofDNA were subsequently confirmed by computer simulation(Jayaram and Beveridge 1996; Young et al. 1997a, b) onspecific sequence cases. The extent to which these resultscan be generalized and are sequence dependent is investigat-ed in the present study.
Crystal structures provide evidence for site-bound ions(Tereshko et al. 1999) especially in the case of divalents,and in some structures charged organic co-crystallizationagents such as spermine have been found in major grooveregions (Robinson and Wang 1996). The possibility of somefractional population of monatomic inorganic ions in thegrooves of DNA was initially predicted by MD simulation(Young et al. 1997a, b). This idea led to a lively debate in theliterature (Shui et al. 1998; Chiu et al. 1999) since a signif-icant groove population of ions would affect binding affin-ities. At this point in time, the fractional occupancies of ioninvolved seem to be small and sequence dependent (McConnelland Beveridge 2000; Rueda et al. 2004). The level that would
be significant with respect to conformational stability andligand binding has not yet been established. We revisit theidea of groove populations of ions in the context of theresults we have acquired in this study (vide infra).
2.3 Molecular simulation studies
Reviews are available of the earlier literature on computersimulation studies of DNA hydration (Feig and Pettitt 1998)and ion atmosphere (Jayaram and Beveridge 1996). Beyondthe observations noted above, obtaining a comprehensivemolecular model of DNA hydration and ion atmospherefrom thermodynamic and spectroscopic measurements is ahighly underdetermined problem, particularly since DNAsolvation at a temperature must be viewed as a Boltzmannensemble of thermally accessible structural forms. Whilecomputationally intensive, a complete description of thestructure of DNA including solvation consistent with Boltz-mann statistical thermodynamics can now be obtained theo-retically from Monte Carlo (MC) and molecular dynamics(MD) computer simulations, subject of course to approxima-tions intrinsic to the assumed force field and simulationmethodologies and computational protocols. In studiesaimed at validating all atom models of MD on DNA includ-ing explicit water and ions, comparisons of calculated DNAconformations with those observed from crystal structures(Young et al. 1997a, b) and from the NMR structures insolution (Arthanari et al. 2003) have been in remarkablyclose accord when the best force fields are used (CheathamIII and Young 2000; Perez et al. 2007a, b). A comparison ofMD on DNA with time-resolved Stokes-shift experimentsfocuses specifically on the dynamics of water and ions nearDNA (Sen et al. 2009). Extensive MD studies have beenreported on DNA bending (Beveridge et al. 2004a, b) andflexibility (Orozco et al. 2008). The A to B transition isuniquely sensitive to water activity, and has been successfuldescribed by molecular dynamics simulations (Cheatham IIIand Kollman 1996; Sprous et al. 1998; Knee et al. 2008).Most importantly in this study, the water molecules and ionsincluded in these trajectories can be used to obtain calculatedwater and ion density distributions and thus extract a com-putational model of DNA solvation (Ponomarev et al. 2004).A number of recent articles have addressed some specificissues of DNA solvation based on MD results, including theminor groove spine of hydration (Subramanian et al. 1988;Guarnieri and Mezei 1996) and possible ion insertion intogrooves of DNA (Young et al. 1997a, b). As noted above, agrand canonical MC simulation study (Jayaram and Beveridge1991) and MD simulations of the ion atmosphere of DNA(Young et al. 1997a, b) generally supported the structure andenergetics of counterion condensation theory and providedsome predictions about sequence effects.
402 SB Dixit, M Mezei and DL Beveridge
J. Biosci. 37(3), July 2012
The use of Ewald summation method for the treatment oflong-range electrostatics remarkably improved the quality ofMD simulations on DNA (York et al. 1995). Subsequently,multiple simulations have addressed the issue of DNA hy-dration to various extents (Cheatham III and Kollman 1997;Duan et al. 1997). A particularly thorough study of thehydration of A- and B-forms of the pentameric duplex ofsequence d(C5T5) in explicit water and 0.8 M excess NaClwas reported by Feig and Pettitt (1999). These simulationsused both the AMBER and CHARMM force field, and theanalysis was based on the shell structure of hydrationobtained from a variation of quasi-component distributionfunctions using the proximity criterion (Mehrotra and Bev-eridge 1980; Mezei and Beveridge 1986). Their calculationsindicate some 29 water molecules in the primary hydrationshell in agreement with densitometric measurements, andfound ~20 water hydrogen bonded directly to the DNA inagreement with dielectric relaxation, resolving the discrep-ancies between the two sets of experiments. The number ofbound waters is decreased in A-form compared with B-form,and less for AT compared with GC base pairs. The calculat-ed hydration densities generally match crystallographic hy-dration sites and provide evidence for up to three shells ofhydration. Water molecules in the primary hydration layerare seen to be shifted and rearranged, but do not dehydratethe DNA. The effect of ions reduced the mobility but not thenumber of waters partially immobilized by the presence ofions. The agreement between MD results specifically ondC5T5 obtained by Feig and Pettitt and general experimentalresults is quite encouraging, and effectively points out theadditional information about solvation of DNA at the mo-lecular level that can be obtained from computer simulation.
Molecular dynamics simulations of canonical A-formDNA structure in water using the AMBER force field leadsto a rapid transition of the solute structure to a qualitativelyB-like structure (Cheatham III and Kollman 1996). Detailedanalysis of the water structure around one such transitioningDNA structure has revealed that considerable delay, to theextent of 5–7 ns, is observed before the solvent structurereorganizes to the new DNA conformation (Stefl and Koca2000). The convergence of ions in the course of a simulationcan be an even slower process. Recent analysis of iondistribution around a palindromic DNA sequence indi-cates that simulations extending up to 100 ns might berequired to achieve a symmetric ion distribution thatsuch a sequence would call for (Ponomarev et al.2004). Varnai and Zakrzewska (2004) have shown that Na+
and K+ counterions exhibit different groove binding propen-sities in the course of MD simulations with the Na+ bindingto both grooves in a sequence-dependent manner whilethe K+ ion mainly visits the major groove. Rueda et al.(2004) have observed that the insertion of Na+ ions in theminor groove of DNA is a very rare event because of
thermodynamic reasons. They note that in the situationwhere ions bind inside the minor groove, they remaintrapped for fairly long times by current routine simulationlengths (~10 ns) but do not dramatically influence the duplexstructure. While the size of Na+ and K+ ions differ onlyslightly, their solvent shell display quite different behaviour.The g(r) between Na+ and water drops to near zero betweenthe first and second shell, while the lowest value of the g(r)between K+ and water is of the order of 0.5, This behaviourwas observed already in early simulations (Mezei andBeveridge 1981) and confirmed recently employing theforce field used in this study (Mezei, unpublished). Thisdifference translates into a fairly rigid solvation shell for Na+,since the 0.01 observed for the g(r) minimum translates intoa barrier between the two shells of kT ln(0.01)~2.8 kcal/mol.At this point in time, MD simulations on a B-DNA of up to1 μs have been dynamically stable (Perez et al. 2007a, b).
2.4 Continuum and integral equation solvation models
Recently, there have been attempts to model solvation inMD and MC simulations of DNA using dielectric continuummodels based on Poisson–Boltzmann (PB) theory and/or thegeneralized Born (GB) approximation. While preliminaryresults were encouraging (Tsui and Case 2000), other calcu-lations of this type show various degrees of pathology (Dixitet al. 2006) and efforts are ongoing to improve the quality ofsuch simulations (Chocholousova and Feig 2006). An alter-nate application of the continuum solvation approach re-ferred to as the MM PB/GB SA employs trajectories of theDNA derived from simulation employing explicit solvent tocarry out post facto free energy analysis of the solvationthermodynamics (Jayaram et al. 1998; Srinivasan et al.1998). Of particular interest to the present work is a studyof the electrostatic component of solvation free energies ofthe 64 trinucleotides using numerical solution to the PBequation (Elcock and McCammon 1995). While based oncanonical structures in B-form, the calculated solvation freeenergies were shown to be more favourable for GC relativeto AT pairs. Recently, Howard et al. (2011) described anintegral equation theory that replicates MD and the experi-mental results for the base-specific hydration patterns in boththe major and the minor grooves and were able to discerncharacteristic structural pattern differences between Na(+)and K(+) ions.
2.5 MD on DNA: The ABC consortium
As noted above, studies of sequence effects on DNA struc-ture including solvation have been limited by the necessityof considering all unique base pair steps in all unique se-quence contexts. The computational task of obtaining MD
DNA hydration 403
J. Biosci. 37(3), July 2012

trajectories on all of these cases has recently been addressedby a broad-based collaboration of research groups specializ-ing in MD on DNA, the Ascona B-DNA Consortium (ABC).An up-to-date review of the ABC initiative is providedelsewhere in this issue. The emphasis in the ABC projectwas to generate a database suitable for understand the effectof effect of flanking base pairs on the structural properties ofall 10 unique dinucleotide steps (Beveridge et al. 2004a, b;Dixit et al. 2005; Lavery et al. 2010)). To thoroughly exam-ine context effects, the ABC project generated MD trajecto-ries for at least two copies of all 136 unique tetrameric steps.All simulations were carried out using the AMBER suite ofprograms and the parm94 force field of Cornell et al. (1995),the first explicit solvent force field to provide a reasonablemodel of B-form DNA (Cheatham III et al. 1995). A rela-tional data base was constructed to deal with the informaticsaspects of analysis (Dixit and Beveridge 2006). The resultsof the ABC consortium indicated that while some specificsteps are sensitive to sequence context effects, most steps arerelatively unaffected. Specifically, while YpR steps widelyimplicated in DNA bending (Calladine 1982) are intrinsical-ly the most flexible, they also are least affected by neigh-bouring base pairs. On the other hand, purine–purine andpurine–pyrimidine steps, which are found to be relativelyless flexible and in some cases such as A-tracts essentiallystraight and rigid, are the most sensitive to context effects.The ABC results also revealed a tendency in the parm94MDto undergo an irreversible conformational transition in thesugar–phosphate backbone parameters α and γ that traps theMD in a non-canonical conformational sub-state. Such α/γtransitions are observed in A-DNA (Gao et al. 1999) and arecommon in protein DNA crystal structures (Djuranovic andHartmann 2003; Sims and Kim 2003), but should be revers-ible. The AMBER force field for MD on DNA has subse-quently been corrected (Perez et al. 2007a, b). In the studyreported herein, the MD trajectories from the ABC proj-ect to date form the basis for analysis of the generalnature and sequence dependence of the hydration andion atmosphere of B-form DNA, including sequencecontext effects.
3. Methods
All simulations analysed in this study were carried out usingthe AMBER 6 or AMBER 7 suite of programs (Case et al.1999). The details of these simulations has been reportedpreviously by the ABC Consortium (Beveridge et al. 2004a,b; Dixit et al. 2005; Lavery et al. 2010). MD simulationswere carried out on all oligomers with repeating tetranucleo-tide sequences (ABCDABCDABCD…). Moving a 4-base‘reading frame’ along the oligomer, we located successivelyABCD, BCDA, CDAB and DABC tetranucleotides. Thelength of the oligomers was chosen to be 15 base pairs, a
compromise between the necessity to avoid end-effects andthe computational expense of the simulations. This strategyenables all 136 tetranucleotides to be studied based on only39 independent MD simulations. The ends of each oligomerwere capped with a single GC pair to avoid fraying. A given15-base-pair oligomer thus contains 3¼ tetranucleotiderepeats 5¶-G-D-ABCD-ABCD-ABCD-G-3¶, where A, B, Cand D are one of A, T, G or C
In all individual simulations the solute molecule is a 15-base-pair oligonucleotide with 28 K+ (Aqvist 1990) ionsadded to achieve system electroneutrality. The DNA withits counterions was simulated in a truncated octahedral boxhaving a face-to-face dimension of ~70 Å, which allows fora solvent shell extending for at least 10 Å around the DNA.The starting configuration has the oligomer in a canonical B-form structure. The ions are randomly placed around theoligomer, and located at least 5 Å from any atom of thesolute and at least 3.5 Å from one another in the initialstructure. The neutral ion–oligomer complex was solvatedwith TIP3P water molecules (Jorgensen 1981). Simulationswere performed with periodic boundary conditions in whichthe central cell contained ~8000 water molecules. Consider-ing the DNA, counterions and solvent water, the total systemconsisted of ~24000 atoms.
The preparations for MD simulations consisted of aninitial minimization followed by slow heating to 300 K atconstant volume over a period of 100 ps using harmonicrestraints of 25 kcal mol−1 Å−2 on the solute atoms. Theserestraints were slowly relaxed from 5 to 1 kcal mol−1 Å−2
during a series of five segments of 1000 steps of energyminimization and 50 ps equilibration using constant temper-ature (300 K) and pressure (1 bar) conditions via the Berend-sen algorithm (Berendsen et al. 1984) with a couplingconstant of 0.2 ps for both parameters. The final segmentconsisted of 50 ps equilibration with a restraint of0.5 kcal mol−1 Å−2 and 50 ps unrestrained equilibration.The simulations were then continued for a total of 15 ns atconstant temperature and pressure conditions, using theBerendsen algorithm (Berendsen et al. 1984) with a couplingconstant of 5 ps for both parameters. Electrostatic interac-tions were treated using the Particle Mesh Ewald (PME)algorithm (Essmann et al. 1995) with a real space cut-offof 9 Å, cubic B-spline interpolation onto the charge grid witha spacing of ~1 Å. SHAKE constraints (Ryckaert et al. 1977)were applied to all bonds involving hydrogen atoms. Theintegration time step was 2 fs. Centre-of-mass translationalmotion was removed every 5000 MD steps to avoid themethodological problems described by Harvey et al.(1998). The trajectories were extended to 15 ns for eacholigomer and conformations of the system were saved every1 ps for further analysis.
The program ptraj in AMBER contains procedures forgenerating many of the indices required for analysis of an
404 SB Dixit, M Mezei and DL Beveridge
J. Biosci. 37(3), July 2012
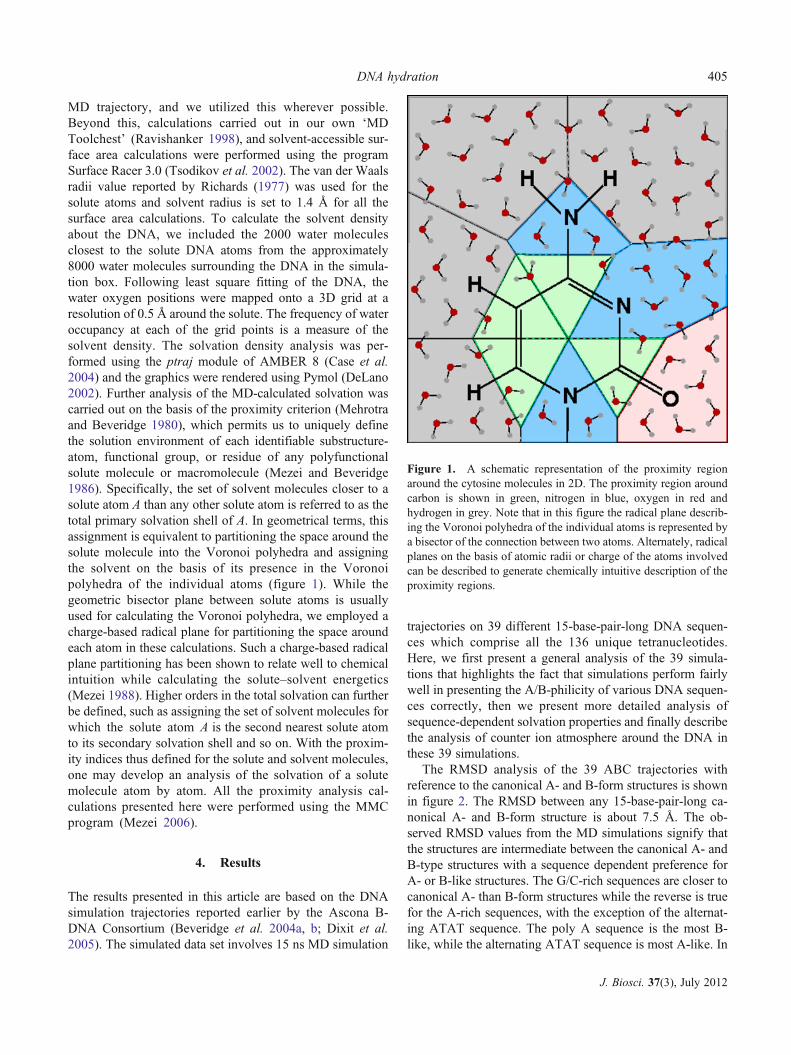
MD trajectory, and we utilized this wherever possible.Beyond this, calculations carried out in our own ‘MDToolchest’ (Ravishanker 1998), and solvent-accessible sur-face area calculations were performed using the programSurface Racer 3.0 (Tsodikov et al. 2002). The van der Waalsradii value reported by Richards (1977) was used for thesolute atoms and solvent radius is set to 1.4 Å for all thesurface area calculations. To calculate the solvent densityabout the DNA, we included the 2000 water moleculesclosest to the solute DNA atoms from the approximately8000 water molecules surrounding the DNA in the simula-tion box. Following least square fitting of the DNA, thewater oxygen positions were mapped onto a 3D grid at aresolution of 0.5 Å around the solute. The frequency of wateroccupancy at each of the grid points is a measure of thesolvent density. The solvation density analysis was per-formed using the ptraj module of AMBER 8 (Case et al.2004) and the graphics were rendered using Pymol (DeLano2002). Further analysis of the MD-calculated solvation wascarried out on the basis of the proximity criterion (Mehrotraand Beveridge 1980), which permits us to uniquely definethe solution environment of each identifiable substructure-atom, functional group, or residue of any polyfunctionalsolute molecule or macromolecule (Mezei and Beveridge1986). Specifically, the set of solvent molecules closer to asolute atom A than any other solute atom is referred to as thetotal primary solvation shell of A. In geometrical terms, thisassignment is equivalent to partitioning the space around thesolute molecule into the Voronoi polyhedra and assigningthe solvent on the basis of its presence in the Voronoipolyhedra of the individual atoms (figure 1). While thegeometric bisector plane between solute atoms is usuallyused for calculating the Voronoi polyhedra, we employed acharge-based radical plane for partitioning the space aroundeach atom in these calculations. Such a charge-based radicalplane partitioning has been shown to relate well to chemicalintuition while calculating the solute–solvent energetics(Mezei 1988). Higher orders in the total solvation can furtherbe defined, such as assigning the set of solvent molecules forwhich the solute atom A is the second nearest solute atomto its secondary solvation shell and so on. With the proxim-ity indices thus defined for the solute and solvent molecules,one may develop an analysis of the solvation of a solutemolecule atom by atom. All the proximity analysis cal-culations presented here were performed using the MMCprogram (Mezei 2006).
4. Results
The results presented in this article are based on the DNAsimulation trajectories reported earlier by the Ascona B-DNA Consortium (Beveridge et al. 2004a, b; Dixit et al.2005). The simulated data set involves 15 ns MD simulation
trajectories on 39 different 15-base-pair-long DNA sequen-ces which comprise all the 136 unique tetranucleotides.Here, we first present a general analysis of the 39 simula-tions that highlights the fact that simulations perform fairlywell in presenting the A/B-philicity of various DNA sequen-ces correctly, then we present more detailed analysis ofsequence-dependent solvation properties and finally describethe analysis of counter ion atmosphere around the DNA inthese 39 simulations.
The RMSD analysis of the 39 ABC trajectories withreference to the canonical A- and B-form structures is shownin figure 2. The RMSD between any 15-base-pair-long ca-nonical A- and B-form structure is about 7.5 Å. The ob-served RMSD values from the MD simulations signify thatthe structures are intermediate between the canonical A- andB-type structures with a sequence dependent preference forA- or B-like structures. The G/C-rich sequences are closer tocanonical A- than B-form structures while the reverse is truefor the A-rich sequences, with the exception of the alternat-ing ATAT sequence. The poly A sequence is the most B-like, while the alternating ATAT sequence is most A-like. In
Figure 1. A schematic representation of the proximity regionaround the cytosine molecules in 2D. The proximity region aroundcarbon is shown in green, nitrogen in blue, oxygen in red andhydrogen in grey. Note that in this figure the radical plane describ-ing the Voronoi polyhedra of the individual atoms is represented bya bisector of the connection between two atoms. Alternately, radicalplanes on the basis of atomic radii or charge of the atoms involvedcan be described to generate chemically intuitive description of theproximity regions.
DNA hydration 405
J. Biosci. 37(3), July 2012
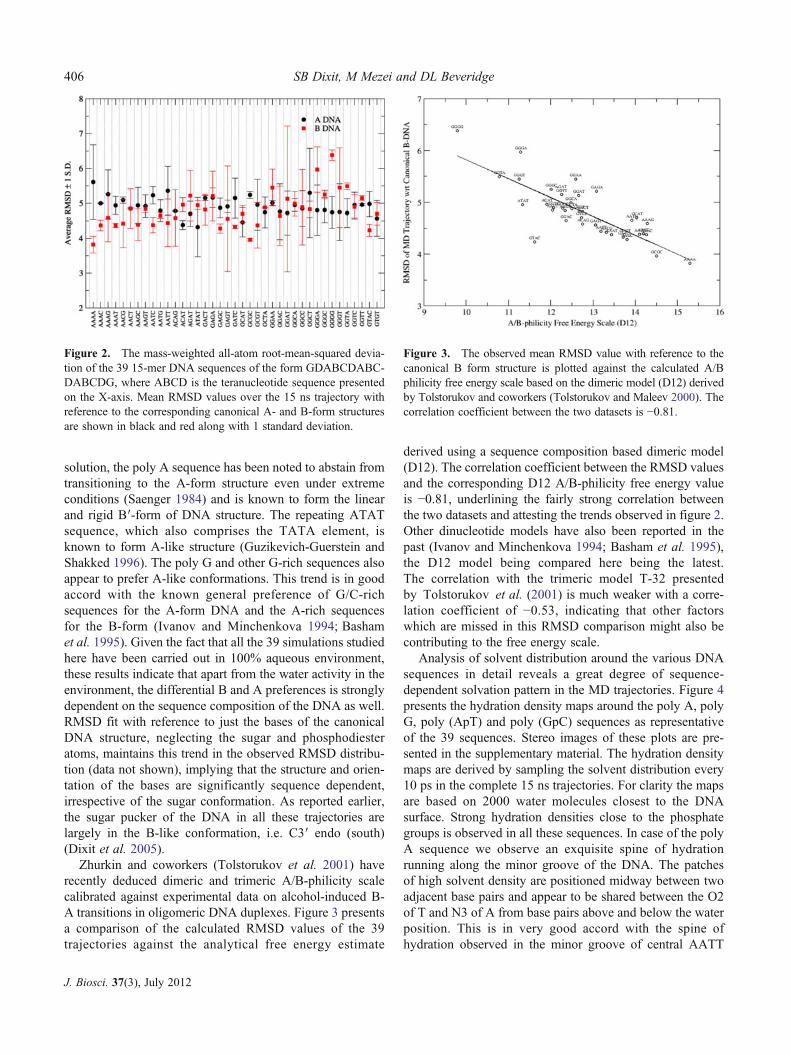
solution, the poly A sequence has been noted to abstain fromtransitioning to the A-form structure even under extremeconditions (Saenger 1984) and is known to form the linearand rigid B′-form of DNA structure. The repeating ATATsequence, which also comprises the TATA element, isknown to form A-like structure (Guzikevich-Guerstein andShakked 1996). The poly G and other G-rich sequences alsoappear to prefer A-like conformations. This trend is in goodaccord with the known general preference of G/C-richsequences for the A-form DNA and the A-rich sequencesfor the B-form (Ivanov and Minchenkova 1994; Bashamet al. 1995). Given the fact that all the 39 simulations studiedhere have been carried out in 100% aqueous environment,these results indicate that apart from the water activity in theenvironment, the differential B and A preferences is stronglydependent on the sequence composition of the DNA as well.RMSD fit with reference to just the bases of the canonicalDNA structure, neglecting the sugar and phosphodiesteratoms, maintains this trend in the observed RMSD distribu-tion (data not shown), implying that the structure and orien-tation of the bases are significantly sequence dependent,irrespective of the sugar conformation. As reported earlier,the sugar pucker of the DNA in all these trajectories arelargely in the B-like conformation, i.e. C3′ endo (south)(Dixit et al. 2005).
Zhurkin and coworkers (Tolstorukov et al. 2001) haverecently deduced dimeric and trimeric A/B-philicity scalecalibrated against experimental data on alcohol-induced B-A transitions in oligomeric DNA duplexes. Figure 3 presentsa comparison of the calculated RMSD values of the 39trajectories against the analytical free energy estimate
derived using a sequence composition based dimeric model(D12). The correlation coefficient between the RMSD valuesand the corresponding D12 A/B-philicity free energy valueis −0.81, underlining the fairly strong correlation betweenthe two datasets and attesting the trends observed in figure 2.Other dinucleotide models have also been reported in thepast (Ivanov and Minchenkova 1994; Basham et al. 1995),the D12 model being compared here being the latest.The correlation with the trimeric model T-32 presentedby Tolstorukov et al. (2001) is much weaker with a corre-lation coefficient of −0.53, indicating that other factorswhich are missed in this RMSD comparison might also becontributing to the free energy scale.
Analysis of solvent distribution around the various DNAsequences in detail reveals a great degree of sequence-dependent solvation pattern in the MD trajectories. Figure 4presents the hydration density maps around the poly A, polyG, poly (ApT) and poly (GpC) sequences as representativeof the 39 sequences. Stereo images of these plots are pre-sented in the supplementary material. The hydration densitymaps are derived by sampling the solvent distribution every10 ps in the complete 15 ns trajectories. For clarity the mapsare based on 2000 water molecules closest to the DNAsurface. Strong hydration densities close to the phosphategroups is observed in all these sequences. In case of the polyA sequence we observe an exquisite spine of hydrationrunning along the minor groove of the DNA. The patchesof high solvent density are positioned midway between twoadjacent base pairs and appear to be shared between the O2of T and N3 of A from base pairs above and below the waterposition. This is in very good accord with the spine ofhydration observed in the minor groove of central AATT
Figure 2. The mass-weighted all-atom root-mean-squared devia-tion of the 39 15-mer DNA sequences of the form GDABCDABC-DABCDG, where ABCD is the teranucleotide sequence presentedon the X-axis. Mean RMSD values over the 15 ns trajectory withreference to the corresponding canonical A- and B-form structuresare shown in black and red along with 1 standard deviation.
Figure 3. The observed mean RMSD value with reference to thecanonical B form structure is plotted against the calculated A/Bphilicity free energy scale based on the dimeric model (D12) derivedby Tolstorukov and coworkers (Tolstorukov and Maleev 2000). Thecorrelation coefficient between the two datasets is −0.81.
406 SB Dixit, M Mezei and DL Beveridge
J. Biosci. 37(3), July 2012

in the crystal structure of the Dickerson-Drew dodecamersequence (Kopka et al. 1983). In MD simulations of the polyG sequence, the minor groove sequence exhibits two peaksin the neighbourhood of each base pair positioned. Unlikethe poly A sequence, independent hydration densities areobserved for the O2 atom of C and N3 atom of G. In accordwith X-ray crystallographic observations (Schneider andBerman 1995; Egli et al. 1998), the N2 of G does not seemto make direct contact with waters in the first hydration shell.At most of the base pair step positions in this poly Gsequence, the hydration peak around the O2 atom of Cmerges with the hydration pattern around N3 atom of neigh-bouring G in the opposite strand on the 3′ side in a tandem
orientation. The GGCC sequence presents a similar doublepeak at each base pair step. This is in contrast to the report ofSchneider and Berman (1995), which suggests that a GGCCsequence in the position of an AATT sequence in theDickerson-Drew dodecamer would also exhibit a similarspine of hydration composed of a single hydration peakbetween each base pair. The major groove of the poly Gsequence presents two well-organized tracks of water density.Note that the solvent distribution patterns are much weaker inthe poly (ApT) and poly (GpC) sequences compared to thepoly A and poly G sequences. Apart from the sequence com-position, the increased level of flexibility and dynamicsexhibited by these sequences with the pyrimidine-purine
Figure 4. Solvent density around the (a) poly A, (b) poly (ApT), (c) poly G and (d) poly (GpC) sequences. The DNA structures arederived from the average structure of the 15 ns long trajectories of each sequence. The central 13 base pairs of the 15-base-pair-long DNAsequence is shown. The water distribution about the complete DNA is contoured at a density of 25 hits per 0.5 Å3 and is shown as light greygrid. The solvent densities within 3.5 Å of the polar atoms are shown as the orange grid in the major groove and violet grid in the minorgroove. The density of groove bound water molecules is plotted at the level of 30 hits per 0.5 Å3. The figures to the right present detailedview of the solvent density in the major (top) and minor (bottom) groove in each case.
DNA hydration 407
J. Biosci. 37(3), July 2012

Figure 4. (continued).
Figure 5. Selection of major and minor groove atoms for proximity analysis. The atoms labeled in blue are considered to lie in the majorgroove and the one labelled in red lie in the minor groove.
408 SB Dixit, M Mezei and DL Beveridge
J. Biosci. 37(3), July 2012

(YpR) steps are responsible for the decreased solvation patternin these figures.
The proximity analysis (Mehrotra and Beveridge 1980;Mezei and Beveridge 1986) offers a more detailed approachto quantify the general solvent distribution in terms of thecoordination numbers, solvation volume of individualatoms in the solute and their corresponding interactionenergies. The classification of atoms in the nucleotide asbelonging to the major groove, minor groove, sugar and
phosphate groups for these proximity calculations isdepicted in figure 5. A summary of the results derived fromthe proximity analysis of 39 simulation trajectories is pro-vided in table 1. The average values for the A, T, G and Cnucleotides and their base pairs from data in all the 39trajectories is employed to summarize this data. The netcoordination number of both AT and GC base pairs in thefirst solvation shell is not significantly different and both thebase pairs are coordinated by approximately 14 water
Table 1. Average results from proximity analysis of the 39 ABC trajectories
<K>a <2 K>b <TK>c <VFS>d <SLTBE>e <TSLTBE>f <BEWWT>g
Complete Nucleotide
G 7.4 26.5 74.1 522.1 −101.1 −201.0 −222.1A 7.0 26.1 71.4 509.6 −95.4 −198.8 −224.6C 6.8 26.4 72.7 478.1 −92.0 −189.6 −225.4T 6.8 27.4 71.6 508.8 −95.7 −197.6 −221.0AT 13.7 53.5 143.1 1018.4 −191.1 −396.4 −445.6CG 14.3 52.9 146.9 1000.2 −193.1 −390.6 −447.5Sugar
G 0.1 6.9 13.4 151.5 −0.7 −36.3 −100.4A 0.1 6.7 12.8 151.1 −0.7 −36.5 −99.4C 0.0 6.3 11.5 148.0 −0.4 −32.5 −99.0T 0.0 5.8 9.4 147.3 −0.3 −30.3 −98.3AT 0.1 12.5 22.2 298.4 −1.0 −66.8 −197.7CG 0.1 13.1 24.9 299.5 −1.1 −68.8 −199.4Phosphate
G 5.6 15.8 56.7 178.5 −82.2 −135.3 −51.7A 5.6 15.7 54.5 177.9 −81.8 −135.6 −52.6C 5.6 15.8 55.9 178.4 −81.4 −134.0 −52.0T 5.6 15.6 53.5 179.3 −81.7 −135.3 −51.6AT 11.2 31.2 108.1 357.2 −163.5 −270.9 −104.2CG 11.3 31.6 112.5 356.9 −163.6 −269.3 −103.6Major Groove
G 1.1 2.3 2.6 103.6 −14.1 −19.7 −34.5A 0.9 3.0 3.4 114.4 −8.5 −19.8 −54.9C 0.6 3.8 4.8 108.6 −3.6 −16.6 −65.1T 0.6 5.4 8.1 131.1 −6.7 −25.0 −62.6AT 1.5 8.4 11.5 245.5 −15.2 −44.8 −117.5CG 1.8 6.1 7.4 212.2 −17.8 −36.3 −99.6Minor Groove
G 0.6 1.4 1.4 88.9 −4.4 −10.1 −35.5A 0.4 0.6 0.6 66.6 −4.5 −7.0 −17.7C 0.5 0.5 0.5 42.6 −6.2 −6.2 −9.3T 0.5 0.5 0.5 50.8 −6.9 −6.9 −8.5AT 0.9 1.2 1.2 117.4 −11.4 −14.0 −26.2CG 1.1 1.9 1.9 131.5 −10.6 −16.3 −44.7
a: Number of waters in first hydration shell; b: number of water in the first two hydration shells; c: total number of water molecules in theproximity region; d: volume of first shell (Å3 ); e: interaction energy of solute with waters in first hydration shell (kcal/mol); f: total solute–water interaction energy in the proximity region; g: water–water interaction energy of molecules in the proximity region.
DNA hydration 409
J. Biosci. 37(3), July 2012

molecules in the first solvation shell. Note that the firstsolvation shell is defined on the basis of the first min-ima in the calculated primary radial distribution function.About 80% of the water molecules in the first hydrationshell are coordinating the phosphate group, while themajor and minor grooves are associated with the remain-ing 20% of the water molecules. A similar trend has beenreported in the X-ray crystallographic analysis of hydration inthe A- and B-form structures (Egli et al. 1998). Evaluation ofthe first solvent shell volume for the different regions of thenucleotide against the corresponding first shell coordinationnumber indicates that phosphate groups preferentially attracta larger number of solvent molecules in a comparable vol-ume of space. On considering both the first and secondhydration shell, there are about 53 water molecules solvatingeach nucleotide, with approximately equal number of watermolecules observed around both the purines and pyrimi-dines. In subsequent layers of hydration, the associationof water molecules by the phosphate group goes downto about 60% as the water structuring introduces mole-cules in the proximity region of sugar atoms as well.About 15% of the water molecules around the DNAappear in the proximity region of the sugars. Note thatgoing by the description of proximity region, the minorgroove atoms are completely closed from solvent accessbeyond the first few solvent layers.
Considering the ratio of total solute–solvent interac-tion energy to the total coordination number in eachregion of the nucleotide in table 1, the strongest interac-tions of the solute atoms occur with waters bound to theminor groove, followed by those in the proximity regionof the major groove atoms. The last column of table 1presents the interaction energy of water molecules in aparticular proximity region with other water molecules within a distance of 4 Å. This value is noticeably large forthe waters in the proximity of the sugars compared tothe phosphate. This explains the fact that the hydropho-bic nature of the sugar atoms forces the water moleculesin its proximity region to make strong interactionsamong themselves. On the other hand, the water mole-cules in the proximity region of the phosphate groupalign themselves in such a manner that the solute–sol-vent interactions are much stronger than the solvent–solvent interactions.
As noted earlier the proximity criterion provides a meansto analyze solvation effect at the individual nucleotide levelfor each DNA trajectory independently. A representativeplot of the average coordination number and interactionenergy at the sequence level for the GTGGATGGATGGATG sequence is shown in figure 6. The results indicatethat while it is difficult to discern the differences betweensequences on the basis of solvation in the first hydrationshell, the sequence-dependent solvation properties become
apparent on considering the subsequent layers of solvation.The AT pairs appear to be more solvated in the major groovethan the GC base pairs. We notice strong difference betweenthe solvation properties of AT and GC major grooves onincluding the bulk solvent. While a sequence-dependenttrend is observed in the minor grove as well, the sequenceeffect is not as strong. Neglecting end-effects, the repeatingsequence pattern in the DNA sequence causes a symmetricaltrend in the calculated solute–solvent interaction energy andthe average coordination number. The difference in trend ofthe number of coordinated water molecules and interactionenergy in the first shell and bulk supports the idea that thedefinition of hydration layer or the solvent shell radiuswould determine the number of water molecules observedin that layer.
Figure 6. The average (a) coordination number and (b) averageinteraction energy of d(GTGGATGGATGGATG) duplex simula-tion in water derived by proximity analysis.
410 SB Dixit, M Mezei and DL Beveridge
J. Biosci. 37(3), July 2012
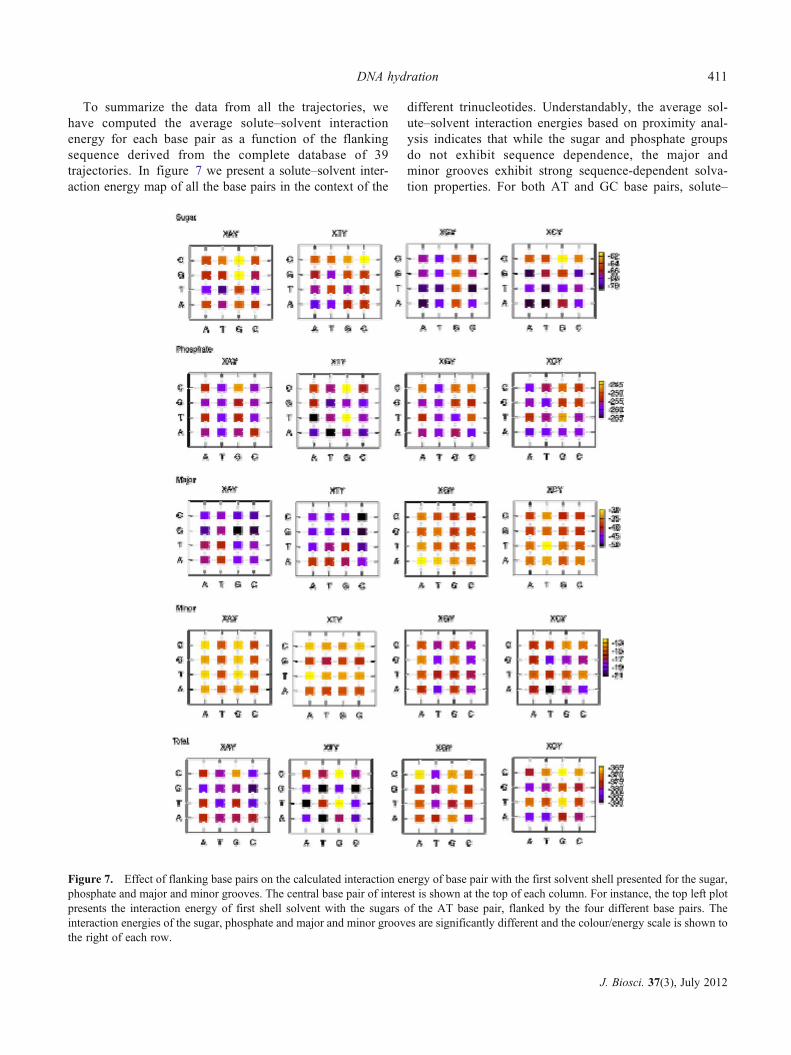
To summarize the data from all the trajectories, wehave computed the average solute–solvent interactionenergy for each base pair as a function of the flankingsequence derived from the complete database of 39trajectories. In figure 7 we present a solute–solvent inter-action energy map of all the base pairs in the context of the
different trinucleotides. Understandably, the average sol-ute–solvent interaction energies based on proximity anal-ysis indicates that while the sugar and phosphate groupsdo not exhibit sequence dependence, the major andminor grooves exhibit strong sequence-dependent solva-tion properties. For both AT and GC base pairs, solute–
Figure 7. Effect of flanking base pairs on the calculated interaction energy of base pair with the first solvent shell presented for the sugar,phosphate and major and minor grooves. The central base pair of interest is shown at the top of each column. For instance, the top left plotpresents the interaction energy of first shell solvent with the sugars of the AT base pair, flanked by the four different base pairs. Theinteraction energies of the sugar, phosphate and major and minor grooves are significantly different and the colour/energy scale is shown tothe right of each row.
DNA hydration 411
J. Biosci. 37(3), July 2012

solvent interactions are stronger in the major groovethan in the minor groove. The AT base pairs bind watermolecules much more strongly in the major groove thanthe GC base pairs. On the other hand, water moleculesin the minor groove of GC base pairs bind more strong-ly than to the AT base pair. While the difference be-tween the AT and GC base pair solvation energies canbe as high as 60%, the range of solvent interactionenergy for the trinucleotides where the central basepairis AT / TA (or GC / CG) is fairly small. Thus, thisresult suggests that the solvation of individual base pairsgrooves is fairly local in agreement with earlier crystal-lographic analysis (Schneider and Berman 1995).
Analysis of the solvent radial distribution around thedifferent electronegative atoms in the simulated DNAtrajectories reveals that while distinct distribution pat-terns are observed as a function of the atoms typesand the nucleotide, the radial distributions functions (RDF)are not very sensitive to the sequence composition of the DNA.In figure 8 we present the radial distribution function ob-served for various atom types in the GTGGATGGATG-GATG sequence. The O1P and O2P atoms of thephosphate groups are the most clearly solvated atomswith a sharp peak at about 2.8 Å. We observe a secondpeak about 5.0 Å and a very small third peak at about7.0 Å. While the O5′ and O3′ atoms also exhibit theprimary solvation peak at about 3.0 Å, these atoms typeslack the subsequent solvation shells observed in the caseof O1P and O2P. The solvation pattern around the O4′atoms of all the four nucleotides are fairly weak and
indistinguishable. The RDF of N7 atoms in A and Gexhibit a strong peak at about 3.0 Å. A secondary peakshows up at 5.0 Å but the sampling in this region appearsto be much weaker. The N3 atom of A and G onlyexhibits the primary peak at about 2.8 Å. Notice thatfor all RDFs the value at the first minimum is stillsignificantly larger than zero. This means that there isno distinct separation between the first and second shells.This explains the observed sensitivity of coordination numb-ers to the choice of first shell radius value.
We have also compared the solvent-accessible surfaceareas (SASA) of the four nucleotides in the crystallo-graphic database and the SASA calculated from MDsimulations of diverse nucleic acid sequences in solu-tion. Figure 9 presents a comparison of the solvent acces-sible surface area derived from the database of 49 DNAcrystal structures with resolution higher than 3.0 Å classifiedas B-DNA (PDB IDs are presented in supplementary table 1)and the 39 MD simulation trajectories. The phosphategroups are the most solvent accessible component ofthe nucleotide followed by the sugars. The thymine baseis most solvent accessible in the major groove, whileguanine is most accessible in the minor groove. The netaccessibility of the AT and GC base pairs are almostequal, the AT base pairs being more accessible in themajor groove and the GC pairs being more accessible inthe minor groove.
A recent analysis of the solvation energetics of dinucleo-tides extracted from ABC trajectories provides a clue to thefunctional destiny of genomic DNA sequences. Solvation
Figure 8. Radial distribution function of waters around electronegative atoms in the GTGGATGGATGGATC sequence.
412 SB Dixit, M Mezei and DL Beveridge
J. Biosci. 37(3), July 2012

energetics clearly separates DNA coding for mRNA fromthat coding for tRNA (Khandelwal and Jayaram 2012).
All the 39 simulations studied here have been performedwith minimal number of cations required to neutralize the netcharge of the system. In particular, 28 K+ ions (Aqvist 1990)were included in the simulation box of TIP3P water mole-cules along with the solute DNA molecule. Figure 10presents an overlay of the ion atmosphere from 1500 snap-shots in a 15 ns long trajectory of the poly A sequence. Theions have been colour-coded according to their distance from
the central axis of the DNA. The axis is defined by the lineconnecting the centres of the two penultimate base pairsat the ends of the DNA sequence. A distinct variation inthe density of ions close to the DNA surface extendingto a distance of about 15 to 20 Å and the space beyondis observed. This is in excellent agreement with theManning’s Counterion Condensation Theory (Manning1978), which describes a layer of ‘condensed counterions’around the DNA followed by an extended layer of diffuseDebye-Huckel-like ion atmosphere.
Figure 9. The classification of the average solvent accessible surface area (SASA) of the unique nucleotides in 49 B-DNA crystalstructures (in black) compared with average SASA data derived from the 39 15 ns long MD trajectories sampled every 10 ps. The atom-wise SASA has been employed to determine the contribution of the sugar, phosphate and major and minor grooves to the total SASA.
DNA hydration 413
J. Biosci. 37(3), July 2012

A plot of the cumulative number of ions as a functionof distance from DNA provides further insight into thepercentage of counterions present within the region ofcondensed counterions. Figure 11 shows the radial distri-bution function and the cumulative number of K+ ionsaround the DNA as a function of the distance from thecentral axis of DNA in all the 39 trajectories. For the radialdistribution function g(r) and cumulative ion condensation N(r) calculations, the ions were binned at 1 Å resolution andions which are located above or below the planes describedby the two penultimate base pairs are left out. The volumeelement for g(r) is calculated from the concentric cylindersaround the central axis of the DNA, neglecting the volumecorrection required for the volume occupied by the solute.Matching the graphical representation in figure 11, the graphof the cumulative counterion condensation data indicates aninflexion point near about 20 Å and all the sequences haveroughly about 60–70% of the cumulative charge distributioncondensed at this distance. Manning’s Counterion Condensa-tion Theory proposes that close to 74% of the polyelectrolytecharge could be shielded by the ions present in thecondensation region. The height of the first peak in theg(r) plot is different for all the sequences, notably be-tween the A-rich and G-rich sequences. This indicatesthe sequence-dependent differences in groove bindingpreference. These ions correspond to the ones that arecoloured in shades of dark blue in figure 10 whichappear in the grooves (largely the major groove) of theDNA. Beyond this first peak the g(r) is very similar for allthe 39 sequences. A consistent second maxima in the g(r)plot is observed at about 13 Å from the DNA surface.
In order to analyse the nature of ion binding to theDNA grooves, figure 12a and b shows, for example, thetimeline of ion localization in the vicinity of the DNAmolecules for the sequences composed of repeating
tetranucleotides AAAA and AAGG. Each dot in these plotsrepresents an event involving the approach of a cation within4 Å of the electronegative atoms in the groove or thebackbone of the DNA. Only cations that persist in thatlocation for more than 2 ps are shown, and ion approachevents shorter than this period of time are assumed to benon-binding diffusion. We observe that ions are consis-tently present in the vicinity of phosphate oxygen atomsbut selectively access the grooves of the DNA in asequence-dependent fashion. Ion localization in the vi-cinity of the phosphate groups is altered by the basesequence composition in the DNA. Figure 12c and dpresents the cumulative time period over which ions arelocalized along the length of the DNA. The total extent ofion localization and symmetry in localization patternbecomes apparent in these graphs. Ion approach and locali-zation events are significantly more frequent in the majorgroove than in the minor groove. The repeating compositionof the DNA sequences simulated here provides an opportu-nity to appreciate the extent of ion convergence around theDNA. Some of the sequences (such as AAGG shown infigure 12) exhibit a sequence-dependent ion localizationpattern in the major groove in the form of increased locali-zation at the GG steps. In other cases such as the AAAAsequence, no symmetric patterns can be detected in the ionlocalization plots. Hence, the degree of ion convergenceappears to be a strongly sequence-dependent phenomena.
An analysis of the crystallographic database for the pres-ence of monovalent cations in the vicinity of the AT and GCbase pairs is presented in table 2. This data is derived fromthe Solvation Web Server (http://tatooine.u-strasbg.fr/~sws/SwS.html) developed by Auffinger and Hashem (2007). Allthe B-DNA crystal structures at a resolution of 3.0 Å orhigher have been searched for the regular Watson–CrickAT and GC base pairs and monovalent cations within 4 Å
Figure 10. The cumulative counter ion distribution around the poly A sequence in the 15-ns-long molecular dynamics trajectory. Iondistribution in the trajectory has been sampled every 10 ps. The first solute structure in the trajectory that was used as reference is shown.The ions have been colour-coded on the basis of their distance from the helical axis of the DNA.
414 SB Dixit, M Mezei and DL Beveridge
J. Biosci. 37(3), July 2012

of their electronegative atoms are selected. As of October2006, the database reveals 7070 GC and 7408 AT basepairs respectively. Of these, only 90 GC pairs and 65AT pairs are directly associated with some monovalentcations. The bulk of the associated cations are Na+
followed by a smaller number of K+, Tl+, Rb+ or Cs+. The
data in table 2 presents a breakup of all these ion–base paircontacts in terms of the grooves and backbone. In the crystalstructures the GC pairs make larger number of contacts withthe cations in the major groove than the AT base pairs. Onthe other hand, in the minor groove, the AT pairs make moreion contacts than the GC pairs.
Figure 11. (a–d) radial distribution function g(r) of K+ ions around the 39 DNA trajectories. The distance r of the ion is calculated withreference to the central axis of the solute DNA. The volume is calculated for concentric cylinders around the DNA axis and the correction inthe radial distribution function because of the solute volume has been neglected. (e) The normalized cumulative number of ionscondensation as a function of distance from DNA surface for all the 39 trajectories. All the sequences exhibit an inflexion point in therange of 15 to 20 Å.
DNA hydration 415
J. Biosci. 37(3), July 2012

To summarize the ion localization results, figure 13presents the normalized histograms of the observed net ionlocalization times for the AT (or TA) and GC (or CG) basepairs in the major and minor grooves of the DNA structure inthe MD simulations and the crystal structure data. The plot isbased on the data of all occurrence of the AT and GC basepairs at the central 13 base pair steps of the 15 base pairsequences, in the complete dataset of 39 trajectories. Theextent of ion localization in the major groove is almost anorder of magnitude higher than in the minor groove. In the15-ns-long trajectories, the major grooves of the AT and GCbase pairs appear to cumulatively localize ions to the extentof 1 ns and 2.5 ns respectively, while the localization in theminor groove averages to only about a few 100 ps. Thecomplete dataset confirms that the GC pairs assimilate moreions in the major groove than the AT base pairs. In the minorgroove, the AT base pairs appear to attract K+ ions morefrequently compared to the GC pairs.
5. Discussion
In this article we have presented detailed analysis of thesolvation and ion distribution around DNA in a databaseof 39 MD trajectories comprising all the unique tetranu-cleotide sequences. Each of the trajectories is 15 ns longand the total simulation length amounts to about 0.6 μs.Based on this extensive database of trajectories we havebeen able to analyse the intrinsic propensity of variousDNA sequences to adopt the A- or B-like DNA struc-tures. The trend observed in A/B-philicity in the MDsimulations compare well with the empirically basedmodel for predicting A-philicity, confirming that thepresent simulations model performs very well at predict-ing the sequence-directed structural properties of DNA.This is a valuable information that can be derived fromsimulations, which is critical in understanding the prop-erties of reversible A↔B transitions critical for develop-ing complete appreciation of DNA structure and itsrecognition by proteins.
�Figure 12. (a) Timeline of ion localization within 4 Å of the elec-tronegative atoms in the GAAAAAAAAAAAAAG sequence. (b)Timeline of ion localization within 4 Å of the electronegative atomsin the GAGGAAGGAAGGAAG sequence. Ions in the vicinity of themajor groove, minor groove and backbone are coloured green, blue andred respectively. The separation of ions from the N7 or O6 atoms of G,N4 of C, N7 or N6 atom of A and O4 of T in the major groove aremeasured. For the minor groove, separation from N9, N3 or N2 of G,N1 or O2 of C, N9 or N3 of A and N1 or O2 of T is measured.Separation from O1P, O2P, O3′ and O5′ is measure for the backbone.(c–d) Derived from (a) and (b) respectively, these plot shows thecumulative time during which ions are observed in the vicinity of theparticular base pair.
416 SB Dixit, M Mezei and DL Beveridge
J. Biosci. 37(3), July 2012

Ion localization close to the DNA structure has importantimplications for the structural properties of the molecule. Inthe past MD simulations (Young et al. 1997a, b) of theEcoRI endonuclease sequence CGCGAATTCGCG hadshown that a Na+ ion could intrude the minor groove andoccupy the position of a water molecule in the spine ofhydration. Subsequently, it has been shown with high-resolution X-ray crystallography (Shui et al. 1998) andNMR (Denisov and Halle 2000) that ions could replacewater molecules in the spine of hydration. An extended60-ns-long MD simulation of the same sequence hadrevealed that the ion localization in the minor grooveof the central AATT region was not a very frequentevent (Ponomarev et al. 2004). In the dataset analysed here,which totals to almost 0.6 μs, we noted that localization ofions in the minor groove of ApA or ApT steps is a rare event.In the event such localization occurs, the extent of localiza-tion is usually limited to less that 1 ns. We observed thatsuch localization events do not occur symmetrically in allrepeating sections of the sequence, indicating that rarity ofsuch binding and the shortness of the 15-ns-long simulations
to normalize ion distribution. It has been shown inearlier simulations that the K+ ions diffuse faster andlocalize less than Na+ ions (Varnai and Zakrzewska 2004)in simulations of the DNA. In all the simulations pur-sued here, K+ ions have been the only counterion species inthe solution environment and this could be a cause for thelack on localization observed in these simulations. In anearlier study (Varnai and Zakrzewska 2004), it was shownthat the presence of Na+ as counterions during the DNAsimulation led to a greater degree of non-canonical α/γsubstates in comparison with simulations employing K+
ions. This was attributed to the tendency of Na+ ions tosequester in the minor groove of the DNA structure, whileK+ ions do not.
6. Conclusions
Results from the analysis of solvent and counter ion distri-bution in 39 different MD simulation trajectories comprisingmultiple copies of all the 136 unique tetranucleotide stepswere presented. Comparison of the DNA structures inthe simulated trajectories with the canonical A- and B-form structures reveals that the G/C-rich sequences arecloser to canonical A- than B-form structures, while thereverse is true for the poly A sequences with the excep-tion of the alternating ATAT sequence. Analysis ofhydration density maps reveals that the flexibility ofsolute molecule has a significant effect on the natureof observed hydration. While DNA structures of thepoly A and poly G sequences, which are fairly stiff,present regular hydration patterns such as the spine ofhydration in the case of poly A sequence, the relativelyflexible structures such as the poly GpC sequence havevery little regular hydration. Energetic analysis of solute–
Figure 13. Observed frequency of cation localization in the grooves of the DNA derived from a database of 39 different 15 ns long MDtrajectories. The presented data is normalized over the complete dataset which included 210 and 218 copies of the AT and GC base pairsrespectively. Only the central 11 base pairs of the 15-mer DNA sequences were included in this analysis to avoid end-effects. The crystaldata is based on analysis of DNA structures at a resolution finer than 3.0 Å in the nucleic acid database (NDB) (table 2).
Table 2. Observed frequency of cations in the vicinity of AT andGC base pairs in B-DNA crystal structure at a resolution higherthan 3.0 Å available in the NDB
Ions Major groove Minor groove Backbone Total
GC 55 6 75 136
AT 17 14 53 84
Water Major groove Minor groove Backbone Total
GC 3649 1489 5217 10355
AT 2824 1425 5494 9743
Monovalent cations within 4.0 Å of the electronegative atoms in thegrooves or phosphodiester backbone are considered. Data obtainedfrom the Solvation Web Site (Auffinger and Hashem 2007).
DNA hydration 417
J. Biosci. 37(3), July 2012

solvent interactions based on proximity analysis of sol-vent reveals that the GC or CG base pairs interact morestrongly with water molecules in the minor groove ofDNA that the AT or TA base pairs. On the other hand,the interactions of the AT or TA pairs in the majorgroove are stronger than those of the GC or CG pairs.Computation of solvent-accessible surface area of thenucleotide units in the simulated trajectories reveals thatthe similarity with results derived from analysis of adatabase of crystallographic structures is excellent. Irre-spective of the sequence composition, all the MD trajecto-ries tend to obey the Manning’s counterion condensationtheory, presenting a region of condensed counterionswithin a radius of about 17 Å from the DNA surface.The GC and CG pairs tend to associate with cations inthe major groove of the DNA structure to a greaterextent than the AT and TA pairs. Cation association ismore frequent in the minor groove of AT than the GCpairs. In general, the observed water and ion atmospherearound the DNA sequences is the MD simulation is ingood agreement with experimental observations.
Acknowledgements
We gratefully acknowledge support from MRAC awardCHE050040P, SDSC account WEU202, NIH grantGM37909 to DLB, The Keck Center for Integrative Genomicsat Wesleyan University and the HHMI grant 52005211. Wethank the participants of the Ascona B-DNA Consortium forkindly sharingwith us the trajectories of the 39DNA sequences.DLB acknowledges support from Dr Joshua Boger and theWE Coffman family.
References
Albiser GA, Lamiri A and Premilat S 2001 The A–B transition:temperature and base composition effects on hydration of DNA.Int. J. Biol. Macromol. 28 199–203
Anderson CF and Record Jr MT 1982 Polyelectrolyte theories andtheir application to DNA. Annu. Rev. Phys. Chem. 33 191–222
Aqvist J 1990 Ion-water interaction potentials derived from freeenergy perturbation simulations. J. Phys. Chem. 94 8021–8024
Arthanari H, McConnell KJ, Beger R, YoungMA, Beveridge DL andBolton PH 2003 Assessment of the molecular dynamics structureof DNA in solution based on calculated and observed NMRNO-ESY volumes and dihedral angles. Biopolymers 68 1097–0282
Auffinger P and Hashem Y 2007 SwS: a solvation web service fornucleic acids. Bioinformatics 23 1035–1037
Basham B, Schroth GP and Ho PS 1995 An A-DNA triplet code:thermodynamic rules for predicting A- and B-DNA. Proc. Natl.Acad. Sci. USA 92 6464–6468
Berendsen HJ, Postma JP, van Gusteren WF, DiNola A and HaakJR 1984 Molecular dynamics with coupling to an external bath.J. Chem. Phys. 81 3684–3690
Berman HM and Schneider B 1999 Nucleic acid hydration; inOxford handbook of nucleic acid structure (ed) S Neidle(Oxford: Oxford University Press) pp 295–312
Beveridge DL, Barreiro G, Byun KS, Case DA, Cheatham TE III,Dixit SB, Giudice E, Lankas F, et al. 2004 Molecular dynamicssimulations of the 136 unique tetranucleotide sequences of DNAoligonucleotides. I. Research design and results on d(CpG)steps. Biophys. J. 87 3799–3813
Beveridge DL, Dixit SB, Barreiro G and Thayer KM 2004 Molec-ular dynamics simulations of DNA curvature and flexibility:helix phasing and premelting. Biopolymers 73 380–403
Calladine CR 1982 Mechanics of Sequence-dependent Stacking ofBases in B-DNA. J. Mol. Biol. 161 343–352
Case DA, Pearlman DA, Caldwell JW, Cheatham IIIT E, Ross WS,Simmerling CL, Darden TA, Merz KM, et al. 1999 AMBER 6(San Francisco: University of California)
Case DA, Darden TA, Cheatham IIIT E, Simmerling CL, Wang J,Duke RE, Luo R, Merz KM, et al. 2004 AMBER 8 (SanFrancisco: University of California)
Chalikian TV and Breslauer KJ 1998 Volumetric properties ofnucleic acids. Biopolymers 48 264–280
Chalikian TV, Sarvazyan AP, Plum GE and Breslauer KJ 1994Influence of base composition, base sequence, and duplexstructure on DNA hydration: apparent molar volumes andapparent molar adiabatic compressibilities of synthetic andnatural DNA duplexes at 25 degrees C. Biochemistry 332394–2401.
Cheatham IIIT E and Kollman PA 1996 Observation of the A-DNAto B-DNA transition during unrestrained molecular dynamics inaqueous solution. J. Mol. Biol. 259 434–444
Cheatham IIIT E and Kollman PA 1997 Molecular DynamicsSimulations Highlight the structural differences among DNA:DNA, RNA:RNA and DNA:RNA hybrid duplexes journal. J.Am. Chem. Soc. 119 4805–4825
Cheatham IIIT E and Young MA 2000 Molecular dynamics simu-lation of nucleic acids: successes, limitations, and promise. Bio-polymers 56 232–256
Cheatham TE III, Miller JL, Fox T, Darden TA and Kollman PA1995 Molecular dynamics simulations on solvated biomolecularsystems: The particle mesh Ewald method leads to stable trajec-tories of DNA, RNA, and proteins. J. Am. Chem. Soc. 1174193–4194
Chen YZ and Prohofsky EW 1993 Synergistic effects in the meltingof DNA hydration shell: melting of the minor groove hydrationspine in poly(dA)poly(dT) and its effect on base pair stability.Biophys. J. 64 1385–1393
Chiu TK, Kaczor-Grzeskowiak M and Dickerson RE 1999 Absenceof minor groove monovalent cations in the crosslinked dodeca-mer C-G-C-G-A-A-T-T-C-G-C-G. J. Mol. Biol. 292 589–608
Chocholousova J and Feig M 2006 Implicit solvent simulations ofDNA and DNA-protein complexes: agreement with explicitsolvent vs experiment. J. Phys. Chem. B 110 17240–17251
Cornell WD, Cieplak P, Bayly CI, Gould IR, Merz KM, FergusonDM, Spellmeyer DC, Fox T, et al. 1995 A second generationforce field for the simulation of proteins, nucleid acids andorganic molecules. J. Am. Chem. Soc. 117 5179–5197
DeLano WL 2002 The PyMOL molecular graphics system (SanCarlos, CA: DeLano Scientific)
418 SB Dixit, M Mezei and DL Beveridge
J. Biosci. 37(3), July 2012

Denisov VP and Halle B 2000 Sequence-specific binding of coun-terions to B-DNA. Proc. Natl. Acad. Sci. USA 97 629–633
Dixit SB and Beveridge DL 2006 Structural bioinformatics ofDNA: a web-based tool for the analysis of molecular dynamicsresults and structure prediction. Bioinformatics 22 1007–1009
Dixit SB, Beveridge DL, Case DA, Cheatham TE III, Giudice E,Lankas F, Lavery R, Maddocks JH, et al. 2005 Moleculardynamics simulations of the 136 unique tetranucleotide sequen-ces of DNA oligonucleotides II: Sequence context effects on thedynamical structures of the 10 unique dinucleotide steps.Biophys. J. 89 3721–3740
Dixit SB, Ponomarev SY and Beveridge DL 2006 Root meansquare deviation probability analysis of molecular dynamicstrajectories on DNA. J. Chem. Inf. Model. 46 1084–1093
Djuranovic D and Hartmann B 2003 Conformational characteristicsand correlations in crystal structures of nucleic acid oligonucleo-tides: evidence for sub-states. J. Biomol. Struct. Dyn. 20 771–788
Duan Y, Wilkosz P, Crowley M and Rosenberg JM 1997Molecular dynamics simulation study of DNA dodecamerd(CGCGAATTCGCG) in solution: conformation and hydra-tion. J. Mol. Biol. 272 553–572
Egli M, Tereshko V, TeplovaM,Minasov G, Joachimiak A, SanishviliR, Weeks CM, Miller R, et al. 1998 X-ray crystallographicanalysis of the hydration of A- and B-form DNA at atomicresolution. Biopolymers 48 234–252
Eisenstein M and Shakked Z 1995 Hydration patterns and intermo-lecular interactions in A-DNA crystal structures. Implicationsfor DNA recognition. J. Mol. Biol. 248 662–678
Elcock AH and McCammon JA 1995 Sequence dependenthydration of DNA: Theoretical results. J. Am. Chem. Soc.117 10161–10162
Essmann U, Perera L, Berkowitz ML, Darden T, Lee H and Ped-ersen LG 1995 A smooth particle mesh Ewald method. J. Chem.Phys. 103 8577–8593
Feig M and Pettitt BM 1998 A molecular simulation picture of DNAhydration around A- and B-DNA. Biopolymers 48 199–209
Feig M and Pettitt BM 1999 Modeling high-resolution hydra-tion patterns in correlation with DNA sequence and confor-mation. J. Mol. Biol. 286 1075–1095
Franklin RE and Gosling RG 1953 The structure of sodium thy-monucleate fibers I. The influence of water content. Acta Cryst.6 673–677
Gao YG, Robinson H and Wang AH 1999 High-resolution A-DNAcrystal structures of d(AGGGGCCCCT). An A-DNA model ofpoly(dG) x poly(dC). Eur. J. Biochem. 261 413–420
Guarnieri F and Mezei M 1996 Simulated annealing of chemical poten-tial: a general procedure for locating bound waters. Application to thestudy of the differential hydration propensities of the major and minorgrooves of DNA. J. Am. Chem. Soc. 118 8493–8494
Guzikevich-Guerstein G and Shakked Z 1996 A novel form of theDNA double helix imposed on the TATA-box by the TATA-binding protein. Nat. Struct. Biol. 3 32–37
Halle B and Denisov VP 1998 Water and monovalent ions in theminor groove of B-DNA oligonucleotides as seen by NMR.Biopolymers 48 210–233
Harvey SC, Tan RK-Z and Cheatham TE III 1998 The flying icecube: Velocity rescaling in molecular dynamics leads to viola-tion of energy equipartition. J. Comput. Chem. 19 726–740
Howard JJ, Lynch GC and Pettitt BM 2011 Ion and solvent densitydistributions around canonical B-DNA from integral equations.J. Phys. Chem. B 115 547–556
Hunter CA 1993 sequence-dependent DNA structure: The Role ofbase stacking interactions. J. Mol. Biol. 230 1025–1054
Ivanov VI and Minchenkova LE 1994 The A-form of DNA: Insearch of the biological role. Mol. Biol. (Mosk) 28 1258–1271
Jayaram B and Beveridge DL 1990 Free energy of an arbitrarycharge distribution imbedded in coaxial cylindrical dielectriccontinua: application to conformational preferences of DNA inaqueous solutions. J. Phys. Chem. 94 4666–4671
Jayaram B and Beveridge DL 1991 Grand canonical Monte-Carlo simulations on aqueous solutions of NaCl andNaDNA: Excess chemical potentials and sources of non-ideality in electrolyte and polyelectrolyte solutions. J. Phys.Chem. 95 2506–2516
Jayaram B and Beveridge DL 1996 Modeling DNA in aqueoussolution: Theoretical And computer simulation studies on theion atmosphere of DNA. Annu. Rev. Biophys. Biomol. Struct. 25367–394
Jayaram B, Sharp K and Honig B 1989 The electrostatic potentialof B-DNA. Biopolymers 28 975–993
Jayaram, B, DiCapua FM and Beveridge DL 1991 A theoreticalstudy of polyelectrolyte effects in protein-DNA interactions:Monte Carlo free energy simulations on the ion atmospherecontribution to the thermodynamics of l repressor-operator com-plex formation. J. Am. Chem. Soc. 113 5211–5215
Jayaram B, Sprous D, Young MA and Beveridge DL 1998Free energy analysis of the conformational preferences of Aand B forms of DNA in solution. J. Am. Chem. Soc. 12010629–10633
Jorgensen WL 1981 Transferable intermolecular potential functionsfor water, alcohols and ethers. Application to liquid water. J.Am. Chem. Soc. 103 335–340
Jovin TM, Soumpasis DM and McIntosh LP 1987 The transi-tion between B-DNA and Z-DNA. Annu. Rev. Phys. Chem.38 521–560
Khandelwal G and Jayaram B 2012 DNA-water interactions distin-guish messenger RNA genes from transfer RNA genes. J. Am.Chem. Soc. DOI: 10.1021/ja3020956
Knee KM, Dixit SB, Aitken CE, Ponomarev S, Beveridge DL andMukerji I 2008 Spectroscopic and molecular dynamics evidencefor a sequential mechanism for the A-to-B transition in DNA.Biophys J 95 257–272
Kopka ML, Fratini AV, Drew HR and Dickerson RE 1983 Orderedwater structure around a B-DNA dodecamer. A quantitativestudy. J. Mol. Biol. 163 129–146
Kuntz Jr. ID, Brassfield TS, Law GD and Purcell GV 1969 Hydra-tion of macromolecules. Science 163 1329–1331
Lavery R, Zakrzewska K, Beveridge DL , Bishop TC, Case DA,Cheatham TIII, Dixit SB , Jayaram B, et al. 2010 A systematicmolecular dynamics study of nearest-neighbor effects on basepair and base pair step conformations and fluctuations in B-DNA. Nucleic Acids Res. 38 299–313
Leikin S, Parsegian VA and Rau DC 1993 Hydration Forces.Annual Review of Physical Chemistry 44 369–395
Leslie AG, Arnott S, Chandrasekaran R and Ratliff RL 1980Polymorphism of DNA double helices. J. Mol. Biol. 143 49–72
DNA hydration 419
J. Biosci. 37(3), July 2012
Malenkov G, Minchenkova L, Minyat E, Schyolkina A and IvanovV 1975 The nature of B-A transition of DNA in solution.FEBSLetters 51 38–42
Manning GS 1978 The molecular theory of polyelectrolyte solu-tions with applications to the electrostatic properties of polynu-cleotides. Quart. Rev. Biophys. 11 179–246
Mazur J, Sarai A and Jernigan RL 1989 Sequence dependence ofthe B-A conformational transition of DNA. Biopolymers 281223–1233
McConnell KJ and Beveridge DL 2000 DNA structure: what's incharge? J. Mol. Biol. 304 803–820
Mehrotra PK and Beveridge DL 1980 Structural analysis of molec-ular solutions based on quasi-component distribution functions.application to [H2CO]aq at 25°C. J. Am. Chem. Soc. 102 4287–4294
Mezei M 1988 Modified proximity criteria for the analysis of thesolvation of a polyfunctional solute. Molecular Simulation. 1327–332
Mezei M 2006 MMC: Monte Carlo program for computer simula-tion of molecular solutions (New York)
Mezei M and Beveridge DL 1981 Monte Carlo studies of thestructure of dilute aqueous solutions of Li+, Na+, K+, F-, andCl- . J. Chem. Phys. 74 6902–6910
Mezei M and Beveridge DL 1986 Structural chemistry of biomo-lecular hydration: the proximity criterion. Methods Enzymol.127 21–47
Nishimura Y, Torigoe C and Tsuboi M 1986 Salt induced B-Atransition of poly(dG)*poly(dC) and the stabilization of A-formby its methylation. Nucleic Acids Res. 14 2737–2748
Olson WK, Gorin AA, Lu XJ, Hock LM and Zhurkin VB 1998 DNAsequence-dependent deformability deduced from protein-DNAcrystal complexes. Proc. Natl. Acad. Sci. USA 95 11163–11168
Orozco M, Noy A and Perez A 2008 Recent advances in the studyof nucleic acid flexibility by molecular dynamics. Curr. Opin.Struct. Biol. 18 185–193
Pal SK, Zhao L, Xia T and Zewail AH 2003 Site- and sequence-selective ultrafast hydration of DNA. Proc. Natl. Acad. Sci. USA100 13746–13751
Perez A, Luque FJ and Orozco M 2007 Dynamics of B-DNA on themicrosecond time scale. J. Am. Chem. Soc. 129 14739–14745
Perez A, Marchan I, Svozil D, Sponer J, Cheatham TE, LaughtonCA and Orozco M 2007 Refinement of the amber force field fornucleic acids. Improving the description of {alpha}/{gamma}conformers. Biophys. J.92 3817–3829
Pilet J and Brahms J 1972 Dependence of B-A conformationalchange on base composition. Nature New Biol. 236 99–100
Ponomarev SY, Thayer KM and Beveridge DL 2004 Ion motions inmolecular dynamics simulations on DNA. Proc. Natl. Acad. Sci.U.S.A. 10114771–14775
Privalov PL, Dragan AI, Robinson CC, Breslauer KJ, Remeta DPand Minetti CA 2007 What drives proteins into the major orminor grooves of DNA? J. Mol. Biol. 365 1–9
Ravishanker G 1998 Molecular Dynamics Tool Chest 2.0 (Wesleyan:Wesleyan University)
Reddy CK, Das A and Jayaram B 2001 Do water moleculesmediate protein-DNA recognition? J. Mol. Biol. 314 619–632
Richards FM 1977 Areas, volumes, packing and protein structure.Annu. Rev. Biophys. Bioeng. 6 151–176
Robinson H and Wang AH 1996 Neomycin, spermine and hex-aamminecobalt (III) share common structural motifs in convert-ing B- to A-DNA. Nucleic Acids Res. 24 676–682
Rueda M, Cubero E, Laughton CA and Orozoco M 2004 Exploringthe counterion atmosphere around DNA: what can be learnedfrom molecular dynamics simulations?. Biophys. J. 87 800–811
Ruggiero NJ, Pereira de Souza F and Colombo MF 2001 Hydrationeffects on DNA double helix stability modulates ligand bindingto natural DNA in response to changes in water activity. CellMol. Biol. (Noisy-le-grand) 47 801–814
Ryckaert J-P, Ciccotti G and Berendsen HJ C 1977 Numerical integra-tion of the cartesian equations ofmotion of a systemwith constraints:molecular dynamics of n-alkanes. J. Comput. Phys. 23 327–341
Saenger W 1984 Principles of nucleic acid structure (New York:Springer Verlag)
Saenger W, Hunter WN and Kennard O 1986 DNA conformation isdetermined by economics in the hydration of phosphate groups.Nature 324 385–388
Schneider B and Berman HM 1995 Hydration of the DNA bases islocal. Biophys. J. 69 2661–2669
Schneider B, Cohen D, and Berman HM 1992 Hydration of DNAbases: analysis of crystallographic data. Biopolymers 32 725–750
Schneider B, Cohen DM, Schleifer L, Srinivasan AR, Olson WKand Berman HM 1993 A systematic method for studying thespatial distribution of water molecules around nucleic acid bas-es. Biophys. J. 65 2291–2303
Schneider B, Patel K and Berman HM 1998 Hydration of the phos-phate group in double-helical DNA. Biophys. J. 752422–2434
Schwabe JW 1997 The role of water in protein-DNA interactions.Curr. Opin. Struct. Biol. 7 126–134
Seeman NC, Rosenberg JM and Rich A 1976 Sequence-specificrecognition of double helical nucleic acids by proteins. Proc.Natl. Acad. Sci. USA 73 804–808
Sen S, Andreatta D, Sergei Y, Ponomarev, Beveridge DL and BergMA 2009 Dynamics of water and ions near DNA: comparison ofsimulation to time-resolved stokes-shift experiments. J. Am.Chem. Soc. 131 1724–1735
Shotton MW, Pope LH, Forsyth T, Langan P, Denny RC, Giesen U,Dauvergne M-T and Fuller W 1997 A high-angle neutron fibrediffraction study of the hydration of deuterated A-DNA. Bio-phys. Chem. 69 85–96
Shui X, McFail-Isom L, Hu GG and Williams LD 1998 Structure ofthe potassium form of CGCGAATTCGCG: DNA deformationby electrostatic collapse around inorganic cations. Biochemistry37 8341–8355
Sims EG and Kim S-H 2003 Global mapping of nucleic acidconformational space: dinucleoside monophosphate conforma-tions and transition pathways among conformational classes.Nucleic Acids Res. 31 5607–5616
Sprous D, Young MA and Beveridge DL 1998 Moleculardynamics studies of the conformational preferences of aDNA double helix in water and in an ethanol/water mix-ture: Theoretical considerations of the A/B transition. J.Phys. Chem. 102 4658–4667
Srinivasan J, Cheatham IIIT E, Cieplak P, Kollman PA and CaseDA 1998 Continuum solvent studies of the stability of DNA,RNA, and phosphoramidate - DNA helices. J. Am. Chem.Soc.120 9401–9409
420 SB Dixit, M Mezei and DL Beveridge
J. Biosci. 37(3), July 2012

Stefl R and Koca J 2000 Unrestrained molecular dynamics simu-lations of [d(AT)5]2 duplex in aqueous solution: hydration andbinding of sodium ions in the minor groove. J. Am. Chem.Soc.122 5025–5033
Subramanian PS, Ravishanker G and Beveridge DL 1988 Theoret-ical considerations on the ‘spine of hydration’ in the minorgroove of d(CGCGAATTCGCG) duplex: Monte Carlo comput-er simulation. Proc. Natl. Acad. Sci. USA 85 1836–1840
Tereshko V, Minasov G and Egli M 1999 The Dickerson-Drew B-DNA dodecamer revisited at atomic resolution. J. Am. Chem.Soc. 121 470–471
Tolstorukov MY and Maleev VY 2000 Conformational transitionsof DNA induced by changing water content of the sample: atheoretical study. J. Biomol. Struct. Dyn. 17 913–920
TolstorukovMY, Ivanov VI, Malenkov GG, Jernigan RL and ZhurkinVB 2001 Sequence-dependent B<–>A transition in DNA evaluatedwith dimeric and trimeric scales. Biophys. J. 81 3409–3421
Tsodikov OV, Record Jr MT J and Sergeev YV 2002 A novelcomputer program for fast exact calculation of accessible andmolecular surface areas and average surface curvature. J. Com-put. Chem. 23 600–609
Tsui V and Case DA 2000 Molecular Dynamics Simulations ofNucleic Acids with a Generalized Born Solvation Model. J. Am.Chem. Soc. 122 2489–2498
Tunis MJ and Hearst JE 1968 On the hydration of DNA. I. Prefer-ential hydration and stability of DNA in concentrated trifluor-oacetate solution. Biopolymers 6 1325–1344
Umehara T, Kuwabara S, Mashimo S and Yagihara S 1990Dielectric Study on Hydration of B-DNA, A-DNA and Z-DNA. Biopolymers 30 649–656
Umrania Y, Nikjoo H and Goodfellow JM 1995 A knowledge-based model of DNA hydration. Int. J. Radiat. Biol. 67 145–152.
Varnai P and Zakrzewska K 2004 DNA and its counterions: amolecular dynamics study. Nucleic Acids Res. 32 4269–4280
Westhof E and Beveridge DL 1989 Hydration of nucleic acids. inwater science reviews: The molecules of life (ed) F Franks.(Cambridge: Cambridge University Press) pp 24–136
York DM, Yang W, Lee H, Darden T and Pedersen LG 1995Toward the accurate modeling of DNA: The importance oflong-range electrostatics. J. Am. Chem. Soc. 117 5001–5002
Young MA, Jayaram B and Beveridge DL 1997 Intrusion of Coun-terions into the spine of hydration in the minor groove of B-DNA: Fractional occupancy of electronegative pockets. J. Am.Chem. Soc. 119 59–69
YoungMA, Ravishanker G and Beveridge DL 1997 A 5-nanosecondmolecular dynamics trajectory for B-DNA: Analysis of structure,motions and solvation. Biophys. J. 73 2313–2336
DNA hydration 421
J. Biosci. 37(3), July 2012