studies on genetic diversity of teak using aflp markersdocs.kfri.res.in/kfri-rr/kfri-rr339.pdf ·...
TRANSCRIPT

KFRI Research Report No. 339
STUDIES ON GENETIC DIVERSITY OF TEAK USING AFLP MARKERS M. Balasundaran E.P. Indira P.A. Nazeem (Kerala Agricultural University, Thrissur) Forest Genetics and Biotechnology Division Kerala Forest Research Institute Peechi 680653, Trichur, Kerala March 2010

KFRI Research Report No. 339 (Final Report of the Project KFRI 381/02
STUDIES ON GENETIC DIVERSITY OF TEAK USING AFLP MARKERS M. Balasundaran1 E.P. Indira1 P.A. Nazeem (Professor and Head, Centre for Plant Biotechnology and Molecular Biology Kerala Agricultural University, Thrissur) 1Forest Genetics and Biotechnology Division Kerala Forest Research Institute Peechi 680653, Trichur, Kerala March 2010

Abstract of the Project Proposal
1. Project No. : KFRI 381/02 2. Title : Studies on Genetic Diversity of Teak Using AFLP Markers
3. Principal investigator : Dr. M. Balasundaran, Scientist, KFRI
4. Associate investigators : Dr. E.P Indira, Scientist, KFRI
Dr. P.A. Nazeem (Professor, Kerala Agricultural University)
5. Research Fellows : Dr. T.B. Suma (Research Associate) : Mr. P.M. Sreekanth (Junior Research Fellow) 6. Objectives :
i. To estimate the genetic diversity in natural teak populations and teak provenances
of the Western Ghats region through AFLP technique.
ii. To estimate the genetic variation existing in teak seed stands located in different
parts of Kerala
iii. To estimate the genetic variation existing in teak clones being used for raising
clonal teak plantation and clonal seed orchards
8. Duration : 3 Years
9. Funding Agency : Department of Biotechnology,
Government of India

ACKNOWLEDGEMENT
We thank Department of Biotechnology, Government of India for providing us
funds for carrying out the research work (Sanction order No.BT/PR/2302/AGR
/08/161/2000). This was a collaborative project between KFRI and Centre for Plant
Biotechnology and Molecular Biology (CPBMB), Kerala Agricultural University (KAU),
Thrissur. We are thankful to Dr. J.K. Sharma, former Director, KFRI and Dr. K.V. Peter,
former Vice-Chancellor, Kerala Agricultural University (KAU), Thrissur for providing us
facilities to carry out the project work and for their keen interest and encouragement. We
also thank Dr. P. Suresh Kumar, Radiological Safety Officer, Radio-tracer Laboratory of
KAU, for providing us permission to use the equipments and other infrastructure for
carrying out the research work. We are indebted to Kerala Forest Department, Karnataka
Forest Department and Tamil Nadu Forest Department for providing us permission to
collect teak leaf samples from the forests of the Western Ghats within these states.

CONTENTS
ABSTRACT 1
1. INTRODUCTION 3
2. MATERIALS AND METHODS 6
3. RESULTS AND DISCUSSION 13
4. CONCLUSIONS AND RECOMMENDATIONS 27
5. REFERENCES 28

ABSTRACT
One hundred and eighty genotypes from 9 teak populations of natural forests
(20 trees from each population) of the Western Ghats were evaluated for genetic
diversity. The teak populations selected for the study belonged to forest divisions of
Konni, Peechi-Vazhani Wildlife Sanctuary, Parambikulam Wildlife Sanctuary, Nilambur
South, and Wayanad Wildlife Sanctuary from Kerala State, natural forests of Shimoga,
Virnoli and Barchi of Karnataka State and one population from Indira Gandhi Wildlife
Sanctuary from Tamil Nadu State. Out of 64 AFLP primer combinations screened, ten
best primer combinations were used for the study. Sample collection, DNA extraction,
pre-selective amplification, data analysis and report preparation were done at Molecular
Biology laboratory of KFRI while the selective amplification reaction of the AFLP
protocol and PAGE separation of the amplified products were done at CPBMB laboratory
and Radiotracer laboratory of KAU.
Of the nine natural populations, Konni and Wayanad populations had the
highest genetic diversity as measured from per cent of polymorphic loci and gene
diversity index. Gene diversity (h) varied from 0.139 (Barchi) to 0.244 (Konni and
Wayanad). Kerala and Tamil Nadu populations showed higher genetic diversity than
Karnataka populations. The gene diversity indices of the nine populations showed higher
genetic diversity values for populations from protected forests than populations from
territorial forests. Cluster analysis done using genetic similarity coefficients between the
populations showed grouping of nine populations into two main clusters; the Karnataka
populations (Shimoga, Barchi and Virnoli) forming a single cluster. The Kerala
populations (viz. Konni, Peechi-Vazhani Wildlife Sanctuary, Parambikulam Wildlife
Sanctuary, and Wayanad Wildlife Sanctuary) and Indira Gandhi Wildlife Sanctuary from
Tamil Nadu formed a separate cluster. The Nilambur natural forest population stood out
separately but joined the cluster of Kerala populations indicating uniqueness of Nilambur
populations among the natural teak of Kerala.
Eighty genotypes from 4 Seed Production Areas (SPAs) (20 teak trees from each
SPA) viz. Konni, Parambikulam, Nilambur and Wayanad were selected for studying the
genetic diversity in SPAs. The genetic diversity of the SPAs varied from 0.169 (Konni

SPA) to 0.203 (Wayanad SPA). The percentage of polymorphic loci ranged from 74.42
(Parambikulam SPA) to 84.06 (Konni SPA). The genetic similarity coefficients and
clustering of 80 genotypes in the NTSYSpc-generated dendrogram indicated a pattern in
accordance with the origin and geographic location of SPAs but with small discrepancies.
All the 20 samples from each of Konni and Parambikulam SPAs clustered into respective
groups clearly justifying their respective geographic origin. However, five genotypes
from Nilambur namely N2, N3, N9, N12 and N14 and one Wayanad genotype W5
intruded into the Konni cluster besides the 20 genotypes of Konni origin. This indicated
that these trees might have their origin in Konni and they might have reached Nilambur
and Wayanad plantation as stumps for planting or there could be mixing of Konni seeds
into Nilambur and Wayanad seed lots.
The study of the genetic diversity of teak Clonal Seed Orchard (CSO) was
carried out in a 21-year-old CSO established in 1985 by the Kerala Forest Department at
Kalluvettankuzhi (8.58ha) in Thenmalai Forest Division in Kollam District of Southern
Kerala. Clones of Nilambur origin showed highest genetic diversity (0.2208) followed by
Konni (0.2074) and Arienkavu (0.2007). The dendrogram generated by cluster analysis
showed that most of the genotypes clustered in accordance with their geographic origin.
However, clustering of a few genotypes of different geographic origin in one cluster
indicated possible error in clone labeling, or mix up of stumps or suppression of scion by
root stock growth. In the CSO, flowering (8.8%) and fruiting (6%) were very low. All
flowered clones were unable to produce seeds. The genetic diversity among clones of
Nilambur origin was higher than that among teak genotypes in Nilambur natural forests
and SPAs. Hence, the genetic diversity factor is inadequate to explain the poor
performance of seed orchards with respect to seed production and viability.
2

3
1. INTRODUCTION 1.1. TEAK
Teak (Tectona grandis L. f.) which belongs to the family Verbenaceae, is
predominantly tropical and subtropical in distribution. It grows in regions having annual
rainfall of 600mm to 3000mm and grows up to 1300m altitude. It reaches its best
development on deep well drained foot hills with an annual rainfall of 1200 to 2000mm and a
pronounced dry season. Teak occurs in natural forest between 90 to 260 North latitude and 730
to 1040 East longitudes, which includes southern and central India, Myanmar, Laos Peoples
Democratic Republic, and Northern Thailand. In Indonesia, teak is grown in extensive areas.
Demand for quality timber has made teak the most widely planted hardwood species even in
areas outside its natural distribution.
1.2. DEPLETION OF TEAK FORESTS
Teak genetic resources have been drastically disturbed during the past 50-100 years
because of uncontrolled logging and mixing of germplasm. Habitat destruction and
fragmentation have restricted the distribution of species to small and isolated populations.
Although, detailed studies on the distribution of genetic variability in teak are limited,
considerable variation in quantitatively inheritable traits have been reported in provenances
from natural populations of India, Thailand and Laos (Kjaer, 1996).
1.3. GENETIC IMPROVEMENT OF TEAK
Teak has a long generation interval and hence prior information on genetic diversity
can hasten the progress of implementing conservation measures and tree breeding
programmes. Teak improvement is constrained by low genetic variability of genotypes,
delayed and inadequate flowering, asynchrony in flowering phenology, low fruit setting,
limited seed production, poor seed germination, variability in growth and wood quality,
prolonged time requirement for multi-year progeny test, etc.

4
1.3.1. Seed production area and clonal seed orchards
In order to meet the annual planting requirement, seed production areas (SPAs) are
developed by culling inferior trees from even- aged high quality plantations and retaining
sufficient number of superior and healthy trees with more than average seed production
(Zobel and Talbert, 1984). One of the major reasons for low productivity may be poor quality
planting stock (stump / root trainer seedlings) raised out of poor quality seeds collected from
different SPAs. Prabhu (2007) also reported considerable variations in various tree and fruit
parameters of different SPAs from Kerala. Low fruit production in teak clonal seed orchard
was reported by Gunaga and Vasudeva (2005).
1.4. STUDIES ON GENETIC DIVERSITY
Genetic diversity forms the base of biodiversity hierarchy (Namkoong et al., 1996)
and it serves as building blocks in future selection and breeding (FAO, 1989). In recent years,
biochemical and molecular markers are widely used to study the extent and pattern of genetic
variation in tree species. A few studies have been conducted in teak using isozyme and
random amplified polymorphic DNA (RAPD) markers to estimate genetic diversity and
outcrossing rates in selected populations from natural and cultivated range (Changtragoon
and Szmidt, 2000; Nicodemus et al., 2005; Lowe et al., 2005). However, studies on genetic
diversity of teak in clonal seed orchard (CSO) and seed production areas (SPs) have not been
reported. Only a limited natural population from India, particularly in Kerala has been
covered in these studies.
1.5. OBJECTIVES OF THE STUDY
The natural forests of the Western Ghats region, an important biodiversity hotspot of South
India, is highly vulnerable for destruction. Teak is one of the species adversely affected by
forest destructions and for which information on genetic diversity is urgently needed. Loss of
natural teak population, due to illicit felling, forest encroachment, severe logging, diseases
and pests, fragmentation, genetic drift and skewed gene flow have adverse effect on genetic
diversity of the species.

5
The SPAs located in different climatic regions of Kerala show considerable amount
of variations not only due to genetic factors but also due to edaphic factors, which greatly
influence their performance. CSOs were planned and established for raising the production
of high quality seeds from fast growing superior plantations. But these clones are not tested
for genetic variability in order to avoid planting of genetically related clones for avoiding
inbreeding in the clonal seed orchard. Among several other factors, the cause of poor seed
quality is presumed to be narrow genetic base of the SPAs and the seed orchards. The present
study is an attempt to evaluate the genetic variation in teak in the Southern part of the
Western Ghats falling within the states of Kerala, Karnataka and Tamil Nadu.
The major objectives of the project are:
iv. To estimate the genetic diversity in natural teak populations and teak provenances of
the Western Ghats region through AFLP technique.
v. To estimate the genetic variation existing in teak seed stands located in different parts
of Kerala
vi. To estimate the genetic variation existing in teak clones being used for raising clonal
teak plantation and clonal seed orchards

6
2. MATERIALS AND METHODS
2.1. SAMPLE COLLECTION FROM NATURAL FORESTS
Leaf samples were collected from nine natural teak growing forests of the Western
Ghats belonging to Kerala, Karnataka and Tamil Nadu states (Fig.1 and Table 1). These
locations are Kattathi natural reserve of Konni Forest Division in Pathanamthitta District,
Thamaravellachal natural reserve of Peechi – Vazhani Wildlife Sanctuary in Thrissur
District, Vengoli and Chettuara reserves in Parambikulam Wildlife Sanctuary in Palghat
District, Padkka natural reserve in Nilambur Forest Division in Malappuram District and
Tholpetty natural reserve of Wayanad Wildlife Sanctuary, all from Kerala state, Shimoga,
Barchi and Virnoli natural reserves from Karnataka State and Pachathalisaraham natural
reserve near Sarkarapathi power house in Indira Gandhi Wildlife Santuary from Tamil Nadu
State. From each location, 20 trees were identified using transect method of sampling.
Expanding leaves were collected from the trees for extracting DNA.
2.1.1. DNA extraction
DNA was isolated from 300 mg juvenile leaf samples following modified CTAB
protocol (Doyle and Doyle, 1990). The concentration of DNA in the aqueous solution was
estimated at A260 (1OD=50 μg ml-1) (Gallagher, 1996) and subjected to AFLP analysis.
2.1.2. AFLP analysis
AFLP analysis was performed as described by Vos et al. (1995). AFLP reagents were
purchased from M/s. Invitrogen Corporation, USA, and the reactions were carried out
according to manufacturer’s protocol. The pre-amplification reaction of the AFLP protocol
was carried out in Molecular Biology laboratory of Kerala Forest Research Institute while
selective amplification reaction was done at the Centre for Plant Biotechnology, Molecular
Biology and Radiotracer Laboratory of Kerala Agricultural University, Thrissur. Selective
amplification was done with ten primer combinations: E-AGG/M-CTT, E-AAC/M-CTG, E-
AAC/M-CTT, E-ACT/M-CAG, E-ACC/M-CTT, E-ACA/M-CTT, E-ACC/M-CTA, E-

7
AGG/M-CAG, E-AGG/M-CTG and E-AGG/M-CAT selected out of sixty-four possible
combinations.
Table. 1. Details of natural teak populations from Western Ghats sampled for AFLP analysis.
Sl.No.
Name of geographic
area or locality
Forest Division State Latitude (N)
Longitude (E)
1
Konni
Konni Division Kerala 09° 55′ 76° 67′
2
Thrissur Peechi- Vazhani Wild life Sanctury
Kerala 10° 26′ 76° 58′
3
Parambikulam
Parambikulam Wild life Sanctury
Kerala 10° 25′ 76° 45′
4
Nilambur
Nilambur South Division
Kerala 11° 80′ 76° 10′
5
Wayanad
Wayanad Wild life Sanctury
Kerala 11° 02′ 76° 41′
6
Pollachi
Indira Gandhi Wildlife Sanctury
(IGWLS)
Tamil Nadu 10° 35′ 76° 52′
7
Shimoga
Shimoga Division
Karnataka 13° 55′ 75° 38′
8
Barchi (Dandeli)
Haliyal Division Karnataka 15° 17′ 74° 38′
9
Virnoli
Haliyal Division
Karnataka 15° 43′ 74° 73′

8
Fig. 1. Map showing the locations of natural populations, seed production areas and clonal seed orchards of teak in the Western Ghats region selected for AFLP analysis
2.1.3. Separation and visualization of amplified products
After PCR amplification, the amplified products were electrophoresced on 6%
Polyacrylamide gel with 0.4mm spacers and shark tooth combs in a Sequi – Gen GT Nucleic
Acid electrophoresis cell (Biorad, USA). The gel was transferred to chromatographic paper,

9
and exposed the gel to X–ray film (Kodak®) for overnight. Manual processing of X-ray film
was done at the dark room in infra red light.
2.1.4. Data analysis
PCR products as visualized on the film were scored manually as '1' for the presence
of band (DNA band) and '0' for absence of band. Each PCR product was assumed to
represent a single locus. Both, polymorphic and monomorphic bands were included in the
final data sets forming a binary matrix.
The data matrices were grouped into nine populations and analyzed using POPGENE,
Version 1.32 package and a pair-wise comparison of population was made (Yeh et al., 1999).
The genetic diversity parameters within population viz., gene diversity (h) and percent of
polymorphic loci (ppl), and pair-wise comparison of genetic distances between populations
were estimated. The pair-wise genetic distances obtained was subjected to clustering using
Unweighted Pair Group Method with Arithmetic means (UPGMA).
AFLP binary matrix of 180 individual trees was subjected to population structuring.
A matrix of genetic distance between individual genotypes of each population based on
shared amplification products was calculated. This was also used to construct a UPGMA
dendrogram.
2.2. GENETIC DIVERSITY IN SEED PRODUCTION AREAS Four younger SPAs located in four important geographic areas of teak plantations namely
Konni, Parambikulam, Nilambur and Wayanad were selected for the study (Table 2). From
each SPA, 20 trees were selected at random using transect method. From these trees,
expanding leaves were collected for DNA extraction. The methods and protocols for DNA
extraction, AFLP reactions, electrophoretic separation and visualization of amplified
products, and data analysis were same as those described for natural forests.

10
Table 2. List of Seed Production Areas (SPAs) selected for AFLP analysis.
Forest division
Locality Forest Section Year of Plantation
Area (ha)
Latitude (N)
Longitude (E)
Nilambur
Kombankallu Edacode 1955 10 11° 18′ 76° 46′
Wayanad North
Tholpetty Kaimaram 1963 10.63 11° 47′ 76° 84′
Parambikulam Wildlife
Sanctuary
Thoonakadavu Anappady 1955 27 10° 62′ 76° 55′
Konni
Kondodi Karippanthode 1965 16.96 09° 42′ 76° 55′
2.3. GENETIC DIVERSITY IN CLONAL SEED ORCHARD
AFLP analysis was carried out in a 21-year-old clonal seed orchard of 8.58 ha area
established in 1985 by Kerala Forest Department at Kulathupuzha, (Kalluvettankuzhi) in
Thenmalai Forest Division in Kollam District of Southern Kerala. There were 1200 trees of
31 clones in the orchard, planted in 8m X 8m spacing. These clones were raised from 31 plus
trees selected from natural teak forests and plantations raised in main teak growing forest
Divisions of Kerala. Of these, 15 clones originated from Nilambur, 9 clones from Konni and
7 clones from Arienkavu under Thenmalai Forest Division in Kollam District. The clones
were raised by grafting buds from bud wood cuttings of healthy branches of plus trees to one-
year-old teak stumps. Successful grafts were outplanted in clonal seed orchard in randomized
design and details of individual clones and its origin are given in Table 3.

11
2.3.1. Sample collection, phenology, seed setting and germination parameters
To study the genetic variation of clones in the clonal seed orchard, we selected half
the portion of layout comprising 578 healthy trees (ramets of 31 clones) and left out rest of
the layout due to damage and stunted nature of the trees. The selected area included all the 31
clones repeated as per randomized design. Juvenile expanded leaves of 31 clones were
randomly collected from this plot for DNA extraction. Observations on phenological events
and seed setting of each clone were recorded. Fruits collected from each clone were dried and
cleaned by removing calyx and other debris. Immediately after pre- sowing treatment, fruits
were sown in germination trays filled with vermiculite.
The methods and protocols for DNA extraction, AFLP analysis, separation and
visualization of amplified products adopted for genetic diversity studies of nine natural teak
populations of the Western Ghats were followed for studies on clonal seed orchard also.
Table 3. List of Clones planted in clonal seed orchard, Kulathupuzha (Kalluvettankuzhi).
SL.No. Clone ID Clone
Number
Total number of
ramets Locality of
origin 1 NIL 1 clone 1 17 Nilambur 2 NIL 2 clone 2 16 Nilambur 3 NIL 3 clone 3 16 Nilambur 4 NIL 4 clone 4 19 Nilambur 5 NIL 5 clone 5 13 Nilambur 6 NIL 6 clone 6 14 Nilambur 7 NIL 7 clone 7 19 Nilambur 8 NIL 8 clone 8 14 Nilambur 9 NIL 9 clone 9 17 Nilambur 10 NIL 10 clone 10 15 Nilambur 11 NIL 11 clone 11 20 Nilambur 12 NIL 12 clone 12 18 Nilambur 13 NIL 13 clone 13 18 Nilambur 14 KON 14 clone 14 21 Konni

12
15 KON 15 clone 15 20 Konni 16 KON 16 clone 16 23 Konni 17 KON 17 clone 17 22 Konni 18 KON 18 clone 18 19 Konni 19 KON 19 clone 19 18 Konni 20 KON 20 clone 20 19 Konni 21 KON 21 clone 21 25 Konni 22 KON 23 clone 23 21 Konni 23 NIL 24 clone 24 22 Nilambur
24 NIL 25 clone 25 18 Nilambur 25 ARK 26 clone 26 18 Arienkavu 26 ARK 27 clone 27 23 Arienkavu 27 ARK 28 clone 28 19 Arienkavu 28 ARK 29 clone 29 20 Arienkavu 29 ARK 30 clone 30 19 Arienkavu 30 ARK 31 clone 31 17 Arienkavu 31 ARK 32 clone 32 18 Arienkavu
Each DNA band was treated as separate putative locus and scored as "1" for the
presence of locus and "0" for the absence of locus in each clone to create binary data
matrices. Genetic diversity within clonal populations of different geographic origin namely
Konni, Areinkavu and Nilambur and genetic distance among clonal populations were
estimated. Genetic diversity was quantified as the percentage of polymorphic loci and Nei's
gene diversity (Nei, 1973) assuming Hardy-Weinberg equilibrium. Genetic distance between
the clonal populations of distinct origin of mother trees were obtained from POPGENE
software and the resultant distance matrices were used to construct a UPGMA dendrogram.
The genetic similarities among the thirty-one clones were calculated using NTSYSpc
2.02 software. The resultant similarity matrix was subjected to cluster analysis. Genetic
similarities based on simple matching coefficient (Sokal and Sneath, 1963) were calculated
between all possible pairs of clones.

13
3. RESULTS AND DISCUSSION
Teak trees in the Western Ghats forests have been depleted considerably from the early
British period due to illicit felling, repeated fires, excessive grazing and enormous soil
erosion caused by torrential rain (Prabhu, 2007). Earlier genetic studies on natural teak
populations of the Western Ghats had been mainly confined to Kerala portion only. The
present study using AFLP analysis provided considerable information on the magnitude and
pattern of genetic variation existing in nine natural teak populations from the Western Ghat
forests covering three different States viz. Kerala, Karnataka and Tamil Nadu.
3.1. GENETIC DIVERSITY IN NATURAL POPULATIONS
DNA was obtained from leaf samples collected from all the 180 genotypes (9
populations X 20 trees) which originated from nine natural teak populations of the Western
Ghats located in the three states of Kerala, Karnataka and Tamil Nadu. The AFLP analysis of
the 180 DNA samples, using ten primer combinations involved 1800 reactions. The average
number of DNA bands per AFLP fingerprint of a tree per primer pair combination was 67. A
representative AFLP autoradiogram samples from Peechi – Vazhani WLS is provided in
Fig. 2.
At the population level, polymorphism varied from 56.84 per cent (Virnoli) to 87.97
per cent (Konni) (Table 4). Similarly Nei's (1973) gene diversity index (h) varied from
0.1387 (Barchi) to 0.2449 (Konni). The gene diversity and per cent of polymorphic loci for
Konni and Wayanad were almost similar and these two Kerala populations showed the
highest genetic diversity. Karnataka populations showed the lowest genetic diversity index
varying from 0.1387 (Barchi) to 0.1605 (Shimoga) and per cent of polymorphic loci ranging
from 56.84 (Virnoli) to 68.42 (Shimoga).

14
Fig. 2. AFLP profile of twenty natural teak trees from Peechi-Vazhani WLS; DNA amplified using primer combination E-ACT + M-CAG; M: DNA marker 30-330 bp AFLP ladder (Invitrogen Life Technologies, USA); 1-20: tree numbers.

15
Table 4. Comparison of nine natural populations of teak for various genetic diversity
measures.
Teak Populations
Nei’s (1973) gene diversity
index (h)
Per cent of polymorphic
loci (ppl)
Konni RF
0.2443
87.97
P-V WLS, Thrissur
0.2334 81.50
Parambikulam WLS
0.2336 81.35
Nilambur RF
0.1980 75.49
Wayanad WLS
0.2449 86.77
Indira Gandhi Wildlife Sanctuary (IGWLS) Tamil
Nadu
0.1980 73.98
Shimoga NF
0.1605 68.42
Barchi NF
0.1387 64.06
Virnoli NF
0.1428 56.84
The standard genetic distances (D) between all pair-wise population comparisons
varied from 0.0554 (between Barchi and Virnoli) to 0.1166 (between Tamil Nadu and
Barchi). The UPGMA dendrogram showed the genetic relationship between the populations.
The dendrogram showed two main clusters with clear separation (Fig. 3). The larger cluster
comprised of all the Kerala populations (viz. Konni, Thrissur, Parambikulam, Wayanad and
Nilambur) along with Tamil Nadu population (IGWLS) while the second cluster consisted of
Karnataka populations viz., Shimoga, Barchi and Virnoli natural forests.
The present study showed that the overall gene diversity of nine teak populations
were comparable with mean values obtained in outcrossing woody perennials studied through

16
RAPD markers. But these estimates are slightly lower than values reported for teak
populations screened in earlier studies using isozyme and RAPD markers (Changtragoon and
Szmidt, 2000; Nicodemus et al., 2005).
In Kerala, gene diversity was higher in protected forests such as wildlife sanctuaries
than in territorial forests except Konni natural forest. This might be due to less human
disturbances in wildlife sanctuaries when compared to that of other natural forests. Karnataka
populations viz., Shimoga, Barchi and Virnoli showed the lowest gene diversity. These
populations might have undergone widespread logging, illicit felling, augmentation planting
or severe fragmentation of the natural teak forest during the past.
3.1.1.Genetic distance measures between populations
The nine populations selected for the study covered a broad geographic range
differing in rainfall and altitude. Teak populations from Virnoli and Barchi of Karnataka
State were genetically and geographically closer than any other pairs of teak populations.
These two populations showed the lowest genetic distance and they formed a single cluster to
which the third population from Karnataka, Shimoga area joined. However, a complete
correlation between genetic distance and geographic distance between populations was not
seen. Even though teak populations from IGWLS of Tamil Nadu and Barchi of Karnataka
showed the highest genetic distance coefficients, these populations were not farthest apart.
But, in general, there is a relation between genetic distance and geographic distance.
The Kerala populations viz., Konni, Thrissur, Parambikulam Wayanad and Tamil
Nadu (Pollachi) made a separate cluster with its own sub clusters with Nilambur standing out
separately from all these populations. The uniqueness of Nilambur teak with respect to
growth and wood quality is world famous. The Malabar teak (Nilambur, Kerala) from the
Western Ghat region in India, generally displaying good growth and log dimensions with
desired wood figure (golden yellowish brown colour), has a wide reputation in the world
trade for ship-building (Bhat and Priya, 2004). Nilambur valley is reported to have
the most suitable alluvial soil and climatic condition required for good quality teak. The
unique edaphic and climatic factors might have resulted in a different type of evolution in the
natural teak populations.

17
Nilambur RF
Konni RF
Wayanad WLS
IGWLS Tamil Nadu
P-V WLS Thrissur
Parambikulam WLS
Shimoga NF
Barchi NF
Virnoli NF
Fig.3. Dendrogram constructed based on Nei’s (1978) genetic distance coefficients of nine natural populations of teak.
RF: Reserve Forests; WLS: Wildlife Sanctuary; IGWS: Indira Gandhi
Wildlife Sanctuary; P-V WLS: Peechi – Vazhani Wildlife Sanctuary; NF: Natural Forests.
________________________________________ 0.11 0.05
18
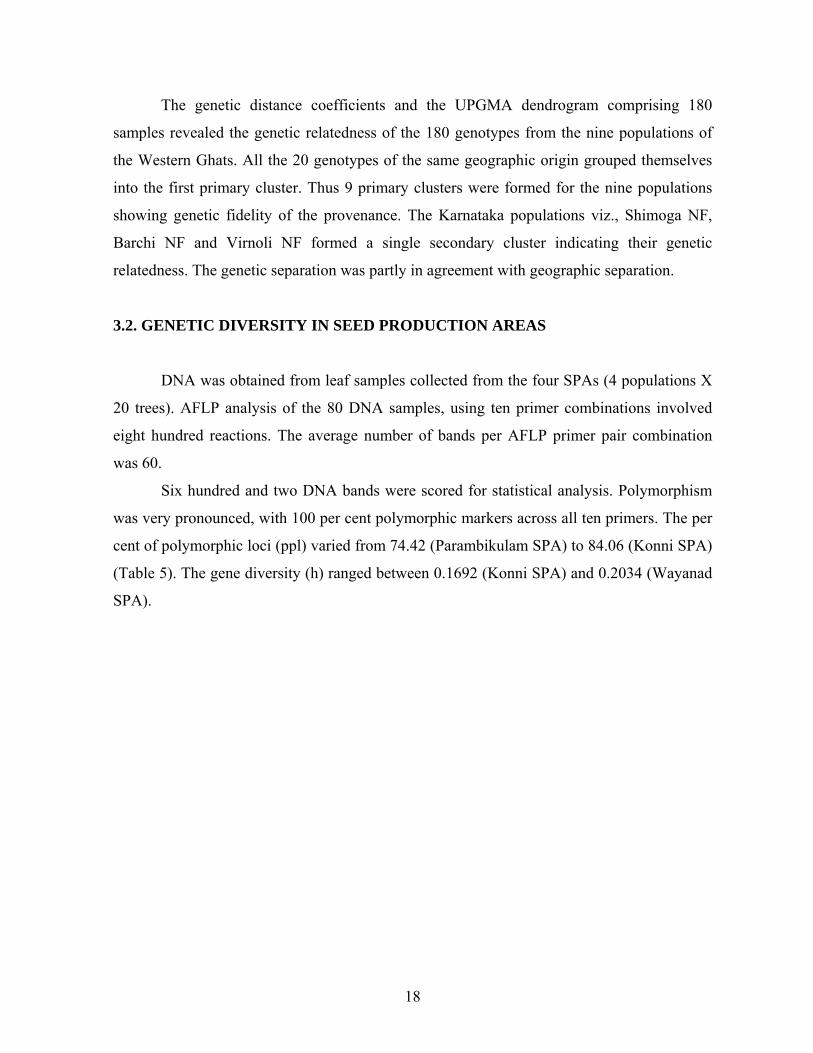
The genetic distance coefficients and the UPGMA dendrogram comprising 180
samples revealed the genetic relatedness of the 180 genotypes from the nine populations of
the Western Ghats. All the 20 genotypes of the same geographic origin grouped themselves
into the first primary cluster. Thus 9 primary clusters were formed for the nine populations
showing genetic fidelity of the provenance. The Karnataka populations viz., Shimoga NF,
Barchi NF and Virnoli NF formed a single secondary cluster indicating their genetic
relatedness. The genetic separation was partly in agreement with geographic separation.
3.2. GENETIC DIVERSITY IN SEED PRODUCTION AREAS
DNA was obtained from leaf samples collected from the four SPAs (4 populations X
20 trees). AFLP analysis of the 80 DNA samples, using ten primer combinations involved
eight hundred reactions. The average number of bands per AFLP primer pair combination
was 60.
Six hundred and two DNA bands were scored for statistical analysis. Polymorphism
was very pronounced, with 100 per cent polymorphic markers across all ten primers. The per
cent of polymorphic loci (ppl) varied from 74.42 (Parambikulam SPA) to 84.06 (Konni SPA)
(Table 5). The gene diversity (h) ranged between 0.1692 (Konni SPA) and 0.2034 (Wayanad
SPA).

19
Table 5. Genetic diversity measures of seed production areas (SPAs).
The estimates of Nei’s genetic distance (D) between populations were calculated for
all pair-wise SPA comparisons. While Konni and Nilambur SPAs showed the least genetic
distance (0.0389), Parambikulam and Nilambur SPAs showed the highest genetic distance
(0.0881). UPGMA dendrogram displayed two main clusters with Nilambur and Konni SPAs
in one cluster while Parambikulam and Wayanad formed another cluster.
Gene diversity (h) estimated for seed production plantations was generally poor
ranging from 0.16-0.20 in the four SPAs from four geographic areas. The diversity values
were lower than the diversity values for natural teak populations of the Western Ghats
revealed in the present study. Also the values were poorer than those reported for teak
plantations by Nicodemus et al. (2005). The exact reason for low diversity could not be
identified. No information was available from the forest offices regarding the origin of seed
lot used for raising the plantations. Records such as plantation Journal was also unavailable
for reference. Probably plantations might have been raised using seeds of a couple of mother
trees of narrow genetic base. There are about 32 teak SPAs in Kerala and only 4 SPAs have
been subjected to genetic diversity estimation in the present study. Understanding the genetic
diversity status of each SPAs will be useful in deciding strategies for management of SPAs
and for ascertaining the quality of seeds for raising future plantations.
Populations
Nei’s (1973) gene diversity
(h)
Per cent of polymorphic loci
(ppl) Wayanad SPA 0.2034
80.40
Nilambur SPA 0.1972
81.73
Parambikulam SPA
WLS 0.1915
74.42
Konni SPA
0.1692
84.06
Total
0.2296
±0.1418 100
20
Considering the lower level of genetic diversity within the SPAs, for raising future
plantations seeds have to be collected from as many trees as possible and bulked to maintain
a broad genetic base preferably with in the same provenance.
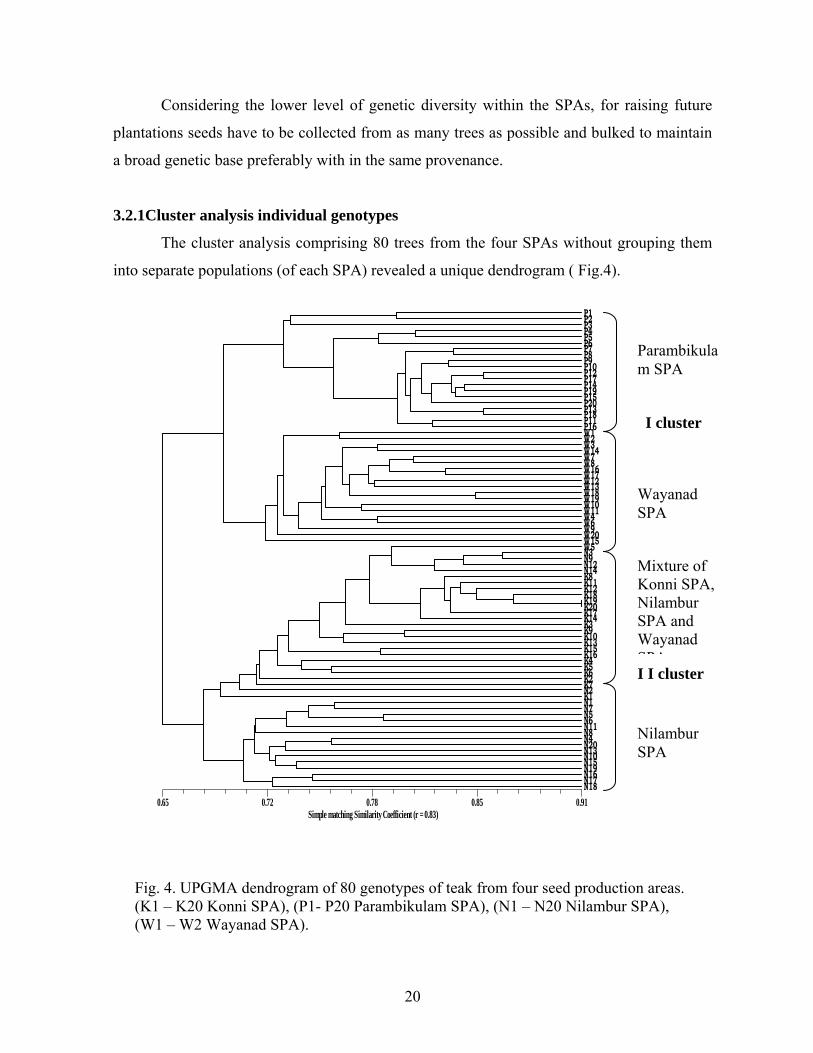
3.2.1Cluster analysis individual genotypes
The cluster analysis comprising 80 trees from the four SPAs without grouping them
into separate populations (of each SPA) revealed a unique dendrogram ( Fig.4).
Simple matching Similarity Coefficient (r = 0.83)0.65 0.72 0.78 0.85 0.91
P1 P2 P3 P4 P5 P6 P7 P8 P9 P10 P12 P17 P14 P19 P15 P20 P13 P18 P11 P16 W1 W2 W3 W14 W7 W8 W16 W17 W12 W13 W18 W19 W10 W11 W4 W6 W9 W20 W15 W5 N3 N9 N12 N14 K8 K11 K12 K18 K19 K20 K17 K14 K3 K9 K10 K13 K15 K16 K4 K5 K6 K2 K7 N2 K1 N1 N7 N5 N6 N11 N8 N4 N20 N13 N10 N15 N19 N16 N17 N18
Parambikulam SPA
I cluster
Wayanad SPA
Mixture of Konni SPA, Nilambur SPA and Wayanad SPAI I cluster
Nilambur SPA
Fig. 4. UPGMA dendrogram of 80 genotypes of teak from four seed production areas. (K1 – K20 Konni SPA), (P1- P20 Parambikulam SPA), (N1 – N20 Nilambur SPA), (W1 – W2 Wayanad SPA).

21
The dendrogram divided 80 genotypes into two main clusters. The first cluster was
shared between genotypes from Parambikulam and Wayanad. The SPAs formed their own
sub clusters, the former with 20 genotypes and the latter with 19 genotypes. The second
cluster was shared between Nilambur and Konni SPA genotypes but with mixing of
genotypes from three geographic areas in one sub cluster. One of the cluster comprised of
five genotypes from Nilambur (N2, N3, N9, N12, and N14) and 1 from Wayanad (W5),
besides all the 20 genotypes from Konni. This showed that these five genotypes from
Nilambur and one from Wayanad might have originated from Konni.
Generally the pattern of clustering of trees was in accordance with the origin and
location of SPAs. However, the five genotypes from Nilambur and one Wayanad genotype
intruded into the Konni cluster raising the number of trees in Konni cluster to 26. This
indicated that these trees might have their actual origin in Konni. They might have reached
Nilambur and Wayanad plantations respectively as stumps for planting or as mixed seeds.
Transport of teak stumps from Konni to Nilambur and Wayanad could have been resorted
when sufficient quantity of stumps were not available from Nilambur nursery for completing
the planting work. Sometimes, stumps might have been brought from Konni for casualty
replacement. Another probability is the mixing of seeds from Konni, Nilambur and Wayanad
before sowing seeds for producing stumps.
3.3. GENETIC DIVERSITY IN CLONAL SEED ORCHARD
The total number of DNA bands formed from 31 clones was 653, of which 651 were
polymorphic (99.69%). At the population level, i.e. considering clones from the same
geographical location of origin as separate groups, the percentage of polymorphism varied
from 71.67 per cent (Arienkavu) to 86.37 per cent (Nilambur). Gene diversity index (h)
varied from 0.2007 (Areinkavu) to 0.2208 (Nilambur) (Table 6). The genetic distance varied
from 0.0120 (between Nilambur and Konni) to 0.0251 (between Konni and Areinkavu).

22
3.3.1. Cluster analysis of individual clones
Clonal seed orchard is a plantation of vegetatively propagated genotypes or plantlets
of plus trees, which are previously selected for their superiority from natural populations or
plantations. The cluster analysis based on genetic distance coefficients of all combinations of
the thirty one clones generated a unique dendrogram with six clusters (Fig. 5). The first
cluster comprised NIL 1 and NIL 2, second of NIL 3, NIL 4, NIL 5, NIL 6, NIL 7, NIL 8,
NIL 9 along with KON 18 and KON 20. Third cluster was formed by NIL 11, NIL 12 and
KON 14, KON 17 and KON 21. Fourth cluster comprised KON 15, KON 23, KON 16 and
KON 19. Fifth cluster was formed by NIL 10, ARK 32, NIL 24, NIL 25, ARK, 26, ARK
27, ARK 28. Sixth cluster was
Table 6. Comparison of genetic variation and origin of clones used for raising clonal orchard at Kulathupuzha (Kalluvettankuzhi).
Clonal population
Gene diversity index
(h)
Per cent of polymorphi
c loci (ppl)
Nilambur
0.2208
86.37
Konni 0.2074
73.66
Arienkavu 0.2007
71.67
Overall 0.2274 ±0.0227
99.69

23
Fig. 5. UPGMA dendrogram of genetic similarity between thirty one clones using NTSYSpc software. formed by ARK 29, ARK 31 and ARK 30. The pattern of clustering indicated that contrary
to the general expectation, a few clones of different geographic origin had come under same
cluster. For example the second major cluster comprised of eight clones from Nilambur and
two clones of Konni. Such unexpected pattern indicated an error in identity of the clones. The
error could be during the time of labeling of clones at some occasion during the period of
grafting or planting or due to inadvertent mixing of ramets. The clones had originated from
Similarity Coefficient (r = 0.73)0.68 0.73 0.78 0.84 0.89
NIL1 1 2 3 4 5 6
NIL2 NIL3 NIL4 NIL5 NIL13 KON18 KON20 NIL6 NIL7 NIL8 NIL9 NIL11 NIL12 KON14 KON17 KON21 KON15 KON23 KON16 KON19 NIL10 ARK32 NIL24 NIL25 ARK26 ARK27 ARK28 ARK29 ARK31 ARK30

24
plantations and not from natural forests (Venkatesh et al., 1986). Hence, transporting of teak
genotypes from one place to another as seed or stump might have taken place at the time of
plantation establishment as suspected for SPAs. Yet another chance is the destruction of
scion and establishment and growth of root stock of unknown origin. Contrary to these
confusions on genotype identity within SPAs and clones, the samples from natural forest had
showed strict genetic fidelity with respect to origin.
3.3.2. Phenology, seed setting and germination parameters
The data on flowering and fruit setting of clones were recorded for 578 trees (ramets)
of 31 clones in the orchard for one year. Out of 578 trees, there were 51 flowering trees and
35 seed setting trees. The percentage of flowering was 8.8 per cent and seed setting was 6 per
cent showing very low percentage among the clones in the orchard. Out of 31 clones 27
clones were able to flower and 20 clones were able to produce seeds. Low percentage of
germination of the collected seeds was observed. Seeds from only two clones were able to
germinate. Clone 11 and clone 31 gave germination percentage of 6.6 and 3.3 respectively
(Table 7).
Fruit set in teak is influenced by several factors such as genetic diversity of clones,
presence and activity of pollinators, weather conditions, etc. The total genetic diversity
among the clones in the clonal seed orchard was found to be 0.23. Nicodemus et al. (2005)
estimated total genetic diversity of 0.3 in same species using RAPD markers in samples from
natural forests and plantations of the Western Ghats and Central India. When compared to the
genetic diversity of samples from natural forests, the genetic diversity of clonal seed orchard
is not too much lower. However, the mixing of genotypes from different areas might have
vitiated the estimation to some extent. But the decrease in genetic diversity is insufficient to
account for the dismal performance of seed orchards with respect to seed production. Lack of
flowering is seen as the major cause of poor seed set. Though we have monitored the
flowering and seed setting for one year only, records indicated continued absence of
flowering and seed setting in the seed orchards located at Kulathupuzha.
While selecting clones for future seed orchard establishment, it may be important to
select clones within a broad provenance region, such that their flowering time could be

25
matched or CSOs should be established using genetically diverse clones showing profuse
synchronized flowering and seed set, selected within a provenance. While raising seed
orchards in future, ramet’s number should be labeled properly and information on origin of
plus trees, consistency of flowering, seed setting, seed viability and germination percentage,
etc. are to be recorded properly.

26
Table 7. Flowering, fruit setting and seed germination in clonal seed orchard at Kalluvettankuzhi.
SL.No. Clone
ID Clone
Number
Total number of
(trees) ramets
observed
Number of trees
flowered
Number of seed setting trees
Germination
percentage 1 NIL 1 clone 1 17 5 3 nil 2 NIL 2 clone 2 16 2 2 nil 3 NIL 3 clone 3 16 3 3 nil 4 NIL 4 clone 4 19 2 nil nil 5 NIL 5 clone 5 13 1 1 nil 6 NIL 6 clone 6 14 3 1 nil 7 NIL 7 clone 7 19 1 1 nil 8 NIL 8 clone 8 14 1 1 nil 9 NIL 9 clone 9 17 2 nil nil 10 NIL 10 clone 10 15 nil nil nil 11 NIL 11 clone 11 20 2 1 6.6 % 12 NIL 12 clone 12 18 1 1 nil 13 NIL 13 clone 13 18 2 nil nil 14 KON 14 clone 14 21 3 3 nil 15 KON 15 clone 15 20 1 1 nil 16 KON 16 clone 16 23 nil nil nil 17 KON 17 clone 17 22 2 1 nil 18 KON 18 clone 18 19 2 2 nil 19 KON 19 clone 19 18 2 1 nil 20 KON 20 clone 20 19 2 1 nil 21 KON 21 clone 21 25 nil nil nil 22 KON 23 clone 23 21 2 2 nil 23 NIL 24 clone 24 22 1 1 nil 24 NIL 25 clone 25 18 1 1 nil 25 ARK 26 clone 26 18 nil nil nil 26 ARK 27 clone 27 23 1 nil nil 27 ARK 28 clone 28 19 1 nil nil 28 ARK 29 clone 29 20 1 nil nil 29 ARK 30 clone 30 19 1 nil nil 30 ARK 31 clone 31 17 5 5 3.3 % 31 ARK 32 clone 32 18 3 3 nil
TOTAL 31 578 51 35
27
4. CONCLUSIONS AND RECOMMENDATIONS
Natural teak population of Kerala and Tamil Nadu part of the Western Ghats in the
Indira Gandhi Wildlife Sanctuary showed higher genetic diversity than the Karnataka
populations. The lower genetic diversity of teak from Nialmbur natural forest compared to
other areas of the Western Ghats of Kerala necessitates immediate attention for its
conservation. Nilambur teak forests showed its separate genetic identity in cluster analysis.
Considering the genetic divergence of Nilambur teak from other teak populations of Kerala
and their unique superior timber quality reported in several other studies, mixing of
genotypes from other provenances, especially in breeding populations such as SPAs and
CSOs should be avoided in order to maintain genetic purity of Nilambur teak. Centuries of
glorious tradition associated with tree form and colour of Nilambur teak, and the separate
genetic identity revealed by the present study suggest the possibility of considering
geographic indicator registration for Nilambur teak.
Understanding the genetic diversity status of each SPAs will be useful in ascertaining
the quality of seeds used for raising future plantations. The genetic diversity of SPAs is lower
than that of natural teak populations. This could be due to the narrow genetic base of the
parent trees from which seeds for raising the plantation (SPA) might have been collected.
Hence, sufficient genetic diversity of a plantation has to be ensured before converting
plantations to SPAs in order to avoid inbreeding and poor seed quality.
The lower genetic diversity might be causing, to some extent, inbreeding in CSO
affecting seed set, seed germination and seedling health. However, the genetic diversity
factor is insufficient to explain the poor performance of seed orchards with respect to seed
production and viability. Future CSOs may be established using genetically diverse clones
selected from same provenance and showing profuse synchronized flowering and seed set.
These attributes have to be ensured while selecting candidate plus trees or plus trees from
which the clones are derived.
Geographical and genetic distances were significantly correlated showing genetic
divergence between distant natural populations. Hence, while mixing clones from different
provenances for establishing CSOs, phenologically unmatching clones should be avoided.

28
5. REFERENCES Bhat, K.M., and Priya, P.B. 2004. Influence of provenance variation on wood properties of
teak from the Western Ghat region in India. IAWA J. 25: 273–282. Changtragoon, S., and Szmidt, A.E. 2000. Genetic diversity of teak (Tectona grandis L.) in
Thailand revealed by randomly amplified polymorphic DNA (RAPD) markers. In IUFRO conference on Tropical Species Breeding and Genetic Resources: Forest Genetics for the next millennium. International Conference Centre, Durban, South Africa. pp. 82-83.
Doyle, J.J., and Doyle, J.L. 1990. Isolation of DNA from fresh plant tissue. Focus, 12: 13 -
15. FAO, 1989. Forest product prices 1969-1988. ESTUDIO FAO MONTES 95. FAO, Rome. Gallagher, S.R. 1996. Quantification of DNA and RNA with absorption and fluorescence
spectroscopy. In Current Protocols in Molecular Biology, Vol. III. Edited by Ausubel, F.M., Brent, R., Kingston, R.E., Moore, D.D., Seidman, J.G., Smith, J.A. and Struhl, K. John Wiley and Sons, USA. pp. A.3D.1 - A.3D.8.
Gunaga, R.P., and Vasudeva, R. 2005. Causes for low fruit production in Clonal seed
orchards of teak ( Tectona grandis Linn. f.) A special references to India. In Quality Timber Products of Teak from Sustainable Forest Management. Kerala Forest Research Institute and International Timber and Trade Organization. Edited by Bhat, K.M, Nair, K.K.N, Bhat, K.V, Muralidharan, E.M, and Sharma, J.K. Kerala Forest Research Institute and International Tropical Timber Organization, Peechi, India. pp. 366-371.
Kjaer, E.D., 1996. Estimation of effective population number in a Picea abies (Karst.) seed
orchard based on flower assessment. Scand. J. For. Res. 11: 111-121 . Lowe, A., Samantha, D., Hugo, V., Jongkon, C., Indira, E.P., Balasundaran, M., Sudarsono,
Endah, R.P., Hubert, W., Elsie, S., Dominique, V.D.S. and Madan, S. 2005. TEAKDIV – Developing know how for the improvement and sustainable management of teak genetic resources. In Quality Timber Products of Teak from Sustainable Forest Management. Kerala Forest Research Institute and International Timber and Trade Organization. Edited by Bhat, K.M, Nair, K.K.N, Bhat, K.V, Muralidharan, E.M, and Sharma, J.K. Kerala Forest Research Institute and International Tropical Timber Organization, Peechi, India.

29
Namkoong, G., Boyle, T., Gregorius, H.R., Joly, H.Y., Savolainen, O., Ratnam, R. and Young, A. 1996. Testing criteria and indicators for assessing the sustainability of forest management: genetic criteria and indicators. CIFOR, Bogor, Indonesia.
Nei, M. 1973. Analysis of gene diversity in subdivided populations. Proc. Natl. Acad. Sci.
70: 3321-3323. Nicodemus, A., Nagarajan, B., Narayanan, C., Varghese, M., and Subramaniaan, K. 2005.
RAPD Variation in Indian teak populations and its implications for breeding and conservation. In Quality Timber Products of Teak from Sustainable Forest Management Proceedings of International Conference. Edited by Bhat, K.M, Nair, K.K.N, Bhat, K.V, Muralidharan, E.M, and Sharma, J.K. Kerala Forest Research Institute, Peechi, Kerala, India and International Tropical Timber Organization, 5th floor, Pacifico – Yokohama, 1-1-1, Minato- Mirai, Nishi-ku, Yokahama, Japan. pp. 321-330.
Prabhu, N.H. 2007. Studies on seed production areas of teak ( Tectona grandis L.f.) in Kerala
for their seed quality and nursery performance. Ph.D Thesis, Faculty of Silviculture, Forest Research Institute University, Dehradun, Uttaranchal.
Sokal, R.R., and Sneath, P. H. A. 1963 Principles of Numerical Taxonomy. Freeman, San
Francisco, California. Venkatesh, C.S., Koshy, M.P., Chacko, K.C., and Indira, E.P.1986. Genetic improvement of
teak (Tectona grandis L. f.) in Kerala. In: KFRI Research report, Kerala Forest Research Institute, No. 13: 5, Kerala Forest Research Institute, Peechi, Thrissur.
Vos, P., Hogers, R., Bleeker, M., Reijens, M., Van de Lee, T., Hornes, M., Frijters, A., Pot,
J., Peleman, J., Kuiper, M., and Zabeau, M. 1995. AFLP: a new technique for DNA fingerprinting. Nucleic Acids Res. 23: 4407-4414.
Yeh, F.C., Yang, R., and Boyle, T. 1999. POPGENE Version 1.32: Microsoft Window-based
Freeware for Population Genetic Analysis. A joint project developed by Centre for International Forestry Research and University of Alberta, Canada, 25.
Zobel, B. and Talbert, J., 1984. Applied Forest Tree Improvement, John Wiley, New York.