studies on structural and physical properties of zr bi tio
TRANSCRIPT

Studies on Structural and Physical Properties of Zr
Substituted Na0.5Bi0.5TiO3 and Na0.5Bi0.5TiO3-BaTiO3 Solid
Solution for Vibration Sensor Application
Gottuparthi Vasundhara
(MS12M1002)
A Dissertation Submitted to
Indian Institute of Technology Hyderabad
In Partial Fulfillment of the Requirements for
The Degree of Master of Technology
Department of Materials Science and Metallurgical Engineering
Indian Institute of Technology Hyderabad
June 2014
ii
Declaration
I declare that this written submission represents my ideas in my own words, and where
others’ ideas or words have been included, I have adequately cited and referenced the
original sources. I also declare that I have adhered to all principles of academic
honesty and integrity and have not misrepresented or fabricated or falsified any
idea/data/fact/source in my submission. I understand that any violation of the above
will be a cause for disciplinary action by the Institute and can also evoke penal action
from the sources that have thus not been properly cited, or from whom proper
permission has not been taken when needed.
_________________________
(Signature)
Gottuparthi Vasundhara
(MS12M1002)
iii

iv
Acknowledgements
I would like to express sincere gratitude to my supervisor Dr. Ranjith Ramadurai
for introducing me the research and providing an opportunity to work in FMRG. I am
thankful to him for his expert guidance and assistance in every aspect of this work. I
am indebted to him for his constant encouragement.
I am also grateful to acknowledge Dr. Atul Suresh Deshpande for his valuable
guidance for the sol gel synthesis. I would like to acknowledge Dr. Pinaki Prasad
Bhattacharjee, Dr. Suhash Ranjan Dey, Dr. Bharat Bhooshan Panigrahi and
other faculty members of MSME department for supporting me throughout my thesis
work.
I am grateful to acknowledge Dr. Amritham Rajagopal, Assistant Professor,
Department of Civil Engineering for giving me access to civil department labs to carry
out my experiments.
I would like to express my gratitude to Mr. Mallesh (Ph.D. Scholar) for his constant
encouragement, support and valuable discussions. I would like to thank Mr. Venky,
Mr. Kumar, Mr. Saj, Mr. Deepak Anand, Mr. Vijay Bhaskar and Mr. Mudith
for helping me in characterization techniques. Without their help I would not complete
my thesis as quickly as I did.
I would like to thank Usha, Nida, Badak, Tushar, Ankith, Rahul, Manish and
Satyanarayana for always being there and bearing with me the good and bad times
during my wonderful days of M.Tech.
I would like to express my gratitude to all the Ph.D. scholars and M.Tech students of
Department of MSME and Department of Physics. Especially to Mr. Damodar, Mr.
Rajkumar, Ms. Sushmita, Mr. Swapnil Ghodke, Mr. Karthik and Mr. Durga
Rao for helping me though out the project.
I wish to express my thanks to Mr. Savit Aluri and Ms. Ritambhara Chauhan
(B.Tech students, Department of Engineering Science) for their help in vibration
sensor work and sharing their knowledge with me.

v
I am grateful towards my school teachers who introduced me to the basic science and
make me to travel in this direction. I want to thank my mother for her constant love
and blessings towards me and finally I am grateful to acknowledge my in laws
especially my Father in law (Mr. K.S.Rama Rao), Mother in law (Mrs. Samrajya
Lakshmi) and to my husband (Mr. Udaya Bhaskar) for their love and unlimited
support to achieve my goal.

vi
Dedicated to
My Family
&
My guide Dr. Ranjith Ramadurai

vii
Abstract
In the present day modern technology scientists are more focused on lead free
ferroelectric ceramics in understanding the fundamental issues, to improve the
ferroelectric and piezoelectric properties of these materials. Among these lead free
piezoelectric ceramics, sodium bismuth titanate (Na0.5Bi0.5) TiO3 (NBT) in recent
times has attracted much more due to its high ferroelectric and piezoelectric
properties. It is well known that the structural and functional properties of materials
can be tuned through the elemental substitution. In this regard, at present we have
focused on tuning the piezoelectric properties of NBT ceramics via Zr substitution
and NBT-BT solid solution. In order to synthesize both (Na0.5Bi0.5) Ti1-xZrxO3 and
NBT-BT solid solutions conventional solid-state reaction route has been used. X-ray
Diffraction, phonon mode measurements have been carried out to identify the
structural and phase modifications. The sintered samples were electroded and poled
to measure the dielectric and piezoelectric properties. The observation of relaxor
features in Zr substituted NBT ceramics i.e. frequency dispersion in Tmax along with
diffused phase transition. In NBT-BT solid solution decrease in the depolarization
temperature and Tmax has been reported through dielectric studies. The
electromechanical coupling coefficient of these materials has been measured using
resonant and antiresonant method, which revealed the decrease in the coupling
coefficient with substitutions. The piezoelectric strain coefficient was measured using
Piezo-test meter for Zr substituted NBT and decrement in this value observed with Zr
substitution. Finally these NBT ceramic pellets have been tested for the vibrational
sensor applications.

viii
Nomenclature
NBT - Sodium bismuth titanate (Na0.5Bi0.5TiO3)
NBZT5 - Sodium bismuth zirconium titanate (Na0.5Bi0.5Ti0.95Zr0.05O3)
NBZT10 - Sodium bismuth zirconium titanate (Na0.5Bi0.5Ti0.9Zr0.1O3)
NBT-BT - Sodium bismuth titanate- Barium titanate solid solution ((1-x)
Na0.5Bi0.5TiO3-xBaTiO3)
NBT6BT - 0.94Na0.5Bi0.5TiO3-0.06BaTiO3
NBT8BT - 0.92Na0.5Bi0.5TiO3-0.08BaTiO3
ε - Dielectric constant or permittivity
ε” - Dielectric loss
Tm or Tmax - Temperature at maximum dielectric constant
γ - Diffusivity
Tc - Curie temperature
Td - Depolarization temperature
XRD - X-ray diffraction
SEM - Scanning electron microscope

ix
Contents
Declaration………………………………………………………………………ii
Approval Sheet………………………………………………………………….iii
Acknowledgements……………………………………………………………...iv
Abstract…………………………………………………………………………viii
Nomenclature…………………………………………………………………… viiii
1. Introduction………………………………………………………………………1
1.1 Dielectric materials………………………………………………………….1
1.2 Relaxor ferroelectrics…………………………………………………….....5
1.3 Piezoelectric materials .....……………………………………………...….6
2. Literature review…………………………………………………………….......8
2.1 Lead free piezoceramics (NBT)…………………………………………….8
2.2 Literature review on NBT-BT solid solution………………………………12
2.3 Objectives……………………………………………..…………………...15
3. Experimental Details…………………………………………………….……..17
3.1 Synthesis…………………………………………………………………...17
3.2 Characterization techniques……………………………………………….23
4. Results and discussion of Zr substituted NBT ...……………………………..27
4.1 XRD………………………………………………………………………..27
4.2 Raman spectroscopy…………………………………………………….....29
4.3 Scanning electron microscopy……………………………………………..30
4.4 Piezoelectric resonance and electromechanical coupling coeffcient…...….32
4.5 Piezoelectric charge coefficient…………………………………………....34
4.6 Dielectric characterization………………………………………………....34
5. Results and discussion of NBT-BT solid solution ...……...…………………..39
5.1 XRD…………………………………………………..………...………….39
5.2 Scanning electron microscopy………………………………………...…...40
5.3 Piezoelectric resonance and electromechanical coefficient………………..41
5.4 Dielectric measurements…………………………………………………...42
x
6. Testing of NBT as a vibration sensor………………………………..….…….45
6.1 Introduction………………………………………………………………..45
6.2 Testing the vibration sensor…………………………………………………46
7. Summary and Conclusions………………………………………………...…..48
References………………………………………………………………………...50
1
Chapter 1
Introduction
1.1 Dielectric materials:
The dielectric materials are electrically insulating and could be polarized by the application
of electric field. In principle all the dielectrics are insulators, when an electric field is applied
the center of positive and negative charges gets displaced which leads to net dipole moment.
This separation of charge centers is called polarization [1]. Due to the polarizability of
dielectric materials they are used in wide range of device applications staring from filters,
data processors and storage etc. The energy storage is associated with the mechanism of
charge separation under external electric field. The storage capacity varies from material to
material; it depends on the intrinsic and extrinsic contributions of polarization.
Dielectric materials are classified into the two major types: non-ferroelectric materials and
ferroelectric materials [2].
Non-Ferroelectric materials:
Non-ferroelectric materials get polarized when subjected to an external electric field. There
are three major intrinsic mechanisms involved in the generation of electric polarization
depending on the frequency of the applied electric field. The three primary mechanisms of
polarization includes: electronic polarization, ionic polarization, orientational polarization
(dipolar polarization) [2]. If the applied electric field induces the distortion of electron cloud
around an atom then it is called as electronic polarization, which responds up to the frequency
range of 1012 to 1015 Hz. The polarization generated due to the displacement of positive and
negative ions with respect one another is called as ionic polarization, it follows the applied
alternating field up to the frequency of 109 to 1012 Hz [2]. The alignment of dipoles in the
direction of applied electric field is known as orientational polarization or dipolar
polarization, it responds up to the frequency range of 106 to 109 Hz [Dipolar polarization
presents in the materials possessing permanent dipoles] [2]. All these polarizations are due to
bound charges within the system. Figure 1.1 shows the schematic representation of all these

2
polarization mechanisms. Apart from these polarizations the extrinsic contribution of
polarization includes: space charge polarization, grains and grain boundary polarization [2].
Fig 1.1: Electric polarization mechanisms
Ferroelectric Materials:
Ferroelectric effect was first observed by Valasek in 1921 in Rochelle salt. The word ferro is
from Greek term ferum which means iron. This doesn’t mean that it contains iron, the word
ferroelectrics are used in analogy to ferromagnetism due to similarity in the characteristics.
Ferroelectrics are the materials which exhibits spontaneous polarization and that can be
reversible by the application of electric field [2]. The essential criterion of ferroelectric
materials is the non-centro symmetric crystal structure which means lack of center of
inversion. Most of the ferroelectric materials exhibit the perovskite crystal structure [General
formula: ABO3]
Fig 1.2: Schematic representation of a Perovskite Structure [5]

3
Features of Ferroelectricity:
Hysteresis behavior:
The nonlinear relation between polarization (P) and electric field (E) is called hysteresis
behavior. Fig 1.3 shows the schematic of hysteresis loop of a conventional ferroelectric
material. Initially the P varies linearly (OA region) with respect to applied field, because of
insufficient field for the domain orientation. By increasing the field at a certain value the
polarization gets saturated, which means most of the domains oriented in the direction field,
it is called saturation polarization (BC region). Again by decreasing the field domains tried
align in the original positions, whereas some of the domains could not orient in the original
position. This leads to some remnant polarization (D) in the system even in the absence of
external field. The field required to make the polarization zero is called coercive field (OR).
The area of the hysteresis loop represents the energy dissipated in the specimen as heat during
each cycle [2].
Fig 1.3: Hysteresis loop of ferroelectrics [2]
Structure criterion:
Non-centrosymmetric crystal structure is one of an essential criterion for a material
to exhibit ferroelectric properties. Among the ferroelectric materials perovskites (ABO3)
structured materials are simplest, occupied major portion of ferroelectric materials. In the
perovskites structure corner positions are occupied by the larger cations (A), body centered
site is occupied by B cation, whereas all the face centered sites occupied by oxygen atoms.

4
Size of the A-site cation is larger compared to B, the interaction of A-O is more compared to
B-O. So B-cation is free to move from its center position, this is called rattling of B cation,
which is the origin of polarization in BaTiO3 like systems [6]. The below figure (Fig 1.4)
shows the origin of polarization in BaTiO3.
Fig 1.4: Origin of polarization in BaTiO3 [6]
Phase transition:
The transition of a ferroelectric material from centro-symmetric state (paraelectric) to non-
centro symmetric state at a particular temperature is called phase transition. The figure 1.5
shows the variation of a dielectric constant with temperature. In case of normal ferroelectrics
the variation of dielectric constant is sharp when material undergoes transition from
ferroelectric to paraelectric state. This transition involves structural changes and change in
the spontaneous polarization [6]. The temperature at which phase transition occurs is called
Curie temperature.
Fig 1.5: Phase transition in ferroelectrics [6]

5
1.2 Relaxor Ferroelectrics:
These are the special class of ferroelectrics, which has disorder at A or B site. The general
formulae is A1A2B1B2O3
here A1 = Pb+2, Ba+2, Sr+2, Ca+2, Na+1; A 2 = La2+, Bi3+; B1 = Mg2+, Sc3+, Zn4+; B2 = Ti4+, Nb5+
These relaxor ferroelectrics (RFE) are different from normal ferroelectrics in several aspects.
The main properties of RFE are:
1. Due to presence of charge heterogeneity either in A-site or B-site cationic positions,
relax or ferroelectric materials possess local cationic ordered and disordered regions.
The ordered regions might be embedded in disordered regions and vice versa [3].
The ordered regions of relaxors are polar due to local structural distortion; these local
ordered regions are also termed as polar nano regions (PNRs). The size of these polar
nano regions in relaxors is typically in the order of 2-50nm.
2. Temperature dependence of permittivity in normal ferroelectrics follows the Curie-
Weiss law i.e., 1/ε’ vs T plot is follows the linear behavior after phase transition
temperature (Curie temperature) as shown in the inset of figure. But relaxor-
ferroelectrics exhibits strong deviation from Curie-Weiss law (non-linear 1/ε’ vs T
plot) due to the presence of interaction between polar nano regions even beyond
temperature corresponds dielectric maxima (Tmax) [4]. So the phase transition
behavior of relaxor ferroelectric materials explained by modified Curie-Weiss law.
Modified Curie Weiss law: (1/ε – 1/εm ) = (T - Tm ) γ / C …… (1.1)
where, ε - Dielectric constant, εm- Maximum dielectric constant,
Tm- Temperature at εm
3. In relaxor ferroelectrics, ferroelectric to paraelectric transition is board i.e. over wide
range of temperatures unlike normal ferroelectrics. Figure 1.6 shows the phase
transition behavior of relaxor ferroelectric. The diffused phase transition in relaxors
is due to variation in size of the ordered and disordered regions, as well as associated
local compositional heterogeneity. Depending on the size of the clusters the
temperature corresponds dielectric maxima (Tmax) differs, so the phase transition is
diffusive relaxors over wide range of temperatures. Additionally relaxors exhibits
dielectric frequency dispersion below dielectric maxima, frequency dispersion in
Tmax. The shift in Tmax towards high temperature in dielectric constant vs temperature
curve with increasing frequency of the applied field (frequency dispersion in Tmax) is

6
due to the increment of correlation strength between polar clusters as the
measurement frequency increases [4].
(a) (b)
Fig 1.6 (a) Phase transition in relaxor ferroelectrics (b) Change in the polarization with
temperature [4]
1.3 Piezoelectricity:
Piezoelectric effect was discovered by Jacques and Pierre Curie in 1888. The word piezo is
derived from the Greek word piezein which means to squeeze or press. Piezoelectric effect is
the capability of a material to generate the electric voltage by the application of mechanical
stress. The essential requirement of a piezoelectric material is the crystal structure should be
non-centrosymmetric. The major difference between ferroelectric and piezoelectric materials
is: ferroelectrics exhibit reversible spontaneous polarization, whereas piezoelectrics (polar)
exhibits non-reversible spontaneous polarization with no center of symmetry. Also non-polar
piezoelectric materials do not exhibit any spontaneous polarization. Piezoelectric phenomena
include both direct and indirect effects [2]. The generation of electric voltage under applied
mechanical stress expressed as direct piezoelectric effect, whereas generation of mechanical
strain (stress) by the application of electric field is called as converse piezoelectric effect.
Fig 1.7: Piezoelectric effect phenomenon [7]
All ferroelectric materials are piezoelectric materials but all piezoelectric materials are not
ferroelectrics. Piezoelectric materials with ferroelectricity exhibit reversible spontaneous

7
polarization whereas polar piezoelectrics without ferroelectricity exhibits irreversible
spontaneous polarization.
Figures of merit:
Piezoelectric strain (charge) coefficient (d):
The Piezoelectric strain coefficient (d) is defined as the mechanical strain (x) induced in a
piezoelectric material by the applied electric field along the specific direction or the amount
of charge developed relative to the applied stress along the specific direction [8].
x = d E………………………………… (1.2)
Piezoelectric properties are anisotropic in nature, so depending on the applied electric field
direction the mechanical component will be different along different orientational direction.
These directional properties are specified by using subscripts, which defines the direction and
orientation. The more general form of strain coefficient is dij, where i is the applied field
direction and j is the generated strain (or stress) direction. The Piezoelectric strain coefficients
are d33, d31 and d15. The unit of piezoelectric strain coefficient is pm/V (or pC/N).
Electromechanical coupling factor (k2):
Electromechanical coupling factor is the direct way to measure the energy conversion ability
of a piezoelectric material to convert electrical energy to mechanical energy and vice versa.
In other words coupling constant is a measure of efficiency of a piezoelectric material to
convert one form of energy to another form [8].
k2= Output electrical energy/ Input mechanical energy (or)
k2= Output mechanical energy / Input electrical energy………(1.3)
The total input energy could not be converted into output energy, so the coupling factor (k) is
always less than unity. Typical values of k are: 0.1 for quartz, 0.4 for Barium Titanate, 0.7 for
Lead Zirconate Titanate (PZT) and 0.9 for Rochelle salt.

8
Chapter 2
Literature Review
2.1 Lead free Piezo ceramics (Na0.5Bi0.5TiO3 (NBT)):
Lead based material are well known for their excellent piezoelectric properties and are widely
using in various applications (marine, transducers, sonars and paints) and these materials are
ruling the medical, electronic industry and structural health monitoring of civil structures. But
considering the toxicity of lead and its compounds, which are emitted by the electronic waste,
is hazardous to health and environment. So these materials are restricted from the ROHS
(Restriction of hazardous substances), legislation passed by European Union [7].
So in recent years there has been a continuous drive in search of efficient lead free
piezoelectric materials. In those lead free materials Bismuth based materials occupied a
significant place due to its similarities with lead. Among all these Bi-based materials NBT is
the most promising material with good piezoelectric properties due to the similarities in
electronic configuration of lead and bismuth as in PZT lead leads to the polarization due to
the distortion of stereo chemical 6s2 lore pair which is similar in NBT through Bi3+ ion. NBT
was first reported by smolensky et al. in 1960. NBT phase transition behavior and crystal
structure is still a controversial research topic. NBT has rhombohedral crystal structure at
room temperature and shows phase transition with increasing temperature as Rhombohedral
(R3C) to Tetragonal (p4bm) at 320 °C and Tetragonal to Cubic (pm3m) at 540 – 520 °C [9].
In general NBT is synthesized by solid state route and hydrothermal process depending upon
the application. Barick et al. Prepared the NBT ceramic by solid state route at 1100 °C with 4
hrs. Because of this high sintering temperature there is a chance of Bi volatility which creates
the oxygen vacancies in the system [9]. So to decrease the sintering temperature M.V. Raman
et al. used microwave sintering method with 950 °C as sintering temperature. In both methods
single phase sodium bismuth titanate is formed and by microwave sintering method improved
the morphology and physical properties i.e. increase in the dielectric constant compared to
solid state route was observed [10].

9
The dielectric properties of NBT are still an argument due to its diffused phase transition and
without frequency dispersion in the Tmax (the temperature corresponding to dielectric
maximum). Fig. 2.1 shows the dielectric constant vs temperature at different frequencies. It
was observed that dielectric constant (εr) increases with decreasing frequency. The peak at
around 200°C is defined as depolarization temperature where the transition from ferroelectric
to anti ferroelectric phase occurs due to absence of long range ferroelectric order [11] and the
phase transition ferroelectric to paraelectric phase at 320 °C called as Curie temperature or
phase transition temperature which involved the structural phase transition. The imaginary
part (ε//) i.e. dielectric loss is also follows the same behavior of εr. Baric et al. calculated the
diffusivity value of phase transition by using modified Curie Weiss law
(1/ε – 1/εm) = (T - Tm ) γ / C……………………………..(2.1)
and for NBT reported as γ= 1.53 for 10 kHz which proved that the phase transition is a
diffused phase transition and this behavior is due to cation disorder at A-site [9].
Fig 2.1: Dielectric constant studies of NBT from room temperature to 450°C at different
frequencies (inset: modified Curie-Weiss plot of the same) [9]
These dielectric phase transitions are supported by temperature dependent Raman studies
done by Viola et al. In this paper change in the dielectric constant was attributed to the change
in the Raman mode intensities and splitting [11]. In this paper they reported the Raman modes
at 270 cm-1, 380 cm-1, 520 cm-1 and 590 cm-1 in between 200 to 600 cm-1 range. Between room
temperature to 125 °C, the mode at 270 cm-1 undergoes softening and intensity of this mode

10
decreases with increasing temperature and showing significant intensity after Tmax suggesting
the presence of polar nano regions, an in this region the ferroelectric phase is dominant. Above
125 °C this mode softening ceases suggests the increase in the spatial disorder, which leads to
the shrinkage of polar clusters. The mode of 380 cm-1 show hardening with increasing
temperature due to the change in the unit cell influences the octahedral framework, which
leads to increased interaction between oxygen atoms [11].
Fig2.2: Temperature dependent Raman spectrum of NBT [11]
Polarization vs. electric field (PE loop) characterization for NBT was done by Niranjan et al.
in which they reported the coercive field Ec 65 kV/cm an remnant polarization as Pr = 38
µC/cm2[12]. Due to this high coercive field these NBT ceramics are difficult to pole compared
to other commercial piezo electric materials. To overcome this problem different dopants can
be added to NBT and we can improve the piezoelectric properties (d33). There are two types
of dopants in NBT.
2.1.1 A site dopants:
La substituted NBT:
Aksel et al. substituted A-site by La3+ with 0.5, 1.0 and 1.5 at %. By this substitution the
coercive field (Ec) decreased by 5 kV/mm and remnant polarization (Pr) increased by 5
µC/cm2 and by 1.5 at% La substitution. The depolarization temperature (Td) decreased

11
consistently as the La content increased, and 60 °C decrease in Td from unmodified to 1.5 at
% La modified NBT .This feature is useful to the device application there is no change in the
relaxor features of NBT by La substitution [13].
Fig 2.3 (a): PE loop of NBT and La substituted NBT [13], (b): Dielectric properties of NBT and
La [13]
Fe substitution in NBT:
Elena Aksel et al. studied the effect of Fe3+ substitution in NBT. By substituting Fe local
disorder decreases and the structure becomes closer to long range Cc structure. This can be
correlated with the increased distortion of the unit cell leads to possible increase in octahedral
tilting as observed in increasing lattice parameters. The addition of 0.5 and l at % Fe to NBT
increases the depolarization temperature, and this is attributed to the defect dipoles that form
with the addition of Fe to NBT which stabilize the ferroelectric order. Further Fe addition
leads to a decrease in Td, is due to limited poling owing to high conductivities of these samples
[14].
Fig 2.4: Phase transition plots of NBT and 0.5% Fe modified NBT [14]

12
2.1.2 B-site dopants:
In B site dopants are two types acceptor and donor dopants table shows the values of physical
properties with different dopants. With the donor doping, Ec is decreased and Pr increased and
with acceptor doping Ec is increased and Pr decreased [15].
Table2.1: Physical properties of NBT with different B-site substitutions [15]
Property
NBT Donor Acceptor
Ti4+ Nb5+ Ta5+ W6+ Mn3+ Sc3+
Ionic radius (Å) 0.60
5 0.64 0.64 0.64 0.64 0.64
d33(pC/N) 74 87 84 84 66 77
kp 0.17 0.17 -- 0.16 0.13 0.16
Qm 320 160 202 180 369 269
Tm (°C) 324 ↑ - ↑ - -
Td (°C) 190 129 - - 167 -
Ec @ 60Hz (k/cm) ~41 ~24 ~18 ~20 - -
Pr @ 60Hz (uC/cm2) ~35 - - ~40 - -
Even though different substitutions were studied in NBT, there is no clear report on relaxor
properties of NBT with Zr4+ substitution. Three people have reported about Zr substitution
NBT, but they did not mentioned about the physical properties.
2.2 Literature review on NBT-BT solid solution:
The morphotropic phase boundary in NBT based solid solutions, attributed to the large
piezoelectric properties. NBT-BT solid solution is one of the well-known materials with a
morphotropic phase boundary (MPB) between rhombohedral phase of NBT and tetragonal
phases of BT [16].

13
Fig 2.5: Phase diagram of NBT-BT [16]
Table 2.2: Piezoelectric properties of NBT-BT solid solution [17]
Compound d33(pC/N) Kp Tand (%)
NBT 64 302.6 1.752
(1-x) NBT-xBT, X=0.02 78 402 1.73
X=0.04 87 445 2.07
X=0.06 122 601 1.79
X=0.08 112 841 2.04
X=0.1 94 764 2.39
The below figure shows the phase diagram of NBT and BT. This MPB for NBT-BT is at 6-7
mol % of BT. In this region d33 values increase drastically compared to NBT (64 pC/N). The
below table shows the increase in the piezoelectric properties with different compositions of
NBT-BT solid solution [17].
Garg et al. discussed about the (1-x) NBT-xBT solid solution with different compositions by
solid state sintering route. He reported the compositions of x= 0, 0.05, 0.065, 0.07 and 0.10.
The below Fig. 2.6 shows the enlarged XRD patterns of (110), (111) and (200) reflections of
(1-x) NBT-xBT. At x=0.05 composition, the XRD pattern is normal as NBT. From x=0.05 to
0.06 we can observe the changes in XRD patterns and all the peaks are singlet’s at x=0.06. A
sudden change in the XRD pattern occurs at x=0.07. The triplet nature of (110) and (200)

14
peaks can be explained as the coexistence of tetragonal and rhombohedral phases which is the
feature of MPB system. The Fig. shows the piezoelectric coefficient (d33) and maximum
polarization (pm) of NBT –BT ceramic. These properties shows a large values at x=0.06 - 0.07
region which are consistent with the above structural data from XRD [18].
Fig2.6 (a): Enlarged profiles of (110), (111) and (200) peaks [18], (b) Composition dependence of
Piezoelectric coefficient and maximum polarization of (1-x) NBT-xBT [18]
C. xu et al. studied the dielectric properties of the (1-x) NBT –xBT sold solution. The below
Fig. 2.7 shows the dielectric constant vs. temperature plots for x=0.06 and x=0.12. This solid
solution also exhibit two dielectric anomalies at 200 °C (Td) and 320 °C (Tm) like NBT. By
adding BT to NBT Td decreases and exhibit strong frequency dependence in x=0.06 which is
reported as MPB. In x=0.12 composition this peak is very sharp which indicated the tetragonal
side of MPB. Tm is also effected by Ba substitution as in x=0.06, the diffusivity of phase
transition increased drastically to 2.02 compared to NBT as 1.55 and a slight decrement to
1.92 with further increase to x=0.12. This is concluded as 0.94 BNT – 0.06 BT ceramic i.e. at
MPB has the maximum diffusivity value and this exhibits broad phase transition at around
320 °C because Na+, Bi3+ and Ba2+ are randomly distributed in the 12 fold coordination sites
so the observed diffuse phase transition at Tm is attributed to the disordering of A site cations
[19].
The transition temperatures effected as Td decreased by 168 °C to 105 °C at x=0.06 and
increase to 194 °C with increasing x to 0.12. Tm is also decreased to 285 °C from 320 °C with
x = 0.12 substitution. This decrease in Td attributed as ceramics at MPB possess the lowest
Td, because of the oxygen octahedron tilting at this composition [19].

15
Fig 2.7: Dielectric phase transition plot of (1-x) NBT-xBT [19]
So this MPB of (1-x) NBT-xBT (x=0.06-0.07) is very useful for device applications due to
high piezoelectric properties.
2.3 Objectives:
This work has been done with three major objectives.
1. To understand the relaxor feature of NBT by Zr – substitution. As NBT is showing
diffused phase transition but absence of frequency dependence in Tmax which is one
of the relaxor feature. To improve this feature we substituted Zr4+ in NBT. The reason
behind this explained below.
Reason for Zr- Substitution:
Zr4+ is isovalent with Ti4+ ions but heavier than Ti4+. So oxygen hybridization will be
high towards Zr because of its high atomic mass. So Zr-O bond is stronger than Ti-O
and ZrO6 octahedral distortion is less compared to TiO6 octahedra. As a result the
interaction between polar nano regions can be altered because of that relaxor feature
can be improved.

16
2. For device application synthesis and characterization of NBT –BT solid solution for
the enhancement of piezoelectric properties. As NBT – BT is well known material
due to its high piezoelectric properties we tried to reproduce those results.
3. Testing of vibration sensor with the synthesized NBT for vibration sensing
applications.

17
Chapter 3
Experimental Details
In this chapter the detailed synthesis procedure of sodium bismuth titanate [(Na0.5Bi0.5) TiO3)
[NBT], Zirconium substituted NBT [Na0.5Bi0.5Ti (1-x) ZrxO3, x = 0.05, 0.1], Barium titanate
(BaTiO3) (BT), and NBT-BT solid solutions were clearly explained. Also basic working
principles of structural, morphological and physical characterization techniques such as X-
ray diffraction, Raman spectroscopy, scanning electron microscope, Piezo – d33 meter and
Impedance Analyzer were given briefly.
3.1 Synthesis
3.1.1 Synthesis of NBT and Zr substituted NBT through solid state reaction route:
Solid-state reaction route is most widely used method to synthesize polycrystalline ceramic
compounds because in this route simple and cost effective. Oxides and carbonates are
generally used as initial precursors. To synthesize compounds via solid state reaction route
sufficiently high reaction (calcination) temperatures are required compare to wet chemical
routes. This thermal energy will help to overcome the diffusion barrier and allows the ions
to migrate through the rigid solid lattice. The reaction rate depends upon reaction atmosphere,
structural aspects, surface area and reactivity of initial precursors [20]. In the present work to
synthesize NBT and Zr substituted NBT the initial precursors such as Na2CO3, TiO2, Bi2O3
and ZrO2 with purity greater than 99.9% of SIGMA ALDRICH make were used. Initially all
these precursors were weighed in stoichiometric proportion to obtain NBT and Zr substituted
NBT. The stoichiometrically weighed powders were mixed and grounded in an agate mortar
to obtain homogeneously mixed compounds. Homogeneously mixed powders were calcined
at 8000C for 4hrs to obtain single phase compounds. The phase purity of calcined compounds
was confirmed through x-ray diffraction analysis. The phase pure calcined compounds were
ball milled for 8hrs at 400 rpm using propanol as a medium to get the fine particles [Ball mill
model: FRITCH – PULVERISETTE 7 premium Vials: Agate, Balls: Agate]. These fine
18
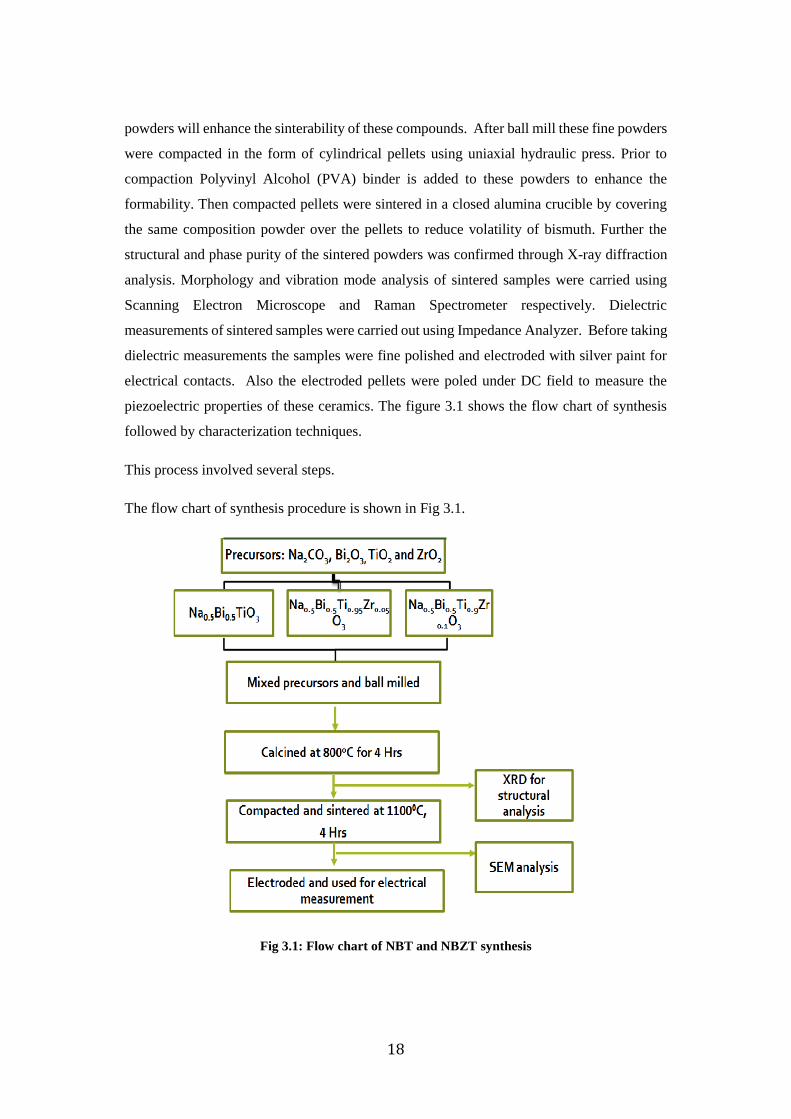
powders will enhance the sinterability of these compounds. After ball mill these fine powders
were compacted in the form of cylindrical pellets using uniaxial hydraulic press. Prior to
compaction Polyvinyl Alcohol (PVA) binder is added to these powders to enhance the
formability. Then compacted pellets were sintered in a closed alumina crucible by covering
the same composition powder over the pellets to reduce volatility of bismuth. Further the
structural and phase purity of the sintered powders was confirmed through X-ray diffraction
analysis. Morphology and vibration mode analysis of sintered samples were carried using
Scanning Electron Microscope and Raman Spectrometer respectively. Dielectric
measurements of sintered samples were carried out using Impedance Analyzer. Before taking
dielectric measurements the samples were fine polished and electroded with silver paint for
electrical contacts. Also the electroded pellets were poled under DC field to measure the
piezoelectric properties of these ceramics. The figure 3.1 shows the flow chart of synthesis
followed by characterization techniques.
This process involved several steps.
The flow chart of synthesis procedure is shown in Fig 3.1.
Fig 3.1: Flow chart of NBT and NBZT synthesis

19
Calcination:
Calcination is a thermal treatment process in solids in order to achieve thermal decomposition
state for the required phase formation through interdiffusion between the precursors. The
calcination temperature is usually below the lowest melting point among the precursors [20].
The manually mixed powders were calcined at 800 °C in a closed alumina crucible.
Calcination was done in muffle furnace with heating and cooling rate of 5 °C / min and soaking
time as 4 hr.
0 1 2 3 4 5 6 7 8 9 10 11 120
200
400
600
800
Te
mp
era
ture
(C
)
Time (Hrs)
4hrs at 800C
5C/min
Fig 3.2: Calcination profile of the NBT precursors
Sintering:
Sintering is the densification process of a polycrystalline body with or without the presence
of liquid phase to aid the transport of matter [22]. This transport of matter occurs by the
diffusion of atoms, ions or molecules along surface, grains, grain boundaries and lattices.
Initial bonding between the particles is the first step of sintering. Then neck growth followed
by pore shrinkage and pore coarsening leads to densification. Sintering temperature, time and
atmosphere can affect the microstructure i.e. particle size and shape of the product [6].
20
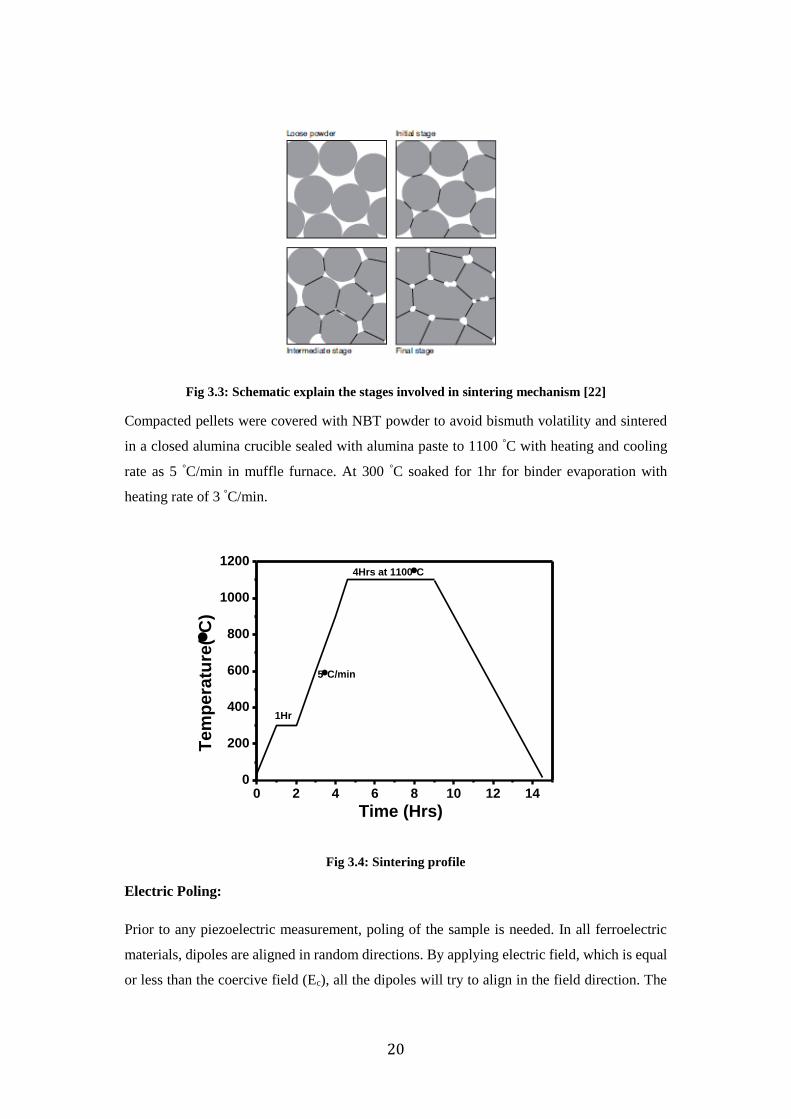
Fig 3.3: Schematic explain the stages involved in sintering mechanism [22]
Compacted pellets were covered with NBT powder to avoid bismuth volatility and sintered
in a closed alumina crucible sealed with alumina paste to 1100 °C with heating and cooling
rate as 5 °C/min in muffle furnace. At 300 °C soaked for 1hr for binder evaporation with
heating rate of 3 °C/min.
0 2 4 6 8 10 12 140
200
400
600
800
1000
1200
5C/min
Time (Hrs)
Te
mp
era
ture
(C
)
1Hr
4Hrs at 1100C
Fig 3.4: Sintering profile
Electric Poling:
Prior to any piezoelectric measurement, poling of the sample is needed. In all ferroelectric
materials, dipoles are aligned in random directions. By applying electric field, which is equal
or less than the coercive field (Ec), all the dipoles will try to align in the field direction. The

21
below figure explains about the alignment of dipoles by applying field. Generally poling
procedure needs high temperature because by increasing temperature Ec of the material will
decrease.
Fig 3.5: (a) Non polar state (b) Domains begin to align in field direction (c) Fully polarized state
(d) By removing field i.e. at zero field remaining polarization (remnant polarization) [24]
3.1.2 Synthesis of Barium titanate:
Barium titanate was prepared by using Sol gel synthesis.
Sol gel method is a wet chemical synthesis technique for preparation of oxide gels ceramics
at low temperatures. The sol gel process as the name implies, a transition from a liquid sol
(colloidal solution) into a gel phase. This process involves hydrolysis and condensation of
metal alkoxide followed by heat treatment at elevated temperature which induces
polymerization producing a metal oxide network [25].
For the synthesis of BaTiO3 through sol gel, barium carbonate (BaCO3), titanium iso prop
oxide (Ti (OCH (CH3)2)4), acetic acid (CH3COOH) and acetyl acetone (C5H8O2) were used
as precursors. The reason behind the selection of BaCO3 is due to its high solubility compared
to other materials. Barium carbonate is mixed with a 2 ml of acetic acid, stirred it for 30 - 40
minutes to prepare clear solution of Barium Acetate, then Titanium solution was prepared by
mixing Titanium iso propoxide with acetyl acetone in 1:1 molar ratio. The reactions are shown
below.
BaCO3 + 2CH3COOH ----- Ba (CH3COOH) 2 + CO2 + H2 ………………… (3.1)
Ti (OPri)4+ C5H8O2 (Acac) -------------- Ti(OPri)4-x(L)x + x iPrOH…………………(3.2)

22
These prepared solutions mixed together and allowed for gelation at room temperature for 24
hour which allows desorption of solvent trapped in the polymeric network. Involving
hydrolysis and condensation the BaTiO3 gel was formed. This gel was calcined at 1000 °C for
the phase formation and this phase purity was checked with XRD and used it for NBT-BT
solid solution synthesis.
The below figure shows flow chart of Sol Gel synthesis for BT preparation.
Fig 3.6: Flow chart of Barium titanate synthesis
Two major steps of sol gel synthesis are hydrolysis and condensation.
Hydrolysis:
The transition from sol to gel involves two steps. In hydrolysis process all the alkoxide groups
are replaced by hydroxyl groups by the addition of water [25].
OR OR
RO – M – OR + H2O ----------RO – M – OH + R – OH
OR OR
Ti iso propoxide is mixed with water, immediately Ti (OH) 2 will form. So to delay the
hydrolysis process we used acetyl acetone as chelating agent.

23
Condensation:
Condensation reaction involves hydroxyl groups and result in M – O – M linkage which
forms a 3D network by leaving water or alcohol as by product. From this reaction the
viscosity of the sol becomes high through network formation and form gel.
OR OR OH OH
RO – M – OH + RO – M’ – OH --------- HO – M – O – M’ – OH + R – OH
OR OR OH OH
3.1.3 Synthesis of NBT-BT solid solution:
For NBT-BT solid solution preparation, NBT was prepared by SSR and BT was prepared by
Sol gel route to improve the reactivity between the precursors.
The solid solution was prepared by using solid state route. Phase pure NBT and BT were
weighed stoichiometrically and mixed together manually for 1 hour with acetone medium.
Mixed powders were dried at room temperature and calcined at 800 °C. This powder was
mixed with PVA binder, compacted by using hydraulic press with 2 tons load, and sintered at
1100 °C in a closed alumina crucible sealed with alumina paste in muffle furnace with heating
rate of 2 °C/min up to 300°C and soaked for 1 hour at that temperature for binder evaporation
and from 300 °C to 1100 °C heating rate as 5 °C/min. These sintered pellets were electroded
and poled for electrical characterization.
3.2 Characterization techniques:
3.2.1 Density measurement:
Density measurements generally follow the Archimedes principle. According to this principle
when a body immersed in a liquid loses weight by an amount equal to the weight of the liquid
displaced.
Density of object =Wa
𝑊𝑎−𝑊𝑤𝑋𝜌 ……………………………………………………(3.3)
Wa= weight of object in air, Ww=weight water, ρ = density of water

24
3.2.2 X ray diffraction:
X ray diffraction is an eminent technique for structural characterization of crystalline
materials. Each crystalline substance has its own XRD pattern which can be identified by
using standard files (JCPDS). From this we can get the information of crystal structure,
particles size, phase purity, and lattice parameters etc. The key principle of x ray diffraction
is Bragg’s Law.
This law is demonstrated by using two parallel planes in the crystal. The X rays incident on
the set of parallel planes ABC and ABC’ with an incident angle θ and scattered with same
angle. If these scattered rays form two parallel planes are in phase, then they gives the peak
with high intensities where as those reflected rays are out of phase will not give any intensities.
The below figure shows the phenomenon of X ray diffraction [26].
nλ = 2dsinθ……………………………………(3.4)
Here, λ = wavelength of the X ray, d = interplaner spacing, n= order of reflection and θ=angle
of incidence.
Fig 3.7: Schematic of Bragg’s law
PAN Alytical expert pro X ray diffractometer with copper Kα (λ=1.54 Å) radiation was
used to investigate phase and crystal structure of the sintered ceramics.

25
3.2.3 Raman Spectroscopy:
Raman Spectroscopy is a vibrational spectroscopy which relies on inelastic scattering of light
from the substance. When the light source interacts with a molecule, it polarizes the electron
cloud. Then the molecule prompted to the virtual energy state where it has short life and
comes back to higher or lower vibrational energy state by emitting phonons. In this process
energy transfer can be done between photon and system. If the scattered photon has more
energy than incident photon then it is called as Antistokes scattering. It has high energy and
short wavelength. If the scattered photon has less energy than incident photon then it is called
as stokes scattering. It has low energy and long wavelength [20]. The below figure explains
the Raman scattering phenomena.
Fig 3.8: Raman scattering phenomenon [27]
Laser Micro Raman spectrometer (Bruker, Senterra) in a back–scattering geometry with an
excitation source of 532 nm is used to obtain the Raman spectrum.
3.2.4 Scanning electron microscope:
Morphological studies were done by scanning electron microscope. It uses a focused high
energy electron beam incidents on the specimen surface and generates a variety of signals
because of electron-specimen interaction. Depending upon the required information these
signals can be analyzed. Secondary electrons and back-scattered electrons are used for
imaging and characteristic X-rays are used for elemental analysis [28].
All the samples were coated with gold by using sputter coater to make them conductive. Carl
Zeiss Super 40 SEM was used for morphology and composition analysis studies.
26
Electrical measurements:
In this section phase transition studies, piezoelectric resonance, PE loop and piezoelectric
coefficient characterizations were done.
3.2.5 Phase transition studies:
Every ferroelectric material will exhibits a phase transition from ferroelectric state to
paraelectric state at certain temperature. Because of change in the dipolar displacement with
temperature, so there will be change in the polarization and capacitance and related properties.
This temperature where the material behaviour changes from ferroelectric to paraelectric state
is called Curie temperature or phase transition temperature [6]. These studies were conducted
by using precision impedance analyzer (Agilent 42941A). This system works based on the
principle of Auto balancing bridge method which has frequency operational range of 40Hz
to 110 MHz with high accuracy.
Electroded samples of NBT, NBZT5, NBZT10, NBT6BT and NBT8BT were used to measure
the capacitance.
3.2.6 Piezoelectric resonance:
Every ferroelectric material is piezoelectric material. So they will exhibit piezoelectric
resonance. When the applied frequency matches with the fluctuation frequencies of the ions,
molecules, grains and grain boundaries in the material then they will vibrate with high
amplitude [2].
These studies were done by using Precision impedance analyzer (Agilent 16034E).
3.2.7 Piezoelectric coefficient (d33):
Piezoelectric coefficient was measured by using piezo test meter (PM 300). This instrument
works based on the principle of piezoelectricity i.e. by applying mechanical stress to the
system it’ll generate electrical signals. In this system, mechanical stress is applied to the
material by clamping it between the electrodes at required frequency. Then the material
responds to the stress and generates electrical signals which will be compared with built in
reference sample and directly displays the d33 value. Poled samples were used to measure the
d33 value [9].

27
Chapter 4
Results and discussion of Zr substituted
NBT
This chapter summarizes the results and discusses the outcome of NBT and NBZT
ceramics with varying compositions.
4.1 XRD:
Fig. 4.1 shows the X-ray diffraction patterns of NBT, NBZT5 and NBZT10 ceramics prepared
by solid state route sintered at 1100 °C for 4 hours. These XRD patterns confirm the formation
of perovskites with rhombohedral (R3c) crystal structure at room temperature [9]. NBT and
NBZT5 compounds were formed as single phase and NBZT10 has a small amount of
impurity. This impurity peak was attributed with the ZrO2.
Fig 4.1 XRD pattern of sintered NBT, NBZT5 and NBZT10
As the Zr content increases, the diffraction peaks were shifted towards lower Bragg angles
which infer the expansion of unit cell. These changes are due to the substitution of higher
ionic radii Zr4+ ion (0.72 Å) in Ti4+ site (0.605 Å) and confirm that Zr is substituted in Ti
site. This shift in (1 1 0) peak is shown in Fig. 4.2.

28
Fig 4.2: Magnified powder diffraction pattern indicating the shift in (1 1 0) peak
To extract the further structural information the diffraction peaks were analyzed by reitveld
refinement method using Fullprof suite package. All room temperature data was modelled by
using R3c space group. The χ2 values show the goodness of fit and these refinement values
are tabulated in table 4.1. NBZT 10 has impurity phase which corresponds to the decrease in
the goodness of fit. The unit cell volume and lattice parameters are tabulated in Table 4.1,
confirms the unit cell expansion and substitution of Zr4+ ion in Ti4+ lattice site.
Fig 4.3: Rietveld refined XRD patterns

29
Table 4.1: Lattice parameters, unit cell volumes and fitting parameters from refinement
Material a (Å) c (Å) Volume(Å)3 χ2
NBT 5.48544 13.49896 351.768 3.2
NBZT5 5.50346 13.50489 354.236 2.9
NBZT10 5.51337 13.53578 356.327 4.3
The peak around 38° corresponds to superlattice reflection of NBT compound which indicates
the antiphase rotation a-a-a- of the TiO6 octahedra (characteristic tilting feature of R3c),
confirms the space group as R3c rather than R3m. The weak intensity of this peak suggests
the distortion from ideal cubic lattice is small and it decreases on increasing Zr content. The
substitution of Zr does not introduce any additional structural phase transitions.
This data is further supported by Raman spectroscopy.
4.2 Raman spectroscopy:
To support the structural information from the XRD and to study the vibrational modes of the
material, Raman spectroscopy was done to the pellets of pure NBT, NBZT5 and NBZT10.
Fig 4.4 shows the Raman spectrum of NBT, NBZT5 and NBZT10 samples. The Raman
spectrum of NBT is similar to the reported spectrum. There are 13 Raman active modes for
Rhombohedral (R3c) phase and these modes were overlapped and appears as 6 Raman modes
in the spectrum at 135 cm-1, 276 cm-1, 528 cm-1, 580 cm-1, 752 cm-1 and 846 cm-1 [11].
The mode at 135 cm-1 is attributed to Na-O vibration. If we consider the mass of A-site ion in
NBT, Bi is having higher mass than Na, so the mode corresponds to Bi-O vibration will be at
lower frequencies and this can’t be captured by the instrument. The mode at 276 cm-1
corresponds to Ti-O vibration and it is sensitive to the local polar order, structural phase
transitions [11]. Modes at 528 and 580 cm-1 involves the polyhedral oxygen vibrations of TiO6
octahedral stretching. This region is well known in perovskites oxides. Modes above 700 cm-
1 (752 cm-1, 846 cm-1) are related to the presence of oxygen vacancies while their intensity
yields the vacancy concentration. This region is linked to the overlapping of A1 (LO) and E
(LO) [11].

30
We observed mainly two changes in the Zr substituted NBT from NBT.
1. Shift towards lower frequency by increasing Zr concentration, because of these higher
ionic radii Zr4+ in Ti4+ site.
2. All the peaks were broadened and intensity decreased due to the substitution of Zr in
Ti place leads to a local disorder without changing the symmetry. This was confirmed
by XRD measurements that there is no change in the global symmetry but some local
disorder is introduced by Zr substitution.
Fig 4.4: Raman spectrum of NBT and Zr substituted NBT
4.3 Scanning Electron microscope:
Fig. 4.5 shows the scanning electron microscope images of NBT, NBZT5 and NBZT10
sintered at 1100 °C for 4 hrs. These SEM micrographs shows the polycrystalline nature of the
samples with a rectangular grains of different sizes randomly distributed on sample surface.
Grains are well defined and sintering process (necking) is clearly visible. By Zr substitution
the grains size significantly increases from 1 µm to 2 µm. The grain shape was also observed
to change to rectangular shape by increasing Zr concentration. In NBZT5, NBZT10
micrograph, plate like structures was observed. The compositional analysis (EDX) revealed
that those are Bismuth and sodium rich places. Fig 4.6 shows the EDX results of NBT, NBZT5
and NBZT10. In NBZT10 micrograph very small grains agglomerated with big grains were
observed and those are explained as Zr rich regions .The contrast small dots on the grains of
NBZT10 shows the presence of secondary phase. Over all sample morphology is densely
packed and the relative density of the samples are around 90%. But few scattered pores are
observed which indicates that there is certain degree if porosity in the samples.
Experimental Calculated
Difference Bragg position
R3c, χ2=2.9
R3c, χ2=4.3

31
In NBT, ring structures were observed which are evident to antiferroelectric phase transition.
These structural domains are called as 180° domains. In NBZT5 and NBZT10 also we
observed these structures which are confirming that there is no suppression in the antiferro
electric phase transition at around 200 °C by the substitution of Zirconium.
Fig 4.5: SEM micrographs of (a) NBT (b) NBZT5 (c) NBZT10
(a)
32
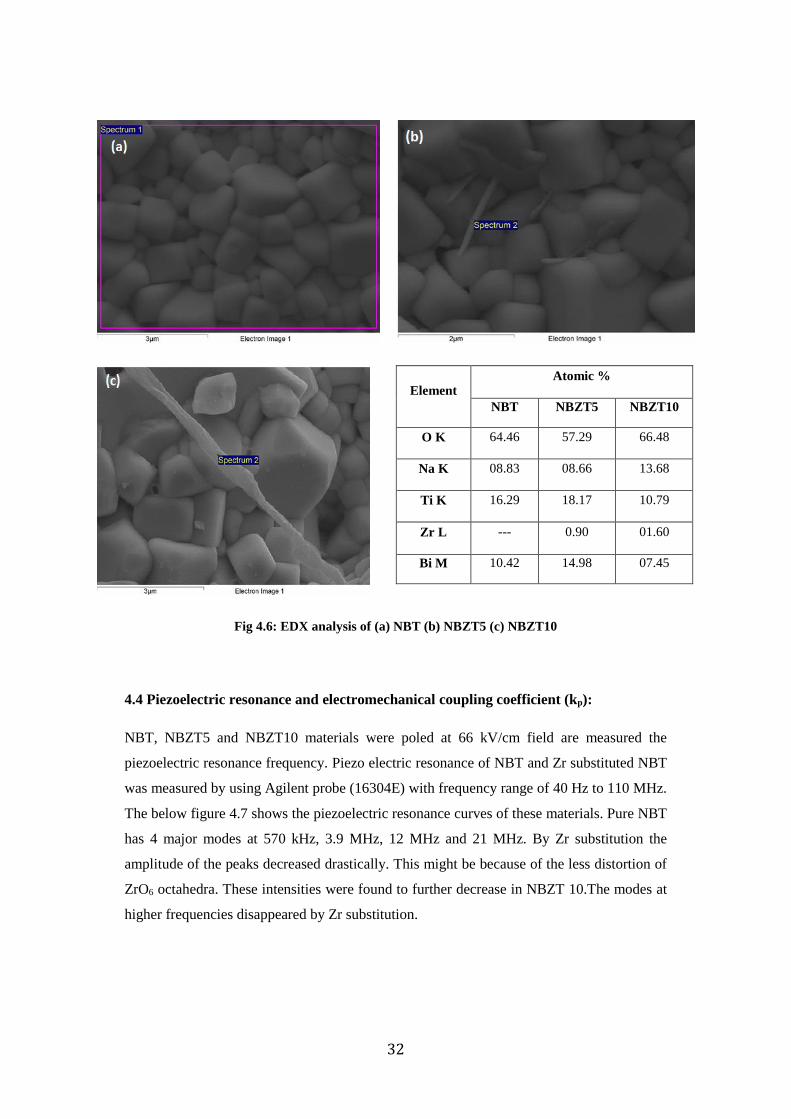
Element Atomic %
NBT NBZT5 NBZT10
O K 64.46 57.29 66.48
Na K 08.83 08.66 13.68
Ti K 16.29 18.17 10.79
Zr L --- 0.90 01.60
Bi M 10.42 14.98 07.45
Fig 4.6: EDX analysis of (a) NBT (b) NBZT5 (c) NBZT10
4.4 Piezoelectric resonance and electromechanical coupling coefficient (kp):
NBT, NBZT5 and NBZT10 materials were poled at 66 kV/cm field are measured the
piezoelectric resonance frequency. Piezo electric resonance of NBT and Zr substituted NBT
was measured by using Agilent probe (16304E) with frequency range of 40 Hz to 110 MHz.
The below figure 4.7 shows the piezoelectric resonance curves of these materials. Pure NBT
has 4 major modes at 570 kHz, 3.9 MHz, 12 MHz and 21 MHz. By Zr substitution the
amplitude of the peaks decreased drastically. This might be because of the less distortion of
ZrO6 octahedra. These intensities were found to further decrease in NBZT 10.The modes at
higher frequencies disappeared by Zr substitution.

33
Fig 4.7: Piezoelectric resonance plots of (a) NBT (b) NBZT5 (c) NBZT10
Electromechanical coupling constant (kp) is calculated by using resonance and anti –
resonance method. These are calculated by using above piezo resonance graphs by using the
formula.
…………………………………………………..(4.1)
Here fa = anti-resonance frequency, fr = resonance frequency
The coupling coefficient decreased in NZBT5 compared to NBT as expected in piezo
resonance measurement. But in NBZT10 Kp increased compared to NBZT5.
34
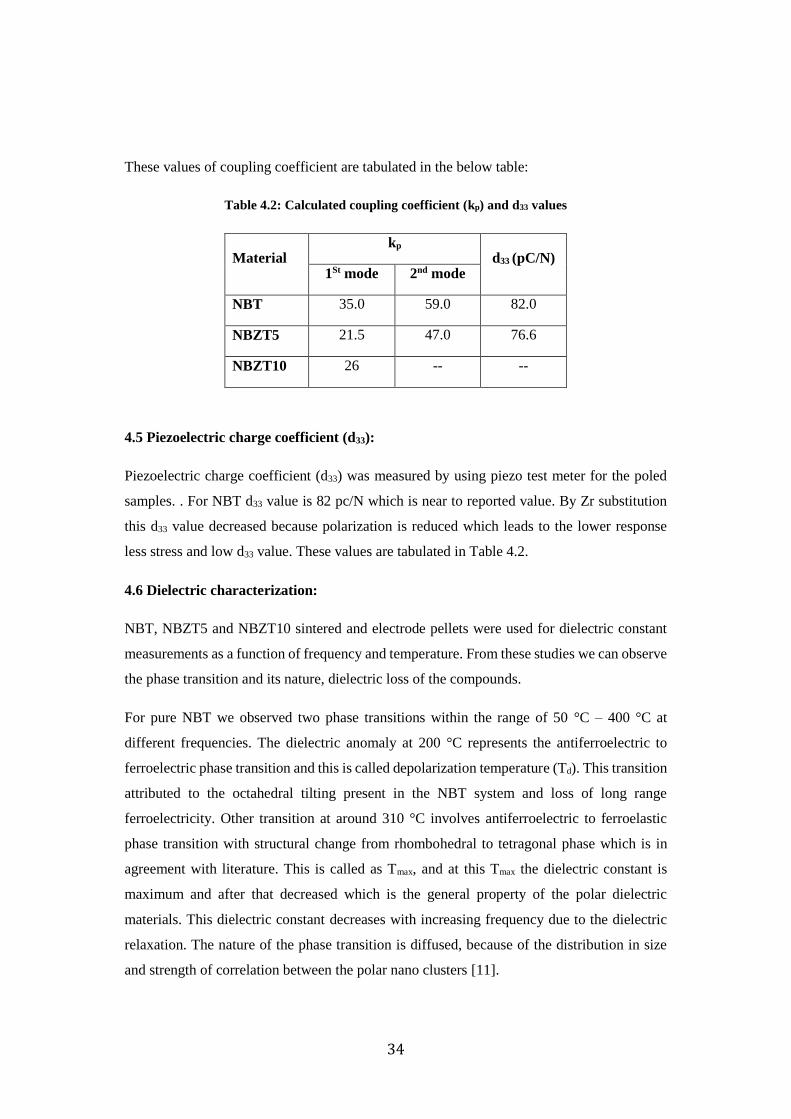
These values of coupling coefficient are tabulated in the below table:
Table 4.2: Calculated coupling coefficient (kp) and d33 values
Material kp
d33 (pC/N) 1St mode 2nd mode
NBT 35.0 59.0 82.0
NBZT5 21.5 47.0 76.6
NBZT10 26 -- --
4.5 Piezoelectric charge coefficient (d33):
Piezoelectric charge coefficient (d33) was measured by using piezo test meter for the poled
samples. . For NBT d33 value is 82 pc/N which is near to reported value. By Zr substitution
this d33 value decreased because polarization is reduced which leads to the lower response
less stress and low d33 value. These values are tabulated in Table 4.2.
4.6 Dielectric characterization:
NBT, NBZT5 and NBZT10 sintered and electrode pellets were used for dielectric constant
measurements as a function of frequency and temperature. From these studies we can observe
the phase transition and its nature, dielectric loss of the compounds.
For pure NBT we observed two phase transitions within the range of 50 °C – 400 °C at
different frequencies. The dielectric anomaly at 200 °C represents the antiferroelectric to
ferroelectric phase transition and this is called depolarization temperature (Td). This transition
attributed to the octahedral tilting present in the NBT system and loss of long range
ferroelectricity. Other transition at around 310 °C involves antiferroelectric to ferroelastic
phase transition with structural change from rhombohedral to tetragonal phase which is in
agreement with literature. This is called as Tmax, and at this Tmax the dielectric constant is
maximum and after that decreased which is the general property of the polar dielectric
materials. This dielectric constant decreases with increasing frequency due to the dielectric
relaxation. The nature of the phase transition is diffused, because of the distribution in size
and strength of correlation between the polar nano clusters [11].

35
Fig 4.8: (a) Dielectric constant vs Temperature, Inset figure: Modified curie Weiss law plot
(b) Dielectric loss vs Temperature at frequencies
This diffusivity of phase transition can be calculated by using modified Currie Weiss law. For
NBT this diffusivity γ=1.92 at 100 kHz. The dielectric constant of NBT at 100 kHz is 2437.
This graph is shown in inset of Fig 4.8 (a).
The dielectric loss will also follows the same nature of dielectric constant, shown in fig 4.8(b)
the loss is very high at low frequencies and after that it followed the property like with
increasing frequency loss is increasing because of the insufficient relaxation time of the
dipoles.
(a)
(b)

36
NBT with Zirconium Substitution:
By substituting with Zr the dielectric constant decreased drastically to 1818 (at 100 kHz) due
to the decrease in the polarization with Zr substitution. The Tmax is increased slightly to 325
°C. Initially we observed the frequency dispersion in Tmax due to the change in the strength of
interaction between polar nano regions. Because by Zr4+ substitution, ZrO6 octahedral
distortion is less compared to TiO6 octahedral. So there are the regions with different strength
of polarization apart from the regions of A - site cationic disorder. This effect is resulted as
frequency dispersion in Tmax and this can be proved by using Vogel fulchur law which is
shown in Fig 4.9. The below figure shows the dielectric constant vs temperature plots of
NBZT5 and NBZT10.
NBZT5 NBZT10
Fig 4.9: Dielectric constant Vs temperature
Fig 4.10: Vogel fulchur law for NBZT10
37
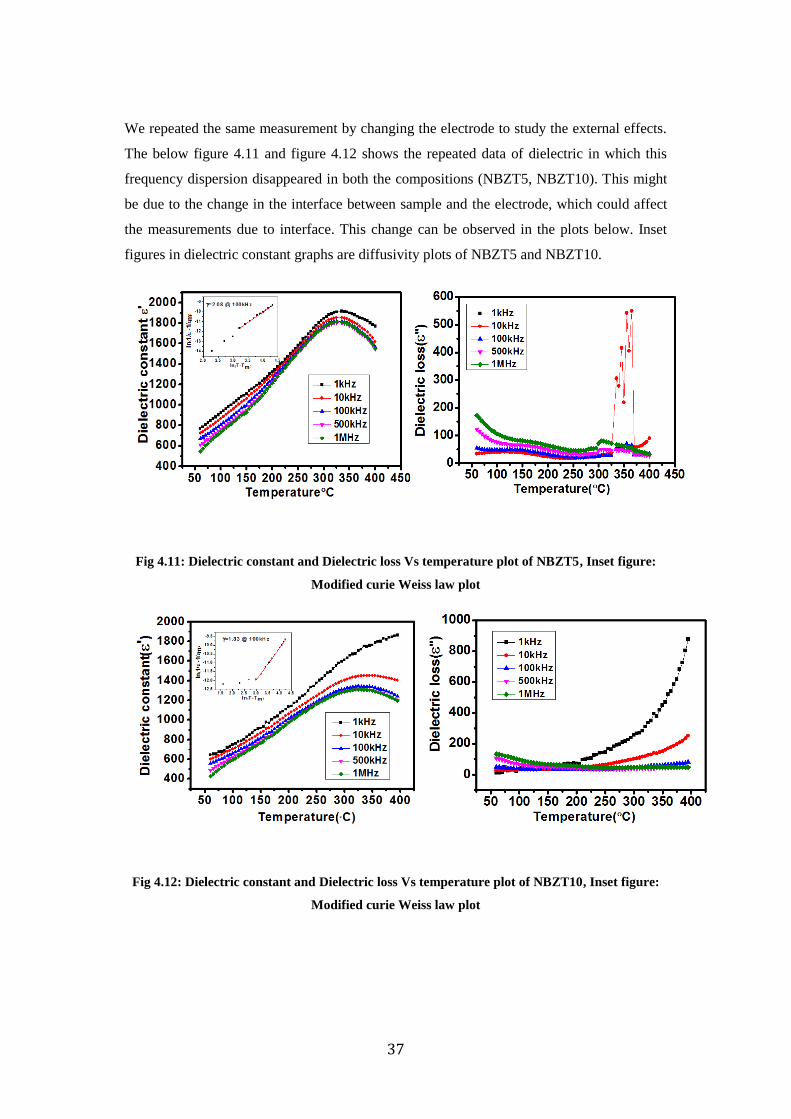
We repeated the same measurement by changing the electrode to study the external effects.
The below figure 4.11 and figure 4.12 shows the repeated data of dielectric in which this
frequency dispersion disappeared in both the compositions (NBZT5, NBZT10). This might
be due to the change in the interface between sample and the electrode, which could affect
the measurements due to interface. This change can be observed in the plots below. Inset
figures in dielectric constant graphs are diffusivity plots of NBZT5 and NBZT10.
Fig 4.11: Dielectric constant and Dielectric loss Vs temperature plot of NBZT5, Inset figure:
Modified curie Weiss law plot
Fig 4.12: Dielectric constant and Dielectric loss Vs temperature plot of NBZT10, Inset figure:
Modified curie Weiss law plot

38
So there is a frequency dispersion introduced by Zr substitution in NBT in the first
measurement and it was not repeated in other measurements. Dielectric constant is decreased
with increasing Zr concentration. The depolarization peak at 200 0C temperature was observed
as decreasing with Zr substitution which is the evidence of presence of AFE transition and
this is supported by SEM results with the 180° domains presented in the NBZT5 and NBZT10.
The dielectric loss also followed the same nature of dielectric constant except at low
frequency (1 kHz) and this loss increased by increasing frequency, compared to NBT loss is
decreased in the Zr substituted NBT. The behaviour of phase transition is broad in all
compositions and there is no considerable change in the diffusivity, these values are for
NBZT5 γ = 2.02 at 100 kHz and for NBZT10 γ =1.83 at 100 kHz.
39
Chapter 5
Results and discussion of NBT-BT solid
solution
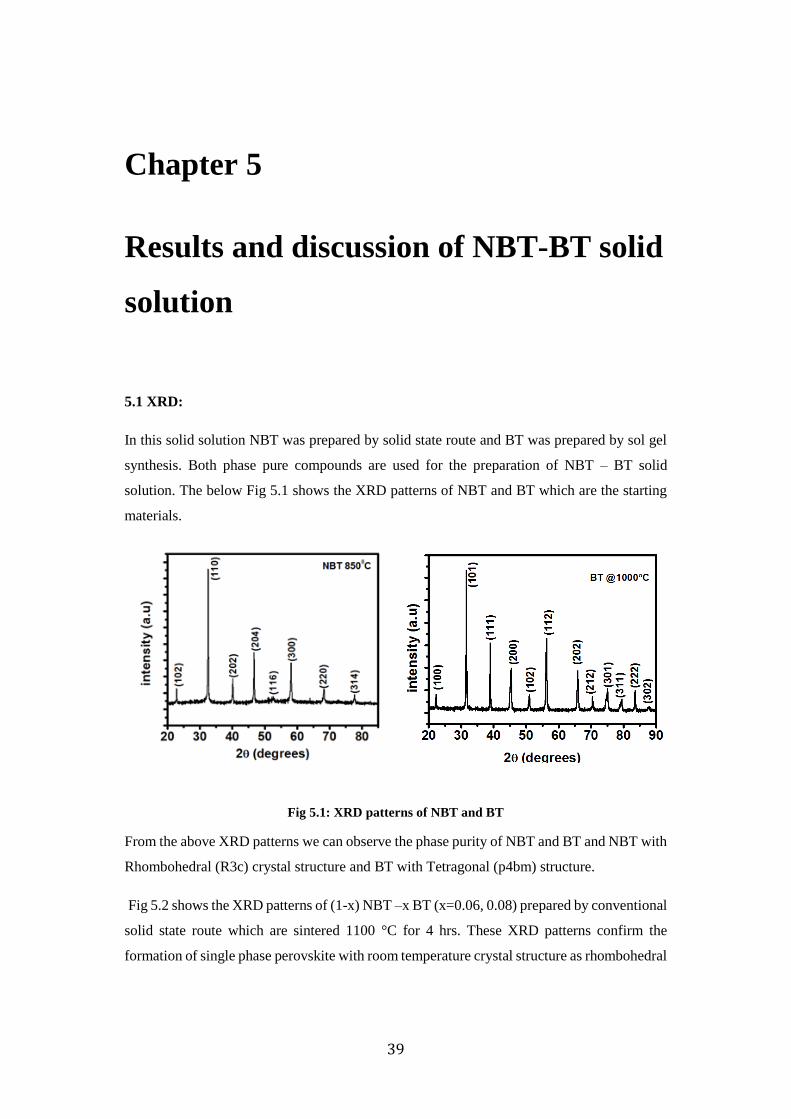
5.1 XRD:
In this solid solution NBT was prepared by solid state route and BT was prepared by sol gel
synthesis. Both phase pure compounds are used for the preparation of NBT – BT solid
solution. The below Fig 5.1 shows the XRD patterns of NBT and BT which are the starting
materials.
Fig 5.1: XRD patterns of NBT and BT
From the above XRD patterns we can observe the phase purity of NBT and BT and NBT with
Rhombohedral (R3c) crystal structure and BT with Tetragonal (p4bm) structure.
Fig 5.2 shows the XRD patterns of (1-x) NBT –x BT (x=0.06, 0.08) prepared by conventional
solid state route which are sintered 1100 °C for 4 hrs. These XRD patterns confirm the
formation of single phase perovskite with room temperature crystal structure as rhombohedral

40
(R3C). The narrow and symmetric XRD patterns of NBT-BT compounds indicated the
homogeneity and good crystallization.
Fig 5.2: XRD patterns of NBT-BT solid solution and Shift in (110) peak
With increasing x value (Ba concentration) peaks shift slightly towards lower Bragg angles
which means that lattice parameters and unit cell volume also increases. This is attributed that
Ba2+ is diffused into the NBT lattice sites. This is because of the substitution of higher ionic
radii Ba2+ (1.36 Å) in the lower ionic radii Na+1 (1.02 Å) or Bi3+ (1.03 Å), due to this inter
planner spacing will increase as a result peaks shifts towards lower angles. The peak
intensities increased with Ba2+ substitution [19].
The characteristic feature of NBT i.e. super lattice peak became invisible with Ba2+
substitution. These super lattice peaks are due to the octahedral tilting with respect to adjacent
octahedrons (oxygen). Due to the lower scattering power of X rays and the magnitude of the
tilt is small, sometimes it is difficult to observe these peaks. According to literature there is a
MPB between Rhombohedral (NBT) and Tetragonal (BT) at BT concentration as (x=0.06 –
0.07). These structural changes can be observed by the splitting in the characteristic peaks.
But in our data we did not observed any structural changes in both the compositions
(0.94NBT-0.06 BT) and (0.94NBT-0.08 BT) [19].
5.2 Scanning Electron Microscope:
The SEM micrographs indicate the polycrystalline nature of the compounds with distorted
rectangular shapes. The overall microstructure is looking dense and the density of these
samples is at around 96 %. The sintering mechanism i.e. necking can be observed with well-

41
defined grain boundaries. The below Fig. 5.3 shows the scanning electron microscope images
of NBT6BT and NBT8BT.
Fig 5.3: SEM micrographs of (a) NBT6BT (b) NBT8BT
The grain size varied from 100 nm to 1µm because the starting materials NBT was
synthesized by solid state route which gives the grain size as in µm range and BT was
synthesized by sol gel with nm grains, because of this there is a huge change in the grain sizes.
The compositional analysis was done at different places in 0.94 NBT-0.06BT and 0.94 NBT-
0.06BT showed the elements are in the normal expected range.
5.3 Resonance – antiresonance studies and electromechanical coupling coefficient (kp):
These materials are poled at 60 kV/cm field and used for piezoelectric resonance
measurements. These measurements were done by using Agilent probe (16304E) with
frequency range of 40 Hz to 110 MHz. The below Fig.5.4 shows the piezoelectric resonance
frequencies NBT6BT and NBT8BT. In NBT6BT has four major modes at 540 kHz,
1.4MHz,2.2 MHz and 3.4 MHz and in NBT8BT total five modes were observed at 80 kHz ,
470 kHz , 750 kHz , 1 MHz and 2,1 MHz which is attributed to the near to MPB region.
(a)
(b)

42
Fig 5.4: Piezoelectric resonance frequency plots of NBT6BT and NBT8BT
Electro mechanical coupling coefficient was calculated by using resonant and antiresonant
method. These values are tabulated in table 5.1. The coupling coefficient is of NBT8BT is
high compared to NBT6BT which is again indicating that NBT8BT is near to MPB regions
compared to NBT6BT.
Table 5.1: Piezoelectric resonance frequency and kp values
Mode NBT6BT NBT8BT
fr kp fr kp
1st 540.0 kHz 26.0 180.0 kHz 22.2
2nd 1.4 MHz 22.2 470.0 kHz 35.7
3rd 2.2 MHz 31.3 750.0 kHz 30.0
4th 3.4 MHz 50.0 1.0 MHz 34.0
5th -- -- 2.1 MHz 35.7
5.4 Dielectric Studies:
The below figure shows the variation of dielectric constant and loss with temperature at
different frequencies. The dielectric response of NBT6BT and NBT8BT exhibits the diffuse
phase transition like NBT, and here also we observed to anomalies as Td and Tm, where Td
corresponds to the transition from ferroelectric to antiferroelectric state.

43
Fig 5.5 (a): Dielectric constant plot of NBT6BT, (b): Dielectric loss plot of NBT6BT
Fig 5.6: Dielectric property of NBT8BT
Fig 5.6 (b): Dielectric loss plot of NBT8BT
At Tm there is a structural phase transition along with ferroelectric transition which is broad.
In NBT-BT the values of Td and Tm are low compared to NBT. The improvement of
piezoelectric properties depends upon the sufficient reorientation of 90° domains. Lower Td
means lower stabilities, which favors the easy reorientation of 90° domains and results high
piezoelectric properties. So in NBT-BT because of the decrease in Td from 200 °C to 120 °C
in NBT8BT provide the better piezoelectric properties than NBT6BT. The diffusiveness of
this relaxer ferroelectrics are calculated by modified Curie –Weiss law where there is a slight
increase in the diffusivities. These values are tabulated in table 5.2. The inset figures in
dielectric constant vs. temp plots show the modified Curie Weiss law plots.
The dielectric constants values are also increased drastically. These values are tabulated in
below table.

44
Table 5.2: Transition temperatures, dielectric loss and diffusivity values
Material Td (°C) Tm Dielectric constant
at 100 kHz γ Loss at 10 kHz
NBT 200 310 2437 1.90 800
NBT6BT 120 275 3881 2.07 120
NBT8BT 100 280 3044 2.20 150
The decrease in Td and Tm, dielectric loss and increase in the dielectric constant are attributed
that NBT-BT solid solution is better for device applications compared to NBT.

45
Chapter 6
Testing of NBT as a vibration sensor
6.1 Introduction:
Vibration sensor comes under accelerometer. Accelerometers are the most common dynamics
sensors capable of a vast range of sensing. These are used to measure the mechanical variables
i.e. acceleration, vibration and mechanical shock. There are several types of accelerometer
based on the working principle i.e. piezoelectric, piezoresistive and piezocapacitive
accelerometers [29]. In these piezoelectric accelerometer is the most common. It works based
on piezoelectric effect. In this accelerometer a mass is attached to a piezoelectric which is
mounted on base materials. The stress is generated on the crystal as result of the mass
imposing a force on the crystal [32]. Due to this charge is accumulated on the crystal (piezo
electric effect). Electrodes will collect this charge and transmit it to a signal conditioner; there
it will be amplified into either voltage or current. This piezo electric accelerometer obeys
Newton’s second low (F=ma) as charge generated is proportional to the applied force. The
below figure shows the one variety of configuration [31].
Fig 6.1: Compression model of piezoelectric accelerometer [31]
This performance of piezoelectric accelerometers is affected by resonance frequency, mass
interface and other external factors. For sensor applications resonance frequency of a

46
piezoelectric material is an important factor, because the maximum usage limit of the sensor
will be decided by this factor [5]. Below or above the resonance frequency we can use the
sensor and at resonance frequency loss will be very high so we can’t use the sensor at that
frequency [29].
6.2 Testing the vibration sensor:
The NBT pellet which was synthesized by solid state route is used for this sensor preparation.
This pellet was poled at 45 kV/cm. After mounting the sample on a base material, checked
the resonance frequency by using 50 g and 100 g masses. There is no change in resonance
frequency by increasing weight. The below figure shows the Piezoelectric resonance plots of
NBT.
Fig 6.2: Piezoelectric resonance plots of NBT with 50 g and 100 g mass
After this we attached copper wires to the sample and metal base and those wires are
connected to the BNC. This BNC is connected to the DSO (Digital storage oscilloscope).
Now if we subject the NBT sample to vibrations, we can observe the change in the
amplitude from the DSO.

47
Fig 6.3: Experimental setup for testing the vibration sensor
The below figures shows the response of NBT to different vibrations.
Fig 6.4: Response of NBT (a) Without applying force (b) With applying force
-0.02 0.00 0.02 0.04 0.06
-8
-4
0
4
8
vo
lta
ge
(V
)
Time (mS)
Fig 6.5: Response of NBT to applied force
(a) (b)

48
The Fig. 6.4 (a) shows the response without applying any mass. After applying small force
by tapping it, we observed the response from the material, and that was captured as Fig. 6.4
(b). Fig. 6.5 shows the response of the NBT to this force applied. Even though the response
is less compared to PZT, NBT has the potential to be fabricated as a Sensor in lead free
piezoelectric materials.

49
Chapter 7
Summary and Conclusions
7.1 Summary:
In this project work an attempt has been made to understand the relaxor features of NBT, Zr
substituted NBT and NBT BT solid solution physical properties. These compositions were
prepared by solid state route and analyzed the structural, morphological and physical
properties with XRD, Raman spectroscopy, SEM, piezoelectric resonance and piezoelectric
coefficient. At last NBT samples were tested for vibration sensor application.
7.2 Conclusions:
NBT with Zr substitution:
Phase pure NBT and NBZT5 were synthesized by solid state route where NBZT10 had some
small impurity which is expected with higher Zr substitution.
1. Structural confirmations were done by XRD where there is no structural change in NBT by
Zr substitution which was supported by Raman spectroscopy.
2. SEM analysis revealed the bismuth and sodium rich places with a platelet kind of structures
in NBZT5 and NBZT10. Over all stoichiometry is as expected in NBT, NBZT5 and NBZt10
other that those plate like regions. The sample densities are also around 90% and there is
increase in the grain size with Zr substitution.
3. Dielectric measurements revealed the decrease in the dielectric constant with increasing Zr
concentration in NBT and there is no suppression in the AFE peak in Zr substituted NBT.
4. Piezoelectric resonance frequency measurements, piezoelectric coefficients (d33) and
electromechanically coupling coefficients (kp) were decreased in NBZT (5, 10) compounds.

50
NBT–BT:
NBT – BT solid solution was prepared with two different compositions as NBT 6 BT (0.06
at % BT) and NBT8BT (0.08 at % BT). XRD revealed the phase purity of the compounds and
indicated that there is no structural phase transition.
1. Scanning electron microscope images revealed that decrease in the grain size with increase
in the BT concentration due to the less particle size of BT because it was synthesized by sol
gel route. Overall composition followed proper stoichiometry.
2. Dielectric properties are changed in NBT – BT solid solution as Td and Tm were decreased
which is attributed to the increase in the piezo electric properties.
Vibration sensor study:
Vibration sensing capabilities of NBT were tested by using different vibrations. Results of the
test proved the potential of NBT for vibration sensor applications.
Future work:
1. Synthesis of NBT-BT solid solution at MPB composition
2. Preparation of standard vibration sensor device with proper circuit.
3. Testing the vibration sensing abilities of NBT – BT compound.
51
References
1. Deborah D.L. Chung. Functional materials. World Scientific publishing Co. Pte. Ltd,
2010
2. Kawan Chi Kao. Dielectric phenomenon in solids. Elsevier Academic Press, 2004.
3. Matthew Delgado. Phase Transitions in Relaxor Ferroelectrics. (2005).
4. George A samara. The relaxational properties of compositionally disordered ABO3
perovskites. Journal of Physics: Condensed Matter 15, (2003) R367-R411.
5. Water Heywang, Karl Lubitz and Wolfram Wersing. Piezoelectricity. Springer, 2008.
6. Charles Kittel. Introduction to Solid State Physics. 8th edition. John Wiley & Sons,
Inc, 2005.
7. Abid A. shah. A FEM-BEM interactive coupling for modeling the piezoelectric
health monitoring systems. Latin American Journal of solids and structures. 8,
(2011) 305-334.
8. Uchino, Kenji. Advanced piezoelectric materials, Science and Technology.
Woodhead publishing, Inc, 2010.
9. B K Barick, K K Mishra, A K Arora, R N P Choudhary and Dillip K Pradhan.
Impedance and Raman spectroscopic studies of (Na0. 5Bi0. 5) TiO3. Journal of Physics
D: Applied Physics. 44, (2011) 355402.
10. M. Venkata Ramana, S. Roopas Kiran, N. Ramamanohar Reddy, K. V. Siva Kumar,
V. R. K. Murthy, B. S. Murthy. Synthesis of lead free sodium bismuth titanate (NBT)
ceramic by conventional and microwave sintering methods. Journal of Advanced
Dielectrics 01, (2011) 71-77.
11. Giuseppe Viola, Huanpo Ning, Xiaojong Wei, Marco Deluca and Arturas
Adomkevicius. Dielectric relaxation, lattice dynamics and polarization mechanisms
in NBT. Journal of Applied Physics. 114, (2013) 014107.
12. Manish K Niranjan, T. Karthik, Saket Asthana, Jaysree Pan and Umesh V.
Waghmare. Theoretical and experimental investigation of Raman modes,
ferroelectric and dielectric properties of relaxor Na0.5Bi0.5TiO3. Journal of Applied
Physics. 113, (2013) 194106.

52
13. Elena Aksel, Jennifer S. Forrester, Humberto M. Foronda, Robert Dittmer and Dragan
Damjanovic. Structure and properties of La-modified Na0.5Bi0.5TiO3 at ambient and
elevated temperatures. Journal of Applied Physics. 112, (2012) 054111.
14. Elena Aksel, Jennifer S. Forrester, Benjamin Kowalski, Marco Deluca, Dragan
Damjanovic, and Jacob L. Jones. Structure and properties of Fe-modified
Na0.5Bi0.5TiO3 at ambient and elevated temperature. Physical Review B. 85, (2012)
024121.
15. Yeon Soo Sung and Myong Ho Kim. Effects of b site donor and acceptor doping in
lead free Bi0.5Na0.5TiO3 ceramics, Ferroelectrics. Chapter 13, In Tech, 2010.
16. Elena Aksel, and Jacob L. Jones. Advances in Lead-Free Piezoelectric Materials for
Sensors and Actuators. Sensors 10, (2010) 1935-1954.
17. P.K. Panda. Environmental friendly lead free ceramics. Journal of Material Science.
44, (2009) 5049–5062.
18. Rohini Garg, Badari Narayana Rao, Anatoliy Senyshyn, P.S.R. Krishna and Rajeev
Ranjan. Lead free piezoelectric system (Na0.5Bi0.5)TiO3-BaTiO3: Equilibrium
structures and irreversible structural phase transformations driven by electric field
and mechanical impact. Physical Review B. 88, (2013) 014104.
19. Chenggang Xu, Dunmin Lin, and K.W. Wok. Structure, electrical properties and
depolarization temperature of (Bi0.5Na0.5)TiO3-BaTiO3 lead free piezoelectric
ceramics. Solid state sciences, 10, (2008) 934-940.
20. Anthony R. WEST, Solid state chemistry and Its Applications. 2nd edition. John
Wiley & Sons, Ltd, 2014.
21. G.S Upadhyaya. Powder Metallurgy Technology. Cambridge International Science
Publishing, 2002.
22. Katsuyoshi Kondoh. Powder Metallurgy. In Tecch, 2012.
23. Zhigang Zak Fang. Sintering of Advanced Materials. Woodhead Publishing Limited,
2010.
24. Ted A Asare. Fabrication and damping behaviour of particulate BaTiO3 ceramic
reinforced copper matrix Composites. M.Sc Thesis. Virginia Polytechnic Institute
and State University, Blacksburg, Virginia, 2004.
25. C. Jeffrey Brinker and George W. Scherer. Sol-Gel Science: The physics and
chemistry of sol-gel processing. Academic Press. Inc, 1990.
26. B.D.Cullity. Elements of X-Ray Diffraction. Addison- Wesley Publishing Company,
Inc, 1956.
53
27. J.D. Winefordner. Raman Spectroscopy for chemical analysis. John weily & Sons,
Inc., 2000
28. Ray F. Egerton. Physical Principles of Electron Microscopy. Springer, 2005.
29. http://sensorwiki.org/doku.php/sensors/accelerometer
30. how sensors work - accelerometer - vibration sensors.htm
31. http://www.pcb.com/TechSupport/Tech_Accel
32. http://www.sensorsmag.com/sensors/acceleration-vibration/the-principles-
piezoelectric-accelerometers-1022