studies on the antioxidant activity of milk proteins in
TRANSCRIPT

Copyright is owned by the Author of the thesis. Permission is given for a copy to be downloaded by an individual for the purpose of research and private study only. The thesis may not be reproduced elsewhere without the permission of the Author.

Studies on the antioxidant activity of milk proteins
in model oil-in-water emulsions
A thesis presented in partial fulfilment of the requirements
for the degree of
Doctor of Philosophy
in
Food Technology
by
Daniel Ries
Riddet Institute
Massey University, Palmerston North, New Zealand
2009


Abstract i
Abstract
The present study was aimed at extending our knowledge of the antioxidative properties
of the milk protein products, whey protein isolate (WPI) and sodium caseinate (NaCas),
in oil-in-water (O/W) emulsions rich in polyunsaturated fatty acids (PUFAs). In
particular, the objective was to contribute to our understanding of the compositional and
processing factors that influence the oxidative stability of protein-stabilised O/W
emulsions. Linoleic acid (approximately 60 %) was used as the lipid for the oil phase
(10.6 %). The emulsion samples were usually incubated at 50 ˚C to accelerate lipid
oxidation. Lipid oxidation indicators were lipid hydroperoxides and headspace hexanal,
determined by solid phase microextraction (SPME) combined with gas chromatography
(GC).
WPI- or NaCas-stabilised emulsions were prepared using a wide range of protein
concentrations (0.5, 1.0, 2.0, 3.0, 4.0, 7.0 or 10.0 %) at two droplet sizes (d32 = 0.31 and
0.65 µm). In general, higher lipid oxidation levels were found for the larger droplet size.
Increasing protein concentration led to a decrease in the lipid oxidation rate. The
greatest decrease in lipid hydroperoxide levels (values after 4 h) occurred at up to 4.0 %
protein concentration. The greatest decrease in hexanal levels (values after 24 h)
occurred at up to 4.0 % protein concentration in WPI emulsions (0.31 µm). The hexanal
levels were more independent of the protein concentration in the other emulsion types.
The hexanal level decreased at protein concentrations > 4.0 % in NaCas emulsions (0.31
and 0.65 µm) and at protein concentrations > 7.0 % in WPI emulsions (0.65 µm). The
difference between lipid hydroperoxide generation in emulsions with small and large
droplet sizes decreased with increasing protein concentration. This effect was more
pronounced in NaCas emulsions. In general, NaCas was a better inhibitor of lipid
oxidation than WPI, but WPI appeared to be the better antioxidant at some droplet
size/protein concentration combinations.
The protein in the continuous phase, i.e. the unadsorbed protein, played an important
role in lipid oxidation. In principal, the lipid hydroperoxide and hexanal levels showed
the same development over the continuous phase protein concentration as over the

Abstract ii
protein concentration in WPI and NaCas emulsions (d32 = 0.31 µm). A low NaCas level
in the continuous phase already led to a relatively low hexanal level, whereas a higher
WPI level was required. When NaCas solution was added to a WPI emulsion or WPI
solution was added to a NaCas emulsion, a synergistic antioxidative effect was
observed.
The high molecular weight fractions (molecular weight ≥ 12000−14000) of WPI and
NaCas contained pro-oxidative metal ions that contributed to lipid oxidation in the
emulsions. An enrichment of NaCas emulsions with the low molecular weight fraction
of NaCas (with a molecular weight ≤ 12000−14000) notably inhibited lipid oxidation.
An enrichment of WPI emulsions with the low molecular weight fraction of WPI (with
a molecular weight ≤ 12000−14000) also seemed to inhibit lipid oxidation, but the
effect was not significant. The protein solutions were enriched with these fractions
before emulsion preparation.
Pure WPI solution or mixed WPI/NaCas (1:1, weight/weight) solution with 1.12 or 2.24
% protein concentration was heated at 84 ˚C for up to 40 min, cooled and then used to
prepare emulsions. Lipid oxidation was generally not affected by the heat treatment or
the degree of whey protein denaturation. However, at the lower WPI concentration,
more hexanal was produced for the longer heating times (20, 30 and 40 min) and this
appeared to be connected with the physical instability of the emulsions. Greater
oxidative stability was found at the higher protein concentration and when the proteins
were mixed, pointing to a possible synergistic antioxidative effect of WPI and NaCas.
The addition of the free radical source 2,2’-azobis(2-amidinopropane) dihydrochloride
(AAPH) greatly increased the oxygen uptake and the generation of lipid hydroperoxides
in the emulsions. The oxidative stability increased with increasing protein concentration
(1.0, 4.0 and 7.0 %). NaCas had a greater antioxidative effect than WPI. The inhibition
of oxygen uptake appeared to be largely influenced by the free-radical-scavenging
activity of the system, determined by the protein type and the protein concentration, as
the radicals were produced linearly over time and oxygen was consumed linearly over
time. It can therefore be concluded that free-radical-scavenging activity represents a
major antioxidative mechanism of the milk proteins.

Abstract iii
Oxygen was consumed much faster in emulsions than in protein solutions when the
same level of AAPH was incorporated. In a WPI (1.0 % protein) emulsion, much lower
levels of protein hydroperoxides than of lipid hydroperoxides developed. This pointed
to a much greater reactivity of linoleic acid than of the milk proteins with oxygen. In
contrast, the exposure of WPI to oxidising linoleic acid in an emulsion (1.0 % protein)
or to AAPH in aqueous solution led to oxidative damage of the whey proteins, indicated
by the loss of amino acids. The loss of specific amino acids was different for proteins in
the continuous phase or cream phase of an emulsion or in WPI solution.
The present study confirms the antioxidative potential of WPI and NaCas and gives new
insights into their functionality as oxidative stabilisers in O/W emulsions.


Acknowledgements v
Acknowledgements
I am sincerely grateful to my chief supervisor, Professor Harjinder Singh, for his
guidance, encouragement and generous help throughout the entire project. I highly
appreciate his inputs and expertise. I especially thank him for preventing me from
following the wrong tracks during the practical work, and for his support and guidance
in the preparation of this thesis.
I am sincerely grateful to my co-supervisor, Dr Derek R Haisman. I would like to thank
him for believing in my suitability for this project and bringing me to the Riddet
Institute and Massey University. Also, I would like to thank him for his constant
guidance with expertise, his support and encouragement throughout the practical work
and during the preparation of the thesis.
I would like to thank Dr Aiqian Ye for his valuable inputs and expertise in questions
about oil-in-water emulsions and his help in preparing publication material based on the
findings of this project.
I wish to thank the Riddet Institute for the scholarship that enabled me to do this project.
I would like to thank Ms Leiza Turnbull, Ms Michelle Tamehana, Ms Fliss Jackson, Mr
Garry Radford, Mr Steve Glasgow, Dr Kelvin Goh, Dr Lara Matia-Merino and Mr
Warwick Johnson (Institute of Food, Nutrition and Human Health, Massey University),
Ms Fliss Stibbards, Dr Peter Zhu, Ms Janiene Gilliland, Ms Maggie Zhou, Mr Shane
Rutherfurd and Mr Chris Hall (Riddet Institute, Massey University) for their
cooperation, help or assistance in experimental work or their advice. Thank you to Mr
Matt Levin and Mr Peter Jeffery for their services in information technology (Institute
of Food, Nutrition and Human Health, Massey University).
Thank you to Professor Eric Ainscough for his advice and the demonstrations in ESR
spectroscopy, to Mr Grant Platt for his customised technical equipment used in one of
the experiments (both Institute of Fundamental Sciences, Massey University), to Mr

Acknowledgements vi
Rob Hunter for his assistance in gel electrophoresis (Fonterra Co-operative Group
Limited), to Dr Caryl Lockhart for her advice in statistical analyses (EpiCentre, Massey
University) and to Dr Yacine Hemar for his inspiring contribution to the project (The
MacDiarmid Institute for Advanced Materials and Nanotechnology).
A special thank-you I direct to my fellow post-graduates from the Seed Tech Hut and
colleagues, to my friends and flatmates and other people I shared time with in the past
years, for their company, their support, a word that cheered me up when it was tough,
their prayers, for extending my knowledge in life science ☺ or insights into another
culture of this world: Dr Noorzaid Muhamad, Dr Mary Eastham, Claire Hastings,
Kathleen and Rick Field, Tim Coogan, Alex Kordichev, Nandu Goswami, Aniket
Abhyankar, Dr Amelie Deglaire, Anwesha Sarkar, Catootjie Nalle, Dr Mischa Walton,
Oni Yuliarti, Dr Supat Chaiyakul, Dr Ahmed Mohammed Rida Amerah, Thanuja
Herath, Dr Janina Kühn, Prabhu Balan, Emmanuelle Riou, Hilary McKinnon, Visaka
Anantawat, Jiahong Su, Sylvia Chung, Carolina Saavedra, Natalie Keller, Xuemei
Tang, Cheryl Nkhasi, Dr Simon Loveday, Amit and Nimi Taneja, Dr Reza Mozafari, Dr
Inge Merts, Dr Ajay Awati, Bonny Zhan, Liwei (Daisy) Bai, Anne Göppert, Taka
Fihaki, Wiremu and Trieste Te Awe Awe, Ron Sanders, Daniel Chua, Francis Keete,
Reuben Wallis, Hone Davis, Dr Caryl Lockhart, Benjamin Trembarth, Steven Evans,
Birgit Schauer, Dr Simone Titus, Manfred Sutter, James and Alice Curtis, Ariunaa and
Amra Mendtsoo, Dr Clyton Moyo, Bernard Phiri, Carlos Hug de Belmont, Dione
Joseph, Dominic Tehan, Stephen Smith, Rachel Anderson, Emma Dodson, Penelope
Byrnes, Christina Rock, Agatha Chiu, Aberry, James Valtorta, Lucy Ellis, Lynda
Bottrill, Sonya House, Trudy Leslie, Albertha Lavi, Jane Dravitski, Averil Wills, Alex
Ogidi, Deogratius Mohanga, Fuminori Watanabe, Kunsik Park, Kieran Udy, Ellen
Schoner, Fr Marcus Francis, Fr Brian Walsh, Jonny Boon and Mary-Grace Williams,
Professor Janina Mazierska, David Mullin, Kui and Helen Chen, Giovanna, Tatiana
Shirokova, Sonja Koch, Karin Kohler, Stefanie Bachmann, Dominik Durner, Monique
Laurie, Philipp Schenkel, Morgane Blanc, Florence, Christoph Rau, Michaela Eckstein,
Kaustubh Savant, Andre Bruns, Helga Kocurek, Jozsef-Sebastian and Katrin Pap, Paul
and Dianne Stock, Matthias and Victoria Herzog, Joanne Oliver, Lucia Kwa and all
members of the Magnificat Community, Cross Creek, and Freedom Church, Te
Rangimarie Marae, Rangiotu.

Acknowledgements vii
I would like to thank my family, especially my Mum, my Dad and my brothers, who
were far away but still there for me when I needed them.
Finally, I want to thank God for holding me in his hands, although he does not always
give me a hand. I am grateful to come to the end of this PhD journey.


Table of contents ix
Table of contents
Abstract i
Acknowledgements v
Table of contents ix
Chapter 1: Introduction 1
Chapter 2: Literature review 5
2.1 Lipids 5
2.1.1 Fatty acids in food material 5
2.1.2 Fatty acids and human health 6
2.2 Oxidation of unsaturated fatty acids 8
2.3 Measuring lipid oxidation 10
2.3.1 Oxygen consumption 10
2.3.2 Lipid hydroperoxides 10
2.3.3 Conjugated diene hydroperoxides 11
2.3.4 2-Thiobarbituric acid (TBA) value 11
2.3.5 Carbonyl compounds 12
2.3.6 Gas chromatographic (GC) analysis 13
2.4 Milk proteins 14
2.4.1 Caseins 14
2.4.2 Whey proteins 15
2.5 Oil-in-water (O/W) emulsions 17
2.6 Lipid oxidation in O/W emulsions 21
2.6.1 Role of pro-oxidative metal ions, chelators,
the pH and the surface charge 21
2.6.2 Primary antioxidants 25
2.6.3 Oxygen 26
2.6.4 The droplet interface as a physical barrier 27
2.6.5 Viscosity 28
2.6.6 Oil phase concentration 28
2.6.7 Droplet size 29
2.6.8 Retention of volatiles 32

Table of contents x
2.7 Antioxidative influence of milk proteins
in O/W emulsions and similar systems 33
2.7.1 General findings 33
2.7.2 Influence of continuous phase protein
on oxidative stability 35
2.7.3 Influence of heat treatment of milk proteins
on oxidative stability 36
2.7.4 Influence of high and low molecular weight
protein fractions, protein hydrolysates and peptides
on oxidative stability 39
2.8 Antioxidative mechanisms of milk proteins,
milk protein hydrolysates and peptides 41
2.8.1 Hydrophobicity 42
2.8.2 Metal binding 43
2.8.3 Free-radical-scavenging ability 50
Chapter 3: Materials and methods 59
3.1 General materials 59
3.1.1 Emulsion lipid 59
3.1.2 Proteins 59
3.1.3 Chemicals for lipid hydroperoxide
and hexanal determination 59
3.2 General methods 60
3.2.1 Determination of the iron and copper content
of the protein powders 60
3.2.2 Preparation of protein solutions 60
3.2.3 Preparation of emulsions 60
3.2.4 Acceleration of the lipid oxidation rate
by emulsion storage at elevated temperature 61
3.2.5 Measurement of the droplet size 62
3.2.6 Measurement of the pH value 62
3.2.7 Lipid hydroperoxide determination 62
3.2.8 Hexanal determination 63
3.2.9 Spectrophotometric measurements 64

Table of contents xi
3.2.10 Statistical analysis 64
3.3 Materials and methods in Chapter 4 65
3.3.1 Methods: Chapter 4.1 65
3.3.2 Methods: Chapter 4.2 65
3.3.3 Methods: Chapter 4.3 66
3.4 Materials and methods in Chapter 5 67
3.4.1 Materials: Chapter 5 67
3.4.2 Methods: Chapter 5.1 68
3.4.3 Methods: Chapter 5.2 68
3.5 Materials and methods in Chapter 6 69
3.5.1 Materials: Chapter 6 69
3.5.2 Methods: Chapter 6 70
3.6 Materials and methods in Chapter 7 73
3.6.1 Materials: Chapter 7 73
3.6.2 Methods: Chapter 7 74
3.6.3 Methods: Chapter 7.1 74
3.6.4 Methods: Chapter 7.2 76
Chapter 4: Factors affecting lipid oxidation
in milk-protein-based O/W emulsions 79
4.1 Effect of droplet size on lipid oxidation in NaCas-based
linoleic acid emulsions 80
4.2 Effect of droplet size, protein type and protein concentration
on lipid oxidation in linoleic acid emulsions 86
4.3 Role of unadsorbed protein in lipid oxidation 97
4.4 Addition of milk protein solutions to milk-protein-based
emulsions and the influence on lipid oxidation 104
4.5 General discussion 109
Chapter 5: Influence of low molecular weight (LMW) compounds
on lipid oxidation 119
5.1 Influence of the removal of LMW compounds
of WPI and NaCas by dialysis and the addition
of metal ion chelators on lipid oxidation 119

Table of contents xii
5.2 Effects of LMW fractions on oxidative stability 134
Chapter 6: Effect of heat treatment of milk protein solutions prior to
emulsification on the oxidative stability of O/W emulsions 141
Chapter 7: Effect of free radicals on lipid and protein oxidation 159
7.1 Effects of free radicals on oxygen consumption
and lipid hydroperoxide production in emulsions 159
7.2 Effects of free radicals on protein oxidation 169
7.3 General discussion 186
Chapter 8: Concluding discussion and recommendations 197
8.1 Concluding remarks 197
8.2 Recommendations for future work 208
Appendix 211
References 219

Chapter 1: Introduction 1
Chapter 1
Introduction
Polyunsaturated fatty acids (PUFAs) play an important role in human nutrition.
Research in recent decades has shown greatly beneficial effects for human health of
diets that are high in the omega-3 (or n-3) fatty acids, docosahexaenoic acid (DHA) and
eicosapentaenoic acid (EPA). They appear to be particularly suitable for the prevention
of coronary heart disease, hypertension and type 2 diabetes and are beneficial for brain
development and mental health (Ruxton et al. 2004; Simopoulos 1999). Other PUFAs
such as arachidonic acid, linoleic acid, γ-linolenic acid (n-6 fatty acids) and α-linolenic
acid (n-3 fatty acid) are also physiologically important. In general, unsaturated fatty
acids serve as building blocks for biological membranes and signal compounds
(Kritchevsky 2002; Watkins and German 2002). A balanced ratio of n-6:n-3 intake is an
important factor in the prevention of heart diseases. In Western countries, such as the
USA and the UK, this ratio was found to be unbalanced because of a low n-3 intake and
a high n-6 intake (Simopoulos 1999; Simopoulos 2001; Wijendran and Hayes 2004).
The fortification of food products with lipids high in omega-3 fatty acids could be a
means of dealing with the problem of omega-3 deficiency in Western societies.
However, the stability and stabilisation of PUFAs in foods is a challenge because these
fatty acids are highly susceptible to lipid oxidation. Lipid oxidation leads to damage to
PUFAs and thereby a decrease in their nutritional value. Volatile off-flavour
compounds (e.g. aldehydes) are produced during lipid oxidation. Thus, deterioration in
the quality of foods can occur and their shelf lives may be reduced. Some metals that
are widely present in food, the oxidative state of the raw materials and the conditions
during the production process and storage of foods can initiate and promote lipid
oxidation:
• iron and copper ions;
• pre-contamination with hydroperoxides;
• presence of oxygen;
• heating during the production process, e.g. pasteurisation;

Chapter 1: Introduction 2
• high storage temperatures;
• light.
Therefore, effective strategies for protecting PUFAs in foods from oxidative
deterioration are required. The food delivery systems for omega-3 fatty acids need to
have the correct format to minimise negative influences that can promote lipid
oxidation. For their incorporation at high levels into a food product, PUFAs usually
need to be emulsified because of their hydrophobic nature. Examples of sources that are
rich in DHA and EPA are oils of marine fish and algae (Ackman 2004; Berge and
Barnathan 2005; Lagarde 2008).
The milk protein products whey protein isolate (WPI) and sodium caseinate (NaCas) are
used as emulsifiers for oil-in-water (O/W) emulsions because of their remarkable
emulsifying properties (see also Chapter 2, Sections 2.4 and 2.5). Furthermore, WPI and
NaCas, as well as hydrolysates and peptides thereof, have shown good antioxidative
potential by inhibiting the oxidative deterioration of unsaturated fatty acids, either as
part of triacylglycerols or in free form (see also Chapter 2, Section 2.7). WPI and NaCas
therefore appear to be useful for the design of O/W emulsions that serve as delivery
systems for omega-3 fatty acids because of their dual functionality as emulsifiers and
antioxidants. Such emulsions may be incorporated into real food emulsion systems, e.g.
milk, yoghurt, mayonnaise or ice cream.
Although WPI and NaCas have shown antioxidative potential in O/W emulsions, a
more detailed understanding of their effectiveness under certain conditions, their
antioxidative mechanisms and their interaction with emulsion lipids is required. In
addition, new possibilities for improving their antioxidative functionality need to be
explored. These were the purposes of the present study. As more fundamental
information about the characteristics and the behaviour of whey proteins and caseins in
O/W emulsions is gathered, it will become easier to handle and use them for real food
systems.
For the present study, an O/W emulsion test model system, in which the influence of
certain parameters on oxidation could be examined, needed to be chosen. A simple,

Chapter 1: Introduction 3
relatively well-defined and standardised system was proposed, in order to limit the
number of unknown variables and to be able to attribute changes in the oxidative
stability more unequivocally to the factors that were altered. In that respect, the
selection of a suitable lipid as the oil phase was important. One criterion for the lipid
was a high content of PUFAs because it had to exhibit similarity to omega-3 fatty acids.
Linoleic acid was selected, as it was available in purified and standardised form without
antioxidants and in large quantities from a chemical supplier.

Chapter 2: Literature review 5
Chapter 2
Literature review
2.1 Lipids
Food lipids, fats (if they are solid) and oils (if they are liquid), are derived from both
animal sources and plant sources. Triacylglycerols, which consist of three fatty acids
esterified with glycerol, form the major component of food lipids. Depending on the
origin of the oil or the fat, the overall fatty acid composition varies and determines the
characteristics of the triacylglycerol mixture, e.g. melting point, hydrophobicity and
susceptibility towards oxidation. Free fatty acids, diacylglycerols and
monoacylglycerols are present in smaller quantities in food oils. Di- and
monoacylglycerols are also industrially produced from triacylglycerols and are used as
food emulsifiers. Another group of lipids that are present in food comprises
phospholipids and glycolipids. Together with proteins, they are major components of
biological membranes and are therefore present in many food products. Amongst them,
lecithin is the most relevant group in foods. Lecithin is a complex mixture of glycerol
esterified with two fatty acids of various kinds and orthophosphate, which is again
esterified, mostly with three molecules, choline, ethanolamine or inositol. In addition,
isoprenoid compounds (steroids, carotenoids and monoterpenes), tocopherols and waxes
are classified as lipids (Belitz et al. 2004).
2.1.1 Fatty acids in food material
Fatty acids are the main constituent of the most common food lipids. The major
saturated fatty acids are palmitic acid (11 %), stearic acid (4 %) and myristic acid (2 %)
and the major unsaturated fatty acids are oleic acid (34 %), linoleic acid (34 %) and α-
linolenic acid plus γ-linolenic acid (5 %), according to estimated quantities of the world
production of food oils. Certain highly unsaturated fatty acids are not found in a great
variety of sources but are contained in higher quantities in specific lipid-containing

Chapter 2: Literature review 6
biological material. Typical sources of arachidonic acid, with 20 carbon atoms and four
double bonds, are liver, lard, lipids of chicken eggs and meat. Docosahexaenoic acid
(DHA) consists of 22 carbon atoms and six double bonds, and eicosapentaenoic acid
(EPA) consists of 20 carbon atoms and five double bonds (Belitz et al. 2004). They are
contained in larger quantities in marine algae and fish oils, which represent the major
source of DHA and EPA (Ackman 2004; Berge and Barnathan 2005; Lagarde 2008).
2.1.2 Fatty acids and human health
Fatty acids have important functions in the human body. Adipose tissue, consisting
mainly of triacylglycerols, serves as energy storage, an insulator and a shock absorber.
However, an excessive fat and oil intake is detrimental, leading to obesity with all its
negative aspects. The lipophilic vitamins A, E, D and K are transported in the body in
association with fat. In particular, unsaturated fatty acids are important building blocks
for biological membranes and signal compounds with hormone-like character, e.g.
eicosanoids (Kritchevsky 2002; Watkins and German 2002).
It is known that palmitic, stearic and oleic acids can be synthesised by humans, but the
overall fatty acid metabolism is not yet fully understood. Linoleic acid and α-linolenic
acid have been seen as essential fatty acids, but this has also been controversially
discussed. DHA and arachidonic acid can be synthesised from α-linolenic acid and
linoleic acid respectively, but at low levels that are particularly insufficient in conditions
such as infancy (Cunnane 2003).
A balanced ratio of n-6 fatty acids (linoleic acid, γ-linolenic acid, arachidonic acid) to n-
3 fatty acids (α-linolenic acid, DHA, EPA) was found to be an important aspect of a
healthy diet to prevent heart diseases. Socio-cultural differences for this ratio were
detected. The n-6:n-3 ratio was 4:1 for the average Japanese diet, whereas it was 7:1 for
the UK diet and 17:1 for the USA diet (Simopoulos 2001). Ratios from 1:1 to 6:1 have
been suggested for healthy adults (Simopoulos 1999; Wijendran and Hayes 2004).
Chapter 2: Literature review 7
The ingestion of DHA and EPA has generally shown greatly beneficial influences, as
indicated by numerous studies. Anti-inflammatory, antithrombotic, antiarrhythmic,
hypolipidaemic and vasodilatory properties have been found, resulting in beneficial
health effects for patients with predispositions for coronary heart disease, hypertension
and type 2 diabetes and in some cases for patients with renal disease, rheumatoid
arthritis, ulcerative colitis, Crohn’s disease and chronic obstructive pulmonary disease
(Ruxton et al. 2004; Simopoulos 1999). Furthermore, there is strong evidence that they
play an important role in brain development and function. Also, mental health seems to
be influenced beneficially by DHA and EPA intake. Lower plasma levels of both fatty
acids were found in children with hyperactivity, pointing to a possible correlation with
the symptoms. Anti-depressive effects were found and evidence for beneficial
influences in the prevention or treatment of dementia, cognitive decline and
Alzheimer’s disease was shown (the results of these studies were partly linked to a high
fish consumption) (Ruxton et al. 2004). DHA is also important for eye health, playing a
particular role in the retina, with functional, structural and protective properties
(Delcourt 2007).
Intake levels for DHA and EPA have been recommended by health organisations and
government agencies. For health improvements, 400−600 mg/day (Harris 2007) and
450−900 mg/day (Ruxton et al. 2004) have been suggested. Although positive health
effects are predominant with respect to diets that are rich in long chain polyunsaturated
fatty acids (PUFAs), some studies point out that such diets are very susceptible towards
oxidation and can partly increase the oxidative stress on the body. Consequences may
be lower antioxidant levels (e.g. of vitamin E), which could affect their protective
functions within the body. Some studies also found higher oxidation levels in low
density lipoproteins (LDLs), previously linked to atherosclerosis and inflammatory
processes. An adequate supplementation with antioxidants has therefore been suggested
to account for possible negative side effects (Turini et al. 2001).

Chapter 2: Literature review 8
2.2 Oxidation of unsaturated fatty acids
Unsaturated fatty acids, in acyl or free form, are susceptible to oxidation. The major
oxidation mechanism is called autoxidation and takes place when the oxidising fatty
acid is not exposed to the activity of pro-oxidative enzymes (lipoxygenases, peroxidases
and catalases) or light in the presence of type II photosensitisers, which would trigger
photooxidation with singlet oxygen activity (Belitz et al. 2004). The basic condition for
the initiation of autoxidation is the presence of small amounts of free radicals (a “free
radical” or just “radical” is defined as “an atom or group of atoms with at least one
unpaired electron;…” (http://wordnetweb.princeton.edu/perl/webwn?s=free%20radical
2009)) or a light-activated photosensitiser of type I. Both can abstract a hydrogen atom
from a methylene group situated between two double bonds or as part of an allyl group
and a free radical is created on the fatty acid molecule. The greater the number of
double bonds present on the whole molecule, the lower is the energy required for the
abstraction, as the free radical is stabilised by electron delocalisation over a larger area.
Therefore, the susceptibility towards oxidation increases with an increasing degree of
unsaturation (Belitz et al. 2004).
The free radical further reacts with oxygen to create a peroxyl radical (reaction a, Figure
2.1), which can again abstract a hydrogen atom from a methylene group, leading to a
hydroperoxide (reaction b, Figure 2.1). This sort of hydroperoxide will generally be
called lipid hydroperoxide in the present study. The greater the number of double bonds,
the greater is the variety of lipid hydroperoxides that can result from one hydrogen atom
abstraction. The lipid hydroperoxide can resolve into an alkoxyl radical and a hydroxyl
radical in a monomolecular reaction (reaction c, Figure 2.1) or, in the presence of a
metal ion (+II), an alkoxyl radical and a metal ion (+III) can be generated (reaction d,
Figure 2.1). The lipid hydroperoxide can also react with a metal ion (+III), creating a
peroxyl radical and a metal ion (+II) (reaction e, Figure 2.1). The most relevant pro-
oxidative metal ions derive from iron, copper and cobalt. In further decomposition
reactions, many volatile secondary oxidation products (mostly aldehydes, ketones,
alcohols and hydrocarbons (Frankel 1998b)), which are already perceivable at low
concentrations, are formed. This can cause quality deterioration in food products with
even low oil or fat content. The homolytic β-scission of the alkoxyl radicals is one of

Chapter 2: Literature review 9
the major reactions responsible for off-flavour production. In Figure 2.2, this reaction is
illustrated with the example of linoleic acid autoxidation, resulting in the aldehyde
hexanal. An intermediate product is the hydroperoxide at carbon atom C13 (in the
autoxidation of linoleic acid, hydroperoxides can also form at carbon atom C9). Belitz et
al. (2004) indicated that hexanal is the major volatile oxidation product of linoleic acid.
Out of 19 secondary oxidation products, the highest concentration was found for
hexanal (5100 µg/g linoleic acid after specified oxygen uptake at 20 ˚C). The second
highest concentration was below 1000 µg/g and the concentration was below 500 µg/g
for all other compounds.
R1· + O2 → R1OO· (reaction a)
R1OO· + R2H → R1OOH + R2· (reaction b)
R1OOH → R1O· + ·OH (reaction c)
R1OOH + Men+ → R1O· + OH− + Me(n+1)+ (reaction d)
R1OOH + Me(n+1)+ → R1OO· + H+ + Men+ (reaction e)
R1O· + R2H → R1OH + R2· (reaction f)
Figure 2.1: Principal reactions in the autoxidation of unsaturated fatty acids (Belitz et al. 2004)
CH3(CH2)4CH=CHCH2CH=CH(CH2)7COOH linoleic acid
CH3(CH2)4–CH–CH=CHCH=CH(CH2)7COOH hydroperoxide at C13 of linoleic acid
O-OH reaction c or d in Figure 2.1 a b CH3(CH2)4–CH–CH=CHCH=CH(CH2)7COOH alkoxyl radical at C13 of linoleic acid
O·
cleavage b
CH3(CH2)4COH + ·CH=CHCH=CH(CH2)7COOH
hexanal
Figure 2.2: Hexanal formation in the autoxidation of linoleic acid by homolytic β-scission (Frankel 1998b; Gordon 2001)

Chapter 2: Literature review 10
Iron appears to be the most relevant pro-oxidative metal in foods as it is reactive and is
present in relatively high concentrations. Ferrous iron is more pro-oxidative than ferric
iron as it is ten times more reactive (Mei et al. 1998a) and fuels the production of
alkoxyl radicals, further leading to off-flavour products (reaction d, Figure 2.1; Figure
2.2). In Decker et al. (2002), ferrous iron is stated to react 105 times faster than ferric
iron with hydrogen peroxide. Although Cu+ reacts 50 times faster than ferrous iron with
hydrogen peroxide, it is not seen as the major pro-oxidative metal in food because of
low concentration levels.
2.3 Measuring lipid oxidation
2.3.1 Oxygen consumption
In the lipid oxidation process, oxygen reacts with lipids. Therefore, the uptake of
oxygen can be measured as a parameter that indicates lipid oxidation. The technique to
measure dissolved oxygen comprises an oxygen electrode with a Clark-type membrane,
where a current that is proportional to the concentration of dissolved oxygen is created
(Clark et al. 1953). The electrode is connected to an oxygen meter, where the current is
converted into oxygen concentration, shown on a display. To measure the oxygen
consumption, the sample is located in a closed container. The technique has also been
used for emulsion systems (Chen et al. 1998; Rival et al. 2001a; Taylor and Richardson
1980a).
2.3.2 Lipid hydroperoxides
The peroxide value (PV) method is widely used to measure the hydroperoxide
concentration in bulk oils. The principle is that iodide acts as a reducing agent towards
the oxidised sample. In turn, iodide is oxidised to iodine and is determined
titrimetrically with sodium thiosulfate. Thiosulfate reduces iodine (yellow in solution)
again to iodide (colourless). Starch can be used as an indicator towards the endpoint of

Chapter 2: Literature review 11
the iodine reduction. The PV is expressed as milliequivalents (meq) of iodine per
kilogram of lipid or mmoles of hydroperoxide per kilogram of lipid (PV in meq/kg = 2
PV in mmol/kg). For dairy products, another more sensitive method without the time-
consuming titration step is often used to determine lipid hydroperoxides. Its basic
principle is the oxidation of ferrous iron to ferric iron when in contact with lipid
hydroperoxides. Ferric iron reacts with thiocyanate (reactant) to form a coloured
complex that can be determined spectrophotometrically. In the assay, the lipids are first
extracted from the sample with organic solvents before this reaction takes place
(Frankel 1998c; Nuchi et al. 2001; Shantha and Decker 1994).
2.3.3 Conjugated diene hydroperoxides
With this method, conjugated diene hydroperoxides, generated during the course of
fatty acid oxidation, can be measured. The samples (oils, fats or emulsions) are diluted
in organic solvents. The conjugated diene hydroperoxides have a strong absorption
maximum at 234 nm and are determined directly at this wavelength. Thus, the method
is straightforward, but the complication is that it can deliver reliable results only in the
early stage of lipid oxidation. Secondary oxidation products and polymers generated
from the decomposition of lipid hydroperoxides at later stages of oxidation also absorb
at 234 nm. Therefore, it can become unclear to what extent the measured concentration
is due to the presence of conjugated diene hydroperoxides or secondary oxidation
products. The method has also been described as being unsuitable for samples
containing free PUFAs (Frankel 1998c).
2.3.4 2-Thiobarbituric acid (TBA) value
TBA reacts with many secondary oxidation products of unsaturated lipids (called TBA-
reactive substances or TBARS), forming compounds that absorb at 532−535 nm. The
reaction is not specific to a certain oxidation product, although the colour development
(pink) was originally thought to be due to the reaction of only malonaldehyde with TBA
(in quantitative analyses, 1,1,3,3-tetraethoxypropane is used as a standard compound as

Chapter 2: Literature review 12
it decomposes to malonaldehyde in the assay). Various factors influence the generation
of the coloured compounds and they vary depending partly on the version of the assay:
pH (low pH is a reaction condition), temperature (the assay involves heating to 100 ˚C),
the presence of metal ions (ferric iron promotes the reaction) and antioxidants
(butylhydroxytoluol and EDTA suppress the reaction). Therefore, a negative aspect is
also that the reaction conditions are suitable for altering the original lipid oxidation
status of the sample. Furthermore, other materials present in complex food systems,
such as amino acids and carbohydrates, may affect the result as they can contribute to
the colour reaction (Frankel 1998c; Hegenauer et al. 1979a; McDonald and Hultin
1987).
2.3.5 Carbonyl compounds
Carbonyls (ketones and aldehydes) can be determined by their reaction with 2,4-
dinitrophenylhydrazine as they form coloured hydrazones that absorb at 430−460 nm. In
the classical method, trichloroacetic acid is used as a catalyst but this is disadvantageous
in lipid oxidation studies as it promotes the decomposition of hydroperoxides. To
eliminate the problem, the hydroperoxides can be reduced by stannous chloride or the
hydrazones can be derivatised and analysed after their removal by vacuum distillation
(Frankel 1998c). In food products with a naturally high content of carbonyls, high
values might be obtained for the control sample, independent of the status of lipid
oxidation, reducing the sensitivity of the method. The method has not been widely used
for measuring lipid oxidation.
Another method, the p-anisidine test, can be used to measure the content of saturated
and unsaturated carbonyls in triacylglycerols. An aliquot of the fat or oil is dissolved in
isooctane and the carbonyls react with the reagent p-anisidine in the acetic acidic milieu,
forming a coloured adduct. The absorbance at 350 nm, multiplied by a factor and
divided by the weight (grams) of the sample, is defined as the p-anisidine value (Frankel
1998c; IUPAC 1987).

Chapter 2: Literature review 13
2.3.6 Gas chromatographic (GC) analysis
Volatile compounds of a sample can be analysed using gas chromatography, which is
therefore useful for determining lipid oxidation products such as aldehydes and
hydrocarbons. The sample is added into a container with a headspace and the container
is sealed. Volatile compounds present in the sample are transferred into the headspace
by heating and/or agitation for a set time. In the static headspace technique, an aliquot
of the headspace is taken (with or without previous purging of the sample with an inert
gas) and is injected on to the GC column. In the dynamic headspace (or “purge and
trap”) technique, the sample is first purged with an inert gas. Volatiles evaporate with
the gas stream and are then adsorbed or “trapped” and thus concentrated on a short
column. From there, they are transferred on to the GC column with the carrier gas. In
the solid phase microextraction (SPME) technique, the simplicity of the static
headspace method is combined with the greater sensitivity of the dynamic headspace
technique. A fibre that is capable of adsorbing volatile compounds (e.g.
polydimethylsiloxane) is exposed to the gas in the headspace of the measurement
container. Under set conditions, the volatiles adsorb to the fibre material and
concentrate. The fibre is then inserted directly into the injection port of the GC column.
The volatiles pass through the GC column (most commonly capillary columns) with the
inert carrier gas at various velocities, as they are differentially retained by the column
material, and thus are separated. At the end of the GC column, they are qualified (e.g.
by using a standard of the targeted compound) and quantified with a detector (e.g. a
flame ionisation detector (FID) or a mass spectrometric (MS) detector) (Frankel 1998c).
Examples where the SPME technique has been used to determine secondary lipid
oxidation products are the studies of Beltran et al. (2005) (Tween-20-stabilised
sunflower O/W emulsions), Lee et al. (2003) (DHA-enriched fish oil) and Jonsdottir et
al. (2005) (microencapsulated fish oil).

Chapter 2: Literature review 14
2.4 Milk proteins
2.4.1 Caseins
Pasteurised skimmed bovine milk is acidified with hydrochloric acid, lactic acid
(particularly in New Zealand by fermentation with lactic acid bacteria (Fox and
McSweeney 1998a)) or sulphuric acid. The acid is added gradually while stirring at 30
or 45 ˚C. Caseins precipitate at pH 4.6 (concomitantly, the casein micelles are disrupted
and calcium phosphate is set free as a solute (Dalgleish 2004)). The casein precipitate is
then separated by centrifugation or vibrating sieve, washed with potable water to
remove lactose and salts, dehumidified by pressing and dried with belt or drum driers to
give the so-called acid casein. The casein fraction represents about 80 % of the total
milk protein (about 3.5 %). Sodium caseinate (NaCas) is produced by dissolving acid
casein in sodium hydroxide solution and subsequent spray drying (by analogy, calcium
and potassium caseinates are obtained by the use of calcium and potassium hydroxides).
NaCas forms colloidal solutions in water and has a bland flavour if the pH value is
maintained at around pH 7 during production (Tamime et al. 2007).
Bovine casein consists of four proteins, with a molecular weight between 20 and 24 kDa
(Patel 2007a), that are separately generated by gene expression: αs1-casein (37 %), αs2-
casein (10 %), β-casein (35 %) and κ-casein (12 %). β-Casein is the major substrate of
plasmin, a native proteinase in milk. When β-casein is hydrolysed by plasmin, γ-caseins
and proteose-peptones are formed (Fox and McSweeney 1998a).
Caseins have a low level of cysteine/cystine compared with whey proteins and no free
sulfhydryl groups. Only αs2-casein and κ-casein contain cysteine (two per molecule),
which is present in the disulfide form of cystine under normal non-reducing conditions.
In αs2-casein, two cysteine molecules are linked by disulfide bridges and κ-casein forms
oligomers from two to ten molecules interlinked by disulfide bridges. Caseins have a
high phosphorus content because of the esterification of monophosphate with the
hydroxyl group of serine and, to a minor degree, threonine. The possible numbers of
such phosphorylated residues decrease as follows: αs2-casein (10−13) > αs1-casein (8−9)

Chapter 2: Literature review 15
> β-casein (4−5) > κ-casein (1−3). The phosphate groups contribute to the
hydrophilicity of the caseins and can interact with cations because of their negative
charge. κ-Casein is glycosylated. Some κ-casein molecules are linked to tri- or
tetrasaccharides of N-acetylneuraminic acid, galactose and N-acetylgalactosamine via a
threonine residue. The oligosaccharide residues contribute to the hydrophilicity of κ-
casein (Fox and McSweeney 1998a). β-Casein is also glycosylated (with galactose,
galactosamine and N-acetylneuraminic acid (Fox 2003)).
Caseins are widely used in food processing. They exhibit excellent emulsifying and
foam-stabilising properties and can be used to modify the texture of foods (Chandan
1997). A good overview of the wide variety of food applications is given by Fox and
McSweeney (1998a). The good emulsifying characteristics of caseins are due to
hydrophobic and hydrophilic moieties, as opposed to an even distribution of amino acid
residues with various polarities. Caseins are very stable to thermal denaturation (sodium
caseinate is stable at 140 ˚C, pH 6.5−7.0, for more than 1 h before visible physical
effects occur (Fox and McSweeney 1998b)). Little secondary and tertiary protein
structure, as a result of a high proline content, is likely to account for the thermal
stability (Fox and McSweeney 1998a).
2.4.2 Whey proteins
In the production of acid casein, acid whey is obtained after the removal of the
precipitated caseins. Lactose and salts are removed from the whey to a large degree by
ion-exchange chromatography and ultrafiltration. Thereafter, the solution is spray-dried
to yield whey protein isolate (WPI) with a protein content of about 95 %. Whey protein
represents about 20 % of the total milk protein (Fox and McSweeney 1998a).
Whey protein consists of many proteins. The major proteins are β-lactoglobulin (50 %),
α-lactalbumin (20 %), bovine serum albumin (10 %) and immunoglobulins (IgG1, IgG2,
IgA, IgM) (10 %). The remaining 10 % consists mainly of non-protein nitrogen
compounds and small amounts of a large variety of proteins (lactoferrin, serotransferrin
and about 60 enzymes) (Fox 2003; Fox and McSweeney 1998a).

Chapter 2: Literature review 16
β-Lactoglobulin (molecular weight 18.3 kDa) contains two disulfide bonds and one free
sulfhydryl group, which is buried in the interior of the protein. It can form polymers,
depending on the environment. α-Lactalbumin (molecular weight 14.2 kDa) contains
four disulfide bonds and no free sulfhydryl group and exists as a monomer. One
disulfide bond is less stable than the others and might be disrupted more easily,
depending on the conditions. A possible disruption leads to a conformational change,
with greater exposure of hydrophobic regions. This can increase the surface activity and
might influence the antioxidative properties of the protein. The α-lactalbumin in milk
was found to be glycosylated to some degree. Bovine serum albumin (molecular weight
66.4 kDa) contains 17 disulfide bonds and one free sulfhydryl group and exists as a
monomer. Immunoglobulins (molecular weight 150–900 kDa) exist as monomers or as
polymers, in which four molecules are linked by four disulfide bonds (Fox 2003; Fox
and McSweeney 1998a).
In comparison with caseins, whey proteins are very susceptible to heat denaturation,
which begins at temperatures ≥ 70 ˚C (Smith and Campbell 2007). The whey proteins in
milk are completely denatured when heated at 90 ˚C for 10 min (Fox and McSweeney
1998a). This sensitivity can be explained by a greater presence of secondary and tertiary
structure in comparison with caseins, partially caused by a lower proline content. The
structures are largely determined by globular conformation (Patel 2007a).
In foods, WPI can be used as a stabiliser and fat mimetic (yoghurt, bakery mixes,
dietetic foods, infant foods, confections), as a substitute for egg white to reduce costs,
and as an ingredient or in pure form for high protein dietary formulations. It exhibits
water-binding and gel-forming properties and has a bland flavour. As native whey
proteins do not precipitate and give stable colloidal solutions over a wide pH range, they
can therefore also be used to protein-fortify acidic fruit or soft drinks (Chandan 1997).
They also have good emulsifying properties (Ye and Singh 2000). A comprehensive
overview of their applications in food is given by Fox and McSweeney (1998a).
Amongst the whey proteins, β-lactoglobulin and α-lactalbumin exhibit the best
emulsifying properties. They form stable oil-in-water emulsions that are only slightly
less stable than casein-stabilised emulsions (Hunt and Dalgleish 1994; Ye and Singh

Chapter 2: Literature review 17
2000). It has also been shown that the emulsifying properties of whey proteins are
improved by partial hydrolysis. This may be partly due to the formation of larger
surface-active peptides (Agboola et al. 1998; Dalgleish 2004; Huang et al. 1996).
2.5 Oil-in-water (O/W) emulsions
O/W emulsions are common on the food product market, for example as milk,
mayonnaise, creamers, ice cream mixes, gravies, whippable toppings, salad dressings or
cream liqueurs. Ideal O/W emulsions consist of a hydrophilic continuous phase
surrounding a hydrophobic oil phase, which exists as dispersed and discrete spherical
droplets of various sizes. The droplets are kinetically stabilised and prevented from
coalescing by the presence of a surfactant/emulsifier, which reduces the interfacial
tension between the two phases by forming an intermediate layer, the droplet interface.
The lower the interfacial tension, the lower is the tendency of the two phases to form the
smallest possible contact surface. Surfactants are molecules of an amphiphilic nature,
with a non-polar part and a polar part. The non-polar part reaches into the hydrophobic
oil phase whereas the polar part moves into the hydrophilic continuous phase (Dalgleish
2004). The ability of a surfactant to reduce the interfacial tension is given by the Gibbs’
equation ((Equation 1) (Fox and McSweeney 1998c)). In protein-stabilised emulsions, Γ
represents the protein load (mg/m2) on the interface (Dalgleish et al. 1995).
dγ = − R*T*Γ*dln a (Equation 1)
where γ is the interfacial tension, Γ is the excess concentration of the surfactant at the
interface over the concentration in the continuous phase, a is the activity of the
surfactant in the continuous phase, R is the universal gas constant and T is the absolute
temperature. Higher values of Γ and a as well as higher temperatures result in a
decrease in the interfacial tension γ.
In food O/W emulsions, the oil phase generally consists mainly of triacylglycerols and
the continuous phase consists of water, surfactants and other solutes. To give stable

Chapter 2: Literature review 18
O/W emulsions, surfactants are added in excess and are therefore also present in the
continuous phase. Often solids and gas bubbles are also contained in the system.
Proteins, in particular milk proteins, are widely used as emulsifiers in food emulsions.
Further details about applications and properties of specific milk proteins are given in
Section 2.4.
Colloid mills or high pressure homogenisers are used for the production of food O/W
emulsions. Colloid mills consist of a rotor and a stator, with a narrow gap between the
two. When a mixture of oil, aqueous solution and emulsifier passes through that gap
during the rotation process, shear forces tear the oil phase into small droplets and
surfactant molecules instantly adsorb to the newly created surfaces. Droplets of about 2
µm can be created with colloid mills. Smaller droplets are obtained with high pressure
homogenisers, in which the shearing forces are generated by pressure differences. The
components are usually pre-emulsified, e.g. with a high speed blender of the
rotor−stator type, before they are passed through the homogeniser. The main factors that
influence the droplet size are homogenisation pressure, design of the homogeniser,
number of passes, type and amount of surfactants and viscosity. At low emulsifier
concentrations, the formation of small droplet sizes is limited. The droplets coalesce and
form larger droplets, if the total droplet surface is too large to be covered (Dalgleish
2004). Monomodal, bimodal or multimodal droplet size distributions are obtained by
emulsification; they are assumed to be single (monomodal) or overlaying (bimodal and
multimodal) log−normal distributions (van Duynhoven et al. 2002). In a monomodal
droplet size distribution, the mean represents the average droplet size. In general,
monomodal distributions are targeted as such emulsions are more controllable.
The techniques that are widely used to measure the droplet size distribution and the
average droplet size are based on light scattering, such as integrated light scattering
(ILS) and dynamic light scattering (DLS). In the measurement process, the emulsion is
highly diluted with water. Light passes through the sample from a light source located at
one side of the sample and is scattered in a characteristic way that depends on the
droplet size distribution. In ILS, the intensity of the scattered light is measured from
various angles. In DLS, the light scattered to a fixed angle of 90 ˚ within a short period
of time is measured. In each case, the data obtained are processed by software that

Chapter 2: Literature review 19
calculates the most likely size distribution and average droplet size by generating a
regression function. Droplet size measurement is useful for controlling the effectiveness
and reproducibility of the emulsification process and allows the emulsion stability to be
monitored over time (Dalgleish 2004). The droplet sizes in food emulsions generally
range between 0.5 and 2.5 µm (Dalgleish 1997) or between 0.1 and 100 µm (Dickinson
1992; Dickinson and Stainsby 1982; McClements and Decker 2000).
When proteins adsorb at the oil−water interface, their conformation changes (e.g. as
found for β-lactoglobulin and α-lactalbumin). Such structural changes cannot be
investigated for caseins because of a naturally simpler conformation and limitations in
the measurement techniques. The denaturation can be reversible to some degree, as
found for α-lactalbumin, or irreversible, as observed for β-lactoglobulin. In the
adsorption process, the protein molecules unfold and spread out to maximise the contact
of lipophilic moieties with the oil phase, but structural elements such as the polypeptide
backbone also restrain close adsorption. However, even a few contact points can be
sufficient to stabilise the droplets towards coalescence, as for example in the case of the
egg protein phosvitin, which is a good emulsifier although it is relatively hydrophilic.
Other proteins, such as lysozyme and also gelatin, are poor emulsifiers because their
structure constrains effective adsorption (Dalgleish 2004).
The emulsifying properties of proteins can also change depending on the conditions or
the treatment. For example, pH reduction or chelator treatment can cause removal of
naturally bound Ca2+ from α-lactalbumin. This improves its emulsifying properties
because of greater flexibility. Also, the surface activity of β-lactoglobulin has been
reported to be pH dependent. Protein interfaces are less closely packed than interfaces
formed by surfactants of smaller size, such as mono- and diglycerides or phospholipids.
They can reduce the interfacial tension more effectively, but proteins often better
stabilise the droplets towards disruptive forces by forming more cohesive and viscous
interfaces. It has been reported that the interfaces formed by caseins are about 10 nm
thick. Whey proteins form thinner layers of about 2 nm. Small molecule surfactants are
able to replace proteins from the interface after emulsification (e.g. sodium dodecyl
sulfate (SDS)). Some studies have looked at the proportion in which different milk
proteins adsorb to droplet interfaces when mixed protein solutions are used for
Chapter 2: Literature review 20
emulsification. In most cases, and when a mix of whey protein and NaCas was used, a
balanced adsorption of all proteins according to their concentration was found
(Dalgleish 2004; Dalgleish et al. 1995).
In protein-based food emulsions, droplets are stabilised by charge repulsion and steric
repulsion. The droplet surface is often negatively charged as the pH may be above the
isoelectric point (pI) of the proteins under weakly acidic or neutral pH conditions (pH
5−7). The droplets are thereby stabilised by charge repulsion. In steric repulsion,
structural features of the proteins prevent droplets from close approach and aggregation,
e.g. hydrophilic residues in β-casein with a high lysine and arginine content, which
protrude into the continuous phase (Dalgleish 2004; Dalgleish et al. 1995).
Proteins, adsorbed at the interface, can polymerise, as for example observed for β-
lactoglobulin and α-lactalbumin, by disulfide formation. In whey-protein-based
emulsions, droplets can take part in gel formation by binding to proteins in the
continuous phase. Interactions between interfacial and continuous phase proteins can
also result in mono- or multi-molecular protein layers. Multi-layers are reported to form
more easily at whey protein interfaces than at casein interfaces as the molecules do not
reach as far into the continuous phase and therefore the steric repulsion against
approaching protein molecules is weaker. However, multi-layer formation also seems to
occur in NaCas-based emulsions. The stability and the properties of multi-layers, in
comparison with mono-layers, and the conditions for their formation have not yet been
fully elucidated. By the interaction of interfacial proteins present on different droplets,
e.g. disulfide linkage between whey proteins, the emulsion can physically destabilise as
droplets aggregate. In casein-based emulsions, the addition of cations such as Ca2+ can
reduce the charge repulsion between droplets, and organic solvents such as ethanol can
affect the steric stabilisation of the droplets. Both can result in aggregate formation
(Dalgleish 2004). Calcium has also caused aggregation in whey protein emulsions
(Chanamai and McClements 2002). In contrast, when calcium is present in the form of
calcium caseinate, casein clusters are formed in aqueous solution and, during
emulsification, these clusters can adsorb at the interface, leading to a higher protein load
and emulsion stability (Srinivasan et al. 1999). In general, the temperature (e.g.
flocculation occurred in whey-protein-stabilised emulsions at neutral pH at 70 ˚C), the

Chapter 2: Literature review 21
pH value and the ionic strength also influence the stability of protein-based emulsions
(Chanamai and McClements 2002; Dalgleish 2004).
2.6 Lipid oxidation in O/W emulsions
In the O/W emulsion system, unsaturated fatty acids are present as part of tri-, di- and
monoacylglycerols, and as free fatty acids. They are mostly located within the oil
droplets and a few molecules can also be present in the interface (McClements and
Decker 2000). Lipid hydroperoxides are a vital element in the free-radical-mediated
propagation of lipid oxidation. They are more polar than the unoxidised lipid molecules
and therefore a higher concentration can be found at the interface than in the more
hydrophobic core of the oil droplet (McClements and Decker 2000; Nuchi et al. 2002).
The interface has also been suggested to be the most relevant region for lipid oxidation
to take place and surface-active antioxidants would be particularly effective oxidation
inhibitors (McClements and Decker 2000). In general, the autoxidation mechanisms in
O/W emulsions are thought to be the same as in bulk oils (Genot et al. 2003). As
described earlier, metal ions and free radicals play an important role in the autoxidation
process of lipids. The limitation of these factors is also most relevant for the oxidative
stability of O/W emulsions (Decker et al. 2002).
2.6.1 Role of pro-oxidative metal ions, chelators, the pH and the surface charge
A basic requirement for low oxidative sensitivity is that the materials used for
emulsification, in particular the oil phase and the emulsifier, contain the lowest possible
levels of hydroperoxides (as they are a source of free radicals upon decomposition) and
iron and copper (as they lead to decomposition of hydroperoxides) (McClements and
Decker 2000). For example, Mancuso et al. (1999a) found 4–35 µmol peroxide/g
surfactant in lecithin, Brijs and Tweens.
The presence of effective chelators in the system makes metal ions unavailable for the
lipid oxidation process. The addition of artificial chelators such as EDTA has a marked

Chapter 2: Literature review 22
antioxidative effect. EDTA can also be added legally as an antioxidant in food O/W
emulsions (e.g. in the USA with a permitted dose of 75−100 ppm (FDA 2007)).
Chelating properties of proteins have also been reported, as discussed later. Not only the
continuous phase but also the oil phase can be a source of metal ions (water, oil,
surfactants, buffer substances (Mei et al. 1998a)). Proteins naturally contain minerals
and water may also be a source of pro-oxidative metal ions. Food oil can be
contaminated with low levels of metals from the production process (Benjelloun et al.
1991). The location of chelators is therefore a relevant factor for an effective chelation
process.
The solubility of iron in water increases with decreasing pH (Donnelly et al. 1998; Graf
et al. 1984; Mancuso et al. 1999b). Thus, more lipid oxidation occurred in a Tween-20-
based emulsion at pH 3 than at pH 7, when oxidation was promoted by Fe3+ and
ascorbate, creating Fe2+. Metal repulsion would have been similar at both pH conditions
because of a non-ionic droplet surface (Donnelly et al. 1998). In another study, in which
Tween 20 was also used as the emulsifier and no iron was added, lipid oxidation was
greater at pH 7 than at pH 3. An increased iron concentration on the droplet surface was
found at pH 7, which indicated that more iron had precipitated on the droplet surface at
the higher pH (Mancuso et al. 1999b). An explanation for these seemingly contradictory
results is offered by Mei et al. (1998a); the solubility of ferric iron increases from pH 7
to pH 3, whereas the solubility of ferrous iron increases from pH 3 to pH 7. In contrast,
ferrous iron is apparently still 1017 (pH 7) and 1013 (pH 3) times more water soluble
than ferric iron (Decker et al. 2002). The concentration of the respective redox form
therefore appears to be a relevant factor for how much iron can precipitate on the
droplets at a certain pH, affecting the oxidative stability of the emulsion.
Iron on the droplet interface can also be removed by continuous phase chelators. This
was shown in a study of Mei et al. (1998a), as the addition of EDTA or phytate to an
SDS-stabilised hexadecane O/W emulsion with ferrous iron lowered the zeta-potential
on the droplets. In the same study, the lipid oxidation rate in SDS-stabilised salmon
O/W emulsions with ferrous iron decreased when EDTA or phytate was added. An
example of a real food product is mayonnaise, stabilised with the protein phosvitin from
egg yolk. Phosvitin has a high iron content and lipid oxidation may be accelerated by

Chapter 2: Literature review 23
the release of iron at the droplet interface under acidic conditions. EDTA can remove
iron from phosvitin at the interface and thus inhibit lipid oxidation (Jacobsen et al.
2001; Thomsen et al. 2000). In a study of Tong et al. (2000b), the addition of ferrous
iron to a hexadecane O/W emulsion (pH 7) stabilised with bovine serum albumin (0.1
%) led to an increase in the zeta-potential at the droplet surface, indicating iron
association. When increasing levels of a high molecular weight fraction of whey
(molecular weight ≥ 3500) were incorporated, the zeta-potential decreased. At the
highest whey protein level (14.0 µg/ml), the zeta-potential had decreased more than
when 20 µmol EDTA/l was added and the level was below the initial level before iron
addition. It was concluded that both components were able to remove iron from the
interface by chelation. In the same study, the lipid oxidation rate in a Tween-20-
stabilised salmon O/W emulsion (pH 7) to which the same whey fraction had been
added also decreased. This pointed to the possibility that the removal of iron from the
interface into the continuous phase may have contributed to the improved oxidative
stability. Other milk proteins also exhibit metal-binding abilities and can thus enhance
the oxidative stability of emulsions. This is discussed in more detail in a later section.
The surface charge of the droplets also plays an important role in the lipid oxidation
process. Pro-oxidative cations can be electrostatically repelled into the continuous phase
by a positive surface charge, away from the interface where lipid hydroperoxides are
prone to metal-induced decomposition. In contrast, a negatively charged droplet surface
can promote lipid oxidation by attracting pro-oxidative cations (Genot et al. 2003;
McClements and Decker 2000). These effects were shown when emulsions stabilised
with an anionic surfactant (SDS) oxidised more than emulsions stabilised with non-
ionic (Tween 20 or Brij 35) or cationic (dodecyltrimethylammonium bromide)
surfactants, when iron (Mei et al. 1998b) or no iron (Mancuso et al. 1999b) was added.
In a study of Mei et al. (1998b), sodium chloride (1.0 %) reduced iron-promoted lipid
oxidation in an SDS-stabilised emulsion with a net negative surface charge by 20 %, but
had no effect in emulsions with non-ionic or cationic surfactants. The authors pointed to
the possibility that other cations, which are not pro-oxidative, such as sodium ions in
this particular case, may compete with iron ions for negatively charged binding sites on
the droplet surface. This can lead to lower iron adsorption on the droplets and thus
decreased lipid oxidation.

Chapter 2: Literature review 24
It was also found that the access of antioxidants from the continuous phase to the
interface can be limited, and their effectiveness reduced, if their electric charge has the
same sign as the droplet surface charge. For example, partially negatively charged
galloyl derivatives did not associate with SDS-stabilised droplets with a negative
surface charge at pH 7.0 (Mei et al. 1999).
In general, the repelling or attracting force on the droplet surface depends on the surface
charge density (McClements and Decker 2000). The pH determines the surface charge
of protein molecules. In protein-based emulsions, the pH is therefore an influential
factor on the oxidative stability. Proteins are more likely to repel iron and copper ions
when they are positively charged at pH conditions below their isoelectric point. At the
interface, metal ions from the continuous phase would be repelled, but continuous phase
proteins are also less capable of binding metal ions. When a fraction of acid whey
(molecular weight ≤ 5000) was added to a phosphatidylcholine liposome system, the
inhibition of TBARS formation increased with increasing pH from pH 5 to pH 7. This
might have been due to greater metal-binding capacity, keeping metal ions away from
the liposomes (Colbert and Decker 1991). In a study of Donnelly et al. (1998), WPI-
stabilised menhaden O/W emulsions with iron had more oxidative stability at pH 3.0
than at pH 7.0. This observation was attributed to the greater repulsion of iron from the
net positively charged protein interface at low pH. Similar results were obtained by
Faraji et al. (2004); less lipid hydroperoxides and propanal were produced in menhaden
O/W emulsions stabilised with 0.5 % WPI at pH 3 than at pH 7. In a study by Hu et al.
(2003a), various whey proteins (WPI, sweet whey, α-lactalbumin, β-lactoglobulin) were
used to produce salmon O/W emulsions. Increasing pH led to decreasing droplet surface
charge (indicated by a decrease in the zeta-potential). At the same time, the lipid
oxidation rates increased. However, amongst the emulsions prepared with different
proteins (pH 3), the order of oxidative stability and zeta-potential did not totally
correspond, showing that the droplet surface charge was not the only factor that
influenced the oxidative stability.

Chapter 2: Literature review 25
2.6.2 Primary antioxidants
Primary antioxidants (also called chain-breaking antioxidants) are able to inhibit the
lipid oxidation process by scavenging free radicals. The antioxidant donates a hydrogen
atom to the free-radical-bearing molecule (e.g. lipid radical, hydroxyl radical, alkoxyl
radical or peroxyl radical). The free radical is thereby transferred to the antioxidant
molecule, on which it is stabilised and less reactive (Genot et al. 2003; Yanishlieva-
Maslarova 2001). Primary antioxidants are reducing agents.
In studies on the effectiveness of primary antioxidants in O/W emulsions and how it
depended on their polarity, a tendency for antioxidants to achieve greater oxidative
stability the more lipophilic they were was found. Lipophilic antioxidants can be more
effective as they accumulate in the oil phase and at the droplet interface, where higher
levels of lipid hydroperoxides and free radicals may be present. In contrast, hydrophilic
antioxidants can be more effective in bulk oils where they are located at the oil−air
interface (McClements and Decker 2000). This phenomenon is sometimes called “polar
paradox”. Partly conflicting results about the relationship between the lipophilicity of
antioxidants and their effectiveness in O/W emulsions have been obtained (Genot et al.
2003). To some degree, free radicals can also be found in the continuous phase, e.g.
because they were generated during emulsification (Coupland et al. 1996). A study of
Mei et al. (1999) pointed to the relevance of free-radical-scavenging activity in the
continuous phase, as galloyl derivatives with the ability to scavenge free radicals were
able to inhibit lipid oxidation in an O/W emulsion when they were not associated with
the droplet interface. Thus, the overall effectiveness of free radical scavenging depends
on the polarity, location and oxidisability of the primary antioxidants and the type and
concentration of free radicals in the different phases. Examples of primary antioxidants
are α-tocopherol, ascorbyl palmitate and carnosol (lipophilic) and Trolox, ascorbic acid,
carnosic acid and rosmarinic acid (hydrophilic) (McClements and Decker 2000).
In the presence of ferric iron, some reducing agents may have a pro-oxidative effect
(e.g. reducing sugars, glutathione, ascorbate or tocopherol) as they reduce ferric iron to
more pro-oxidative ferrous iron (McClements and Decker 2000; Mei et al. 1998a). In a
study of Mei et al. (1999), galloyl derivatives, which are also used as antioxidants,

Chapter 2: Literature review 26
showed strong reducing activity for ferric iron at pH 3.0. Also sulfhydryl groups, e.g.
present in cysteine residues in proteins, were suspected to reduce ferric iron to ferrous
iron (Pazos et al. 2006). Cysteine also promoted the free-radical-scavenging activity in
herring O/W emulsions (Marcuse 1960) and linoleic acid O/W emulsions (Marcuse
1962).
Proteins, in particular milk proteins, have shown a great potential for free-radical-
scavenging activity. This is discussed in more detail in a later section. In some studies,
proteins also influenced the effectiveness of other antioxidants by interacting with them
(Genot et al. 2003).
2.6.3 Oxygen
In the pre-blending and emulsification process, the newly formed emulsion is enriched
with oxygen. Oxygen is an important reactant in lipid oxidation as it contributes to lipid
hydroperoxide formation. The solubility of oxygen is higher in food oil than in water
(about three times (Ke and Ackman 1973) or 4.4 times (Genot et al. 2003)). With an
increase in the oil volume fraction in an O/W emulsion, the total amount of contained
oxygen increased (conditions: 25 ˚C, saturation with air). In contrast, the oxygen
concentration in the oil (µg O2/g oil) decreased. The greatest decrease was found with
an increase in the oil content up to 10 % (Genot et al. 2003). With increasing
temperature, the solubility of oxygen decreases and may become a factor that limits the
oxidation rate. At the same time, autoxidation reactions are accelerated with increasing
temperature. The oxygen solubility in the continuous phase also decreases with
increasing concentration of dissolved compounds. Oxygen exclusion, for example by
vacuum storage or the use of a protective inert gas such as nitrogen, can inhibit lipid
oxidation in real food emulsions until the product container is opened. In studies in
which the ability of an emulsion to resist oxidation is investigated, the oxygen partial
pressure above the emulsion should not be a limiting factor. It has also been found that
the production of secondary oxidation products is influenced by the oxygen
concentration. In the autoxidation of linoleic acid, 2,4-decadienal becomes a more
prominent product over hexanal at lower oxygen concentrations (Genot et al. 2003).
Chapter 2: Literature review 27
As oxygen is consumed in an emulsion, oxygen diffuses from the air into the continuous
phase and further via the droplet interface into the oil phase. Agitation accelerates this
process. The physical characteristics of an emulsion, e.g. viscosity, cream layer at the
air−water interface and structure of the droplet interface, may also influence oxygen
diffusion and thus lipid oxidation (Genot et al. 2003).
2.6.4 The droplet interface as a physical barrier
The oxidative stability of a Brij-stabilised O/W emulsion was greater when the size of
the hydrophilic part of the surfactant was larger. This suggested that the interface would
play a role as a physical barrier towards pro-oxidants from the continuous phase
(Silvestre et al. 2000). As proteins form relatively thick interfaces, they may be an
effective physical barrier against not only oxygen but also metal ions from the
continuous phase (Genot et al. 2003; McClements and Decker 2000). In a study of
Donnelly et al. (1998), WPI was partially removed from the droplet interface of a WPI-
based emulsion by the addition of Tween 20. Lipid oxidation increased in the iron-
fortified system and it was suggested that it could be attributed to the thinner Tween 20
interface exhibiting a less protective physical barrier towards pro-oxidants from the
continuous phase. In a study of Kellerby et al. (2006), NaCas was used as a stabiliser of
menhaden O/W emulsions (pH 7). The interfacial casein was cross-linked by
transglutaminase and could not be replaced by Tween 20. In spite of the more cohesive
interface, lipid hydroperoxide and TBARS generation was not more inhibited than in
the untreated emulsion. The increased rigidity of the interface did not seem to influence
the migration of pro-oxidants. It was suggested that pro-oxidative metals could still
have transferred across the protein layer. Kiokias et al. (2007) found greater oxidative
stability of whey-protein-stabilised sunflower O/W emulsions when the protein
solutions had been heated before emulsification. The authors suggested that the heated
whey proteins could have formed a more effective physical barrier towards pro-
oxidants. They referred to a previous study (Kiokias and Bot 2006), in which the same
emulsion system was used and twice as much whey protein associated with the oil
phase at elevated emulsification temperatures between 65 and 85 ˚C. Kiokias et al.
(2006) found greater oxidative stability and smaller droplet sizes for NaCas-stabilised

Chapter 2: Literature review 28
cottonseed O/W emulsions at higher protein concentrations. They mentioned the
possibility that thicker interfaces and thus greater protection from pro-oxidants could
have played a role for the improved oxidative stability at higher protein concentrations.
They referred to the findings of Kiokias and Bot (2006) who observed thicker protein
layers at the droplet interfaces at higher protein concentrations.
2.6.5 Viscosity
The influence of viscosity on the oxidative stability of O/W emulsions has been
discussed in association with the presence of polysaccharides, added to achieve textural
modification. It was found that the molecular movement of small molecules was not
hindered in polysaccharide networks. In contrast, xanthan gum was found to chelate
metal ions and tragacanth exhibited free-radical-scavenging activity in an O/W
emulsion; both activities led to improved oxidative stability (McClements and Decker
2000; Shimada et al. 1992; Shimada et al. 1994). Therefore, the oxidative stability in
O/W emulsions with higher viscosity may not be primarily related to viscosity, but to
the ingredients’ ability to chelate metal ions, scavenge free radicals and build a
protective droplet interface (McClements and Decker 2000). In a study of Jacobsen et
al. (2001), the incorporation of antioxidants into a fish-oil-enriched mayonnaise
changed the gel strength and the viscosity. The oxidative stability was also examined,
but it was not clear if the viscosity influenced lipid oxidation. In another study, gum
arabic, xanthan gum and propylene glycol alginate solutions made with lemon juice
were used to produce olive O/W emulsions. These were of various viscosities. Higher
viscosity was caused by a higher incorporation level of polysaccharides and resulted in
greater oxidative stability (Paraskevopoulou et al. 2007). The increase in viscosity was
again not disconnected from the possible antioxidative influence of the polysaccharides.
2.6.6 Oil phase concentration
The oil phase content of O/W emulsions and its influence on lipid oxidation is a factor
that has not yet been extensively studied. In a study of Kiokias et al. (2006), decreasing

Chapter 2: Literature review 29
oil content (40, 30, 20 and 10 %) resulted in greater oxidative stability (conjugated
diene hydroperoxides were determined) for sunflower O/W emulsions (pH 7) stabilised
with 2 % NaCas. Sun and Gunasekaran (2009) observed less oxidative stability (lipid
hydroperoxides and anisidine values were determined) at the lowest oil content in WPI-
stabilised menhaden O/W emulsions (pH 6.7−7.0; oil contents: 40, 20 and 5 %; WPI
contents: 2.0, 1.0 and 0.2 % ), but there was no consistent link between oil content and
oxidative stability. Other factors such as droplet size, surface charge, creaming stability
and viscosity were also influenced by changes in the oil content. Sun and Gunasekaran
(2009) referred to other studies in which safflower O/W emulsions (Sims et al. 1979)
and canola O/W emulsions (Osborn and Akoh 2004) had less oxidative stability at
lower oil contents. Some possible explanations for the influence of the oil content were
given. The number of radicals generated per droplet may be higher at low oil contents as
the concentration of oil droplets is lower, leading to more lipid oxidation (McClements
and Decker 2000; Osborn and Akoh 2004). The droplet surface may be less covered
with surfactant at high oil contents and thus pro-oxidants may interact more easily with
the oil phase, leading to more lipid oxidation (Sun and Gunasekaran 2009).
2.6.7 Droplet size
The droplet size is another physical characteristic of O/W emulsions that influences
their oxidative stability. Controversial results for the effect of the droplet size have been
obtained.
Lethuaut et al. (2002) reported that bovine-serum-albumin-stabilised sunflower O/W
emulsions with different droplet sizes showed the trend of more oxidative stability at
larger droplet sizes (0.5, 1.9, 27 µm), by measuring the oxygen uptake and the
conjugated diene formation in emulsions stored in closed containers. Hexanal was also
measured but no differences with varying droplet size were found. The differences in
oxidative stability were observed for the first stage of storage when oxygen was not
limiting. It was assumed that the hydroperoxide decomposition and the transfer of
decomposition products into the continuous phase were independent of the droplet size.
Lipid hydroperoxide decomposition possibly depended on the lipid hydroperoxide

Chapter 2: Literature review 30
concentration. More lipid oxidation in smaller droplets was attributed to a larger droplet
surface area and thus better access for pro-oxidants to the interface and the oil phase. As
bovine serum albumin could probably also better interact with the droplet surface, this
may have partly offset the pro-oxidative effect.
Gohtani et al. (1999) found greater oxidative stability for larger droplet sized
decaglycerin-monostearate-stabilised DHA emulsions (droplet sizes: 6.4, 3.4 µm), when
the peroxide development was followed. It was speculated that the effect of a larger
droplet surface area in emulsions with smaller droplet size led to more oxidation.
In a study of Jacobsen et al. (2000), the oxidative stability of fish-oil-enriched
mayonnaises with a larger mean droplet size was higher in the early stage of storage (20
°C). Fewer free radicals, lipid hydroperoxides and volatiles were generated. After 3−4
weeks, no difference was found and the authors concluded that, in the state of
propagation, the oxidation was independent of the droplet size. Mayonnaise with small
droplets showed greater gel strength. In the initiation stage of lipid oxidation, the
contact of phosvitin (major protein of egg yolk serving as the emulsifier) with a larger
interfacial area might have been a pro-oxidative factor. Phosvitin has a high content of
iron, which is mostly bound to phosphoserine groups. Iron might have been partly
released and enhanced lipid oxidation. At a later stage, similar or even faster oxidation
occurred in large droplets, which was attributed to a greater oil volume in which free
radical chain reactions could take place more unhindered. As more creaming occurred
with the larger droplet size after advanced storage time, it was also speculated that a
better exposure of the cream phase to oxygen could have led to more lipid oxidation.
In a study of Rampon et al. (2001), bovine-serum-albumin-stabilised sunflower O/W
emulsions of two mean droplet sizes (d32: 1.20, 0.36 µm) were produced. They were
incubated at 37 and 47 ˚C. After 15 days, a stronger fluorescence (emission at 425 nm),
indicating reactions between the protein and lipid oxidation products, was observed in
the small droplet sized emulsion for both incubation temperatures. For lipid
hydroperoxide and pentane production, no difference was found for the two droplet
sizes. The stronger fluorescence was attributed to a larger interfacial area, enabling

Chapter 2: Literature review 31
more interaction between oxidising lipids and the amino groups (e.g. in lysyl residues)
of bovine serum albumin.
Nakaya et al. (2005) reported higher lipid hydroperoxide and hexanal levels as well as
lower residual oxygen concentrations in cod liver or soybean O/W emulsions stabilised
with sucrose lauryl ester or decaglycerol lauryl ester at larger droplet sizes. They offered
two hypotheses for the findings. Firstly, at a smaller droplet size, the concentration of
oxidisable lipid per droplet was lower and the ratio of surfactant to oxidisable lipid per
droplet was higher. This affected the oxidation process. Secondly, the hydrophobic tails
of the surfactants would have reached further into the interior of smaller droplets
because of a smaller droplet diameter and may have affected the free movement of the
oxidisable triacylglycerols, thereby limiting the free radical chain reactions. This was
called a “wedge effect”. The decreased mobility of oxidisable lipid was shown by 1H-
NMR (nuclear magnetic resonance) with motional spin−spin relaxation times of protons
in acyl residues. The motional frequency was shorter in small droplet sized emulsions.
In larger droplets, in contrast, the autoxidation in the droplet core was not hindered by
the hydrophobic tails of surfactants as they were located only near the interface.
In O/W emulsions based on methyl linoleate and decaglycerol monolaurate, small
droplets also gave better oxidative stability. The authors explained the finding by the
above-described “wedge effect” (Imai et al. 2008).
In a study of Let et al. (2007b), fish oil was homogenised with milk at 50 and 72 ˚C.
Smaller droplets were created by homogenising at 72 ˚C than at 50 ˚C. Also, in
emulsions with smaller droplet sizes, fewer lipid hydroperoxides and volatile oxidation
products developed. However, the effect of greater oxidative stability could not be
directly attributed to the droplet size as the conformation of some milk proteins, in
particular β-lactoglobulin, changes at temperatures ≥ 65 ˚C. This creates different
characteristics in adsorption and also exposes sulfhydryl groups with free-radical-
scavenging activity, which were previously buried in the interior of the protein
structure. The researchers attributed the greater oxidative stability to a better interaction
of those groups with oxidisable lipid.

Chapter 2: Literature review 32
Kiokias et al. (2006) produced cotton seed O/W emulsions emulsified with NaCas at
various concentrations. An increasing NaCas concentration led to decreasing droplet
size (d32 = 3.04 µm (0.5 % NaCas), d32 = 2.32 µm (1 % NaCas), d32 = 1.40 µm (2%
NaCas)) and also greater oxidative stability as fewer conjugated dienes were generated.
Greater oxidative stability was attributed to a larger interfacial area in which NaCas
could interact with the oxidisable lipid and deploy antioxidative effects. However,
whether smaller droplet sizes actually contributed to less oxidative stability could not be
ruled out, with the increasing protein concentration more than offsetting this influence.
In other studies, the variation of the droplet size of emulsions did not influence the
oxidative stability (Kiokias et al. 2007; Kiokias et al. 2006; Osborn and Akoh 2004;
Ponginebbi et al. 1999; Roozen et al. 1994; Shimada et al. 1996).
2.6.8 Retention of volatiles
Secondary lipid oxidation products affect the flavour quality of O/W emulsions. Once
the compounds are formed in the interior of a droplet or at the interface, they still need
to migrate to the continuous phase and from there pass into the air phase to cause the
off-flavour sensation. Shen et al. (2007) gave an overview of interactions between
flavour compounds and proteins. Flavour retention has been observed in aqueous
solutions and emulsions as a result of the interactions between proteins and flavour
compounds. Hydrophobic interactions, and also covalent binding, in particular with
aldehydes, between proteins and aldehydes, ketones, esters and lactones were found. In
one study, the binding of butanal and hexanal to whey protein increased markedly with
an increase in the pH from 6 to 9 (Weel et al. 2003). An increase in the pH in protein-
based emulsions may therefore increase the lipid oxidation rate because of an anionic
droplet surface that attracts pro-oxidative metal ions, but a stronger retention of
secondary oxidation products may partly reduce the negative influence on the flavour
quality.
Chapter 2: Literature review 33
2.7 Antioxidative influence of milk proteins in O/W emulsions and similar systems
2.7.1 General findings
Taylor and Richardson (1980b) found that the addition of skim milk to a methyl
linoleate emulsion improved its oxidative stability. To determine the contribution of
caseins and whey proteins to the oxidative stability, solutions of single proteins of
concentration equal to that in skim milk were produced and added to the linoleate
emulsion (pH 6.7). The proteins showed decreasing antioxidative behaviour in the order
β-casein (2.40) > κ-casein (2.20) > αs-casein (1.81) > α-lactalbumin (1.20) > β-
lactoglobulin (1.11) (the numbers indicate the relative effectiveness). Therefore, the
caseins exhibited greater antioxidative potential than the whey proteins.
In a study of Diaz et al. (2003), Brij-35-stabilised corn O/W emulsions (pH 3 and pH 7)
were fortified with caseinophosphopeptides (CPPs) from a tryptic digest of casein,
which resulted in reduced lipid hydroperoxide and hexanal generation at both pH
conditions. In phosphatidylcholine liposome systems (pH 7), the addition of CPPs and
casein hydrolysates reduced the production of TBARS (Diaz and Decker 2004).
Various whey proteins or protein fractions showed antioxidative activity (inhibition of
lipid hydroperoxide and propanal production) when they were used to stabilise O/W
emulsions (pH 3) (Hu et al. 2003a). The oxidative stability decreased in the order β-
lactoglobulin ≥ sweet whey > α-lactalbumin ≥ WPI.
In corn O/W emulsions (pH 3), stabilised by NaCas, WPI or soy protein isolate, the
oxidative stability (measured by lipid hydroperoxides and hexanal) decreased in the
following order: NaCas > WPI > soy protein isolate. Emulsions of two protein
concentrations (0.5 and 1.5 %) were prepared. A similar lipid oxidation rate was found
at both protein levels, with partly even higher values at the higher protein concentration.
In NaCas emulsions, the hexanal lag time was twice as long at the 1.5 % protein level as
at the 0.5 % protein level (Hu et al. 2003b).

Chapter 2: Literature review 34
In a study of Djordjevic et al. (2004), NaCas gave better protection than WPI towards
lipid hydroperoxide generation, when the proteins were used to stabilise algal O/W
emulsions (pH 3). The generation of propanal was not significantly different in either
emulsion type.
Allen and Wrieden (1982) produced triolein or sunflower O/W emulsions (pH 6.8)
stabilised with lysophosphatidylcholine. When casein or whey protein was added to the
emulsions, greater oxidative stability was achieved with casein, measured by oxygen
consumption and the generation of TBARS. α-Lactalbumin also showed some
antioxidative activity when added to the emulsion.
In a study of Kiokias et al. (2006), cottonseed O/W emulsions (pH 7) were prepared
with 1 % whey protein concentrate (WPC), NaCas or Tween 20. Conjugated diene
production decreased in the order Tween 20 (176 % increase after 10 days) > NaCas (53
% increase after 10 days) > WPC (29 % increase after 10 days). WPC gave the greatest
oxidative stability. Furthermore, NaCas was used to emulsify cottonseed O/W
emulsions at levels of 0.5, 1 and 2 %. Conjugated diene production decreased in the
order 0.5 % (99 % increase after 10 days) > 1 % (53 % increase after 10 days) > 2 %
(25 % increase after 10 days). An increase in the NaCas concentration clearly increased
the oxidative stability.
Casein, β-lactoglobulin or lactoferrin was added to a system with multilamellar vesicles
consisting of dipalmitoylphosphatidylcholine and arachidonic acid. Ferrous iron and
ascorbate were also added to promote oxidation. Casein showed the greatest inhibitive
effect towards TBARS production. The induction periods decreased as follows: casein
(20 min) > lactoferrin (10 min) > β-lactoglobulin (7 min) > control without protein (5
min) (Cervato et al. 1999).
In a study of Sun and Gunasekaran (2009), menhaden O/W emulsions (pH 6.7−7.0)
were prepared with WPI at protein concentrations of 0.2, 1.0 and 2.0 %. More lipid
hydroperoxides and secondary lipid oxidation products developed at low WPI
concentrations.

Chapter 2: Literature review 35
2.7.2 Influence of continuous phase protein on oxidative stability
Faraji et al. (2004) found that the lipid hydroperoxide production decreased in a WPI-
stabilised menhaden O/W emulsion (pH 7) when the protein concentration was
increased. The WPI levels were 0.25, 0.5, 1.0 and 1.5 %. More lipid hydroperoxides
were generated in these emulsions when the continuous phase was substituted with
buffer solution containing no protein. The measured continuous phase protein
concentration was higher with increasing initial protein concentration, used to prepare
the emulsions. The order of oxidative stability remained the same as in the original
emulsions without continuous phase replacement. In contrast, a menhaden O/W
emulsion stabilised with 1 % WPI at pH 3 showed slightly lower lipid hydroperoxide
and propanal levels when the continuous phase was replaced with protein-free buffer
solution. Therefore, the presence of WPI in the continuous phase only appeared to
contribute to oxidative stability at neutral pH. Firstly, the researchers suggested that the
removal of continuous phase protein was in particular pro-oxidative at neutral pH above
the isoelectric point as the continuous phase proteins had a net negative surface charge
and might have been able to chelate metal ions from the interface or the oil phase.
Secondly, it was suggested that low molecular weight compounds of WPI, which were
active only at neutral pH but not at pH 3, might have been present in the continuous
phase. The removal of continuous phase protein thus led to different effects at the two
pH conditions. In the same study, the continuous phase of a WPI-stabilised menhaden
O/W emulsion (pH 7) was replaced with solutions of NaCas, soy protein isolate or WPI.
The oxidative stability (measured by lipid hydroperoxides and propanal) decreased in
the order: soy protein isolate > NaCas > WPI.
Elias et al. (2005) produced Brij-35-stabilised menhaden O/W emulsions (pH 7) and
replaced the continuous phase with β-lactoglobulin solution at levels of 250 or 750
µg/ml emulsion or buffer solution. Lipid hydroperoxide and TBARS generation was
effectively reduced with increasing continuous phase levels of β-lactoglobulin. In a
subsequent study by Elias et al. (2007), the same emulsion system was used. The
continuous phase was again substituted with β-lactoglobulin solution, with final protein
levels of 0, 50 and 500 µg/g oil in the emulsion. The production of lipid hydroperoxides
and TBARS decreased with increasing level of continuous phase protein.

Chapter 2: Literature review 36
Buffer solution or a high molecular weight fraction of acid whey (molecular weight ≥
3500) was added to a Tween-20-stabilised salmon O/W emulsion (pH 7) at various
levels (700, 1400, 4900 and 9800 µg/ml emulsion). Increasing continuous phase protein
levels led to a decrease in lipid hydroperoxide and TBARS generation (Tong et al.
2000b). In a similar study of Tong et al. (2000a), when the same emulsion system was
used, dilution with various acid whey fractions also lowered lipid hydroperoxide and
TBARS generation. The oxidative stability decreased in the following order: addition of
whole whey > addition of high molecular weight fraction (≥ 3500) of whey > addition
of low molecular weight fraction (≤ 3000) of whey > addition of buffer solution.
In a study of Donnelly et al. (1998), increasing continuous phase levels of WPI
(0–1.0 %) led to increasing lipid hydroperoxide and TBARS levels in a Tween-20-
stabilised menhaden O/W emulsion (pH 7) when lipid oxidation was accelerated by iron
addition. An amount of Tween 20 such that there was no excess surfactant in the
continuous phase was used. The pro-oxidative influence of the whey proteins was
explained by several possible mechanisms: removal of antioxidants from the interface
by protein micelles, transfer of lipid peroxides to the continuous phase by protein
micelles increasing their exposure to pro-oxidants, and residual lipids in WPI possibly
exhibited a free radical source in combination with the higher iron level in the
continuous phase. The addition of WPI plus additional Tween 20 led to greater
oxidative stability. This was attributed to a greater exposure of free-radical-scavenging
or chelating amino acid residues, as Tween 20 may have denatured the whey proteins.
2.7.3 Influence of heat treatment of milk proteins on oxidative stability
In a study of Tong et al. (2000a), a high molecular weight fraction of raw whey
(molecular weight ≥ 3500) was heated at room temperature (control sample), 60, 70, 80
or 90 ˚C for 15 min. The samples were added to Tween-20-stabilised salmon O/W
emulsions (pH 7) to test their influence on oxidative stability. When the control sample
was added, slightly higher lipid hydroperoxide and TBARS levels were measured.
When the sample heated at 60 ˚C was added, a clearly higher TBARS level and a
slightly higher lipid hydroperoxide level were measured. In contrast, the heat treatments

Chapter 2: Literature review 37
at both 80 and 90 ˚C led to a considerable and similar decrease in lipid hydroperoxide
and TBARS levels. The effect of heat treatment at 70 ˚C was not tested.
More aromatic amino acid residues (tyrosyl, phenylalanyl, tryptophan) and free
sulfhydryl groups became exposed with increasing heating temperature of the solutions,
indicating unfolding of the protein. The free sulfhydryl concentration decreased again at
90 ˚C, as sulfhydryl groups possibly oxidised under these conditions. The total
sulfhydryl concentration decreased with increasing heating temperature. The
antioxidative influence of the solutions heated at 80 and 90 ˚C in the emulsion was
attributed to the greater exposure of free-radical-scavenging amino acid residues
(aromatic residues and free sulfhydryl groups), whereas the pro-oxidative influence
found for the sample treated at 60 ˚C and the control could not be explained (Tong et al.
2000a).
In a study of Elias et al. (2007), the continuous phase of a Brij-35-stabilised menhaden
O/W emulsion (pH 7) was replaced with β-lactoglobulin solution that had been heated
at various temperatures (95, 70, 50 and control 20 °C) for 15 min. During the storage
period of the emulsions, the lipid hydroperoxide and TBARS levels were nearly 90 %
lower in the emulsion with the 95 °C sample (after one week), whereas the addition of
the other two heat-treated samples did not significantly inhibit lipid oxidation compared
with the 20 °C sample. β-Lactoglobulin exhibited ferric-iron-binding activity after all
heat treatments but it was similar for the native protein and when heated at 70 ˚C (500
µmol/mg protein), slightly higher for the protein heated at 50 ˚C (550 µmol/mg protein)
and lowest for the protein heated at 95 ˚C (300 µmol/mg protein). A maximum
concentration of free sulfhydryls was found at 70 °C and a minimum was found at 95
°C. The tryptophan fluorescence increased with increasing heating temperature,
indicating that more tryptophan residues became exposed. The free-radical-scavenging
ability of β-lactoglobulin towards radicals from the radical-generating azo compound
2,2’-azobis(2-amidinopropane) dihydrochloride (AAPH) clearly improved with
increasing heating temperature. It was suggested that the increased oxidative stability of
the 95 °C sample could have been due to a greater exposure of free-radical-scavenging
amino acid residues (e.g. tryptophan, tyrosine, phenylalanine or methionine) on β-
lactoglobulin and/or a greater interface contact of the protein because of increased

Chapter 2: Literature review 38
hydrophobicity, both leading to improved effectiveness of the free-radical-scavenging
process. This positive influence on the oxidative stability appeared to have outweighed
the negative influence of reduced metal chelation ability.
In a study of Taylor and Richardson (1980b), skim milk fractions of pH 6.7 (skim milk,
sweet whey, acid whey and casein) were heated at various temperatures (room
temperature, 70, 90, 110 and 130 ˚C) and added to a linoleate emulsion. The heat
treatments increased the oxidative stability of the emulsion. The free sulfhydryl
concentration increased and the total sulfhydryl concentration decreased through the
influence of elevated temperatures.
Kiokias et al. (2007) prepared WPC-stabilised sunflower O/W emulsions with 3 %
protein content (pH 6.78) at various temperatures, using solutions of WPC heated at 40,
60, 72, 75 and 85 °C. The solutions of the respective temperature were added to
sunflower oil, pre-emulsified by sonication in an ice bath and then further emulsified by
passing through a two-valve high pressure homogeniser. The researchers showed that
the oxidative stability of the emulsions (measured by conjugated diene hydroperoxides)
improved with increasing degree of β-lactoglobulin denaturation. An increased
exposure of sulfhydryl groups and aromatic amino acid residues as a result of protein
unfolding was thought to be partially responsible for the greater inhibition of lipid
oxidation.
A heat-treated (90 ˚C, 30 min) fraction of acid whey with a molecular weight below
5000 had basically the same antioxidative activity as without heating (activity before
heating: 100 %; activity after heating: 96−99 %). The samples were incorporated into a
phosphatidylcholine liposome system (pH 7) at a 20 % level and TBARS and lipid
hydroperoxides were determined as lipid oxidation indicators (Colbert and Decker
1991).
Chapter 2: Literature review 39
2.7.4 Influence of high and low molecular weight protein fractions, protein
hydrolysates and peptides on oxidative stability
Colbert and Decker (1991) tested acid whey for its antioxidative properties in a
phosphatidylcholine liposome system (pH 7), in which oxidation was promoted by
ferric iron plus ascorbic acid (generating ferrous iron). The inhibition of lipid
hydroperoxide and TBARS formation increased with increasing incorporation of whey
and reached a maximum at the highest whey concentration (20 %): 86 % lipid
hydroperoxide and 90 % TBARS inhibition. Whole whey was also fractionated
according to molecular weight and incorporated into the liposome system at a level
equivalent to 20 % whey. The antioxidative activity of the various fractions decreased in
the following way: whole whey (90 %) > molecular weight below 5000 (80 %) >
molecular weight above 6000 (18 %) > molecular weight below 500 (2 %). This
indicated great antioxidative activity for the molecular weight fraction between 500 and
5000. In the liposome system, the molecular weight < 5000 fraction and whey were also
compared for their antioxidative activity towards metmyoglobin plus hydrogen peroxide
(45−50 % inhibition) and soybean lipoxygenase plus linoleic acid (75 % inhibition with
the molecular weight < 5000 fraction and 92 % inhibition with whey). The molecular
weight < 5000 fraction of whey inhibited TBARS formation better with increasing pH
from pH 5 to pH 7.
In the study of Tong et al. (2000a), a Tween-20-stabilised salmon O/W emulsion (pH 7)
was diluted with various fractions of acid whey. Dilution with the low molecular weight
fraction of whey (molecular weight ≤ 3000) improved the oxidative stability towards
lipid hydroperoxide and TBARS formation compared with the control, but the
stabilising effect was greater for the high molecular weight fraction of whey (molecular
weight ≥ 3500) and was greatest for whole whey. The protein contents of the added
solutions were not equal. Whole whey was fractionated and therefore the protein
concentration of the various whey fractions probably decreased in the following order:
whole whey > high molecular weight fraction of whey > low molecular weight fraction
of whey. This order also mirrored the oxidative stability. The antioxidative activity was
attributed to whey proteins in the high molecular weight fraction and possibly to

Chapter 2: Literature review 40
peptides and amino acids in the low molecular weight fraction, as suggested by Colbert
and Decker (1991).
WPI was hydrolysed with pure enzymes (pepsin, trypsin, chymotrypsin and papain) or
commercial crude proteases (protease F, protease P or protease A). The hydrolysates
were added to a liposome system (pH 7) with ascorbic acid and ferric iron. The
hydrolysates obtained by treatment with the commercial proteases inhibited TBARS
formation (in particular protease F), but not the hydrolysates produced by the pure
enzymes. Protease F was noted as the only enzyme with exopeptidase activity,
producing single amino acids. A positive correlation between the degree of hydrolysis
and the antioxidative activity was found for only the hydrolysate produced by protease
P. A higher degree of hydrolysis, with increased peptide content, gave greater oxidative
stability (Pena-Ramos and Xiong 2001).
In a study of Diaz et al. (2003), casein, tryptic casein hydrolysate and a low molecular
weight fraction of tryptic casein hydrolysate (molecular weight ≤ 10000) were added to
a Brij-35-stabilised corn O/W emulsion (pH 7) to test their influence on oxidative
stability. They were added in quantities of equal nitrogen and phosphorus content. The
ability to inhibit lipid hydroperoxide and hexanal generation generally decreased in the
following order: low molecular weight casein hydrolysate > casein hydrolysate >
casein.
In a phosphatidylcholine liposome system (pH 7), in which oxidation was accelerated
with ferric iron plus ascorbic acid, enriched CPPs, tryptic casein hydrolysate or a low
molecular weight fraction of casein hydrolysate (molecular weight ≤ 10000) was added
on an equal nitrogen basis. Casein hydrolysate and low molecular weight casein
hydrolysate inhibited lipid oxidation (measured by TBARS) at low and high
incorporation levels, but CPPs inhibited lipid oxidation only at low concentrations (all
samples showed a similar inhibition). High incorporation levels of CPPs were pro-
oxidative. When oxidation was promoted by the addition of the free radical source
AAPH, lipid oxidation inhibition was greater at higher incorporation levels of the
respective fraction and generally decreased as follows: low molecular weight casein
hydrolysate > casein hydrolysate > enriched CPPs (Diaz and Decker 2004).

Chapter 2: Literature review 41
In a study of Let et al. (2007a), cod liver oil was incorporated into milk, yoghurt or
salad dressing (emulsified with denatured whey protein, acidic because of 5 % acetic
acid content). The fish oil either was incorporated directly with subsequent
emulsification or was added after pre-emulsification with a solution of denatured whey
protein. The pH conditions of these emulsions were pH 6.7 (milk), pH 4.4 (yoghurt) and
pH 4.0 (salad dressing). Lower levels of lipid hydroperoxides and off-flavour volatiles
developed in yoghurt and salad dressing than in milk. The lipid hydroperoxide
production was similar in yoghurt and salad dressing, but lower levels of off-flavour
compounds were produced in fish-oil-enriched yoghurt. Therefore, it was hypothesised
that metal ions were less available for the lipid oxidation process in the yoghurt (less
decomposition of lipid hydroperoxides into alkoxyl radicals). Furthermore, the
microbial activity in yoghurt was mentioned as a possible reason for the limited metal
availability. This would make sense from the point of view that, in yoghurt, lactic acid
bacteria produce peptides from milk proteins by protease activity (Renye and Somkuti
2008; Tzvetkova et al. 2007). Peptides derived from milk proteins had also exhibited
antioxidative activity in the previously mentioned studies (Diaz et al. 2003; Pena-
Ramos and Xiong 2001) and they have shown the ability to chelate metal ions in many
cases (discussed in the next section). The potential of yoghurt to give oxidative stability
to incorporated susceptible lipids has also been observed in other studies (Jacobsen et
al. 2006; Nielsen et al. 2007).
2.8 Antioxidative mechanisms of milk proteins, milk protein hydrolysates and peptides
Milk proteins and peptides have shown great potential to prevent lipid oxidation in O/W
emulsions and similar systems, e.g. with liposomes. The amphiphilic nature of proteins
prevents their solubility in the oil phase of emulsions but makes them available for
antioxidative mechanisms at the interface and in the continuous phase. Some of their
lipophilic moieties may reach from the interface into the oil phase. In the following, an
overview of the antioxidative mechanisms of proteins and peptides is given, with the
focus on milk proteins and derived materials.
Chapter 2: Literature review 42
2.8.1 Hydrophobicity
One characteristic that has been discussed is the hydrophobicity of proteins, peptides
and amino acids. The hydrophobicity of proteinaceous material is likely to influence its
contact to the lipid phase of an emulsion and would thereby influence the lipid
oxidation process.
In the study of Saiga et al. (2003), a peptide/amino acid mixture that stemmed from a
papain-generated protein hydrolysate contained in total more hydrophobic amino acids
than the corresponding peptide/amino acid mixture generated by actinase E. The papain-
generated mixture also showed a greater ability to inhibit lipid hydroperoxide formation
in a linolenic acid/Triton X-100 emulsion system.
Murase et al. (1993) investigated the antioxidative activity of histidine and carnosine
with attached long chain fatty acid moieties (oleate C 18:1, decanoate C 10:0). They
added the compounds to a mixture of methyl linoleate in hexane/2-propanol and also
incorporated them into phosphatidylcholine liposome membranes. In the solution
system, the antioxidative activity towards lipid hydroperoxide production was 20 %
higher for the N-C18:1-histidine than for the N-C10:0-histidine. The carnosine derivatives
exhibited a corresponding behaviour. N-C18:1-glycine showed no inhibition effect. In the
liposome system, carnosine showed only a slight TBARS inhibition when incorporated
into the membrane compared with its presence in the aqueous phase. The incorporation
of the more lipophilic derivatives into the membrane resulted in more TBARS
inhibition compared with carnosine and the inhibition was greater for N-C18:1-carnosine
than for N-C10:0-carnosine. The incorporation of C18:1/C10:0 histidine derivatives into the
membrane led to less TBARS generation than for the control without added compound,
but there was no difference between the two. N-C18:1-glycine showed the same TBARS
development as the control sample.
Chen et al. (1998) analysed the hydrophobicity of 22 histidine-, leucine- and proline-
containing peptides found in digests of soybean protein. The general composition but
not the position of amino acids in the peptide had an effect on the retention time on a
reversed-phase high performance liquid chromatography (HPLC) column. However, no

Chapter 2: Literature review 43
correlation between the hydrophobicity and the antioxidative behaviour of the peptides
was found when they were added to a linoleic acid/Triton X-100 emulsion system. The
oxygen consumption had been measured as a lipid oxidation indicator.
A specific antioxidative mechanism for the hydrophobic maize protein zein has been
reported. Its antioxidative function was attributed to the ability to bind to lipids
susceptible to oxidation and to bury them in the protein structure (Arcan and
Yemenicioglu 2007; Chiue et al. 1997).
2.8.2 Metal binding
The presence of pro-oxidative iron and copper ions is an important factor in the lipid
oxidation process. Milk proteins as well as other proteins and peptides thereof
contribute to the oxidative stability of O/W emulsions because of their ability to bind
metal ions. In general, the chelation ability of proteins, resulting in improved oxidative
stability, was found to be related to the reduction in the chemical reactivity of the metal
ions, the formation of insoluble metal complexes, the removal of metal ions from their
location in proximity to lipids and/or the blocking of reaction sites at which metals and
lipids could interact (Diaz et al. 2003; Elias et al. 2007).
Phosphorylated serine residues exist in caseins. They are present in hydrophilic domains
of αs1-, αs2- and β-caseins. Certain sequences of the primary structure, such as -SerP-
SerP-SerP-Glu-Glu-, exhibit particularly good chelating capacity towards iron, copper,
zinc and calcium ions (Baumy and Brule 1988; Bennett et al. 2000; Kitts 2005). The
-SerP-SerP-SerP-Glu-Glu- sequence is present in β-casein-4P (1−25), αs1-casein-5P
(59−79), αs2-casein-4P (1−21) and αs2-casein-4P (46−70) (Kitts 2005). In general, the
numbers of phosphoseryl residues per molecule of casein are 7−9 (αs1-casein), 5 (β-
casein), 10−13 (αs2-casein) and 1−2 (κ-casein) (Leonil et al. 1995).
Unlike caseins, whey proteins have no phosphoseryl residues but other metal-binding
mechanisms exist, such as the involvement of carboxyl groups (Vegarud et al. 2000),
present in aspartic and glutamic acid residues. For example, Shears et al. (1987) showed

Chapter 2: Literature review 44
that iron was complexed by carboxyl groups in a bovine serum albumin digest. Elias et
al. (2008) attributed the metal chelation abilities of proteins to residues of histidine,
glutamic acid and aspartic acid. Arcan and Yemenicioglu (2007) mentioned chelating
properties for acidic (aspartate and glutamate) and basic (lysine and arginine) amino
acid residues (Rajapakse et al. 2005; Saiga et al. 2003) as well as histidinyl residues (Je
et al. 2005; Rajapakse et al. 2005). Because of the general presence of these amino acid
residues in proteins, proteins would generally be able to chelate metal ions to a certain
degree. For caseins, the chelating properties of phosphoseryl residues add to these
features.
The metal-binding abilities of whey proteins were summarised in a review by Vegarud
et al. (2000). Iron and/or copper binding to α-lactalbumin (Baumy and Brule 1988; Hirai
et al. 1992; Svenning and Vegarud 1998), bovine serum albumin (Mossini and Feather
1998; Nagasako et al. 1993), β-lactoglobulin (Baumy and Brule 1988; Svenning and
Vegarud 1998) and lactoferrin (Feng et al. 1995; Nagasako et al. 1993) was reported.
Svenning and Vegarud (1998) found iron chelation activity for α-lactalbumin and β-
lactoglobulin. Hydrolysis of the proteins yielded peptides with greater iron chelation
activity.
Kim et al. (2007b) looked at the binding ability of WPC and WPC hydrolysates for
ferrous iron. The hydrolysates were produced using several proteolytic enzymes
(alcalase, esperase, flavourzyme, neutrase, pancreatin, papain, pepsin, trypsin and a
protease from Bacillus stearothermophilus). A high iron-binding capacity between 72 %
(WPC) and up to 98 % (alcalase-generated hydrolysate) was found in solutions with 5
% protein or hydrolysate and 0.1 % ferrous sulfate. Pancreatin-generated hydrolysate
exhibited the lowest iron-binding activity amongst the hydrolysates. After 240 min
hydrolysis time, WPC treated with pancreatin had the highest degree of hydrolysis (13.9
%) and WPC treated with alcalase had the second highest (13.6 %). The lowest degree
of hydrolysis was 7.5 % (with papain). Therefore, the degree of hydrolysis (according to
the concentration of primary amines (Adler-Nissen 1979)) seemed not to be the most
influential factor for ferrous iron binding. In contrast, in the alcalase-generated
hydrolysate, bovine serum albumin, β-lactoglobulin and α-lactalbumin were the most
hydrolysed compared with the other hydrolysates (measured by tricine SDS

Chapter 2: Literature review 45
polyacrylamide gel electrophoresis). Furthermore, it was pointed out that a main
fraction of the alcalase hydrolysate had a higher content of lysine, histidine and
phenylalanine than WPC. The authors finally attributed the various iron-binding
abilities to differences in the amino acid types (Doucet et al. 2003) and the net charge
and length of the peptides (Chaud et al. 2002).
Lactoferrin inhibited lipid oxidation in soybean-lecithin-stabilised corn O/W emulsions,
but was partially pro-oxidative in lecithin liposome systems (both pH 6.6). In the
emulsion systems, lactoferrin inhibited lipid oxidation promoted with ferrous iron. Lipid
oxidation was more promoted by the addition of copper (II) than ferrous iron and
lactoferrin did not reduce the pro-oxidative effect of copper. The findings pointed to the
ability of lactoferrin to bind iron and to inactivate it for redox reactions. Furthermore,
lactoferrin either did not chelate cupric ions or copper−lactoferrin complexes might still
have been pro-oxidative (Huang et al. 1999). Smith et al. (1994) had found that cupric
ions bound to the same sites as ferric iron. In a study of Nielsen et al. (2004), lactoferrin
showed antioxidative activity up to 8 µmol/l in mayonnaise and 12 µmol/l in milk, but
was pro-oxidative at higher incorporation levels.
Phillipe et al. (2005) gave an overview of the metal-binding abilities of casein and
casein fractions. Iron binding to CPP (1−25) from β-casein (Bouhallab et al. 1991;
Gaucheron et al. 1995), ferric iron binding to αs1-casein (Reddy and Mahoney 1991a;
Reddy and Mahoney 1991b) and ferrous iron binding to NaCas (Gaucheron et al. 1996)
were reported. Vegarud et al. (2000) referred to findings about iron and/or copper
binding to peptides derived from β-casein and αs1-casein (Baumy and Brule 1988;
Bouhallab et al. 1991; Gaucheron et al. 1996).
Gallaher et al. (2005) added water or milk (skim milk, 2 % milk fat milk or whole milk)
to Tween-20-stabilised algal O/W emulsions (pH 7) with ferric iron. The addition of
milk greatly reduced the lipid oxidation rate. The authors attributed the effect to iron-
binding activity, mostly caused by casein as a main constituent of milk that had
previously exhibited strong metal-binding activity (Diaz et al. 2003; Hegenauer et al.
1979c). Gaucheron et al. (1997b) observed iron binding mainly for αs1-casein, but not
for αs2-casein, β-casein, β-lactoglobulin or α-lactalbumin, when skim milk was
Chapter 2: Literature review 46
supplemented with ferrous iron and ferric iron (reversed-phase HPLC analysis
combined with photospectrometry). However, when skim milk was ultracentrifuged to
remove casein micelles, 7.8−11 % of supplemented iron was found in the whey protein
fraction. When skim milk was ultrafiltered to separate whey proteins and caseins from
low molecular weight compounds, 3.1−5.6 % of supplemented iron was found in the
low molecular weight fraction (atomic absorption spectrometry). The studies of Baumy
and Brule (1988) and Nagasako et al. (1993), who found iron binding to the whey
proteins α-lactalbumin, β-lactoglobulin and lactoferrin, were referred to. The following
compounds were suggested to possibly have bound iron in the low molecular weight
fraction: citrate, organic and inorganic phosphate, lactose (Bachran and Bernhard 1980),
orotic acid and sulfur-containing compounds.
Faraji et al. (2004) determined the chelating ability of NaCas, WPI and soy protein
isolate for ferric iron at pH 7. The iron-binding capacity decreased in the order:
NaCas > soy protein isolate > WPI.
Emery (1992) showed that casein supported the oxidation of ferrous iron to ferric iron
in aqueous solution (pH 6.5) and that casein bound strongly to ferric iron. The binding
of ferric iron to casein was evident as the metal could be recovered quantitatively after
isoelectric precipitation. Under the same aerobic conditions without casein, the ferrous
iron concentration hardly decreased. It was shown that the iron-binding activity
increased with increasing levels of α-casein. Partially dephosphorylated casein exhibited
a much lower iron-binding ability, which pointed to the importance of phosphorylated
serine residues for the chelation activity of casein. Similar observations were made by
Hegenauer et al. (1979b), who also found ferrous iron oxidation promoted by caseins
and the binding of ferric iron to caseins. Manson and Cannon (1978) reported the
reaction of αs1-casein and β-casein with ferrous iron in the presence of oxygen.
Cervato et al. (1999) observed a correlation between the phosphoseryl content (α- > β- >
κ-casein) of casein fractions and their antioxidative activity towards TBARS formation
in a liposome system containing arachidonic acid (pH 7.4). It was also found that
dephosphorylation only partially restricted the antioxidative activity of these fractions,
pointing to the existence of other chelation or antioxidative mechanisms. Furthermore,

Chapter 2: Literature review 47
orthophosphate and phosphoserine were also added to the liposome system. Both
inhibited TBARS formation to some degree, with phosphate showing a moderately
better inhibition, but the phosphorylated caseins had a much greater antioxidative
capacity. The antioxidative influence of phosphate and phosphoserine was probably due
to their chelation ability. Also, Diaz et al. (2003) looked at the importance of
phosphoseryl groups for the antioxidative activity of caseins. They added several casein
fractions with equal phosphorus content to a Brij-35-stabilised corn O/W emulsion
(pH 7) and followed the development of lipid hydroperoxides and hexanal. Hydrolysate
of low molecular weight casein inhibited lipid oxidation the most of all fractions,
followed by casein hydrolysate, casein and finally enriched CPPs (containing 86 %
CPPs). When the fractions were added on the basis of equal nitrogen content, only the
order of casein and CPPs was changed. The results suggested that the content of
phosphoseryl residues was not the most important antioxidative factor and that other
protection mechanisms must have existed.
In a study of Rival et al. (2001a), β-casein showed the greatest chelation activity
towards ferrous iron, followed by casein. Dephosphorylation of β-casein markedly
reduced its chelation activity. Other casein fractions (κ-casein and dephosphorylated α-
casein) and bovine serum albumin had a similar and lower chelation activity compared
with β-casein. The chelation activity considerably increased (except for β-casein) upon
hydrolysis with various proteolytic enzymes (trypsin, subtilisin and clostripain) and
reached a similar level for the various fractions. The compounds were tested for their
antioxidative activity in a linoleic acid/Triton X-100 emulsion (pH 7) with the free
radical source AAPH (oxygen uptake measured). The addition of dephosphorylated
casein and β-casein caused a greater inhibition of lipid oxidation than the addition of the
respective untreated fraction. Bovine serum albumin showed a similar antioxidative
activity to the caseins. Protein hydrolysis generally increased the antioxidative activity
(four out of five samples), but this also seemed to depend on the protease.
In a study of Kim et al. (2007a), CPPs were isolated from NaCas hydrolysate produced
by alcalase. The CPPs were aggregated by calcium chloride addition under different pH
conditions (from pH 3 to pH 8) and were precipitated with ethanol. The fraction
produced at pH 3 chelated ferrous iron the least effectively. It also had a lower glutamic

Chapter 2: Literature review 48
acid, phosphorus and serine content than the other fractions. It was suggested that a
lower level of phosphoseryl and glutamic acid residues might have affected the
chelation ability. Furthermore, it was observed that the reducing capacity for Cu2+ to
Cu+ was different for the various CPP fractions. Increasing pH yielded fractions with a
lower Cu2+ reducing capacity.
Tong et al. (2000b) found that whey proteins in the continuous phase of a bovine-
serum-albumin-stabilised hexadecane O/W emulsion were able to chelate and remove
pro-oxidative ferrous iron from the interface at neutral pH. Also Faraji et al. (2004)
suggested this as an antioxidative mechanism of proteins in the continuous phase. Hu et
al. (2003b) pointed out that, for whey proteins, this mechanism might be impaired at pH
3 because of their net positive surface charge, whereas caseins are probably still able to
chelate metal ions and remove them into the continuous phase at pH 3 as phosphoseryl
groups are negatively charged at low pH (Gaucheron et al. 1996). Other findings would
support this suggestion, as the binding of iron to caseins has been reported to be
independent of the pH between pH 2.5 and pH 8.0 (Baumy and Brule 1988; Diaz et al.
2003; Gaucheron et al. 1996; Gaucheron et al. 1997a; Hekmat and McMahon 1998).
Gaucheron et al. (1997a) studied the binding of ferric iron and Cu2+ ions to NaCas. The
binding of iron, but not the binding of copper, was apparently independent of the pH. In
general, decreasing pH leads to the release of more metal ions from proteins as H+ or
H3O+ ions compete for cation-binding sites (Diaz et al. 2003). For example, Katz et al.
(1980) showed that the binding ability of bovine serum albumin for Cu2+ ions increased
from pH 5.3 to pH 7.4.
In a study of Villiere et al. (2005), bovine serum albumin and NaCas were tested for
their capacity to bind ferrous iron in aqueous solutions (pH 6.5; 1 g/l protein content).
All ferrous iron was retained by NaCas up to the maximum dose of 5.2 mg/l. Bovine
serum albumin retained basically all ferrous iron at the lowest dosage of 0.7 mg/l, but
the uptake levelled off at a maximum of 1.4 mg/l at higher iron levels. In sunflower
O/W emulsions (pH 6.8 at the beginning and pH 6.1 at the end of storage), prepared
with the respective protein (1.4 % protein concentration), moderately less oxygen was
consumed and conjugated dienes were generated in the bovine serum albumin emulsion,
up to 30 h of storage at 50 ˚C. Thereafter, both oxidation indicators showed the same
Chapter 2: Literature review 49
development in either emulsion type. Zeta-potential measurements showed that droplets
stabilised with caseins had a more negative surface charge (−80 mV) than droplets
stabilised with bovine serum albumin (−20 mV). When EDTA was incorporated into the
emulsions (100 µmol EDTA/l), which had been added to the protein solutions before
emulsification, the steep rise in oxygen uptake was generally delayed (after 8 h without
EDTA). A much later rise in oxygen uptake was observed in the NaCas emulsion (after
52 h) than in the bovine serum albumin emulsion (after 16 h) with EDTA. The iron
concentration in the emulsions, considering only iron incorporated by the proteins, was
2.27 µmol/l (bovine serum albumin emulsion) and 1.34 µmol/l (NaCas emulsion).
These findings showed that caseins had a greater binding capacity for pro-oxidative
ferrous iron than the whey protein bovine serum albumin. In this case, a greater metal-
binding ability may have led to the slightly greater lipid oxidation rate in the emulsions.
The droplet surface charge in the NaCas emulsion was more negative (compared with
the bovine serum albumin emulsion), which could have resulted in a higher
concentration of pro-oxidative metal ions at the interface, leading to more lipid
oxidation. The authors suggested that the addition of NaCas solution after
emulsification might have improved the oxidative stability, as caseins could then have
removed detrimental metal ions away from the interface into the continuous phase.
When pro-oxidative metal ions were sequestered by EDTA, NaCas was considerably
more antioxidative than bovine serum albumin. According to the authors (Villiere et al.
2005), this might have been due to a greater free-radical-scavenging activity of the
caseins on the interface.
Decker et al. (2001) tested carnosine (β-alanylhistidine) and its constituent amino acid
histidine for their antioxidative properties in an LDL system, in which oxidation was
promoted by cupric ions. Both compounds had an antioxidative influence. In the same
system, when oxidation was promoted by free radicals from AAPH, they showed only a
minor antioxidative activity. This indicated that copper-chelating and not free-radical-
scavenging activity was their main antioxidative mechanism.
Chan and Decker (1994) showed that carnosine−metal chelates scavenged superoxide
radicals. It was concluded that simply chelating and thereby keeping metal ions away

Chapter 2: Literature review 50
from lipids in an O/W emulsion is only one aspect of the antioxidative influence of
chelation. In addition, the chelates themselves could have pro- or antioxidative
character.
In most studies that looked at the antioxidative influence of milk proteins and derived
peptides in O/W emulsions or similar systems (Section 0), metal chelation was referred
to as an important antioxidative mechanism of the proteinaceous material. Chelation
was mentioned in 13 articles and chelation abilities were examined in five articles.
2.8.3 Free-radical-scavenging ability
Free-radical-mediated reactions are a substantial element of lipid autoxidation.
Extensive research has been conducted to replace synthetic primary antioxidants with
free-radical-scavenging activity (e.g. butylated hydroxyanisole (BHA) and butylated
hydroxytoluene (BHT)) with natural compounds that are in accordance with consumer
preferences. Proteins and peptides from many animal and plant sources (e.g. bovine
milk, porcine, eggs, fish, soy, legumes, cereals etc.) have been studied and there is great
evidence for their free-radical-scavenging capacities. The ability to scavenge free
radicals derives from their constituent amino acids, such as cysteine, tyrosine,
tryptophan, phenylalanine and histidine (Arcan and Yemenicioglu 2007; Moure et al.
2006). However, it was found that amino acid residues alone did not account for the
whole free-radical-scavenging activity of peptides (Hernandez-Ledesma et al. 2005). In
the following, the free-radical-scavenging abilities of milk proteins, milk protein
hydrolysates and peptides are reported.
Diaz and Decker (2004) studied the ability of enriched CPPs, tryptic casein hydrolysate
or low molecular weight casein hydrolysate (molecular weight ≤ 10000) to inhibit
TBARS formation in a phosphatidylcholine liposome system (pH 7) with the free
radical source AAPH. Furthermore, they investigated the ability of the three fractions to
scavenge free radicals derived from AAPH in aqueous solution (pH 7). The
antioxidative activity in the liposome system corresponded with the free-radical-

Chapter 2: Literature review 51
scavenging activity and decreased in the following order: low molecular weight casein
hydrolysate > casein hydrolysate > CPPs.
In a study of Rival et al. (2001a), caseins, casein hydrolysates (produced with the
proteolytic enzymes trypsin, subtilisin and clostripain) and bovine serum albumin
exhibited AAPH-radical-scavenging activity, as indicated by reduced oxygen uptake in
a linoleic acid/Triton X-100 emulsion system (pH 7.0). The tested compounds were in
detail: casein, dephosphorylated casein, β-casein, dephosphorylated β-casein,
dephosphorylated α-casein, κ-casein and bovine serum albumin. Dephosphorylated
casein and β-casein were more antioxidative than the respective native protein. In
general, the antioxidative activity (for four out of five samples) increased upon
hydrolysis.
In a test system containing linoleic acid and soy bean lipoxygenase in aqueous solution
(pH 9.0), these protein fractions were also antioxidative and may have scavenged free
radicals (the mechanism of lipoxygenase-induced oxidation was mentioned to include
carbon- and oxygen-centred radicals). The effect of hydrolysis on the antioxidative
activity was very variable and depended on the enzyme and the protein.
Dephosphorylated fractions seemed to have a lower antioxidative activity (Rival et al.
2001a).
In another test, all protein fractions showed free-radical-scavenging activity in a system
with linoleic acid hydroperoxides and haemoglobin (pH 9.0). Linoleic acid
hydroperoxide and haemoglobin react with each other, generating a haemoglobin-
derived peroxyl radical. Upon hydrolysis, the antioxidative activity either generally
decreased or remained the same. Dephosphorylated fractions showed a greater
antioxidative activity. In aqueous solution (pH 7.0) with the free radical 1,1-diphenyl-2-
picrylhydrazyl (DPPH), unhydrolysed caseins and bovine serum albumin were effective
in DPPH radical scavenging, but not the hydrolysates. Dephosphorylated casein and β-
casein had a lower DPPH-radical-scavenging activity than the respective native protein
(Rival et al. 2001a).

Chapter 2: Literature review 52
The different test systems to investigate antioxidative activities contained different
types of radicals. It was suggested that the different degrees of hydrophobicity of the
incorporated radicals influenced the possibility of interaction between them and the
respective protein fraction (Rival et al. 2001a). This suggestion was based on a former
finding of Dean et al. (1991), that hydrophobic radicals, unlike hydrophilic radicals,
hardly interacted with bovine serum albumin. In a previous study of Rival et al.
(2001b), whole casein and α-casein, β-casein and κ-casein (native or dephosphorylated)
had also shown lipoxygenase-inhibiting activity in a Tween 20/linoleic acid system (pH
9.0), indicated by a lower oxygen consumption rate.
In a study of Cervato et al. (1999), the deteriorative effect of hydroxyl and superoxide
radicals (pH 7.4) towards deoxyribose and nitroblue tetrazolium in aqueous solution
was 30−40 % in the presence of caseins (α-casein, β-casein, κ-casein and
dephosphorylated α-casein) compared with control solutions without protein.
Dephosphorylated β-casein showed the greatest free-radical-scavenging ability as the
deteriorative effect of the radicals was only 12 %. Hydroxyl radicals had been generated
by combining ascorbate, ferric iron and hydrogen peroxide. Therefore, for this study as
well as for some of the following examples, the antioxidative activity might have been
partially due to metal ion chelation activity and not just the ability to scavenge hydroxyl
radicals.
Suetsuna et al. (2000) produced a casein hydrolysate with pepsin. Peptide fractions
exhibited scavenging activity for superoxide anion radicals. A peptide was isolated from
the most antioxidative fraction. The most important amino acid residues for the
scavenging activity were tyrosine, phenylalanine, glutamic acid and leucine. The
peptide also exhibited scavenging ability for hydroxyl radicals (produced by hydrogen
peroxide plus ferrous iron) and DPPH radicals. In comparison with the antioxidative
peptides gluthathione and carnosine, the free-radical-scavenging activity was as follows
(smaller numbers indicate higher activity): casein peptide (251) > carnosine (654) >
glutathione (661) for hydroxyl radicals and glutathione (6) > carnosine (23) > casein
peptide (98) for DPPH radicals.
Chapter 2: Literature review 53
In a study of Kim et al. (2007a), CPPs were isolated from NaCas hydrolysate produced
by alcalase. The CPPs were aggregated by calcium chloride addition under different pH
conditions (from pH 3 to pH 8) and precipitated with ethanol. The fraction produced at
pH 3 had the greatest scavenging activity for AAPH-derived radicals. This fraction also
had a higher content of cysteine (possibly derived from κ-casein), histidine and tyrosine
residues. These residues were pointed out as being effective free radical scavengers.
Chin and Kitts (2004) reported on the scavenging activity of CPPs for 2,2’-azino-bis-(3-
ethylenzothiazoline-6-sulfonic acid) (ABTS) radicals in aqueous solution.
Buttermilk solids scavenged hydroxyl radicals in an aqueous solution with hydrogen
peroxide and ferrous iron (pH 7.4) at concentrations ≥ 2.5 mg/ml, indicated by the
inhibition of deoxyribose degradation. The maximal inhibition of free radicals was 60 %
at the highest buttermilk solids concentration (10 mg/ml). However, at concentrations
between 0.1 and 1.0 mg/ml, buttermilk solids promoted the deteriorative effect of free
radicals. Free-radical-scavenging activity was partly ascribed to sulfhydryl groups. In
contrast, the reducing capacity of sulfhydryl groups for ferric iron might have
contributed to the pro-oxidative effect at lower buttermilk solids levels (Wong and Kitts
2003).
In a study of Tong et al. (2000b), a high molecular weight fraction of whey protein
scavenged AAPH radicals, indicated by inhibition of β-phycoerythrin decay in aqueous
solution (pH 7.0). The whey protein fraction also inhibited lipid hydroperoxide and
TBARS production in a Tween-20-stabilised salmon O/W emulsion (pH 7). When
sulfhydryl groups in the whey protein fraction were blocked with N-ethylmaleimide
(NEM), the inhibitive effect towards TBARS production was affected to some degree
and the free-radical-scavenging activity decreased by 20 %. It was therefore suggested
that the whey protein fraction inhibited lipid oxidation in the emulsion partly by free
radical scavenging with sulfhydryl groups, but that possibly other residues such as
tyrosine were also involved. The protein fraction also exhibited chelation ability for
ferrous iron.

Chapter 2: Literature review 54
Hernandez-Ledesma et al. (2005) identified several AAPH-radical-scavenging peptides
from enzymatic (pepsin, trypsin, chymotrypsin, thermolysin and corolase PP)
hydrolysates of β-lactoglobulin and α-lactalbumin in the oxygen radical absorbance
capacity-fluorescein (ORAC-FL) assay, as they inhibited the decay of fluorescein. The
peptide with the greatest radical-scavenging activity had a Trolox equivalent value of
2.62, which was higher than for butylated hydroxyanisole (BHA) with a Trolox
equivalent value of 2.43. An equimolar mixture of the 11 constituent amino acids of that
peptide was more antioxidative than the peptide itself (Trolox equivalent value 4.3). The
same comparison was done for the second best radical-scavenging peptide (containing
five amino acids). In this case, the peptide was more antioxidative than the amino acid
mixture (Trolox equivalent value 0.8 versus 0.4). The ORAC-FL assay was also run
with pure amino acids. The molar Trolox equivalents were: 4.6 (tryptophan), 1.6
(tyrosine), 1.1 (methionine), 0.15 (cysteine), 0.07 (histidine) and 0.0025
(phenylalanine). All other amino acids tested (arginine, asparagine, glutamine, aspartic
acid, proline, alanine, valine, lysine, isoleucine) showed values below 0.00001. It was
concluded that the antioxidative properties of the peptides were influenced by the
sequence of the amino acids and the structure of the peptide. The amino acid sequence
may have a synergistic or antagonistic effect for the antioxidative activity in comparison
with equimolar amino acid mixtures.
In a study of Bayram et al. (2008), whey proteins were directly separated from whey
solution via size exclusion chromatography or whey solution underwent hydrolysis with
pepsin or trypsin with subsequent chromatographic separation of the fractions obtained.
The various fractions were tested for their scavenging activity towards superoxide
radicals in aqueous solution at pH 7.8 (in the following, low numbers indicate high
scavenging activity). The first fraction obtained without hydrolysis was high in bovine
serum albumin and immunoglobulins and showed the greatest scavenging activity (9).
The second fraction had a high content of α-lactalbumin and β-lactoglobulin and
showed the lowest scavenging activity (176), but the activity greatly increased (16)
upon hydrolysis with pepsin. The third fraction without hydrolysis contained small
peptides (91). Other fractions obtained after hydrolysis and chromatography had the
following activities: high in bovine serum albumin (21), high in β-lactoglobulin (88),

Chapter 2: Literature review 55
small peptides (143) (all obtained after trypsin treatment) and high in α-lactalbumin (60)
(obtained after pepsin treatment).
Elias et al. (2006) compared the antioxidative properties of β-lactoglobulin and a
chymotryptic hydrolysate of β-lactoglobulin in a Brij-35-stabilised menhaden O/W
emulsion (pH 7.0). They also measured the free-radical-scavenging activity towards
radicals from AAPH and the ability to chelate ferric iron. In the emulsion, the
hydrolysate inhibited lipid hydroperoxide and TBARS production more than the
unhydrolysed protein. Both fractions also exhibited free-radical-scavenging and
chelation activity, with the hydrolysate being more effective than the unhydrolysed
protein. The activities increased with increasing concentration.
A substantial decrease in the concentration of specific tyrosine (38 % after day 4) and
methionine (55 % after day 4) residues, but not phenylalanine residues (8 % after day
8), was observed in peptides of the hydrolysate present in the continuous phase of the
emulsion. The decrease in concentration was attributed to the oxidation of these
residues, possibly indicating free-radical-scavenging activity. The loss of tyrosine and
methionine residues set in earlier than the generation of lipid hydroperoxide and
propanal, suggesting antioxidative activity towards lipids. The loss of phenylalanine
was detected after lipid oxidation had set in. It was therefore suggested that
phenylalanine did not exhibit notable antioxidative activity in this particular system.
Elias et al. (2006) also referred to a previous study (Elias et al. 2005), using the same
emulsion system. When methionine was part of native β-lactoglobulin in the continuous
phase, its concentration was stable. It was therefore suggested that methionine was more
exposed to the solvent as part of the peptide and was thus able to take part in oxidation
reactions. In contrast, Elias et al. (2005) observed a decrease in free sulfhydryl groups
and thereafter tryptophan residues in the continuous phase β-lactoglobulin before the
onset of lipid oxidation.
Taylor and Richardson (1980a) found that, amongst 15 amino acids added to a linoleic
acid methyl ester/Tween 80 emulsion, only cysteine had a dose-dependent protective
effect in terms of lower oxygen consumption. Also protein solutions (bovine serum
albumin, ribonuclease, lysozyme, trypsin, metallothionein) were added to the system.

Chapter 2: Literature review 56
The generation of more free sulfhydryl groups by treating the proteins with NaBH4 led
to lower oxygen consumption compared with the unmodified proteins. When bovine
serum albumin and lysozyme were further treated with iodoacetic acid, free sulfhydryl
groups were oxidised and, as a consequence, a marked increase in oxygen uptake was
observed.
In a second study, when the same test system was used and only milk proteins were
added, Taylor and Richardson (1980b) confirmed the antioxidative effect of free
sulfhydryls, but also pointed out that this would not explain the entire antioxidative
activity of the proteins. Also skim milk was added to the emulsion. It was found that
whey proteins contained most of the sulfhydryl groups in skim milk but that they were
only slightly responsible for its total antioxidative activity. Skim milk treated with
NaBH4 caused a marked increase in the sulfhydryl concentration but did not greatly
lower the oxygen uptake in the emulsion.
Tong et al. (2000b) added a high molecular weight fraction of whey protein to a salmon
oil/Tween 20 emulsion and followed the free sulfhydryl concentration over incubation
time. After 10 days, the free sulfhydryl concentration was no longer detectable but the
lipid hydroperoxide and TBARS concentrations did not increase steeply afterwards.
Blocking of free sulfhydryl groups with NEM resulted in 60 % less effective TBARS
inhibition. In aqueous solution, the whey fraction lost 20 % of its AAPH-radical-
scavenging activity when sulfhydryl groups were blocked with NEM.
Faraji et al. (2004) replaced the continuous phase of a WPI-stabilised menhaden O/W
emulsion with WPI or soy protein isolate treated with NEM. The inhibition of lipid
oxidation was partly affected compared with the untreated continuous phase proteins.
Hu et al. (2003a) prepared salmon O/W emulsions with different whey proteins and
found that NEM addition did not influence lipid hydroperoxide generation. The
propanal production was more inhibited in the NEM-treated samples.
In another study, patatin, a potato protein, showed scavenging activity of DPPH and
hydroxyl radicals in aqueous solution. The activity was reduced from 20 to 5 % and 30

Chapter 2: Literature review 57
to 10 % for the two radical types respectively when sulfhydryl groups were alkylated
(Liu et al. 2003). They also reported that the modification of tryptophan side chains of
patatin with N-bromosuccinimide led to a reduction in free-radical-scavenging activities
from 20 to 5 % (DPPH radicals) and from 30 to 1 % (hydroxyl radicals) in aqueous
solution.
Wong and Kitts (2003) added 0.1 % buttermilk solids and whey protein to fish
oil/Tween 20 emulsions and found inhibition of lipid hydroperoxide development of 56
and 46 % respectively. Although the whey protein had two to three times more free
sulfhydryl groups than the buttermilk solids fraction, lipid hydroperoxides were not
more inhibited. Furthermore, the reduction of ferric iron to ferrous iron was greater for
the whey proteins and it correlated with the free sulfhydryl content.
In most studies that looked at the antioxidative influence of milk proteins and derived
peptides in O/W emulsions or similar systems (Section 0), free radical scavenging was
referred to as an important antioxidative mechanism of the proteinaceous material (17
articles). In the following, amino acid residues that have been associated with free-
radical-scavenging activity in those articles are indicated: cysteine/sulfhydryl groups (in
11 articles), tyrosine (in eight articles), tryptophan (in three articles), methionine (in two
articles), histidine, phenylalanine, proline and lysine (in one article each).


Chapter 3: Materials and methods 59
Chapter 3
Materials and methods
3.1 General materials
3.1.1 Emulsion lipid
Linoleic acid, specified as approximately 60 %, was of the brand Sigma, purchased
from Sigma-Aldrich Co., St. Louis, Missouri, USA (catalogue number L1626) and
stored in the dark at 5 °C under oxygen-free nitrogen (gas code 152, purchased from
BOC New Zealand Ltd., Auckland). According to the supplier, the original plant source
was soybean oil and besides linoleic acid the product contained oleic acid and linolenic
acids based on gas chromatographic analysis. Several batches were used throughout the
project.
3.1.2 Proteins
Whey protein isolate (WPI; product name Alacen 895) and sodium caseinate (NaCas;
product name Alanate 180) powders were obtained from Fonterra Cooperative Group
New Zealand. Throughout the whole project the same batch of the respective protein
type was used. Sodium azide, extra pure, purchased from Merck KGaA, Darmstadt,
Germany, was used as microbiological stabiliser in the protein solutions.
3.1.3 Chemicals for lipid hydroperoxide and hexanal determination
Ethanol (95 %), n-hexane (95 %), ethyl acetate (min. 99.5 %), methanol (99.8 %) were
obtained from Biolab Ltd., Scoresby, Victoria, Australia, and butan-1-ol from BDH
(VWR International, West Chester, PA, USA). Ammonium thiocyanate (min. 98.0 %)
and barium chloride (min. 99.0 %) were from Ajax Chemicals (Ajax Finechem Pty.

Chapter 3: Materials and methods 60
Ltd., Taren Point, Australia) ferrous sulphate heptahydrate (min. 99.5 %) from Merck
and cumene hydroperoxide (88 %) and hexanal (98 %) from Aldrich (Sigma-Aldrich
Co., St. Louis, Missouri, USA).
3.2 General methods
3.2.1 Determination of the iron and copper content of the protein powders
Iron and copper contents of the proteins were determined by acid digestion and
subsequent ICP-OES (Inductively Coupled Plasma Optical Emission Spectrometry)
determination. The measurements were sub-contracted to Hill Laboratories, Hamilton,
New Zealand.
3.2.2 Preparation of protein solutions
Protein solutions of various protein contents were prepared with water purified by
reverse osmosis (RO). Sodium azide was added to inhibit microbial growth in the
protein solutions and emulsions. The concentration of sodium azide in the protein
solutions was adjusted to give 200 ppm in the emulsions. Gallaher et al. (2005) had
shown that sodium azide had no effect on lipid oxidation in O/W emulsions at this
concentration. The solutions were stirred with a magnetic bar for at least 8 h at 50°C,
until all protein was dissolved and then stored at 5 ˚C until further use.
3.2.3 Preparation of emulsions
Emulsions containing various protein contents and 10.6 % lipid were prepared with
solutions of either WPI or NaCas and linoleic acid. Each solution was added at a
temperature of about 5°C to linoleic acid and a coarse emulsion was created by high
speed blending at 20500 rpm with a Diax 600 blender from Heidolph Instruments
GmbH & Co.KG, Schwabach, Germany. Complete emulsification was achieved with a

Chapter 3: Materials and methods 61
two-valve Rannie homogeniser, model APV-1000, from APV New Zealand Ltd.,
Auckland. The pressure stages generally used for the two valves were 320 bar and 30
bar (320/30 bar), giving physically stable emulsions. The emulsions were passed
through the homogeniser three times to ensure complete emulsification.
3.2.4 Acceleration of the lipid oxidation rate by emulsion storage at elevated
temperature
The emulsion samples were incubated at 50 ± 0.5 °C in the dark using a Contherm,
model 120 MC (Contherm Scientific Ltd., Lower Hutt, New Zealand) as thermostat.
These conditions were chosen to allow reasonably fast autoxidation rates of linoleic acid
with presumably the same oxidation mechanisms as at room temperature. Other
research has found that for incubation tests at 60 °C lipid oxidation correlated well with
shelf life tests at room temperature and side reactions were limited compared to higher
temperatures (Frankel 1993). Also the results of Hamm et al. (1968) pointed to the same
mechanisms in the autoxidation of milk fat up to a temperature of 50 ˚C, according to
the volatile compounds produced. The start of the incubation period followed as soon as
possible after the emulsification. After emulsion preparation, emulsion aliquots were
distributed into containers resulting in either 93 % or 85 % headspace for the lipid
hydroperoxide samples or the hexanal samples respectively. The aliquots were 1 ml
(lipid hydroperoxide measurements) and 3 ml (hexanal measurements). Sample
containers for lipid hydroperoxide measurements were 15 ml plastic centrifuge tubes
from Sarstedt (air tight sealed with plastic screw cap) and 20 ml glass vials for gas
chromatographic measurements from Phenomenex (air tight sealed with rubber/teflon
septum and tin cap). The headspace was regarded as a factor that did not limit lipid
hydroperoxide formation as the molar ratio of oxygen initially present in the headspace
(20 °C, 1013 hPa) to the highest molarity of lipid hydroperoxides created (WPI (0.5 %)
emulsion, d32 = 0.6 µm, in Chapter 4) was 130:1. Samples were incubated in triplicate.
Usually, samples were taken at 0, 2 and 4 hours for lipid hydroperoxide and at 0, 12 and
24 h for hexanal measurements. The samples were immediately put into the freezer (-18
°C) at the end of the incubation period. Each container represented an experimental unit
for single measurements of either the lipid hydroperoxide or hexanal concentration.

Chapter 3: Materials and methods 62
Lipid hydroperoxides and hexanal were determined within 1-2 weeks. In a preliminary
experiment samples kept at -18 °C were found to have oxidative stability for at least 3
weeks.
3.2.5 Measurement of the droplet size
Droplet size was measured as Sauter Mean Diameter (d32) in micrometer with a
Mastersizer/E from Malvern Instruments Ltd., Malvern, Worcestershire, UK. The
presentation code for these measurements was 2NAD. In some experiments, the droplet
size was measured as Z-average in micrometer with a Zetasizer Nano-ZS from Malvern
Instruments Ltd. In general, the relative refractive index (N) i.e. the ratio of refractive
index of fat or lipid globule (1.456) and that of the dispersion medium (1.33) was 1.095.
Over the whole incubation period, the droplet size was measured at various times to
monitor the physical stability of the emulsions. Independent sample containers were
used for measurements at different times. Measurements were carried out in duplicate.
This was done separately for all emulsions of an experiment.
3.2.6 Measurement of the pH value
The pH was measured using an Orion 520 pH meter from Thermo Fisher Scientific Inc.,
Waltham, MA, USA. The pH meter was calibrated daily with a two point calibration at
pH 4.0 and 7.0. Emulsions prepared with WPI or sodium caseinate and linoleic acid
appeared to be well buffered systems at protein concentrations from 0.5 to 10.0 %. A
stable pH of 6.0 ± 0.2 was found over 24 h incubation time (Chapter 4). Therefore the
pH was not measured explicitly in all experiments.
3.2.7 Lipid hydroperoxide determination
For the determination of lipid hydroperoxides, a method adapted from Shantha and
Decker (1994) and Nuchi et al. (2001) was applied. To frozen 1 ml emulsion aliquots, 5
ml of an effective extraction solvent (ethanol/ethyl acetate/n-hexane, 1:1:1 (V/V/V)),

Chapter 3: Materials and methods 63
was added and left thawing at room temperature for 20 min. The solvent mixture had
been formerly used successfully by Satue-Gracia et al. (2000) to extract fat from infant
formulas. A vortexing procedure to extract the lipids from the samples and
centrifugation step followed. Supernatant (0.5 ml) was transferred to a reaction tube
with 4 ml of methanol/butanol (2:1 (V/V)). Thiocyanate (30 µl) and ferrous iron
solution (30 µl) were added. After each addition, the reaction tubes were vortexed for a
few seconds. Three reagent control samples were prepared in the same way, but using
the extraction solvent instead of sample extract. The tubes were kept in the dark at room
temperature for 20 min before measuring the absorption at 510 nm. A standard curve
made with cumene hydroperoxide was used to quantify the lipid hydroperoxides. For
this purpose, cumene hydroperoxide was diluted with the extraction solvent to various
concentrations. These solutions were used instead of sample extracts in the assay.
Principle of the chemical reaction:
Fe2+ lipid hydroperoxides Fe3+
Fe3+ + thiocyanate coloured complex (absorption maximum at 510 nm)
3.2.8 Hexanal determination
A characteristic secondary oxidation product of linoleic acid is hexanal. The samples
were subjected to solid phase microextraction (SPME) that followed hexanal
quantification by gas chromatography (GC) using a flame ionisation detector (FID). The
principle of SPME is that a solid fibre capable of adsorbing volatiles is exposed to the
headspace in the sample vials. After a specified agitation procedure that helps to release
volatiles from the sample the fibre is exposed in the injector of the GC and releases the
adsorbed compounds into the column gas stream. Characteristics of the SPME
procedure were as follows: polydimethylsiloxane fibre (diameter 100 µm), incubation
and extraction temperature 50 °C, pre-incubation before extraction at 50 °C for15 min at
constant agitation speed, extraction time 20 min at same constant agitation speed. For

Chapter 3: Materials and methods 64
the gas chromatograph measurements an Rtx-1701 (30 m, 0.25 mm inner diameter, 1.0
µm film thickness) column was used. A split ratio of 1.0 was applied for the column gas
stream. Column temperature program was 45 °C for 1 min, 5 °C/min up to 100 °C and
10 °C/min up to the end temperature of 230 °C. The injector and FID temperature were
set at 250 °C. A hexanal external standard curve was created for the quantification of
hexanal in the samples. For this purpose hexanal was added at different levels to a
freshly prepared emulsion of 4.7 % NaCas and WPI respectively. The average of the
two regression curves was used as standard curve.
3.2.9 Spectrophotometric measurements
All spectrophotometric measurements were carried out with an Ultrospec II photometer
from Pharmacia LKB (Thermo Fisher Scientific Inc., Waltham, MA, USA). The
samples were measured in 4 ml plastic cuvettes.
3.2.10 Statistical analysis
Mean values are shown with the standard error of the mean value (SEM) as error bars to
indicate the variability of the single values (calculated in Microsoft Excel).
Multifactorial analyses of variance (ANOVA) according to the general linear model
were carried out with the lipid hydroperoxide and hexanal concentration as responses.
Two sample t-tests were carried out to test if two mean values were significantly
different from each other. For these purposes Minitab, version 14 or 15, was used.
Chapter 3: Materials and methods 65
3.3 Materials and methods in Chapter 4
3.3.1 Methods: Chapter 4.1
Incubation of emulsion samples
The containers for lipid hydroperoxide measurements were triplicates. The containers
for hexanal measurements were duplicates for the first emulsion of each droplet size and
triplicates for the second one.
Statistical analysis
The total number of samples was n = 72 for lipid hydroperoxide measurements and n =
60 for hexanal measurements. Several ANOVA were carried out. The factors in the
analyses were droplet size and incubation time. In each ANOVA either lipid
hydroperoxide or hexanal data of emulsions with two different droplet sizes was
compared over the whole incubation time range. This was done to show statistical
evidence if lipid oxidation had occurred significantly differently in samples with
different droplet sizes.
3.3.2 Methods: Chapter 4.2
pH
The pH of the samples was 6.0 ± 0.2 over the entire incubation period. It was measured
after 0, 4, 12 and 24 h of incubation time to monitor pH stability. Two independent
sample containers were observed over 24 h for all emulsion types.
Statistical analysis
The total number of samples was n = 324 for lipid hydroperoxide measurements (n =
111 for samples incubated for 4 h) and n = 294 for hexanal measurements (n = 98 for
samples incubated for 24 h). The number of replicates for one sample type ranged from
three to six (lipid hydroperoxide measurements) and two to six (hexanal measurements).
One ANOVA was carried out for the lipid hydroperoxide and hexanal data respectively,

Chapter 3: Materials and methods 66
including the experimental factors protein type, protein concentration, droplet size and
incubation time (to obtain lipid hydroperoxide and hexanal means over the protein
concentration). Another ANOVA was carried out for the lipid hydroperoxide and
hexanal data respectively with the experimental factors protein concentration, droplet
size and incubation time (to evaluate the influence of the droplet size in WPI and NaCas
emulsions with increasing protein concentration).
3.3.3 Methods: Chapter 4.3
Determination of the protein surface concentration
The measurement of the surface protein concentration was based on the procedure
described by Srinivasan et al. (1996).
Interface protein in 11 g emulsion:
0.033732 g NaCas in NaCas emulsion with 1.0 % protein content
0.025636 g WPI in WPI emulsion with 1.0 % protein content
The interface protein content was calculated by subtracting the protein content of the
subnatant (obtained by centrifugation of four times 11 g of the emulsion at 45,000 g for
60 min with a Sorvall centrifuge type RC 5C) from the total protein content of 11 g of
WPI and NaCas emulsions (1.0 % protein). The protein content of the subnatant was
determined using the “Leco, total combustion method” according to AOAC Official
Method 968.06 (Dumas Method) (AOAC 2005a)).
Content of oil phase in 11 g of emulsion:
11 g emulsion with 10.6 % linoleic acid content => oil phase content = 11 g * 0.106 =
1.166 g
Approximate specific surface area (SSA) for d32 = 0.31 µm (average droplet size)
= (20.5583 m2/g (in d32 = 0.29 µm) + 18.1221 m2/g (in d32 = 0.33 µm)) / 2
= 19.3402 m2/g

Chapter 3: Materials and methods 67
Surface area = SSA (m2/g) * oil phase content (g) = 19.3402 m2/g * 1.166 g
= 22.55 m2
Surface protein concentration in WPI emulsion with 1.0 % protein content
= 25.636 mg / 22.55 m2 = 1.1369 mg/ m2 = approximately 1.1 mg/m2
Surface protein concentration in NaCas emulsion with 1.0 % protein content
= 33.732 mg / 22.55 m2 = 1.4959 mg/ m2 = approximately 1.5 mg/m2
Replacement of the continuous phase of emulsions with protein solutions
Plastic centrifuge tubes (50 ml) were filled with freshly prepared emulsion. The tubes
were then centrifuged with a CR 22GII centrifuge from Hitachi at 36,000 g for 30min at
5 °C. The cream phase was separated from the continuous phase of the emulsion. The
subnatant was the continuous phase, which was carefully taken out with a syringe. The
syringes that were used were 10 ml plastic ones with a blunt steel tip screwed on top.
The continuous phase was substituted with an equivalent amount of RO water or protein
solution (four replicates per sample type). The tubes were then vortexed for 5 min at
moderate speed with a PV-1 from Grant-bio until the cream was totally suspended
again. Samples in which the continuous phase was substituted with RO water were
regarded as control samples for the effect of continuous phase protein on lipid
oxidation. In the experiment where emulsions with 4.0 % protein were prepared, one
part of the emulsion was put on the side for which the continuous phase was not
replaced. During the replacement process for the rest of the emulsion, this part was kept
at the same temperature before the samples were incubated together at 50 ˚C.
3.4 Materials and methods in Chapter 5
3.4.1 Materials: Chapter 5
Disodium EDTA and trisodium citrate of analytical grade were of the brand BDH from
VWR International, West Chester, PA, USA. Dialysis tubing was a Spectra/Por®
Chapter 3: Materials and methods 68
Membrane with a molecular weight cut-off of 12000-14000 purchased from Spectrum
Laboratories, Inc., Rancho Dominguez, CA, USA.
3.4.2 Methods: Chapter 5.1
Preparation of protein solutions
WPI and NaCas solutions of 5 % were prepared without sodium azide. The protein was
dissolved in half of the final amount of RO water. The other half of aqueous solution
was added to it and consisted of RO water with various levels of disodium EDTA or
trisodium citrate. One part of each protein solution was used for the dialysis process.
The other part was adjusted to 3.36 % protein concentration with RO water.
Dialysis process
For the dialysis process, 80 ml of the respective protein solution was added into a
dialysis tube (each end sealed with plastic clips) and dialysed for 42 h against 20 litres
of RO water at 5 °C under stirring with a magnetic bar. Every 14 h the water was
replaced with fresh RO water. After the dialysis process the volume in the dialysis tube
had increased due to osmosis. The new volume varied depending on the original protein
solution. They were all adjusted to the same protein concentration (3.36 %) with RO
water.
Preparation of emulsions
After the usual emulsification process, 200 ppm sodium azide was added with 35 µl RO
water per g of emulsion.
3.4.3 Methods: Chapter 5.2
Preparation of protein solutions and dialysis process
Protein solutions used in the dialysis process were prepared with 5.5 % WPI or NaCas
and without sodium azide. Two dialysis tubes were filled with 100 ml of RO water and
the ends were closed with plastic clips. One tube was placed into 2 litres of the WPI

Chapter 3: Materials and methods 69
solution, the other one into 2 litres of the NaCas solution. The protein solutions were in
glass beakers with a magnetic bar which were placed on a magnetic stirrer. Dialysis
took place at 5 ˚C for 42 h and the protein solution was replaced with fresh one every 14
h. After the dialysis the tubes were cut open and the protein content of the dialysate
(solution in the tube) was determined using a Kjehldahl method. The dialysates were
diluted with RO water or left undiluted and used instead of RO water to produce protein
solutions as usual which were further used to produce emulsions. For one control
emulsion with NaCas (5.0 %) and 100 ppm EDTA, the protein solution was prepared by
dissolving the EDTA in RO water before the right amount of protein was added.
Protein content of the dialysates
The total nitrogen content of the dialysates was determined in triplicate and the protein
content calculated with a Kjehldahl method: “AOAC Official Method 991.20”,
Nitrogen (Total) in Milk (AOAC 2005c).
3.5 Materials and methods in Chapter 6
3.5.1 Materials: Chapter 6
For the gel electrophoresis, a Mini-Protean® 3 Cell system from Bio-Rad Laboratories
Inc., Hercules, CA, USA, was used. The power supply used for the electrophoresis was
an EC 135 from E-C Apparatus Corporation St. Petersburg, Florida, USA. For the
scanning procedure, a Molecular Dynamics personal densitometer, model PD-SI
computing densitometer (Molecular Dynamics, Sunnyvale, CA, USA) was used,
equipped with the software ImageQuant for Windows NT, Version 5.0 (Molecular
Dynamics, Sunnyvale, CA, USA) to quantify the colour intensity of the bands. All
chemicals used were of analytical reagent grade. Ammonium persulfate and
acrylamide/bis 37.5:1 premixed powder electrophoresis purity reagent (consisting of
acrylamide plus N,N'methylene-bis-acrylamide) were products from Bio-Rad
Laboratories. N,N,N`,N`-Tetramethylethylene-diamine (TEMED) for electrophoresis
and glycine for electrophoresis were obtained from Sigma.
Chapter 3: Materials and methods 70
Tris(hydroxymethyl)methylamine of molecular biology grade, hydrochloric acid (min
35.4 %) and glacial acetic acid were products from BDH. Glycerol and sodium
hydroxide pellets were purchased from Univar AG, Bever, Switzerland. Bromphenol
blue, pH indicator (pH 3.0–4.6), amido black 10B for electrophoresis and redox
indicator, and 2-propanol were products from Merck.
3.5.2 Methods: Chapter 6
Heat treatment of protein solutions at 84 °C
Protein solution (250 g) was transferred into a glass beaker (400 ml) plus a magnetic
stirring bar. The container was covered with transparent food wrap to prevent water
evaporation during the heat treatment and placed into a waterbath above a magnetic
stirrer plate. A thermometer was placed into the solution. The temperature in the
solution reached 83 °C after 10 min. The maximal temperature of 84 ± 0.3 °C was
reached after 15 min. Before heating, the solutions had room temperature and after
heating they were put on ice immediately. After 30 min on ice they were stored at 5 °C.
Native PAGE (polyacryl amide gel electrophoresis) method
The method is suitable to qualify and quantify whey proteins and was adapted from
Havea et al. (1998) and Patel (2007b). For all preparations and procedures extra pure
demineralised water (Milli-Q water) was used. The term %C stands for % w/w of
crosslinking N,N'methylene-bis-acrylamide and %T stands for the
concentration/strength of acrylamide.
Native-PAGE resolving gel was prepared as follows: 2.0 ml native resolving gel buffer,
6.0 ml water and 8 ml acrylamide/bis 37.5:1 solution (30 %) were pipetted into a
vacuum flask, mixed well and degassed while stirring with a magnetic bar under
vacuum for 20 min. The native resolving gel buffer consisted of 3.0 M
tris(hydroxymethyl)methylamine adjusted to pH 8.8 with hydrochloric acid.
Immediately after the degassing procedure, 8 µl of TEMED and 80 µl ammonium
persulphate (10 %) were added to the degassed solution and mixed gently to initiate the
polymerisation reaction leading to polyacrylamide. Then 3.3 ml of the solution was

Chapter 3: Materials and methods 71
quickly pipetted between two glass plates, sealed on the bottom and at the sides (Mini-
Protean® 3 Cell equipment). Water (0.5 to 1 ml) was pipetted on top of the solution
between the glass plates, to give the gel a smooth and level surface upon setting. After
30 min at room temperature, the resolving gel (15 % T, 2.67 % C) had formed and the
water was removed from the top layer using filter paper.
Native-PAGE stacking gel was prepared by mixing 2.0 ml stacking gel buffer, 5.0 ml
water and 1.0 ml acrylamide/bis 37.5:1 solution (30 %) in a vacuum flask, followed by
the degassing procedure described above. The native stacking gel buffer consisted of 0.5
M tris(hydroxymethyl)methylamine adjusted to pH 6.8 with hydrochloric acid.
Immediately after the degassing procedure, 40 µl ammonium persulphate (10 %) and 8
µl TEMED were added to the degassed solution and mixed gently. The mixture was
then pipetted between the glass plates on top of the pre-formed resolving gel. A plastic
comb with ten slots was inserted, to form sample loading wells in the stacking gel. It
was taken care that no air bubbles were embedded during the insertion. After 90 min at
room temperature, the glass plates were removed from the apparatus, as the gel
formation was completed.
Two gels, both consisting of a stacking and resolving gel part situated between two
glass plates, had been prepared at a time. They were placed into an electrophoresis
chamber filled with native-PAGE electrode buffer solution, pH 8.3 (which consisted of
0.125 M tris(hydroxymethyl)methylamine and 0.95 M glycine, diluted 1:4 with water).
Prepared sub-samples (10 µl) were charged into the sample loading wells on top of the
stacking gel with a Hamilton syringe (Hamilton Company, Reno, Nevada, USA). The
sub-samples consisted of a mixture of 50 µl protein solution (original sample) plus 950
µl native gel sample buffer (pH 6.8). Native gel sample buffer (pH 6.8) had been
prepared by combining 200 ml native stacking gel buffer (0.5 M
tris(hydroxymethyl)methylamine adjusted to pH 6.8 with hydrochloric acid), 20 ml
Bromphenol blue solution (0.4 %), 600 ml water and 80 ml glycerol.
Then, electrophoresis was carried out at a maximum voltage of 200 V, with a final
current of 70 mA, for a run time of approximately 70 min; power was turned off when

Chapter 3: Materials and methods 72
the bromphenol blue dye band reached the bottom of the resolving gel. The gels were
then removed from the glass plates and transferred to polyethylene containers for the
staining and destaining procedure.
For the staining procedure, the gels where immersed in 50 ml amido black 10B dye (0.1
% (weight/volume) in 10 % acetic acid) for 60 min. Then the solution was removed and
the gels drained. Afterwards, 100 ml acetic acid (10 % (volume/volume)) was added for
destaining. The solution was replaced after 1 h and one more time after 10 h with 100
ml of acetic acid (10 % (volume/volume)). To support the staining and destaining
processes they took place on a platform rocker. After 20 h destaining time, the gels were
scanned and the colour intensity of the ß-lactoglobulin bands was quantified.
Four gels were prepared to run all together six replicates of each protein solution
sample. On each gel two replicates of the protein solution sample without heat treatment
(control) was run. The entire procedure was repeated once with a separate sub-sample
preparation. The controls represented on each gel 0 % protein denaturation and showed
the darkest stains. The colour intensity decreased, the higher the degree of denaturation
was. The reduction in colour intensity of a stain in comparison to the average intensity
of the two controls, represented the degree of protein denaturation.
Total sulfhydryl determination
Total sulfhydryls were determined as described in Section 3.6.4, Methods: Chapter 7.2.
The same chemicals were used.
Free sulfhydryl determination
Protein solution (2000 µl) or RO water for controls, 200 µl phosphate buffer solution
and 500 µl DTNB solution were added into test tubes, with vortex mixing after each
addition (triplicates). The tubes then were put in the dark for 30 min at room
temperature. The assay was other than that the same as for the determination of total
sulfhydryls described in Section 3.6.4, Methods: Chapter 7.2. The same chemicals were
used. For free sulfhydryl determination a standard curve was created using cysteine
solutions (based on RO water) of different concentration levels instead of protein
solution.

Chapter 3: Materials and methods 73
3.6 Materials and methods in Chapter 7
3.6.1 Materials: Chapter 7
The oxygen concentration was measured with an YSI model 57 Dissolved Oxygenmeter
plus oxygen electrode from YSI Incorporated, Yellow Springs, OH, USA. For
calibration the oxygen electrode was inserted into a 250 ml glass bottle, the bottom
covered with 2-3 cm water. The bottle was immersed in a waterbath at 40 ˚C for
approximately one hour until the temperature in the bottle had equilibrated to 37 ˚C
(measured with the internal thermometer at the oxygen electrode). The needle of the
oxygen meter was then adjusted to 6.73 mg/l, which is the solubility of oxygen in water
exposed to water saturated air at 37 ˚C (YSI model 57 Operating Instructions).
The free radical agent 2,2`-azobis(2methylpropion-amidine) dihydrochloride (AAPH)
(97 %), 5,5`-dithio-bis(2-nitrobenzoic acid) (DTNB) (99 %) and xylenol orange (no
purity stated) were of the brand Aldrich from Sigma-Aldrich Co., St. Louis, Missouri,
USA. Sodium dihydrogen orthophosphate 1-hydrate (99.0 – 102.0 %),
tris(hydroxymethyl)methylamine (≥ 99 %), sodium dodecyl sulphate (SDS), ferrous
sulphate 7-hydrate, hydrogen peroxide (30 %), sodium acetate-3-hydrate (99.5 %),
phosphoric acid (~ 85 %) and trisodium phosphate-12-hydrate (99 %), all analytical
reagents, were of the brand BDH from VWR International, West Chester, PA, USA.
Disodium hydrogen orthophosphate 7-hydrate (≥ 99 %) and sodium hydroxide (NaOH,
analytical reagent) were of the brand Ajax Chemicals from Ajax Finechem Pty. Ltd.,
Taren Point, Australia. Cysteine (no purity stated) was of the brand USB from
Affymetrix Inc., Santa Clara, CA, USA. Oxygen free nitrogen, gas code 152, was
purchased from BOC New Zealand Ltd., Auckland.

Chapter 3: Materials and methods 74
3.6.2 Methods: Chapter 7
Preparation of phosphate buffer (0.1 M), pH 6.0
Phosphate buffer solution (0.1 M) of pH 6.0 was prepared by combining 0.1 M
solutions of sodium dihydrogen orthophosphate 1-hydrate and disodium hydrogen
orthophosphate 7-hydrate in RO water.
3.6.3 Methods: Chapter 7.1
Preparation of emulsions
WPI and NaCas emulsions with 1.0, 4.0 and 7.0 % protein content were created using
protein solutions prepared with phosphate buffer (0.1 M, pH 6.0) instead of RO water.
Experimental description
The experimental set-up is shown in Figure 3.1. Freshly prepared emulsion (165 ml)
was pipetted into a glass flask with three openings and an approximate volume of 200
ml. The two openings on the side were closed by stoppers, the one in the middle left
open. The flask was placed into a water bath at 40 °C and the temperature of the
emulsion adjusted to 37 °C (thermometer in emulsion). The emulsion was stirred by the
use of a magnetic stirrer. In a separate glass beaker, 10 ml of the emulsion was
combined with 750 µl AAPH solution (210 g/l AAPH in RO water) or RO water and
adjusted to pH 6.0 with NaOH (10 M). To the 165 ml emulsion, the analogous volumes
of AAPH solution or RO water (12.4 ml) and NaOH solution (≈ 1.5 ml) were added.
After 1 minute, an oxygen probe was set into the centre opening to close the system.
After 2 minutes, the first oxygen reading was taken. About 3.5 ml emulsion were taken
out through a syringe at various sampling times (2–10 min with AAPH; 2–45 min
without AAPH) through one of the stoppers (glass stopper with rubber septum). For the
volume taken out, oxygen-free nitrogen streamed into the flask from a nitrogen
reservoir. The emulsion taken out was immediately put on ice. It was distributed into 15
ml plastic tubes in triplicate (3 x 1 ml) for lipid hydroperoxide measurements and put
into the freezer (–18 °C) within 10 min. Emulsion samples with AAPH (0 min) were
prepared separately and not by sampling out of the glass flask.
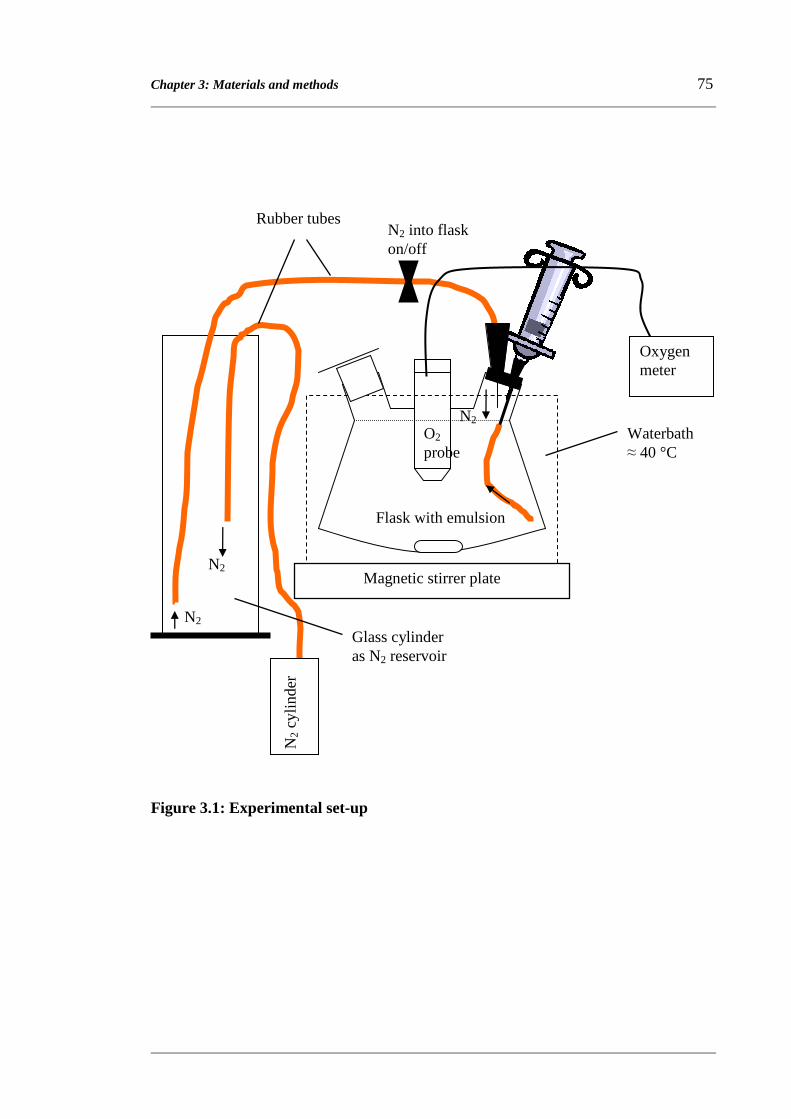
Chapter 3: Materials and methods 75
Glass cylinder as N2 reservoir
N2
N2
N2
Figure 3.1: Experimental set-up
Oxygen meter
N2
cylin
der
Magnetic stirrer plate
Waterbath ≈ 40 °C
Flask with emulsion
O2 probe
Rubber tubes N2 into flask on/off

Chapter 3: Materials and methods 76
3.6.4 Methods: Chapter 7.2
Oxygen consumption in protein solutions with AAPH
The experimental set-up was similar to Figure 3.1 in Section 3.6.3, Methods: Chapter
7.1, except that the stopper with the syringe was replaced with a normal plastic stopper.
The execution of the experiment was also the same as described in Section 3.6.3,
Methods: Chapter 7.1, except for the usage of various aqueous solutions instead of
emulsions and that no sampling took place.
Obtaining continuous and cream phase protein solutions for determinations of
protein hydroperoxides, amino acids and total sulfhydryls
10 ml or 5 ml of emulsion was added into 50 ml plastic centrifuge tubes respectively.
Incubation for various times at 50 ˚C followed. The tubes were then centrifuged with a
RC 5C centrifuge from Sorvall at 45,000 g for 60 min at 5 °C. The subnatants
(continuous phase of the emulsion) were taken out with 10 ml single use plastic
syringes with a blunt steel tip screwed on top. Then the same weight of SDS (2.0 %)
solution was added as subnatant had been taken out. Afterwards re-emulsification was
done by vortexing with a VM-1000 from Digisystem at the highest vortex speed for 35 s
and heavy manual shaking for 10 s. Then the tubes were centrifuged again and also
subnatants (cream phase protein solution of the emulsion) taken out as described above.
The cream phase protein solution contained SDS whereas the continuous phase protein
solution did not. The cream phase protein was therefore denatured and the continuous
phase protein was not. However, in the subsequent methods, both proteins were heavily
exposed to denaturants anyway, to SDS (determination of total sulfhydryls), to strong
acid or base (amino acid determination) or to trichloroacetic acid and an organic solvent
mixture (protein hydroperoxide determination). Therefore the initial difference in the
status of the proteins in either fraction was thought to be irrelevant.
Protein hydroperoxide determination
Protein solution (1000 µl) with continuous or cream phase protein was transferred into a
50 ml plastic centrifuge tube. Trichloroacetic acid (10 % weight/volume in RO water)

Chapter 3: Materials and methods 77
(5000 µl) plus 5000 µl organic solvent mixture (ethanol/ethyl acetate/n-hexane, 1:1:1
(V/V/V)) were added for protein denaturation/precipitation and the extraction of
residual lipid. The mixture was vortexed, centrifuged and the supernatant decanted. To
the remaining protein precipitate, which was in pellet form, 5000 µl sulphuric acid (25
mM) was added. The protein was then suspended with a glass rod. Afterwards 280 µl
xylenol orange solution (23.34 mM xylenol orange) and 280 µl ferrous iron solution
(2.80 mM ferrous sulphate 7-hydrate) based on sulphuric acid (25 mM) were added and
the mixture was vortexed. For controls, 5000 µl sulphuric acid (25 mM), 280 µl xylenol
orange solution and 280 µl ferrous iron solution were added in triplicate into test tubes.
The tubes were then put in the dark for 30 min reaction time at room temperature.
Afterwards they were centrifuged again. The supernatant was transferred into 4 ml
photometric plastic cells and the absorption at 560 nm was measured against sulphuric
acid (25 mM). All samples in this experiment were centrifuged using a RC 5C
centrifuge from Sorvall at 45,000 g for 60 min at 5 °C. The absorption obtained in the
assay was converted into micromoles of hydroperoxides by means of a hydrogen
peroxide standard curve. The hydrogen peroxide curve was created by adding 4970 µl
of sulphuric acid (25 mM) plus 30 µl of hydrogen peroxide solution of various
concentration levels (based on sulphuric acid (25 mM)) plus 280 µl of xylenol orange
and ferrous iron solution into test tubes. The procedure already described above was
followed without centrifugation. The assay was adapted from the instructions of Gieseg
et al. (2000) and Gay et al. (1999).
Principle of the chemical reaction:
Fe2+ Fe3+ Fe3+ + xylenol orange coloured complex (absorption maximum at 560 nm)
Total sulfhydryl determination
Protein solution (500 µl) or RO water for the controls, was pipetted into test tubes; 100
µl phosphate buffer solution (pH 8.1), 1100 µl SDS solution (5.0 %, weight/volume in
RO water) and 500 µl DTNB solution were added. The tubes were placed in the dark for
protein hydroperoxides

Chapter 3: Materials and methods 78
30 min at room temperature and afterwards the absorption at 412 nm was measured
against RO water. Also the absorption at 540 nm was measured against RO water to
take a slight turbidity into account and the reading deducted from the absorption values
at 412 nm. The absorption readings at 540 nm were low (≤ 0.020). There were four
samples of each sample type which were each measured with one replicate. A standard
curve was made for quantification of total sulfhydryls by using RO-water-based
cysteine solution of various concentration levels instead of protein solution in the assay.
The method was adapted from Taylor and Richardson (1980b).
Principle of the chemical reaction (Guingamp et al. 1993):
SH + 5,5`-dithio-bis(2-nitrobenzoic acid) 2-nitro-5-mercaptobenzoic acid
yellow
(absorption maximum at 412 nm)
Preparation of the phosphate buffer solution (pH 8.1)
Tris(hydroxymethyl)methylamine (1 M) and trisodium phosphate-12-hydrate (1 M)
were dissolved in RO water and the pH was adjusted to pH 8.1 with phosphoric acid (85
%).
Preparation of the DTNB solution
Sodium acetate-3-hydrate (50 mM) and DTNB (2 mM) were dissolved in RO water.
mild basic pH

Chapter 4: Factors affecting lipid oxidation in milk-protein-based O/W emulsions 79
Chapter 4
Factors affecting lipid oxidation
in milk-protein-based O/W emulsions
This chapter examines how some of the basic characteristics of milk-protein-based O/W
emulsions influence lipid oxidation. These include change of the droplet size, protein
type, protein concentration and the role of the continuous phase protein. In contrast to
previous studies, these effects were followed over a wider protein concentration range,
leading to a more complete picture of how various factors interact. The comparison of
the two milk protein fractions whey protein isolate (WPI) and sodium caseinate (NaCas)
was especially interesting.
The oxidation of linoleic acid, which was employed as emulsion lipid, was used to
investigate the influence of the various factors. Oxidation indicators were lipid
hydroperoxides for the earlier stage and hexanal – specific to linoleic acid oxidation –
for the advanced stage of lipid oxidation.
In the previous research, contradictory results were obtained in studies that looked at the
influence of the droplet size; some studies found more lipid oxidation for small droplets
(Gohtani et al. 1999; Jacobsen et al. 2000; Lethuaut et al. 2002) others for large droplet
sizes (Let et al. 2007b; Nakaya et al. 2005). The antioxidative behaviour of whey
proteins and fractions (Allen and Wrieden 1982; Djordjevic et al. 2004; Elias et al.
2005; Hu et al. 2003a; Hu et al. 2003b; Tong et al. 2000a; Tong et al. 2000b) as well as
of caseins (Allen and Wrieden 1982; Diaz and Decker 2004; Diaz et al. 2003;
Djordjevic et al. 2004; Hu et al. 2003b) was studied. Faraji et al. (2004) and Hu et al.
(2003b) studied the effect of varying protein concentration and the effect of continuous
phase protein was examined by Elias et al. (2005), (2007) and Faraji et al. (2004).

Chapter 4: Factors affecting lipid oxidation in milk-protein-based O/W emulsions 80
4.1 Effect of droplet size on lipid oxidation in NaCas-based linoleic acid emulsions
In a preliminary experiment, the effects of various droplet sizes on lipid oxidation in a
milk protein based emulsion with only one protein type and concentration (1.0 %
NaCas) were examined.
The experimental plan is depicted in Figure 4.1. More details about its execution can be
found in Chapter 3: Materials and methods.
Figure 4.1: Flow chart of the experimental plan
NaCas (1.12 %) solution
linoleic acid
3 x
NaCas (1.0 %)
emulsion
0.31 µm
NaCas (1.0 %)
emulsion
0.43 µm
NaCas (1.0 %)
emulsion
0.59 µm
2 x
320/30 bar 30/30 bar 120/30 bar
Incubation 50 °C
Incubation 50 °C
Incubation 50 °C
Lipid hydroperoxide & Hexanal measurements

Chapter 4: Factors affecting lipid oxidation in milk-protein-based O/W emulsions 81
The stability of the droplet sizes over time was important in this experiment to allow a
valid reference to droplet sizes and enable meaningful comparisons. Table 4.1 shows the
mean droplet sizes (d32) measured after 0, 4, 12 and 24 h incubation time at 50 °C. The
mean droplet sizes were 0.31 µm, 0.43 µm and 0.59 µm. They were calculated by
combining the measurements of all times for the respective homogenisation pressure
from both experimental replicates. The droplet sizes were mostly stable over the
incubation time. The greatest change occurred for large droplet sizes from 12 h (0.59
µm) to 24 h (0.68 µm).
Table 4.1: Emulsion droplet sizes (d32 (µm)) after 0h, 4 h, 6 h, 12 h and 24 h incubation at 50 °C with standard error of the mean value* (SEM)
Incubation
time (h)
Homogenisation pressure
30/30 bar 120/30 bar 320/30 bar
Mean value 0.58 0.41 0.29 0 h
SEM 0.01 0.01 0.01
Mean value 0.59 0.44 0.31 4 h
SEM 0.01 0.01 0.01
Mean value 0.59 0.44 0.32 12 h
SEM 0.01 0.01 0.00
Mean value 0.68 0.42 0.33 24 h
SEM 0.06 0.01 0.01
* four replicates

Chapter 4: Factors affecting lipid oxidation in milk-protein-based O/W emulsions 82
Figure 4.2 and Figure 4.3 show the lipid hydroperoxide and hexanal development over
time.
Figure 4.2: Effect of droplet size on lipid hydroperoxide production in NaCas-stabilised linoleic acid emulsions. Emulsions produced at different homogenisation pressures led to droplets sizes d32 of 0.31 µm (○), 0.43 µm (■) or 0.59 µm (▲).
From the beginning up to 4 h the two smaller droplet sized emulsions showed an
increase in lipid hydroperoxides at about the same rate and reached 290 (0.31 µm) and
253 µmol/l (0.43µm) after 4 h (Figure 4.2). The 0.59 µm emulsion showed a similar
increase up to 2 h as the other two, but increased sharply between 2 and 4 h compared
with the smaller droplet sized emulsions. At 4 h an average of 732 µmol/l was
measured.
0
100
200
300
400
500
600
700
800
900
0 1 2 3 4
Incubation Time (h)
Lipi
d H
ydro
pero
xide
s (m
icro
mol
/l)

Chapter 4: Factors affecting lipid oxidation in milk-protein-based O/W emulsions 83
Figure 4.3: Effect of droplet size on hexanal production in NaCas-stabilised linoleic acid emulsions. Emulsions produced at different homogenisation pressures led to droplets sizes d32 of 0.31 µm (○), 0.43 µm (■) or 0.59 µm (▲).
The hexanal concentration increased more rapidly in emulsions with larger droplet sizes
up to 12 h and even more noticeably from 12 to 24 h. After 24 h, the hexanal
concentration for 0.31 µm, 0.43 µm and 0.59 µm emulsions had risen to 135, 140 and
190 µmol/l respectively (Figure 4.3). At 24 h, only the hexanal concentrations of 0.31
µm and 0.59 µm were significantly different (p < 0.05 in two sample t-test).
ANOVAs were carried out for comparisons over the whole incubation time range
(Appendix Chapter 4, Table 4A). No significant difference in lipid hydroperoxide and
hexanal generation could be detected between 0.31 and 0.43 µm emulsions and the 0.59
µm emulsion was significantly different from the two smaller droplet sized emulsions.
The results indicate that lipid oxidation was more inhibited in small rather than large
droplet sizes in linoleic acid/NaCas-based O/W emulsions of 1.0 % protein. The greater
oxidative stability could have been due to the antioxidant activity of NaCas that might
0
25
50
75
100
125
150
175
200
225
0 6 12 18 24
Incubation Time (h)
Hex
anal
(m
icro
mol
/l)
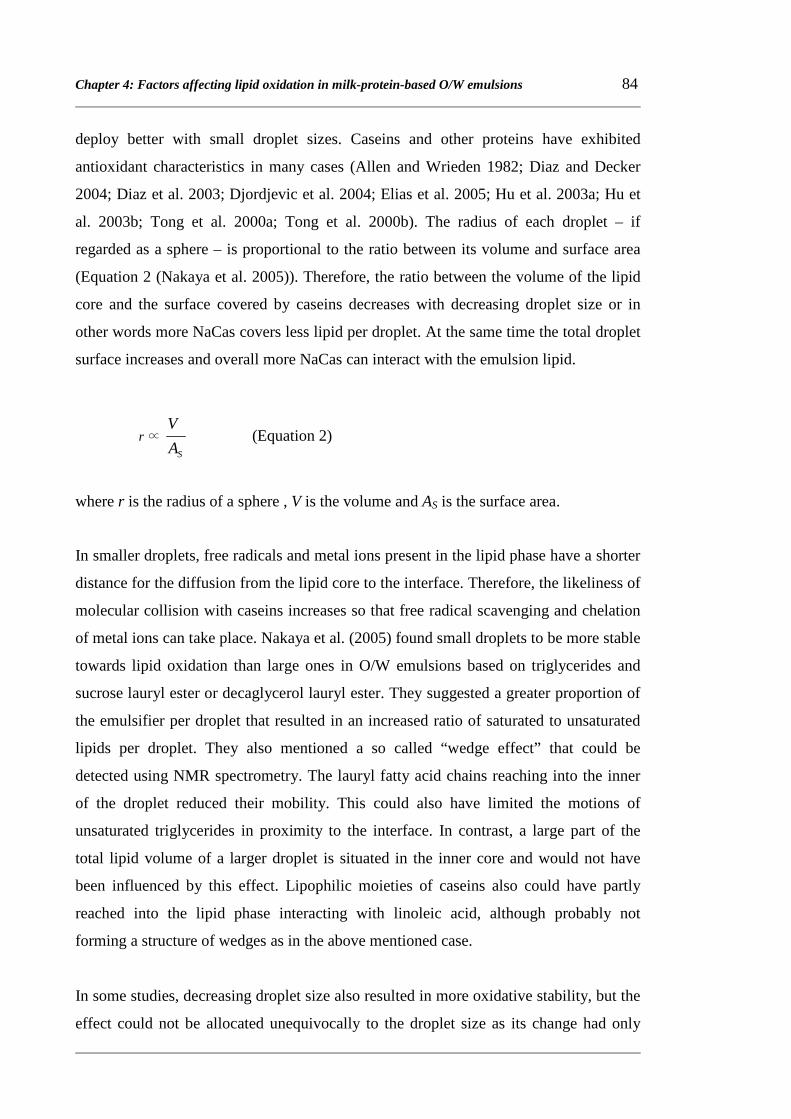
Chapter 4: Factors affecting lipid oxidation in milk-protein-based O/W emulsions 84
deploy better with small droplet sizes. Caseins and other proteins have exhibited
antioxidant characteristics in many cases (Allen and Wrieden 1982; Diaz and Decker
2004; Diaz et al. 2003; Djordjevic et al. 2004; Elias et al. 2005; Hu et al. 2003a; Hu et
al. 2003b; Tong et al. 2000a; Tong et al. 2000b). The radius of each droplet – if
regarded as a sphere – is proportional to the ratio between its volume and surface area
(Equation 2 (Nakaya et al. 2005)). Therefore, the ratio between the volume of the lipid
core and the surface covered by caseins decreases with decreasing droplet size or in
other words more NaCas covers less lipid per droplet. At the same time the total droplet
surface increases and overall more NaCas can interact with the emulsion lipid.
r ∝ SA
V (Equation 2)
where r is the radius of a sphere , V is the volume and AS is the surface area.
In smaller droplets, free radicals and metal ions present in the lipid phase have a shorter
distance for the diffusion from the lipid core to the interface. Therefore, the likeliness of
molecular collision with caseins increases so that free radical scavenging and chelation
of metal ions can take place. Nakaya et al. (2005) found small droplets to be more stable
towards lipid oxidation than large ones in O/W emulsions based on triglycerides and
sucrose lauryl ester or decaglycerol lauryl ester. They suggested a greater proportion of
the emulsifier per droplet that resulted in an increased ratio of saturated to unsaturated
lipids per droplet. They also mentioned a so called “wedge effect” that could be
detected using NMR spectrometry. The lauryl fatty acid chains reaching into the inner
of the droplet reduced their mobility. This could also have limited the motions of
unsaturated triglycerides in proximity to the interface. In contrast, a large part of the
total lipid volume of a larger droplet is situated in the inner core and would not have
been influenced by this effect. Lipophilic moieties of caseins also could have partly
reached into the lipid phase interacting with linoleic acid, although probably not
forming a structure of wedges as in the above mentioned case.
In some studies, decreasing droplet size also resulted in more oxidative stability, but the
effect could not be allocated unequivocally to the droplet size as its change had only

Chapter 4: Factors affecting lipid oxidation in milk-protein-based O/W emulsions 85
been a side effect to the change of another factor, like addition of EDTA (Jacobsen et al.
2001), addition of propyl gallate (Jacobsen et al. 1999), protein concentration (Kiokias
et al. 2006), homogenisation temperature or conformational change of protein (Let et al.
2007b).
In other studies, small droplets were less stable towards lipid oxidation and this could
have been due to the fact that no effective antioxidants were present in the continuous
phase and/or interface or the effect was outweighed by pro-oxidants. Lethuaut et al.
(2002), for example, remarked that although small droplets were more susceptible
towards oxidation than large ones in bovine-serum-albumin-stabilised emulsions the
susceptibility was partly cancelled out by the antioxidative activity of the protein.
Coupland et al. (1996) mentioned that the generation of free radicals is common in food
processing and particularly in the continuous phase of O/W emulsions. Such free
radicals, oxygen and other pro-oxidants, like metal ions, of the continuous phase also
have a larger surface to interact with the smaller droplets, thereby antagonising
oxidative stability. In that respect, the role of the interface to act as a physical barrier
becomes prominent to effectively prevent pro-oxidants from intruding into the lipid
phase.
Kiokias et al. (2006) pointed out that the use of low-molecular weight emulsifiers, like
Tween 20 and SDS, can increase the total surface area as the droplet size decreases and
may result in more lipid oxidation. In a study of Jacobsen et al. (2000), mayonnaise
with small droplets showed greater oxidative susceptibility. This was attributed to the
iron-containing egg yolk protein, phosvitin, which would constitute a large part of the
interface. Rampon et al. (2001) found a greater fluorescence in small rather than large
droplet sized bovine serum albumin emulsions. The fluorescence was caused by the
reaction of interface protein with lipid oxidation products. For the measurement of
direct lipid oxidation indicators no difference was found for the two droplet sizes. It
appeared as if a stronger lipid oxidation in small droplets might have been offset by the
larger contact surface with bovine serum albumin, allowing more antioxidant activity of
the protein.

Chapter 4: Factors affecting lipid oxidation in milk-protein-based O/W emulsions 86
In summary, it appears that the effect of droplet size on lipid oxidation cannot be
regarded independently of other emulsion factors. A decreasing droplet size and
therefore a larger total interfacial area can result in inhibition or promotion of lipid
oxidation. In future work, systematic studies could help to enlighten the influence of
certain factors in connection with increase or decrease of the droplet size. Systematic
combinations of the following factors are seen as particularly relevant: emulsifier and
lipid type as well as concentration, pH and the metal ion concentration. The
investigations should comprise at least two different droplet sizes. Particularly when
proteins are used as emulsifiers, the homogenisation temperature should also be
controlled as it can influence the unfolding of the protein and therefore its interaction
with the emulsion lipid (Let et al. 2007b).
The next set of experiments examined the effects of the protein type – namely WPI and
NaCas – over a wide concentration range on oxidation of small and large droplets.
4.2 Effect of droplet size, protein type and protein concentration on lipid oxidation in linoleic acid emulsions
In previous research, Faraji et al. (2004) investigated milk-protein-based menhaden
O/W emulsions from 0.25 % to 1.5 % at pH 7.0 but only used WPI, whereas Hu et al.
(2003b) used a variety of proteins to compare their antioxidative effect but only used
protein concentrations of 0.5 and 1.5 % at pH 3.0. Sun and Gunasekaran (2009)
examined the oxidative stability of WPI-stabilised menhaden O/W emulsions (pH 6.7–
7.0) with protein concentrations of 0.2 % to 2.0 %. Kiokias et al. (2006) produced
NaCas-stabilised cottonseed O/W emulsions (pH 7.0) at protein concentrations of 0.5 %
to 2.0 % and investigated their oxidative stability.
In this experiment WPI and NaCas were used over a much larger range of protein
concentrations at pH 6.0 and emulsions of two different droplet sizes were examined.

Chapter 4: Factors affecting lipid oxidation in milk-protein-based O/W emulsions 87
The experimental plan is depicted in Figure 4.4. WPI and NaCas emulsions with protein
concentrations of 0.5 to 10.0 % and droplet sizes (d32) of 0.3 and 0.6 µm were produced.
More experimental details are given in Chapter 3, Materials and methods.
Figure 4.4: Flow chart of the experimental plan
Some studies about lipid oxidation in emulsions have shown that the pH is an important
factor. A constant pH value for all sample types and over time was therefore regarded as
an essential parameter. The pH was monitored over 24 h and measured after 0, 4, 12 and
WPI solutions 0.56 % 1.12 % 2.24 % 3.36 % 4.48 % 7.84 % 11.20 %
7 x linoleic
acid
320/30 bar 30/30 bar
WPI emulsions
0.5 % 1.0 % 2.0 % 3.0 % 4.0 % 7.0 % 10.0 %
0.3 µm
WPI emulsions
0.5 % 1.0 % 2.0 % 3.0 % 4.0 % 7.0 % 10.0 %
0.6 µm
320/30 bar 30/30 bar
NaCas emulsions
0.5 % 1.0 % 2.0 % 3.0 % 4.0 % 7.0 % 10.0 %
0.3 µm
NaCas emulsions
0.5 % 1.0 % 2.0 % 3.0 % 4.0 % 7.0 % 10.0 %
0.6 µm
NaCas solutions 0.56 % 1.12 % 2.24 % 3.36 % 4.48 % 7.84 % 11.20 %
7 x linoleic
acid
Lipid hydroperoxide & Hexanal measurements
Incubation 50 °C Incubation 50 °C Incubation 50 °C Incubation 50 °C

Chapter 4: Factors affecting lipid oxidation in milk-protein-based O/W emulsions 88
24 hours of incubation time. Two independent sample containers were observed over
time for all types of emulsion. For all samples the pH was found to be within the range
6.0 ± 0.2 at all times.
The d32 values measured for WPI and NaCas emulsions at various times are given in
Table 4.2. The overall average for small droplet sized emulsions was 0.31 µm and for
large droplet sized emulsions 0.65 µm (determined by averaging mean droplet sizes
including all protein types, protein concentrations and incubations times at one pressure
stage). After 24 h, some of the emulsions showed creaming (WPI 1.0 % and 3.0 %,
large droplets) or aggregates had been formed and irreversible phase separation had
occurred (WPI 0.5 %, large and small droplets; NaCas 0.5 %, large droplets). Lipid
hydroperoxide and hexanal measurements were still carried out for these samples.
Table 4.2: Mean droplet sizes (d32 (µm)) over all protein concentrations after 0 h, 4 h, 12 h and 24 h of incubation time at 50 °C (omitting emulsions with irreversible physical instability) with standard error of the mean value* (SEM)
Protein type
Incubation
time (h)
WPI NaCas
Homogenisation
pressure
30/30 bar
Homogenisation
pressure
320/30 bar
Homogenisation
pressure
30/30 bar
Homogenisation
pressure
320/30 bar
Mean value 0.65 0.31 0.63 0.30 0 h
SEM 0.01 0.01 0.01 0.01
Mean value 0.65 0.32 0.63 0.32 4 h
SEM 0.02 0.01 0.01 0.01
Mean value 0.64 0.32 0.63 0.32 12 h
SEM 0.03 0.01 0.01 0.01
Mean value 0.74 0.31 0.67 0.32 24 h
SEM 0.05 0.01 0.02 0.01
* 12-14 replicates
Figure 4.5 and Figure 4.6 show lipid hydroperoxide and hexanal concentrations after
incubation for 4 and 24 hours, respectively.

Chapter 4: Factors affecting lipid oxidation in milk-protein-based O/W emulsions 89
(i) Concentrations of lipid hydroperoxides
In emulsions made with 10.0 % protein, the lipid hydroperoxide levels of all emulsion
types were very similar and ranged between 10 and 40 µmol/l.
Figure 4.5: Lipid hydroperoxide concentration after 4 h for all emulsion types:
WPI 0.65 µm (●), NaCas 0.65 µm (�), WPI 0.31 µm (○) or NaCas 0.31 µm (△)
For large droplet sizes more lipid hydroperoxides were formed in WPI emulsions for
protein concentrations from 4.0 % upwards compared with NaCas emulsions. The mean
values measured for WPI emulsions at 4.0, 7.0 and 10.0 % were 370, 275 and 20 µmol/l
as compared with only 185, 55 and 10 µmol/l in NaCas emulsions. Below 4.0 %
protein, the hydroperoxides were fairly similar for both protein types: with increase in
protein concentration from 0.5 to 3.0 %, the lipid hydroperoxides decreased from about
800 to 400 µmol/l.
The lipid hydroperoxide concentrations in small droplet sized emulsions were generally
lower than for large droplet sized emulsions. Only large droplet sized NaCas emulsions
0
100
200
300
400
500
600
700
800
900
1000
0 1 2 3 4 5 6 7 8 9 10
Protein Concentration (%)
Lip
id H
ydro
pe
roxi
des
(m
icro
mol
/l)
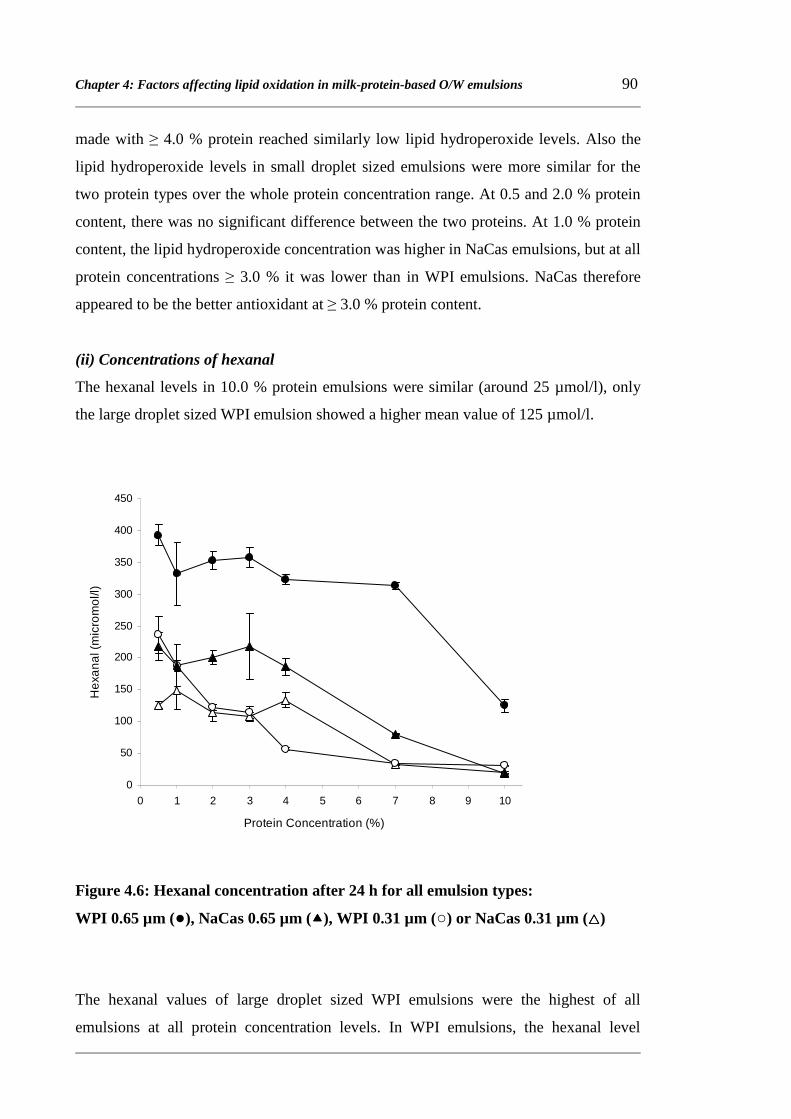
Chapter 4: Factors affecting lipid oxidation in milk-protein-based O/W emulsions 90
made with ≥ 4.0 % protein reached similarly low lipid hydroperoxide levels. Also the
lipid hydroperoxide levels in small droplet sized emulsions were more similar for the
two protein types over the whole protein concentration range. At 0.5 and 2.0 % protein
content, there was no significant difference between the two proteins. At 1.0 % protein
content, the lipid hydroperoxide concentration was higher in NaCas emulsions, but at all
protein concentrations ≥ 3.0 % it was lower than in WPI emulsions. NaCas therefore
appeared to be the better antioxidant at ≥ 3.0 % protein content.
(ii) Concentrations of hexanal
The hexanal levels in 10.0 % protein emulsions were similar (around 25 µmol/l), only
the large droplet sized WPI emulsion showed a higher mean value of 125 µmol/l.
Figure 4.6: Hexanal concentration after 24 h for all emulsion types:
WPI 0.65 µm (●), NaCas 0.65 µm (����), WPI 0.31 µm (○) or NaCas 0.31 µm (△△△△)
The hexanal values of large droplet sized WPI emulsions were the highest of all
emulsions at all protein concentration levels. In WPI emulsions, the hexanal level
0
50
100
150
200
250
300
350
400
450
0 1 2 3 4 5 6 7 8 9 10
Protein Concentration (%)
He
xan
al (
mic
rom
ol/l
)

Chapter 4: Factors affecting lipid oxidation in milk-protein-based O/W emulsions 91
ranged between 300 and 400 µmol/l at protein levels between 0.5 to 7.0 %, but above 10
% WPI the hexanal concentration markedly decreased to 125 µmol/l. For NaCas
emulsions, there was a similar behaviour for protein levels from 0.5 to 4.0 %, where the
hexanal concentration seemed to be independent of the protein concentration. The
hexanal values ranged from 190 to 220 µmol/l. At higher protein levels, there was a
great decrease in hexanal concentration with increasing protein content. Mean values
decreased from 190 to 80 to 20 µmol/l for NaCas levels of 4.0, 7.0 and 10.0 %,
respectively.
In small droplet sized NaCas emulsions, from 0.5 to 4.0 % protein content, the hexanal
concentration ranged between 110 and 150 µmol/l, but decreased to 35 and 20 µmol/l at
7.0 and 10.0 % protein, respectively. For WPI emulsions, the trend was different. With
increasing protein level above 0.5 %, the hexanal generation decreased from 235 µmol/l
(0.5 % WPI) to 55 µmol/l (4.0 % WPI). At higher WPI concentration, only a slight
further decrease could be observed (34 µmol/l at 7.0 % WPI; 31 µmol/l at 10.0 % WPI).
The probability for the difference in lipid hydroperoxide and hexanal levels of WPI and
NaCas emulsions is given in Appendix Chapter 4, Table 4B. There were no significant
differences for hexanal production in small droplet sized NaCas emulsions between 0.5
to 4.0 % protein content, but there was a significant decrease, at the 0.05 level of
probability, for small droplet sized WPI emulsions between 0.5 to 4.0 % protein content
(Appendix Chapter 4, Table 4C).

Chapter 4: Factors affecting lipid oxidation in milk-protein-based O/W emulsions 92
ANOVA results
The mean values for lipid hydroperoxides over all protein concentration levels are
depicted in Figure 4.7. The values decreased from 340 µmol/l at the 0.5 % protein level
to 40 µmol/l at the 10.0 % protein level.
Figure 4.7: Means of lipid hydroperoxides averaging protein type, droplet size and incubation time over the whole protein concentration range (p < 0.01)
10.07.04.03.02.01.00.5
350
300
250
200
150
100
50
0
Protein Concentration (%)
Mea
ns L
ipid
Hyd
rope
roxi
des
(mic
rom
ol/l)

Chapter 4: Factors affecting lipid oxidation in milk-protein-based O/W emulsions 93
The corresponding data for hexanal is shown in Figure 4.8. The hexanal mean values
decreased with increasing protein concentrations from 120 µmol/l at 0.5 % protein to 30
µmol/l at 10.0 % protein.
Figure 4.8: Means of hexanal averaging protein type, droplet size and incubation time over the whole protein concentration range (p < 0.01)
The general trend, previously discussed with the original data, that increasing protein
contents lowered the lipid oxidation rate was confirmed by the ANOVA.
It was also shown that the effect of the difference in droplet size became less important
for the production of lipid hydroperoxides with increasing protein concentration. This
characteristic was not observed for hexanal. For WPI emulsions made with 0.5 to 10.0
% protein, the differences between the lipid hydroperoxide mean values of the two
droplet sizes were slightly different than for NaCas emulsions (Figure 4.9 and Figure
4.10). A summary of the differences is given in Table 4.3.
10.07.04.03.02.01.00.5
120
100
80
60
40
20
Protein Concentration (%)
Mea
ns H
exan
al (
mic
rom
ol/l)
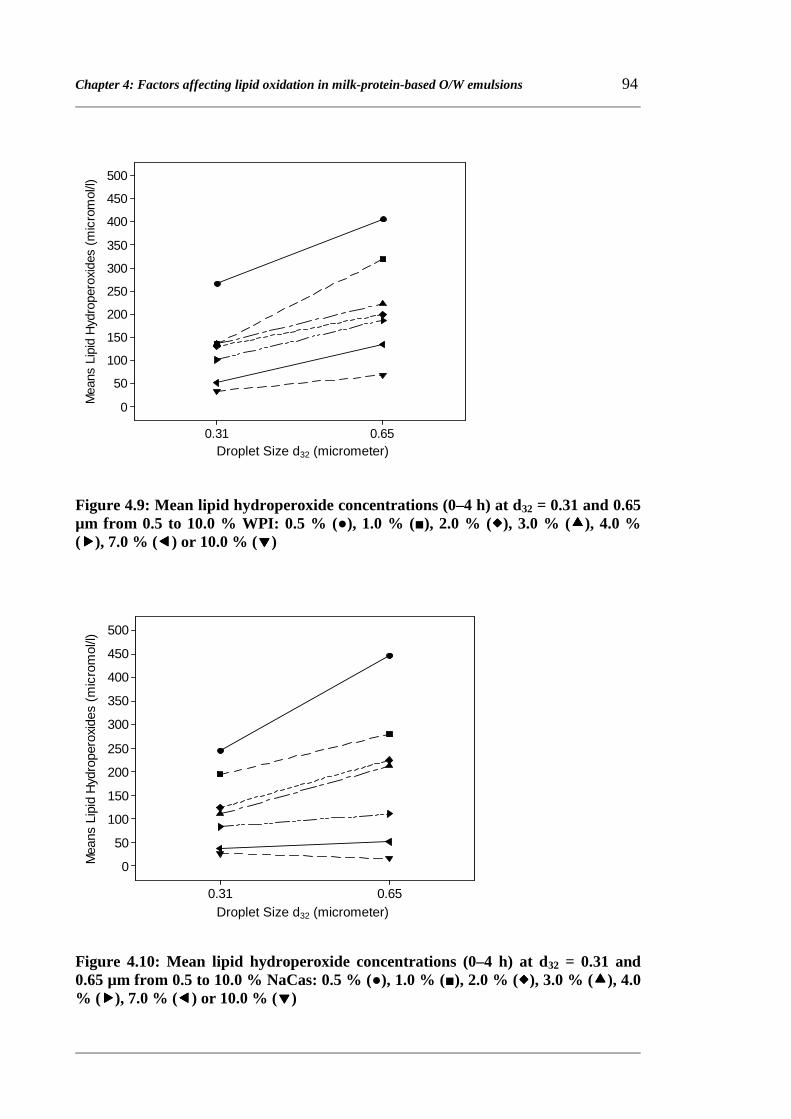
Chapter 4: Factors affecting lipid oxidation in milk-protein-based O/W emulsions 94
Figure 4.9: Mean lipid hydroperoxide concentrations (0–4 h) at d32 = 0.31 and 0.65 µm from 0.5 to 10.0 % WPI: 0.5 % (●), 1.0 % (■), 2.0 % (����), 3.0 % (����), 4.0 % (����), 7.0 % (����) or 10.0 % (����)
Figure 4.10: Mean lipid hydroperoxide concentrations (0–4 h) at d32 = 0.31 and 0.65 µm from 0.5 to 10.0 % NaCas: 0.5 % (●), 1.0 % (■), 2.0 % (����), 3.0 % (����), 4.0 % (����), 7.0 % (����) or 10.0 % (����)
0.650.31
500
450
400
350
300
250
200
150
100
50
0
Droplet Size D[3,2] (micrometer)
Mea
ns L
ipid
Hyd
rope
roxi
des
(mic
rom
ol/l)
0.650.31
500
450
400
350
300
250
200
150
100
50
0
Droplet Size d32 (micrometer)
Mea
ns L
ipid
Hyd
rope
roxi
des
(mic
rom
ol/l)
Droplet Size d32 (micrometer)
Droplet Size d32 (micrometer)

Chapter 4: Factors affecting lipid oxidation in milk-protein-based O/W emulsions 95
Table 4.3: Differences in mean lipid hydroperoxide concentrations (µmol/l) between large and small droplet sized emulsions
Protein concentration (%)
0.5 1.0 2.0 3.0 4.0 7.0 10.0
Difference in mean lipid hydroperoxide concentration between large and small droplet sized emulsions (µmol/l)
WPI emulsion 140 184 70 87 84 83 34
NaCas emulsion 200 86 101 102 28 14 - 11
In 10 % protein WPI emulsions and NaCas emulsions from 4.0 to 10.0 % protein
content, the droplet size had only little influence on lipid hydroperoxide generation. In
WPI emulsions from 2.0 to 7.0 % and NaCas emulsions from 1.0 to 3.0 % protein
content, the droplet size had a greater influence. In WPI emulsions of 0.5 and 1.0 % and
the NaCas emulsion of 0.5 % protein content, the droplet size had a strong impact on
lipid hydroperoxide production.
These results confirmed that for NaCas and also for WPI emulsions, small droplet sizes
suppressed lipid oxidation more than the large ones. Emulsions with small droplet size,
high protein level and prepared with NaCas were in general more physically stable.
Lipid oxidation did not seem to be influenced by creaming or the formation of
aggregates after 24 hours as the hexanal concentrations were not significantly different
to adjacent protein concentrations where it had not occurred. The initial droplet size
seemed to be more important for the oxidative stability.
Lipid oxidation was in general lowered by an increase of the protein concentration. This
general trend was expected as proteins had shown antioxidative potential in O/W
emulsions before. Furthermore an increase of protein concentration led to a decrease in
the difference in lipid hydroperoxide production between large and small droplet sized
emulsions. The antioxidative effect of the protein concentration appeared to offset the
effect of droplet size.
The antioxidative activity of each protein was dependent on the protein concentration
and the droplet size. It could not simply be said that NaCas exhibited greater

Chapter 4: Factors affecting lipid oxidation in milk-protein-based O/W emulsions 96
antioxidative activity than WPI. Other researchers had found that NaCas protected
emulsion lipids better from oxidation than WPI (Faraji et al. 2004; Hu et al. 2003b), but
in this study the results were more complex. NaCas was the better antioxidant in large
droplet sized emulsions of approximately 0.6 µm. Less hexanal was formed and lipid
hydroperoxide generation was more inhibited. In small droplet sized emulsions NaCas
only inhibited lipid hydroperoxide generation significantly better at protein
concentrations of 3.0 % and higher. At lower protein concentration more lipid
hydroperoxides were produced in the NaCas emulsion. In large droplet sized WPI
emulsions, the hexanal level was constant and independent of the protein concentration
up to 7.0 % but dropped at higher protein concentrations. In contrast, in small droplet
sized WPI emulsions, the hexanal level decreased depending on the WPI content from
lowest protein levels upwards. In large as well as small droplet sized NaCas emulsions,
no significant change in the hexanal level could be observed up to 4.0 % protein but it
decreased at higher protein concentrations. In small droplet sized emulsions the
increased incorporation of WPI limited hexanal and therefore off-flavour production
whereas NaCas inhibited hexanal independently of concentration. At low protein
concentrations, NaCas showed more potential to inhibit hexanal formation than WPI.
The inhibition of lipid oxidation by proteins in O/W emulsions has been shown to be
mostly due to free radical scavenging and metal ion chelation. Each protein exhibits its
own specific “portfolio” of antioxidative potential which is likely to depend on the
conditions of the system where it is employed. For most but not all conditions, NaCas
showed a greater antioxidative potential than WPI. Generally speaking, the specific
antioxidative feature of caseins is considered to be their metal chelating capacity
because of their phosphoseryl groups (Baumy and Brule 1988; Bennett et al. 2000;
Gaucheron et al. 1996) and for WPI it is its free radical scavenging activity due to free
sulfhydryl groups (Faraji et al. 2004; Hu et al. 2003a; Kiokias et al. 2007; Kiokias et al.
2006; McClements and Decker 2000; Ostdal et al. 1996; Tong et al. 2000b). In whey
protein, β-lactoglobulin contains one free sulfhydryl group (Hu et al. 2003a).
Nevertheless both characteristics – phosphoseryl and free sulfhydryl groups – are not
solely contributing to the total antioxidative capacity of the respective protein. It has
been shown that the dephosphorylation of α-, and β-casein only partially suppressed
their antioxidative activity in a liposome system (Cervato et al. 1999) and

Chapter 4: Factors affecting lipid oxidation in milk-protein-based O/W emulsions 97
caseinophosphopeptides high in phosphoseryl groups did not show the greatest
antioxidative capability in a corn O/W emulsion compared with other casein-derived
protein fractions (Diaz et al. 2003). When sulfhydryls of the high molecular weight
fraction of whey were blocked with NEM in aqueous solution its AAPH-radical-
scavenging activity was only reduced by 20 % (Tong et al. 2000b) and when skim milk
was treated with NaBH4 the concentration of sulfhydryls strongly increased but the
oxygen uptake was only moderately lowered in an oxidation trial (Taylor and
Richardson 1980b).
Moreover, each of the two milk proteins features both mechanisms, metal chelation and
free radical scavenging. For example, a high molecular weight fraction of whey chelated
ferrous iron in the continuous phase of a bovine serum albumin/hexadecane emulsion
(Tong et al. 2000b) and WPI exhibited ferric iron binding capacity in aqueous solution,
although not as much as NaCas, which bound about five fold more (Faraji et al. 2004).
Caseins and peptides from tryptic hydrolysis of casein showed AAPH-radical-
scavenging activity in a linoleic acid/Triton X-100 emulsion (Rival et al. 2001a).
Besides the question what molecular characteristics caused the antioxidative function of
WPI and NaCas, it is also relevant to question where the antioxidative mechanisms
predominantly took place. In the next chapter therefore the role of each protein in the
different phases, interfacial and continuous, of the emulsion has been examined.
4.3 Role of unadsorbed protein in lipid oxidation In section 4.2, it was observed that an increase in the protein concentration led to more
oxidative stability of the emulsion. In O/W emulsions, only a limited amount of
emulsifier can be adsorbed to form the interface of the emulsion droplets. The rest
remains as excess in the continuous phase of the emulsion. This leads to the question
what role the unadsorbed protein plays in oxidative stability. To investigate the role of
continuous phase protein, a protein saturated and stable interface is required. It has been
shown that the interface in WPI-based O/W emulsions (5 % oil) was saturated when the
WPI concentration reached 0.2 % (Donnelly et al. 1998; Hu et al. 2003a). Dalgleish et
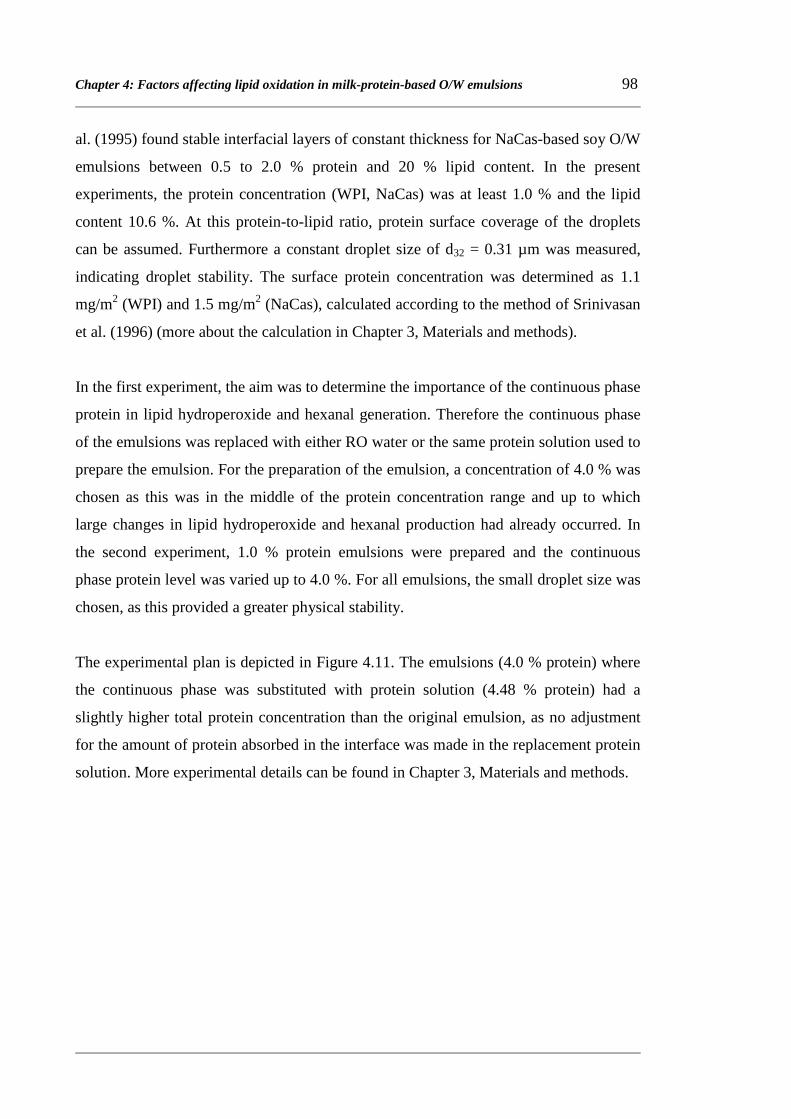
Chapter 4: Factors affecting lipid oxidation in milk-protein-based O/W emulsions 98
al. (1995) found stable interfacial layers of constant thickness for NaCas-based soy O/W
emulsions between 0.5 to 2.0 % protein and 20 % lipid content. In the present
experiments, the protein concentration (WPI, NaCas) was at least 1.0 % and the lipid
content 10.6 %. At this protein-to-lipid ratio, protein surface coverage of the droplets
can be assumed. Furthermore a constant droplet size of d32 = 0.31 µm was measured,
indicating droplet stability. The surface protein concentration was determined as 1.1
mg/m2 (WPI) and 1.5 mg/m2 (NaCas), calculated according to the method of Srinivasan
et al. (1996) (more about the calculation in Chapter 3, Materials and methods).
In the first experiment, the aim was to determine the importance of the continuous phase
protein in lipid hydroperoxide and hexanal generation. Therefore the continuous phase
of the emulsions was replaced with either RO water or the same protein solution used to
prepare the emulsion. For the preparation of the emulsion, a concentration of 4.0 % was
chosen as this was in the middle of the protein concentration range and up to which
large changes in lipid hydroperoxide and hexanal production had already occurred. In
the second experiment, 1.0 % protein emulsions were prepared and the continuous
phase protein level was varied up to 4.0 %. For all emulsions, the small droplet size was
chosen, as this provided a greater physical stability.
The experimental plan is depicted in Figure 4.11. The emulsions (4.0 % protein) where
the continuous phase was substituted with protein solution (4.48 % protein) had a
slightly higher total protein concentration than the original emulsion, as no adjustment
for the amount of protein absorbed in the interface was made in the replacement protein
solution. More experimental details can be found in Chapter 3, Materials and methods.

Chapter 4: Factors affecting lipid oxidation in milk-protein-based O/W emulsions 99
Figure 4.11: Flow chart of the experimental plans
The droplet size was determined as d32 in WPI and NaCas emulsions (4.0 % protein)
and ranged for all sample types from 0.28 to 0.32 µm within the 24 h incubation period.
In Figure 4.12 and Figure 4.13, the generation of lipid hydroperoxides and hexanal is
shown. In Appendix Chapter 4, Table 4D it is shown which samples were significantly
different.
WPI or NaCas (4.48 %) solution
Linoleic acid
320/30 bar
WPI or NaCas (4.0 %) emulsion
RO water added
WPI or NaCas (4.48 %)
solution added
WPI and NaCas emulsion, continuous
phase RO water
WPI and NaCas emulsion,
continuous phase 4.48 % WPI or
NaCas
Vortex
Centrifugation
Continuous phase taken out
Incubation 50 °C
Lipid hydroperoxide & Hexanal measurements
2 x
Vortex
320/30 bar
WPI or NaCas (1.0 %) emulsion
Centrifugation
Continuous phase taken out
WPI or NaCas (1.12 %) solution
Linoleic acid
RO water added
WPI or NaCas 0.5 %
added
WPI or NaCas 2.0 %
added
WPI or NaCas 4.0 %
added
Vortex Vortex Vortex Vortex
WPI and NaCas 1 % emulsions with WPI / NaCas continuous phase content of:
0 % 0.5 % 2.0 % 4.0 %
Incubation 50 °C
Incubation 50 °C
Lipid hydroperoxide & Hexanal measurements
2 x

Chapter 4: Factors affecting lipid oxidation in milk-protein-based O/W emulsions 100
Figure 4.12: Lipid hydroperoxide development over 4 h in milk protein (4.0 %) emulsions with replaced continuous phase: WPI emulsion where continuous phase was replaced with RO water (△△△△), WPI control emulsion (◇◇◇◇), WPI emulsion where continuous phase was replaced with WPI (4.48 %) solution (□), NaCas emulsion where continuous phase was replaced with RO water (����), NaCas control emulsion (����) or NaCas emulsion where continuous phase was replaced with NaCas (4.48 %) solution (■)
After 4 h, the lipid hydroperoxide level of the WPI control emulsion rose to 250 µmol/l
but only to 150 µmol/l in the NaCas control. When the continuous phase was replaced
with RO water the lipid hydroperoxides rose to 380 µmol/l in the WPI and to 190
µmol/l in the NaCas emulsion. When the continuous phase was replaced with protein
solution the lipid hydroperoxides were reduced to 190 µmol/l in the WPI and to 75
µmol/l in the NaCas emulsion. The same tendency was observed for WPI as well as
NaCas emulsions i.e. the replacement of the continuous phase with RO water increased
the lipid hydroperoxide production and the replacement with protein solution lowered it
compared with the control emulsion. Furthermore, the lipid hydroperoxide
concentration was lower in NaCas emulsions than in WPI emulsions.
0
50
100
150
200
250
300
350
400
450
0 2 4
Incubation Time (h)
Lipi
d H
ydro
pero
xide
s (m
icro
mo
l/l)

Chapter 4: Factors affecting lipid oxidation in milk-protein-based O/W emulsions 101
Figure 4.13: Hexanal development over 24 h in milk protein (4.0 %) emulsions with replaced continuous phase: WPI emulsion where continuous phase was replaced with RO water (△△△△), WPI control emulsion (◇◇◇◇), WPI emulsion where continuous phase was replaced with WPI (4.48 %) solution (□), NaCas emulsion where continuous phase was replaced with RO water (����), NaCas control emulsion (����) or NaCas emulsion where continuous phase was replaced with NaCas (4.48 %) solution (■)
After 24 h the hexanal level of the WPI control emulsion rose to 60 µmol/l and to 125
µmol/l in the NaCas control. These values were very similar to the hexanal results found
in the previous section (WPI and NaCas, 4.0 %, 0.3 µm, 24 h). When the continuous
phase was replaced with RO water the hexanal level rose to 160 µmol/l in the WPI but
only to 95 µmol/l in the NaCas emulsion. When the continuous phase was replaced with
protein solution the hexanal level was at 65 µmol/l in the WPI and at 105 µmol/l in the
NaCas emulsion after 24 h.
The hexanal production in WPI and NaCas emulsions was different for different
treatments. The hexanal level was very similar and not significantly different (Appendix
Chapter 4, Table 4D) when the continuous phase was replaced with WPI solution (65
µmol/l) compared with the WPI control (60 µmol/l). However, the hexanal level was
much higher when RO water was in the continuous phase (160 µmol/l). For NaCas there
0
20
40
60
80
100
120
140
160
180
0 12 24
Incubation Time (h)
He
xan
al (
mic
rom
ol/l)

Chapter 4: Factors affecting lipid oxidation in milk-protein-based O/W emulsions 102
was not much difference – although significant – in all three emulsion types: NaCas
control emulsion (125 µmol/l), replacement with NaCas solution (105 µmol/l) and
replacement with RO water (95 µmol/l). It is believed that the random variation of
hexanal levels observed for NaCas emulsions with 0.5 to 4.0 % protein content
(between 100 to 150 µmol/l hexanal) – see Figure 4.6 – is also mirrored in these results.
This may indicate a low influence of continuous phase NaCas on hexanal generation.
The droplet size in WPI and NaCas emulsions (1.0 % protein) ranged for all sample
types from d32 = 0.28 to 0.34 µm within the 24 h incubation period. Figure 4.14 and
Figure 4.15 show lipid hydroperoxide and hexanal concentrations with various
continuous phase protein levels after 4 and 24 h respectively.
Figure 4.14: Lipid hydroperoxide concentration after 4 h in milk protein emulsions with various continuous phase protein levels: WPI (◇◇◇◇), NaCas (■)
The lipid hydroperoxide concentration was significantly lower for NaCas compared
with WPI emulsions over the whole protein concentration range (Figure 4.14 and
Appendix Chapter 4, Table 4F). Generally there was a decrease in lipid hydroperoxide
concentration with increasing continuous phase protein level. For WPI emulsions, it
0
100
200
300
400
500
600
700
800
900
0 1 2 3 4
Continuous Phase Protein Concentration (%)
Lipi
d H
ydro
pero
xide
s (m
icro
mol
/l)

Chapter 4: Factors affecting lipid oxidation in milk-protein-based O/W emulsions 103
decreased from 825 µmol/l (0 %) to 710 µmol/l (0.5 %) to 340 µmol/l (2.0 %) and 165
µmol/l (4.0 %). For NaCas emulsions, there was first an increase in lipid
hydroperoxides from 470 µmol/l (0 %) to 565 µmol/l (0.5 %). Thereafter it dropped to
215 µmol/l (2.0 %) and 120 µmol/l (4.0 %). The lipid hydroperoxide mean values were
significantly different within one protein type (Appendix Chapter 4, Table 4E).
Figure 4.15: Hexanal concentration after 24 h in milk protein emulsions with various continuous phase protein levels: WPI (◇◇◇◇), NaCas (■)
The hexanal concentration decreased from 270 µmol/l (0 %) to 150 µmol/l (0.5 %) to 80
µmol/l (2.0 %) to 50 µmol/l (4.0 %) in WPI emulsions (Figure 4.15). In contrast, the
hexanal concentration in NaCas emulsions (0.5 to 4.0 % protein) did not change
significantly with protein concentration (125 µmol/l, 108 µmol/l, 112 µmol/l, 126
µmol/l with increasing protein level). The hexanal values were significantly different
for all continuous phase WPI levels but not for most NaCas levels (Appendix Chapter 4,
Table 4E).
0
50
100
150
200
250
300
0 1 2 3 4
Continuous Phase Protein Concentration (%)
Hex
ana
l (m
icro
mol
/l)

Chapter 4: Factors affecting lipid oxidation in milk-protein-based O/W emulsions 104
4.4 Addition of milk protein solutions to milk-protein-based emulsions and the influence on lipid oxidation
In the previous results, NaCas was particularly antioxidative towards lipid
hydroperoxide formation and delivered lower hexanal levels at low protein
concentrations. In contrast, the inhibition of hexanal generation in WPI emulsions was
concentration dependent, and hexanal levels were higher at low protein concentrations.
The continuous phase protein level contributed largely to these effects. The next
experiment was carried out to determine whether the positive characteristics of both
proteins could be combined. The emulsions were diluted with milk protein solutions to
find out if the low hexanal level in NaCas emulsions (1.0 % protein) could be further
lowered by dilution with WPI solution, and if the lipid hydroperoxide production in
WPI emulsions could be decreased by dilution with NaCas solution.
Whether or not similar results could be obtained by using different protein
concentrations was also tested. If 2.0 % WPI or NaCas solution was added to a 1.0 %
WPI or NaCas emulsion this would increase the continuous phase protein concentration,
and the lipid hydroperoxide production should be inhibited for either protein type. Also,
less hexanal generation might be expected in the case of WPI but not NaCas addition, as
only an increase of continuous phase WPI lowered the hexanal generation (up to 4 %
protein). If the emulsions were diluted with RO water (i.e. a decrease of the continuous
phase protein concentration) it would be expected that more lipid hydroperoxides would
be formed for both protein types. Also more hexanal would be produced in WPI than
NaCas emulsions diluted with RO water as a change of continuous phase WPI caused
more changes in hexanal production.
The experimental plan is depicted in Figure 4.16. The diluents were added to the
emulsions in the lipid hydroperoxide and hexanal measurement containers. The same
amount of linoleic acid was therefore present in the measurement containers with
diluted and undiluted emulsions. In diluted emulsions, the new lipid concentration was
7.1 % and the new protein concentration 0.7 % (dilution with RO water) and 1.3 %
(dilution with protein solution).
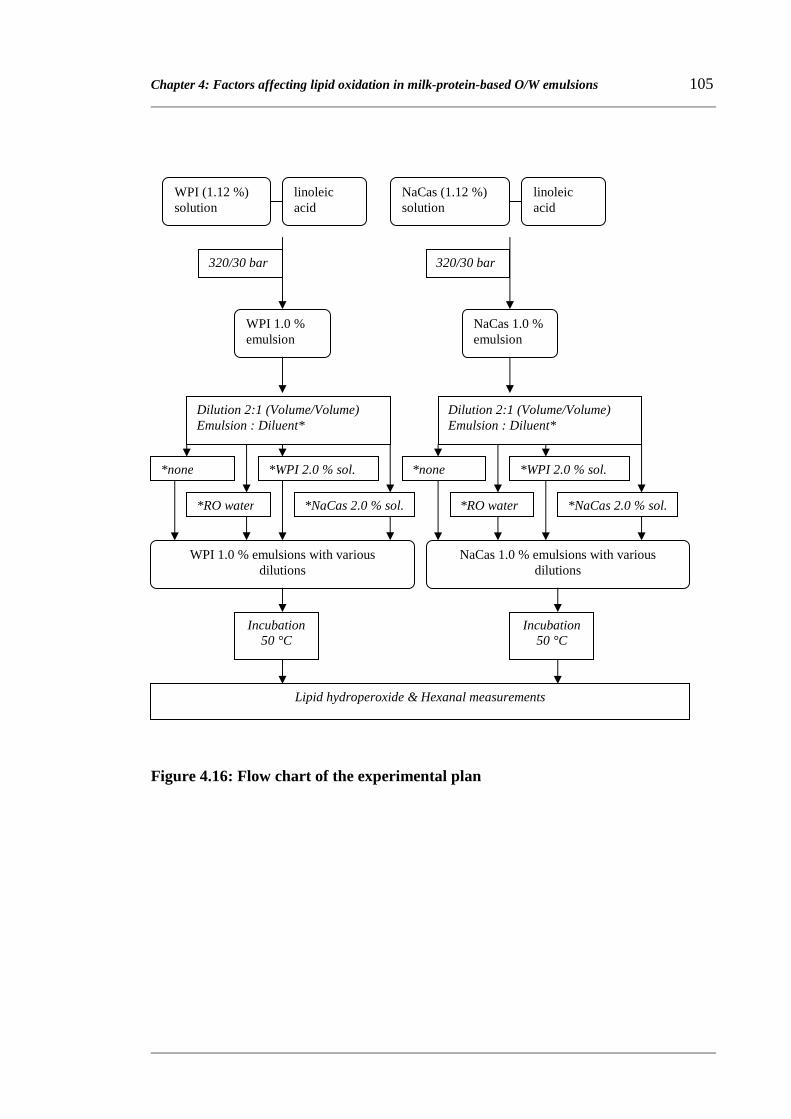
Chapter 4: Factors affecting lipid oxidation in milk-protein-based O/W emulsions 105
Figure 4.16: Flow chart of the experimental plan
WPI (1.12 %) solution
linoleic acid
NaCas (1.12 %) solution
linoleic acid
320/30 bar
WPI 1.0 % emulsion
320/30 bar
NaCas 1.0 % emulsion
Dilution 2:1 (Volume/Volume) Emulsion : Diluent*
Dilution 2:1 (Volume/Volume) Emulsion : Diluent*
*none
*RO water
*WPI 2.0 % sol.
*NaCas 2.0 % sol.
*none
*RO water
*WPI 2.0 % sol.
*NaCas 2.0 % sol.
WPI 1.0 % emulsions with various dilutions
NaCas 1.0 % emulsions with various dilutions
Incubation 50 °C
Lipid hydroperoxide & Hexanal measurements
Incubation 50 °C

Chapter 4: Factors affecting lipid oxidation in milk-protein-based O/W emulsions 106
The development of lipid hydroperoxides and hexanal is shown in Figure 4.17 and
Figure 4.18. The significance of the difference between samples is shown in Appendix
Chapter 4, Table 4G.
Figure 4.17: Dilution of emulsions with protein solutions and the effect on lipid hydroperoxide generation: WPI (1.0 %) emulsion (◇◇◇◇), WPI (1.0 %) emulsion + RO water (2:1) (□), WPI (1.0 %) emulsion + WPI (2.0 %) solution (2:1) (△△△△), WPI (1.0 %) emulsion + NaCas (2.0 %) solution (○), NaCas (1.0 %) emulsion (����), NaCas (1.0 %) emulsion + RO water (2:1) (■), NaCas (1.0 %) emulsion + NaCas (2.0 %) solution (2:1) (����) or NaCas (1.0 %) emulsion + WPI (2.0 %) solution (2:1) (●)
The dilution of both emulsion types with RO water led to the highest lipid
hydroperoxide values of all samples (Figure 4.17). The mean values for lipid
hydroperoxides were 800 µmol/l and 900 µmol/l for WPI and NaCas emulsions diluted
with RO water, respectively, after 4 h. For the undiluted NaCas emulsion and the
undiluted WPI emulsion, these values were 660 and 575 µmol/l respectively. The
NaCas emulsion diluted with NaCas solution exhibited 490 µmol/l lipid
hydroperoxides. It was not significantly different from the WPI emulsion diluted with
0
100
200
300
400
500
600
700
800
900
1000
0 2 4
Incubation Time (h)
Lipi
d H
ydro
pero
xide
s (m
icro
mol
/l)

Chapter 4: Factors affecting lipid oxidation in milk-protein-based O/W emulsions 107
WPI solution which gave 475 µmol/l. The NaCas emulsion diluted with WPI solution
showed a slightly lower mean value of 425 µmol/l. The lowest of all mean values (315
µmol/l) was found in the WPI emulsion diluted with NaCas solution.
Figure 4.18: Dilution of emulsions with protein solutions and the effect on hexanal generation: WPI (1.0 %) emulsion (◇◇◇◇), WPI (1.0 %) emulsion + RO water (2:1) (□), WPI (1.0 %) emulsion + WPI (2.0 %) solution (2:1) (△△△△), WPI (1.0 %) emulsion + NaCas (2.0 %) solution (2:1) (○), NaCas (1.0 %) emulsion (����), NaCas (1.0 %) emulsion + RO water (2:1) (■), NaCas (1.0 %) emulsion + NaCas (2.0 %) solution (2:1) (����) or NaCas (1.0 %) emulsion + WPI (2.0 %) solution ) (2:1) (●)
The hexanal concentrations of several samples were fairly similar after 24 h and not
significantly different (Figure 4.18 and Appendix Chapter 4, Table 4G). The values
ranged between 75 and 90 µmol/l. The WPI emulsion diluted with WPI solution gave a
lower hexanal concentration of 60 µmol/l. When both proteins were combined the
hexanal level was the same and overall the lowest (45 µmol/l).
0
10
20
30
40
50
60
70
80
90
100
0 12 24
Incubation Time (h)
Hex
anal
(m
icro
mol
/l)

Chapter 4: Factors affecting lipid oxidation in milk-protein-based O/W emulsions 108
Table 4.4: Absolute values and relative values of lipid hydroperoxides and hexanal compared with the undiluted control emulsion
Sample Type Lipid
hydroperoxides after 4 h (µmol/l)
Hexanal
after 24 h (µmol/l)
Difference in lipid
hydroperoxides
after 4 h compared to
control (µmol/l)
Difference in hexanal
after 24 h compared to
control (µmol/l) WPI control* 577 85.4 0 0
WPI + RO water* 801 89.0 + 224 + 3.4
WPI + WPI* 477 72.1 - 100 - 13.3
WPI + NaCas* 315 45.6 - 262 - 39.8
NaCas control* 659 76.9 0 0
NaCas + RO water* 898 79.1 + 239 + 2.2
NaCas + NaCas* 492 79.6 - 167 + 2.7
NaCas + WPI* 427 46.1 - 232 - 30.8
* Explanation of the samples: WPI control = WPI (1 %) emulsion, WPI + RO water = WPI (1 %) emulsion + RO water (2:1), WPI + WPI = WPI (1 %) emulsion + WPI (2 %) solution (2:1), WPI + NaCas = WPI (1 %) emulsion + NaCas (2 %) solution (2:1), NaCas control = NaCas (1 %) emulsion, NaCas + RO water = NaCas (1 %) emulsion + RO water (2:1), NaCas + NaCas = NaCas (1 %) emulsion + NaCas (2 %) solution (2:1), NaCas + WPI = NaCas (1 %) emulsion + WPI (2 %) solution (2:1)
An overview about the actual effects in terms of increase or decrease in the lipid
oxidation rate compared with the undiluted control emulsion of the respective protein
type is given in Table 4.4. More lipid hydroperoxides were generated in both WPI and
NaCas emulsions diluted with RO water but there was no significant increase in hexanal
generation in either type of emulsion. In WPI emulsion diluted with WPI solution,
considerably less lipid hydroperoxides were produced, and in NaCas emulsions diluted
with NaCas solution there was an even stronger decrease in lipid hydroperoxides. The
decrease in hexanal production was much smaller and not significant for the NaCas
emulsion diluted with NaCas solution (compared with the WPI emulsion diluted with
WPI solution). NaCas caused a stronger lipid hydroperoxide decrease in the WPI
emulsion than WPI in the NaCas emulsion and NaCas was much more effective in
reducing hexanal in the WPI emulsion than WPI added to the NaCas emulsion. The
combination of both milk proteins had a stronger antioxidative effect than a single
protein alone.

Chapter 4: Factors affecting lipid oxidation in milk-protein-based O/W emulsions 109
These experiments have shown how the presence or absence of continuous phase
protein influenced lipid oxidation. The initial protein concentration used to prepare the
emulsions appeared to have influenced lipid oxidation in terms of altering the
continuous phase protein concentration. This was indicated by similar values of lipid
hydroperoxides (4 h) and hexanal (24 h) over the protein and continuous phase protein
concentration (comparison of data in Section 4.2 and present data). The lower the
continuous phase protein concentration of either milk protein type was, the more lipid
hydroperoxides were produced. With increasing continuous phase protein concentration
the hexanal production decreased in the WPI, but not in the NaCas emulsion where it
remained constant.
The dilution of milk protein emulsions (2:1, volume emulsion/volume diluent) with RO
water or the protein solution used to prepare the emulsion led, for most sample types, to
the expected effects. In comparison to their control, WPI and NaCas emulsions showed
higher lipid hydroperoxide levels with decreased continuous phase protein content.
Furthermore, neither increase nor decrease of continuous phase NaCas level led to a
change of the hexanal concentration in the NaCas emulsion. However, an increase of
continuous phase WPI led to the expected decrease of hexanal in the WPI emulsion.
When both milk proteins were combined, a synergistic antioxidative effect could be
observed that was much stronger than when any of the two proteins was used alone.
Especially when WPI emulsion was enriched with NaCas solution, lipid oxidation was
markedly inhibited. A positive antioxidative interaction of the two proteins appears to
have taken place.
4.5 General discussion
McClements and Decker (2000) pointed out that the driving factor in lipid oxidation of
O/W emulsions is the decomposition of lipid hydroperoxides in the presence of
transition metals. Higher concentrations of lipid hydroperoxides may be present at the
interface due to their partially polar character. Benjelloun et al. (1991) have shown that
conventionally processed food oil contained traces of iron and copper and that the

Chapter 4: Factors affecting lipid oxidation in milk-protein-based O/W emulsions 110
treatment with chelators markedly slowed down lipid oxidation. Although there might
be only traces of metals in the oil phase of an emulsion, the immediate proximity to
oxidisable substrate increases their significance. In protein-stabilised emulsions, it also
appears likely that they would associate with anionic protein moieties on the inner side
of the interface due to their positive charge. There might be a lower metal concentration
in the non-polar lipid core of droplets. In the present study there is a possibility that an
antioxidative mechanism took place where interfacial proteins bound trace metal ions
from the oil phase, preventing their interaction with lipids and lipid hydroperoxides.
Furthermore, some of those interfacial protein molecules might have taken part in a
dynamic exchange process with protein molecules from the continuous phase.
A study of Cho et al. (2003) greatly supports the theory of transfer of iron from the lipid
to the continuous phase. With increasing concentrations of chelators (EDTA, sodium
tripolyphosphate or citrate) in the continuous phase of an O/W emulsion (emulsifier:
polyoxyethylene 10-lauryl ether), they observed a stronger depletion of ferric iron from
the lipid phase. As a consequence lipid oxidation in the emulsion was more inhibited.
In the present study a small proportion of the total metal content may be incorporated
into the emulsion system via the proteins and the aqueous solution. A possible external
source of metal ions could have been the homogenisation process where the emulsion is
exposed to stainless steel surfaces on the pre-blender and homogeniser. Some metal ions
probably entered the system in association with proteins. Protein bound metal ions do
not necessarily take part in the lipid oxidation process if they are strongly bound into the
protein structure. In addition, proteins can chelate externally added metal ions.
Tong et al. (2000b) reported that the addition of ferrous iron to a bovine-serum-
albumin-stabilised emulsion turned the initially negative zeta-potential to a positive
value. When EDTA and also a high molecular weight fraction of whey protein were
added to the continuous phase the value was lowered again below the level before iron
addition. When EDTA and that whey protein fraction were added to a Tween 20
emulsion, a lower lipid oxidation rate was observed. This indicated that the whey
protein and EDTA could partly have had the same antioxidative mechanism i.e. the
removal of metal ions from the droplet surface into the continuous phase and thereby

Chapter 4: Factors affecting lipid oxidation in milk-protein-based O/W emulsions 111
preventing iron from further interaction with lipids and lipid hydroperoxides. In a
similar study, Mei et al. (1998a) found that ferrous and ferric iron associated with the
surface of negatively charged droplets of a SDS-stabilised n-hexadecane emulsion, as
indicated by an increase of the zeta-potential. In emulsions with neutral and cationic
surface charge, this was not observed. Chelators (EDTA, phytate) depleted the metal
ions from the surface of the SDS-stabilised droplets into the continuous phase
depending on their concentration. In the presence of chelators also, lipid oxidation in a
SDS-stabilised salmon O/W emulsion was inhibited. In the study of Hu et al. (2003a)
WPI-based salmon O/W emulsions were more oxidatively stable at pH 3 than at pH 7.
They attributed the finding to the positive charge of WPI on the droplet surface at pH 3,
repelling metal ions into the continuous phase. Carboxy and amino groups are either
protonated (low pH, net positive charge below the pI) or deprotonated (high pH, net
negative charge above the pI). A net negative charge causes more cation attraction than
repulsion and for a net positive charge it is the other way around (Remondetto et al.
2004). These findings underline the significance of iron located at the interface of
emulsion droplets for the lipid oxidation process.
In the present study, proteins of WPI and NaCas, located at the droplet surface and in
the continuous phase, were presumably negatively charged as the pH value (pH 6) was
above the pI of the proteins (pI whey protein: pH 5.2 (Ju and Kilara 1998), pI NaCas:
pH 4.6 (Chen et al. 1999)). Metal ions would therefore have been attracted to the droplet
surface as well as to the proteins in the continuous phase. On the other hand, the
proportion of negatively charged proteins present in the continuous phase increased
with increase in protein concentration in the system, whereas the negative charge on the
droplets remained at the same level. Therefore, the removal of positively charged iron
from the droplet surface into the continuous phase appears more likely to occur at the
higher continuous phase protein concentrations. The relative affinity of various milk
proteins for ferric iron was found to decrease in the following order: αs1-casein > β-
casein > bovine serum albumin > κ-casein > β-lactoglobulin > α-lactalbumin. (Hekmat
and McMahon 1998). In αs1-, αs2- and β-caseins, phosphorylated side chains of serine
are located in the polar moieties of the proteins, which exhibit chelation capacity for
ferric iron. Furthermore, the Fe2+/Fe3+ equilibrium is thereby affected and this can
promote the conversion of ferrous to ferric iron. Since ferric iron is less pro-oxidative,

Chapter 4: Factors affecting lipid oxidation in milk-protein-based O/W emulsions 112
this process would be advantageous (Elias et al. 2008). Ferrous iron is required for the
reaction of lipid hydroperoxides to secondary oxidation products via alkoxyl radicals
(Frankel 1998b; McClements and Decker 2000).
For whey proteins, bovine serum albumin can chelate one cupric ion per molecule and
inhibited copper-catalysed oxidation of low density lipoproteins (Elias et al. 2008;
Schnitzer et al. 1997). The copper concentration in food is generally lower than the iron
concentration but copper is also deemed more pro-oxidative (Elias et al. 2008). A
prominent iron chelator in whey is the minor whey protein lactoferrin. It also contains
iron in its native state and has about 78 to 85 % more iron binding capacity (Satue-
Gracia et al. 2000; Steijns and van Hooijdonk 2000). Lactoferrin can bind two ferric
ions per molecule (Nielsen et al. 2004). It has also shown antioxidative capacity added
to milk, mayonnaise and an infant formula (Nielsen et al. 2004; Satue-Gracia et al.
2000). On the other hand, heat processing is expected to change the structure of
lactoferrin irreversibly leading to reduced activity (Brisson et al. 2007). Lactoferrin as
part of the WPI used in the present experiments might therefore have had limited
chelation capacity as WPI production involves an elevated temperature in the spray
drying process. Besides the specific metal chelation abilities of certain milk proteins,
general binding mechanisms exist as amino acid side chains of aspartic acid, glutamic
acid, histidine, phosphorylated serine, threonine, arginine and lysine (Arcan and
Yemenicioglu 2007; Elias et al. 2008) can bind metal ions. Most of these amino acids
are commonly found in proteins and would also account for some of the metal binding
capacity of WPI and NaCas.
In combination with pro-oxidative transition metals, free radicals are the other driving
force in lipid oxidation. One free radical source in O/W emulsions is the lipid phase.
Because of the susceptibility of unsaturated fatty acids towards oxidation, at least a low
level of free radicals is generally present in the raw material. Homogenisation, a process
with a high energy input, contributes to the formation of free radicals that will be
located in continuous phase, interface and oil phase. Continuous-phase-born free
radicals that have been created during homogenisation can possibly migrate to the lipid
phase (Coupland et al. 1996). In the presence of oxygen, peroxyl radicals are formed
from lipid radicals leading further to hydroperoxides. Lipid hydroperoxides are
Chapter 4: Factors affecting lipid oxidation in milk-protein-based O/W emulsions 113
commonly located at the interface of the emulsion droplets. They are either produced
there or diffuse to there from the non-polar droplet core (Nuchi et al. 2002). With the
decomposition of lipid hydroperoxides by ferrous and ferric iron, alkoxyl- and peroxyl
radicals are created respectively. They are a vital element for the propagation of lipid
oxidation (McClements and Decker 2000). Interference at this stage of lipid oxidation
by free radical scavengers is therefore an important antioxidative mechanism.
A high concentration of continuous phase protein, as in the present system, increases the
potential for free radical scavenging in continuous phase, interface and lipid phase. An
imaginable antioxidative mechanism could have been the scavenging of alkoxyl and
peroxyl radicals by interfacial protein and continuous phase protein, which accessed
interfacial regions with high levels of those radicals. The access would partly have
depended on the property of the interface to act as physical barrier. Particularly caseins
can form thick interfacial layers of ≤ 10 nm and for whey proteins 1–2 nm thick
interfacial layers have been reported (Dalgleish 1993; Dalgleish et al. 1995; Fang and
Dalgleish 1993; Mackie et al. 1991). In spite of this, low molecular weight compounds
of WPI and NaCas, with possible free-radical-scavenging activity, might have entered
those interfacial areas from the continuous phase.
On the other hand, the access of oxygen and metal ions from the continuous phase could
have been restricted by a thick interfacial barrier, leading to more oxidative stability.
This aspect might have played a role for large droplet sized emulsions of 4.0 and 7.0 %
protein content as much less lipid hydroperoxides were generated in NaCas than in WPI
emulsions. The transfer of oxygen might have been more limited across thicker casein
than whey protein interfaces. However, as continuous phase protein appeared to greatly
influence the oxidative stability of the emulsions, interaction between larger molecules
than oxygen with susceptible lipids and lipid hydroperoxides did probably occur. A
restriction of the oxygen transfer across the protein interfaces seems therefore not so
likely. As metal ions have a somewhat similar size like oxygen molecules – compared
with larger organic molecules of the protein fractions – the protein interfaces would
probably also not inhibit metal ion migration by means of acting as physical barrier.
Chapter 4: Factors affecting lipid oxidation in milk-protein-based O/W emulsions 114
Whey proteins have been shown to exhibit free-radical-scavenging activity via free
sulfhydryls and other mechanisms (Elias et al. 2006; Pazos et al. 2006; Tong et al.
2000b). Also caseins were found to scavenge free radicals (Diaz and Decker 2004;
Rival et al. 2001a). The free sulfhydryl groups of β-lactoglobulin represent a specific
molecular feature in whey protein that causes free radical scavenging ability. Although
this feature has been referred to many times, there are also other free-radical-scavenging
mechanisms in whey proteins and proteins in general.
Elias et al. (2008) points out that all 20 amino acids can form new radicals if the energy
level of the radical they get in contact with is high enough, for example hydryoxyl
radicals. But only if the new protein radical is on a low energy level with little reactivity
that restricts the passing on of the free radical to susceptible materials like unsaturated
lipids, the free-radical-scavenging process is antioxidative. In that respect, the three
dimensional structure of the protein plays a role as free radicals can be directed to the
proteins` interior where they are locally separated and not harmful to other substrates.
An example are the findings of Ostdal et al. (1999) who found that tyrosyl radicals in
the interior of bovine serum albumin were stable and long lived unlike reactive and
short lived free tryrosine radicals.
Besides low reactivity of protein radicals, an important antioxidative feature is that they
are easily generated in the first place, thereby allowing interference with the radical
chain reactions in lipid oxidation. Elias et al. (2005), for example, found that free
sulfhydryls and tryptophan residues of continuous phase β-lactoglobulin oxidised before
they could detect lipid oxidation in a Brij-stabilised menhaden O/W emulsion. In
general, the ability of a protein to interact with or scavenge free radicals can be
indicated by the oxidation of amino acid side chains. Their modification suggests that
they are a preferred target and marks them as a reaction partner of free radicals in
competition with unsaturated fatty acids. In this way, unsaturated fatty acids are
protected from oxidation.
Free radicals as part of esterified unsaturated fatty acids probably also led to the
oxidation of free sulfhydryls (first) and tryptophan (second) but not methionine residues
of continuous phase β-lactoglobulin in a Brij-stabilised menhaden O/W emulsion (Elias

Chapter 4: Factors affecting lipid oxidation in milk-protein-based O/W emulsions 115
et al. 2005). In whey protein-stabilised O/W emulsions, tryptophan side chains oxidised
on the interface (Rampon et al. 2001; Viljanen et al. 2005). Another example where the
free sulfhydryl level decreased was given by Tong et al. (2000b) who added whey
protein to the continuous phase of a Tween 20/salmon O/W emulsion. However, in
regard of sulfhydryl groups also pro-oxidative activity has been found. Hu et al.(2003a)
prepared salmon O/W emulsions with WPI and found that the blockage of free
sulfhydryls with N-ethylmaleimide (NEM) did not change lipid hydroperoxide
generation but propanal production was more inhibited. Wong and Kitts (2003) found
that the capacity of whey to reduce ferric to ferrous iron correlated with the free
sulfhydryl content. If free sulfhydryls can generate more ferrous iron, they could
therefore act as pro-oxidants under certain conditions.
The findings of Hernandez-Ledesma et al. (2005) support the idea that free-radical-
scavenging activity of a protein is probably not the sum of the free-radical-scavenging
activity of its amino acid side chains. They found that specific peptides from
hydrolysates of β-lactoglobulin and α-lactalbumin scavenged free radicals better or less
effective, but not equally like the equimolar mixtures of their constituting amino acids.
This indicates that the free-radical-scavenging activity of proteinaceous material
(proteins, peptides and amino acids) probably depends on the interaction of the single
compounds or moieties in the case of a protein.
Also the nature of the free radical, e.g. the polarity of its host molecule and its
reactivity, and where it contacts the protein (polar/non-polar regions, structural
accessibility) will determine the effectiveness of the free-radical-scavenging process.
Sharp et al. (2004) found a clear correlation between the accessibility of amino acid
residues on lysozyme and β-lactoglobulin A by hydroxyl radicals and their oxidisability.
For the reaction with hydroxyl radicals, the reactivity of various amino acid side chains
was shown to decrease in the following order: cysteine > tryptophan, tyrosine >
methionine > phenylalanine > histidine > isoleucine > leucine > proline (Sharp et al.
2004).
As mentioned before, WPI and NaCas had shown a synergistic antioxidative activity.
This effect still can not be easily explained. It should be remarked that whey proteins

Chapter 4: Factors affecting lipid oxidation in milk-protein-based O/W emulsions 116
and caseins also coexist as continuous phase proteins in their natural environment, milk,
and might fulfil collective functions like the inhibition of milk fat oxidation. A
synergistic antioxidative effect also could have played a role in the findings of Faraji et
al. (2004). In a WPI-stabilised menhaden O/W emulsion, NaCas and soy protein were
found to be more antioxidative in the continuous phase than WPI. But the effect was
attributed to the single proteins present in the continuous phase and not to a possible
interaction between continuous phase and interfacial protein. An example of positive
and negative synergy of protein-derived material is given in the findings of Hernandez-
Ledesma et al. (2005) who found that equimolar amino acid mixtures of peptides
exhibited lower or higher free-radical-scavenging activity (AAPH-derived radicals) than
the peptides themselves. Although no direct parallel can be drawn to the present system,
the example illustrates that interactions can have a synergistic effect contributing to the
antioxidative potential.
During the autoxidation of linoleic acid, hydroperoxides develop at the C9 and C13
atoms via the reaction of lipid radicals with oxygen (Frankel 1998a). They subsequently
break down into a variety of products. Hexanal is one of the breakdown products and
stems from the C13 hydroperoxide (Frankel 1998b). However, it is not fully understood
yet how various factors, such as the reaction medium and pro-/antioxidants, influence
the generation of secondary oxidation products (Kamal-Edin 2003). For the
autoxidation of linoleic acid, homolytic cleavage on the unsaturated side of C13 leads
from the C13 hydroperoxide to hexanal. The reaction requires mild acidic conditions
(Frankel 1998b).
In the present experiments, C9 and C13 hydroperoxides were presumably formed. The
formation was inhibited by higher protein levels. Possible mechanisms were free radical
scavenging and chelation of pro-oxidative metal ions. In WPI emulsions (0.31 µm),
lipid hydroperoxides and hexanal showed a similar logarithmic or linear decrease over
the WPI concentration (see Figure 4.5/Figure 4.6 and Figure 4.14/Figure 4.15).
Therefore, hexanal development might have been largely dependent on the lipid
hydroperoxide level. WPI has probably not interfered in the reaction from C13
hydroperoxide to hexanal.

Chapter 4: Factors affecting lipid oxidation in milk-protein-based O/W emulsions 117
In NaCas emulsions (0.31 µm), lipid hydroperoxides and hexanal showed a different
development over the NaCas concentration, as lipid hydroperoxide concentrations
decreased similar to the development in WPI emulsions, but hexanal concentrations
remained fairly constant up to 4 % protein concentration (see Figure 4.5/Figure 4.6 and
Figure 4.14/Figure 4.15). Hexanal development seemed more independent of the lipid
hydroperoxide level.
It seems as if a part of NaCas suppressed the reaction pathway from the C13
hydroperoxide to hexanal and that it was already effective at a lower NaCas
concentration. A further increase of that factor did not bring more inhibition over a wide
NaCas level range.
In a study of Faraji et al. (2004) it was proposed that a further increase of WPI in the
continuous phase of a WPI-stabilised menhaden O/W emulsion might not have led to a
greater inhibition of propanal production as lower protein levels were sufficient to bind
the available metal ions. A parallel may be drawn to the present study, where metal ions
might have been bound effectively already at lower protein concentrations by NaCas but
not by WPI, as the caseins may have better chelation abilities (Hekmat and McMahon
1998). The chelation of metal ions, particularly of ferric iron by phosphoseryl residues,
near the reaction site of homolytic cleavage could have led to a shift of the Fe2+/Fe3+
equilibrium and a lower Fe2+ concentration. As ferrous iron is required for the reaction
of the C13 hydroperoxide to the C13 alkoxyl radical, and the C13 alkoxyl radical leads via
homolytic cleavage to hexanal, the generation of hexanal would have been inhibited.
Another possible explanation could be that that NaCas fraction locally depleted H+ by
its buffer activity; H+ is required for the homolytic cleavage reaction. Third, the NaCas
fraction could have hindered the homolytic cleavage reaction sterically by blocking the
reaction site.
In conclusion, the findings of the present chapter showed the importance of factors,
such as droplet size, protein type and concentration as well as the amount of protein in
the continuous phase on the oxidative stability of O/W emulsions. The single factors
appeared to have influenced the impact of other factors on oxidative stability. For real
food emulsions this may, for example, mean that incorporated unsaturated lipids may be

Chapter 4: Factors affecting lipid oxidation in milk-protein-based O/W emulsions 118
stable and no off-flavours are produced if certain homogenisation conditions are applied
using NaCas or WPI at a high protein level. In contrast, this may only be the case for
NaCas but not WPI if a lower homogenisation pressure was applied.
In the next chapter the influence of some compositional characteristics of WPI and
NaCas on the oxidative stability of emulsions will be explored. As both milk protein
fractions are known to bind metal ions such as iron and copper (Chapter 2, Section
2.8.2), they may already contain a certain level of these compounds, potentially
contributing to lipid oxidation in the emulsions.

Chapter 5: Influence of low molecular weight (LMW) compounds on lipid oxidation 119
Chapter 5
Influence of low molecular weight (LMW) compounds
on lipid oxidation
5.1 Influence of the removal of LMW compounds of WPI and NaCas by dialysis and the addition of metal ion chelators on lipid oxidation
Metal ions, particularly iron and copper cations, are strong pro-oxidants in the lipid
oxidation process. This has also been shown for O/W emulsions (Ahn and Kim 1998;
Cho et al. 2003; Donnelly et al. 1998; Frankel et al. 2002; Nuchi et al. 2001). Potential
metal sources are the emulsifier and the water it is dissolved in. The RO water, used in
this study, showed an iron concentration of <0.02 mg/l and a copper concentration of
<0.0005 mg/l. The milk proteins employed as emulsifiers had an iron concentration of 5
mg/kg (WPI) and 6 mg/kg (NaCas). The copper concentration was 0.28 mg/kg (WPI)
and 0.6 mg/kg (NaCas). Therefore, the proteins could be seen as a potential source of
pro-oxidants, although some metal ions might not take part in the lipid oxidation
process if they are firmly bound to the proteins or buried within their molecular
structure. To remove free metal ions from the protein solutions used to prepare
emulsions, they were dialysed against RO water. Also chelators (EDTA, citrate) were
added to the protein solutions to bind free metal ions as well as metal ions bound to the
proteins. These protein solutions were dialysed as well to remove chelator–metal ion
complexes, excess chelator and/or free metal ions. By this process, emulsions with even
lower metal ion content and basically free of chelators were presumably obtained.
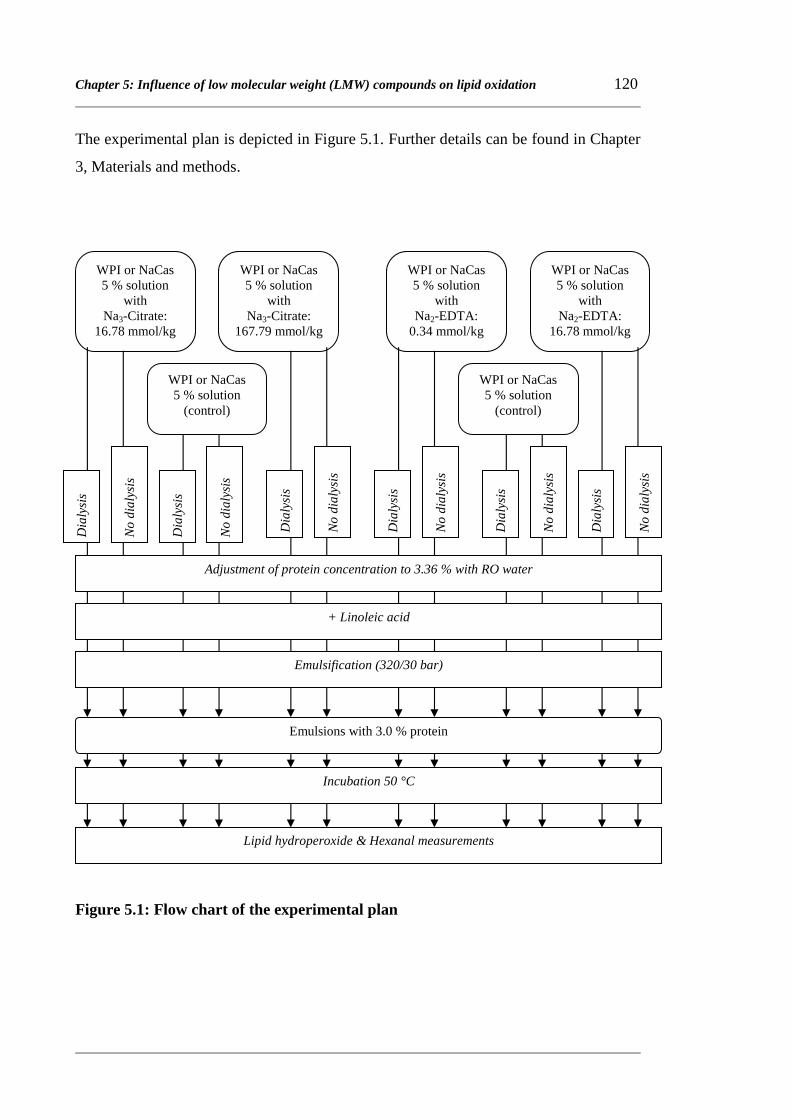
Chapter 5: Influence of low molecular weight (LMW) compounds on lipid oxidation 120
The experimental plan is depicted in Figure 5.1. Further details can be found in Chapter
3, Materials and methods.
Figure 5.1: Flow chart of the experimental plan
WPI or NaCas 5 % solution
with Na3-Citrate:
16.78 mmol/kg
WPI or NaCas 5 % solution
(control)
WPI or NaCas 5 % solution
with Na3-Citrate:
167.79 mmol/kg
WPI or NaCas 5 % solution
with Na2-EDTA:
0.34 mmol/kg
WPI or NaCas 5 % solution
with Na2-EDTA:
16.78 mmol/kg
WPI or NaCas 5 % solution
(control)
Dia
lysi
s
Dia
lysi
s
No
dia
lysi
s
No
dia
lysi
s
Dia
lysi
s
No
dia
lysi
s
Dia
lysi
s
No
dia
lysi
s
Dia
lysi
s
No
dia
lysi
s
Dia
lysi
s
No
dia
lysi
s
Adjustment of protein concentration to 3.36 % with RO water
+ Linoleic acid
Emulsification (320/30 bar)
Incubation 50 °C
Lipid hydroperoxide & Hexanal measurements
Emulsions with 3.0 % protein

Chapter 5: Influence of low molecular weight (LMW) compounds on lipid oxidation 121
WPI and NaCas solutions with 5 % protein were prepared. Various amounts of different
chelators were incorporated. One part of each solution was used for a dialysis process
against RO water (molecular weight cut-off 12000-14000), the other part was left
unprocessed. To compensate for the dilution during dialysis, all dialysed – and not-
dialysed – solutions were adjusted to 3.36 % protein with RO water. These solutions
were then used for the preparation of emulsions with 3.0 % protein. The emulsions then
were further processed as usual. When the protein solutions had not been dialysed, the
final chelator concentrations in the emulsions were 0 mmol/kg (controls), 0.3 mmol/kg
EDTA, 15 mmol/kg EDTA, 15 mmol/kg citrate and 150 mmol/kg citrate. The legal
EDTA concentration for many O/W food emulsions in the USA is 75 to 100 ppm (0.3
mmol/kg) (FDA 2007). A relatively high EDTA level (50 fold higher) was chosen to
see if this would make a difference when dialysis was applied as well as for the control
emulsions where no dialysis was involved.
To compare the efficacy of the two chelators and because citrate is the weaker chelator,
15 mmol/kg was also chosen for the lowest citrate concentration and 150 mmol/kg for
the highest citrate concentration. Table 5.1 gives an overview about the chelator types,
their incorporation levels into the protein solutions and their concentration in the
emulsions when the protein solutions were not dialysed. Also the code names of the
chelators/chelator levels used in the results section are shown.
Table 5.1: Chelator types, incorporation levels and respective code names
Chelator type Chelator concentration Code name of chelator level
in protein solutions without dialysis
(mmol/kg)
in emulsions without dialysis
(mmol/kg)
Control (no chelator) 0 0 control Trisodium Citrate 16.78 15.0 low citrate
167.79 150 high citrate Disodium EDTA 0.34 0.3 low EDTA
16.78 15.0 high EDTA

Chapter 5: Influence of low molecular weight (LMW) compounds on lipid oxidation 122
Figure 5.2 and Figure 5.3 show the lipid hydroperoxide development for emulsions
prepared with chelator-treated, dialysed and not-dialysed protein solutions. The overall
values after 4 hours are given in Table 5.2.
(a) WPI, not-dialysed: control (�), low citrate (■) or (c) WPI, dialysed: control (◇), low citrate (□) or high
high citrate (�) citrate (△)
(b) NaCas, not-dialysed: control (�), low citrate (■) or (d) NaCas, dialysed: control (◇), low citrate (□) or
high citrate (�) high citrate (△)
Figure 5.2: Lipid hydroperoxide development in emulsions prepared with citrate-treated, dialysed and not-dialysed protein solutions
0
100
200
300
400
500
600
0 2 4Incubation Time (h)
Lipi
d hy
drop
erox
ides
(m
icro
mol
/l)
0
100
200
300
400
500
600
0 2 4Incubation Time (h)
Lipi
d hy
drop
erox
ides
(m
icro
mol
/l)
0
100
200
300
400
500
600
0 2 4Incubation Time (h)
Lipi
d hy
drop
erox
ides
(m
icro
mol
/l)
0
100
200
300
400
500
600
0 2 4Incubation Time (h)
Lipi
d hy
drop
erox
ides
(m
icro
mol
/l)

Chapter 5: Influence of low molecular weight (LMW) compounds on lipid oxidation 123
(a) WPI, not-dialysed: control (�), low EDTA (■) or (c) WPI, dialysed: control (◇), low EDTA (□) or
high EDTA (�) high EDTA (△)
(b) NaCas, not-dialysed: control (�), low EDTA (■) or (d) NaCas, dialysed: control (◇), low EDTA (□) or high
high EDTA (�) high EDTA (△)
Figure 5.3: Lipid hydroperoxide development in emulsions prepared with EDTA-treated, dialysed and not-dialysed protein solutions
0
100
200
300
400
500
600
0 2 4Incubation Time (h)
Lipi
d hy
drop
erox
ides
(m
icro
mol
/l)
0
100
200
300
400
500
600
0 2 4Incubation Time (h)
Lipi
d hy
drop
erox
ides
(m
icro
mol
/l)
0
100
200
300
400
500
600
0 2 4Incubation Time (h)
Lipi
d hy
drop
erox
ides
(m
icro
mol
/l)
0
100
200
300
400
500
600
0 2 4Incubation Time (h)
Lipi
d hy
drop
erox
ides
(m
icro
mol
/l)

Chapter 5: Influence of low molecular weight (LMW) compounds on lipid oxidation 124
Figure 5.4 and Figure 5.5 show the hexanal development for emulsions prepared with
chelator treated, dialysed and not-dialysed protein solutions. The overall values after 24
hours are given in Table 5.2.
(a) WPI, not-dialysed: control (�), low citrate (■) (c) WPI, dialysed: control (◇), low citrate (□) or
or high citrate (�) high citrate (△)
(b) NaCas, not-dialysed: control (�), low citrate (■) or (d) NaCas, dialysed: control (◇), low citrate (□) or high
high citrate (�) high citrate (△)
Figure 5.4: Hexanal development in emulsions prepared with citrate-treated, dialysed and not-dialysed protein solutions
0
20
40
60
80
100
120
140
160
0 12 24Incubation Time(h)
Hex
anal
(m
icro
mol
/l)
0
20
40
60
80
100
120
140
160
0 12 24Incubation Time (h)
Hex
anal
(m
icro
mol
/l)
0
20
40
60
80
100
120
140
160
0 12 24Incubation Time in h
Hex
anal
(m
icro
mol
/l)
0
20
40
60
80
100
120
140
160
0 12 24Incubation Time in h
Hex
anal
(m
icro
mol
/l)

Chapter 5: Influence of low molecular weight (LMW) compounds on lipid oxidation 125
(a) WPI, not-dialysed: control (�), low EDTA (■) (c) WPI, dialysed: control (◇), low EDTA (□) or
or high EDTA (�) high EDTA (△)
(b) NaCas, not-dialysed: control (�), low EDTA (■) (d) NaCas, dialysed: control (◇), low EDTA (□) or
or high EDTA (�) high EDTA (△)
Figure 5.5: Hexanal development in emulsions prepared with EDTA-treated, dialysed and not-dialysed protein solutions
0
20
40
60
80
100
120
140
160
0 12 24Incubation Time (h)
Hex
anal
(m
icro
mol
/l)
0
20
40
60
80
100
120
140
160
0 12 24Incubation Time (h)
Hex
anal
(m
icro
mol
/l)
0
20
40
60
80
100
120
140
160
0 12 24Incubation Time (h)
Hex
anal
(m
icro
mol
/l)
0
20
40
60
80
100
120
140
160
0 12 24Incubation Time (h)
Hex
anal
(m
icro
mol
/l)

Chapter 5: Influence of low molecular weight (LMW) compounds on lipid oxidation 126
Table 5.2: Formation of lipid hydroperoxides (after 4 h) and hexanal (after 24 h) for WPI and NaCas emulsions with and without dialysis at the various chelator levels
Lipid oxidation
indicator
Sample type Chelator addition
Control
no chelator
Citrate
low
Citrate
high
EDTA
low
EDTA
high
WPI,
not-dialysed
305
260
140
30
40
WPI,
dialysed
495
340
320
80
35
NaCas,
not-dialysed
210
55
40
55
25
Lipid
hydroperoxides
after 4 h
(µmol/l) NaCas,
dialysed
535
220
185
110
45
WPI,
not-dialysed
60
45
30
25
25
WPI,
dialysed
150
55
50
40
25
NaCas,
not-dialysed
75
35
30
25
25
Hexanal
after 24 h
(µmol/l)
NaCas,
dialysed
145
80
25
65
25
It is clear that dialysis increased the extent of lipid oxidation, as measured by formation
of both lipid hydroperoxides and hexanal. This was particularly noticeable for longer
incubation times. In control emulsions without dialysis, less lipid hydroperoxides were
produced for NaCas emulsions than for WPI emulsions after 4 hours, but there was only
a little difference in the level of hexanal after 24 hours, with a lower value for the WPI
emulsion. With dialysis, there was very little difference in the extent of oxidation for the
controls of either protein type.

Chapter 5: Influence of low molecular weight (LMW) compounds on lipid oxidation 127
The addition of chelators greatly reduced the amount of both lipid hydroperoxides and
hexanal.
In the samples without dialysis and with chelator, generally very little lipid
hydroperoxides were produced over 4 hours. At all levels of citrate and EDTA, the lipid
hydroperoxide concentration had not increased after 4 hours. WPI emulsions in
combination with citrate were an exception. At the low citrate level, the lipid
hydroperoxide concentration had increased to the same level as for the control. The
hexanal concentration had not changed after 4 hours at both EDTA levels for either
protein type. At both citrate levels, the hexanal concentration had slightly increased in
NaCas emulsions. A similar increase was found in the WPI emulsion at the high citrate
level. In the WPI emulsion with the low citrate level, it had increased more notably.
Generally speaking EDTA was more effective in inhibiting lipid oxidation than citrate.
In NaCas emulsions, citrate exhibited an antioxidative effect similar to EDTA.
In samples with dialysis there was not much difference in lipid hydroperoxide
production between the two levels of either chelator. With the high EDTA level, lipid
hydroperoxides remained at the initial concentration for both proteins and the values
were slightly higher for the low EDTA level. Both citrate levels led to more lipid
hydroperoxide production than either EDTA level, particularly in the WPI emulsion. In
WPI emulsions, with dialysis, the amount of hexanal was greatly reduced by EDTA.
After 24 hours, it had remained at the initial concentration at the high level of EDTA
and was only slightly higher at the low level. For both citrate levels, the hexanal
concentration was higher and the same after 24 hours. In the NaCas emulsions, with
dialysis, the initial hexanal concentration was found at the high citrate and EDTA level
after 24 hours. It was higher for the low chelator levels and EDTA inhibited hexanal
only slightly better than citrate. In general, EDTA also inhibited lipid oxidation better in
emulsions with dialysis. A high level of citrate inhibited the hexanal production in the
NaCas emulsion as effectively as EDTA but not in the WPI emulsion.
Generally, samples treated with EDTA gave more similar lipid oxidation values. Also
the higher chelator level of either EDTA or citrate gave more similar lipid oxidation
values (Table 5.2).

Chapter 5: Influence of low molecular weight (LMW) compounds on lipid oxidation 128
An overview about the similarity/difference of samples is given in Appendix Chapter 5,
Table 5A and 5B. The samples were compared in two sample t-tests. In Table 5A,
combinations of the protein type and the application of dialysis are compared at certain
chelator levels. In Table 5B, varying chelator levels are compared for certain
combinations of protein type and application of dialysis.
General trends already observed with the original data could be confirmed by ANOVA
tests. The main effects, shown in Figure 5.6 and Figure 5.7, were all significant
(p ≤ 0.01) except for the hexanal means of the protein type.
Figure 5.6: Main effects of dialysis, chelator, protein type and incubation time on lipid hydroperoxide generation. Means are shown.
0
50
100
150
200
dialysed not dialysed
Dialysis
Lipi
d hy
drop
erox
ide
mea
ns
(mic
rom
ol/l)
p = 0.000
0
50
100
150
200
Control 15.0mmol/lCitrate
150mmol/lCitrate
0.3mmol/lEDTA
15.0mmol/lEDTA
Chelator
Lipi
d hy
drop
erox
ide
mea
ns
(mic
rom
ol/l)
p = 0.000
0
50
100
150
200
WPI NaCas
Protein Type
Lipi
d hy
drop
erox
ide
mea
ns
(mic
rom
ol/l)
p = 0.000
0
50
100
150
200
0 2 4
Incubation Time (h)
Lipi
d hy
drop
erox
ide
mea
ns
(mic
rom
ol/l)
p = 0.000
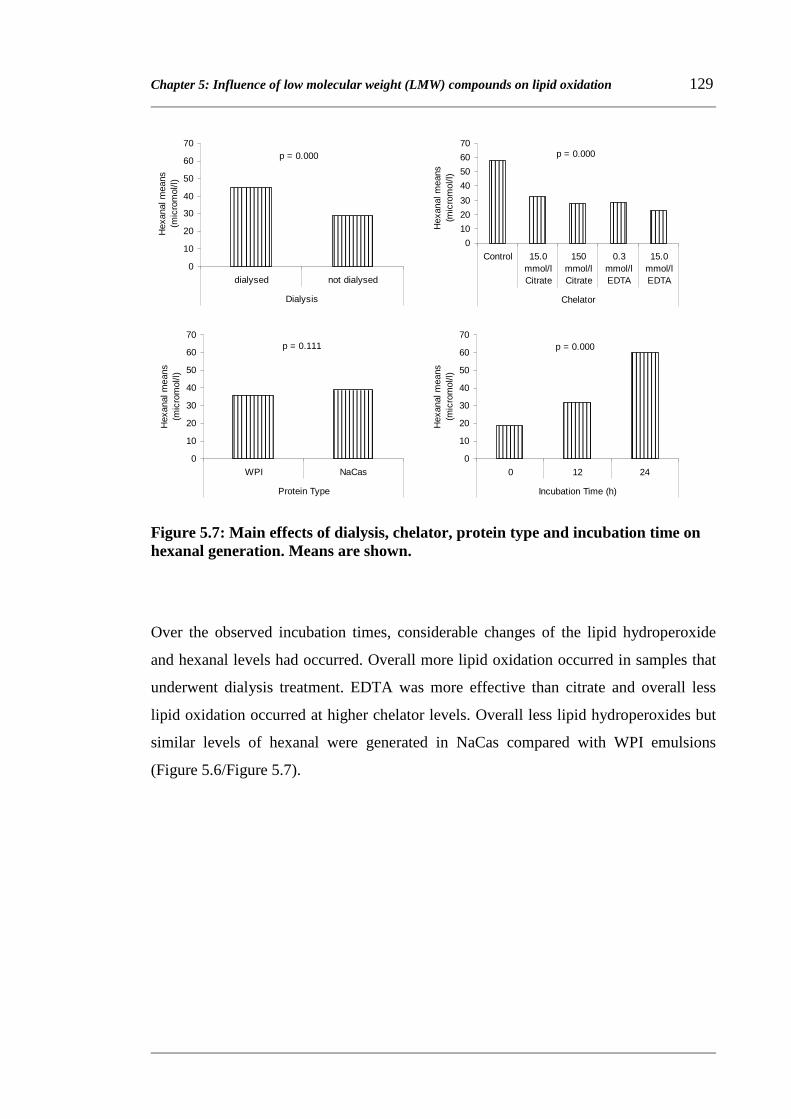
Chapter 5: Influence of low molecular weight (LMW) compounds on lipid oxidation 129
Figure 5.7: Main effects of dialysis, chelator, protein type and incubation time on hexanal generation. Means are shown.
Over the observed incubation times, considerable changes of the lipid hydroperoxide
and hexanal levels had occurred. Overall more lipid oxidation occurred in samples that
underwent dialysis treatment. EDTA was more effective than citrate and overall less
lipid oxidation occurred at higher chelator levels. Overall less lipid hydroperoxides but
similar levels of hexanal were generated in NaCas compared with WPI emulsions
(Figure 5.6/Figure 5.7).
0
10
20
30
40
50
60
70
dialysed not dialysed
Dialysis
Hex
anal
mea
ns
(mic
rom
ol/l)
p = 0.000
0
10
20
30
40
50
60
70
Control 15.0mmol/lCitrate
150mmol/lCitrate
0.3mmol/lEDTA
15.0mmol/lEDTA
Chelator
Hex
anal
mea
ns
(mic
rom
ol/l)
p = 0.000
0
10
20
30
40
50
60
70
WPI NaCas
Protein Type
Hex
anal
mea
ns
(mic
rom
ol/l)
p = 0.111
0
10
20
30
40
50
60
70
0 12 24
Incubation Time (h)
Hex
anal
mea
ns
(mic
rom
ol/l)
p = 0.000
Chapter 5: Influence of low molecular weight (LMW) compounds on lipid oxidation 130
Dialysis of protein solutions prior to emulsion formation had in general a pro-oxidative
influence. This was in contrast to the initial idea that lipid oxidation rates might have
been reduced by the removal of pro-oxidative metal ions. It is likely that other LMW
compounds present in protein solutions, like peptides, amino acids, lactose, organic
acids etc., were also removed. Some of these components may have had antioxidative
properties. Tong et al. (2000a), for example, showed that a LMW fraction (molecular
weight ≤ 3000) of whey had an antioxidative activity when added to a Tween-stabilised
O/W emulsion.
Gaucheron et al. (1996) showed that EDTA and also citrate were able to chelate ferrous
iron bound to milk proteins, using NaCas. In the present study, it can be assumed that
all available metal ions were chelated at a high EDTA level, including those bound to
the proteins. Hence, the lipid oxidation values remained very low. As the emulsions
from protein solutions with and without dialysis had similar levels of lipid oxidation,
the chelation of metal ions from high molecular weight (HMW) proteins probably
played an important role for the oxidative stability. The lipid oxidation level at the high
EDTA level for all samples with dialysis was lower than for control samples (no
chelator) with no dialysis. In these emulsions, LMW proteins were still present but also
metal ions. Therefore, it can be assumed that the removal of metal ions from HMW
proteins was more important for the oxidative stability of the emulsions than the
presence of LMW proteins. For citrate, it seemed as if its chelation capacity was the
limiting aspect. The high citrate level did not lead to the same low lipid oxidation
values, especially lipid hydroperoxide levels, when the emulsions were prepared with
dialysed or not-dialysed protein solutions. It seemed as if the chelating capacity of
citrate could hardly offset the loss of antioxidative LMW compounds.

Chapter 5: Influence of low molecular weight (LMW) compounds on lipid oxidation 131
Possible migration of compounds during dialysis that is likely to enhance or inhibit lipid
oxidation in the emulsions is illustrated in Figure 5.8. The protein type is not
considered.
In A and B no chelators are added. In B but not A dialysis takes place. In B dialysis
leads to the removal of pro-oxidative free metal ions. Also LMW proteins that have
bound metal ions (supposedly pro-oxidative) will also be removed. On the other hand
LMW proteins where no metals are bound, possibly antioxidative, are also removed.
Furthermore, pro-oxidative metals remain in A and B bound to HMW proteins.
In C and D a chelator is added, which binds to metal ions and consequently reduces
their pro-oxidative effect. In C metal ion-chelator complexes remain in the system. In D
these complexes are removed by dialysis and also LMW proteins that are possibly
antioxidative.
In E and F at a high chelator concentration, most metal ions are bound to the chelator. In
E the complexes remain in the system. In F the complexes are removed by dialysis and
also LMW proteins that are possibly antioxidative.
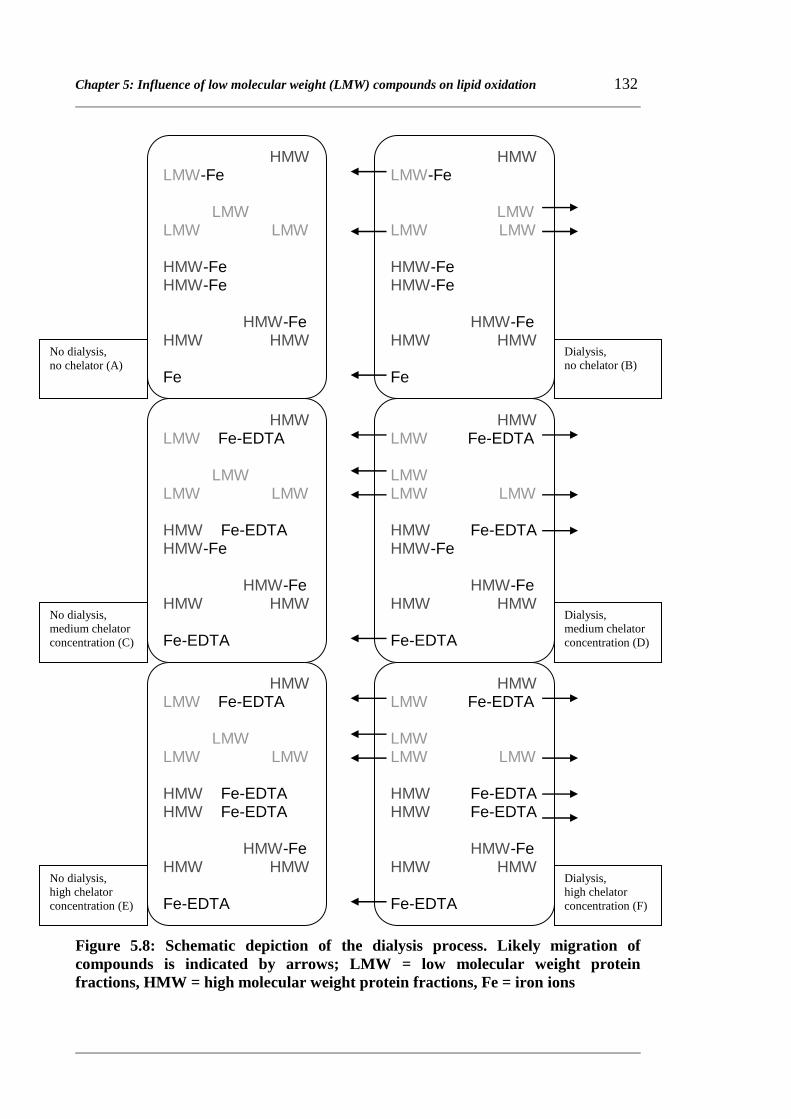
Chapter 5: Influence of low molecular weight (LMW) compounds on lipid oxidation 132
Figure 5.8: Schematic depiction of the dialysis process. Likely migration of compounds is indicated by arrows; LMW = low molecular weight protein fractions, HMW = high molecular weight protein fractions, Fe = iron ions
HMW LMW-Fe LMW LMW LMW HMW-Fe HMW-Fe HMW-Fe HMW HMW Fe
No dialysis, no chelator (A)
HMW LMW-Fe LMW LMW LMW HMW-Fe HMW-Fe HMW-Fe HMW HMW Fe
Dialysis, no chelator (B)
HMW LMW Fe-EDTA LMW LMW LMW HMW Fe-EDTA HMW-Fe HMW-Fe HMW HMW Fe-EDTA
Dialysis, medium chelator concentration (D)
HMW LMW Fe-EDTA LMW LMW LMW HMW Fe-EDTA HMW-Fe HMW-Fe HMW HMW Fe-EDTA
No dialysis, medium chelator concentration (C)
HMW LMW Fe-EDTA LMW LMW LMW HMW Fe-EDTA HMW Fe-EDTA HMW-Fe HMW HMW Fe-EDTA
Dialysis, high chelator concentration (F)
HMW LMW Fe-EDTA LMW LMW LMW HMW Fe-EDTA HMW Fe-EDTA HMW-Fe HMW HMW Fe-EDTA
No dialysis, high chelator concentration (E)

Chapter 5: Influence of low molecular weight (LMW) compounds on lipid oxidation 133
In other studies, the antioxidative activity of citrate and EDTA had been investigated
when the chelators were added after emulsification (Cho et al. 2003; Djordjevic et al.
2004; Hu et al. 2004). In each of the studies, EDTA gave greater oxidative stability than
citrate, when applied at the same concentration up to 0.1 mmol/l. Above a certain
concentration, more EDTA did not yield greater oxidative stability, which was
attributed to the chelation of all available metal ions. Greater antioxidative activity of
EDTA over citrate was attributed to a higher binding constant for ferric iron and greater
chemical inactivation, making iron less available to take part in reactions. Partly citrate
had been found pro-oxidative which was explained by an increase of iron mobility by
the chelator and insufficient reduction of its reactivity at the same time. Both citrate and
EDTA were able to increase the concentration of ferric iron in the continuous phase that
stemmed from the oil phase of an emulsion. As a result of this transfer oxidative
stability increased. In summary, various antioxidative mechanisms of chelators can be
named: change of metal location, reduction of metal solubility, alteration of redox
potential of metals (reducing their reactivity as oxidants) and interference with redox
cycles and sterical hindrance of interactions between metals and hydroperoxides
(preventing hydroperoxide decomposition and free radical generation).
The loss of LMW proteins by dialysis enhanced lipid oxidation in milk-protein-based
O/W emulsions. This pro-oxidative effect could be compensated by the addition of a
high level of EDTA before dialysis. In fact, the samples treated with EDTA (metal ions
complexed) and also dialysis (LMW proteins removed) were more stable towards lipid
oxidation than the controls without chelator treatment (metal ions present) and no
dialysis (LMW proteins present). This suggests that the removal of metal ions from
HMW proteins was more prominent for the oxidative stability than the presence of
LMW proteins. However, emulsions where metal ions were complexed with the
chelator and LMW proteins were still present exhibited the greatest oxidative stability
and emulsions in which metal ions were not complexed and LMW proteins had been
removed were oxidised to the highest level.

Chapter 5: Influence of low molecular weight (LMW) compounds on lipid oxidation 134
5.2 Effects of LMW fractions on oxidative stability
It appears that the LMW fractions of WPI and NaCas were important for the oxidative
stability of emulsion lipids. Therefore, it was thought that an increase of their
concentration could lead to better oxidative stability. Solutions enriched with LMW
fractions were obtained by the dialysis of RO water against protein solutions. These
solutions were used instead of RO water to prepare protein solutions for emulsification
as usual. Emulsions fortified with LMW-WPI and LMW-NaCas were tested for their
oxidative stability. Lipid oxidation was compared with control emulsions prepared with
only WPI, NaCas and also NaCas + 100 ppm EDTA. A reasonably high total protein
concentration (5 %) was chosen to achieve similar oxidative stability as with the
addition of 100 ppm EDTA.
The experimental plans are shown in Figure 5.9 and Figure 5.10. The production of
control emulsions (WPI, NaCas and NaCas + EDTA) is not depicted in the
experimental plans. Dialysis tubes filled with RO water were placed into WPI or NaCas
solutions (5.5 %), and left for about 42 h. The protein solution was replaced every 14 h.
The tubes were cut open and the protein content was determined using the Kjehldahl
method. The solutions, undiluted and diluted with RO water, were used to prepare
5.60 % WPI and NaCas protein solutions. These were employed as usual for the
emulsification with linoleic acid to produce emulsions with 5.0 % protein. More details
about the execution of the experiments can be found in Chapter 3, Materials and
methods.

Chapter 5: Influence of low molecular weight (LMW) compounds on lipid oxidation 135
Figure 5.9: Flow chart of the experimental plan (A)
RO water in dialysis tube
RO water in dialysis tube
Placement in WPI 5.5 %
solution, 3x14 h
Placement in NaCas 5.5 %
solution, 3x14 h
RO water with LMW-WPI (0.033 %)
RO water with LMW-NaCas
(0.028 %)
Addition of WPI
Addition of NaCas
WPI 5.60 % solution LMW-WPI-enriched
NaCas 5.60 % solution LMW-NaCas-enriched
Linoleic acid
Linoleic acid
320/30 bar 320/30 bar
WPI 5.0 % emulsion LMW-WPI-enriched (0.030 %)
NaCas 5.0 % emulsion LMW-NaCas-enriched (0.025 %)
Incubation 50 °C
Incubation 50 °C
Lipid hydroperoxide & Hexanal measurements

Chapter 5: Influence of low molecular weight (LMW) compounds on lipid oxidation 136
Figure 5.10: Flow chart of the experimental plan (B)
Placement in NaCas 5.5 %
solution, 3x14 h
RO water with LMW-NaCas
(0.05 %)
Addition of NaCas
NaCas 5.60 % solution LMW-NaCas-enriched
Linoleic acid
320/30 bar
NaCas 5.0 % emulsion LMW-NaCas-enriched (0.045 %)
Incubation 50 °C
Lipid hydroperoxide & Hexanal measurements
RO water in dialysis tube
Incubation 50 °C
NaCas 5.0 % emulsion LMW-NaCas-enriched-(0.022 %)
320/30 bar
Linoleic acid
NaCas 5.60 % solution LMW-NaCas-enriched
Addition of NaCas
RO water with LMW-NaCas
(0.025 %)
Dilution with RO water (1:1)

Chapter 5: Influence of low molecular weight (LMW) compounds on lipid oxidation 137
WPI and NaCas emulsions with and without enrichment of their LMW fraction were
tested for their oxidative stability (Table 5.3).
The lipid hydroperoxide concentrations of the WPI control and WPI emulsion enriched
with LMW-WPI were 180 and 165 µmol/l after 4 h, respectively, but the values were
not significantly different. For the NaCas control and NaCas emulsion enriched with
LMW-NaCas the lipid hydroperoxide concentrations were 100 and 35 µmol/l after 4 h,
respectively (Table 5.3). The values were significantly different.
Table 5.3: Lipid hydroperoxide and hexanal concentrations for emulsions enriched with LMW-WPI and LMW-NaCas
Sample type Incubation time (h)
Lipid hydroperoxides ± SEM* (µmol/l)
Hexanal ± SEM* (µmol/l)
0 55 ± 5 105 ± 5 4 180 ± 5 -
WPI
24 - 305 ± 15 0 60 ± 5 105 ± 5 4 165 ± 5 -
WPI + 0.030 % LMW-WPI 24 - 265 ± 10
0 60 ± 5 90 ± 5 4 100 ± 5 -
NaCas
24 - 385 ± 10 0 50 ± 5 90 ± 5 4 35 ± 5 -
NaCas + 0.025 %
LMW-NaCas 24 - 300 ± 20 * SEM = standard error of the mean value
The hexanal concentrations of the WPI control and WPI emulsion enriched with LMW-
WPI were 305 and 265 µmol/l after 24 h respectively, but they were not significantly
different. For the NaCas control and NaCas emulsion enriched with LMW-NaCas, the
concentrations of hydroperoxide were 385 and 300 µmol/l after 24 h, respectively
(Table 5.3). The values were significantly different. Probability values for the difference
between samples were obtained from two sample t-tests. They can be found in
Appendix Chapter 5, Table 5C.
NaCas emulsions enriched with LMW-NaCas showed a greater difference in lipid
oxidation compared with the NaCas control emulsion, especially in respect of lipid

Chapter 5: Influence of low molecular weight (LMW) compounds on lipid oxidation 138
hydroperoxide production. Therefore the LMW-NaCas fraction was further
investigated. The lipid hydroperoxide concentration was followed over a longer time.
Also two concentration levels of LMW-NaCas were used and EDTA was added to have
an oxidatively very stable emulsion sample as a comparison (Table 5.4).
The development of lipid hydroperoxides was delayed in NaCas emulsions enriched
with LMW-NaCas compared to the NaCas control, indicated by the mean values after 8
h (Table 5.4). Higher concentration of LMW-NaCas provided a further delay. The
emulsion to which EDTA was added exhibited very low, stable lipid hydroperoxide
concentration over time. After 16 h, all emulsions reached similar lipid hydroperoxide
levels except for the one with EDTA. All mean values were significantly different from
each other after 8 h. After 16 h, the mean value of the control was still significantly
higher than the high level of LMW-NaCas. The mean values of both LMW-NaCas
levels were not significantly different.
Table 5.4: Lipid hydroperoxide and hexanal concentrations for emulsions enriched with LMW-NaCas at two levels and with EDTA incorporated
Sample type Incubation time (h)
Lipid hydroperoxides ± SEM* (µmol/l)
Hexanal ± SEM* (µmol/l)
0 115 ± 5 65 ± 5 8 785 ± 30 - 16 1030 ± 15 -
NaCas
24 - 390 ± 10 0 80 ± 5 70 ± 5 8 235 ± 10 - 16 940 ± 30 -
NaCas + 0.022 %
LMW-NaCas 24 - 350 ± 20 0 90 ± 5 50 ± 5 8 135 ± 10 - 16 900 ± 30 -
NaCas + 0.045 %
LMW-NaCas 24 - 190 ± 5 0 80 ± 5 50 ± 5 8 30 ± 5 - 16 40 ± 5 -
NaCas + 100 ppm EDTA
24 - 80 ± 5
* SEM = standard error of the mean value

Chapter 5: Influence of low molecular weight (LMW) compounds on lipid oxidation 139
The hexanal concentration in the emulsion with the high LMW-NaCas level was
significantly lower and only half the value of the control sample after 24 h. On the other
hand, this value was still about 120 µmol/l above the level found in the emulsion with
EDTA (Table 5.4). The control sample and the emulsion with the low LMW-NaCas
level did not exhibit a significantly different hexanal concentration. Probability values
for the difference between samples were obtained from two sample t-tests and are
shown in Appendix Chapter 5, Table 5D.
These studies confirm that LMW fractions in the milk protein solutions influence lipid
oxidation in the emulsions. The oxidative stability increased when LMW fractions were
incorporated at a higher concentration level. LMW fractions of NaCas caused a strong
decrease in lipid hydroperoxides and a lower hexanal production. An increase of only
0.04 % protein by enrichment with LMW-NaCas reduced the hexanal generation by
half, indicating a remarkable antioxidative potential of the LMW fraction of NaCas.
Another aspect that needs to be considered is the actual composition of the LMW
fractions. Milk contains several low molecular weight compounds and some of them
were probably also present in LMW-WPI and LMW-NaCas. LMW compounds of milk
are lactose (4.6 %), minerals (0.65 %), organic acids- citrate, formate, acetate, lactate,
oxalate (0.18 %) and vitamins- e.g. A, C, D, thiamine, riboflavin
(http://www.foodsci.uoguelph.ca/dairyedu/chem.html 2008). Some of the organic acids
are known as chelators and might contribute to antioxidative characteristics. Also
ascorbic acid is an antioxidant. Lactose was found to form complexes with ferrous iron
(Bachran and Bernhard 1980). Hu et al. (2003a) mentioned phosphate as iron-chelating
compound in whey. Ferguson (2008) refers to a number of non-protein nitrogen (NPN)
compounds in milk with low molecular weight. NPN compounds would comprise 6.0 %
of all nitrogen-containing compounds. He denotes that those 6.0 % consist of urea (48.0
%), amino acid N (15.1 %), peptide N (11.0 %), creatine N (8.6 %), orotic acid N (5.2
%), creatinine N (4.1 %), ammonia N (3.1 %), uric acid N (2.7 %) and hippuric acid N
(1.4 %). Urate, also naturally occurring in bovine milk, has been shown to reduce light-
induced lipid hydroperoxide production in milk by almost 30 % and was twice as
effective as ascorbic acid (Ostdal et al. 2000). Hydrolysates of milk proteins containing
peptides and amino acids have shown antioxidative potential in emulsions (Diaz et al.

Chapter 5: Influence of low molecular weight (LMW) compounds on lipid oxidation 140
2003; Rival et al. 2001a). It has been shown that they exhibited abilities to scavenge
free radicals (Hernandez-Ledesma et al. 2005; Rival et al. 2001a) and to chelate metal
ions (Shears et al. 1987; Vegarud et al. 2000). In future studies about the oxidative
stability of milk-protein-based emulsions particular attention should also be paid to the
anti-/pro-oxidative influence of the various LMW compounds associated with milk
proteins.
Chapter 6: Effect of heat treatment of milk protein solutions… 141
Chapter 6
Effect of heat treatment of milk protein solutions prior to
emulsification on the oxidative stability of O/W emulsions
The major whey proteins, β-lactoglobulin and α-lactalbumin, denature in aqueous
systems at elevated temperatures (> 70 ˚C). Their conformation changes via an
unfolding process in which the tertiary structure is modified. Sulfhydryl groups and
hydrophobic moieties previously situated in the interior of the proteins become exposed
to the surrounding environment (Anema 2007; Anema and McKenna 1996). Denatured
whey proteins may therefore contribute to improved oxidative stability when used as
emulsifier for O/W emulsions. Sulfhydryl groups possess antioxidative potential and
greater hydrophobicity could improve the contact between proteins and emulsion lipid,
which could also result in a stronger physical barrier against pro-oxidants from the
continuous phase. Furthermore, Tong et al. (2000a) reported about the increased
exposure of aromatic amino acid residues (tyrosyl, phenylalanyl, tryptophan) upon heat-
treatment of whey and associated those residues with free radical scavenging activity.
Other research has looked at the stabilising properties of caseins towards the
aggregation of heat-denatured whey proteins in aqueous solutions. αS-Casein, β-casein
and partly κ-casein inhibited the aggregation of whey proteins (WPI, β-lactoglobulin, α-
lactalbumin, bovine serum albumin) at temperatures between 70-90 ˚C at pH 6.0-7.1,
indicated by decreased turbidity of the protein solutions. Therefore chaperone-like
characteristics have been attributed to them (Bhattacharyya and Das 1999; Morgan et al.
2005; O'Kennedy and Mounsey 2006; Yong and Foegeding 2008). In other studies, it
was reported that κ-casein and also αs2-casein can form complexes with denatured whey
proteins (Anema 2007; Anema and McKenna 1996). However, there is a lack of
knowledge how these protein–protein interactions influence lipid oxidation in O/W
emulsions.

Chapter 6: Effect of heat treatment of milk protein solutions… 142
From these considerations, the effects of heat treatment of pure WPI solutions and
mixed solutions of WPI plus NaCas on the oxidative stability of O/W emulsions were
studied. A possible correlation between WPI denaturation and lipid oxidation was also
investigated.
Pure WPI solutions and mixed solutions of WPI and NaCas (1:1, weight/weight) of 1.12
% and 2.24 % protein content were heated in a water bath at 84 ± 0.3 ˚C for up to 40
minutes. The solutions were then cooled down to 5 ˚C and used to produce emulsions of
1.0 and 2.0 % protein content as before. An overview of the treatments is given in Table
6.1.
The denaturation of WPI in the solutions was followed by measuring the content of β-
lactoglobulin by the Native PAGE method. Also the concentration of free and total
sulfhydryls in the solutions was followed over time. Lipid hydroperoxide and hexanal
concentrations in the emulsions were determined as previously detailed. Further details
can be found in Chapter 3, Materials and methods.
Table 6.1: Scheme of protein solution mixtures and heating at 84 °C
Protein type Protein concentration (%)
Heating time at 84 ˚C (min)
WPI 1.12 0, 10, 20, 30, 40 WPI 2.24 0, 10, 20, 30, 40
WPI + NaCas 1.12 0, 10, 20, 30, 40 WPI + NaCas 2.24 0, 10, 20, 30, 40
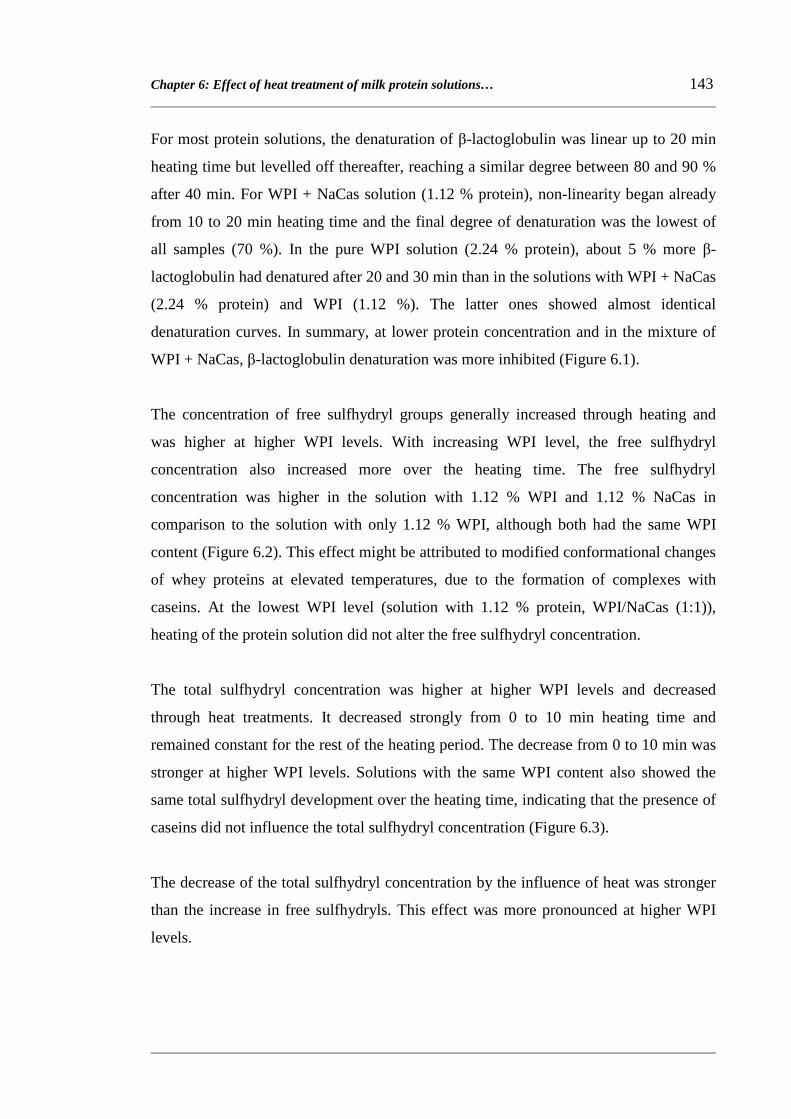
Chapter 6: Effect of heat treatment of milk protein solutions… 143
For most protein solutions, the denaturation of β-lactoglobulin was linear up to 20 min
heating time but levelled off thereafter, reaching a similar degree between 80 and 90 %
after 40 min. For WPI + NaCas solution (1.12 % protein), non-linearity began already
from 10 to 20 min heating time and the final degree of denaturation was the lowest of
all samples (70 %). In the pure WPI solution (2.24 % protein), about 5 % more β-
lactoglobulin had denatured after 20 and 30 min than in the solutions with WPI + NaCas
(2.24 % protein) and WPI (1.12 %). The latter ones showed almost identical
denaturation curves. In summary, at lower protein concentration and in the mixture of
WPI + NaCas, β-lactoglobulin denaturation was more inhibited (Figure 6.1).
The concentration of free sulfhydryl groups generally increased through heating and
was higher at higher WPI levels. With increasing WPI level, the free sulfhydryl
concentration also increased more over the heating time. The free sulfhydryl
concentration was higher in the solution with 1.12 % WPI and 1.12 % NaCas in
comparison to the solution with only 1.12 % WPI, although both had the same WPI
content (Figure 6.2). This effect might be attributed to modified conformational changes
of whey proteins at elevated temperatures, due to the formation of complexes with
caseins. At the lowest WPI level (solution with 1.12 % protein, WPI/NaCas (1:1)),
heating of the protein solution did not alter the free sulfhydryl concentration.
The total sulfhydryl concentration was higher at higher WPI levels and decreased
through heat treatments. It decreased strongly from 0 to 10 min heating time and
remained constant for the rest of the heating period. The decrease from 0 to 10 min was
stronger at higher WPI levels. Solutions with the same WPI content also showed the
same total sulfhydryl development over the heating time, indicating that the presence of
caseins did not influence the total sulfhydryl concentration (Figure 6.3).
The decrease of the total sulfhydryl concentration by the influence of heat was stronger
than the increase in free sulfhydryls. This effect was more pronounced at higher WPI
levels.
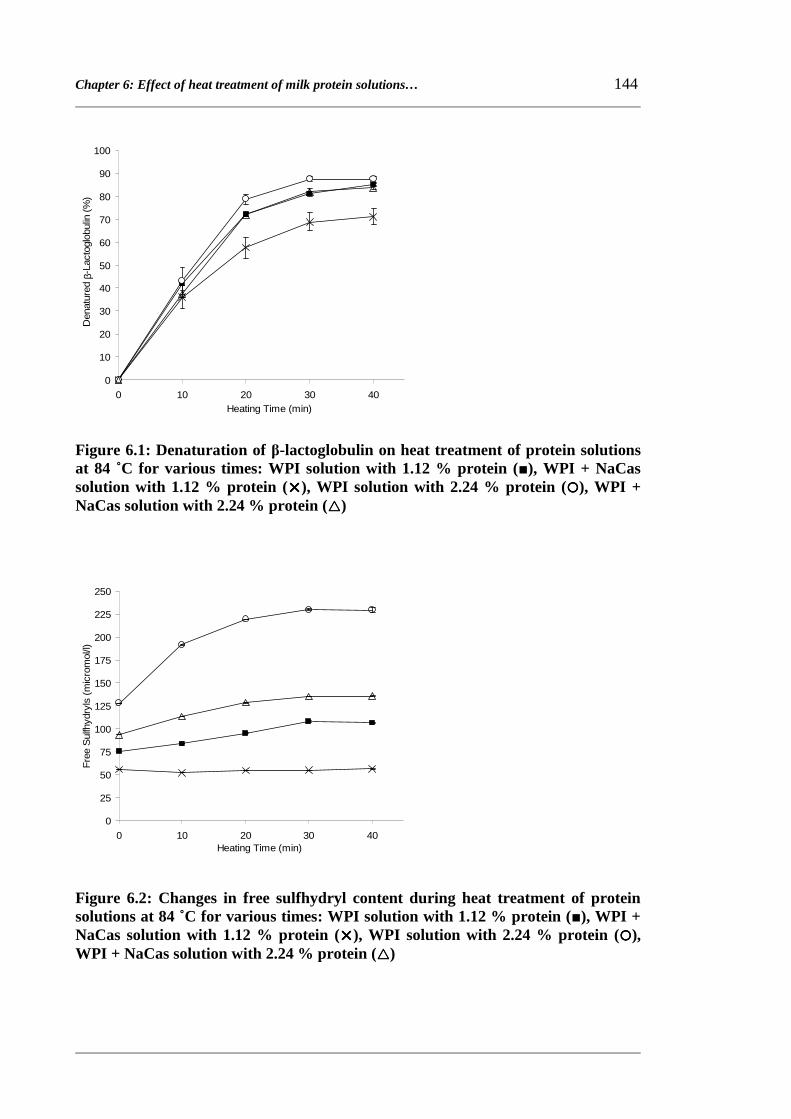
Chapter 6: Effect of heat treatment of milk protein solutions… 144
Figure 6.1: Denaturation of β-lactoglobulin on heat treatment of protein solutions at 84 ˚C for various times: WPI solution with 1.12 % protein (■), WPI + NaCas solution with 1.12 % protein (✕✕✕✕), WPI solution with 2.24 % protein (����), WPI + NaCas solution with 2.24 % protein (△△△△)
Figure 6.2: Changes in free sulfhydryl content during heat treatment of protein solutions at 84 ˚C for various times: WPI solution with 1.12 % protein (■), WPI + NaCas solution with 1.12 % protein (✕✕✕✕), WPI solution with 2.24 % protein (����), WPI + NaCas solution with 2.24 % protein (△△△△)
0
25
50
75
100
125
150
175
200
225
250
0 10 20 30 40Heating Time (min)
Fre
e S
ulfh
ydry
ls (
mic
rom
ol/l)
0
10
20
30
40
50
60
70
80
90
100
0 10 20 30 40Heating Time (min)
Den
atur
ed β
-Lac
togl
obul
in (
%)

Chapter 6: Effect of heat treatment of milk protein solutions… 145
Figure 6.3: Changes in total sulfhydryl content during heat treatment of protein solutions at 84 ˚C for various times: WPI solution with 1.12 % protein (■), WPI + NaCas solution with 1.12 % protein (✕✕✕✕), WPI solution with 2.24 % protein (����), WPI + NaCas solution with 2.24 % protein (△△△△)
The lipid hydroperoxide concentration in the emulsions after 4 hours incubation time
was not influenced by the heat treatment at 84 ˚C for various times. There was also no
correlation between lipid hydroperoxide generation and the degree of β-lactoglobulin
denaturation in the protein solutions. The use of WPI only or a WPI/NaCas mixture
showed no influence either. At the higher protein level, less lipid hydroperoxides were
formed (after 4 hours: 200 to 400 µmol/l at the 2.0 % protein level and 700 to 900
µmol/l at the 1.0 % protein level) (Figure 6.4 and Figure 6.5). The droplet size (Z-
average) was stable for all emulsions between 0 h and 4 h (data not shown).
0
100
200
300
400
500
600
700
800
900
0 10 20 30 40
Heating Time (min)
Tot
al S
ulfh
ydry
ls (
mic
rom
ol/l)

Chapter 6: Effect of heat treatment of milk protein solutions… 146
Figure 6.4: Lipid hydroperoxide concentration after 4 h incubation time of emulsions where the protein solution had been heated at 84 ˚C for various times: WPI 1.0 % (■), WPI + NaCas 1.0 % (✕✕✕✕), WPI 2.0 % (����), WPI + NaCas 2.0 % (△△△△)
Figure 6.5: Relationship between lipid hydroperoxide concentration and the degree of β-lactoglobulin denaturation after 4 h incubation time of emulsions where the protein solution had been heated at 84 ˚C for various times: WPI 1.0 % (■), WPI + NaCas 1.0 % (✕✕✕✕), WPI 2.0 % (����), WPI + NaCas 2.0 % (△△△△)
0
100
200
300
400
500
600
700
800
900
1000
0 10 20 30 40
Heating Time (min)
Lipi
d H
ydro
pero
xide
s af
ter
4 h
(mic
rom
ol/l)
0
100
200
300
400
500
600
700
800
900
1000
0 10 20 30 40 50 60 70 80 90 100
Denatured β-Lactoglobulin (%)
Lipi
d H
ydro
pero
xide
s af
ter
4 h
(mic
rom
ol/l)

Chapter 6: Effect of heat treatment of milk protein solutions… 147
Heat treatment of protein solutions prior to emulsion formation had in general no effect
on hexanal production, with one exception. In WPI emulsions with 1.0 % protein, all
emulsions where the protein solution had been heated showed higher hexanal
concentrations after 24 h compared with the control (0 min at 84 ˚C), but no consistent
development with heating time or β-lactoglobulin denaturation was found. During the
24 h incubation time (including 0, 12, 24 h values) there was significantly (p ≤ 0.01;
ANOVA) less hexanal produced in the unheated control sample compared with all other
WPI samples of 1.0 % protein content, where heat treatment had been applied (Figure
6.6 and Figure 6.7). In Table 6.2 the stability of the droplet size (Z-average) is shown
for the 24 h incubation period. The average droplet size of WPI emulsions (1.0 %
protein content) where the protein solution had been heated for 20, 30 and 40 min had
increased to 0.52 – 0.63 µm after 24 h, whereas other emulsions showed a stable droplet
size ≤ 0.25 µm. Also aggregates had formed, indicating irreversible physical instability.
The protein concentration also influenced the hexanal generation, although not so
strongly as the lipid hydroperoxide generation. Emulsions with the higher protein
content showed lower hexanal concentrations after 24 h incubation time. In WPI/NaCas
emulsions less hexanal was formed than in pure WPI emulsions, especially at the low
protein levels (Figure 6.6 and Figure 6.7).
Table 6.2: Droplet size Z-average (µm) of emulsions at 0 h and 24 h
Heating time of protein
solution at 84 ˚C (min)
Emulsion type
WPI 1.0 % WPI/NaCas 1.0 % WPI 2.0 % WPI/NaCas 2.0 % Incubation time (h) 0 24 0 24 0 24 0 24 Droplet size Z-average ± SEM* (µm) 0 0.23±0.00 0.21±0.00 0.24±0.00 0.23±0.00 0.23±0.00 0.20±0.00 0.23±0.00 0.21±0.00 10 0.23±0.00 0.25±0.00 0.24±0.00 0.22±0.00 0.21±0.00 0.19±0.00 0.21±0.00 0.20±0.00 20 0.24±0.00 0.61±0.02 0.23±0.00 0.22±0.00 0.23±0.00 0.21±0.00 0.23±0.00 0.22±0.00 30 0.26±0.00 0.63±0.01 0.25±0.00 0.24±0.01 0.24±0.00 0.24±0.00 0.23±0.00 0.22±0.00 40 0.27±0.01 0.52±0.02 0.24±0.00 0.23±0.00 0.26±0.00 0.24±0.00 0.22±0.00 0.22±0.00
* SEM = standard error of the mean value; three replicate measurements (from one sample container)
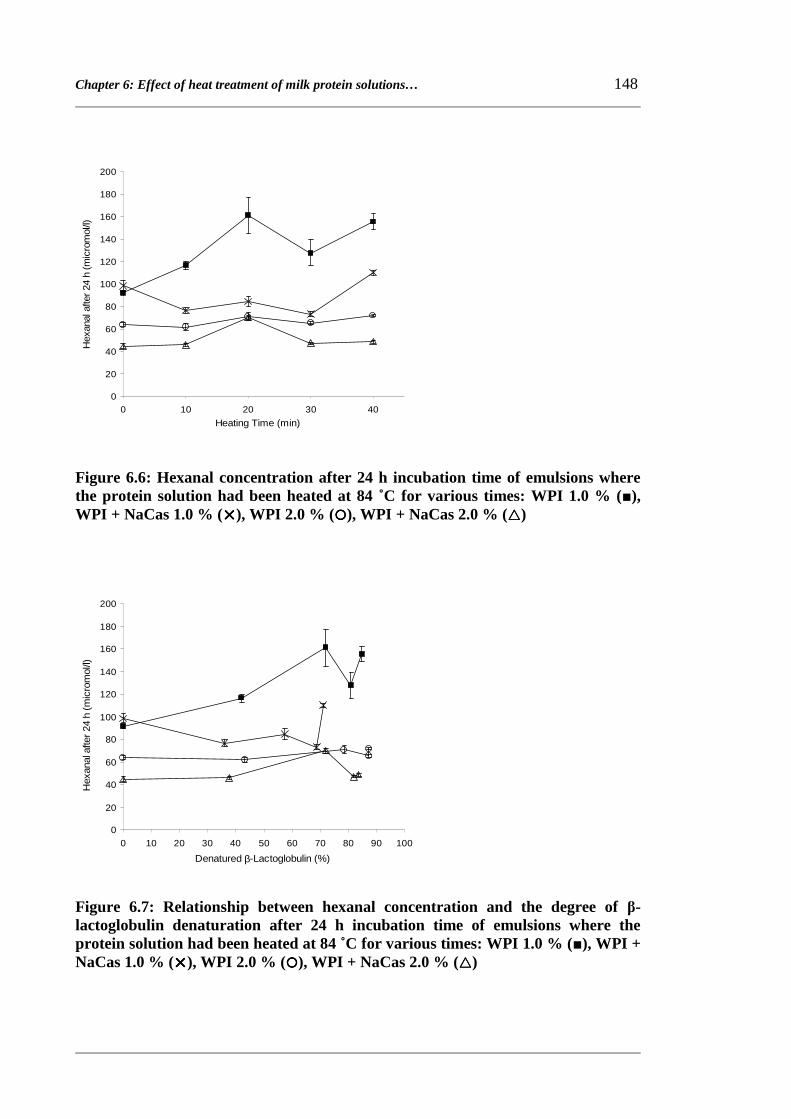
Chapter 6: Effect of heat treatment of milk protein solutions… 148
Figure 6.6: Hexanal concentration after 24 h incubation time of emulsions where the protein solution had been heated at 84 ˚C for various times: WPI 1.0 % (■), WPI + NaCas 1.0 % (✕✕✕✕), WPI 2.0 % (����), WPI + NaCas 2.0 % (△△△△)
Figure 6.7: Relationship between hexanal concentration and the degree of β-lactoglobulin denaturation after 24 h incubation time of emulsions where the protein solution had been heated at 84 ˚C for various times: WPI 1.0 % (■), WPI + NaCas 1.0 % (✕✕✕✕), WPI 2.0 % (����), WPI + NaCas 2.0 % (△△△△)
0
20
40
60
80
100
120
140
160
180
200
0 10 20 30 40
Heating Time (min)
Hex
anal
afte
r 24
h (
mic
rom
ol/l)
0
20
40
60
80
100
120
140
160
180
200
0 10 20 30 40 50 60 70 80 90 100
Denatured β-Lactoglobulin (%)
Hex
anal
afte
r 24
h (
mic
rom
ol/l)

Chapter 6: Effect of heat treatment of milk protein solutions… 149
Figure 6.8: Results from ANOVA: main effects of heating time, protein type, protein concentration and incubation time on lipid hydroperoxide and hexanal generation. Means and the significance level for their difference are shown.
0
100
200
300
400
500
600
0 10 20 30 40
Heating Time (min)
Lipi
d hy
drop
erox
ide
mea
ns
(mic
rom
ol/l)
p = 0.000
0
100
200
300
400
500
600
WPI WPI/NaCas
Protein Type
Lipi
d hy
drop
erox
ide
mea
ns
(mic
rom
ol/l)
p = 0.071
0
100
200
300
400
500
600
1.0 2.0
Protein Concentration (%)
Lipi
d hy
drop
erox
ide
mea
ns
(mic
rom
ol/l)
p = 0.000
0
10
20
30
40
50
60
70
80
90
0 10 20 30 40
Heating Time (min)
Hex
anal
mea
ns
(mic
rom
ol/l)
p = 0.000
0
10
20
30
40
50
60
70
80
90
WPI WPI/NaCas
Protein Type
Hex
anal
mea
ns
(mic
rom
ol/l)
p = 0.000
0
10
20
30
40
50
60
70
80
90
1.0 2.0
Protein Concentration (%)
Hex
anal
mea
ns
(mic
rom
ol/l)
p = 0.000
0
10
20
30
40
50
60
70
80
90
0 12 24
Incubation Time (h)
Hex
anal
mea
ns
(mic
rom
ol/l)
p = 0.000
0
100
200
300
400
500
600
0 2 4
Incubation Time (h)
Lipi
d hy
drop
erox
ide
mea
ns
(mic
rom
ol/l)
p = 0.000
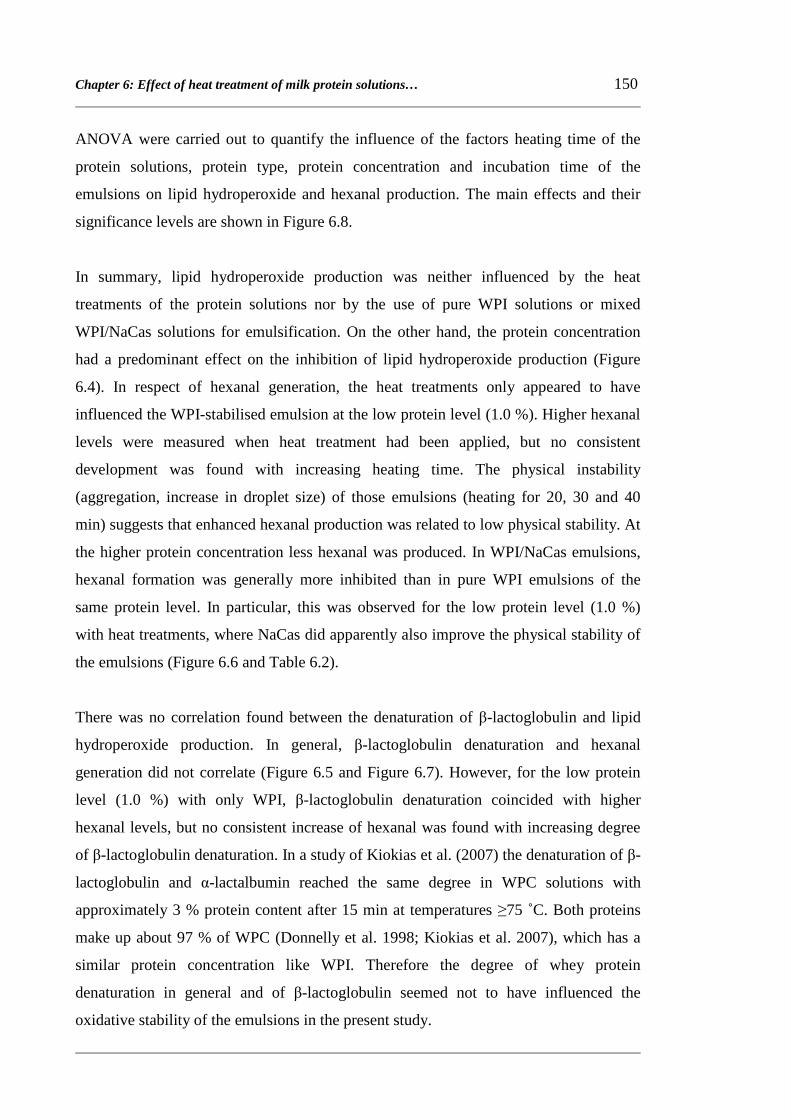
Chapter 6: Effect of heat treatment of milk protein solutions… 150
ANOVA were carried out to quantify the influence of the factors heating time of the
protein solutions, protein type, protein concentration and incubation time of the
emulsions on lipid hydroperoxide and hexanal production. The main effects and their
significance levels are shown in Figure 6.8.
In summary, lipid hydroperoxide production was neither influenced by the heat
treatments of the protein solutions nor by the use of pure WPI solutions or mixed
WPI/NaCas solutions for emulsification. On the other hand, the protein concentration
had a predominant effect on the inhibition of lipid hydroperoxide production (Figure
6.4). In respect of hexanal generation, the heat treatments only appeared to have
influenced the WPI-stabilised emulsion at the low protein level (1.0 %). Higher hexanal
levels were measured when heat treatment had been applied, but no consistent
development was found with increasing heating time. The physical instability
(aggregation, increase in droplet size) of those emulsions (heating for 20, 30 and 40
min) suggests that enhanced hexanal production was related to low physical stability. At
the higher protein concentration less hexanal was produced. In WPI/NaCas emulsions,
hexanal formation was generally more inhibited than in pure WPI emulsions of the
same protein level. In particular, this was observed for the low protein level (1.0 %)
with heat treatments, where NaCas did apparently also improve the physical stability of
the emulsions (Figure 6.6 and Table 6.2).
There was no correlation found between the denaturation of β-lactoglobulin and lipid
hydroperoxide production. In general, β-lactoglobulin denaturation and hexanal
generation did not correlate (Figure 6.5 and Figure 6.7). However, for the low protein
level (1.0 %) with only WPI, β-lactoglobulin denaturation coincided with higher
hexanal levels, but no consistent increase of hexanal was found with increasing degree
of β-lactoglobulin denaturation. In a study of Kiokias et al. (2007) the denaturation of β-
lactoglobulin and α-lactalbumin reached the same degree in WPC solutions with
approximately 3 % protein content after 15 min at temperatures ≥75 ˚C. Both proteins
make up about 97 % of WPC (Donnelly et al. 1998; Kiokias et al. 2007), which has a
similar protein concentration like WPI. Therefore the degree of whey protein
denaturation in general and of β-lactoglobulin seemed not to have influenced the
oxidative stability of the emulsions in the present study.

Chapter 6: Effect of heat treatment of milk protein solutions… 151
In protein solutions, the free sulfhydryl concentration generally increased but at the
same time the total sulfhydryl concentration decreased stronger by the influence of the
heat treatments (Figure 6.2 and Figure 6.3). Neither changes of the free nor total
sulfhydryl concentration seemed to have influenced the oxidative stability of the
emulsions. The increase of free sulfhydryls and decrease of total sulfhydryls in heated
whey protein solutions is in accordance with findings of Taylor and Richardson (1980b)
and Tong et al. (2000a). At heating temperatures above 80 ˚C, β-lactoglobulin can form
intermolecular disulfide bonds, as referred to in Liu et al. (2007). This can explain the
decrease in total sulfhydryl concentration through heating.
In a similar study to the present one (Kiokias et al. 2007), a higher degree of whey
protein denaturation (β-lactoglobulin and α-lactalbumin) coincided with more oxidative
stability (measuring conjugated diene hydroperoxides) in sunflower O/W emulsions (pH
6.78) stabilised with 3 % WPC. WPC solutions had been heated for 15 min at 40, 60,
72, 75 and 85 °C and before cooling down mixed with sunflower oil and sonicated in an
ice bath. Thereafter the emulsions were further emulsified with an APV Lab 1000
homogeniser at 300 bar, which appears to be the same homogeniser model and a similar
pressure stage as used in the present study (320/30 bar).
Kiokias et al. (2007) elaborated that upon heating and homogenisation whey proteins
partially unfold, the hydrophobic parts become exposed enhancing the proteins`
emulsifying properties. Native and denatured whey proteins can act synergistically in
physically stabilising emulsions as the native whey proteins quickly occupy the oil–
water interface and the denatured whey proteins form a thick surrounding layer. The
interface could thereby become an effective barrier against pro-oxidants from the
continuous phase. It was referred to a study of Kiokias and Bot (2006) that showed
whey protein association with the oil phase greatly increased at emulsification
temperatures between 65 to 85 ˚C, in WPC-stabilised vegetable fat O/W emulsions with
4 % protein (pH 6.8). Furthermore, Kiokias et al. (2007) pointed out that whey proteins
could unfold more by heat influence at neutral pH as there is less interaction between
the protein molecules than at low pH. Thereby free sulfhydryl groups with free-radical-
scavenging activity become more exposed at increased temperatures, deploying greater
antioxidative activity.

Chapter 6: Effect of heat treatment of milk protein solutions… 152
All WPI solutions had a temperature of 5 ˚C at the point of emulsification in the present
study, whereas the temperature varied in the study of Kiokias et al. (2007). This makes
it difficult to allocate the relative contribution of the temperature and the degree of
denaturation to oxidative stability. In two other studies the relevance of the
emulsification temperature for the oxidative stability of emulsions was also shown,
albeit the studied systems were more complex using milk as emulsifier.
In a study of Let et al. (2007b), fresh milk (1.0 % fat) was pasteurised at 72 ˚C and then
combined with cod liver oil (0.5 %). The mixture was either cooled down to 50 ˚C or
directly homogenised with a two-valve Rannie homogeniser. Lower lipid hydroperoxide
and (E)-2-hexenal (a secondary lipid oxidation product) levels were found for the 72 ˚C
treatment without cooling to 50 ˚C. This indicated that the emulsification temperature
was also important for the oxidative stability of the emulsions and not only the degree
of denaturation. The milk proteins probably had the same degree of denaturation in
either treatment but only the temperature at the time of emulsification varied. The
authors suggested that β-lactoglobulin was more surface active at the higher
emulsification temperature, resulting in improved interfacial stability. Also more
sulfhydryl groups with free-radical-scavenging activity were exposed at the higher
temperature, both resulting in increased oxidative stability.
Sorensen et al. (2007) used the same milk emulsion system as Let et al. (2007b). The
higher emulsification temperature (72 versus 50 ˚C) resulted also in greater oxidative
stability (measuring lipid hydroperoxides), when the same emulsification procedures
were followed. The greater oxidative stability for samples emulsified at 72 ˚C was
attributed to greater surface activity of β-lactoglobulin, resulting in more stable
interfaces that can act as a physical barrier towards pro-oxidants from the continuous
phase, and a higher concentration of free sulfhydryl groups. Also more casein was
found in the continuous phase at the higher emulsification temperature. It was referred
to another study, where casein exhibited an antioxidative influence because of metal-
ion-chelation activity particularly in the continuous phase of a milk–algae oil emulsion
(Gallaher et al. 2005). For the present study, however, there was no antioxidative effect
found arising from a possible interaction of heat and the presence of caseins.

Chapter 6: Effect of heat treatment of milk protein solutions… 153
Although the antioxidative influence of the whey proteins will probably increase upon
heat treatments, as their emulsifying property improves by increased hydrophobicity
and a greater exposure of free-radical-scavenging amino acid residues, the unfolding of
the proteins will partly also occur during the homogenisation process when the proteins
are forced onto the droplet interfaces. This may explain why the proteins did not alter
the oxidative stability in the present study, although they were denatured to various
degrees. On the other hand, denatured whey proteins would also have been present in
the continuous phase, but did apparently not notably contribute to oxidative stability.
A higher temperature during the homogenisation process, causing more oxidative
stability in the previously mentioned studies, could have increased the reaction rates of
proteins with free radicals and metal ions at a point when a high collision rate of all
reaction partners prevailed. After emulsification, emulsion systems are more static and
the rate of collision between proteins and pro-oxidants is probably much lower. The
oxidative stress on susceptible lipids in protein-stabilised O/W emulsions prepared at a
higher temperature may therefore be reduced already at the point of emulsion formation.
In the present study such an effect could not have occurred, as all emulsions were
prepared at the same temperature.
For emulsions prepared with the low WPI concentration (1.0 %), heat treatment of
protein solutions impaired physical and presumably oxidative stability. The
concentration of denatured whey protein might have been too high for the formation of
physically stable emulsions. The amount of native whey protein was lower in the
solutions with 1.12 % WPI compared with 2.24 % WPI at a similar degree of
denaturation. Low physical stability of whey-protein-stabilised O/W emulsions at low
concentrations of native whey protein on the droplet interface has been reported
(Kiokias and Bot 2006; Segall and Goff 2002). Higher emulsification temperatures
(≥ 70 ˚C) have also led to an increase of the droplet size in whey protein-stabilised
vegetable fat O/W emulsions after temperature-cycling, compared with stable droplet
sizes at lower emulsification temperatures (Kiokias and Bot 2006). It has also been
reported that native and denatured whey proteins would act synergistically in stabilising
emulsion droplets as the native whey proteins quickly occupy the oil–water interface
and the denatured whey proteins form a thick surrounding layer (Kiokias et al. 2007).

Chapter 6: Effect of heat treatment of milk protein solutions… 154
The right proportion of native to denatured whey proteins therefore appears to be an
influential factor for the formation of stable droplet interfaces that may act as effective
physical barrier to give oxidative stability.
The presence of casein also improved the physical stability at the low protein
concentration (1.0 % protein) and resulted in greater oxidative stability at both protein
levels. Caseins (from NaCas) and whey proteins adsorbed in equal proportions to the
droplet interface in protein-stabilised soy O/W emulsions (pH 7) when the protein
concentration was at a low limit to cover the droplet surfaces. At higher protein levels
the proportion of caseins on the interface was higher (Dalgleish 2004; Hunt and
Dalgleish 1994). In the present study, greater oxidative stability with NaCas might have
been directly related to better physical stability, for example because of thicker
interfaces, partly formed with caseins. Generally, the interface thickness is about 10 nm
for casein-stabilised emulsions compared with 2 nm in whey-protein-stabilised
emulsions (Dalgleish 2004; Dalgleish et al. 1995). In addition, other antioxidative
mechanisms are possible, e.g. metal ion chelation or free-radical-scavenging activity. A
combination of WPI and NaCas also improved the oxidative stability in Chapter 4,
Section 4.3, when protein solutions were used to dilute emulsions prepared with the
respective other protein type. This shows that the synergistic antioxidative effect of the
two protein fractions is not necessarily restricted to the formation of the droplet
interface.
In other studies, heat-treated milk protein solutions were added to already prepared
emulsions, usually stabilised with small molecule surfactants. The influence of the
protein on the oxidative stability of the emulsion would in those cases probably only
have related to the anti- or pro-oxidative activity deployed in the continuous phase. In a
study of Elias et al. (2007), β-lactoglobulin was heated in aqueous solution (95, 70, 50
and control 20 °C for 15 min). When the continuous phase of a Brij-stabilised
menhaden O/W emulsion (pH 7) was replaced with the protein solutions, the oxidative
stability increased the higher the temperature of the heat treatment had been. With
increasing temperature of the heat treatment, amino acid residues of tryptophan and
sulfhydryl groups became more exposed in the protein solution and the free-radical-
scavenging activity towards AAPH-derived radicals improved. The highest free

Chapter 6: Effect of heat treatment of milk protein solutions… 155
sulfhydryl concentration was found at 70 ˚C and for tryptophan the maximum was at 95
˚C. Heating also influenced the ability of the protein to chelate metal ions. The lowest
chelation ability was reached at the highest heating temperature (95 ˚C). It seems
therefore as if the oxidative stability was ruled by the increased exposure of free-
radical-scavenging groups, like tryptophan residues.
An increase of the antioxidative capacity of skim milk and skim milk fractions of pH
6.7 (skim milk, sweet whey, acid whey) upon heat treatment (room temperature, 70, 90,
110 and 130 ˚C) was observed by Taylor and Richardson (1980b). The cooled fractions
were added to a SDS-stabilised methyl linoleate emulsion, which generally showed
greater oxidative stability at the higher temperature of heat treatment. The free
sulfhydryl concentration increased and the total sulfhydryl concentration decreased by
the influence of elevated temperatures. Casein solution (pH 6.7), obtained by
acidification of the skim milk, subsequent washing and pH readjustment, was also heat-
treated at the same conditions. When the casein was added to the linoleate emulsion,
heat treatment showed no effect on the oxidative stability, except for extreme conditions
(110 and 130 ˚C for 30 min), when the oxidative stability decreased compared with the
control emulsion.
In a study of Tong et al. (2000a) a high molecular weight fraction of raw whey
(molecular weight cut-off 3500) was heated at room temperature (control), 60, 80 and
90 ˚C for 15 min. The samples were added to Tween 20-stabilised salmon O/W
emulsions (pH 7) to test their influence on oxidative stability (no information about the
temperature at the time of addition). When the control sample was added, slightly
higher lipid hydroperoxide and TBARS levels were measured. When the sample heated
at 60 ˚C was added, a clearly higher TBARS level and slightly higher lipid
hydroperoxide level was measured. In contrast, the heat treatments at 80 and 90 ˚C both
led to a considerable and similar decrease in lipid hydroperoxides and TBARS levels.
More aromatic amino acid residues (tyrosyl, phenylalanyl, tryptophan) and free
sulfhydryl groups became exposed with increasing heating temperature of the solutions,
indicating unfolding of the protein. At 90 ˚C the free sulhydryl concentration decreased
again, which was attributed to oxidation at the relatively extreme temperature. The total
Chapter 6: Effect of heat treatment of milk protein solutions… 156
sulfhydryl concentration decreased with increasing heating temperature. The
antioxidative influence of the solutions heated at 80 and 90 ˚C in the emulsion was
attributed to the greater exposure of free-radical-scavenging amino acid residues
(aromatic residues and free sulfhydryls), whereas the pro-oxidative influence found for
the sample treated at 60 ˚C and the control, could not be explained.
In a study of Tong et al. (2000b), a high molecular weight fraction of raw whey
(molecular weight cut-off 3500) was heated at various temperatures (room temperature,
55, 60, 65 and 70 ˚C). It showed decreasing ability to scavenge free radicals derived
from AAPH in aqueous solution, the higher the heating temperature had been. The free-
radical-scavenging activity was 42 % for the unheated sample compared with the
control without protein, whereas only 9 % for the sample treated at 70 ˚C. In
comparison, it was 34 % when free sulfhyrdyl groups had been blocked by N-
ethylmaleimide (NEM), pointing to a moderate ability of free sulfhydryls to scavenge
free radicals. The results also indicated that the free-radical-scavenging activity was
considerably impaired by the influence of heat. This was attributed to a possible protein
aggregation which could have led to a reduced exposure of hydrophobic amino acid
residues with free-radical-scavenging activity, like tyrosyl.
Liu et al. (2007) found decreased antioxidative activity of β-lactoglobulin towards Cu2+-
induced oxidation of low density lipoproteins when the protein had been heated in
aqueous solution (100 ˚C for 2 min, cooled to 10 ˚C afterwards). This was attributed to
a loss of sulfhydryl groups due to disulfide formation, which was measured by SDS-
PAGE and Western blot analyses.
Contradictory results have been obtained about the influence of heat on the
antioxidative properties of whey proteins. In various studies the heat treatment of whey
proteins has improved their antioxidative properties (Elias et al. 2007; Kiokias et al.
2007; Let et al. 2007b; Sorensen et al. 2007; Taylor and Richardson 1980b; Tong et al.
2000a), whereas others reported about pro-oxidative or reduced antixodiative activity
upon heat treatment (Liu et al. 2007; Tong et al. 2000a; Tong et al. 2000b). Taylor and
Richardson (1980b) also reported about decreased oxidative stability of a linoleate
emulsion to which casein was added that had been heated at extreme temperatures ≥ 110

Chapter 6: Effect of heat treatment of milk protein solutions… 157
˚C. For the present study, heat treatment showed either no effect or appears to have
caused physical instability of the emulsions (at the lower WPI level) and thus possibly
oxidative instability.
In future studies about the influence of heat on the anti- or pro-oxidative properties of
whey proteins and caseins, the role of other factors needs to be investigated.
Elevated temperatures can increase the surface hydrophobicity of whey proteins and
may improve their ability to form thick interfaces that function as effective physical
barrier against pro-oxidants from the continuous phase. On the other hand the ratio of
native to denatured whey protein or the presence of caseins will influence the interfacial
properties and thereby the oxidative stability of an emulsion.
At the point of emulsification, the collision rate of molecules is probably high compared
with the situation in already formed emulsions. The probability for collisions of proteins
and other compounds with antioxidative properties with metal ions or free radicals
seems therefore more likely during emulsification. In combination with the high
collision rate of molecules, the temperature at the time of emulsification is likely to
influence the oxidative stability of the emulsion lipid as metal ion chelation and free-
radical-scavenging reactions are accelerated with increasing temperature. In that respect
the temperature at the point of emulsification may play a role for the oxidative stability
of emulsions. The oxidative stability may thus not only be influenced by the
denaturation of proteins and the consequences thereof. The temperature at the point of
emulsification seems therefore a factor that needs to be further elucidated.
At elevated temperatures whey proteins unfold, which also leads to an increased
exposure of aromatic amino acid residues and sulfhydryl groups, contributing to free-
radical-scavenging activity. On the other hand the chelation ability can be impaired as
shown by Elias et al. (2007). In that context the concentration of pro-oxidative metal
ions in an emulsion possibly limits the antioxidative influence of heat-treated whey
proteins. At low metal ion concentrations, low metal ion chelation ability may not be
important and could be outweighed by the antioxidative effect of more exposed free-
radical-scavenging groups. At higher metal concentrations, the chelation capacity is
Chapter 6: Effect of heat treatment of milk protein solutions… 158
probably a more important factor and crucial for the oxidative stability. It also needs to
be considered that free sulfhydryl groups were found to be pro-oxidative under some
conditions as they may reduce ferric to ferrous iron which is the stronger pro-oxidant
(Marcuse 1960; Marcuse 1962; Pazos et al. 2006; Wong and Kitts 2003). The presence
of metal ions is therefore also a factor that needs to be considered in future studies about
the influence of heat on the antioxidative properties of whey proteins.

Chapter 7: Effect of free radicals on lipid and protein oxidation 159
Chapter 7
Effect of free radicals on lipid and protein oxidation
Free radicals are key compounds and potent promoters in the oxidation process of
biological materials. The oxidation of lipids is fuelled by the presence of free radicals.
Also proteins have been shown to undergo oxidation through free radical activity
(Davies 2003; Elias et al. 2008; Hawkins and Davies 2001). It was shown that high
protein concentrations limited lipid oxidation in O/W emulsions. As free radicals are
known to be an important factor in lipid oxidation, the milk proteins may function as
free radical scavengers. This means that the damage to the emulsion lipid could be
limited by the accumulation of free radicals on the proteins. In turn this could lead to
molecular modifications of the proteins. An oxidation of proteins rather than lipids
would have less negative consequences for the sensory properties of the emulsion. In
this section, lipid and protein oxidation in the emulsions was investigated with a special
focus on the free-radical-scavenging activity of the milk proteins. Oxygen consumption
was introduced as a new method to measure oxidation in general.
7.1 Effects of free radicals on oxygen consumption and lipid hydroperoxide production in emulsions
The influence of free radicals on lipid oxidation in emulsions was investigated by the
addition of the free radical source 2,2`-azobis(2methylpropion-amidine) dihydrochloride
(AAPH). The azo compound AAPH has been used in many free radical studies before.
It is water soluble and one AAPH molecule breaks down at a temperature-dependent
rate into two smaller molecules with a carbon-centered radical (C•) on each
(http://www.caymanchem.com/app/template/Product.vm/catalog/82235/promo/searchre
sult.82235/a/z 2008). The influence of milk protein type and concentration on oxygen
consumption and lipid hydroperoxide production was investigated.

Chapter 7: Effect of free radicals on lipid and protein oxidation 160
Sampling at various times
165 ml emulsion
with 0 or 14.7 g/l AAPH in a
closed glass flask pH 6.0, 37 °C
stirred with stirring bar
N2
3.5 ml
Emulsion
3.5 ml
The experimental outline is depicted in Figure 7.1. Emulsions were prepared with
protein solutions based on phosphate buffer (pH 6.0) as the decomposition rate of
AAPH also depends on the pH. More details about the execution can be found in
Chapter 3, Materials and methods.
Figure 7.1: Experimental outline: oxygen consumption and lipid hydroperoxide generation in emulsions, accelerated by AAPH
WPI or NaCas emulsions (320/30 bar)
(1.0 % or 4.0 % or 7.0 % protein content)
in phosphate buffer (0.1 M, pH 6.0) AAPH solution or
RO water
12.4 ml
NaOH 10 M (≈ 1.5 ml) for adjustment to pH 6.0 to 6.0
O2 monitoring
Distribution 3 x 1 ml
On ice immediately
On ice and into freezer (-18 °C)
within 10 min
Lipid hydroperoxide measurements

Chapter 7: Effect of free radicals on lipid and protein oxidation 161
In this experimental set-up, it was difficult to measure the initial oxygen concentrations.
After the addition of AAPH, one minute was granted to reach homogeneity and a
second minute allowed for equilibration after the system had been closed with a stopper.
The first measurements, therefore, took place after two minutes.
The decrease of the oxygen concentration for emulsions with and without AAPH (14.7
g/l) is shown in Figure 7.2.
Figure 7.2: Decrease of oxygen concentration in WPI and NaCas emulsions with AAPH (14.7 g/l) (—) and without AAPH (---): WPI 7.0 % (✕✕✕✕), WPI 4.0 % (+), WPI 1.0 % (❇), NaCas 7.0 % (����), NaCas 4.0 % (□), NaCas 1.0 % (●)
Emulsions with AAPH showed a much faster decrease of the oxygen concentration than
those without AAPH. When AAPH was added, the oxygen concentration had dropped
to ≤ 20 µmol/l within 15 min, whereas at least 50 µmol/l oxygen was still present after
45 min without AAPH addition.
0
10
20
30
40
50
60
70
80
90
100
110
120
130
140
150
160
170
180
190
0 2 4 6 8 10 12 14 16 18 20 22 24 26 28 30 32 34 36 38 40 42 44
Incubation Time (min)
Oxy
gen
Con
cent
ratio
n (m
icro
mol
/l)
Chapter 7: Effect of free radicals on lipid and protein oxidation 162
In NaCas emulsions without AAPH, the oxygen concentration decreased the strongest
in the 1.0 % protein emulsion and the decrease was weaker and similar for the 4.0 and
7.0 % protein level. In WPI emulsions without AAPH, the decrease in oxygen
concentration was similar for the 1.0 and 4.0 % protein level (also similar to the NaCas
1.0 % protein level) and stronger than for the 7.0 % protein level (which showed a
similar decrease as for the NaCas 7.0 % protein level).
The decrease in oxygen concentration as a function of incubation time for emulsions
with AAPH was linear at the beginning of the incubation process and reached very low
values within a few minutes (Figure 7.3). For emulsions with three or more data points
in the area of linear decrease, linear regression curves were created in Microsoft Excel
(Table 7.1), so that the initial oxygen concentrations (0 min) could be determined. The
values obtained were averaged and the mean value of the initial oxygen concentrations
calculated (145 ± 8 (SEM) µmol/l). In emulsions of 1.0 % protein, oxygen decreased
very fast and only a few data points lay in the area of linear decrease. For WPI and
NaCas emulsions with 1.0 % protein the initial oxygen concentration was estimated to
be 145 µmol/l (Figure 7.3).

Chapter 7: Effect of free radicals on lipid and protein oxidation 163
Figure 7.3: Decrease of oxygen concentration in WPI and NaCas emulsions with AAPH (14.7 g/l): linear regression curves (---), connection of data points (―), WPI 7.0 % (✕✕✕✕), WPI 4.0 % (+), WPI 1.0 % (❇), NaCas 7.0 % (����), NaCas 4.0 % (□), NaCas 1.0 % (●)
Table 7.1: Linear regression analysis of data on oxygen concentration in WPI and NaCas emulsions of 4.0 and 7.0 % protein with AAPH (14.7 g/l)
Emulsion type Equation of the linear regression curve
Coefficient of determination (R2)
WPI, 4.0 % y = - 23.536x + 138.78 0.9989
WPI, 7.0 % y = - 23.069x + 159.22 0.9983
NaCas, 4.0 % y = - 15.014x + 125.22 0.9999
NaCas, 7.0 % y = - 14.795x + 158.43 0.9931
0
20
40
60
80
100
120
140
160
0 1 2 3 4 5 6 7 8 9 10
Incubation Time (min)
Oxy
gen
Con
cent
ratio
n (m
icro
mol
/l)

Chapter 7: Effect of free radicals on lipid and protein oxidation 164
In order to follow and compare oxygen consumption over time easier, the oxygen
concentration in micromole per litre was converted into micromoles of oxygen
consumed (Figure 7.4).
Figure 7.4: Oxygen consumption in micromole in WPI and NaCas emulsions with AAPH (14.7 g/l): WPI 7.0 % (✕✕✕✕), WPI 4.0 % (+), WPI 1.0 % (❇), NaCas 7.0 % (����), NaCas 4.0 % (□), NaCas 1.0 % (●)
At all protein levels, oxygen was consumed faster in WPI than in NaCas emulsions.
Within one protein type, oxygen was consumed at the same rate for 4 and 7 % protein
emulsions, but consumed faster at the 1 % protein level.
0
5
10
15
20
25
30
0 1 2 3 4 5 6 7
Incubation Time (min)
Oxy
gen
Con
sum
ptio
n (m
icro
mol
)

Chapter 7: Effect of free radicals on lipid and protein oxidation 165
The development of lipid hydroperoxides in the same WPI and NaCas emulsions with
and without AAPH (14.7 g/l) is shown in Figure 7.5.
Figure 7.5: Lipid hydroperoxide development in WPI and NaCas emulsions with AAPH (14.7 g/l) (―) and without AAPH (---): WPI 7.0 % (✕✕✕✕), WPI 4.0 % (+), WPI 1.0 % (❇), NaCas 7.0 % (����), NaCas 4.0 % (□), NaCas 1.0 % (●)
Lipid hydroperoxides developed much faster in emulsions with AAPH. Furthermore,
the values of the same type of emulsion were at all times lower when no AAPH was
added.
0102030405060708090
100110120130140150160170180190200210220230240250260
0 2 4 6 8 10 12 14 16 18 20 22 24 26 28 30 32 34 36 38 40 42 44
Incubation Time (min)
Lipi
d H
ydro
pero
xide
s (m
icro
mol
/l)

Chapter 7: Effect of free radicals on lipid and protein oxidation 166
Table 7.2: Lipid hydroperoxide concentrations in WPI and NaCas emulsions of various protein concentrations without AAPH after 4 and 44 min
Emulsion type Lipid hydroperoxides in emulsion (µmol/l)
after 4 min
after 44 min
WPI 1.0 % 97 150 WPI 4.0 % 85 105 WPI 7.0 % 63 92
NaCas 1.0 % 66 85 NaCas 4.0 % 33 28 NaCas 7.0 % 22 28
Less lipid hydroperoxides developed in NaCas emulsions than in WPI emulsions
without AAPH. NaCas emulsions of 4.0 % and 7.0 % protein showed no increase in
lipid hydroperoxides over 44 min. In general, less lipid hydroperoxides developed with
increasing protein concentration (Table 7.2).
When AAPH was added, the highest lipid hydroperoxide levels were found in the WPI
(1.0 % protein) emulsion. The values were constant over time (240-250 µmol/l). In the
WPI (4.0 % protein) emulsion the lipid hydroperoxide level increased from 140 to 175
µmol/l within 8 minutes and in the WPI (7.0 % protein) emulsion from 125 to 150
µmol/l within 10 minutes. In the NaCas (1.0 % protein) emulsion the second highest
lipid hydroperoxide levels were found. The level had increased from 135 to 200 µmol/l
after two minutes and remained constant over time thereafter. In the other NaCas
emulsions, the lipid hydroperoxide levels increased from 130 to 165 µmol/l (4.0 %
protein) and from 70 to 130 µmol/l (7.0 % protein) within 10 minutes.
The same trends were found in emulsions with and without AAPH. The lower the
protein concentration, the stronger was the lipid hydroperoxide generation. In NaCas
emulsions less lipid hydroperoxides were formed.

Chapter 7: Effect of free radicals on lipid and protein oxidation 167
As expected, the addition of a free radical source (AAPH) had a strongly pro-oxidative
effect on the emulsions. Oxygen was consumed faster and lipid hydroperoxides were
produced faster or reached higher levels than in emulsions without AAPH. It was also
shown that proteins had an antioxidative effect. With AAPH, the consumption of
oxygen occurred at a linear rate in the initial stages. It can be assumed that the rate of
free radical production was also linear over time
(http://www.caymanchem.com/app/template/Product.vm/catalog/82235/promo/searchre
sult.82235/a/z 2008). This indicates a correlation between the production of AAPH-
derived radicals and oxygen consumption. The slope of oxygen consumption varied
depending on the protein type and concentration. There was no difference between the
rate of oxygen consumption for emulsions with 4.0 and 7.0 % protein within one protein
type, but at 1.0 % protein content, oxygen was consumed faster (Figure 7.4). Also,
oxygen was consumed faster in WPI than in NaCas emulsions. As oxygen consumption
and AAPH radical production appear to be linked, the rate of oxygen consumption is
likely to mirror the ability of the proteins to scavenge AAPH-derived radicals.
In emulsions without AAPH, the same antioxidative characteristics were generally
observed: greater inhibition towards oxygen consumption and lipid hydroperoxide
generation were found for higher protein levels and NaCas. Therefore one might
attribute the observed antioxidative performances of these emulsions, to a large extent,
to the ability of the incorporated proteins to scavenge free radicals.
Figure 7.6 shows how the proteins possibly intervened in the autoxidation of the
emulsion lipid accelerated by AAPH-derived radicals. By the reaction of proteins with
those radicals, presumably more stable and less reactive radicals were formed on the
proteins (free-radical-scavenging process). Less AAPH-derived radicals were therefore
available for reactions with the lipid molecules of the emulsion and lipid oxidation was
inhibited. As the AAPH radical production rate was constant, only depending on the
temperature and the pH value, and less oxygen was consumed at the higher protein
content, it is assumed that the free radicals formed on the proteins did not react with
oxygen to a notable extent. Figure 7.6 also illustrates how less oxygen is consumed and
lipid hydroperoxides are formed when the protein concentration increases from (a) to
(c).

Chapter 7: Effect of free radicals on lipid and protein oxidation 168
4 LH + 4 A• 4 AH + 4 L• + 4 O2 4 LOO• + 4 LH 4 LOOH + 4 L• (a)
+ 2 PH
4 AH + 2 LH + 2 L• + 2 P• + 4 O2 2 LOO• + 2 P• + 2 O2 (b)
+ 2 LH
+ 4 PH 2 LOOH + 2 L•
4 AH + 4 LH + 4 P• + 4 O2 4 P• + 4 O2 (c)
Figure 7.6: Possible antioxidative intervention of proteins in the autoxidation of the emulsion lipid accelerated by AAPH: LH = lipid, L• = lipid radical, PH = protein, P• = protein radical, AH = AAPH derived radical reduced with hydrogen, A• = AAPH derived radical, O2 = oxygen, LOO• = peroxyl radical, LOOH = lipid hydroperoxide, (a) A• reacts only with lipid, no protein is present, (b) A• reacts with some lipid and protein at a low protein concentration, (c) A• reacts only with protein at a high protein concentration
The proteins (PH) scavenged AAPH-derived radicals (A•) and also lipid radicals (L•)
already present in the emulsions, although this is not explicitly shown in Figure 7.6. The
focus here was on the strong external pro-oxidant AAPH.

Chapter 7: Effect of free radicals on lipid and protein oxidation 169
7.2 Effects of free radicals on protein oxidation
It was shown that the milk proteins exhibited free-radical-scavenging abilities. Free
radicals were transferred to the protein molecules which presumably led to some
molecular damage of these molecules by oxidation. In this section, molecular damage to
the proteins and how this might be linked to their antioxidative mechanisms was
investigated.
The first intention was to detect free radicals directly on the proteins, but it was
abandoned as the most appropriate investigating tool would have been electron spin
resonance (ESR) spectrometry and this would have required a major readjustment of the
project.
Instead the consumption of oxygen in protein solutions exposed to the influence of
AAPH (14.7 g/l) and the development of protein hydroperoxides in emulsions were
followed to examine the reactivity of the proteins toward oxygen. Also the generation of
protein hydroperoxides was compared with the generation of lipid hydroperoxides in the
same emulsion system to get an estimate of the relative reactivity of emulsion lipid
(linoleic acid) and protein (WPI) towards oxygen. Elias et al. (2008) mention in their
review about the antioxidative activity of proteins and peptides that the relative kinetics
of protein and lipid oxidation were not investigated in many studies about protein
oxidation, leaving uncertainty if lipid oxidation causes the oxidation of proteins or if
proteins oxidise as they are protecting the lipids from oxidation.
Secondly, the loss of amino acids and total sulfhydryls were determined. Amino acid
loss and changes of the total sulfhydryl concentration were investigated in a WPI
emulsion (1.0 % protein) and also in a WPI solution (1.12 % protein) exposed to the
influence of AAPH (14.7 g/l). It was thereby possible to examine differences in the
deteriorative effects caused by free radicals from oxidising lipid compared with free
radicals derived from AAPH.
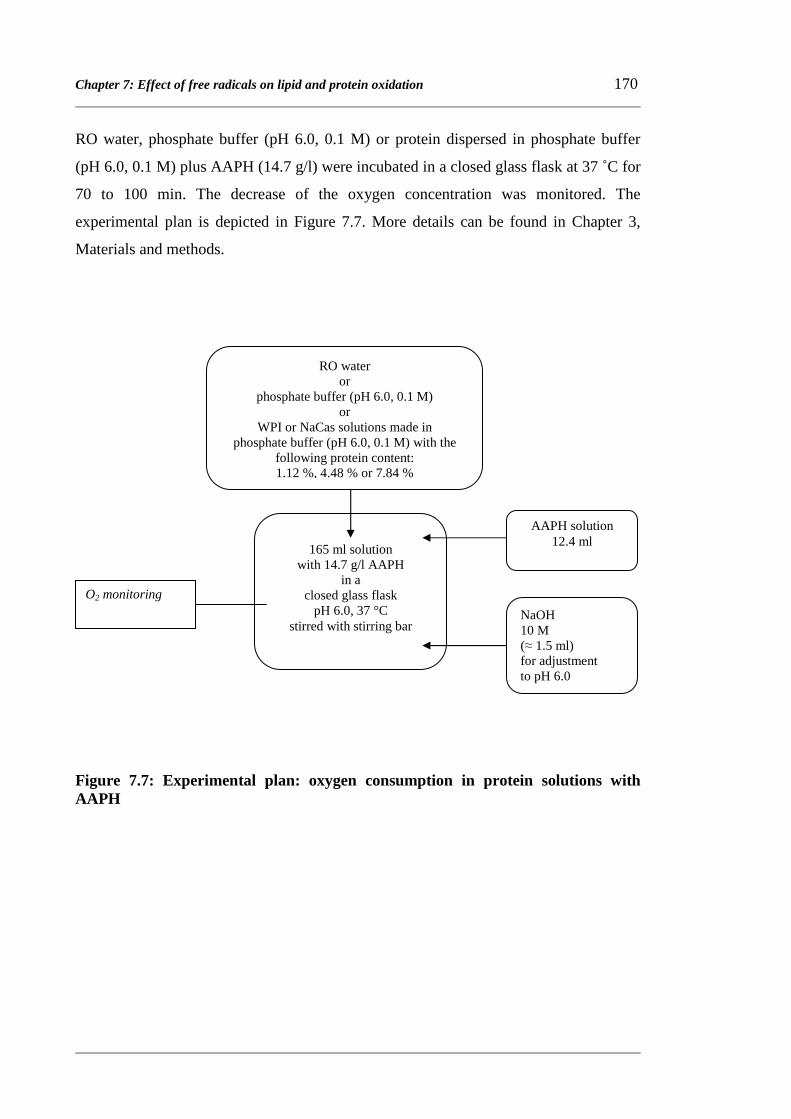
Chapter 7: Effect of free radicals on lipid and protein oxidation 170
165 ml solution
with 14.7 g/l AAPH in a
closed glass flask pH 6.0, 37 °C
stirred with stirring bar
RO water, phosphate buffer (pH 6.0, 0.1 M) or protein dispersed in phosphate buffer
(pH 6.0, 0.1 M) plus AAPH (14.7 g/l) were incubated in a closed glass flask at 37 ˚C for
70 to 100 min. The decrease of the oxygen concentration was monitored. The
experimental plan is depicted in Figure 7.7. More details can be found in Chapter 3,
Materials and methods.
Figure 7.7: Experimental plan: oxygen consumption in protein solutions with AAPH
RO water or
phosphate buffer (pH 6.0, 0.1 M) or
WPI or NaCas solutions made in phosphate buffer (pH 6.0, 0.1 M) with the
following protein content: 1.12 %, 4.48 % or 7.84 %
AAPH solution 12.4 ml
NaOH 10 M (≈ 1.5 ml) for adjustment to pH 6.0 to 6.0
O2 monitoring

Chapter 7: Effect of free radicals on lipid and protein oxidation 171
The development of protein hydroperoxides, in the continuous and cream phase, and
lipid hydroperoxides in a WPI emulsion (1.0 % protein) incubated for 4 h at 50 ˚C was
followed. Protein hydroperoxides were determined as described as follows. Protein
solution from the continuous or cream phase was used in the protein hydroperoxide
assay. The amount of hydroperoxides (µmol) in 1 ml of the respective protein solution
was determined based on a hydrogen peroxide standard curve. The protein content (g)
of 1 ml of the continuous and cream phase solutions of the emulsion incubated for 0 h
had been determined in another experiment carried out under the same experimental
conditions (Figure 7.9). The two values, the amount of hydroperoxides (µmol) and the
protein content (g) in 1 ml protein solution, were divided, giving the hydroperoxide
concentration (µmol/g) on the protein. Previously the amount of WPI present in the
continuous phase and on the interface of a WPI (1.0 % protein) emulsion had been
determined (Chapter 3, Materials and methods, 3.3.3 Methods: Chapter 4.3). The
protein hydroperoxide concentration (µmol/g) on the protein found for the respective
phase and incubation time was multiplied with the amount (g) of protein in the
continuous phase and on the emulsion interface of 1 ml of a WPI (1.0 % protein)
emulsion. The amount of hydroperoxides (µmol) obtained was multiplied by 1000,
resulting in the protein hydroperoxide concentrations (µmol/l) in the emulsion. The
presentation of the values in µmol/l of emulsion allowed a direct comparison with the
development of lipid hydroperoxides (µmol/l). The experimental plan is depicted in
Figure 7.8. More details about the execution can be found in Chapter 3, Materials and
methods.

Chapter 7: Effect of free radicals on lipid and protein oxidation 172
Figure 7.8: Experimental plan: development of protein hydroperoxides in the continuous and cream phase and lipid hydroperoxides in a WPI (1.0 % protein) emulsion
WPI solution 1.12 % protein
linoleic acid
320/30 bar 2 x WPI emulsion
1.0 % protein
1st emulsion: Incubation at 50 °C for 0 h: 8 * 10 ml for 4 h: 8 * 10 ml
Centrifugation
Replacement of subnatant by same
weight of SDS solution (2.0 %)
Re-emulsification by vortexing and
shaking
Centrifugation
Subnatant (= solution containing cream
phase protein) taken out
16 * tubes with continuous phase protein solution: 8 * 0 h, 8 * 4 h
16 * tubes with cream phase protein solution: 8 * 0 h, 8 * 4 h
Two volume aliquots of 4 * 0 h and of 4 * 4 h combined respectively => 2 * 0 h and 2 * 4 h samples
Two volume aliquots of 4 * 0 h and of 4 * 4 h combined respectively => 2 * 0 h and 2 * 4 h samples
Protein hydroperoxide determination
2 x
2nd emulsion: Incubation at 50 °C
for 0 h: 3 * 1 ml for 4 h: 3 * 1 ml
Selection of the least turbid samples (visually evaluated): 4 * 0 h and 4 * 4 h
Selection of the least turbid samples (visually evaluated): 4 * 0 h and 4 * 4 h
Lipid hydroperoxide determination
Subnatant (= continuous phase)
taken out

Chapter 7: Effect of free radicals on lipid and protein oxidation 173
The concentration of a wide range of amino acids and total sulfhydryls in the protein of
the continuous and cream phase of a WPI (1.0 % protein) emulsion was followed over
time. The emulsion was incubated for up to 20 h at 50 ˚C. Briefly, amino acids were
determined by acidic hydrolysis of the protein followed by HPLC analysis according to
laboratory procedures (Zou 2005) based on AOAC Official Methods 994.12 and 985.28
and for tryptophan determination alkaline hydrolysis was performed followed by HPLC
analysis based on the AOAC Official Method 988.15 (AOAC 2005b; AOAC 2005d).
Total sulfhydryls were determined with an adapted method from Taylor and Richardson
(1980b). The amino acid and total sulfhydryl concentration were calculated in
micromole per g of protein and referred to the protein content of the continuous and
cream phase solutions at 0 h of incubation. The protein content was determined by
summing up the contents of all amino acids. It decreased from about 0.5 to 0.4 % over
18 h (measurements of 0 h, 4 h and 18 h samples). The decrease was probably due to a
structural change of some of the amino acids which could therefore not be detected any
more. It was probably not due to a change of the general protein content in the
solutions. Therefore the protein contents of only the samples of 0 h incubation time
were considered. The protein contents determined by the “Leco, total combustion
method” according to AOAC Official Method 968.06 (Dumas Method) gave similar
results for the samples of 0 h incubation time (AOAC 2005a). However, the method
seemed not suitable to measure the protein content when emulsion samples were
incubated for 4 h and longer as the results exhibited a high variability. The experimental
plans are depicted in Figure 7.9 and Figure 7.10. More details about the execution can
be found in Chapter 3, Materials and methods.

Chapter 7: Effect of free radicals on lipid and protein oxidation 174
Figure 7.9: Experimental plan: investigation of amino acid concentrations in the protein of continuous and cream phase of a WPI (1.0 %) emulsion incubated at 50 ˚C for 18 h
WPI solution 1.12 %
linoleic acid
320/30 bar 2 x WPI emulsion
1.0 %
Incubation at 50 °C for 0 h: 8 * 10 ml (1st em.) for 4 h: 8 * 10 ml (1st em.)
for 18 h: 8 * 10 ml (2nd em.)
Centrifugation
Replacement of subnatant by same
weight of SDS solution (2.0 %)
Re-emulsification by vortexing and
shaking
Centrifugation
Subnatant (= solution containing cream
phase protein) taken out
Subnatant (= continuous phase)
taken out
24 * tubes with continuous phase protein solution (8 * 0 h, 8 * 4 h, 8 * 18 h)
24 * tubes with cream phase protein solution (8 * 0 h, 8 * 4 h, 8 * 18 h)
Four volume aliquots of 4 * 0 h, 4 * 4 h and 4 * 18 h combined respectively => 1 * 0 h, 1 * 4 h and 1 * 18 h samples
Four volume aliquots of 4 * 0 h, 4 * 4 h and 4 * 18 h combined respectively => 1 * 0 h, 1 * 4 h and 1 * 18 h samples
Amino acid determination & calculation of protein content based on that
2 x
Least turbid samples (visually evaluated): 4 * 0 h, 4 * 4 h and 4 * 18 h
Least turbid samples (visually evaluated): 4 * 0 h, 4 * 4 h and 4 * 18 h
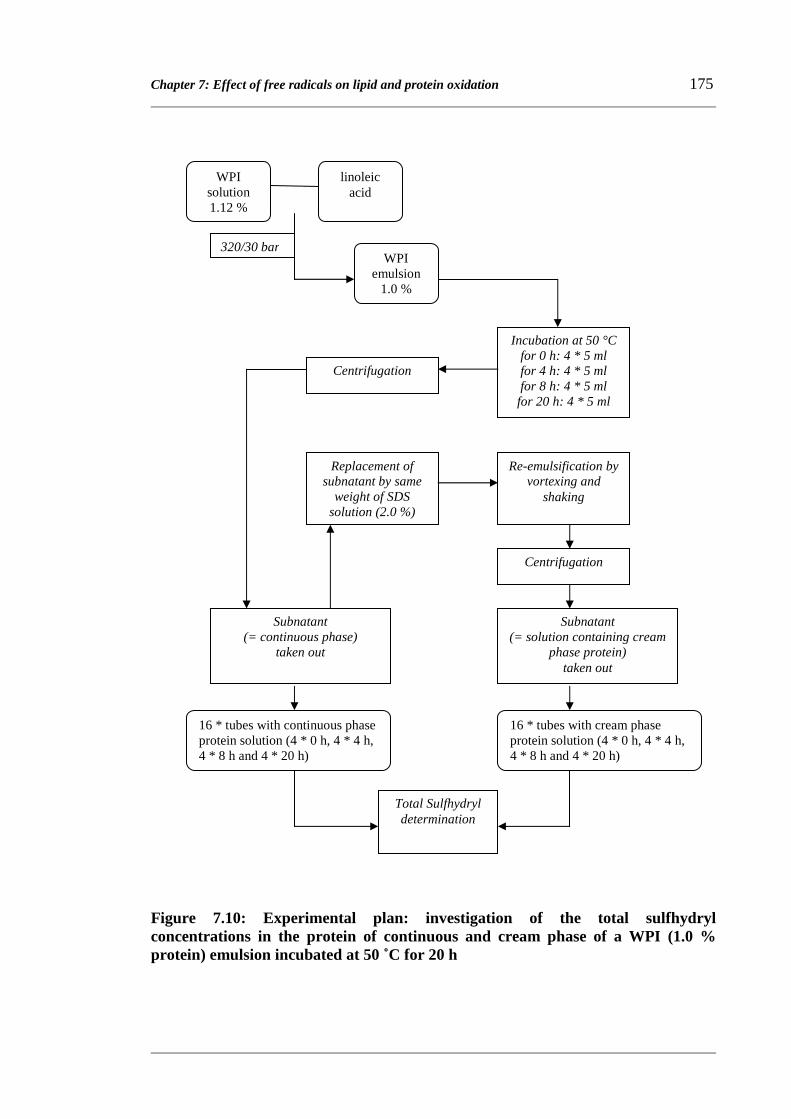
Chapter 7: Effect of free radicals on lipid and protein oxidation 175
Figure 7.10: Experimental plan: investigation of the total sulfhydryl concentrations in the protein of continuous and cream phase of a WPI (1.0 % protein) emulsion incubated at 50 ˚C for 20 h
WPI solution 1.12 %
linoleic acid
320/30 bar WPI
emulsion 1.0 %
Incubation at 50 °C for 0 h: 4 * 5 ml for 4 h: 4 * 5 ml for 8 h: 4 * 5 ml for 20 h: 4 * 5 ml
Centrifugation
Replacement of subnatant by same
weight of SDS solution (2.0 %)
Re-emulsification by vortexing and
shaking
Centrifugation
Subnatant (= solution containing cream
phase protein) taken out
Subnatant (= continuous phase)
taken out
16 * tubes with continuous phase protein solution (4 * 0 h, 4 * 4 h, 4 * 8 h and 4 * 20 h)
16 * tubes with cream phase protein solution (4 * 0 h, 4 * 4 h, 4 * 8 h and 4 * 20 h)
Total Sulfhydryl determination

Chapter 7: Effect of free radicals on lipid and protein oxidation 176
WPI (1.12 % protein) solutions with and without the free radical source AAPH (14.7
g/l) were incubated for 18 h at 50 ˚C (four replicates). The protein solutions to which
AAPH was added were prepared with phosphate buffer (0.1 M) of pH 6.0 instead of RO
water as it was also used for pH stability when AAPH had caused a strong decrease of
the oxygen concentration in emulsions. The concentration of a wide range of amino
acids and total sulfhydryls in the protein was determined. For the amino acid
determination four aliquots were taken from each sample and combined. The amino
acids were determined as stated above. For the total sulfhydryl determination, three of
the four samples were determined. More details about the execution can be found in
Chapter 3, Materials and methods.
Figure 7.11: Experimental plan: investigation of amino acid and total sulfhydryl concentrations in the protein of a WPI (1.12 % protein) solution with and without AAPH (14.7 g/l) incubated at 50 ˚C for 18 h
WPI solution (1.12 % protein)
without AAPH
WPI solution (1.12 % protein) made in
phosphate buffer
(pH 6.0) with
AAPH (14.7 g/l)
18 h incubation at 50 ˚C
Determination of total sulfhydryls
Determination of amino acids
4 * 1 ml 4 * 1 ml
4 aliquots of 4 * 1 ml combined
4 aliquots of 4 * 1 ml combined

Chapter 7: Effect of free radicals on lipid and protein oxidation 177
The oxygen concentration in WPI and NaCas solutions with AAPH (14.7 g/l) decreased
slightly faster than in the control solutions (phosphate buffer of pH 6.0 and RO water).
The WPI and NaCas solution of the same protein concentration showed a similar
decrease. Also the decrease was similar in solutions with different protein concentration
(Figure 7.12). In emulsions with the same level of AAPH the oxygen concentration
decreased much faster (see earlier in Section 7.1, Figure 7.2). This indicated a much
greater reactivity of linoleic acid rather than the milk proteins with oxygen under pro-
oxidative conditions at a high level of free radicals.
Figure 7.12: Decrease of oxygen concentration in aqueous solutions with AAPH (14.7 g/l): RO water (����), phosphate buffer of pH 6.0 (◇◇◇◇), WPI 1.12 % (■), WPI 4.48 % (△△△△), WPI 7.84 % (✕✕✕✕), NaCas 4.48 % (����)
0
20
40
60
80
100
120
140
160
180
200
220
0 10 20 30 40 50 60 70 80 90 100 110
Incubation Time (min)
Oxy
gen
Con
cent
ratio
n (m
icro
mol
/l)

Chapter 7: Effect of free radicals on lipid and protein oxidation 178
The values obtained in the protein hydroperoxide determination were fairly variable
(Table 7.3), which was probably due to the extended multi-step procedure in the protein
hydroperoxide assay (Chapter 3, Materials and methods, 3.6.4 Methods: Chapter 7.2).
The protein hydroperoxide concentration in both, cream phase and continuous phase,
appear to be low and stable over time in comparison with the development of lipid
hydroperoxides. The lipid hydroperoxide level in the emulsion increased about ten-fold
over the same time period (4 h), from 25 ± 2 µmol/l to 247 ± 3 µmol/l (± SEM). This
result appears to be in line with the finding that faster oxygen consumption occurred in
emulsions than in protein solutions, indicating that oxygen reacted more readily with
linoleic acid than with the milk proteins.
Table 7.3: Protein hydroperoxide concentration at 0 h and after 4 h incubation time derived from continuous and cream phase protein in a WPI (1.0 % protein) emulsion
Type of protein source
Incubation time of the emulsion
(h)
Mean value of protein hydroperoxides in a WPI (1.0 % protein)
emulsion (n = 2) ± SEM* (µmol/l)
Single values of protein hydroperoxides in a WPI (1.0 % protein)
emulsion
(µmol/l)
Continuous phase protein 0 18.2 ± 9.0 27.3, 9.2 4 11.6 ± 0.6 11.0, 12.2
Cream phase protein 0 4.2 ± 1.5 2.7, 5.7 4 11.8 ± 4.5 16.2, 7.3
*SEM = standard error of the mean value

Chapter 7: Effect of free radicals on lipid and protein oxidation 179
The concentration of total sulfhydryls decreased from 43 to 5 µmol/g protein in the
continuous phase and from 14 to 4 µmol/g protein in the cream phase of a WPI (1.0 %
protein) emulsion incubated for 20 h (Figure 7.13, see also Table 7.4 and Table 7.5).
Figure 7.13: Changes in total sulfhydryls in the protein of continuous phase (□) and cream phase (△△△△) of a WPI (1.0 % protein) emulsion
0
5
10
15
20
25
30
35
40
45
50
0 4 8 12 16 20
Incubation Time (h)
Tot
al S
ulfh
ydry
ls (
mic
rom
ol/g
of p
rote
in)

Chapter 7: Effect of free radicals on lipid and protein oxidation 180
An overview about the concentrations of various amino acids in the continuous and
cream phase protein of a WPI (1.0 % protein) emulsion over 18 h incubation time is
given in Figure 7.14 and Figure 7.15. More details are given in Table 7.4 and Table 7.5.
Overall the decrease in amino acid concentrations was slightly higher in the cream
phase protein (1346 µmol/g protein) than in the continuous phase protein (1068 µmol/g
protein), excluding total sulfhydryls. The greatest decreases in concentration in the
continuous phase protein were found for glutamic acid (including glutamine) (192
µmol/g protein), lysine (186 µmol/g protein) and leucine (182 µmol/g protein). In the
cream phase protein, the greatest decreases in concentration were found for lysine (262
µmol/g protein), aspartic acid (including asparagine) (235 µmol/g protein) and leucine
(154 µmol/g protein). Although the aspartic acid/asparagine concentration greatly
decreased in the cream phase protein only a minor decrease occurred in the continuous
phase protein.
For the continuous phase protein, the greatest decreases in percent occurred for total
sulfhydryls (cysteine) (88 %), tryptophan (45 %) and methionine (40 %). For the cream
phase protein, it was also total sulfhydryls (cysteine) (72 %), tryptophan (58 %) and
methionine (37 %) (Table 7.4 and Table 7.5).
For some amino acids an increase in concentration was found, especially from 0 to 4 h.
As there was an increase in one phase and at the same time a decrease in the other phase
(e.g. for glutamic acid/glutamine, leucine and alanine from 0 to 4 h), proteins and/or
peptides could have migrated between the phases.

Chapter 7: Effect of free radicals on lipid and protein oxidation 181
glutamic acid + glutamine (□), aspartic acid + asparagine (◇), lysine (�), proline (●), arginine (✕)
valine (□), alanine (◇), leucine (�), isoleucine (●)
Figure 7.14: Development of the amino acid concentration in the protein of the continuous phase (left side) and cream phase (right side) of a WPI (1.0 % protein) emulsion incubated at 50 ˚C
0
200
400
600
800
1000
1200
1400
0 2 4 6 8 10 12 14 16 18
Incubation Time (h)
Am
ino
acid
con
cent
ratio
n (m
icro
mol
/g o
f pro
tein
)
0
200
400
600
800
1000
1200
1400
0 2 4 6 8 10 12 14 16 18
Incubation Time (h)
Am
ino
acid
con
cent
ratio
n (m
icro
mol
/g o
f pro
tein
)
0
200
400
600
800
1000
1200
1400
0 2 4 6 8 10 12 14 16 18
Incubation Time (h)
Am
ino
acid
con
cent
ratio
n(m
icro
mol
/g o
f pro
tein
)
0
200
400
600
800
1000
1200
1400
0 2 4 6 8 10 12 14 16 18
Incubation Time (h)
Am
ino
acid
con
cent
ratio
n(m
icro
mol
/g o
f pro
tein
)

Chapter 7: Effect of free radicals on lipid and protein oxidation 182
serine (□), glycine (◇), methionine (�), threonine (●)
tyrosine (□), phenylalanine (◇), histidine (�), tryptophan (●)
Figure 7.15: Development of the amino acid concentration in the protein of the continuous phase (left side) and cream phase (right side) of a WPI (1.0 % protein) emulsion incubated at 50 ˚C
0
200
400
600
800
1000
1200
1400
0 2 4 6 8 10 12 14 16 18
Incubation Time (h)
Am
ino
acid
con
cent
ratio
n(m
icro
mol
/g o
f pro
tein
)
0
200
400
600
800
1000
1200
1400
0 2 4 6 8 10 12 14 16 18
Incubation Time (h)
Am
ino
acid
con
cent
ratio
n(m
icro
mol
/g o
f pro
tein
)
0
200
400
600
800
1000
1200
1400
0 2 4 6 8 10 12 14 16 18
Incubation Time (h)
Am
ino
acid
con
cent
ratio
n(m
icro
mol
/g o
f pro
tein
)
0
200
400
600
800
1000
1200
1400
0 2 4 6 8 10 12 14 16 18
Incubation Time (h)
Am
ino
acid
con
cent
ratio
n(m
icro
mol
/g o
f pro
tein
)

Chapter 7: Effect of free radicals on lipid and protein oxidation 183
Table 7.4: Decrease of amino acid and total sulfhydryl concentrations in the continuous phase protein in a WPI emulsion (1.0 % protein) incubated for 18 h (20 h for total sulfhydryls) at 50 ˚C
Amino acid or
total sulfhydryls
Concentration after 0 h
in the continuous phase protein
mean value, [1st/2nd replicate]
or ± SEM* (µmol/g protein)
Concentration after 18 h
(20 h) in the continuous phase
protein
mean value, [1st/2nd replicate]
or ± SEM* (µmol/g protein)
Decrease of the concentration
after 18 h (20 h) in the
continuous phase protein
(µmol/g protein)
Decrease of the concentration
after 18 h (20 h) in the
continuous phase protein
(%)
glutamic acid + glutamine 1258 [1256/1260] 1066 [1076/1057] 192
15
lysine 737 [737/737] 550 [556/544] 186 25 leucine 970 [970/969] 787 [794/781] 182 19 alanine 630 [629/631] 532 [547/518] 97 15
isoleucine 445 [445/446] 361 [361/360] 85 19 valine 480 [483/477] 398 [408/388] 82 17 proline 407 [404/409] 326 [310/341] 81 20
methionine 163 [163/163] 98 [101/94] 65 40 tyrosine 203 [202/204] 162 [163/162] 41 20
tryptophan 71 [71/-] 39 [39/-] 32 45 arginine 147 [145/149] 116 [121/111] 31 21
aspartic acid + asparagine 824 [822/825] 796 [809/784] 27
3
phenylalanine 219 [216/223] 194 [198/190] 25 12 threonine 396 [394/398] 377 [380/374] 19 5 histidine 137 [136/138] 154 [158/149] -16 -12 glycine 193 [192/194] 222 [231/213] -29 -15 serine 307 [306/307] 339 [354/324] -32 -10 total
sulfhydryls
43 ± 1
5 ± 1
38
88 * SEM = standard error of the mean value; four replicates

Chapter 7: Effect of free radicals on lipid and protein oxidation 184
Table 7.5: Decrease of amino acid and total sulfhydryl concentrations in the cream phase protein in a WPI emulsion (1.0 % protein) incubated for 18 h (20 h for total sulfhydryls) at 50 ˚C
Amino acid or
total sulfhydryls
Concentration after 0 h
in the cream phase protein
mean value, [1st/2nd replicate]
or ± SEM* (µmol/g protein)
Concentration after 18 h
(20 h) in the cream phase
protein
mean value, [1st/2nd replicate]
or ± SEM* (µmol/g protein)
Decrease of the concentration
after 18 h (20 h) in the cream phase
protein
(µmol/g protein)
Decrease of the concentration
after 18 h (20 h) in the cream phase
protein
(%)
lysine 769 [771/766] 506 [512/501] 262 34 aspartic acid +
asparagine 1015 [1027/1004] 780 [800/761] 235 23 leucine 960 [964/957] 807 [817/797] 154 16
isoleucine 461 [463/460] 347 [350/345] 114 25 threonine 385 [397/372] 291 [279/303] 94 24 tryptophan 149 [149/-] 62 [62/-] 87 58
glutamic acid + glutamine 1108 [1155/1060] 1031 [1051/1011] 76 7
valine 456 [465/446] 390 [399/381] 65 14 serine 311 [329/293] 246 [231/262] 65 21
tyrosine 203 [205/201] 142 [140/144] 61 30 phenylalanine 233 [234/231] 188 [191/184] 45 19 methionine 117 [117/117] 73 [85/62] 43 37
glycine 261 [266/255] 224 [228/219] 37 14 histidine 164 [161/168] 141 [145/136] 24 14 arginine 117 [115/118] 104 [111/96] 13 11 proline 319 [324/315] 322 [335/309] -3 -1 alanine 513 [523/504] 550 [557/542] -36 -7 total
sulfhydryls
14 ± 1
4 ± 1
10
72 * SEM = standard error of the mean value; four replicates
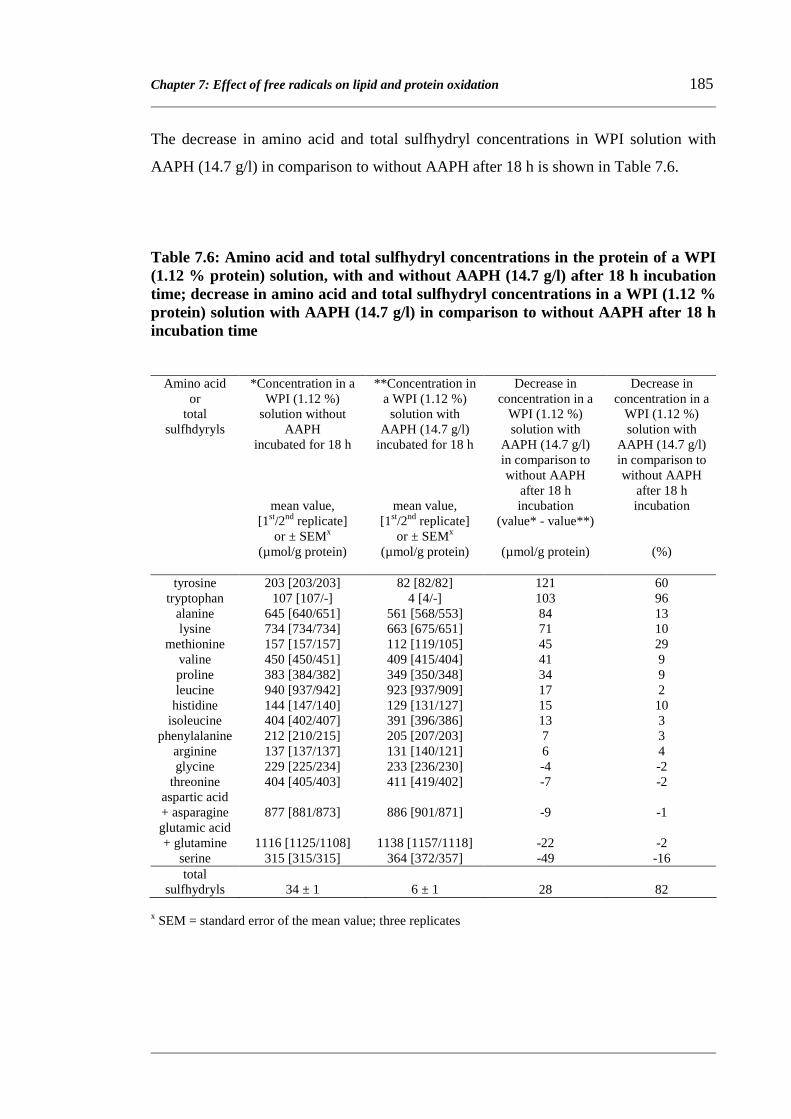
Chapter 7: Effect of free radicals on lipid and protein oxidation 185
The decrease in amino acid and total sulfhydryl concentrations in WPI solution with
AAPH (14.7 g/l) in comparison to without AAPH after 18 h is shown in Table 7.6.
Table 7.6: Amino acid and total sulfhydryl concentrations in the protein of a WPI (1.12 % protein) solution, with and without AAPH (14.7 g/l) after 18 h incubation time; decrease in amino acid and total sulfhydryl concentrations in a WPI (1.12 % protein) solution with AAPH (14.7 g/l) in comparison to without AAPH after 18 h incubation time
Amino acid or
total sulfhdyryls
*Concentration in a WPI (1.12 %)
solution without AAPH
incubated for 18 h
mean value, [1st/2nd replicate]
or ± SEMx
(µmol/g protein)
**Concentration in a WPI (1.12 %) solution with
AAPH (14.7 g/l) incubated for 18 h
mean value, [1st/2nd replicate]
or ± SEMx
(µmol/g protein)
Decrease in concentration in a
WPI (1.12 %) solution with
AAPH (14.7 g/l) in comparison to without AAPH
after 18 h incubation
(value* - value**)
(µmol/g protein)
Decrease in concentration in a
WPI (1.12 %) solution with
AAPH (14.7 g/l) in comparison to without AAPH
after 18 h incubation
(%)
tyrosine 203 [203/203] 82 [82/82] 121 60 tryptophan 107 [107/-] 4 [4/-] 103 96
alanine 645 [640/651] 561 [568/553] 84 13 lysine 734 [734/734] 663 [675/651] 71 10
methionine 157 [157/157] 112 [119/105] 45 29 valine 450 [450/451] 409 [415/404] 41 9 proline 383 [384/382] 349 [350/348] 34 9 leucine 940 [937/942] 923 [937/909] 17 2 histidine 144 [147/140] 129 [131/127] 15 10
isoleucine 404 [402/407] 391 [396/386] 13 3 phenylalanine 212 [210/215] 205 [207/203] 7 3
arginine 137 [137/137] 131 [140/121] 6 4 glycine 229 [225/234] 233 [236/230] -4 -2
threonine 404 [405/403] 411 [419/402] -7 -2 aspartic acid + asparagine 877 [881/873] 886 [901/871] -9 -1 glutamic acid + glutamine 1116 [1125/1108] 1138 [1157/1118] -22 -2
serine 315 [315/315] 364 [372/357] -49 -16 total
sulfhydryls
34 ± 1
6 ± 1 28 82 x SEM = standard error of the mean value; three replicates

Chapter 7: Effect of free radicals on lipid and protein oxidation 186
The strongest decreases in concentration were found for tyrosine (121 µmol/g protein),
tryptophan (103 µmol/g protein), alanine (84 µmol/g protein) and lysine (71 µmol/g
protein). The strongest decreases in percent were found for tryptophan (96 %), total
sulfhydryls (cysteine) (82 %) and tyrosine (60 %). A higher concentration of serine was
found in the WPI solution with AAPH. This was an unexpected result as AAPH is a
pro-oxidant and could hardly account for the protection of any amino acid. A
contamination with serine seems unlikely but may help to explain the finding. For
glutamic acid/glutamine also one notably higher value was measured in the protein
solution with AAPH, but it was within the variability of the method (± 5 % deviation of
the mean value) (Table 7.6).
7.3 General discussion
Oxygen was consumed much faster in emulsions than in protein solutions with the same
level of free radical generator (AAPH) (Figure 7.12 and Figure 7.2). The production of
protein hydroperoxides had not occurred to a significant extent in a WPI (1.0 % protein)
emulsion incubated for 4 h at 50 ˚C (Table 7.3). In contrast, the lipid hydroperoxide
concentration had increased by ten-fold of the initial concentration. The consumption of
oxygen in the emulsions appeared therefore not to be caused by the formation of protein
hydroperoxides, but primarily by the formation of lipid hydroperoxides. It may be stated
that milk proteins protected linoleic acid from oxidation and seemed themselves more
stable towards oxidative deterioration in terms of reaction with oxygen. In general, it is
acknowledged that protein radicals can form when proteins are in contact with oxidising
lipids. The protein acts as hydrogen donor to peroxyl or alkoxyl radicals by the creation
of a protein radical (Gardner 1979). An example of this reaction is depicted in Figure
7.16 (first reaction step), where a hydrogen atom is abstracted from an α-atom on the
peptide backbone.
Once a free radical has formed on a protein, the transfer of this radical from the initial
site of generation to another part of the protein can occur, where the radical is more
stable. This transfer of radicals can, for example, occur between the residues of
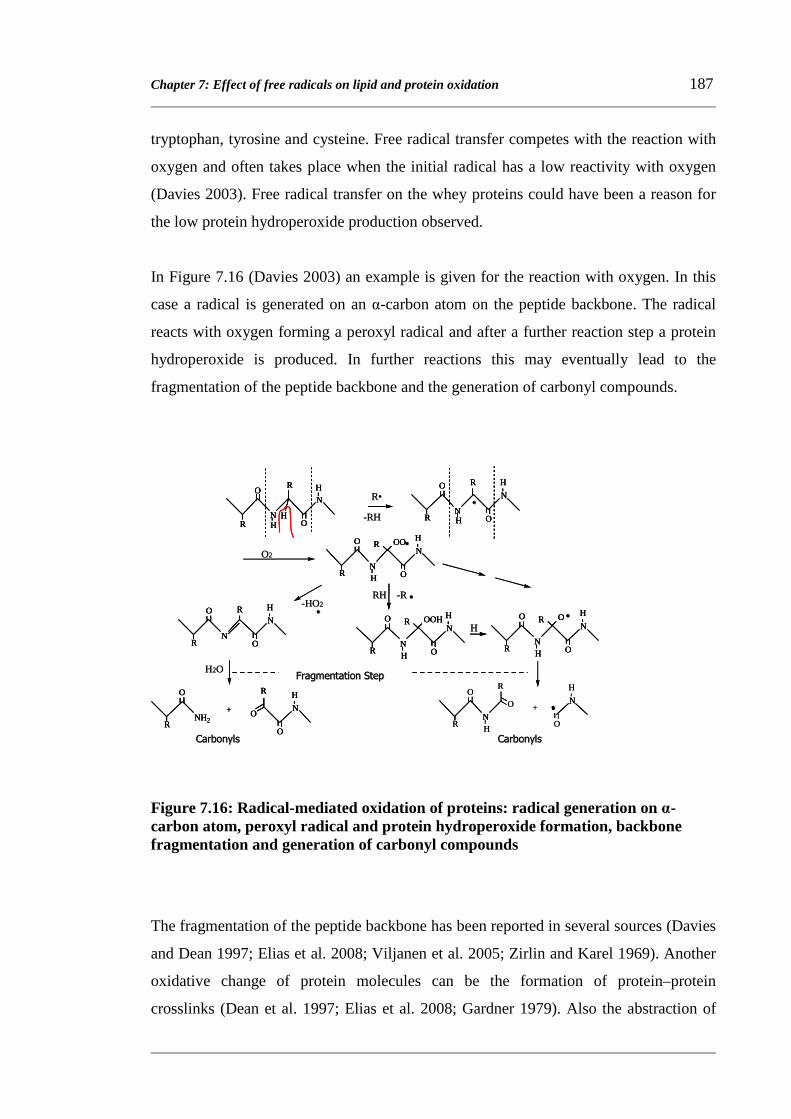
Chapter 7: Effect of free radicals on lipid and protein oxidation 187
tryptophan, tyrosine and cysteine. Free radical transfer competes with the reaction with
oxygen and often takes place when the initial radical has a low reactivity with oxygen
(Davies 2003). Free radical transfer on the whey proteins could have been a reason for
the low protein hydroperoxide production observed.
In Figure 7.16 (Davies 2003) an example is given for the reaction with oxygen. In this
case a radical is generated on an α-carbon atom on the peptide backbone. The radical
reacts with oxygen forming a peroxyl radical and after a further reaction step a protein
hydroperoxide is produced. In further reactions this may eventually lead to the
fragmentation of the peptide backbone and the generation of carbonyl compounds.
Figure 7.16: Radical-mediated oxidation of proteins: radical generation on α-carbon atom, peroxyl radical and protein hydroperoxide formation, backbone fragmentation and generation of carbonyl compounds
The fragmentation of the peptide backbone has been reported in several sources (Davies
and Dean 1997; Elias et al. 2008; Viljanen et al. 2005; Zirlin and Karel 1969). Another
oxidative change of protein molecules can be the formation of protein–protein
crosslinks (Dean et al. 1997; Elias et al. 2008; Gardner 1979). Also the abstraction of
••
CarbonylsCarbonyls CarbonylsCarbonyls
N
NN
N
H
O
RH
R
O
H O
R
R
O
H
N
NO
R O
HR OO
H
H
N
NO
R O
HR OOH
H
N
NO
R O
H
N
NO
R O
HR O
H
R
NH2
N
O
RO
H
+ O
R
N
NO
R O
H
H
R
O +
RR••
--RRHH
••
OO22••
--HOHO22RH RH --RR
••
HH
••
Fragmentation StepFragmentation StepHH22OO
••
CarbonylsCarbonyls CarbonylsCarbonyls
N
NN
N
H
O
RH
R
O
H O
R
R
O
H
N
NN
N
H
O
RH
R
O
H O
R
R
O
H
N
NO
R O
HR OO
H
H
N
NO
R O
HR OOH
H
N
NO
R O
H
N
NO
R O
HR O
H
R
NH2
N
O
RO
H
+ O
R
N
N
N
NO
R O
HR OO
H
H
N
NO
R O
HR OOH
H
N
NO
R O
H
N
NO
R O
HR O
H
R
NH2
N
O
RO
H
+ O
R
N
NO
R O
H
H
R
O +
RR••
--RRHH
••
OO22••
--HOHO22RH RH --RR
••
HH
••
Fragmentation StepFragmentation StepHH22OO

Chapter 7: Effect of free radicals on lipid and protein oxidation 188
N
R` R``
HH
H
O
NHH O O
R` R``
+
R, O2
N
R` R``
HH
O
O
••
••
••
amino acid side chains can occur (Figure 7.17), which can again lead to the
fragmentation of the peptide backbone (Davies 2003).
Figure 7.17: Abstraction of amino acid residues in protein oxidation
Another important aspect of protein oxidation is the damage of amino acid residues
(Elias et al. 2008; Gardner 1979). In general the oxidation pathways and products are
thought to be similar for free amino acids and amino acid residues on proteins or in
peptides (Davies and Dean 1997; Elias et al. 2008).
In this study, the concentration of most amino acids and total sulfhydryls decreased in a
WPI (1.0 % protein) emulsion over 18 h of incubation at 50 ˚C. For ten out of eighteen
amino acids (including total sulfhydryls), the decrease in concentration was greater in
the cream phase protein (Table 7.4 and Table 7.5).
Proteins in the cream phase, present on the interface, were close to the oil phase where
the concentration of lipid-derived radicals increased over time as lipid oxidation
proceeded. From that point of view, the potential for protein damage by free radical
reactions would be greater in the cream phase than in the continuous phase. On the other
hand, free radicals created in the continuous phase during the emulsification could
contribute to protein oxidation. The exchange of proteins between the interface and the
continuous phase could contribute to the fairly balanced damage on the protein of both
phases. Furthermore, it is possible that free radicals present in the interface or
continuous phase could change phases without exchange of the proteins themselves.
Chapter 7: Effect of free radicals on lipid and protein oxidation 189
Also secondary lipid oxidation products, produced over the 18 h incubation period, may
react with protein compounds, thereby contributing to the loss of amino acid residues.
In a study of Rampon et al. (2001), the formation of adducts between proteins and lipid
oxidation products occurred in bovine-serum-albumin-stabilised sunflower O/W
emulsions, indicated by an increase of fluorescence emission at 425 nm.
The greatest deteriorative effect towards amino acids was found for lysine, leucine,
glutamic acid + glutamine and aspartic acid + asparagine as part of whey proteins in a
WPI-stabilised emulsion. The concentration of these amino acids decreased the most.
The greatest loss in percent of the initially present amino acid concentration was found
for total sulfhydryls (representing cysteine), tryptophan and methionine, indicating that
these amino acids were probably most susceptible towards oxidation (Table 7.4 and
Table 7.5).
In the review of Elias et al. (2008) about the antioxidative activity of proteins and
peptides, the residues of the amino acids tryptophan, tyrosine, cysteine, methionine,
histidine and phenylalanine were pointed out as the most unstable ones towards
oxidation. Free radicals are often electrophilic and can easily abstract hydrogen atoms
from these side chains as they are nucleophilic (Davies 2003; Elias et al. 2008). These
amino acid residues are able to react with free radicals of low energy levels in contrast
to less reactive aliphatic amino acid residues (Davies and Dean 1997; Elias et al. 2008).
The concentration of sulfhydryl groups has been shown to decrease in various studies,
in which proteins had been exposed to unsaturated lipids in emulsions, e.g. free
sulfhydryls as part of a high molecular weight fraction of whey protein added to a
salmon oil/Tween 20 emulsion (Tong et al. 2000b) or free sulfhydryls as part of β-
lactoglobulin added to a menhaden oil/Brij 35 emulsion (Elias et al. 2005). Subsequent
oxidation products of cysteine can be cystine and oxy acids (Elias et al. 2008).
In a study of Rampon et al. (2001), tryptophan oxidation in sunflower O/W emulsions
stabilised with bovine serum albumin could be observed within one day of storage. The
oxidation was indicated by a decrease of tryptophan fluorescence. Besides Elias et al.
(2008), also Gardner (1979) counts tryptophan to the amino acids most susceptible to

Chapter 7: Effect of free radicals on lipid and protein oxidation 190
oxidation. N-formylkynurenine, kynurenine, 5-hydroxytryptophan and 7-
hydroxytryptophan are oxidation products of tryptophan (Elias et al. 2008).
The oxidative lability of methionine on a protein with a high methionine concentration
(glutamine synthetase) was investigated in an aqueous solution with hydrogen peroxide
(Levine et al. 1996). Surface-exposed methionine residues readily oxidised, whereas the
methionine residues buried within the protein structure remained unoxidised. The
surface-exposed methionine residues appeared to be arranged in a way that protected the
active site of the enzyme, suggesting they would fulfil an antioxidative function.
Besides Elias et al. (2008), also Gardner (1979) counts methionine to one of the most
labile amino acids towards oxidation. Methionine sulfoxide is a characteristic oxidation
product of methionine (Elias et al. 2008).
In the review of Gardner (1979), lysine is mentioned as one of the most sensitive amino
acids when exposed to oxidising lipids. The lysine side chain bears an amino group that
can take part in Schiff base reactions with aldehydes or can react with α,β-unsaturated
aldehydes by Michael addition. Adducts are formed in both cases. It has been reported
that β-lactoglobulin and also β-casein underwent such reactions (Leaver et al. 1999).
The concentration of lysine in bovine serum albumin was also found to decrease when
the protein was exposed to oxidising unsaturated lipids. The higher the degree of
unsaturation, the stronger was the decrease (Refsgaard et al. 2000). However, Refsgaard
et al. (2000) also pointed out that Schiff base and Michael addition products are not
stable under acidic conditions as applied when proteins are hydrolysed before the amino
acid analysis. Furthermore a similar loss of lysine was found when potentially present
Schiff bases were stabilised towards acidic hydrolysis. Therefore it is questionable to
what extent the formation of those products was responsible for the loss of lysine.
Although aldehydes and α,β-unsaturated aldehydes were probably generated as
secondary lipid oxidation products in the present experiment, the formation of Schiff
base and Michael addition products may not fully account for the loss of lysine in WPI.
Refsgaard et al. (2000) concluded that the capacity of bovine serum albumin to suppress
lipid oxidation was probably due to the reaction of lysine and amino acid residues in
general with alkoxyl radicals.

Chapter 7: Effect of free radicals on lipid and protein oxidation 191
The initial characteristic oxidative modification of leucine is due to the abstraction of
hydrogen from its aliphatic residue, as stated by Davies (2003). Further oxidation
products of leucine residues can be hydroperoxides, alcohols, α-ketoisocaproic acid,
isovaleric acid, isovaleraldehyde, isovaleraldehyde oxime and carbonyl compounds. An
explanation for the susceptibility of leucine could be its hydrophobicity. One might
expect that more hydrophobic amino acid residues were in contact with the oil phase.
Therefore they would be more exposed to lipid-derived radicals. On the other hand, the
other amino acid residues whose concentration decreased the most are very hydrophilic.
Also valine and isoleucine, which has more hydrophobic side chains than leucine
according to the hydropathy index of Kyte and Doolittle (1982), were more stable than
leucine. Therefore, the relevance of hydrophobicity for the stability of the amino acid
residues is questionable.
For glutamic acid only hydroperoxides and for aspartic acid, glutamine and asparagine
no specific side chain oxidation products have been mentioned (Davies 2003; Elias et
al. 2008). Glutamic and aspartic acid side chains exhibit the ability to chelate metal ions
(Arcan and Yemenicioglu 2007; Elias et al. 2008; Saiga et al. 2003). Therefore it
appears possible that they would be particularly prone to free radical attacks if
complexed ferrous and ferric ions were still redox active and able to take part in the
production of alkoxyl and peroxyl radicals on linoleic acid. These radicals would then
be created next to glutamic and aspartic acid side chains, causing deleterious effects. At
the same time this would exhibit an antioxidative mechanism of the protein towards the
emulsion lipid. Linoleic acid would receive a hydrogen atom from WPI and the radical
would be passed on to the protein. As lysyl residues were also reported to exhibit
chelating properties (Arcan and Yemenicioglu 2007; Saiga et al. 2003), the same
process might also contribute to the observed loss of lysine. It has also been reported
that lysine would undergo metal-catalysed oxidation, resulting in a carbonyl compound
(amino-adipicsemialdehyde) (Shacter 2008).
When WPI was exposed to free radicals from AAPH in aqueous solution, the following
amino acid residues were most labile: tyrosine, tryptophan, alanine and lysine. The
greatest loss in percent of the initially present amino acid concentration was found for
tryptophan, cysteine/total sulfhydryls and tyrosine (Table 7.6). In general the loss of

Chapter 7: Effect of free radicals on lipid and protein oxidation 192
amino acids was lesser in the protein of the aqueous solution with AAPH
(approximately 500 µmol/g protein) than in the protein of the respective emulsion phase
in the previously discussed system (approximately 1100 µmol/g in the continuous phase
and 1350 µmol/g in the cream phase).
In the following, an overview about oxidative modifications of the most susceptible
amino acid residues (according to Elias et al. (2008)) and an example for aliphatic side
chain oxidation is given in Figure 7.18 to Figure 7.22 (Davies 2003; Elias et al. 2008).
Figure 7.18: Oxidation of sulfur-containing amino acids
SO
HN
SO
HN
Methionine Methionine sulfoxide
O
HS
O
HN
S
O
HN
2 S
O
NH
- 2 H
Cysteine Cystine

Chapter 7: Effect of free radicals on lipid and protein oxidation 193
Figure 7.19: Side chain oxidation of aromatic amino acids: tryptophan
Figure 7.20: Side chain oxidation of histidine
NH
O
HN
Tryptophan
NH
O
HN
NH
O
HN
OH
OH
5-hydroxytryptophan
7-hydroxytryptophan
NN--formylkynurenineformylkynurenine KynurenineKynurenine
N
NH
O
HN
N
N
O
HNO
Histidine 2-oxo-histidine

Chapter 7: Effect of free radicals on lipid and protein oxidation 194
Figure 7.21: Side chain oxidation of aromatic amino acids: tyrosine and phenylalanine
Figure 7.22: Side chain oxidation of aliphatic amino acids: valine
ValineValine
O
NH
CH2OH
H3C
H
O
NH
CH3
H3C
HN
C 3
3C
O
H
H
H
HO
O
HN
O
HN
O
HN
OH
HO
Phenylalanineortho-Tyrosine
meta-Tyrosine
O
HNHO
O
HNHO
HO
O
HNHO
O
NHOH-H2O2 DOPA
Tyrosine 3,4-dihydroxyphenylalanine (DOPA)
di-Tyrosine
2 Tyrosine
Chapter 7: Effect of free radicals on lipid and protein oxidation 195
Most of the presumably labile amino acid residues were also amongst the most affected
ones in the present study. On the other hand the concentration of histidine and
phenylalanine residues did not greatly change, neither in the emulsion nor in the
aqueous system with AAPH, in spite of their mentioned susceptibility. Furthermore,
alanine was found to be one of the more affected amino acids when WPI was exposed to
radicals from AAPH, although alanine has an aliphatic residue and would therefore be
less susceptible to oxidation. The same was true for leucine in the emulsion system.
Alanine residues together with aspartic acid and asparagine residues had shown a lower
reaction constant k (k ≈ 107 – 108 l mol-1 s-1) in the reaction with hydroxyl radicals
compared with the residues of tryptophan, tyrsosine, histidine, methionine, cysteine,
phenylalanine and arginine (k ≈ 1010 l mol-1 s-1) (Davies 2003).
The decrease in concentration of certain amino acids also greatly depended on the
system or the phase within the system – continuous or cream phase of the emulsion.
Alanine was one of the more affected amino acids in the aqueous system with AAPH
and also in the continuous phase of the emulsion. In contrast, in the cream phase no
decrease in alanine concentration was found. For leucine only a minor loss was
observed in the system with AAPH, but a major loss in both phases of the emulsion. No
extraordinary loss in concentration was found for tyrosine in the emulsion compared
with other amino acids. In contrast, tyrosine was apparently more prone to oxidation in
the aqueous solution with AAPH as its concentration greatly decreased. Glutamic acid +
glutamine and aspartic acid + asparagine were apparently greatly affected by oxidation
in the emulsion system, but no change in concentration was found in the aqueous
solution with AAPH. Lysine was overall the amino acid with the greatest losses
throughout all investigated protein fractions (whey protein from aqueous solution with
AAPH and in the continuous and cream phases of the emulsion).
In a study of Hernandez-Ledesma et al. (2005), the ability of amino acids to scavenge
AAPH-derived radicals in aqueous solution (pH 7.4) was investigated. The scavenging
activity decreased in the following order (relative activity in brackets), showing the
greatest activity for tryptophan and tyrosine: tryptophan (4.65) > tyrosine (1.57) >
methionine (1.13) > cysteine (0.15) > histidine (0.07) > phenylalanine (0.003). Free
radicals derived from AAPH were also used in the present study, in aqueous solution

Chapter 7: Effect of free radicals on lipid and protein oxidation 196
with WPI (pH 6.0). The residues of tyrosine and tryptophan oxidised the most according
to the decrease in concentration. For aqueous systems with AAPH, the free-radical-
scavenging ability and the oxidative modification of tyrosine and tryptophan therefore
appear to be closely linked and also seem to be similar for the free amino acids and the
amino acid residues on WPI.
The conformation of the whey proteins that occupied the droplet interfaces after
homogenisation was different to the conformation of whey proteins in the continuous
phase or in aqueous solution before homogenisation. Different molecular regions were
therefore exposed to the environment. The environment and the types of free radicals in
it did also vary for the studied phases or systems. Whey proteins on the interface were
mostly exposed to free radicals derived from linoleic acid and in the outer region to free
radicals from the continuous phase. Proteins in the continuous phase were exposed to
the latter mentioned. Whey proteins in the aqueous solution with AAPH, were again
exposed to a different type of free radicals. Different free radical species also react
selectively with amino acid residues, whereas free radicals on a high energy level react
less selectively than those on a low energy level (Davies 2003). In a compilation of data
from several studies, the loss of certain amino acid residues varied considerably
depending on the protein type, when various proteins were exposed to the same
oxidising lipid at the same conditions (Gardner 1979).
For the present study and in general, the free-radical-mediated damage of amino acid
residues on proteins therefore appears to be influenced by the following factors:
susceptibility of amino acid residues to oxidation, exposure of amino acid residues to
the environment, free radical species in the environment (which can also be free radicals
on the protein itself or on other protein molecules (Davies 2003)), their reactivity and
concentration and the possibility of interaction between amino acid residues and free
radicals.
Chapter 8: Concluding discussion and recommendations 197
Chapter 8
Concluding discussion and recommendations
8.1 Concluding remarks
Proteins have been shown to exhibit antioxidative properties in many studies, including
studies on protein-stabilised O/W emulsions. In the present study, these antioxidative
effects were confirmed with WPI and NaCas. How the protein type and the protein
concentration influenced key parameters of lipid autoxidation (lipid hydroperoxides and
a secondary oxidation product, hexanal) over a wide protein concentration range was
demonstrated. Lipid oxidation was not inhibited to the same degree over the whole
protein concentration range.
In addition, physical characteristics such as the droplet size played a role in oxidative
stability. At a given protein concentration, the oxidative stability of emulsions was
greater with an average droplet size of 0.31 µm than with an average droplet size of
0.65 µm, because of the larger contact area between proteins and lipids at the smaller
average droplet size. The milk proteins were thus able to act more effectively as
antioxidants towards the emulsion lipids. The presence of proteins, as opposed to non-
protein surfactants, on droplet interfaces had previously been generally shown to result
in greater oxidative stability (Donnelly et al. 1998).
As well as the presence of proteins at the droplet surface and the contact area between
lipids and proteins, the conformation of the proteins at the interface may also be
important in suppressing lipid oxidation. In general, the protein conformation changes
in such a way that maximum contact between hydrophobic moieties and the oil phase is
achieved as the molecule adsorbs at the interface during the emulsification process
(Dalgleish 2004). It is possible that the specific emulsification conditions (e.g. the
homogenisation pressure, the temperature and the pH at the point of emulsification)
could also influence the conformation of the protein on the interface. Kiokias et al.

Chapter 8: Concluding discussion and recommendations 198
(2007) reported increased oxidative stability of WPC-stabilised sunflower O/W
emulsions made at high emulsification temperatures. This was attributed to a greater
degree of whey protein unfolding at higher temperatures, which resulted in better
contact between the emulsion lipids and the whey proteins on the interface. Thus, the
emulsification conditions may influence not only the total contact surface between
lipids and proteins through changes in the droplet size, but also the types of amino acid
residues that come into contact with the emulsion lipids.
The present study also showed that the nature of the continuous phase influenced lipid
oxidation after the droplet interfaces had been formed. The oxidative stability was
different depending on the protein type (WPI, NaCas or a mixture of WPI/NaCas) and
the protein concentration in the continuous phase. The concentrations of lipid
hydroperoxides and hexanal showed the same development over the continuous phase
protein concentration and the general protein concentration (details in Chapter 4). This
indicated the relevance of excess protein (the protein that is not located at the interface
after emulsification but remains in the continuous phase) for oxidative stability.
Furthermore, a decrease or an increase in the continuous phase protein concentration by
diluting emulsions with either RO water or protein solution promoted and inhibited lipid
oxidation respectively. Faraji et al. (2004) also observed lower lipid oxidation rates in
protein-stabilised emulsions (based on WPI, pH 7) at higher continuous phase protein
concentrations. Continuous phase protein also contributed to oxidative stability in some
studies with non-protein emulsifiers; however, in those systems, the interfacial
properties were different from those of protein-stabilised emulsions (Elias et al. 2005;
Elias et al. 2007; Tong et al. 2000a; Tong et al. 2000b).
In the present study, the oxidative stability notably increased when emulsions were
diluted with protein solutions of the other protein type, pointing to a synergistic
antioxidative effect of WPI and NaCas. The mechanisms for this synergistic effect are
still unclear, but interactions of whey proteins and caseins in the continuous phase, or
between continuous phase proteins and interfacial proteins, are likely to be involved. A
synergistic antioxidative effect may also have occurred in the study of Faraji et al.
(2004), when NaCas or soy protein isolate solution was present in the continuous phase
Chapter 8: Concluding discussion and recommendations 199
and WPI was on the interface (pH 7). For both, the oxidative stability was greater than
for pure WPI emulsions (WPI in the continuous phase and at the interface).
The present study showed that milk proteins on the interface as well as in the
continuous phase have the potential to influence the oxidative stability of milk-protein-
stabilised O/W emulsions.
In the present study, an enrichment of the emulsions with low molecular weight
compounds (molecular weight ≤ 12000−14000) of NaCas and WPI (although not
significantly in the case of WPI) increased their oxidative stability. The antioxidative
activity of casein and whey protein hydrolysates and peptides thereof has been
demonstrated in a number of studies (Diaz and Decker 2004; Diaz et al. 2003; Pena-
Ramos and Xiong 2001). Casein-derived peptides are naturally present in milk and are
produced during storage by enzymatic activity (e.g. by plasmin, but also by other
proteinases). Other low molecular weight compounds in milk have also been associated
with antioxidative activity (e.g. urate, organic acids etc.) and may be present in NaCas
and/or WPI (see also Chapter 5, Section 5.2).
In the present study, heat treatment at 84 ˚C led to whey protein denaturation (indicated
by β-lactoglobulin denaturation), to an increase in the free sulfhydryl concentration and
to a decrease in the total sulfhydryl concentration in WPI solutions or mixed solutions
of WPI plus NaCas (1:1). However, these effects of heating did not result in changes in
the lipid oxidation rates of the subsequently produced emulsions. The lipid oxidation
rates were also independent of the heating time of the solutions. Several studies have
reported the inhibition of lipid oxidation in O/W emulsion systems in which heat-treated
milk protein solutions had been incorporated; however, heat treatments have also had
pro-oxidative effects (Elias et al. 2007; Taylor and Richardson 1980b; Tong et al.
2000a). NaCas appeared to increase the physical stability of the emulsions and thus to
contribute also to their oxidative stability. As well as this effect, a general synergistic
antioxidative effect was observed when the emulsions were produced with mixed
solutions of WPI plus NaCas (1:1). Interactions of whey proteins and caseins in the
continuous phase, at the interface or between the interface and the continuous phase
may account for the increased oxidative stability of the emulsions.

Chapter 8: Concluding discussion and recommendations 200
Two major mechanisms inhibit lipid oxidation in general and lipid oxidation in O/W
emulsions in particular. One is free-radical-scavenging activity, in the sense that the
transfer of free radicals to lipids is inhibited or lipid-based radicals are transferred to
other molecules. The other is the prevention of reactions between pro-oxidative metal
ions and lipids. At a low concentration of lipid-based radicals, reactions between lipids
and oxygen are also limited, even if the oxygen concentration is not a limiting factor for
lipid oxidation. Therefore, in investigations of the pro- or antioxidative influence of any
factor, e.g. the droplet size, the protein type etc., in O/W emulsions, it makes sense to
evaluate it in the light of how it contributes to or antagonises these two antioxidative
mechanisms.
Whey proteins, caseins, hydrolysates and peptides thereof have shown free-radical-
scavenging activity in numerous studies. To the author’s knowledge, this present study
was the first to compare the free-radical-scavenging-activities of WPI and NaCas in
O/W emulsions, including protein-stabilised O/W emulsions. Both milk protein
fractions exhibited free-radical-scavenging activity in emulsions in which the free
radical generator AAPH was incorporated. The scavenging activity was greater at
higher protein concentrations and in NaCas-stabilised emulsions. This was shown by
reduced oxygen consumption and reduced lipid hydroperoxide formation. In protein
solutions with similar protein concentration and the same AAPH concentration, the
oxygen consumption rate was much lower and similar to that in solutions without
protein. This indicated low reactivity of the milk proteins with oxygen compared with
linoleic acid. A comparison of the formations of lipid hydroperoxides and protein
hydroperoxides in a WPI-stabilised emulsion supported the hypothesis. Free radicals,
derived from linoleic acid and AAPH, instead led to oxidative modifications of amino
acid residues (shown for WPI). In a study of Rival et al. (2001a), casein, various single
caseins and bovine serum albumin exhibited free-radical-scavenging activity (measured
by the uptake of oxygen) when they were added to a linoleic acid/Triton X-100
emulsion with AAPH. The oxygen uptake was also found to be linear over time. Whole
casein (relative antioxidative activity: 1.56) was found to be more antioxidative than
bovine serum albumin (relative antioxidative activity: 1.47). Other caseins had relative
antioxidative activities as follows: 1.37 (κ-casein) and 1.16 (β-casein).

Chapter 8: Concluding discussion and recommendations 201
For the present study, free radicals derived from hydrophilic AAPH were presumably
scavenged by high and low molecular weight compounds of the protein fractions
directly in the polar continuous phase. Also, AAPH-derived radicals must have entered
areas in which they could react with lipids (the oil phase and/or the interface) – in spite
of their hydrophilicity – because they accelerated lipid oxidation compared with
emulsions without AAPH. The radicals (two per AAPH molecule) had a molecular
weight of 85. Therefore, low molecular weight compounds of the milk protein fractions,
present in the continuous phase, may also have protruded into those areas and reacted
with various radical types of lipids and AAPH. This is a possible free-radical-
scavenging mechanism for emulsions without AAPH. In addition, proteins on the
interface would have scavenged both AAPH-derived radicals and lipid-derived radicals
(lipid radicals, alkoxyl radicals and peroxyl radicals).
Several factors appear to be relevant for an effective free-radical-scavenging process:
the protein concentration in general, the protein type as well as the concentration of low
molecular weight compounds with free-radical-scavenging activity that could enter into
the interface, the exposure of certain moieties and amino acid residues with free-radical-
scavenging activity (e.g. tyrosine, tryptophan, histidine or cysteine), changes in the
exposure of those groups during storage of the emulsion, the transfer of radicals to and
on proteinaceous materials of high and low molecular weight and a low reactivity of
those radicals with lipids. Protein hydrolysates and peptides may be good scavengers of
free radicals because of a high content of small and flexible molecules with free-radical-
scavenging activity. This may also have contributed to the particular antioxidative effect
of the low molecular weight fractions in the present study. Once radicals have formed,
they might be transferred easily to other molecules because of a high mobility of the
peptides. Davies (2003) mentioned the transfer of radicals on proteins to sites at which
they were less reactive and gave an example of amino acid residues (tyrosine,
tryptophan and cysteine) on which radical transfers have been found. Ostdal et al.
(1999) found stable and long-lived tyrosyl radicals in the interior of bovine serum
albumin, whereas radicals on free tyrosine were more reactive and short-lived.
It may be speculated if protein unfolding and increased exposure of some protein
moieties could be pro-oxidative under certain conditions the radical-bearing areas would

Chapter 8: Concluding discussion and recommendations 202
be exposed to the environment, thus enabling radical transfer to other molecules such as
lipids. Baron et al. (2005) mentioned the possibility that proteins may contribute to
oxidative damage of lipids, antioxidants or DNA under the influence of heat or light, or
in the presence of transition metals (Davies et al. 1995; Luxford et al. 2002; Morgan et
al. 2002).
Pro-oxidative metal ions from iron and copper are closely linked to the development of
lipid-based radicals.
The ability of milk proteins, milk protein hydrolysates or peptides and low molecular
weight compounds of milk proteins to chelate iron and copper ions has been
demonstrated in various studies. Milk proteins also naturally contain these metals. In the
present study, the treatment of WPI and NaCas solutions with EDTA resulted in greater
oxidative stability of the emulsions. Dialysis of protein solutions (molecular weight cut-
off 12000−14000) to which no EDTA was added resulted in decreased oxidative
stability of the emulsions. This was probably due to a loss of free-radical-scavenging
and metal ion chelation activities as a result of the removal of the low molecular weight
fractions. The oxidative instability could be balanced out by adding EDTA to the
protein solutions before dialysis. This showed that a relevant factor for lipid oxidation
in the emulsions was probably the presence of pro-oxidative metal ions in the high
molecular weight fractions (molecular weight ≥ 12000−14000) of WPI and NaCas.
These pro-oxidative metal ions were located in proximity to the emulsion lipids.
Nevertheless, both this study and other studies showed that the antioxidative properties
of the proteins prevailed.
The ability of iron and copper ions to promote lipid oxidation in O/W emulsions
depends on their availability to take part in reactions with lipid hydroperoxides. Free
metal ions in the interfacial region, in the lipid phase or in the continuous phase may be
the most likely candidates for those reactions. Metal ions that are bound to
proteinaceous material may also take part in the lipid oxidation process if they are redox
active. This may be the case if they are bound to an exposed molecular moiety and not
buried within the protein structure. Furthermore, conditions that lead to a release of
protein-bound metal ions are also likely to enhance lipid oxidation. The release of metal
Chapter 8: Concluding discussion and recommendations 203
ions probably depends on their location, e.g. if they are bound to buried or exposed
moieties and amino acid residues, and the pH, because H+/H3O+ ions compete for the
same binding sites as cations. Protein surfaces become more positively charged with
decreasing pH, as H+ binds to COO− and amino groups. Free cations are therefore more
likely to be repelled from proteinaceous material at low pH. Remondetto et al. (2004)
stated that a net positive charge causes more cation repulsion than attraction and that a
net negative charge causes more cation attraction than repulsion. The oxidative stability
of whey-protein-stabilised emulsions, below the isoelectric point of the whey proteins,
has been attributed to their net positive surface charge leading to the repulsion of metal
ions from the droplet surface into the continuous phase (Donnelly et al. 1998; Hu et al.
2003b). At pH values above the isoelectric point, proteins or low molecular weight
compounds, originating from the continuous phase, can be antioxidative through the
chelation and removal of pro-oxidative metal ions from the interface (and possibly from
the oil phase, as shown by Cho et al. (2003) for other chelators) as these are transferred
with the chelating molecules into the continuous phase away from susceptible lipids
(Tong et al. 2000b).
In the present study, high and low molecular weight compounds of the milk proteins,
present in the continuous phase, could have exhibited such an antioxidative mechanism,
because the pH was above their isoelectric points. Low hexanal concentrations were
observed at low protein concentrations in NaCas emulsions, whereas higher protein
concentrations were needed in WPI emulsions. The reason for this effect may have been
a stronger metal chelation ability of the caseins compared with the whey proteins,
resulting in a more efficient chelation process. In addition to the metal chelation
characteristics, e.g. carboxyl groups or amino groups, of proteins, caseins also possess
phosphoseryl groups. Villiere et al. (2005) suggested that the addition of NaCas solution
to protein-stabilised emulsions after emulsification may improve their oxidative
stability, because caseins could then remove detrimental metal ions away from the
interface into the continuous phase.
The access of chelators (such as EDTA or citrate in the present study) to the metal-
binding site on a protein and their relative metal binding ability compared with that site
will influence the possibility of metal removal. If a metal ion is released from the

Chapter 8: Concluding discussion and recommendations 204
protein (e.g. by binding to a chelator), its new location and its redox activity will
determine whether or not it has a pro-oxidative influence in the lipid oxidation process.
The interface appears to be a particularly crucial region in terms of chelation ability,
redox inactivation and the retention or release of pro-oxidative metal ions, because a
high concentration of lipid hydroperoxides is thought to prevail at the interface (Decker
et al. 2002; McClements and Decker 2000). The conformation of interfacial proteins
may influence the retention/release of bound pro-oxidative metal ions, their ability to
chelate free metal ions and their participation in redox reactions. Under some
conditions, unfolding of proteins may lead to a greater release of protein-bound metal
ions and thus oxidative destabilisation. Elias et al. (2005) pointed out that hydrolysis as
well as protein denaturation may increase the exposure of amino acid residues and thus
the potential for free radical scavenging, but that metal chelation abilities might also be
affected. In this way, different conformations of interfacial proteins, which were partly
determined during the emulsification process and which may change during storage,
could affect the oxidative stability of an emulsion.
Another relevant aspect for lipid oxidation in O/W emulsions is the emulsion lipid.
PUFAs have a tendency to oxidise easily because of a high degree of unsaturation.
Also, other factors are likely to play a role in the susceptibility to oxidation. Free fatty
acids, as used in the present study (approximately 60 % linoleic acid plus oleic acid and
linolenic acids), are partially deprotonised (pKa of linoleic acid = 7.9 (Belitz et al.
2004)) at neutral or slightly acidic pH and are therefore partly negatively charged,
whereas triacylglycerols have no ionic electrical charge. Free fatty acids oxidise faster
than their esters (Adachi et al. 1995; Miyashita and Takagi 1986), which could be partly
due to their negatively charged carboxyl groups. These can attract pro-oxidative cations.
Furthermore, the hydrophobicity of the lipid, the location of double bonds on the fatty
acid molecules and changes in their polarity during lipid oxidation (parts of molecules
with lipid hydroperoxides are more hydrophilic and can move to the interface) can
influence the oxidative stability of O/W emulsions (McClements and Decker 2000). The
oxidative stability of protein-stabilised emulsions could be partly influenced by these
factors, as they may play a role in the contact between lipids and proteins at the droplet

Chapter 8: Concluding discussion and recommendations 205
interface. Variations in that contact may change the characteristics of free radical
scavenging by the proteinaceous material when alkoxyl and peroxyl radicals are created
from lipid hydroperoxides.
The following picture (Figure 8.1) offers a concept of protein-stabilised O/W emulsion
systems on a molecular level with the depiction of the basic antioxidant processes,
metal ion chelation and free radical scavenging. A profile of the interfacial area (in the
middle) with the adjacent continuous phase (on the right) and oil phase (on the left) is
shown.
The proteins, present in the continuous phase and at the interface, have a net negative
surface charge as pH 6 (the pH used in the present study) is above their isoelectric point.
Oxygen (O2) is present in the continuous phase and in the oil phase. In the oil phase, the
reaction with lipid radicals can occur.
Pro-oxidative metal ions such as iron and copper are present in the continuous phase
and in the oil phase as free metal ions. Another proportion is bound to proteinaceous
material (proteins, peptides and amino acids) in the continuous phase and in the
interfacial area. Free metal ions are attracted to net negatively charged proteinaceous
material in the continuous phase and at the interface. Some proteinaceous LMW
compounds from the continuous phase may be able to enter areas on the inner side of
the interface. They may chelate metal ions there and at the interface in general and
transfer them into the continuous phase, thus inhibiting lipid oxidation.
The picture shows linoleic acid (protonated and deprotonated), linoleic-acid-based
radicals, including alkoxyl radicals and peroxyl radicals, and linoleic acid
hydroperoxides on the inner side of the interface. Due to the hydrophilicity of the
oxidised forms of linoleic acid, higher levels are present in this area compared with the
inner core of the oil phase. Metal ions which are also present in this area can potentially
react with lipid hydroperoxides and fuel the autoxidation process.

Chapter 8: Concluding discussion and recommendations 206
Other types of free radicals can be present in the continuous phase as they are created
during homogenisation. Lipid-based radicals can be scavenged by proteins permanently
present on the interface and potentially also by proteinaceous material which is only
temporarily in the interfacial area and dynamically exchanges with material from the
continuous phase. Proteinaceous material in the continuous phase can also scavenge
continuous-phase-born free radicals.
The suggested antioxidant mechanisms which include the idea that proteinaceous
material from the continuous phase is in dynamic exchange with material in the
interfacial area arises from several findings in the present study and other studies: the
continuous phase protein greatly influenced the oxidative stability of lipids inside the
droplets, LMW compounds of WPI and NaCas which presumably do not take part in the
formation of the interface influenced the oxidative stability, continuous phase protein
experienced almost as much damage (indicated by the loss of amino acids) as cream
phase protein permanently in contact with the emulsion lipids.

Chapter 8: Concluding discussion and recommendations 207
Cu2+
linoleic acid-C1OOH
HOOC1-linoleic acid-C13OOH
linoleic acid-C1OOH
linoleic acid-C1OO-
HOOC1-linoleic acid-C13OO •
linoleic acid-C1OOH
linoleic acid-C1OO-
HOOC1-linoleic acid-C13O•
HOOC1-linoleic acid-C13•
linoleic acid-C1-OO-
linoleic acid-C1OOH
HOOC13-linoleic acid-C1OOH
linoleic acid-C1OOH linoleic acid-C1OOH
•OC13-linoleic acid-C1OOH
linoleic acid-C1OOH
•OOC13-linoleic acid-C1OO-
linoleic acid-C1OOH
linoleic acid-C1OO-
linoleic acid-C1OOH
•C13-linoleic acid-C1OOH
Figure 8.1: Illustration of the emulsion phases in the present system on a molecular level, including the antioxidant mechanisms metal ion chelation and free radical scavenging by proteins; without secondary oxidation products
Fe3+
Fe3+
Fe3+
Fe3+
Fe2+
O2
O2
O2
O2
O2
O2
O2 O2
O2
Continuous phase with proteins
Oil phase
Interfacial area with linoleic acid and proteins
Fe2+
Fe2+ Cu1+
R•
R•
R•
R •
Fe3+
Fe3+
H
H
Fe2+
Fe2+
Fe3+
R•
R•
H

Chapter 8: Concluding discussion and recommendations 208
8.2 Recommendations for future work
• Milk protein products, used in the current study, are complex mixtures of various
proteins. For example, NaCas consists of four different caseins: αs1-, αs2-, β- and κ-
caseins. It would be of interest to understand more fully the role of individual
caseins or whey proteins in providing oxidative stability to O/W emulsions. On a
molecular level, more research to identify the peptide sequences that are directly in
contact with the oil phase is needed.
• In several studies, the heat treatment of milk protein solutions prior to emulsion
preparation led to greater oxidative stability of the emulsions, whereas, in other
studies, decreased oxidative stability was observed (see also Chapter 2, Section
2.7.3, and Chapter 6); no effect of heating − except in cases of physical instability −
was found in the present study. More research to elucidate under what
circumstances, and for which milk proteins, heating contributes to or antagonises
oxidative stability is required. Some of the results of such research may be of
interest for the food industry, as heat treatments of protein solutions, e.g.
pasteurisation, should be applied in a way that also contributes to the oxidative
stability of the subsequently produced emulsions. Future studies could also address
the question of to what extent the unfolding of the proteins (e.g. whey proteins), and
thus improved contact with emulsion lipids in the interfacial region, contributes to
improved oxidative stability. Furthermore, the existence of other antioxidative
mechanisms that are caused by heat treatment could be investigated, such as the
hypothesis that greater oxidative stability of emulsions may be a result of increased
rates of metal chelation and free-radical-scavenging reactions when the
emulsification is carried out at higher temperatures. For this purpose, solutions of
various temperatures, consisting of low molecular weight compounds of the milk
proteins (with chelation ability and free-radical-scavenging ability) plus non-protein
emulsifiers, could be used to produce emulsions. Thus, if antioxidative effects were
observed at higher heating temperatures, they could clearly be attributed to the low
molecular weight compounds and not to protein unfolding (as proteins would not be
present).

Chapter 8: Concluding discussion and recommendations 209
• Low molecular weight compounds appeared to be particularly effective antioxidants
in the present study. More research is needed to determine the composition of the
low molecular weight fractions of WPI and NaCas, as well as the antioxidative
functionality, or possibly partially pro-oxidative functionality, of the constituent
compounds. Furthermore, factors that influence the composition of these fractions
and that might possibly lead to a controlled improvement of their antioxidative
properties could be investigated.
• Enzymatic hydrolysates of WPI and NaCas have exhibited marked antioxidative
properties. Expertise that is already present in the dairy industry could be used to
produce mixtures of antioxidative milk protein peptides. Emulsions stabilised with
WPI or NaCas could also be fortified with such hydrolysates to improve their
oxidative stability.
• An antioxidative synergistic effect was found when WPI and NaCas were used
in combination. More details of the nature of this effect and optimum ratios for
maximum oxidative stability should be investigated. The experimental designs could
consider measurement of the oxidative stability of some of the following emulsions:
WPI only on the interface and caseins only in the continuous phase and vice versa,
combinations of the proteins at various ratios on the interface and WPI or NaCas
only in the continuous phase, and pure proteins on the interface and mixed proteins
at various ratios in the continuous phase. The results of such studies may also be of
interest for commercial food applications in which maximum protection of PUFAs
may be achieved by adjusting the WPI/NaCas ratios.
• Metal ions, contained in the high molecular weight fractions of WPI and NaCas,
appeared to be pro-oxidative in the present study, because their removal contributed
to greater oxidative stability of the emulsions. The chelation capacities of WPI and
NaCas and their natural contents of iron and copper, in terms of their influence on
oxidative stabilisation and destabilisation respectively, could be investigated further.
Although whey proteins and caseins have been shown to exhibit chelation capacity
in several studies, the actual redox inactivation of chelated iron and copper ions

Chapter 8: Concluding discussion and recommendations 210
needs further examination. Such studies should also include variations in the pH
value as it influences the retention of metal ions.
• Furthermore, the role of the location of the high molecular weight fractions of WPI
and NaCas, in which the natural metal content is still present or has been lowered by
EDTA treatment, in the oxidative stability of emulsions could be further elucidated.
A possible experimental design may include the following: preparation of emulsions
using the high molecular weight fraction of WPI or NaCas, which has been treated
with EDTA, and replacement of the continuous phase with WPI or NaCas solution
respectively, which has not been treated with EDTA (and vice versa). A logical
hypothesis would be that the respective high molecular weight fraction with the
original metal content would be more pro-oxidative if present on the interface and
would be less pro-oxidative if present in the continuous phase. Whether high
molecular weight fractions with lowered metal content, present in the continuous
phase, have chelation capacity for metal ions present in interfacial protein that
consists of the high molecular weight fractions with the original metal content could
also be investigated.
• Finally, further research is required to elucidate the transfer of material across the
interface in milk-protein-stabilised emulsions and how this is related to their
oxidative stability under different conditions (e.g. various oxygen and metal
concentrations in the continuous phase, interface and oil phase).

Appendix 211
Appendix
Appendix Chapter 4
Table 4A: Probability values from ANOVA for the difference in lipid oxidation of differently droplet sized NaCas emulsions (1.0 % protein) over the whole incubation time (droplet size*incubation time)
Lipid hydroperoxides Hexanal
Droplet Size*
Incubation Time
*Probability p Droplet Size*
Incubation Time
*Probability p
0.31 versa 0.43 0.436 0.31 versa 0.43 0.966
0.31 versa 0.59 0.000 0.31 versa 0.59 0.000
0.43 versa 0.59 0.000 0.43 versa 0.59 0.009
*Samples that were not significantly different (p > 0.05) are marked red.
Table 4B: Probability values from two sample t-tests for the difference in lipid oxidation between WPI and NaCas emulsions at certain protein concentrations
Droplet size (µm)
Protein concentration
(%)
Comparison WPI – NaCas *Probability p
Lipid hydroperoxides after 4 h
Hexanal after 24 h
0.5 0.401 0.063
1.0 0.000 0.461 2.0 0.138 0.618
0.3 3.0 0.033 0.614 4.0 0.016 0.003 7.0 0.000 0.764 10.0 0.021 0.008
0.5 0.113 0.024 1.0 0.009 0.105 2.0 0.008 0.000
0.6 3.0 0.013 0.237 4.0 0.000 0.000 7.0 0.002 0.001 10.0 0.014 0.009
*Samples that were not significantly different (p > 0.05) are marked red.
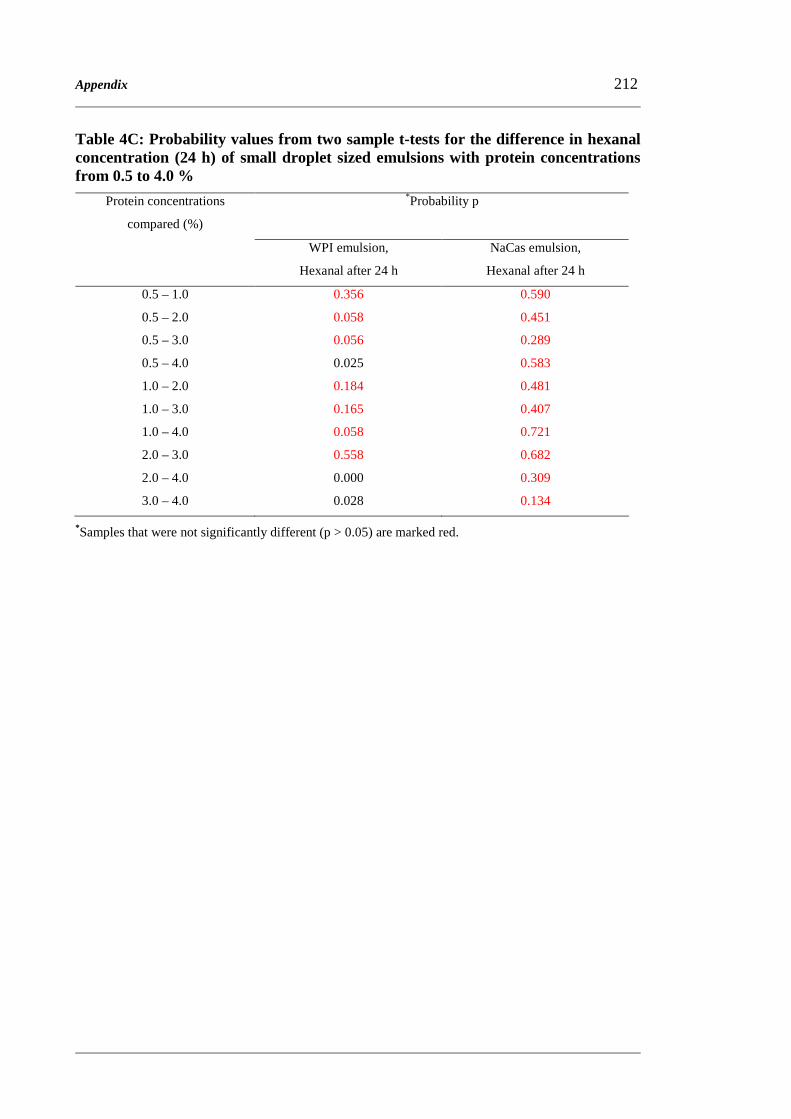
Appendix 212
Table 4C: Probability values from two sample t-tests for the difference in hexanal concentration (24 h) of small droplet sized emulsions with protein concentrations from 0.5 to 4.0 %
Protein concentrations
compared (%)
*Probability p
WPI emulsion,
Hexanal after 24 h
NaCas emulsion,
Hexanal after 24 h
0.5 – 1.0 0.356 0.590
0.5 – 2.0 0.058 0.451
0.5 – 3.0 0.056 0.289
0.5 – 4.0 0.025 0.583
1.0 – 2.0 0.184 0.481
1.0 – 3.0 0.165 0.407
1.0 – 4.0 0.058 0.721
2.0 – 3.0 0.558 0.682
2.0 – 4.0 0.000 0.309
3.0 – 4.0 0.028 0.134
*Samples that were not significantly different (p > 0.05) are marked red.

Appendix 213
Table 4D: Probability values from two sample t-tests for the difference in lipid oxidation for emulsions (4.0 % protein) where the continuous phase was replaced with protein solution (4.48 % protein) or RO water
** Probability p *Samples compared
Lipid hydroperoxides after 4 h Hexanal after 24 h
(WPI control) – (WPI + RO water) 0.000 0.000
(WPI control) – (WPI + WPI) 0.000 0.089
(WPI + ROwater) – (WPI + WPI) 0.000 0.000
(NaCas control) – (NaCas + RO water) 0.003 0.001
(NaCas control) – (NaCas + NaCas) 0.001 0.012
(NaCas + RO water) – (NaCas + NaCas) 0.000 0.041
* WPI control = WPI emulsion; WPI + RO water = WPI emulsion, continuous phase replaced with RO water; WPI + WPI = WPI emulsion, continuous phase replaced with WPI solution; NaCas control = NaCas emulsion; NaCas + RO water = NaCas emulsion, continuous phase replaced with RO water; NaCas + NaCas = NaCas emulsion, continuous phase replaced with NaCas solution. ** Samples that were not significantly different (p > 0.05) are marked red.
Table 4E: Probability values from two sample t-tests for the difference in lipid oxidation of emulsions with varying concentrations of continuous phase protein (comparisons within one protein type)
*Probability p Comparison of emulsions with various
continuous phase protein concentration
Lipid hydroperoxides after 4 h
Hexanal after 24 h
WPI 0 % - WPI 0.5 % 0.005 0.002
WPI 0 % - WPI 2.0 % 0.000 0.002
WPI 0 % - WPI 4.0 % 0.000 0.002
WPI 0.5 % - WPI 2.0 % 0.000 0.008
WPI 0.5 % - WPI 4.0 % 0.001 0.001
WPI 2.0 % - WPI 4.0 % 0.004 0.007
NaCas 0 % - NaCas 0.5 % 0.039 0.047
NaCas 0 % - NaCas 2.0 % 0.000 0.155
NaCas 0 % - NaCas 4.0 % 0.000 0.838
NaCas 0.5 % - NaCas 2.0 % 0.003 0.555
NaCas 0.5 % - NaCas 4.0 % 0.002 0.059
NaCas 2.0 % - NaCas 4.0 % 0.004 0.158
*Samples that were not significantly different (p > 0.05) are marked red.

Appendix 214
Table 4F: Probability values from two sample t-tests for the difference in lipid oxidation of emulsions with the same concentration of continuous phase protein and of different protein type
*Probability p Comparison of emulsions with various
continuous phase protein concentration Lipid hydroperoxides after 4 h Hexanal after 24 h
WPI 0 % - NaCas 0 % 0.000 0.004
WPI 0.5 % - NaCas 0.5 % 0.008 0.008
WPI 2.0 % - NaCas 2.0 % 0.002 0.032
WPI 4.0 % - NaCas 4.0 % 0.000 0.001
*Samples that were not significantly different (p > 0.05) are marked red.

Appendix 215
Table 4G: Probability values from two sample t-tests for the difference in lipid oxidation of emulsions that were not diluted or diluted with protein solution or RO water
** Probability p *Samples compared (1 – 8)
Lipid hydroperoxides after 4 h Hexanal after 24 h
1 – 2 0.009 0.489 1 – 3 0.034 0.014 1 – 4 0.006 0.005 1 – 5 0.055 0.150 1 – 6 0.004 0.162 1 – 7 0.048 0.159 1 – 8 0.017 0.001 2 – 3 0.001 0.022 2 – 4 0.000 0.009 2 – 5 0.022 0.106 2 – 6 0.003 0.114 2 – 7 0.000 0.158 2 – 8 0.000 0.009 3 – 4 0.000 0.002 3 – 5 0.011 0.060 3 – 6 0.000 0.007 3 – 7 0.110 0.004 3 – 8 0.008 0.004 4 – 5 0.004 0.014 4 – 6 0.000 0.001 4 – 7 0.000 0.001 4 – 8 0.001 0.806 5 – 6 0.007 0.648 5 – 7 0.014 0.578 5 – 8 0.008 0.016 6 – 7 0.000 0.877 6 – 8 0.000 0.001 7 – 8 0.005 0.001
* 1 = WPI emulsion; 2 = WPI emulsion + RO water; 3 = WPI emulsion + WPI solution; 4 = WPI emulsion + NaCas solution; 5 = NaCas emulsion; 6 = NaCas emulsion + RO water; 7 = NaCas emulsion + NaCas solution; 8 = NaCas emulsion + WPI solution. ** Samples that were not significantly different (p > 0.05) are marked red.

Appendix 216
Appendix Chapter 5
Table 5A: Probability values from two sample t-tests for the difference in lipid oxidation of emulsions with varying protein type and dialysis application to protein solutions used to prepare the emulsions at certain chelator levels
*Probability p
Lipid hydroperoxides
after 4 h
Hexanal
after 24 h
Sample types compared
Chelator concentration
WPI dialysed - WPI not-dialysed 0.066 0.000 NaCas dialysed - NaCas not-dialysed 0.003 0.015 WPI dialysed - NaCas dialysed 0.695 0.942 Control WPI not-dialysed - NaCas not-dialysed 0.018 0.003 no chelator WPI dialysed - NaCas not-dialysed 0.017 0.000 NaCas dialysed - WPI not-dialysed 0.014 0.007 WPI dialysed - WPI not-dialysed 0.263 0.095 NaCas dialysed - NaCas not-dialysed 0.003 0.007 WPI dialysed - NaCas dialysed 0.085 0.013 Citrate WPI not-dialysed - NaCas not-dialysed 0.001 0.000 low WPI dialysed - NaCas not-dialysed 0.004 0.009 NaCas dialysed - WPI not-dialysed 0.253 0.013 WPI dialysed - WPI not-dialysed 0.000 0.002 NaCas dialysed - NaCas not-dialysed 0.011 0.085 WPI dialysed - NaCas dialysed 0.001 0.001 Citrate WPI not-dialysed - NaCas not-dialysed 0.000 0.967 high WPI dialysed - NaCas not-dialysed 0.000 0.003 NaCas dialysed - WPI not-dialysed 0.074 0.149 WPI dialysed - WPI not-dialysed 0.000 0.035 NaCas dialysed - NaCas not-dialysed 0.025 0.075 WPI dialysed - NaCas dialysed 0.096 0.114 EDTA WPI not-dialysed - NaCas not-dialysed 0.000 0.379 low WPI dialysed - NaCas not-dialysed 0.003 0.017 NaCas dialysed - WPI not-dialysed 0.012 0.074 WPI dialysed - WPI not-dialysed 0.365 0.971 NaCas dialysed - NaCas not-dialysed 0.275 0.893 WPI dialysed - NaCas dialysed 0.534 0.748 EDTA WPI not-dialysed - NaCas not-dialysed 0.034 0.670 high WPI dialysed - NaCas not-dialysed 0.001 0.798 NaCas dialysed - WPI not-dialysed 0.650 0.649
*Samples that were not significantly different (p > 0.05) are marked red.

Appendix 217
Table 5B: Probability values from two sample t-tests for the difference in lipid oxidation of emulsions with different chelator treatments
*Probability p
Lipid hydroperoxides
after 4 h
Hexanal
after 24 h
Chelator levels compared
Protein type and
application of dialysis to protein solution
Control - Citrate low 0.335 0.003 Control - Citrate high 0.001 0.000 Control - EDTA low 0.000 0.000 Control - EDTA high 0.000 0.000 Citrate low - Citrate high 0.015 0.000 WPI, not-dialysed Citrate low - EDTA low 0.001 0.000 Citrate low - EDTA high 0.001 0.000 Citrate high - EDTA low 0.000 0.075 Citrate high - EDTA high 0.000 0.040 EDTA low - EDTA high 0.080 0.361 Control - Citrate low 0.155 0.000 Control - Citrate high 0.087 0.000 Control - EDTA low 0.004 0.000 Control - EDTA high 0.002 0.000 Citrate low - Citrate high 0.750 0.496 WPI, dialysed Citrate low - EDTA low 0.006 0.022 Citrate low - EDTA high 0.003 0.003 Citrate high - EDTA low 0.000 0.024 Citrate high - EDTA high 0.000 0.001 EDTA low - EDTA high 0.001 0.016 Control - Citrate low 0.000 0.000 Control - Citrate high 0.000 0.000 Control - EDTA low 0.000 0.000 Control - EDTA high 0.000 0.000 Citrate low - Citrate high 0.082 0.109 NaCas, not-dialysed Citrate low - EDTA low 0.182 0.045 Citrate low - EDTA high 0.000 0.003 Citrate high - EDTA low 0.104 0.069 Citrate high - EDTA high 0.053 0.003 EDTA low - EDTA high 0.000 0.852 Control - Citrate low 0.004 0.022 Control - Citrate high 0.003 0.002 Control - EDTA low 0.001 0.011 Control - EDTA high 0.001 0.002 Citrate low - Citrate high 0.140 0.001 NaCas, dialysed Citrate low - EDTA low 0.003 0.155 Citrate low - EDTA high 0.002 0.005 Citrate high - EDTA low 0.020 0.080 Citrate high - EDTA high 0.002 0.478 EDTA low - EDTA high 0.033 0.072
*Samples that were not significantly different (p > 0.05) are marked red.
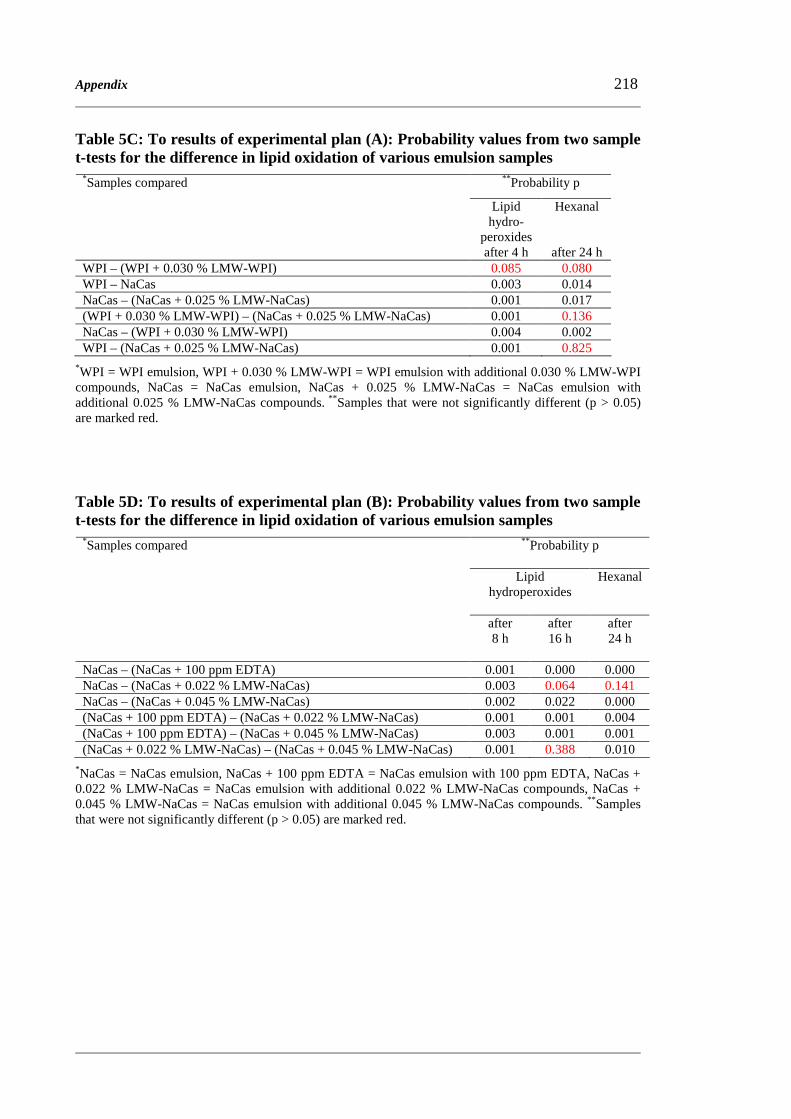
Appendix 218
Table 5C: To results of experimental plan (A): Probability values from two sample t-tests for the difference in lipid oxidation of various emulsion samples
** Probability p *Samples compared
Lipid hydro-
peroxides after 4 h
Hexanal
after 24 h WPI – (WPI + 0.030 % LMW-WPI) 0.085 0.080 WPI – NaCas 0.003 0.014 NaCas – (NaCas + 0.025 % LMW-NaCas) 0.001 0.017 (WPI + 0.030 % LMW-WPI) – (NaCas + 0.025 % LMW-NaCas) 0.001 0.136 NaCas – (WPI + 0.030 % LMW-WPI) 0.004 0.002 WPI – (NaCas + 0.025 % LMW-NaCas) 0.001 0.825
*WPI = WPI emulsion, WPI + 0.030 % LMW-WPI = WPI emulsion with additional 0.030 % LMW-WPI compounds, NaCas = NaCas emulsion, NaCas + 0.025 % LMW-NaCas = NaCas emulsion with additional 0.025 % LMW-NaCas compounds. ** Samples that were not significantly different (p > 0.05) are marked red.
Table 5D: To results of experimental plan (B): Probability values from two sample t-tests for the difference in lipid oxidation of various emulsion samples
** Probability p
Lipid hydroperoxides
Hexanal
*Samples compared
after 8 h
after 16 h
after 24 h
NaCas – (NaCas + 100 ppm EDTA) 0.001 0.000 0.000 NaCas – (NaCas + 0.022 % LMW-NaCas) 0.003 0.064 0.141 NaCas – (NaCas + 0.045 % LMW-NaCas) 0.002 0.022 0.000 (NaCas + 100 ppm EDTA) – (NaCas + 0.022 % LMW-NaCas) 0.001 0.001 0.004 (NaCas + 100 ppm EDTA) – (NaCas + 0.045 % LMW-NaCas) 0.003 0.001 0.001 (NaCas + 0.022 % LMW-NaCas) – (NaCas + 0.045 % LMW-NaCas) 0.001 0.388 0.010
*NaCas = NaCas emulsion, NaCas + 100 ppm EDTA = NaCas emulsion with 100 ppm EDTA, NaCas + 0.022 % LMW-NaCas = NaCas emulsion with additional 0.022 % LMW-NaCas compounds, NaCas + 0.045 % LMW-NaCas = NaCas emulsion with additional 0.045 % LMW-NaCas compounds. ** Samples that were not significantly different (p > 0.05) are marked red.
References 219
References
Ackman, R. G. (2004). The ocean supplies more EPA and DHA than we can use. OCL -
Oleagineux, Corps Gras, Lipides, 11(2), 112-115.
Adachi, S., Ishiguro, T., and Matsuno, R. (1995). Autoxidation kinetics for fatty acids
and their esters. Journal of the American Oil Chemists Society, 72(5), 547-551.
Adler-Nissen, J. (1979). Determination of the degree of hydrolysis of food protein
hydrolysates by trinitrobenzenesulfonic acid. Journal of Agricultural and Food
Chemistry, 27(6), 1256-1262.
Agboola, S. O., Singh, H., Munro, P. A., Dalgleish, D. G., and Singh, A. M. (1998).
Stability of emulsions formed using whey protein hydrolysate: effects of lecithin
addition and retorting. Journal of Agricultural and Food Chemistry, 46(5),
1814-1819.
Ahn, D. U., and Kim, S. M. (1998). Prooxidant effects of ferrous iron, hemoglobin, and
ferritin in oil emulsion and cooked-meat homogenates are different from those in
raw-meat homogenates. Poultry Science, 77(2), 348-355.
Allen, J. C., and Wrieden, W. L. (1982). Influence of milk proteins on lipid oxidation in
aqueous emulsion. 1. Casein, whey protein and α-lactalbumin. Journal of Dairy
Research, 49(2), 239-248.
Anema, S. G. (2007). Role of κ-casein in the association of denatured whey proteins
with casein micelles in heated reconstituted skim milk. Journal of Agricultural
and Food Chemistry, 55(9), 3635-3642.
Anema, S. G., and McKenna, A. B. (1996). Reaction kinetics of thermal denaturation of
whey proteins in heated reconstituted whole milk. Journal of Agricultural and
Food Chemistry, 44(2), 422-428.
AOAC. (2005a). AOAC official method 968.06, protein (crude) in animal feed. Official
Methods of Analysis of AOAC International, 18th Edition, W. Horwitz, and G.
W. Latimer, eds., AOAC International, Gaithersburg, MD, Chapter 4, p. 25.
AOAC. (2005b). AOAC official method 988.15, tryptophan in foods and food and feed
ingredients. Official Methods of Analysis of AOAC International, 18th Edition,
W. Horwitz, and G. W. Latimer, eds., AOAC International, Gaithersburg, MD,
Chapter 45, p. 83.

References 220
AOAC. (2005c). AOAC official method 991.20, nitrogen (total) in milk. Official
Methods of Analysis of AOAC International, 18th Edition, W. Horwitz, and G.
W. Latimer, eds., AOAC International, Gaithersburg, MD, Chapter 33, p. 10.
AOAC. (2005d). AOAC official method 994.12, amino acids in feeds. Official Methods
of Analysis of AOAC International, 18th Edition, W. Horwitz, and G. W.
Latimer, eds., AOAC International, Gaithersburg, MD, Chapter 4, p. 8.
Arcan, I., and Yemenicioglu, A. (2007). Antioxidant activity of protein extracts from
heat-treated or thermally processed chickpeas and white beans. Food Chemistry,
103(2), 301-312.
Bachran, K., and Bernhard, R. A. (1980). Interaction of iron(II) with lactose. Journal of
Agricultural and Food Chemistry, 28(3), 536-540.
Baron, C. P., Berner, L., Skibsted, L. H., and Refsgaard, H. H. F. (2005). Evaluation of
activity of selected antioxidants on proteins in solution and in emulsions. Free
Radical Research, 39(7), 777-785.
Baumy, J. J., and Brule, G. (1988). Effect of pH and ionic strength on the binding of
bivalent cations to β-casein. Lait, 68(4), 409-417.
Bayram, T., Pekmez, M., Arda, N., and Yalcin, A. S. (2008). Antioxidant activity of
whey protein fractions isolated by gel exclusion chromatography and protease
treatment. Talanta, 75(3), 705-709.
Belitz, H. D., Grosch, W., and Schieberle, P. (2004). Lipids. Food Chemistry, 3rd
revised edition, Springer, NY, pp. 157-244.
Beltran, G., Aguilera, M. P., and Gordon, M. H. (2005). Solid phase microextraction of
volatile oxidation compounds in oil-in-water emulsions. Food Chemistry, 92(3),
401-406.
Benjelloun, B., Talou, T., Delmas, M., and Gaset, A. (1991). Oxidation of rapeseed oil -
effect of metal traces. Journal of the American Oil Chemists Society, 68(3), 210-
211.
Bennett, T., Desmond, A., Harrington, M., McDonagh, D., FitzGerald, R., Flynn, A.,
and Cashman, K. D. (2000). The effect of high intakes of casein and casein
phosphopeptide on calcium absorption in the rat. British Journal of Nutrition,
83(6), 673-680.
References 221
Berge, J. P., and Barnathan, G. (2005). Fatty acids from lipids of marine organisms:
molecular biodiversity, roles as biomarkers, biologically active compounds, and
economical aspects. Marine Biotechnology I, Y. Le Gal, and R. Ulber, Eds.,
Springer, NY, pp. 49-125.
Bhattacharyya, J., and Das, K. P. (1999). Molecular chaperone-like properties of an
unfolded protein, αs-casein. Journal of Biological Chemistry, 274(22), 15505-
15509.
Bouhallab, S., Leonil, J., and Maubois, J. L. (1991). Study of β-casein phosphopeptide
(1-25)-iron complex: action of alcalase and acid-phosphatase. Lait, 71(4), 435-
443.
Brisson, G., Britten, M., and Pouliot, Y. (2007). Heat-induced aggregation of bovine
lactoferrin at neutral pH: effect of iron saturation. International Dairy Journal,
17(6), 617-624.
http://www.caymanchem.com/app/template/Product.vm/catalog/82235/promo/searchres
ult.82235/a/z (2008). 82235 AAPH. Cayman Chemical Company, Ann Arbor,
MI, USA.
Cervato, G., Cazzola, R., and Cestaro, B. (1999). Studies on the antioxidant activity of
milk caseins. International Journal of Food Sciences and Nutrition, 50(4), 291-
296.
Chan, K. M., and Decker, E. A. (1994). Endogenous skeletal muscle antioxidants.
Critical Reviews in Food Science and Nutrition, 34(4), 403-426.
Chanamai, R., and McClements, D. J. (2002). Comparison of gum arabic, modified
starch, and whey protein isolate as emulsifiers: influence of pH, CaCl2 and
temperature. Journal of Food Science, 67(1), 120-125.
Chandan, R. (1997). Production and specifications of milk concentrates. Dairy-based
Ingredients, Eagan Press Handbook Series, Eagan Press, St. Paul, MN, pp. 23-
39.
Chaud, M. V., Izumi, C., Nahaal, Z., Shuhama, T., Bianchi, M. D. P., and de Freitas, O.
(2002). Iron derivatives from casein hydrolysates as a potential source in the
treatment of iron deficiency. Journal of Agricultural and Food Chemistry, 50(4),
871-877.

References 222
Chen, H. M., Muramoto, K., Yamauchi, F., Fujimoto, K., and Nokihara, K. (1998).
Antioxidative properties of histidine-containing peptides designed from peptide
fragments found in the digests of a soybean protein. Journal of Agricultural and
Food Chemistry, 46(1), 49-53.
Chen, J. S., Dickinson, E., and Edwards, M. (1999). Rheology of acid-induced sodium
caseinate stabilized emulsion gels. Journal of Texture Studies, 30(4), 377-396.
Chin, S. C. K., and Kitts, D. D. (2004). Antioxidant characterization of
caseinophosphopeptides from bovine milk. Nutraceutical Beverages: Chemistry,
Nutrition, and Health Effects, F. Shahidi, and D. K. Weerasinghe, eds., ACS
Symposium Series, 871, pp. 279-289.
Chiue, H., Kusano, T., and Iwami, K. (1997). Deamidation-induced fragmentation of
maize zein, and its linked reduction in fatty acid-binding capacity as well as
antioxidative effect. Food Chemistry, 58(1-2), 111-117.
Cho, Y. J., Alamed, J., McClements, D. J., and Decker, E. A. (2003). Ability of
chelators to alter the physical location and prooxidant activity of iron in oil-in-
water emulsions. Journal of Food Science, 68(6), 1952-1957.
Clark, L. C., Wolf, R., Granger, D., and Taylor, Z. (1953). Continuous recording of
blood oxygen tensions by polarography. Journal of Applied Physiology, 6(3),
189-193.
Colbert, L. B., and Decker, E. A. (1991). Antioxidant activity of an ultrafiltration
permeate from acid whey. Journal of Food Science, 56(5), 1248-1250.
Coupland, J. N., Zhu, Z., Wan, H., McClements, D. J., Nawar, W. W., and Chinachoti,
P. (1996). Droplet composition affects the rate of oxidation of emulsified ethyl
linoleate. Journal of the American Oil Chemists Society, 73(6), 795-801.
Cunnane, S. C. (2003). Problems with essential fatty acids: time for a new paradigm?
Progress in Lipid Research, 42(6), 544-568.
Dalgleish, D. G. (2004). Food emulsions: their structures and properties. Food
Emulsions, S. E. Friberg, K. Larsson, and J. Sjoeblom, Eds., Marcel Dekker,
NY, pp. 1-44.
Dalgleish, D. G. (1997). Adsorption of protein and the stability of emulsions. Trends in
Food Science & Technology, 8(1), 1-6.

References 223
Dalgleish, D. G., Srinivasan, M., and Singh, H. (1995). Surface properties of oil-in-
water emulsion droplets containing casein and Tween 60. Journal of
Agricultural and Food Chemistry, 43(9), 2351-2355.
Dalgleish, D. G. (1993). The sizes and conformations of the proteins in adsorbed layers
of individual caseins on latices and in oil-in-water emulsions. Colloids and
Surfaces B-Biointerfaces, 1(1), 1-8.
Davies, M. J. (2003). Protein oxidation: concepts, mechanisms and new insights.
http://www.healthcare.uiowa.edu/research/sfrbm/Papers/Sunrise%20Papers/20
03/Davies%202003.ppt#22. The Heart Research Institute, Sydney, Australia.
Davies, M. J., and Dean, R. T. (1997). Radical-Mediated Protein Oxidation: From
Chemistry to Medicine, Oxford University Press, Oxford.
Davies, M. J., Fu, S. L., and Dean, R. T. (1995). Protein hydroperoxides can give rise to
reactive free radicals. Biochemical Journal, 305(Part 2), 643-649.
Dean, R. T., Fu, S. L., Stocker, R., and Davies, M. J. (1997). Biochemistry and
pathology of radical-mediated protein oxidation. Biochemical Journal, 324(Part
1), 1-18.
Dean, R. T., Hunt, J. V., Grant, A. J., Yamamoto, Y., and Niki, E. (1991). Free radical
damage to proteins: the influence of the relative localization of radical
generation, antioxidants, and target proteins. Free Radical Biology and
Medicine, 11(2), 161-168.
Decker, E. A., McClements, D. J., Chaiyasit, W., Nuchi, C. D., Silvestre, M. P. C.,
Mancuso, J. R., Tong, L. M., and Mei, L. Y. (2002). Factors influencing free
radical generation in food emulsions. Free Radicals in Food: Chemistry,
Nutrition and Health Effects, M. J. Morello, F. Shahidi, C-T Ho, Eds., ACS
Symposium Series 807, American Chemical Society, Washington, DC, pp. 83-
97.
Decker, E. A., Ivanov, V., Zhu, B. Z., and Frei, B. (2001). Inhibition of low-density
lipoprotein oxidation by carnosine and histidine. Journal of Agricultural and
Food Chemistry, 49(1), 511-516.
Delcourt, C. (2007). Application of nutrigenomics in eye health. Nutrigenomics -
Opportunities in Asia, E. S. Tai, and P. J. Gillies, eds., Karger, NY, pp. 168-175.
References 224
Diaz, M., and Decker, E. A. (2004). Antioxidant mechanisms of
caseinophosphopeptides and casein hydrolysates and their application in ground
beef. Journal of Agricultural and Food Chemistry, 52(26), 8208-8213.
Diaz, M., Dunn, C. M., McClements, D. J., and Decker, E. A. (2003). Use of
caseinophosphopeptides as natural antioxidants in oil-in-water emulsions.
Journal of Agricultural and Food Chemistry, 51(8), 2365-2370.
Dickinson, E. (1992). An Introduction to Food Colloids, Oxford University Press,
Oxford.
Dickinson, E., and Stainsby, G. (1982). Colloids in Food, Applied Science Publishers,
London.
Djordjevic, D., McClements, D. J., and Decker, E. A. (2004). Oxidative stability of
whey protein-stabilized oil-in-water emulsions at pH 3: potential omega-3 fatty
acid delivery systems (part B). Journal of Food Science, 69(5), C356-C362.
Donnelly, J. L., Decker, E. A., and McClements, D. J. (1998). Iron-catalyzed oxidation
of menhaden oil as affected by emulsifiers. Journal of Food Science, 63(6), 997-
1000.
Doucet, D., Otter, D. E., Gauthier, S. F., and Foegeding, E. A. (2003). Enzyme-induced
gelation of extensively hydrolyzed whey proteins by alcalase: peptide
identification and determination of enzyme specificity. Journal of Agricultural
and Food Chemistry, 51(21), 6300-6308.
Elias, R. J., Kellerby, S. S., and Decker, E. A. (2008). Antioxidant activity of proteins
and peptides. Critical Reviews in Food Science and Nutrition, 48(5), 430-441.
Elias, R. J., McClements, D. J., and Decker, E. A. (2007). Impact of thermal processing
on the antioxidant mechanisms of continuous phase β-lactoglobulin in oil-in-
water emulsions. Food Chemistry, 104(4), 1402-1409.
Elias, R. J., Bridgewater, J. D., Vachet, R. W., Waraho, T., McClements, D. J., and
Decker, E. A. (2006). Antioxidant mechanisms of enzymatic hydrolysates of β-
lactoglobulin in food lipid dispersions. Journal of Agricultural and Food
Chemistry, 54(25), 9565-9572.
Elias, R. J., McClements, D. J., and Decker, E. A. (2005). Antioxidant activity of
cysteine, tryptophan, and methionine residues in continuous phase β-
lactoglobulin in oil-in-water emulsions. Journal of Agricultural and Food
Chemistry, 53(26), 10248-10253.

References 225
Emery, T. (1992). Iron oxidation by casein. Biochemical and Biophysical Research
Communications, 182(3), 1047-1052.
Fang, Y., and Dalgleish, D. G. (1993). Dimensions of the adsorbed layers in oil-in-
water emulsions stabilized by caseins. Journal of Colloid and Interface Science,
156(2), 329-334.
Faraji, H., McClements, D. J., and Decker, E. A. (2004). Role of continuous phase
protein on the oxidative stability of fish oil-in-water emulsions. Journal of
Agricultural and Food Chemistry, 52(14), 4558-4564.
FDA, U. (2007). Paragraph 172.135, Disodium EDTA. Code of Federal Regulations,
Food and Drug Administration, U.S. Department of Health and Human Services,
Silver Spring, MD.
Feng, M., VanderDoes, L., and Bantjes, A. (1995). Preparation of apolactoferrin with a
very low iron saturation. Journal of Dairy Science, 78(11), 2352-2357.
Ferguson, J. D. (2008). Milk components.
http://cahpwww.vet.upenn.edu/dairy/mc.index.htm. University of Pennsylvania,
PA, USA.
Fox, P. F. (2003). The major constituents of milk. Dairy Processing: Improving
Quality, G. Smit, ed., Woodhead Publishing Limited, Cambridge, pp. 5-41.
Fox, P. F., and McSweeney, P. L. H. (1998a). Milk proteins. Dairy Chemistry and
Biochemistry, Blackie Academic & Professional, London, pp. 146-238.
Fox, P. F., and McSweeney, P. L. H. (1998b). Heat-induced changes in milk. Dairy
Chemistry and Biochemistry, Blackie Academic & Professional, London, pp.
347-378.
Fox, P. F., and McSweeney, P. L. H. (1998c). Physical properties of milk. Dairy
Chemistry and Biochemistry, Blackie Academic & Professional, London, pp.
437-461.
Frankel, E. N., Satue-Gracia, T., Meyer, A. S., and German, J. B. (2002). Oxidative
stability of fish and algae oils containing long-chain polyunsaturated fatty acids
in bulk and in oil-in-water emulsions. Journal of Agricultural and Food
Chemistry, 50(7), 2094-2099.
Frankel, E. N. (1998a). Hydroperoxide formation, Lipid Oxidation, The Oily Press,
Dundee, Scotland, pp. 23-41.

References 226
Frankel, E. N. (1998b). Hydroperoxide decomposition, Lipid Oxidation, The Oily Press,
Dundee, Scotland, pp. 55-77.
Frankel, E. N. (1998c). Methods to determine extent of oxidation. Lipid Oxidation, The
Oily Press, Dundee, Scotland, pp. 79-98.
Frankel, E. N. (1993). In search of better methods to evaluate natural antioxidants and
oxidative stability in food lipids. Trends in Food Science & Technology, 4(7),
220-225.
Gallaher, J. J., Hollender, R., Peterson, D. G., Roberts, R. F., and Coupland, J. N.
(2005). Effect of composition and antioxidants on the oxidative stability of fluid
milk supplemented with an algae oil emulsion. International Dairy Journal,
15(4), 333-341.
Gardner, H. W. (1979). Lipid hydroperoxide reactivity with proteins and amino acids: a
review. Journal of Agricultural and Food Chemistry, 27(2), 220-229.
Gaucheron, F., LeGraet, Y., Boyaval, E., and Piot, M. (1997a). Binding of cations to
casein molecules: importance of physicochemical conditions. Milchwissenschaft
- Milk Science International, 52(6), 322-327.
Gaucheron, F., LeGraet, Y., Raulot, K., and Piot, M. (1997b). Physicochemical
characterization of iron-supplemented skim milk. International Dairy Journal,
7(2-3), 141-148.
Gaucheron, F., Famelart, M. H., and LeGraet, Y. (1996). Iron-supplemented caseins:
preparation, physicochemical characterization and stability. Journal of Dairy
Research, 63(2), 233-243.
Gaucheron, F., Molle, D., Leonil, J., and Maubois, J. L. (1995). Selective determination
of phosphopeptide β-cn(1-25) in a β-casein digest by adding iron:
characterization by liquid-chromatography with online electrospray ionization
mass spectrometric detection. Journal of Chromatography B - Biomedical
Applications, 664(1), 193-200.
Gay, C., Collins, J., and Gebicki, J. M. (1999). Hydroperoxide assay with the ferric–
xylenol orange complex. Analytical Biochemistry, 273(2), 149-155.
Genot, C., Meynier, A., and Riaublanc, A. (2003). Lipid oxidation in emulsions. Lipid
Oxidation Pathways, A. Kamal-Edin, ed., AOCS Press, Champaign, IL, pp. 190-
244.
References 227
Gieseg, S., Duggan, S., and Gebicki, J. M. (2000). Peroxidation of proteins before lipids
in U937 cells exposed to peroxyl radicals. Biochemical Journal, 350, 215-218.
Gohtani, S., Sirendi, M., Yamamoto, N., Kajikawa, K., and Yamano, Y. (1999). Effect
of droplet size on oxidation of docosahexaenoic acid in emulsion system.
Journal of Dispersion Science and Technology, 20(5), 1319-1325.
Gordon, M. H. (2001). The development of oxidative rancidity in foods. Antioxidants in
Food: Practical Applications, J. Pokorny, N. Yanlieva, and M. H. Gordon, eds.,
Woodhead Publishing Limited, Cambridge, p. 7-21.
Graf, E., Mahoney, J. R., Bryant, R. G., and Eaton, J. W. (1984). Iron-catalyzed
hydroxyl radical formation. Stringent requirement for free iron coordination site.
Journal of Biological Chemistry, 259(6), 3620-3624.
Guingamp, M. F., Humbert, G., and Linden, G. (1993). Determination of sulfhydryl
groups in milk using Ellman procedure and clarifying reagent®. Journal of Dairy
Science, 76(8), 2152-2155.
Hamm, D. L., Hammond, E. G., and Hotchkis.Dk. (1968). Effect of temperature on rate
of autoxidation of milk fat. Journal of Dairy Science, 51(4), 483-491.
Harris, W. S. (2007). International recommendations for consumption of long-chain
omega-3 fatty acids. Journal of Cardiovascular Medicine, 8(Supplement 1),
S50-S52.
Havea, P., Singh, H., Creamer, L. K., and Campanella, O. H. (1998). Electrophoretic
characterization of the protein products formed during heat treatment of whey
protein concentrate solutions. Journal of Dairy Research, 65(1), 79-91.
Hawkins, C. L., and Davies, M. J. (2001). Generation and propagation of radical
reactions on proteins. Biochimica Et Biophysica Acta - Bioenergetics, 1504(2-3),
196-219.
Hegenauer, J., Saltman, P., Ludwig, D., Ripley, L., and Bajo, P. (1979a). Effects of
supplemental iron and copper on lipid oxidation in milk. 1. Comparison of
metal-complexes in emulsified and homogenized milk. Journal of Agricultural
and Food Chemistry, 27(4), 860-867.
Hegenauer, J., Saltman, P., Ludwig, D., Ripley, L., and Ley, A. (1979b). Iron-
supplemented cow milk. Identification and spectral properties of iron bound to
casein micelles. Journal of Agricultural and Food Chemistry, 27(6), 1294-1301.

References 228
Hegenauer, J., Saltman, P., and Nace, G. (1979c). Iron(III)-phosphoprotein chelates:
stoichiometric equilibrium constant for interaction of iron(III) and
phosphorylserine residues of phosvitin and casein. Biochemistry, 18(18), 3865-
3879.
Hekmat, S., and McMahon, D. J. (1998). Distribution of iron between caseins and whey
proteins in acidified milk. Food Science and Technology - Lebensmittel-
Wissenschaft & Technologie, 31(7-8), 632-638.
Hernandez-Ledesma, B., Davalos, A., Bartolome, B., and Amigo, L. (2005).
Preparation of antioxidant enzymatic hydrolysates from α-lactalbumin and β-
lactoglobulin. Identification of active peptides by HPLC-MS/MS. Journal of
Agricultural and Food Chemistry, 53(3), 588-593.
Hirai, Y., Permyakov, E. A., and Berliner, L. J. (1992). Proteolytic digestion of α-
lactalbumin: physiological implications. Journal of Protein Chemistry, 11(1),
51-57.
http://www.foodsci.uoguelph.ca/dairyedu/chem.html (2008). Dairy chemistry and
physics. Department of Food Science, University of Guelph, Guelph, Canada.
Hu, M., McClements, D. J., and Decker, E. A. (2004). Impact of chelators on the
oxidative stability of whey protein isolate-stabilized oil-in-water emulsions
containing omega-3 fatty acids. Food Chemistry, 88(1), 57-62.
Hu, M., McClements, D. J., and Decker, E. A. (2003a). Impact of whey protein
emulsifiers on the oxidative stability of salmon oil-in-water emulsions. Journal
of Agricultural and Food Chemistry, 51(5), 1435-1439.
Hu, M., McClements, D. J., and Decker, E. A. (2003b). Lipid oxidation in corn oil-in-
water emulsions stabilized by casein, whey protein isolate, and soy protein
isolate. Journal of Agricultural and Food Chemistry, 51(6), 1696-1700.
Huang, S. W., Satue-Gracia, M. T., Frankel, E. N., and German, J. B. (1999). Effect of
lactoferrin on oxidative stability of corn oil emulsions and liposomes. Journal of
Agricultural and Food Chemistry, 47(4), 1356-1361.
Huang, X. L. L., Catignani, G. L., and Swaisgood, H. E. (1996). Improved emulsifying
properties of β-barrel domain peptides obtained by membrane-fractionation of a
limited tryptic hydrolysate of β-lactoglobulin. Journal of Agricultural and Food
Chemistry, 44(11), 3437-3443.

References 229
Hunt, J. A., and Dalgleish, D. G. (1994). Adsorption behavior of whey protein isolate
and caseinate in soya oil-in-water emulsions. Food Hydrocolloids, 8(2), 175-
187.
Imai, H., Maeda, T., Shima, M., and Adachi, S. (2008). Oxidation of methyl linoleate in
oil-in-water micro- and nanoemulsion systems. Journal of the American Oil
Chemists Society, 85(9), 809-815.
IUPAC. (1987). Method 2.504. Determination of the p-anisidine value (p-A.V.). IUPAC
Standard Methods for the Analysis of Oils, Fats and Derivatives, 7th Edition, C.
Paquot, and A. Hautfenne, Eds., Blackwell Scientific Publications, Oxford.
Jacobsen, C., Let, M. B., Andersen, G., and Meyer, A. S. (2006). Oxidative stability of
fish oil enriched yoghurts. Seafood Research from Fish to Dish: Quality, Safety
and Processing of Wild and Farmed Seafood, J. B. Luten, C. Jacobsen, K.
Bakaert, A. Saebø, and J. Oehlenschläger, Eds., Wageningen Academic
Publishers, Wageningen.
Jacobsen, C., Hartvigsen, K., Thomsen, M. K., Hansen, L. F., Lund, P., Skibsted, L. H.,
Holmer, G., Adler-Nissen, J., and Meyer, A. S. (2001). Lipid oxidation in fish
oil enriched mayonnaise: calcium disodium ethylenediaminetetraacetate, but not
gallic acid, strongly inhibited oxidative deterioration. Journal of Agricultural
and Food Chemistry, 49(2), 1009-1019.
Jacobsen, C., Hartvigsen, K., Lund, P., Thomsen, M. K., Skibsted, L. H., Adler-Nissen,
J., Holmer, G., and Meyer, A. S. (2000). Oxidation in fish oil-enriched
mayonnaise 3. Assessment of the influence of the emulsion structure on
oxidation by discriminant partial least squares regression analysis. European
Food Research and Technology, 211(2), 86-98.
Jacobsen, C., Hartvigsen, K., Lund, P., Meyer, A. S., Adler-Nissen, J., Holstborg, J.,
and Holmer, G. (1999). Oxidation in fish-oil-enriched mayonnaise 1.
Assessment of propyl gallate as an antioxidant by discriminant partial least
squares regression analysis. European Food Research and Technology, 210(1),
13-30.
Je, J. Y., Park, P. J., and Kim, S. K. (2005). Antioxidant activity of a peptide isolated
from Alaska pollack (Theragra chalcogramma) frame protein hydrolysate. Food
Research International, 38(1), 45-50.

References 230
Jonsdottir, R., Bragadottir, M., and Arnarson, G. O. (2005). Oxidatively derived volatile
compounds in microencapsulated fish oil monitored by solid-phase
microextraction (SPME). Journal of Food Science, 70(7), C433-C440.
Ju, Z. Y., and Kilara, A. (1998). Gelation of pH-aggregated whey protein isolate
solution induced by heat, protease, calcium salt, and acidulant. Journal of
Agricultural and Food Chemistry, 46(5), 1830-1835.
Kamal-Edin, A., Mäkinen M., and Lampi, A-M (2003). The challenging contribution of
hydroperoxides to the lipid oxidation mechanism. Lipid Oxidation Pathways, A.
Kamal-Edin, ed., AOCS Press, Champain, IL, pp. 1-36.
Katz, S., Shinaberry, R. G., Heck, E. L., and Squire, W. (1980). Structure–volume
relationships: singular volume effects produced by cupric ion–globular protein
interaction. Biochemistry, 19(16), 3805-3813.
Ke, P. J., and Ackman, R. G. (1973). Bunsen coefficient for oxygen in marine oils at
various temperatures determined by an exponential dilution method with a
polarographic oxygen electrode. Journal of the American Oil Chemists Society,
50(11), 429-435.
Kellerby, S. S., Gu, Y. S., McClements, D. J., and Decker, E. A. (2006). Lipid oxidation
in a menhaden oil-in-water emulsion stabilized by sodium caseinate cross-linked
with transglutaminase. Journal of Agricultural and Food Chemistry, 54(26),
10222-10227.
Kim, G. N., Jang, H. D., and Kim, C. I. (2007a). Antioxidant capacity of
caseinophosphopeptides prepared from sodium caseinate using alcalase. Food
Chemistry, 104(4), 1359-1365.
Kim, S. B., Seo, I. S., Khan, M. A., Ki, K. S., Nam, M. S., and Kim, H. S. (2007b).
Separation of iron-binding protein from whey through enzymatic hydrolysis.
International Dairy Journal, 17(6), 625-631.
Kiokias, S., Dimakou, C., and Oreopoulou, V. (2007). Effect of heat treatment and
droplet size on the oxidative stability of whey protein emulsions. Food
Chemistry, 105(1), 94-100.
Kiokias, S., and Bot, A. (2006). Temperature cycling stability of pre-heated acidified
whey protein-stabilised o/w emulsion gels in relation to the internal surface area
of the emulsion. Food Hydrocolloids, 20(2-3), 245-252.
References 231
Kiokias, S. N., Dimakou, C. P., Tsaprouni, I. V., and Oreopoulou, V. (2006). Effect of
compositional factors against the thermal oxidative deterioration of novel food
emulsions. Food Biophysics, 1(3), 115-123.
Kitts, D. D. (2005). Antioxidant properties of casein-phosphopeptides. Trends in Food
Science & Technology, 16(12), 549-554.
Kritchevsky, D. (2002). Fats and oils in human health. Food Lipids - Chemistry,
Nutrition, and Biotechnology, 2nd edition, C. C. Akoh, and D. B. Min, Eds.,
Marcel Dekker, NY, pp. 543-558.
Kyte, J., and Doolittle, R. F. (1982). A simple method for displaying the hydropathic
character of a protein. Journal of Molecular Biology, 157(1), 105-132.
Lagarde, M. (2008). Docosahexaenoic acid: nutrient and precursor of bioactive lipids.
European Journal of Lipid Science and Technology, 110(8), 673-678.
Leaver, J., Law, A. J. R., and Brechany, E. Y. (1999). Covalent modification of
emulsified β-casein resulting from lipid peroxidation. Journal of Colloid and
Interface Science, 210(1), 207-214.
Lee, H., Kizito, S. A., Weese, S. J., Craig-Schmidt, M. C., Lee, Y., Wei, C. I., and An,
H. (2003). Analysis of headspace volatile and oxidized volatile compounds in
DHA-enriched fish oil on accelerated oxidative storage. Journal of Food
Science, 68(7), 2169-2177.
Leonil, J., Molle, D., Gaucheron, F., Arpino, P., Guenot, P., and Maubois, J. L. (1995).
Analysis of major bovine milk proteins by online high-performance liquid
chromatography and electrospray ionization mass spectrometry. Lait, 75(3),
193-210.
Let, M. B., Jacobsen, C., and Meyer, A. S. (2007a). Lipid oxidation in milk, yoghurt,
and salad dressing enriched with neat fish oil or pre-emulsified fish oil. Journal
of Agricultural and Food Chemistry, 55(19), 7802-7809.
Let, M. B., Jacobsen, C., Sorensen, A. D. M., and Meyer, A. S. (2007b).
Homogenization conditions affect the oxidative stability of fish oil enriched
milk emulsions: lipid oxidation. Journal of Agricultural and Food Chemistry,
55(5), 1773-1780.
Lethuaut, L., Metro, F., and Genot, C. (2002). Effect of droplet size on lipid oxidation
rates of oil-in-water emulsions stabilized by protein. Journal of the American
Oil Chemists Society, 79(5), 425-430.

References 232
Levine, R. L., Mosoni, L., Berlett, B. S., and Stadtman, E. R. (1996). Methionine
residues as endogenous antioxidants in proteins. Proceedings of the National
Academy of Sciences of the United States of America, 93(26), 15036-15040.
Liu, H. C., Chen, W. L., and Mao, S. J. T. (2007). Antioxidant nature of bovine milk β-
lactoglobulin. Journal of Dairy Science, 90(2), 547-555.
Liu, Y. W., Han, C. H., Lee, M. H., Hsu, F. L., and Hou, W. C. (2003). Patatin, the
tuber storage protein of potato (Solanum tuberosum L.), exhibits antioxidant
activity in vitro. Journal of Agricultural and Food Chemistry, 51(15), 4389-
4393.
Luxford, C., Dean, R. T., and Davies, M. J. (2002). Induction of DNA damage by
oxidised amino acids and proteins. Biogerontology, 3(1-2), 95-102.
Mackie, A. R., Mingins, J., and North, A. N. (1991). Characterization of adsorbed
layers of a disordered coil protein on polystyrene latex. Journal of the Chemical
Society - Faraday Transactions, 87(18), 3043-3049.
Mancuso, J. R., McClements, D. J., and Decker, E. A. (1999a). Ability of iron to
promote surfactant peroxide decomposition and oxidize α-tocopherol. Journal of
Agricultural and Food Chemistry, 47(10), 4146-4149.
Mancuso, J. R., McClements, D. J., and Decker, E. A. (1999b). The effects of surfactant
type, pH, and chelators on the oxidation of salmon oil-in-water emulsions.
Journal of Agricultural and Food Chemistry, 47(10), 4112-4116.
Manson, W., and Cannon, J. (1978). Reaction of αs1 and β-casein with ferrous ions in
presence of oxygen. Journal of Dairy Research, 45(1), 59-67.
Marcuse, R. (1962). Effect of some amino acids on oxidation of linoleic acid and its
methyl ester. Journal of the American Oil Chemists Society, 39(2), 97-103.
Marcuse, R. (1960). Antioxidative effect of amino acids. Nature, 186(4728), 886-887.
McClements, D. J., and Decker, E. A. (2000). Lipid oxidation in oil-in-water emulsions:
impact of molecular environment on chemical reactions in heterogeneous food
systems. Journal of Food Science, 65(8), 1270-1282.
McDonald, R. E., and Hultin, H. O. (1987). Some characteristics of the enzymatic lipid
peroxidation system in the microsomal fraction of flounder skeletal muscle.
Journal of Food Science, 52(1), 15-21.

References 233
Mei, L. Y., McClements, D. J., and Decker, E. A. (1999). Lipid oxidation in emulsions
as affected by charge status of antioxidants and emulsion droplets. Journal of
Agricultural and Food Chemistry, 47(6), 2267-2273.
Mei, L. Y., Decker, E. A., and McClements, D. J. (1998a). Evidence of iron association
with emulsion droplets and its impact on lipid oxidation. Journal of Agricultural
and Food Chemistry, 46(12), 5072-5077.
Mei, L. Y., McClements, D. J., Wu, J. N., and Decker, E. A. (1998b). Iron-catalyzed
lipid oxidation in emulsion as affected by surfactant, pH and NaCl. Food
Chemistry, 61(3), 307-312.
http://wordnetweb.princeton.edu/perl/webwn?s=free%20radical (2009). Word to search
for: “free radical”. WordNet®, Cognitive Science Laboratory, Princeton
University, Princeton, NJ, USA.
Miyashita, K., and Takagi, T. (1986). Study on the oxidative rate and prooxidant
activity of free fatty acids. Journal of the American Oil Chemists Society,
63(10), 1380-1384.
Morgan, P. E., Treweek, T. M., Lindner, R. A., Price, W. E., and Carver, J. A. (2005).
Casein proteins as molecular chaperones. Journal of Agricultural and Food
Chemistry, 53(7), 2670-2683.
Morgan, P. E., Dean, R. T., and Davies, M. J. (2002). Inactivation of cellular enzymes
by carbonyls and protein-bound glycation/glycoxidation products. Archives of
Biochemistry and Biophysics, 403(2), 259-269.
Mossini, V., and Feather, M. S. (1998). Metal-binding properties of glycated proteins
and amino acids. The Maillard Reaction in Foods and Medicine, J. O'Brien, H.
E. Nursten, M. J. C. Crabbe, and J. Ames, Eds., The Royal Society of
Chemistry, London, pp. 429.
Moure, A., Dominguez, H., and Parajo, J. C. (2006). Antioxidant properties of
ultrafiltration-recovered soy protein fractions from industrial effluents and their
hydrolysates. Process Biochemistry, 41(2), 447-456.
Murase, H., Nagao, A., and Terao, J. (1993). Antioxidant and emulsifying activity of N-
(long-chain-acyl)histidine and N-(long-chain-acyl)carnosine. Journal of
Agricultural and Food Chemistry, 41(10), 1601-1604.

References 234
Nagasako, Y., Saito, H., Tamura, Y., Shimamura, S., and Tomita, M. (1993). Iron-
binding properties of bovine lactoferrin in iron-rich solution. Journal of Dairy
Science, 76(7), 1876-1881.
Nakaya, K., Ushio, H., Matsukawa, S., Shimizu, M., and Ohshima, T. (2005). Effects of
droplet size on the oxidative stability of oil-in-water emulsions. Lipids, 40(5),
501-507.
Nielsen, N. S., Debnath, D., and Jacobsen, C. (2007). Oxidative stability of fish oil
enriched drinking yoghurt. International Dairy Journal, 17(12), 1478-1485.
Nielsen, N. S., Petersen, A., Meyer, A. S., Timm-Heinrich, M., and Jacobsen, C. (2004).
Effects of lactoferrin, phytic acid, and EDTA on oxidation in two food
emulsions enriched with long-chain polyunsaturated fatty acids. Journal of
Agricultural and Food Chemistry, 52(25), 7690-7699.
Nuchi, C. D., Hernandez, P., McClements, D. J., and Decker, E. A. (2002). Ability of
lipid hydroperoxides to partition into surfactant micelles and alter lipid oxidation
rates in emulsions. Journal of Agricultural and Food Chemistry, 50(19), 5445-
5449.
Nuchi, C. D., McClements, D. J., and Decker, E. A. (2001). Impact of Tween 20
hydroperoxides and iron on the oxidation of methyl linoleate and salmon oil
dispersions. Journal of Agricultural and Food Chemistry, 49(10), 4912-4916.
O'Kennedy, B. T., and Mounsey, J. S. (2006). Control of heat-induced aggregation of
whey proteins using casein. Journal of Agricultural and Food Chemistry,
54(15), 5637-5642.
Osborn, H. T., and Akoh, C. C. (2004). Effect of emulsifier type, droplet size, and oil
concentration on lipid oxidation in structured lipid-based oil-in-water emulsions.
Food Chemistry, 84(3), 451-456.
Ostdal, H., Andersen, H. J., and Nielsen, J. H. (2000). Antioxidative activity of urate in
bovine milk. Journal of Agricultural and Food Chemistry, 48(11), 5588-5592.
Ostdal, H., Andersen, H. J., and Davies, M. J. (1999). Formation of long-lived radicals
on proteins by radical transfer from heme enzymes - a common process?
Archives of Biochemistry and Biophysics, 362(1), 105-112.
Ostdal, H., Daneshvar, B., and Skibsted, L. H. (1996). Reduction of ferrylmyoglobin by
β-lactoglobulin. Free Radical Research, 24(6), 429-438.

References 235
Paraskevopoulou, D., Boskou, D., and Paraskevopoulou, A. (2007). Oxidative stability
of olive oil–lemon juice salad dressings stabilized with polysaccharides. Food
Chemistry, 101(3), 1197-1204.
Patel, H. A. (2007a). Milk proteins. Studies On Heat- And Pressure-Induced
Interactions Of Milk Proteins. Ph.D. Thesis, Massey University, Palmerston
North, New Zealand, pp. 5-16.
Patel, H. A. (2007b). Materials and methods. Studies On Heat- And Pressure-Induced
Interactions Of Milk Proteins. Ph.D. Thesis, Massey University, Palmerston
North, New Zealand, pp. 49-66.
Pazos, M., Andersen, M. L., and Skibsted, L. H. (2006). Amino acid and protein
scavenging of radicals generated by iron/hydroperoxide system: an electron spin
resonance spin trapping study. Journal of Agricultural and Food Chemistry,
54(26), 10215-10221.
Pena-Ramos, E. A., and Xiong, Y. L. (2001). Antioxidative activity of whey protein
hydrolysates in a liposomal system. Journal of Dairy Science, 84(12), 2577-
2583.
Philippe, M., Le Graet, Y., and Gaucheron, F. (2005). The effects of different cations on
the physicochemical characteristics of casein micelles. Food Chemistry, 90(4),
673-683.
Ponginebbi, L., Nawar, W. W., and Chinachoti, P. (1999). Oxidation of linoleic acid in
emulsions: effect of substrate, emulsifier, and sugar concentration. Journal of
the American Oil Chemists Society, 76(1), 131-138.
Rajapakse, N., Mendis, E., Jung, W. K., Je, J. Y., and Kim, S. K. (2005). Purification of
a radical scavenging peptide from fermented mussel sauce and its antioxidant
properties. Food Research International, 38(2), 175-182.
Rampon, V., Lethuaut, L., Mouhous-Riou, N., and Genot, C. (2001). Interface
characterization and aging of bovine serum albumin stabilized oil-in-water
emulsions as revealed by front-surface fluorescence. Journal of Agricultural and
Food Chemistry, 49(8), 4046-4051.
Reddy, M. I., and Mahoney, A. W. (1991a). Binding of Fe(III) to bovine αs1-casein.
Journal of Dairy Science, 74(Supplement 1), D58, 100.

References 236
Reddy, M. I., and Mahoney, A. W. (1991b). A study of the interaction of Fe(III) with
bovine αs1-casein using ultraviolet and fluorescence spectroscopy. Journal of
Dairy Science, 74(Supplement 1), D59, 100.
Refsgaard, H. H. F., Tsai, L., and Stadtman, E. R. (2000). Modifications of proteins by
polyunsaturated fatty acid peroxidation products. Proceedings of the National
Academy of Sciences of the United States of America, 97(2), 611-616.
Remondetto, G. E., Beyssac, E., and Subirade, M. (2004). Iron availability from whey
protein hydrogels: an in vitro study. Journal of Agricultural and Food
Chemistry, 52(26), 8137-8143.
Renye, J. A., and Somkuti, G. A. (2008). Cloning of milk-derived bioactive peptides in
Streptococcus thermophilus. Biotechnology Letters, 30(4), 723-730.
Rival, S. G., Boeriu, C. G., and Wichers, H. J. (2001a). Caseins and casein hydrolysates.
2. Antioxidative properties and relevance to lipoxygenase inhibition. Journal of
Agricultural and Food Chemistry, 49(1), 295-302.
Rival, S. G., Fornaroli, S., Boeriu, C. G., and Wichers, H. J. (2001b). Caseins and
casein hydrolysates. 1. Lipoxygenase inhibitory properties. Journal of
Agricultural and Food Chemistry, 49(1), 287-294.
Roozen, J. P., Frankel, E. N., and Kinsella, J. E. (1994). Enzymatic and autoxidation of
lipids in low-fat foods: model of linoleic acid in emulsified hexadecane. Food
Chemistry, 50(1), 33-38.
Ruxton, C. H. S., Reed, S. C., Simpson, M. J. A., and Millington, K. J. (2004). The
health benefits of omega-3 polyunsaturated fatty acids: a review of the evidence.
Journal of Human Nutrition and Dietetics, 17(5), 449-459.
Saiga, A., Tanabe, S., and Nishimura, T. (2003). Antioxidant activity of peptides
obtained from porcine myofibrillar proteins by protease treatment. Journal of
Agricultural and Food Chemistry, 51(12), 3661-3667.
Satue-Gracia, M. T., Frankel, E. N., Rangavajhyala, N., and German, J. B. (2000).
Lactoferrin in infant formulas: effect on oxidation. Journal of Agricultural and
Food Chemistry, 48(10), 4984-4990.
Schnitzer, E., Pinchuk, I., Bor, A., Fainaru, M., and Lichtenberg, D. (1997). The effect
of albumin on copper-induced LDL oxidation. Biochimica Et Biophysica Acta -
Lipids and Lipid Metabolism, 1344(3), 300-311.

References 237
Segall, K. I., and Goff, H. D. (2002). Secondary adsorption of milk proteins from the
continuous phase to the oil–water interface in dairy emulsions. International
Dairy Journal, 12(11), 889-897.
Shacter, E. (2008). Protein oxidation: a primer on characterization, detection, and
consequences.
http://www.healthcare.uiowa.edu/research/sfrbm/Papers/Virtual%20School%20
Papers/Shacter-ProtOx.ppt#1. University of Iowa, Iowa City, IA, USA.
Shantha, N. C., and Decker, E. A. (1994). Rapid, sensitive, iron-based
spectrophotometric methods for determination of peroxide values of food lipids.
Journal of AOAC International, 77(2), 421-424.
Sharp, J. S., Becker, J. M., and Hettich, R. L. (2004). Analysis of protein solvent
accessible surfaces by photochemical oxidation and mass spectrometry.
Analytical Chemistry, 76(3), 672-683.
Shears, G. E., Ledward, D. A., and Neale, R. J. (1987). Iron complexation to carboxyl
groups in a bovine serum albumin digest. International Journal of Food Science
and Technology, 22(3), 265-272.
Shen, Z. P., Rusli, J. K., Sanguansri, L., and Augustin, M. A. (2007). Retention of
propanal in protein-stabilised tuna oil-in-water emulsions. Food Chemistry,
101(2), 746-752.
Shimada, K., Okada, H., Matsuo, K., and Yoshioka, S. (1996). Involvement of chelating
action and viscosity in the antioxidative effect of xanthan in an oil/water
emulsion. Bioscience Biotechnology and Biochemistry, 60(1), 125-127.
Shimada, K., Muta, H., Nakamura, Y., Okada, H., Matsuo, K., Yoshioka, S.,
Matsudaira, T., and Nakamura, T. (1994). Iron-binding property and
antioxidative activity of xanthan on the autoxidation of soybean oil in emulsion.
Journal of Agricultural and Food Chemistry, 42(8), 1607-1611.
Shimada, K., Fujikawa, K., Yahara, K., and Nakamura, T. (1992). Antioxidative
properties of xanthan on the autoxidation of soybean oil in cyclodextrin
emulsion. Journal of Agricultural and Food Chemistry, 40(6), 945-948.
Silvestre, M. P. C., Chaiyasit, W., Brannan, R. G., McClements, D. J., and Decker, E.
A. (2000). Ability of surfactant headgroup size to alter lipid and antioxidant
oxidation in oil-in-water emulsions. Journal of Agricultural and Food
Chemistry, 48(6), 2057-2061.

References 238
Simopoulos, A. P. (2001). n-3 fatty acids and human health: defining strategies for
public policy. Lipids, 36, S83-S89.
Simopoulos, A. P. (1999). Essential fatty acids in health and chronic disease. American
Journal of Clinical Nutrition, 70(3), 560S-569S.
Sims, R. J., Fioriti, J. A., and Trumbetas, J. (1979). Effect of sugars and sugar alcohols
on autoxidation of safflower oil in emulsions. Journal of the American Oil
Chemists Society, 56(8), 742-745.
Smith, A. K., and Campbell, B. E. (2007). Microstructure of milk components.
Structure of Dairy Products, A. Y. Tamime, ed., Blackwell Publishing, Oxford,
pp. 59-71.
Smith, C. A., Anderson, B. F., Baker, H. M., and Baker, E. N. (1994). Structure of
copper-substituted and oxalate-substituted human lactoferrin at 2.0 Angstrom
resolution. Acta Crystallographica Section D - Biological Crystallography,
50(Part 3), 302-316.
Sorensen, A. D. M., Baron, C. P., Let, M. B., Bruggemann, D. A., Pedersen, L. R. L.,
and Jacobsen, C. (2007). Homogenization conditions affect the oxidative
stability of fish oil enriched milk emulsions: oxidation linked to changes in
protein composition at the oil–water interface. Journal of Agricultural and Food
Chemistry, 55(5), 1781-1789.
Srinivasan, M., Singh, H., and Munro, P. A. (1999). Adsorption behaviour of sodium
and calcium caseinates in oil-in-water emulsions. International Dairy Journal,
9(3-6), 337-341.
Srinivasan, M., Singh, H., and Munro, P. A. (1996). Sodium caseinate-stabilized
emulsions: factors affecting coverage and composition of surface proteins.
Journal of Agricultural and Food Chemistry, 44(12), 3807-3811.
Steijns, J. M., and van Hooijdonk, A. C. M. (2000). Occurrence, structure, biochemical
properties and technological characteristics of lactoferrin. British Journal of
Nutrition, 84(Supplement 1), S11-S17.
Suetsuna, K., Ukeda, H., and Ochi, H. (2000). Isolation and characterization of free
radical scavenging activities peptides derived from casein. Journal of
Nutritional Biochemistry, 11(3), 128-131.

References 239
Sun, C. H., and Gunasekaran, S. (2009). Effects of protein concentration and oil-phase
volume fraction on the stability and rheology of menhaden oil-in-water
emulsions stabilized by whey protein isolate with xanthan gum. Food
Hydrocolloids, 23(1), 165-174.
Svenning, C., and Vegarud, G. E. (1998). Proceeding 'Dairy Foods in Health'. IDF
Nutrition Week, New Zealand, p. 12.
Tamime, A. Y., Robinson, R. K., and Michel, M. (2007). Microstructure of
concentrated and dried milk products. Structure of Dairy Products, A. Y.
Tamime, ed., Blackwell Publishing, Oxford, pp. 104-133.
Taylor, M. J., and Richardson, T. (1980a). Antioxidant activity of cysteine and protein
sulfhydryls in a linoleate emulsion oxidized by hemoglobin. Journal of Food
Science, 45(5), 1223-1227.
Taylor, M. J., and Richardson, T. (1980b). Antioxidant activity of skim milk: effect of
heat and resultant sulfhydryl groups. Journal of Dairy Science, 63(11), 1783-
1795.
Thomsen, M. K., Jacobsen, C., and Skibsted, L. H. (2000). Mechanism of initiation of
oxidation in mayonnaise enriched with fish oil as studied by electron spin
resonance spectroscopy. European Food Research and Technology, 211(6), 381-
386.
Tong, L. M., Sasaki, S., McClements, D. J., and Decker, E. A. (2000a). Antioxidant
activity of whey in a salmon oil emulsion. Journal of Food Science, 65(8), 1325-
1329.
Tong, L. M., Sasaki, S., McClements, D. J., and Decker, E. A. (2000b). Mechanisms of
the antioxidant activity of a high molecular weight fraction of whey. Journal of
Agricultural and Food Chemistry, 48(5), 1473-1478.
Turini, M. E., Crozier, G. L., Donnet-Hughes, A., and Richelle, M. A. (2001). Short-
term fish oil supplementation improved innate immunity, but increased ex vivo
oxidation of LDL in man – a pilot study. European Journal of Nutrition, 40(2),
56-65.
Tzvetkova, I., Dalgalarrondo, M., Danova, S., Iliev, I., Ivanova, I., Chobert, J. M., and
Haertle, T. (2007). Hydrolysis of major dairy proteins by lactic acid bacteria
from Bulgarian yogurts. Journal of Food Biochemistry, 31(5), 680-702.

References 240
van Duynhoven, J. P. M., Goudappel, G. J. W., van Dalen, G., van Bruggen, P. C.,
Blonk, J. C. G., and Eijkelenboom, A. (2002). Scope of droplet size
measurements in food emulsions by pulsed field gradient NMR at low field.
Magnetic Resonance in Chemistry, 40(13), S51-S59.
Vegarud, G. E., Langsrud, T., and Svenning, C. (2000). Mineral-binding milk proteins
and peptides; occurrence, biochemical and technological characteristics. British
Journal of Nutrition, 84(Supplement 1), S91-S98.
Viljanen, K., Kylli, P., Hubbermann, E. M., Schwarz, K., and Heinonen, M. (2005).
Anthocyanin antioxidant activity and partition behavior in whey protein
emulsion. Journal of Agricultural and Food Chemistry, 53(6), 2022-2027.
Villiere, A., Viau, M., Bronnec, I., Moreau, N., and Genot, C. (2005). Oxidative
stability of bovine serum albumin- and sodium caseinate-stabilized emulsions
depends on metal availability. Journal of Agricultural and Food Chemistry,
53(5), 1514-1520.
Watkins, S. M., and German, J. B. (2002). Unsaturated fatty acids. Food Lipids -
Chemistry, Nutrition, and Biotechnology, C. C. Akoh, and D. B. Min, Eds.,
Marcel Dekker, NY, pp. 559-561.
Weel, K. G. C., Boelrijk, A. E. M., Burger, J. J., Claassen, N. E., Gruppen, H., Voragen,
A. G. J., and Smit, G. (2003). Effect of whey protein on the in vivo release of
aldehydes. Journal of Agricultural and Food Chemistry, 51(16), 4746-4752.
Wijendran, V., and Hayes, K. C. (2004). Dietary n-6 and n-3 fatty acid balance and
cardiovascular health. Annual Review of Nutrition, 24, 597-615.
Wong, P. Y. Y., and Kitts, D. D. (2003). Chemistry of buttermilk solid antioxidant
activity. Journal of Dairy Science, 86(5), 1541-1547.
Yanishlieva-Maslarova, N. V. (2001). Inhibiting oxidation. Antioxidants in food:
Practical Applications, J. Pokorny, N. Yanishlieva, and M. H. Gordon, eds.,
Woodhead Publishing, Cambridge, pp. 22-70.
Ye, A., and Singh, H. (2000). Influence of calcium chloride addition on the properties
of emulsions stabilized by whey protein concentrate. Food Hydrocolloids, 14(4),
337-346.
Yong, Y. H., and Foegeding, E. A. (2008). Effects of caseins on thermal stability of
bovine β-lactoglobulin. Journal of Agricultural and Food Chemistry, 56(21),
10352-10358.

References 241
Zirlin, A., and Karel, M. (1969). Oxidation effects in a freeze-dried gelatin-methyl
linoleate system. Journal of Food Science, 34(2), 160-165.
Zou, M. (2005). Laboratory procedure: determination of amino acids profile in food and
feedstuffs by means of ion-exchange chromatography, AOAC methods 994.12
& 985.28. Institute of Food, Nutrition and Human Health, Massey University,
Palmerston North, New Zealand.