studies on the effects of mpower programme on mitigation and adaptation...
TRANSCRIPT

PROJECT REPORT
STUDIES ON THE EFFECTS OF MPOWER PROGRAMME ON MITIGATION AND ADAPTATION TOWARDS CLIMATE
CHANGE IN WESTERN RAJASTHAN
APRIL 2013 TO MARCH 2015
Submitted to
PROJECT DIRECTOR, MPOWER (Government of Rajasthan, Jodhpur)
By
Dr. G. Singh, Scientist G
Division of Forest Ecology
Arid Forest Research Institute, Jodhpur-342005 (Indian Council of Forestry Research & Education, Dehradun-248006)
2015

PROJECT REPORT
STUDIES ON THE EFFECTS OF MPOWER PROGRAMME ON MITIGATION AND ADAPTATION TOWARDS CLIMATE CHANGE IN WESTERN RAJASTHAN
Submitted to
Project Director, MPOWER, Jodhpur
By
Dr. G. Singh, Scientist G
ARID FOREST RESEARCH INSTITUTE
JODHPUR-342005 (Indian Council of Forestry Research & Education, Dehradun)

ACRONYMS AFOLU : Agriculture, Forestry and Other Land Use ANOVA : Analysis of Variance ATREE : Ashoka Trust for Research in Ecology and Environment BAIF : BAIF Research Foundation BPL : Below Poverty Line CDP : Combating Desertification Programme CER : Certified Emission Reductions CR : Contour Ridge CSW : Carbon stock without gravel correction CT : Conventional Tillage DBI : Diversion Based Irrigation DDP : Desert Development Programme DMRT : Duncan Multiple Range Tests DPAP : Desert Prone Area Programme GHG : Green House Gases GVNML : Gram Vikas Navyuvak Mandal, Laporiya GWC : Global Warming Commitment HDI : Human Development index HHs : Households ICLEI : International Council for Local Environmental Initiatives IGNP : Indira Gandhi Nahar Pariyojana LDC : Least Developed Country LULUCF : Land Use, Land Use change & Forestry MNREGA : Mahatma Gandhi National Rural Employment Guarantee Act MOEFCC : Ministry of Environment, Forests and Climate Change MPOWER : Mitigating Poverty in Western Rajasthan NABARD : National Bank for Agriculture and Rural Development NAPCC : National Action Plan on Climate Change NGO : Non Government Organisation NICRA : National Innovations on Climate Resilient Agriculture PP : Planting Pits PRA : Participatory Rural Appraisal REDD : Reducing Emissions from Deforestation and Forest Degradation RWH : Rain Water Harvesting RSAPCC : Rajasthan State Action Plan on Climate Change SAPCC : State Action Plans on Climate Change SHG : Self Help Group SOC : Soil Organic Carbon TGA : Total Geographical Area TFR : Total Fertility Rate WOTR : Watershed Organisation Trust UNFCCC : United Nations Framework Convention on Climate Change

PREFACE
Both natural and anthropogenic factors are responsible for changing weather pattern. However,
later ones are relatively more responsible contributing to the rise in atmospheric greenhouse
gases (GHGs). Some of them are land degradation through land use change, forest clearing and
forest degradation. Agriculture is one land use associated with livelihood security and survival of
mankind. Climate extremes like drought, flood, and heat stress and there influences on land
productivity lead people for land use conversion. The western part of Rajasthan is more
dependent on rainfall for agriculture, and the variable rainfall makes the agriculture highly
susceptible to climate change. Forests are degraded, commons are overexploited and farmlands
are marginalized; these all are resulting in a negative balance in terrestrial carbon stock.
Strategies like soil carbon enrichment, retaining woody perennials, promoting climate friendly
livestock, protecting natural forests, restoring watersheds and rangelands, and efficient use of
biomass and fuel could mitigate climate change. Resource conservation measure, diversification
of income, conservation agriculture, crop management practices and use of climate resilient crop
or tree species in intensifying crop production and sustaining rural livelihoods are important
ways of climate change adaptation.
This report is based on field studies and interactions with 2349 respondents with house hold
survey in the project ‘Studies on the effects of MPOWER programme on mitigation and
adaptation towards Climate Change in western Rajasthan’. Divided into 7 chapters this report
covers project background and climatic conditions in western Rajasthan, descriptions and
discussions climate change adaptation and mitigation options based on literature, characteristics
and conditions of the study area and the methodology adopted under this study, socioeconomic
profile, people livelihood and project activities in the blocks, climate change mitigation activities
and options, and people perception and adaptation related activities towards the changing
environmental conditions in the region. Finally, concluded with listing of based
practices/activities carried out in MPOWER programme implemented on pilot basis in Aburoad,
Bali, Sanchor, Sankara, Baap and Baitu blocks in the districts Sirohi, Pali, Jalore, Jaisalmer,
Jodhpur and Barmer, respectively.

This work could have been possible with financial support made under Mitigating Poverty in Western
Rajasthan (MPOWER) programme, Jodhpur, for which we are grateful. We would also like to
thank Sh. Jaipal Singh Mertia, Present Project Director, MPOWER, members of different NGOs
working in different blocks for their help during field visits and people interactions. For successful
completion of field survey, data compilation and report preparation, the contribution of Mrs Ritu
Sharma, Project Fellow and Km Priyanka Garhwal, Research Scholar and help rendered by the
scientists and staff particularly Sh G. R. Choudhary, R.A. I of Forest Ecology Division, AFRI, Jodhpur,
without their support and assistant it would have not been possible to complete this work. We shall not
justify, if not mentioned the name of Late Dr. Mrinal Roy Choudhary, Project Director, MPOWER,
Jodhpur, for his contribution of varying kinds.
Necessary inputs, suggestions and continuous supports provided by Director, AFRI and Group
Coordinator (Research), AFRI are gratefully acknowledged.
Thus I hope that this study report will help in effective planning and implementation of the programme at
large scale for ensured peoples livelihood and making them more resilient to help climate change
adaptation and mitigation by promoting, conserving and restoring farmlands and degraded commons.
(Dr. G. Singh)
Scientist G
i
TABLE OF CONTENTS
Chapter Particular Page Nos. Preface Acronyms Project Overview i-vi
1. BACKGROUND CONTEXT OF THE PROJECT 1 1. INTRODUCTION 1 2. PROJECT BACKGROUND 3. OBJECTIVES OF THE STUDY 6 4. ROLES OF NGO'S IN THE PROJECT 6 5. DELINEATION OF STUDY AREA 7 5.1 Physiography of the region 7 5.2 Districts under study 9 5.3 Climatic conditions in western Rajasthan 12 6. LAND USE PATTERN IN THE REGION 15 6.1 Forest area 16 6.2 Area under non-agriculture uses 16 6.3 Barren and Un-culturable Land 16 6.4 Grazing Lands 17 6.5 Land under Misc. Tree Crops and Groves 17 6.6 Culturable Waste Land 17 6.7 Fallow land 18 6.8 Agriculture 18 6.9 Irrigation area in the districts 18 7. VEGETATION STATUS 18 8. SOCIOECONOMICS CONDITIONS 19 2 CLIMATE CHANGE ADAPTATION AND MITIGATION 21 1. INTRODUCTION 21 2. CLIMATE CHANGE ADAPTATION 24 2.1 Adaptation strategies 25 2.2 Rainwater harvesting and management 26 2.3 Agriculture and food supply 28 2.4 Land use change as adaptation 32 2.5 Forestry and Climate Change Adaptation 33 2.6 Climate Change Adaptation and Livelihood 36 2.7 Government of India initiatives 36 3. CLIMATE CHANGE MITIGATION 39 3.1 Enriching soil carbon 40 3.2 Maintaining and farming woody perennials 42 3.3 Managing livestock production 46 3.4 Protecting forests and natural habitat 48 3.5 Restoring degraded watersheds and rangelands 50

ii
Chapter Particular Page Nos. 3.6 Efficient uses of fuels to reduce GHGs emission 52 4. SYNTHESIS AND FUTURE PERSPECTIVES 53 3 SITE CONDITIONS METHODS OF DATA COLLECTION 57 1. STUDY AREAS 57 2. SITE CONDITIONS 58 2.1 Baap block 58 2.2 Sankara block 59 2.3 Baitu block 59 2.4 Sanchor block 60 2.5 Bali block 60 2.6 Aburoad block 61 2.7 Rainfall pattern in study area 61 3. METHODS OF DATA COLLECTION 63 3.1 Design of survey 63 3.1.1 Selection of villages and households 63 3.1.2 Selection of land use 64 3.2 Data collections 65 3.2.1 Household Survey 65 3.2.2 Data on village profile 67 3.2.3 Meteorological data 67 3.3 Soil sampling and characterization 67 3.3.1 Bulk density Measurement 67 3.3.2 Soil organic carbon 69 3.4 Calculations of soil carbon stock 69 3.5 Problems faced during study 69 3.5.1 Female Interviewees 69 3.5.2 Assembly and Lok Sabha Elections 69 3.5.3 Difficult terrain 69 3.5.4 Respondent’s Apprehension 70 3.6 Statistical Analysis 70 4 SOCIAL PROFILE, LIVELIHOOD AND PROJECT ACTIVITIES 71 1. SOCIOECONOMIC PROFILE 71 1.1 Types of houses 72 1.2 Human and livestock population 73 1.2.1 Human population 73 1.2.2 Livestock population 74 1.3 Land holdings 75 1.4 Occupations and source of income 75 1.4.1 Occupations 75 1.4.2 Income from different sources 77 1.5 Light availability 78

iii
Chapter Particular Page Nos. 1.6 Irrigated lands and irrigation facilities 78 1.7 Sources of drinking water 80 1.8 Source of cooking energy 81 1.9 Agriculture 83 1.10 Fodder availability 84 2. ACTIVITIES IN MPOWER PROGRAMME 85 2.1 Formation of SHGs 87 2.2 Monthly saving 87 2.3 Revolving Fund 88 2.4 Bank linkages 89 2.5 Seed Capital 89 2.6 Seed demonstration 89 2.7 Vegetable demonstration 89 2.8 Fertilizer distribution 90 2.9 Polyhouse and vermipit construction 90 2.10 Goat shed and cow shed construction 91 2.11 Trellis for climbing vegetable plants 91 2.12 Sprinkler distribution 92 2.13 Distribution of 'Bilona' machine 92 2.14 Sewing machine training 92 2.15 Kerosene stove distribution 92 2.17 Fruit plants distribution 93 2.18 Construction of Tanka 93 2.19 Construction of saran 94 2.20 Plastic pot distribution 94 2.21 Solar light distribution 94 2.22 Plant nursery 94 5 SOIL CARBON AND CLIMATE CHANE MITIGATION 95 1. CLIMATE CHANGE AWARENESS 95 2. SOIL PROPERTIES 97 2.1 Gravel content 97 2.2 Soil bulk density 99 2.3 Soil organic carbon 100 3. VARIATIONS IN SOIL CARBON STOCK 101 4. ORGANIC MANURING 104 5. ALTERNATIVE ENERGY SOURCES 105 6. PROMOTION OF PLANTATION 108 7. RELATIONSHIP AMONG DIFFERENT VARIABLES 109 6 PEOPLE PERCEPTIONS AND CLIMATE CHANGE
ADAPTATIONS 113
1 CLIMATE CHANGE ADAPTATION 113
iv
Chapter Particular Page Nos. 2 PEOPLE PERCEPTONS 116 2.1 People perceptions about the work 116 2.2 People view and activity ranking 117 2.3 Requirements of the local people 118 3. TYPES OF ADAPTATIONS 119 3.1 Factors influencing changes 120 3.2 Water availability 121 3.3 Change in cropping pattern 122 3.4 Increased irrigation sources 123 3.5 Assets as climate change resilience and adaptation 125 3.6 Rearing livestock 126 3.7 Dependency on forests and grazing lands 128 3.8 Alternative livelihoods 130 3.9 People migration 131 7 CONCLUSION AND RECOMMENDATIONS 133 1 SOCIOECONOMY AND LIVELIHOOD 133 2 PEOPLE PERCEPTIONS 135 3 CLIMATE CHANGE MITIGATION 137 4 CLIMATE CHANGE ADAPTATION 138 5 RECOMMENDATIONS 139 8 BIBLIOGRAPHY 143 9 Annexure I 167 Annexure II 171 Annexure III 187 Annexure IV 191

v
LIST OF TABLES
Table Title Page Nos. 1.1 Average Productivity of all major crops in All Districts (1990-2010). 3 1.2 Agroclimatic zone and their distribution in Rajasthan 8 1.3 Geographical area, population and rainfall of different districts under
study (2010-11). 11
1.4 District-wise rainfall intensities in Rajasthan (1980 to 2009). 15 1.5 Different land uses in Rajasthan and the selected districts during
2009-10. 17
1.6 Socioeconomics data of different districts (2010-11). 19 2.1 Government of India's programmes related to building resilience,
reducing vulnerability, social safety nets, etc. 37
2.2 Adaptation through collaboration with NGOs. 37 2.3 Management options for reducing emissions and enhancing sinks to
mitigate climate change effects 39
2.4 Mitigation potential in agriculture and forestry by 2030 45 3.1. Number of village panchayat and different blocks of MPOWER
project. 58
3.2 Annual rainfall in nearby areas of the studied MPOWER blocks in western Rajasthan.
62
3.3 Number of rain days in nearby areas of the studied MPOWER blocks in western Rajasthan.
62
3.4 Number of soil samples collected based on available land uses in the selected 102 village in different blocks of MPOWER.
64
3.5 Respondents age groups covering both male and female across the castes in different surveyed blocks of MPOWER.
66
4.1 Number of village Panchayat, village and households (HHs) in different MOPWER blocks.
71
4.2 Distributions of household among different casts in the studies areas MPOWER blocks of western Rajasthan
72
4.3 Types of houses in the studied regions of MPOWER blocks in western Rajasthan.
73
4.4 Human population in the surveyed villages of different MPOWER blocks of western Rajasthan.
73
4.5 Livestock population in the surveyed villages of different MPOWER blocks of western Rajasthan.
75
4.6 Landholding ('bigha') of surveyed households in different blocks of MPOWER in Western Rajasthan.
75
4.7 Occupations other than the agriculture in different blocks of MPOWER in western Rajasthan.
76
4.8 Income from milk production in different blocks of MPOWER 77 4.9 Income from other sources than milk production in different blocks of 78
vi
Table Title Page Nos. MPOWER.
4.10 Source of irrigation at present in different MPOWER block in western Rajasthan.
79
4.11 Different sources of drinking water in the MPOWER blocks of Western Rajasthan.
80
4.12 Sources of drinking water in the studied area particularly during water scarcity in western Rajasthan.
81
4.13 Average distance of water source for drinking water in MOPWER areas of western Rajasthan.
81
4.14 Different type energy generated for cooking purpose in studied areas of western Rajasthan.
82
4.15 Cooking device used in households for cooking food in studied region of MPOWER block of Western Rajasthan.
82
4.16 Sites of fuelwood collection in different blocks of MPOWER in western Rajasthan.
83
4.17 Types of implements the people of different MPOWER block have and used in agricultural operations in western Rajasthan.
84
4.18 Types of assets the people have in MPOWER block of western Rajasthan.
85
4.19 Sites of fodder collection in studied areas of MPOWER in western Rajasthan
85
4.20 List of NGOs working in different MPWER blocks in western Rajasthan.
86
4.21 Activities carried out by different NGOs in different MPOWER blocks.
86
5.1 Means by which people in different MPOWER block of western Rajasthan experience climate change.
96
5.2 Effects of spatial variations and land uses on soil gravel content. Values are mean±SE of multiple replications.
98
5.3. Effects of spatial variations and land uses on soil bulk density (g cm-
3). Values are mean±1SE of multiple replications. 99
5.4 Effects of spatial variations and land uses on per cent soil organic carbon content. Values are mean±1SE of multiple replications.
101
5.5 Effects of spatial variations and land uses on soil organic carbon stock (tons ha-1) without gravel correction. Values are mean±1SE of multiple replications.
102
5.6 Effects of spatial variations and land uses on soil carbon stock (tons ha-1) after gravel correction. Values are mean±1SE of multiple replications.
104
5.7 Correlations in different variables of soils and socio-economic profile of a village in the studied area of MPOWER.
108

vii
Table Title Page Nos. 6.1 People opinions towards the activities carried out in different
MPOWER blocks of western Rajasthan. 117
6.2 People perceptions about the most favoured activities implemented in different MPOWER blocks of western Rajasthan
118
6.3 Listed requirement of the villagers in different blocks of MPOWER in western Rajasthan.
118
6.4 Types of adaptation among the villagers of different MPWER blocks towards climate change.
120
6.5 Probable reasons for adopting alternative practices over the traditional ones in MPOWER blocks in western Rajasthan.
121
6.6 Varietal changes in agricultural production in different bocks of MPOWER in western Rajasthan.
123
6.7 Change in per cent households with different land holding categories during last 10 years in different blocks of MPOWER in western Rajasthan.
124
6.8 Types of assets the people have in MPOWER block of western Rajasthan.
126
6.9 Range of animals reared by the people in MPOWER blocks of western Rajasthan.
127
6.10 Percent of households utilizing different sources for fuel wood collection in different blocks of MPOWER in western Rajasthan.
128
7.1 Ranking of different activities implemented in different MPOWER blocks of western Rajasthan.
136

viii
LIST OF FIGURES
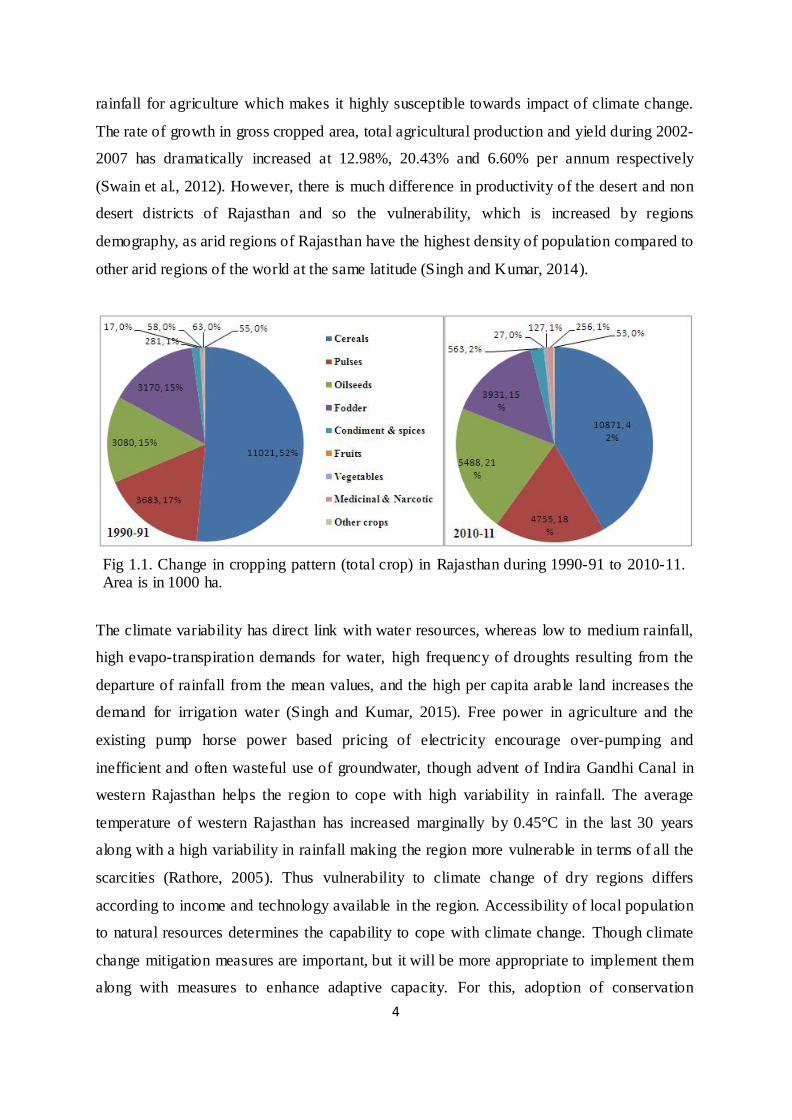
Figure Title Page Nos. 1.1 Change in cropping pattern (total crop) in Rajasthan during 1990-91
to 2010-11. Area is in 1000 ha. 4
1.2 Mean annual rainfall and physiography of arid region of Rajasthan
9
1.3 Long-term trends in annual mean air temperatures and annual rainfall in Thar region of Rajasthan.
13
1.5 Land use pattern in Rajasthan (left) and the studied districts (right). 16 2.1 Effects of stocking rate (50 kg sheep equivalent/ha) on X-axis
ranging from 2-8 sheep on soil carbon storages indicated by solid symbol and vegetation utilization rate (open symbol).
47
3.1 Area marked yellow color are Baap block in Jodhpur, Sankara in Jaisalmer, Baitu in Barmer, Sanchor in Jalor, Bali in Pali and Abu Road in Sirohi district of Rajasthan.
57
3.1 Monthly change in rainfall in different MPOWER area of Rajasthan. 63 3.2 Interaction with the villagers in Aburoad (left) and Baitu (right)
blocks of MPOWER. 66
3.3 Soil sampling using mechanical auger in a plantation in Baitu (left) and in a pastureland in Sankara (right) block of MPOWER.
68
4.1 Percentage of BPL (A) and agrarian (B) families in different MPOWER Block of Western Rajasthan.
72
4.2 Change in land holding in the studied area during 10 years period. 76 4.3 Percentage of HHs involved in working of MPOWER activity (A)
and having electricity connections (B) in different blocks in western Rajasthan.
78
4.4 Change in irrigation pattern during last ten years in the studied blocks in Rajasthan.
79
4.5 Per cent villages where SHGs have been formed. 867 4.6 Interaction with villagers (left) in Aburoad block and monthly
saving through 'Bachat Peti' (right) in Bali block. 88
4.7 Per cent households covered under seed distribution of agricultural crops.
90
4.8 Constructed polyhouse (left) and growing seedlings of vegetable (right) for distribution among the members of SHGs.
91
4.9 Distribution of sewing machine (left) in Sanchor block and kerosene stove (right) in Aburoad block.
93
4.10 Planting fruit plants in house premises in Sankara block (left) and construction of Tanka in Baap block (right)
93
4.11 Saran in Bali block (left) and diversion channel in Sanchor block (right) for irrigation purpose.
94
5.1 Percentage awareness about climate change among the peoples of 96
ix
Figure Title Page Nos. different blocks of MPOWER in western Rajasthan.
5.2 Changes in soil gravel content due to spatial variations (A) and land uses (B) in western Rajasthan. Error bars are ±1SE of multiple replications.
98
5.3 Changes in soil bulk density due to spatial variations (A) and land uses (B) in western Rajasthan. Error bars are ±1SE of multiple replications.
100
5.4 Changes in per cent soil organic carbon due to spatial variations (A) and land uses (B) in western Rajasthan. Error bars are ±1SE of multiple replications.
101
5.5 Changes in per cent soil organic carbon due to spatial variations (A) and land uses (B) in western Rajasthan. Error bars are +1SE of multiple replications.
103
5.6 Change in use of energy generation for cooking purpose in studied area of western Rajasthan.
106
5.7 Trend line relationships between rainfall and soil organic carbon and soil bulk density.
110
5.8 Relationship between rainfall and soil organic carbon stock with and without gravel correction.
110
5.9 Relationships of soil organic carbon stock with (dotted line) and without gravel (solid line) corrections with human (left) and livestock (right) population per household.
111
6.1 Change in irrigation pattern during last ten years in the studied blocks in Rajasthan.
124
6.2 Per cent of households utilizing different sources for grazing or fodder collection in studied areas of western Rajasthan.
129
6.3 Growing vegetables on farmlands in Baitu block (left) and in Aburoad block (right).
130
6.4 Sources of livelihoods other than the agriculture in different blocks of MPOWER in western Rajasthan.
132
__________________________________________________________________________________________________________________________
nwjHkk"k/Phones:(0291) 2722549 (O), 2000623 (R),QSDl/ Fax: (0291) 2722764 / bZ esy/ E mail: [email protected]
Project Overview
Risks of climate change (CC) vulnerability are increasingly high in dry lands, which are often threatened by destruction and overexploitation and affected by droughts, floods, and famines. The adverse impacts of climate change expected to be more on agriculture and reduction in crop yields from rain-fed agriculture is expected to be up to 30% by 2050 in Central and South Asia. In western Rajasthan, temperature has shown a great variability with an average rise of about 0.5°C for the month of June. Land productivity is low depending upon low and erratic rainfall, access to alternative services is limited and drought is a regular phenomenon all affecting people livelihood. People in landless or marginal land holding categories and those spending nomadic life whose livelihood depends mostly on animal husbandry are the most affected. This is indicated by low Human development index (HDI) in districts of western Rajasthan.
Mitigating Poverty in Western Rajasthan (MPOWER) is a programme implemented on pilot basis in six blocks namely Aburoad, Bali, Sanchor, Sankara, Baap and Baitu situated in Sirohi, Pali, Jalore, Jaisalmer, Jodhpur and Barmer district, respectively in Western Rajasthan. It was to mitigate poverty of the target groups through strengthened capacity, improved livelihood, sustainable enterprises, natural resources management and increased access to credit and markets. Various activities promoted involving 9 different NGOs through Self help Groups (SHG) were: monthly saving scheme, generating revolving fund, developing bank linkage, seed capital for self employment, distribution and demonstration of crops and vegetable seeds, fertilizer, trellis for climbing vegetable plants, Bilona machine, Kerosene stove, solar light, plastic pot for water transport, sprinkler for efficient water use, seedlings of horticultural species, construction of polyhouse and vermipit for composting, sheds for goat and cow, Tanka with handpump, Saran - water distributing channels, and providing trainings for skill development.
'kq"d ou vuqla/kku laLFkku ¼Hkkjrh; okfudh vuqla/kku ,oa f'k{kk ifj"kn~]
i;kZoj.k ,oa ou ea=ky;] Hkkjr ljdkj dh Lok;Rr'kklh laLFkk½ ih- vkW- df̀"k e.Mh] ubZ ikyh jksM+] tks/kiqj& 342 005
ARID FOREST RESEARCH INSTITUTE (Indian Council of Forestry Research & Education,
An Autonomous Body of the Ministry of Environment & Forests, Govt. of India) P.O. Krishi Mandi, New Pali Road, Jodhpur- 342 005
,u- ds- oklq-] ¼Hkk-o-ls-½ funs'kd
N.K. Vasu, IFS
Director

__________________________________________________________________________________________________________________________
nwjHkk"k/Phones:(0291) 2722549 (O), 2000623 (R),QSDl/ Fax: (0291) 2722764 / bZ esy/ E mail: [email protected]
Project "Studies on the effects of MPOWER programme on mitigation and adaptation towards Climate Change in western Rajasthan" was funded under MPOWER at total cost of Rs 8.8 lakhs to have a practical knowledge and the impact of activities promoted under the programme for improved livelihood and people resilience to mitigate and adapt to climatic changes and enlisting best methods for further replication. The objectives of this project were: To identify best practice in terms of enhanced livelihood and adaptations among the
villagers of the selected villages in western Rajasthan; To identify best practice supporting mitigation (i.e., carbon sequestration in soil) option
of climate change in these villages; Document and suggest best practices of MPOWER in terms of climate change mitigation
and adaptation for its further replication in large scale.
Methods adopted were both field data collection and interaction with the peoples by covering 10% villages (9 villages in Bali to 32 in Baitu block) of 1024 villages in the region. Ten per cent households (respondents) were interacted through PRA and focus group discussions though well designed questionnaires covering different aspects of socio-economic profile, climate change awareness and strategies of mitigation and adaptation to CC during 2012-13 and 2013-14. Number of households surveyed were 2349 (247 in Baap to 573 in Sanchor) represented by 38.4% male and 61.6% female of different age. Soil samples in 0-30 cm soil layer were collected from different land uses like agriculture, forests/plantation, pasture/grassland, Oran, roadside and fallow land for estimating carbon stock as a measure of CC mitigation options. Data on rainfall was also collected from district H.Q. to relate it with soil carbon storage.
Baitu, Baap, Sankara and Sanchor blocks are dominated by OBC, whereas Aburoad and Bali blocks have been dominated by ST with dominant communities Bheel and Garasiyas. In general 41% are OBC, 31% ST, 23% SC and 5% general castes. Families under BPL ranged from 48% in Sankara to 80% in Bali block with region average of 56%. Kachha houses represented 42% HHs dominated in Aburoad, 12% houses are Pakka dominated in Baap and 56% houses are mixed particularly in Sankara. Highest numbers of respondents have land holding 0-5 bigha particularly in Bali, Aburoad and Sanchor blocks. Access to electricity is relatively poor in Baap, Aburoad and Bali blocks. Purdah and Ghoonghat system in women still prevails in the region, where people are hesitant to discussion and skeptical in government plans.
About 94.3% HHs face water shortage during May to July, whereas rests face year round problem of water scarcity. Main sources of drinking water are collected/stored water in

__________________________________________________________________________________________________________________________
nwjHkk"k/Phones:(0291) 2722549 (O), 2000623 (R),QSDl/ Fax: (0291) 2722764 / bZ esy/ E mail: [email protected]
individual Tanka, government tanks, dugwells (unfit for consumption) and open ponds. During water scarcity, people of Baitu, Sankara, Baap and Sanchor block depend mostly on private water supply, whereas the people of Aburoad and Bali depend on deep dugwells and public hand pumps. Drinking water is even transported from nearby water supply and nearby village, whereas is Aburoad and Bali region drinking water is transported even by travelling 0.5 to 5 km.
Agriculture (88% in Sanchor to 97% in Baitu) and animal rearing are the dominant occupation indicated by >90% respondents. About 65.6% households depend on rainfed agriculture, and dominant in Baitu, Sankara and Baap. Most common sources of irrigation are wells (tubewell and dugwell) adopted by 20.9% respondents. However, Saran (irrigation channels) appears important source of irrigation in Bali and Aburoad blocks. Because of small and marginal land holding farmers in Aburoad and Bali mostly uses Ox based ploughing (26.2%), whereas farmers of Baitu, Sankara, Baap and Sanchor are mechanized using tractor for ploughing (65.5%). Rest uses camels or a combination of these. Though low in number, people are now introducing high yield and hybrid seeds of crops and vegetables more resilient to drought and heat stress and increase irrigation facilities help enhance the productivity.
Family size and number of livestock per HHs have been observed low in Sanchor that increased to highest (11.5 persons and 11.0 animals per HHs) in Sankara block against the region average of 5.6 and 4.3, respectively. Majority of HHs have 2-4 animals, whereas percentage of HHs with >10 animals limited to 5% dominated by cow (22.1%) and goat (63.5%). Goat and sheep dominated in Baitu, Sankara, Baap and Aburoad regions whereas buffalo increased in Sanchor, Aburoad and Bali blocks.
Per month earning of almost 80% HHs was less than Rs 500/ from different sources including 21% respondent without any source of income. The earning of Rs 500 to 1000, Rs 10000 to 20000 and Rs >20000 per month was of 8%, 3% and 3% HHs, respectively. Unskilled daily labour is the main source of income in these villages as >85% respondents engaged in MNREGA (81% ranging 77% in Sanchor to 88% in Bali block) and MPOWER programme (4% respondents). Though a large percentage of people practice agriculture, but the relative cash flow is relatively low. Livestock accounts for a substantially larger share of the total asset value as well as gross farm income in the villages. However, milk productivity is relatively low and has insignificant contribution in income. For example, above 95% respondents do not consider milk as source of income, whereas income through milk selling ranging between Rs 1000/ and >10000/ per month limited to 3.3% HHs. Other sources of income limited to about 10% that

__________________________________________________________________________________________________________________________
nwjHkk"k/Phones:(0291) 2722549 (O), 2000623 (R),QSDl/ Fax: (0291) 2722764 / bZ esy/ E mail: [email protected]
includes animal husbandry, business, government service, private work job and alternative livelihoods.
Fuelwood, cow dung and crop residue are main sources energy for cooking. About 56.9% HHs use both cow-dung and fuel wood (37% in Baitu to 85% in Bali block), 18.4% solely fuel wood, 0.6% LPG, 8.5% HHs a combination of fuel wood, kerosene, cow dung and LPG, 0.1% HHs kerosene and 8.1% a combination of cow dung, fuel wood and kerosene. Traditional Chulha is main device used by 76.2% HHs for cooking food, followed by a mix of Chulha and Kerosene stove, and Chulha and LPG stoves by 9.2% HHs.
Agriculture land is main source of fuelwood collection (33% HHs), followed by common lands by 16% HHs and from forests and other commons by 40% HHs. Less than 5% HHs depends solely of forests, Gauchar, Oran or on purchase of fuel wood. For grazing and fodder collection, a combination of all land uses are used by 44.8% HHs though depends mainly on forests. People of Baitu, Sankara and Baap block observed most dependent on agriculture land for this. About 9.8% HHs used to purchase fodder for their livestock.
People perceptions About 52% respondents did not seem to have any idea about the functioning of Self Help Groups in the villages, whereas 31% respondents did not aware about the MPOWER works. A significant number of respondents observed hesitant to comment about the programme activity. Out of 49%, about 23% respondents rated the activities of MPOWER ‘good’, 8% respondents rated ‘very good’ and other rated them average or not up to mark.
People preference to best practice varied among the blocks, though 48% respondent unable to rank different practices adopted. Preferred activities across the blocks were: monthly saving (25.5% HHs), revolving fund (12.1%), distribution of climate resilient seeds of crop (3.8% HHs), vegetable (3.0% HHs) and sewing machine training (2.8% HHs). Other region specific best practices are construction of Tanka in Sanakara, goat shed in Sanchor, Aburoad and Bali block, and polyhouse and vermi-pits, Saran distributaries and solar lights in Bali block. Development of bank linkages observed least preferred activity.
Highest number of respondent were in need of promoting cottage industry for increased employment followed by requirement of increasing water availability - the main problems the region is facing. Toilets, medical and education facilities are expectation of the people of the regions. May be due to lack of income sources not less than 10% respondents were in view of free distribution of fodder, sheep/goat and fruit plants for increased income and resilient to better adaptation.

__________________________________________________________________________________________________________________________
nwjHkk"k/Phones:(0291) 2722549 (O), 2000623 (R),QSDl/ Fax: (0291) 2722764 / bZ esy/ E mail: [email protected]
Climate Change mitigation Despite of increased communications about 34% respondents were less aware about the global warming and climate change (CC). People perceptions about climate variability were increased temperatures increased and fluctuation in rainfall pattern and thus drought and deforestation as the responsible factor.
Strategies to mitigate climate change in the MPOWER programme are reducing atmospheric carbon dioxide by increasing soil carbon storage though plantation of distributed seedlings of horticultural species and addition of organic manure to farmlands etc. Mitigation was also by reducing emission by shifting towards use of kerosene stoves, LPG, solar light, improved Chulha etc and reduction in use of dung, fuelwood and crop residue burning in the region.
SOC stock in 0-30 cm soil layer varied in order Baitu<Sankara<Baap<Sanchor<Bali <Aburoad ranging from 2.66 tons ha-1 Baitu to 16.33 tons ha-1 in Aburoad because of varying rainfall and soil type. The order of land uses for it was Roadside (6.17 tons ha-1) <Oran<gauchar<agriculture land<Forest<Fallow land (10.08 tons ha-1) because of organic manuring and anthropologic activities. SOC stock was enhanced by increased rainfall and water availability and organic manuring of farmland and decreased by soil loss and increased content of gravel and stone and increased livestock (per HHs) on common lands.
Climate change adaptation About 63.7% respondents followed traditional ways of cultivation and livelihood. Increased availability of tube-well (12.8% HHs), dug wells (2.1% HHs), Saran (2.7% HHs), canal water supply (0.3% HHs) and quality seeds (0.9% HHs) more resilient to climatic variations had motivated people for adaptive agriculture. Alternatively, decreased in water table affecting farm yield (1.1% HHs), to increase HHs income (0.1%), inspiration of MPOWER programme (6.4%) and visual observation on ensured benefits and livelihood activities of other SHGs had motivated people for alternative livelihood and enhancing adaptive capacity. Roof top and surface water harvesting for ensured drinking water, ensured irrigation of agricultural crop through canal and well/tubewell, change in seeds crops and the varieties resilient to water and heat stress, migration to other place and cities for livelihood, growing vegetables as alternative land use, use of sprinkler for efficient water use, animal husbandry, livelihood through sewing machine, planting trees for fruit, vegetable, fodder and fuelwood and use of biofertilizer in enhancing crop and vegetable yield are important activities adapting CC.
__________________________________________________________________________________________________________________________
nwjHkk"k/Phones:(0291) 2722549 (O), 2000623 (R),QSDl/ Fax: (0291) 2722764 / bZ esy/ E mail: [email protected]
Increased water supply for drinking and irrigation and construction of goat and cow shed to intensify livestock production system particularly small stock through improved breed and health care are important activities promoting CC adaptation. Training and distributing 'Bilona' and ‘Sewing’ are skills development that promoted self employment opportunities and resulted in purchase of sewing machine by most of the SHG women adding extra income and improving livelihood. Promotion of vegetable farming and its sailing also help generating income for better resilience and adaptation.
A decrease in fuel wood collection from forest land, guachar and other common lands and increasing dependency on agriculture appears in favour of these common lands. However, deterioration of these common resources might also be responsible for such shifting.
Available employment opportunity and increased alternative sources of income through different programmes has reduced migration from these regions. This indicated by migration of only 3% population to different cities like Jodhpur, Ahmadabad, Surat, Mumbai etc in search of employment and livelihood.
Thus efficient use of water source, managing and restoring community forest, promoting planting of trees and grasses in the farmland, diversifying crops and income generation activities and practices of saving and revolving funds by local people are effective adaptation and drought-proofing measures. There are need to strengthen them for increased fodder, fuel wood and food supply together with carbon sequestration. If re-vegetation is assisted by communities by way of planting and nurturing diverse native species like Prosopis cineraria, Azadirachta indica, Cordia myxa, Ziziphus spp., Punica granatum, Cassia angustifolia etc., they provide multiple benefits and make people more resilience to adapt to climate change. Moreover, each person requires to be made aware about their carbon footprint generated and encouraged to reduce such foot print by reducing emission or sequestering CO2 by involving and promoting degraded land restoration and plantation activities.
(N. K.Vasu)
1
Chapter 1
BACKGROUND CONTEXT OF THE PROJECT
1. INTRODUCTION
Changing climate is increasing the risks, particularly for those who rely on weather patterns,
soils, water, and other natural resources for their livelihoods. The magnitude, timing and
location of these climate impacts are inherently unpredictable. Climate change destabilizes
and degrades many ecosystems that are already threatened by destruction and
overexploitation. Poor people often lack access to alternative services and are highly exposed
to ecosystem changes that result in droughts, floods, and famine. The adverse impacts of
climate change on agriculture will be more predominantly in the tropics and subtropics,
where reduction in yields from rain-fed agriculture could be substantial i.e. by up to 30% by
2050 in Central and South Asia. In India, the loss could be about 18% of its rain-fed cereal
production. Food and fodder scarcity, water scarcity and vulnerability to natural disasters,
and population displacement are all exacerbated by rapid population growth in dry region of
western India. The increasing variability in weather pattern in western part of India could
impose both positive and negative impacts on agricultural sector resulting in the need for
agricultural producers to adapt in order to reduce impacts and even capitalize on new
opportunities. The regions with scarce resources are among the very vulnerable systems of
the earth and most of such regions have extreme climatic conditions like deserts and snow
covered areas. The vulnerability of arid regions is further accentuated by low levels of socio-
economic development resulting in fast depletion of water resources (Singh and Kumar,
2015).
Though land use and agriculture play an important role in sustaining the health, nourishment
and economy of the growing population, but some land use practices can degrade the quality
of soils, waterways, air and other natural resources at the same time. More than 70% of the
world’s poor are living in rural areas, with land use as a major source of subsistence.
Improving the productivity of land is essential for increasing the incomes and food security
among the rural population (Chitonge, 2013). Moreover, it is also a low cost and rapidly
implementable means of climate change mitigation. Forests, agriculture, pastureland, human
habitations, and various economic activities are different land use types. Agriculture is the
prime one and most important for the survival of the mankind. Common property land

2
resources are pasture land 'gauchar' and natural woodland 'oran'. The 'orans' (Forests of God)
are generally named in honour of village deity or saint and are preserved meticulously on
socio-religious grounds. While gross cropped area, cropping intensity and area under non-
agricultural uses increased significantly in Rajasthan in recent years, the area under pasture,
barren and unculturable land and culturable wasteland has declined (GoR, 2012). The
community pasture, Orans etc are becoming overcrowded by increased livestock population,
whereas the productivity of forests and agriculture are at decline. Even the marginal lands of
western Rajasthan are put under cultivation of different cash crops like Arachis hypogea
(moongfali), Ricinus communis (Castor), Capsicum annuum (Mirchi), Plantago ovata
(Isabgol), Cuminum cymium (Zeera) etc (Singh et al., 2008; Jain, 2014). All these land use
practices are influencing biological diversity and carbon storage.
Evidences show that conversion of agricultural land is a serious issue in India as net sown
area in the country declined by about 1.8 million hectares though it has increased in some
states, i.e. about 20 lakh ha in Rajasthan and 9.5 lakh ha in Gujarat during 1991-92 to 2011-
12. In contrast, Odisha lost over 17 lakh ha net sown area, whereas the losses in Bihar
(including Jharkhand), Maharashtra, Tamil Nadu, Karnataka, Andhra Pradesh and West
Bengal were 12.4 lakh ha, 7.6 lakh ha, 7.1 lakh ha, 3.1 lakh ha, 2.7 lakh ha and 2.6 lakh ha,
respectively (Sharma, 2015). Area under non-agricultural uses has increased from 21.3
million ha in 1991-92 to 26.3 million ha in 2011-12 and almost in all states (Sharma, 2015).
Further, about 69% of the total area of India falls into dry-lands category, which includes arid
region too. The dry- lands are characterized by scarcity of water resources, which makes these
lands vulnerable to climate change.
In Rajasthan, the cropping intensity has increased by 18.6% (116.6% in 1991-92 to 135.2%
in 2011-12) with increased irrigation intensity by 3.9% during the same period (Sharma,
2015). However, most of the desert districts are not only in low Human Development index
(HDI) but also in low agricultural production. A study on average agricultural production for
major crops during 1995-2010 indicates that Bharatpur, Bundi, Dholpur were high in
productivity, whereas Chittorgarh, Ganaganagar and Alwar districts performed well (Table
1.1). Dungarpur and Baran were growing faster. However, most of the desert districts are
under productive like Bikaner, Churu, Jodhpur, Jaisalmer and Barmer, which remained less
productive during this period. Jalore has increased its productivity in last five years, whereas

3
Nagaur has been remained less productive district for last 15 years (Singh et al., 2014). The
overall agricultural productivity has enhanced due to technology and other institutional
development in the agriculture and there is an average incremental trend of the productivity.
Table 1.1 Average Productivity of all major crops in All Districts (1990-2010).
District Average Productivity (kg ha-1) Rank Bundi 1843.09 1 Dholpur 1714.44 2 Bharatpur 1637.30 3 Baran 1568.23 4 Chittorgarh* 1507.33 5 Kota 1464.54 6 Alwar 1368.76 7 Rajsamand 1365.36 8 Ganganagar* 3 1339.84 9 Udaipur 1294.39 10 S.Madhopur* 1287.36 11 Dungarpur 1286.62 12 Dausa 1235.23 13 Jhalawar 1223.53 14 Jaipur 1199.99 15 Sirohi 1176.56 16 Banswara 1149.81 17 Bhilwara 1111.48 18 Sikar 901.82 19 Jhunjhunu 864.84 20 Tonk 790.70 21 Pali 668.82 22 Ajmer 665.73 23 Jaisalmer 578.76 24 Jalore 531.83 25 Nagaur 474.26 26 Jodhpur 418.38 27 Bikaner 403.20 28 Churu 340.88 29 Barmer 168.14 30
Source: Singh et al. (2014)
The land use pattern in Rajasthan has changed with development of water resources either
through tub-wells or canal irrigation. Farmers are now opting for crop diversification and
commercial crops like oil producing crop (i.e., musturd) and condiments and spices,
medicinal and narcotic etc., whereas there is a decrease in area under cereal during 1990-91-
2010-11 (Fig 1.1). The decrease in rainfed crops like gram is attributed due to high
variability of rainfall. The central part of the arid region of Rajasthan is more dependent on
4
rainfall for agriculture which makes it highly susceptible towards impact of climate change.
The rate of growth in gross cropped area, total agricultural production and yield during 2002-
2007 has dramatically increased at 12.98%, 20.43% and 6.60% per annum respectively
(Swain et al., 2012). However, there is much difference in productivity of the desert and non
desert districts of Rajasthan and so the vulnerability, which is increased by regions
demography, as arid regions of Rajasthan have the highest density of population compared to
other arid regions of the world at the same latitude (Singh and Kumar, 2014).
Fig 1.1. Change in cropping pattern (total crop) in Rajasthan during 1990-91 to 2010-11. Area is in 1000 ha.
The climate variability has direct link with water resources, whereas low to medium rainfall,
high evapo-transpiration demands for water, high frequency of droughts resulting from the
departure of rainfall from the mean values, and the high per capita arable land increases the
demand for irrigation water (Singh and Kumar, 2015). Free power in agriculture and the
existing pump horse power based pricing of electricity encourage over-pumping and
inefficient and often wasteful use of groundwater, though advent of Indira Gandhi Canal in
western Rajasthan helps the region to cope with high variability in rainfall. The average
temperature of western Rajasthan has increased marginally by 0.45°C in the last 30 years
along with a high variability in rainfall making the region more vulnerable in terms of all the
scarcities (Rathore, 2005). Thus vulnerability to climate change of dry regions differs
according to income and technology available in the region. Accessibility of local population
to natural resources determines the capability to cope with climate change. Though climate
change mitigation measures are important, but it will be more appropriate to implement them
along with measures to enhance adaptive capacity. For this, adoption of conservation

5
agriculture, varying crop management practices and suitable crop varieties, diversification of
income generation activities and application of conservation measures like traditional water
harvesting and tillage techniques are best-suited solutions to intensify crop production,
sustain the rural livelihoods and help control desertification and adapt to climatic changes.
2. PROJECT BACKGROUND
Mitigating Poverty in Western Rajasthan (MPOWER) is one programme under
implementation in six blocks one each in Jaisalmer, Barmer, Jodhpur, Pali, Jalore and Sirohi
districts of western Rajasthan for mitigation of poverty of the target groups households
through strengthened capacity, improved livelihood, sustainable enterprises, natural
resources management and increased access to credit and markets. The purpose of this
programme was to support the provision of sustainable livelihood options for the target group
by providing opportunities of increasing cash income through a coordinated set of actions
that is initially built on the available resources, minimize the risks that beneficiaries are
facing in their lives. Besides, increasing the incomes through the development of marketing
organization and linkages for produce and improve productivity through transfer of
technology and creating institutional environment for savings, group lending and credit for
micro-enterprises. The supports activities includes: building grass-roots institutions,
promoting and securing access of marginalized groups to resources, and promoting the
diversification of on-farm and off- farm livelihood opportunities. The basic objectives of this
project are:
(i) To secure and enhance the present livelihoods and copping strategies by
mitigating risk; (ii) To promote income and employment enhancing opportunities by building
capacities, providing financial services and establishing partnership with private sector for securing better market access; and
(iii) To promote inclusion by empowering and organizing the target households into SHG’s, marketing groups/producers companies, and village development committees.
The project targets poor households headed by landless agricultural laborers and small and
marginal farmers, owners of marginal land or wastelands, traditional artisans, women, and
young people who are without the skills and need to become employed. The project was
designed to ensure empowerment of the poorest people. Although most of those who will

6
benefit from it are living under the poverty line, activities will also include some other people
who are not quite so poor but are eligible for support.
3. OBJECTIVES OF THE STUDY
To have a practical knowledge and the impact of activities carried out under MPOWER
programme on people livelihood, development of resilience and adaptation towards climatic
abrasions among the people of the project areas this project "Studies on the effects of
MPOWER programme on mitigation and adaptation towards Climate Change in western
Rajasthan" was taken up with following objectives so that best methods for improving people
livelihoods and strategy of climate change adaptation (Venkateswarlu, 2010) could be
replicated further in other areas:
To identify best practice in terms of enhanced livelihood and adaptations among the
villagers of the selected villages in western Rajasthan;
To identify best practice supporting mitigation (i.e., carbon sequestration in soil)
option of climate change in these villages;
Document and suggest best practices of MPOWER in terms of climate change
mitigation and adaptation for its further replication in large scale.
4. ROLES OF NGO'S IN THE PROJECT
Innovation in the project is bringing the NGOs to play a central role in creating awareness,
linking self help groups (SHGs) with banks for availing credit and providing the services of
village facilitators for handholding the SHGs. Further, uniqueness in the project is its attempt
to develop the SHGs into enterprises and marketing groups, making markets work for the
target groups and the poor, supporting specific, shorter value chains for ensuring better farm
gate prices to the producers, ensuring equity, gender mainstreaming and preparing
convergence plans at the village level involving different beneficiaries.
Livestock related activities are an important component of livelihoods in western Rajasthan.
Many NGOs are working in goat improvement, pasture development and animal health/para-
vet training, whereas other types of intervention include cattle breed improvement and dairy
projects for women. For example, BAIF Development foundation is working on cross
breeding programme in the state able to promote high yielding cattle and buffaloes. Para-vet

7
training has been undertaken by many NGOs, and its importance is borne out by the inability
of the Department of Animal Husbandry's animal health services to reach out to rural
livestock owners. Further, project entails the provision (as gift or by partial loan) of dairy
animals, i.e. cows, goats etc as a measure of poverty alleviation, both from the perspective of
the already existing fodder deficit and the actual needs of the beneficiaries. It requires
evaluation carefully whether no other income generating options are available. Rajasthan is
endowed with multiple indigenous knowledge and institutions, however, awareness about its
value and even the existence of these traditional knowledge is lacking among NGO staff.
NGOs put major emphasis on women as main actors in the livestock sector, especially dairy-
related activities. Their limitations in this respect are caused by the difficulty of finding
female staff. The empowerment of women is a slow process, because overcoming centuries-
old traditions requires more than the lifespan of a project. With men migrating to
neighbouring states and areas in search of job, the households tend to be women headed. The
gender framework of agriculture is now changing and in such situations, it is necessary to
have a larger number of women who can play the extension role as part of the project.
Further, this project also covers the needs of the nomadic pastoralist population though the
NGO-network. Thus project proposed that local NGOs go through a rigorous capacity
building phase so that the people could be trained on the crucial elements of livestock
development in the region and get benefits arise out of it.
5. DELINEATION OF STUDY AREA
Rajasthan is the country’s largest state covering about 10.4 % of the total geographical area
of the country. It lies between latitudes 23º 3' and 30º 12' North and longitudes 69º 30' N and
78º 17' E covering about 3, 42,239 sq km area (Table 1.2). The western arid region, the major
part of Thar Desert, includes 12 districts i.e. Sriganganagar, Hanumangarh, Churu, Sikar,
Jhunjhunu, Nagaur, Bikaner, Jodhpur, Barmer, Jalore, Pali and Jaisalmer. The district Sirohi
bordering Jalore and Pali falls in semi arid region.
5.1 Physiography of the region
The main physiographic feature of Rajasthan is the Aravalli Range, which runs across the
state from southwest (Mount Abu) with peak height of 1,722 m to Khetri in Jhunjhunu
district situated in the northeast running for almost more than 850 km. This range divides

8
Rajasthan into 60% in the North West of the lines and 40% in the southeast. The northwest
tract is sandy and unproductive with little water. It is a wide expanse of poorly watered,
sterile and wind-blown sand. The general aspect of this region is of an interminable sea of
sand and sand dunes of different shapes and sizes varying from 6 to 60 meter in height and
being sometimes 3–5 km in length, particularly in case of linear dunes (Fig 1.2).
Table 1.2. Agroclimatic zone and their distribution in Rajasthan (Source:
http://agropedia.iitk.ac.in/content/agro-climatic-zone-rajasthan).
SNo Agro-climatic Zones
Rainfall (mm) range
Districts
1 IA-Arid Western plain 200-370 Barmer, Jodhpur 2 IB-Irrigated North Western plain 100-350 Sriganganagar, Hanumangarh 3 IC-Hyper-arid partly Irrigated
Zone 100-350 Bikaner, Jaisalmer, Churu
4 IIA-Internal Drainage Dry Zone 300-500 Nagaur, Sikar, Jhunjhunu 5 IIB-Transitional Plain of Luni Basin 300-500 Jalore, Pali, Sirohi 6 IIIA-Semi arid Eastern Plain 500-700 Jaipur, Ajmer, Dausa, Tonk 7 IIIB-Flood Prone Eastern Plain 500-700 Alwar, Dholpur, Bharatpur,
Karauli and S. Madhopur 8 IVA-Sub humid Southern Plain 500-900 Bhilwara, Rajsamand,
Chittorgarh 9 IVB-Humid Southern plain 500-1100 Dungarpur, Udaipur,
Banswara and Pratapgarh 10 V-Humid Southern Eastern Plain 650-1000 Bundi, Kota, Baran, Jhalawar
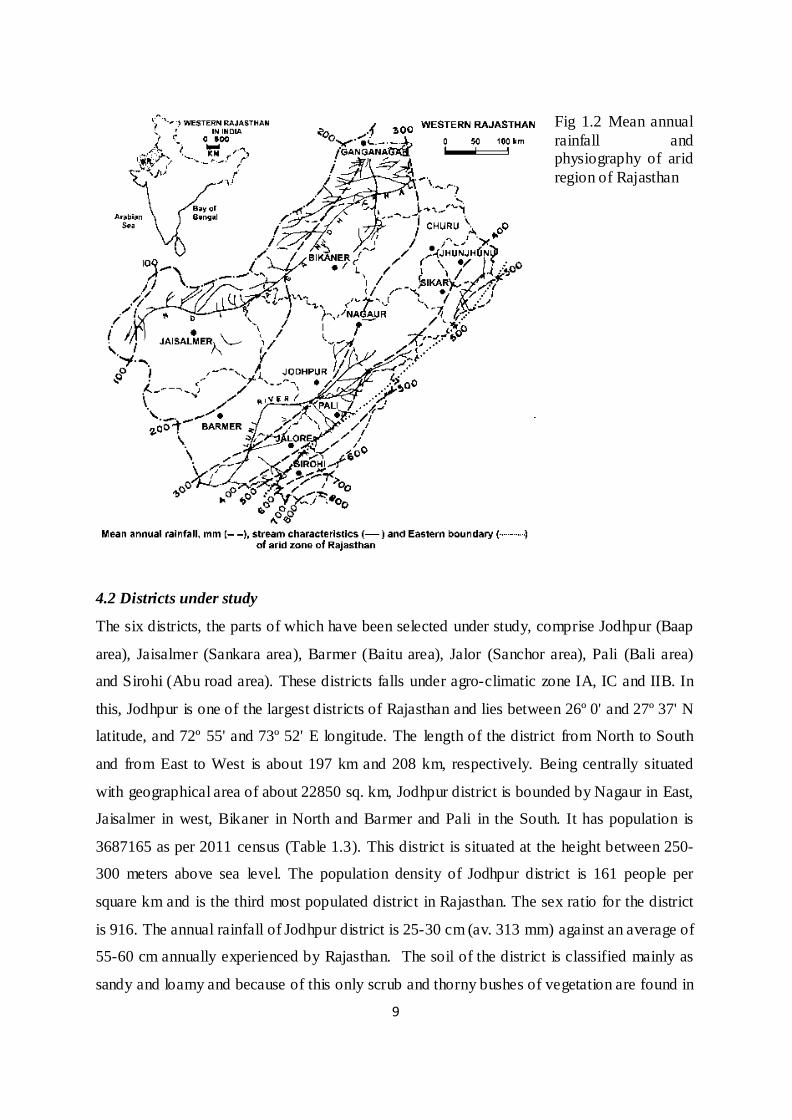
The south-eastern region is drained by Luni in its south-eastern portion. Availability of gully
of varying size and shapes has given rise to conglomerate landscape. The land is slightly
undulating within venue of sand deposited by inland drainage and stream with salt lakes.
Most of the region faces extremity of the climate and where rainfall varies from 100 mm in
Jaisalmer region to 800 mm annually in Sirohi district (i.e., Mt Abu area). However,
commencement of IGNP has increased the water availability in north-western part of this
region (Fig 1.2). Because of its location in the western part of India and varying topography,
Rajasthan exhibits varying climate. For example, the rocky Aravali, the western arid plains,
the eastern fertile plains etc experiences different climatic conditions. The weather pattern in
the state can be divided into pre-monsoon, monsoon, post-Monsoon and winter. Pre-
monsoon is summer and the most parched and hot season of the year and is actually the hot
season that precedes the monsoon and extends from April to June.
9
Fig 1.2 Mean annual rainfall and physiography of arid region of Rajasthan
4.2 Districts under study
The six districts, the parts of which have been selected under study, comprise Jodhpur (Baap
area), Jaisalmer (Sankara area), Barmer (Baitu area), Jalor (Sanchor area), Pali (Bali area)
and Sirohi (Abu road area). These districts falls under agro-climatic zone IA, IC and IIB. In
this, Jodhpur is one of the largest districts of Rajasthan and lies between 26º 0' and 27º 37' N
latitude, and 72º 55' and 73º 52' E longitude. The length of the district from North to South
and from East to West is about 197 km and 208 km, respectively. Being centrally situated
with geographical area of about 22850 sq. km, Jodhpur district is bounded by Nagaur in East,
Jaisalmer in west, Bikaner in North and Barmer and Pali in the South. It has population is
3687165 as per 2011 census (Table 1.3). This district is situated at the height between 250-
300 meters above sea level. The population density of Jodhpur district is 161 people per
square km and is the third most populated district in Rajasthan. The sex ratio for the district
is 916. The annual rainfall of Jodhpur district is 25-30 cm (av. 313 mm) against an average of
55-60 cm annually experienced by Rajasthan. The soil of the district is classified mainly as
sandy and loamy and because of this only scrub and thorny bushes of vegetation are found in

10
the forest areas of the district.
Jaisalmer is the largest district located within a rectangle lying between 26° 04’ to 28° 23' N
latitude and 69°20' to 72°42' E longitude and covers about 38,401 sq. km area. It is bounded
on the northeast by Bikaner, on the east by Jodhpur, on the south by Barmer, and on the west
and north by Pakistan. The area is barren, undulating with its famous sand dunes and slopes
towards the Indus valley and the Runn of Kutch. The area is an interminable sea of sand hills,
of all shapes and sizes, some rising to a height of 40-50 m. Those in the west are covered
with log bushes, those in the east with tufts of long grass. Water is scarce and generally
brackish. The region is drained by very scanty rainfall during the monsoon season, i.e. 18.55
cm annual. The maximum day temperature rises over 47 Cº during summer and deep down
<0 ºC at night during winter. According to census 2011, total population and population
density of Jaisalmer are 672008 individuals and 17 persons per sq. km, respectively (Table
1.2). There are 821 female per 1000 male in the district (Table 1.3).
District Barmer is located in the western part of Rajasthan and is surrounded by Jaisalmer in
the North, Jalore in the south, Pali and Jodhpur in the east and Pakistan in the south. The
district is located between 24º 58' to 26º 32'N Latitudes and 70º 05' to 72º 52' E Longitudes
covering an area of about 28,387 square km. The district is characterized by low rainfall with
erratic distribution, resulting in droughts and crop failures. Baitu is situated at a distance of
40 km from the district headquarters. The longest river in the district is the Luni, which is
480 km in length and drain into the Gulf of Kutch passing through Jalor district. The
variation in temperature in various seasons is quite high. In summers the temperature soars to
46 ºC to 51º C. In winters it drops to 0 ºC. Barmer district is a desert where average rainfall
in a year is about 27.0 cm. Barmer district is generally desert type intermingle with sand
dunes, where soil is aeolian, coarse sand in texture, but calcareous at some places. The soils
of Barmer soil are graded as very low to medium level. Total population of the district is
2604453 with population density of 92 persons per sq. km according to 2011 census (Table
1.3). However, number of female per 1000 male is lowest (812 female) in the selected six
districts.
Jalore district is surrounded by Barmer on the North-West, Sirohi on the South-East, Pali on
the North-East and Banaskantha district of Gujarat on the South-Western part of Rajasthan. It
11
is situated between 24.48º 5' and 25.48º 37' N latitude and 71º 07' and 75.5º 53' E longitude.
It covers about 10,640 sq km area with altitude ranging from 175 to 190 meters above sea
level. The daily as well as the annual temperature of the region is quite high. The annual
average rainfall of Jalore is 37-40 cm. The coldest month in Jalore district is January. During
this time the temperature dips to around 1-2 ºC, whereas June is the hottest month of the year
during when the temperature rises to as high as 41-42 ºC. Sometimes the temperature may be
as high as 48 ºC. Jalore has huge deposits of old as well as new alluvial soils. The main river
of the region is Sukri which is a tributary of Luni river. It has total population of 1830151
people with population density of 172 persons per sq. km according to 2011 census (Table
1.3). Number female per 1000 male is 964 in Jalor.
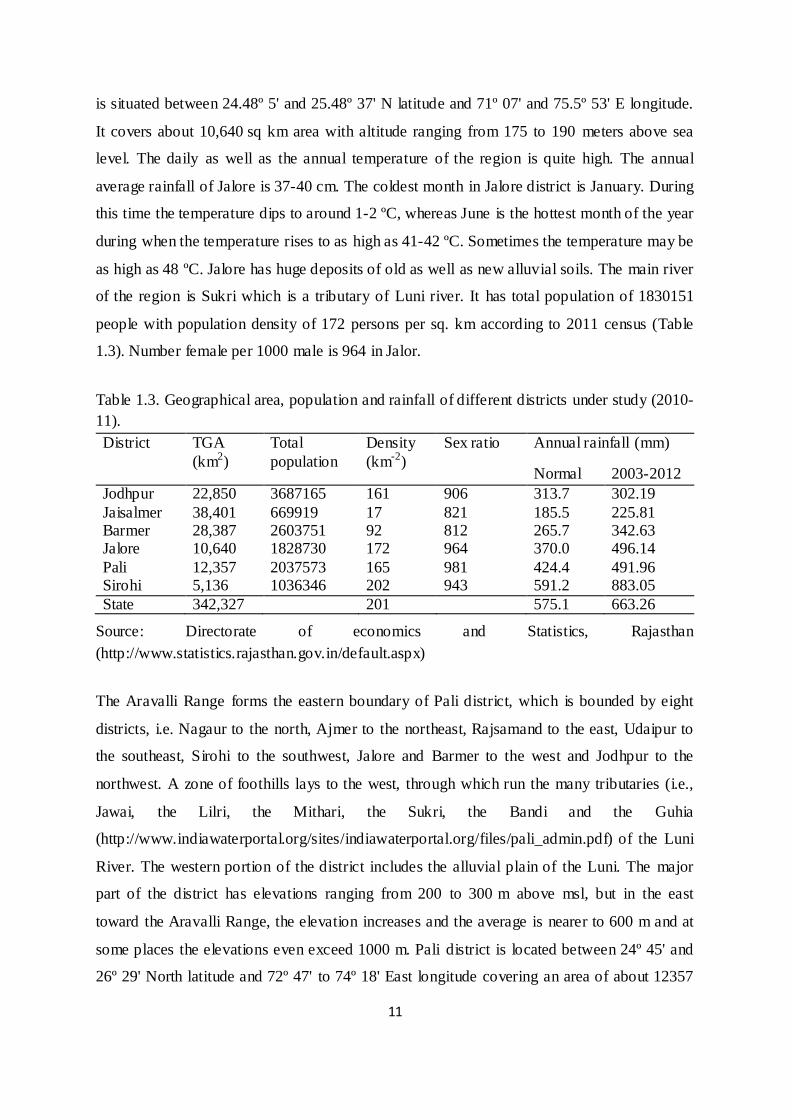
Table 1.3. Geographical area, population and rainfall of different districts under study (2010-11). District TGA
(km2) Total population
Density (km-2)
Sex ratio Annual rainfall (mm)
Normal 2003-2012 Jodhpur 22,850 3687165 161 906 313.7 302.19 Jaisalmer 38,401 669919 17 821 185.5 225.81 Barmer 28,387 2603751 92 812 265.7 342.63 Jalore 10,640 1828730 172 964 370.0 496.14 Pali 12,357 2037573 165 981 424.4 491.96 Sirohi 5,136 1036346 202 943 591.2 883.05 State 342,327 201 575.1 663.26
Source: Directorate of economics and Statistics, Rajasthan (http://www.statistics.rajasthan.gov.in/default.aspx)
The Aravalli Range forms the eastern boundary of Pali district, which is bounded by eight
districts, i.e. Nagaur to the north, Ajmer to the northeast, Rajsamand to the east, Udaipur to
the southeast, Sirohi to the southwest, Jalore and Barmer to the west and Jodhpur to the
northwest. A zone of foothills lays to the west, through which run the many tributaries (i.e.,
Jawai, the Lilri, the Mithari, the Sukri, the Bandi and the Guhia
(http://www.indiawaterportal.org/sites/indiawaterportal.org/files/pali_admin.pdf) of the Luni
River. The western portion of the district includes the alluvial plain of the Luni. The major
part of the district has elevations ranging from 200 to 300 m above msl, but in the east
toward the Aravalli Range, the elevation increases and the average is nearer to 600 m and at
some places the elevations even exceed 1000 m. Pali district is located between 24º 45' and
26º 29' North latitude and 72º 47' to 74º 18' East longitude covering an area of about 12357
12
sq km. Normal annual rainfall in the district ranges between 50 to 60 cms and the average
humidity percentage for the district is nearly 60 to 70. Soils of the district are shallow to deep
and sandy to loam including gravelly silt. Irrigated area covers about 2824.02 km2, which is
about 22.79 percent of the total geographical area of the district. The main source of
irrigation in the district is wells, which constitute seventy-five per cent of total irrigated area
followed by ponds tanks twenty per cent, tube wells 5 per cent. Total population of the
district is 2,038,533 with population density of 165 persons per sq km according to census
2011. Number of female on per 1000 male is 981 (Table 1.3)
The district Sirohi has an area of 5136 km² bordering west by Jalore District, on the north by
Pali District, on the east by Udaipur District, and on the south by Banaskantha district of
Gujarat. It is situated at the south-west part of Rajasthan between parallel of 24º 20' and 25º
17' North latitude and between 72º 16' and 73º 10' East longitude. Sirohi district is broken up
by hills and rocky ranges and the station Abu Road lies in the valley of the West Banas. The
southwest corner of the district is drained by the Sukri river, an intermittent stream that
drains the western slope of Mt Abu. The northwestern portion of the district is drained by
tributaries of the Luni River. The average annual Temperature ranges between 35-48 °C.
Summer is hot and humid with an average temperature of 40 Cº with hot sandy winds.
However just before monsoon it becomes hot along with humidity. Winter temperature
ranges from 7 to 14 ºC, which is quite cold as compared to other cities in Rajasthan. Average
annual rainfall is about 40 to 50 cm though reaches up to more than 120 cm in Mt Abu area.
Soils of Sirohi district are yellowish brown in colour, medium to heavy in texture and rich in
nutrients with medium to high fertility status. According to census 2011, population and
population density of Sirohi district area 1037185 and 202 persons per sq. km, respectively.
Female to male ratio in district is 943 (Table 1.3).
4.3 Climatic conditions in western Rajasthan
In western Rajasthan temperature has shown a great variability with an average rise of about
0.5°C for the month of June over last 35 years (1973–2008). The maximum rise is visible
during 1995–2000. The scarcity of water resource accompanied by variability creates water
stress conditions in the region and is responsible for droughts. During this period, the average
annual rainfall has shown a decrease of 50 mm (Singh and Kumar, 2015). Long-term trends
(1971-2011) in mean air temperature carried out by Poonia and Rao (2013) indicates that by

13
the end of 21st century, the Thar region will show an increase in temperature by +3.3 ºC at
Bikaner, +3.4 ºC at Jaisalmer, +2.9 ºC at Jodhpur and +2.5 ºC at Pali, if the present rate of
warming continues (Fig 1.3). Jodhpur experienced highest day temperature of 48.3 ºC on 8th
June 2011 and warmest winter in 2008- 2009 surpassing all past 50 years of extreme hot
summer and warm winters in the region.
Fig 1.3. Long-term trends in annual mean air temperatures and annual rainfall in Thar
region of Rajasthan. Source: Poonia and Rao (2013).
Rainfall is very low, highly erratic and variable throughout the Rajasthan plain. Mean Annual
Rainfall is from 100 mm to 400 mm on eastern edge of Indo-Pak border (Rao and Purohit,
2009). Rainfall decreases from East to West and from South West to North East. The average
annual rainfall in western part of Aravalli ranges from less than 100 mm in north-west part of
Jaisalmer to 200-300 mm in Ganganagar, Bikaner and Barmer regions, 300-400 mm in
Nagaur, Jodhpur, Churu and Jalore regions and more than 400 mm in Sikar, Jhunjhunu and
Pali regions and along the western fringes of the Aravalli range. The coefficient of annual
rainfall varies from 40 in the east to 70% in west of the region, causing larger inter-annual
variability in rainfall influencing crop production. The study of Poonia and Rao (2013)
indicates an overall regional increasing trend (0.56 mm/year, though not significant) in
14
annual rainfall during 1960-2011 for Thar Desert, however, the rainfall trend at different
locations showed that the annual rainfall is likely to increase by +100 mm at Bikaner, +124
mm at Jaisalmer, -40 mm at Jodhpur and +21 mm at Pali (Fig 1.3). Thus, the projected
rainfall is likely to increase from 252 mm to 308 mm at Bikaner, from 176 mm to 234 mm at
Jaisalmer and from 487 mm to 613 mm at Pali, whereas, in Jodhpur the rainfall is likely to be
decreased from 325 mm to 275 mm.
Drought is a regular phenomenon in arid region of Rajasthan and the most affected
community is Raika – whose livelihood depends mostly on animal husbandry (Box 1). The
Thar region experienced severe drought during 1918, 1987, 2002 and 2009, when rainfall
departure from the normal was -81, -65 and -70 per cent, respectively. In 2009, a rainfall
deficiency of 40% from its normal rainfall value caused drought affecting desert fauna due to
scarcity for feed and drinking water. Drought followed by high temperatures touching 45-49
ºC during late summer period of June, 2010 resulted in causality of Chinkaras and Black
bucks in Barmer, Churu and Jodhpur districts of Thar region. According to a classification
given by Ramana Rao et al. (1981), the frequency of agricultural drought in arid Rajasthan
was studied for 109 years (1901-2011). During this period, the region experienced
agricultural drought in one part or the other in 54 to 62 years, which suggest drought occurs
in the region once in three years to alternate year. Jaisalmer district is most prone to drought.
During 1901-2011, the agricultural drought in the region occurred in 70% of the years, out of
which drought in 44% years was of severe in nature and in 29% year it was moderate, thus
affecting crop and fodder production considerably.
Box 1.1 Raikas live in Desert of Rajasthan and generally categorized into two groups, i.e. Maru, who rear camels, and Raikas, who rear goat and sheep. Because of climatic uncertainty, Raikas combines agriculture with pastoralism. During a discussion with a Raikas family in village Daljitnagar in Luni Tehsil of Jodhpur district, 7 drought years of varying kinds are observed in average 10 years according to Shri Chunnilal Devasi, the family head. His family hosts about 150 goats, 200 sheeps, 4 cows, 4 buffallows and 2 camels and this is main stack of livelihood. Production during the 3 good rainfall years meets the family's requirements for about 5 years, whereas for rest of the years (during which the agriculture produce reduced to almost nil to 20%), these (Raika families) depend upon the produce obtained from animals and the work performed in the form of labour. These families stayed in their villages during monsoon period, but as soon as the nearby grazing grounds are dry or exhausted (by October month) they use to move out in search of other pasture and water. The movements
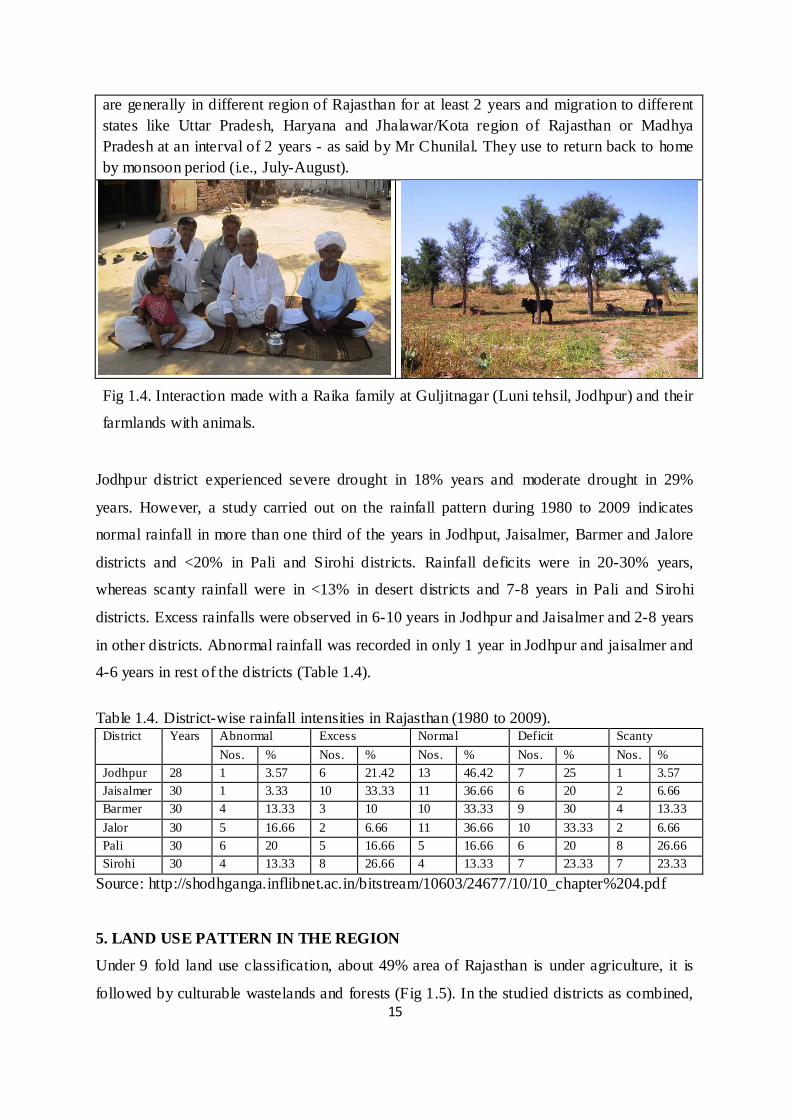
15
are generally in different region of Rajasthan for at least 2 years and migration to different states like Uttar Pradesh, Haryana and Jhalawar/Kota region of Rajasthan or Madhya Pradesh at an interval of 2 years - as said by Mr Chunilal. They use to return back to home by monsoon period (i.e., July-August).
Fig 1.4. Interaction made with a Raika family at Guljitnagar (Luni tehsil, Jodhpur) and their
farmlands with animals.
Jodhpur district experienced severe drought in 18% years and moderate drought in 29%
years. However, a study carried out on the rainfall pattern during 1980 to 2009 indicates
normal rainfall in more than one third of the years in Jodhput, Jaisalmer, Barmer and Jalore
districts and <20% in Pali and Sirohi districts. Rainfall deficits were in 20-30% years,
whereas scanty rainfall were in <13% in desert districts and 7-8 years in Pali and Sirohi
districts. Excess rainfalls were observed in 6-10 years in Jodhpur and Jaisalmer and 2-8 years
in other districts. Abnormal rainfall was recorded in only 1 year in Jodhpur and jaisalmer and
4-6 years in rest of the districts (Table 1.4).
Table 1.4. District-wise rainfall intensities in Rajasthan (1980 to 2009).
District Years Abnormal Excess Normal Deficit Scanty Nos. % Nos. % Nos. % Nos. % Nos. %
Jodhpur 28 1 3.57 6 21.42 13 46.42 7 25 1 3.57 Jaisalmer 30 1 3.33 10 33.33 11 36.66 6 20 2 6.66 Barmer 30 4 13.33 3 10 10 33.33 9 30 4 13.33 Jalor 30 5 16.66 2 6.66 11 36.66 10 33.33 2 6.66 Pali 30 6 20 5 16.66 5 16.66 6 20 8 26.66 Sirohi 30 4 13.33 8 26.66 4 13.33 7 23.33 7 23.33
Source: http://shodhganga.inflibnet.ac.in/bitstream/10603/24677/10/10_chapter%204.pdf
5. LAND USE PATTERN IN THE REGION
Under 9 fold land use classification, about 49% area of Rajasthan is under agriculture, it is
followed by culturable wastelands and forests (Fig 1.5). In the studied districts as combined,

16
42% area is under agriculture followed by 23% under culturable wastelands. Fallow lands
other than current follows and current fallow are covered about 8% each. These are followed
by Barren and unculturable land (7%) and area under pasture and grazing lands (5%). Area
under forests is about 3.8% in these districts.
Fig 1.5. Land use pattern in Rajasthan (left) and the studied districts (right).
5.1 Forest area
Forests are an important part of any ecosystem and contribute by providing humans with
food, fodder and fuel and by enriching and aiding the nutrients to the ecosystem too. In
Rajasthan, coverage of forests is 9.54% of total geographic area as compared to the country’s
average of 20.6%. In the studied six districts, coverage of forests is about 2.98% ranging
from 0.31% in Jodhpur to 30.02% in Sirohi district as compared to the total area of the
studied district (Table 1.5).
4.2 Area under non-agriculture uses
This category belongs to the land put to non-agriculture uses such as residential, roads/paths,
water bodies etc. The share of such land use ranges between 3.56% in Jodhpur and 6.58% in
Jaisalmer with an average value of 4.53 in the studied districts as compared to about 6% in
Rajasthan.
4.3 Barren and Un-culturable Land
This category of land is considered as non-suitable for agricultural operation. About 7% of
the total area of Rajasthan is categorized as barren and un-cultural waste land. In the studied
districts, this category covers about 7% of the total area varying from 6.43% in Jodhpur to
8%6%
7%
5%0%
13%
6%6%
49%
Area x106 haForest
Non agricultural uses
Barren and un-culturable landPastures and grazing land
Trees crops and groves
Culturable waste land
Other fallow lands
Current fallow
Net area sown
3%4%
7%
5% 0%
23%
8%8%
42%
Area x103 ha

17
14% in Sirohi district.
Table 1.5. Different land uses in Rajasthan and the selected districts during 2009-10. SN Land Use
Classification Raj. Districts (area × 1000 ha) (m ha) Jodhpur Jaisalmer Barmer Jalore Pali Sirohi Total
i Areas under forest 2.74 7.25 44.89 32.47 22.61 86.54 155.47 349.23 ii Area under non
agricultural uses 1.98 80.25 252.59 73.55 40.94 58.49 25.44 531.26
iii Barren and un-culturable land
2.29 145.12 254.68 124.78 81.82 139.37 74.55 820.32
iv Permanent pastures and other grazing land
1.70 121.93 103.50 202.49 47.43 91.13 33.24 599.72
v Miscellaneous trees crops and groves
0.02 0.09 0.47 0.04 0.02 0.24 0.07 0.93
vi Culturable waste land
4.48 13.74 2430.05 195.99 34.86 43.52 10.80 2728.96
vii Fallow lands other than current fallows
2.05 277.55 102.17 278.62 92.51 118.87 41.92 911.64
viii Current fallow 2.06 354.00 104.07 208.01 84.83 94.27 38.71 883.89 ix Net area sown 16.97 1256.48 546.74 1701.79 651.59 600.65 137.36 4894.61 - Area with double
crop 145.47 79.48 118.19 172.87 29.23 33.46 578.7
Total reported area for land utilization
34.28 2256.41 3839.15 2817.33 1056.60 1233.08 517.95 11720.52
Source: GoR (2012).
4.4 Grazing Lands
This is one of the most important categories of land use. The availability of permanent
pasture and grazing land determines the status of livestock economy in the regions. It
constituted about 5.12% (ranging from 2.7% in Jaisalmer to 7.39% in Pali district) of the
total area in these districts as compared to 5% in the State.
4.5 Land under Misc. Tree Crops and Groves
Area under fruit crop falls under this category of land use. In Rajasthan, it is less than 1% and
in the studied districts, it covers almost negligible area.
4.6 Culturable Waste Land: This is also one of the major categories of land use covering
about 13% of the total reported area of Rajasthan. Agriculture operations are possible on
these lands. About 23.3% area covers under this land use in the studied districts, where is
ranges between 0.61% in Jodhpur and 63.3% in Jaisalmer districts.
18
4.7 Fallow land
There are two types of fallow land, i.e. current fallow and long fallow (fallows other than
current fallows). Lands with suspended agriculture operation for one to five years fall under
this category. At the state level, these land uses cover about 6% area each in Rajasthan. In the
studied districts, these cover about 7.78% (ranging between 2.66% in Jaisalmer and 12.3% in
Jodhpur districts) and 7.54% (ranges from 2.71% in Jasisalmer to 8.03% in Jalor district),
respectively.
4.8 Agriculture
About half (49%) of the total reported area of Rajasthan is under agriculture operation. The
irrigated northern-western region and internal drainage dry zones leading ahead as compared
to other zones in bringing larger proportion of area under agriculture that depends upon the
availability and access to irrigation facilities, status of aquifer and geophysical features of the
regions. In the studied area, net sown area is about 41.8% ranging between 14.3% in
Jaisalmer and 61.7% in Jalore. The area sown twice in a year ranges from 2.1% in Jaisalmer
to 16.4% in Jalore with an average value of 4.94% in the studied region.
4.9 Irrigation area in the districts
Irrigated area in these districts ranged between 9.19% in Barmer to 48.83% in Sirohi district.
Total irrigated area in Jodhpur, Jaisalmer, Jalore and Pali districts are 19.37%, 13.96%,
41.09% and 18.45%, respectively.
5. VEGETATION STATUS
The floristic indicates poor in forest resources in desert districts Jodhpur, Jaisalmer, Barmer
and Jalor, but relatively better vegetation are observed in Pali and Sirohi districts. The sparse
vegetation of desertic district is largely dominated by Israili babul (Acacia tortilis), khezri
(Prosopis cineraria), ker (Capparis decidua), the bushes like Aak (Calotropis procera), Arni
(Clerodendum phlomidides), Murali (Lycium barbarum), and the grasses like Shravan
(Lasiurus sindicus), Dhaman (Cencrus ciliaris) etc (Singh, 2014). However, this vegetation
is utilized both by cattle and men; cattle for their fodder and men for their fuel wood,
thatching material, vegetable, medicines and food. The other plant species observed in arid
areas are: Azadirachta indica, Tecomella undulata, Salvadora persica, S. oleoides, Acacia
nilotica, A. senegal, Bauhinia racemosa, Maytenus emerginatus, Prosopis juliflora, Zizypus

19
rotundifolia, Z. mauritiana, Aerva persica, Calligonum polygonoides, Calotropis procera,
Leptadenia pyrotechnica, Ziziphus nummularia, Aristida adsenceonis, A. funiculata,
Citrullus colocynthis, Crotalaria burhia, Cassia italica, Cenchrus biflorus, Dypterigium
glaucum, Indigofera cordifolia, Tephrosia purpurea, etc (Singh, 2015). In Pali and Sirohi
areas, the dominant species are Azadirachta indica, Acacia leucophloea, A. nilotica, A.
tortilis, A. senegal, Anogeissus pendula, Bauhinia racemosa, Boswellia serrata, Salvadora
persica, S. oleoides, Maytenus emerginatus, Prosopis juliflora, Z. mauritiana, Aerva persica,
Cassia auriculata, Calotropis procera, Leptadenia pyrotechnica, Ziziphus nummularia,
Aristida adsenceonis, A. funiculata, Crotalaria burhia, Indigofera cordifolia, Tephrosia
purpurea, Heteropogon contortus, etc.
6. SOCIOECONOMICS CONDITIONS
Average rural population in these districts is 82.4%, whereas the urban population is about
17.6% ranging from 6.98% in Barmer to 34.30% in Jodhpur. Jaisalmer, Barmer and Jalore
are relatively high in rural population as compared to the other three districts (Table 1.6).
Table 1.6. Socioeconomics data of different districts (2010-11). District Population Sex
ratio Literacy (%)
Workers (%)
Cult ivators (%)
Land holding (ha)
Total Rural Urban % urban
Jodhpur 3687165 2422551 1264614 34.30 906 65.9 40.4 39.8 7.10 Jaisalmer 669919 580894 89025 13.29 821 57.2 43.1 45.9 8.72 Barmer 2603751 2421914 181837 6.98 812 56.5 46.2 62.7 7.98 Jalore 1828730 1676975 151755 8.30 964 54.9 49.0 55.0 4.94 Pali 2037573 1577567 460006 22.58 981 62.4 41.3 28.4 3.56 Sirohi 1036346 827692 208654 20.13 943 55.3 40.5 29.6 2.59 17.6 904.5 58.70 43.42 43.57 5.82
Literacy rate varies from 54.9% in Jalor to 65.9% in Jodhpur, with an average literacy rate of
58.7% in this region. Average land holing ranged between 2.59 ha in Sirohi to 8.72 ha in
Jaisalmer indicating average land holding of 5.82 ha in these six districts. Average
population of the workers ranges from 40.4% in Jodhpur to 49.0% in Jalore, whereas average
number of cultivators ranges between 28.4% in Pali to 62.7% in Barmer. Average percentage
of workers and cultivators across the districts are 43.42 and 43.57, respectively. This
indicates that people of Jaisalmer, Barmer and Jalore are more dependent on cultivation
(agriculture) as compared to the other districts.

20
Human development index (HDI) of these districts is indicated by ranks 9, 11, 21, 29, 28 and
14 for Jodhpur, Jaisalmer, Barmer, Jalor, Pali and Sirohi, respectively among the 33 districts
of Rajasthan, with HDI value in respective district of 0.686, 0.673, 0.578, 0.527, 0.547 and
0.645.

21
Chapter 2 CLIMATE CHANGE ADAPTATION AND MITIGATION
________________________________________________________________________
This chapter deals with literature describing climate change effects on people livelihoods and
offers different options on climate change adaptation and mitigation.
1. INTRODUCTION
Climate change is a long lasting change in the statistical distribution of weather patterns over
periods ranging from decades to millions of years. The earth's climate is dynamic and is
always changing through a natural cycle. However, the changes occurring today appear to be
speeded up because of anthropogenic activities. It is the climate change that the last decade of
the 20th century and the beginning of the 21st have been the warmest period in the entire
global instrumental temperature record (NOAA, 2007). The factors responsible for climate
change can be divided into two categories, i.e. natural and anthropogenic. Natural factors
responsible for climate change include continental drift, volcanoes, earth's tilt, ocean currents
etc. The anthropogenic factors are industrial activities, fossil fuel burning, rapid urbanization;
which are contributing to the rise in greenhouse gases (GHGs) in the atmosphere (Box 2.1).
These GHGs are contributing more than natural factors in increasing our earth’s temperature.
There is the confounding factor of climate change. Land degradation also contributes to
climate change, as degraded land has less ability to sequester carbon (Grainger et al., 2009).
Further, land use changes and land degradation make up a significant portion, i.e. as much as
20% of worldwide greenhouse gas emissions, with forest clearing and forest degradation
creating most of these emissions and drylands contributing to about 4% (IPCC, 2014). Thus
both climate change and land degradation create a detrimental positive feedback loop, as
climate change contributes to land degradation, which releases further carbon, which in turn
contributes to land degradation further (Herrman and Hutchinson, 2005). Most of the
countries globally are affected by climate change and are affected in different ways and to a
different extent. The developing countries like India and others are badly stroked because of
geographical situation (non-temperate latitudes) and strong dependence on agriculture with
their fewer resources (Stern, 2006).
Climate change increases the possibility that existing societies will experience climatic shifts
like that in temperature, storm frequency, flooding and other factors, for which the previous

22
experience had not prepared. However, some results suggest that the subjective experience of
local climate change is dependent not only on external climate conditions, but also on
individual believes, with perceptions apparently biased by prior believes about global
warming (Howe and Leiserowitz, 2013). Studies indicate that global climate change
increases the frequency and intensity of climate-related disasters like floods, fires, and
droughts, and causes ecosystem degradation (UNEP, 2009). This in turn reduces the
resilience of ecosystems and human societies against the impacts of climate change and the
increased risk of disasters (McCarthy et al., 2001). Ecosystem degradation compromises the
carbon sequestration ability of natural systems, and may turn these systems from carbon
sinks to sources, thus exacerbating the downward spiral. Rural areas are highly vulnerable to
climate change, since people there depend heavily on natural resources such as local water
supplies and agricultural land. In fact, about 70 % of the population in developing countries
lives in rural areas, where agriculture is the main source of livelihood.
Box 2.1
Carbon dioxide (77% including 57% from fossil fuel use, 17% through deforestation and biomass decay etc and 3% from other sources), nitrous oxide (8%), and methane (14%) are the main greenhouse gases (GHGs) that trap infrared radiation and contribute to climate change. Land use changes contribute to the release of these GHGs. Of the total annual human-induced GHGs emissions in 2004 (49 billion tons of CO2 equivalent), roughly 31% (i.e., 15 billion tons) was from land use. By comparison, fossil fuel burning accounts for about 27.7 billion tons of CO2-equivalent emissions annually. Two ways by which deforestation and de-vegetation release carbon are (i) decay of the plant matter itself that releases carbon dioxide, and (ii) soil exposed to wind and rain is more prone to erosion. Land uses like agriculture and grazing exacerbate soil erosion and exposure. While atmosphere oxidizes the soil carbon releasing more CO2 into the atmosphere, application of nitrogenous fertilizers leads to soils releasing NOx. Methane is released from the rumens of livestock such as cattle, goats, and sheep when they eat and from manure and water-logged rice plantations as well. Fires in forests and grasslands also contribute to GHGs. In the ElNiño year of 1997–98, fires accounted for about 2.1 billion tons of carbon emissions. Likewise, burning of explosives and fossil fuels during wars and other related actives also adds GHGs into atmosphere. Due to the unpredictability of these events, annual emissions from these sources vary from year to year.
Source: http://www3.epa.gov/climatechange/ghgemissions/global.html Climate influences degradation of ecosystems and disproportionately affects children and
women who are increasingly playing a key role as heads of households and primary
producers of food. The adverse impacts of climate change on agriculture are more in the dry

23
lands (i.e., arid, semi-arid and dry sub-humid regions), where potential reduction in yields
from rain-fed agriculture will be substantial (Venkateswarlu, 2009). Emissions or
sequestration of CO2 occurs through land use changes also. For example, CO2 is exchanged
between the atmosphere and the plants and soils on land because of conversion of cropland
into grassland, whereas new areas are diverted to cropland or forests. Besides, use of
biological feed stocks like energy crops or wood for electricity generation, creation of liquid
fuels, or building materials all lead to emissions or sequestration (Hergoualc'h and Verchot,
2014). Data for 2000–2009 suggest that land use change was responsible for the release of
1.1–2.7 PgC (Friedlingstei et al., 2010; Pan et al., 2011). Deforestation, agriculture, and
livestock grazing are the major land use changes that enhance carbon emission to the
atmosphere. Land use and land use changes account for about 31% of total human-induced
GHGs emissions into the atmosphere throughout the world. Enteric fermentation and
agricultural soils represent together about 70 % of total emissions, followed by paddy rice
cultivation (9 - 11 %), biomass burning (6 - 12 %) and manure management (7 - 8 %). If all
emission categories are broke up, the largest emitting categories after enteric fermentation
(32 - 40 % of total agriculture emissions) are manure deposited on pasture (15 %) and
synthetic fertilizer (12 %), both contributing to about 27% emissions from agricultural soils
(Smith et al., 2014). Paddy rice cultivation (11 %) is a major source of global CH4 emission,
which in 2010 was estimated to be 493 – 723 MtCO2eq / yr (FAOSTAT, 2013).
Predictions of climate change models indicate an increase in average temperature worldwide,
with significant impacts on local patterns of temperature and precipitation. The extent to
which such changes offer risk to food supplies and farmer livelihoods in rural communities
depends in part on the direction, magnitude, and rate of such changes (Scott et al., 2012).
However, it is equally importantly on the ability of the agricultural sector to adapt to
changing patterns of yield and productivity, production cost, and resource availability. India
is a large emerging economy with a great variety of geographical regions, biodiversity and
natural resources. However, the country is one of the most vulnerable to climate change risks
worldwide. In 124 years period, the probability of occurrence of drought was observed 25%
in west Rajasthan, 23% in Saurashtra and Kutch, followed by 21% in Jammu and Kashmir
and 21% in Gujarat (Mall et al., 2006). More than half of India’s population of over 1 billion
people lives in rural areas depends on climate-sensitive sectors like agriculture, fisheries and
forestry for their livelihoods. Natural resources and the environment are already under

24
pressure as a result of rapid urbanization, industrialization and economic development. The
western part of India covers an area of half a million km2. Indian Thar Desert is occupied by
dry open grassland or grassland interspersed with tree and thorny bushes. Rajasthan is the
geographically largest state in India receives scanty and erratic rainfall and affected by high
air and soil temperature, intense solar radiation and high wind velocity. Context-specific
interactions of these factors not only give rise to frequent droughts and famines, but also
make local livelihoods highly vulnerable. The increasing variability in weather pattern in the
region could impose both positive and negative impacts on agricultural sector resulting in the
need for agricultural producers to adapt to in order to reduce impacts and even capitalize on
new opportunities (Thomalla et al., 2006).
Two main policy responses to climate change are adaptation to and mitigation of climate
change. While adaptation seeks to lower the risks posed by the consequences of climatic
changes, climate change mitigation addresses the root causes, by reducing GHGs emissions
to the atmosphere. Both the approaches are necessary, because even if emissions are
dramatically decreased in future, adaptation will still be needed to deal with the global
changes that have already been set in motion (Tubiello and van der Velde, 2004). The
efficacy of adaptation and mitigation actions however, implemented now a days can be
thought of as a qualitative measure of their ability to reduce climate damage as a function of
climate warming. In general, adaptation activities work well to limit damage from low-to -
medium warming, while mitigation actions work on longer timescales. Thus joint adaptation
and mitigation actions, which can be implemented across a wide range of land and water
resource management solutions, can provide both adaptation benefits in the short term and
long- lasting mitigation benefits in the longer term.
2. CLIMATE CHANGE ADAPTATION
Adaptation is the adjustments that society or ecosystems make to minimize or prevents the
negative impacts of climate change that may be local or regional in nature (NRC, 2010). It
also includes purposefully modifying the developmental interventions to ameliorate
environmental conditions and ensure people livelihoods. Adaptation to short-term climate
variability and extreme events serves as a starting point for reducing vulnerability to longer-
term climate change (Spanger-Siegfried and Dougherty, 2005). Adjusting or restructuring in
anticipation of adverse effects of climate change and taking appropriate actions for

25
minimizing the damage or taking advantage of opportunities that may arise out of climatic
variations are also adaptation. For example, adoption of conservation agriculture, varying
crop management practices and utilization of suitable crop varieties or tree species are
sustainable way to intensify crop production and sustain the rural livelihoods and are
important ways of adaptation to climate change as well as combating desertification and
securing livelihood (Smith et al., 2014). Other important adaptations include diversification
of income generation activities, in situ moisture conservation, rainwater harvesting and
recycling to enhance water availability and enhanced productivity (Bhati et al., 1997; Gupta,
1995; Singh, 2012), efficient use of irrigation water, conservation agriculture, energy
efficiency in agriculture and use of poor quality water for increasing vegetation cover and
biomass (Venkateswarlu and Shanker, 2009).
2.1 Adaptation strategies
Adaptation to climate changes refers to adjustments in ecological, social, and economic
systems in response to the effects of changes in climate (Smith et al. 2000; Smit and
Pilifosova 2001). It includes strategies that provide additional income and ensure food
security to rural communities, for instance, forestry management and agroforestry
techniques, good agricultural practices that conserve soil and water resource; and properly
scaled bio-energy projects for rural communities. Human societies have repeatedly exhibited
a strong capacity for adapting to different climates and environmental changes throughout the
ages. These are in the form of migration to new areas, soil and water conservation to enhance
crop yields, changing the crops the people cultivate, or building different types of shelter etc
(Parry et al., 2008). Adaptation measures are planned in advance or put in place
spontaneously in response to a local condition. They include large-scale infrastructure
changes like building defences to protect against sea- level rise or improving the quality of
road surfaces to endure hotter temperatures or changes in behaviour of using less water,
planting different crops and more households and businesses buying insurance towards losses
due to flood, drought etc (Alcamo et al., 2007; Miller and Yates, 2006). However, there is
need to consider both negative and positive side-effects and externalities of adaptation
measures. Further, interactive effects of adaptation–mitigation also call for integrated design
and assessment of adaptation and mitigation policies, which are often developed by diverse
communities.

26
2.2 Rainwater harvesting and management
Climate change is expected to have significant impacts on water supplies by creating or
exacerbating shortages of water supply (Pandey et al., 2003; Sullivan et al., 2003; Shah,
2009). Retreading glaciers and decrease in flow of many streams, if continued, could affect
the availability of water for agriculture and other uses. Sea- level rise may result in saltwater
intrusion into coastal fresh water aquifers, and will reduce water resource availability.
Further, changes in quantity and intensity of precipitation are likely to result in more floods
and droughts and increased demand for irrigation water. While water storage is one of the
most important strategies not only to control runoff and soil loss but also contribute to
climate change mitigation; conjunctive use of surface and ground water is an important
strategy to mitigate climate change. Innovative approaches in ground water sharing can also
contribute to equitable distribution of water and reduced energy use in pumping (Sharma et
al., 2010). Water management play an increasingly central role in adaptation, however it
often requires costly investment in infrastructure. Because of long economic and physical life
of reservoirs, water withdrawal, treatment, delivery and disposal systems, adaptive responses
towards these are generally slower than in agriculture. The water sector is most vulnerable
and is where many of the impacts are felt first and most severely. Despite of this rainwater
harvesting is a key strategy for a planned adaptation according to IPCC. Water resources are
directly impacted by climate change, and the management of these resources affects
the vulnerability of ecosystems, socio-economic activities and human health. Most important
activities as adaptation in water sector are improvement in water use efficiency and building
additional water storage capacity, and protecting and restoring stream and river banks to
ensure good water quality and safe guard water quantity (Ubuoh et al., 2012). While Ngigi
(2003) defined rainwater-harvesting as the collection and concentration of runoff, Mati
(2012) called it floodwater harvesting rather than for rainwater-harvesting, ascribing the
latter to ‘rainwater collection’ and storage. Likewise Rockström (2002) conceptualized water
harvesting as a term describing the collection and conservation of runoff water originating
from ephemeral streams during storms, whereas Mati (2012) characterized it as an amalgam
of rainwater and floodwater harvesting. A review by Vohland and Barry (2009) indicates that
in situ RWH practices improve hydrological indicators such as infiltration and groundwater
recharge, enrich soil nutrients and increase biomass production with subsequent higher
yields. Higher biomass supports a higher number of plants and animals, although native
species might be replaced by crops as the landscape might change as a whole.
27
Interventions at watershed level generate good employment opportunities and reduce the
migration of both skilled and unskilled labour from the watershed village to urban areas
significantly (Pathak et al., 2013). It also improves the environmental quality and ecological
status in the watershed. The watershed interventions increase the vegetative index or
greenery, reduces runoff, soil loss, and land degradations and improves the bio-diversity in
fragile ecosystems (Singh et al., 2012). Policy based adaptation to climate change includes
incentive-based rainwater-harvesting legislation in developed countries or some rebate for
purchasing made upon connecting rainwater tanks to toilets, washing machines, and outdoor
faucets like that in some states of Australia. Rain taxes are collected in Germany for
impervious surface on property that generates runoff encouraging people to reduce imperious
surfaces in order to get tax reductions. There are much tougher laws, in favor of rainwater-
harvesting in India. For example, 16 Indian states and cities, including New Delhi and
Mumbai have enforced uncompromising laws making rain water-harvesting mandatory with
varying criteria. The kinds of building required to have rainwater-harvesting facilities varied
from all new buildings; commercial, institutional, tourist and industrial only; residential only;
government buildings; and those having tube wells in their compounds. The total area size of
the property or building for which rainwater-harvesting becomes compulsory varies from 250
to 1500 square meters. In some cases, tubewells in the compound are prohibited or owners of
tube wells are required to dig percolation wells for groundwater recharge. In Tamil Nadu,
government would construct the facilities on its own and recover cost and other additional
charges from the owners in case of failing to do so.
Bunclark and Lankford (2011) examined the factors that determine the suitability of
rainwater harvesting (RWH) in small-scale agriculture in developing countries and proposes
a decision developing regions to assess the suitability of the technology for increasing crop
production and reducing poverty. The uncertainty in crop production through RWH appeared
due to impacts of climate change and alterations to rural livelihood strategies as a result of
economic development and national governance approach. Among contour ridge (CR)
channel, conventional tillage (CT) and planting pits (PP), CR have been observed better for
cropping systems utilizing soil moisture close to the structure (Nyakudya et al., 2012).
Construction of a series of checkdams, digging up of van-talavalli, or application of different
rainwater harvesting structures recharge water table in the adjoining areas making that much
more water available influencing cropping pattern, enhancing food security and enhance

28
fuelwood and food production (Hussein, 2006; Hughes et al., 2006; Singh et al., 2013).
Productivity analysis of a watershed indicated a considerable improvement in gross monetary
returns under different cropping systems, where water harvesting through creation of farm
ponds and its recycling in agro-horticulture (Ziziphus mauritiana) system resulted in
diversified production (fruit, fuel and fodder) and sustained 1.14 adult cattle unit ha-1 yr-1
(Bhati et al., 1997). Pastures development in community grazing lands increased forage
production (2-3 t ha-1) over traditional methods (0.3-0.4 t ha-1). Adoption of various physical
and biological land treatments in the eroded rocky catchment reduced the soil erosion and
increased the ground water recharge. A direct relation is observed between increase in crop
yield and increase of rainfall amount. RWH therefore enhance the sustainability of traditional
rainfed through increasing yield and water productivity and minimizing environmental
impacts on natural resources. However, lack of technical knowhow and money leads to low
success of such knowledge (Shamseddin and Adeeb, 2014).
2.3 Agriculture and food supply
Changes in local patterns of temperature and precipitation is threatening agricultural
production and increasing the vulnerability of people dependent on agriculture for their
livelihoods (Howden et al., 2007). Climate change disrupts food markets and poses
population at wide risks to food supply (Lepper et al., 2014). This also influence the ability
of the agricultural sector to adapt to changing patterns of yield and productivity, i.e. all
components like cropping area of planted or harvested and cropping intensity, number of
crops grown within a year, production cost, and resource availability (Lizumi and
Ramankutty, 2015). Such threats can be reduced by increasing the adaptive capacity of
farmers as well as increasing resilience and resource use efficiency in agricultural production
systems by growing new varieties and species that are more adapted to altered thermal and
hydrological conditions; rescheduling of farm management practices such as irrigation and
nutrient application to better match altered phenological cycles; implementation of
technologies that conserve water and soil, adjusting crops rotations, and production practices
etc (Scott et al., 2012). The approaches of climate smart agriculture offers coordinated
actions by farmers, researchers, private sector, civil society and policymakers towards
climate-resilient pathways through four main actions like (1) building evidence; (2)
increasing local institutional effectiveness; (3) fostering coherence between climate and
agricultural policies; and (4) linking climate and agricultural financing (Lipper et al., 2014).
29
It emphasizes the capacity to implement flexible, context-specific solutions, supported by
innovative policy and financing actions. These adaptations using existing crop production
technologies can partially mitigate the impacts of climate change on national agricultural
markets. Further, adaptive redistribution of production shows significant implications for
both regional land use and environmental quality.
Adaptation to climate change in agriculture is to minimise people vulnerability by improving
their ability to cope with the impacts of climate change (Kalisch et al., 2011). In poor rural
areas where people live on subsistence agriculture and generally have little formal education,
people have to be provided with climate change-related information and access to social,
economic, institutional, and technical resources including development of micro-credit
schemes, improved extension delivery and human capital development together with
integration into existing capacities, assets and resources (Mustapha et al., 2012). Decreased
soil moisture favours drying up of field crops at harvesting maturity, whereas false start and
poor rainfall distribution results in poor crop yield. Strategies to adapt to such adverse
impacts of climate change are proper tillage practices, use of improved, early mature and
drought resistant varieties over semiarid areas. The tillage practices in particular enhance rain
water harvest and improve soil moisture and fertility increasing agricultural production and
food security (Gwambene and Majule, 2010). Growing new crops such as vegetables, fodder
and higher value medicinal crops for commercial sale; use of environmentally sound
fertilizers (vermiculture); improved storage for fodder and food grains; and improved water
conservation and harvesting techniques through bunding of fields, construction of anicuts and
digging and deepening ponds and wells (Chatterjee, 2005). Adaptation strategies often take
precedence over mitigation, as climate changes are already under way and farmers are
adapting in order to maintain production systems, incomes and livelihoods. Thus careful
management of land maintain or increase the resilience and stability of production systems,
while also sequestering soil carbon and reducing fluxes from farm activities (Rosenzweig and
Tubiello, 2007; Tarleton and Ramsey, 2008).
A decrease in crop yield by 30-46% has been predicted before the end of the 21st century
even under the slowest (B1) climate warming scenario (Schlenker and Roberts, 2009).
Farmers could adapt to the expected yield changes by growing crops more suited to the
predicted climate. Change in cropping patterns in an important part of predicting adaptation

30
behaviour and evaluating the effect of climate change on food and fiber production.
Traditional knowledge of the farmers in Rajasthan proves extremely useful to address climate
change challenges. Instead of relying on high input agriculture by using hybrid seeds,
chemical fertilizers and pesticides, some farmers still trust on the force of traditional soil and
crop management practices. Practices that increase the productivity of irrigation water use –
defined as crop output per unit of water use – may provide significant adaptation potential for
all land production systems under future climate change. At the same time, improvements in
irrigation performance and water management are critical to ensure the availability of water
both for food production and for competing human and environmental needs (FAO, 2007). A
number of farm, irrigation system and basin level adaptation techniques and approaches
specific to water management for agriculture include:
Increased use of varieties or species resistance to heat shock and drought;
Modification of irrigation techniques, including amount, timing or technology;
Adoption of supplementary irrigation in rain fed cropping;
Use of water-efficient technologies to harvest water and conserve soil moisture (e.g.
retention of crop residue, mulching, etc.);
Improved water management to prevent water logging, soil erosion and salt leaching;
Modification of crop calendars, i.e. timing or location of cropping activities;
Implementation of seasonal climate forecasting;
Following water allocation rules that reward high return on water;
Conjunctive use of surface water and groundwater; and
Adoption of structural and nonstructural measures to cope with floods and droughts.
Climate change put additional pressure on the natural resources of dry areas, where irregular
or no rainfall forces many small farmers to abandon their fields, at least temporarily, and
seek work in the nearby cities and towns. Participative water management, growing crops of
low water needs and more sustainable farming practices are adaptation strategies that allow
farmers to continue their activities in western Rajasthan. Such adaptation approaches are vital
for the future also in order to prevent the rural exodus and guarantee food security for people
(Akermann et al., 2009). Farmers are now increasing area under vegetable, orchard crop or
high value crops, whereas area under field crops is declining. Some important adaptations are
uses of breed crop varieties that are more tolerant of heat, drought, and water logging from

31
heavy rainfall or flooding (Cairns et al., 2013). Mix cropping is traditionally adapted
strategy, which not only enhance total yield but also mitigate the adverse effects of climate
change. For example, added chicory in pasture mixtures like orchard grass (Dactylis
glomerata L.) –white clover (Trifolium repens L.) or perennial ryegrass (Lolium perenne L.)
influences forage yield, root growth, and soil moisture extraction under drought (Skinner,
2008). Here addition of chicory to white clover mixtures increases drought tolerance when
chicory constituted 24 to 39% of harvested forage biomass. The three-species mixtures shows
greater root counts than the two-species mixtures at soil depths below about 70 cm under
well-watered conditions, but a greater proliferation of roots at depths below 70 cm was
observed for the two-species mixture under drought stress (Skinner, 2008).
Studies emphasize long term investments in strategic research and new policy initiatives that
mainstream climate change adaptation into development planning (Venkateswarlu, 2009).
This requires documentation of all the indigenous practices farmers are following over time
for coping with climate change; quantification of the adaptation and mitigation potential of
the existing best practices for different crop and livestock production systems; and a long
term strategic research planning to evolve new tools and techniques including crop varieties
and management practices that help in adaptation. Important technologies include in situ
moisture conservation and water management, conservation agriculture, and agroforestry like
agri-silvi-culture, silvipasture and agri-horticultur including energy efficiency in agriculture
and use of poor quality water, which ultimately favour carbon sequestration (Lema and
Majule, 2009).
Farmers in Indian dry zones are adopting modern technologies, i.e. fruits and vegetables, drip
irrigation facility, variety seed, improving planting technology and micro irrigation, good
network of transports and markets, agricultural advisory centers indicating positive increase
in cropping pattern (Yadao and Sharma, 2015). However, management practices have a
major impact on natural resources including water, soil, nutrients, plants and animal.
Increasing higher use of ground water or increased availability of water through
canal/channel is also increasing the area under irrigated crop like groundnut and cotton in
arid region of Rajasthan (Singh et al., 2008). Over-exploitation of groundwater resources
have set declining trend in water levels in most of the regions of Rajasthan. Even average
Pre-monsoon-Post-monsoon water levels show decline in most of the region indicating

32
significant withdrawal as compared to natural recharge to groundwater (CGW, 2007). Such
changes appear mostly driven by increasing food demand in the region and farmer response
to increase their income though change in local climatic conditions also influence market
rather than climate change (Zhang et al., 2013). Some simulation studies show the
importance of irrigation water as an adaptation technique to reduce the impact of drought and
climate change by reducing impacts on crop yield and heat stress. However, the adaptation
practices that involve increased irrigation water use may place additional stress on water and
environmental resources as warming and evaporative demand increase (Fezzi et al., 2015).
For example, a rise in temperature by 3°C is accompanied by 20% decrease in precipitation
levels that increase the amount of water for irrigation by 2.9 MCM/Y (Mimi and Jamous,
2010). Though changes in rainfall and temperature affects crops and livestock in a number of
ways resulting in reduced productivity, but a wealth of knowledge on coping and adaptation
that farmer shows formed a foundation for designing agricultural innovation systems to deal
with impacts of climate change and variability (Lema and Majule, 2009). Because of their
capacity to adapt to environmental change based on in-depth understanding of the land, the
resilience of indigenous peoples is rooted in traditional knowledge (McLean, 2010).
2.4 Land use change as adaptation
Socio-economic and climatic changes are expected to alter the current land-use patterns
(Koomen et al., 2008) as changes to forests, farmlands, waterways, and air are being driven
by the need to provide food, fiber, water, and shelter to more than six billion people globally.
Global croplands, pastures, plantations, and urban areas have expanded in recent decades,
accompanied by large increases in energy, water, and fertilizer consumption, along with
considerable losses of biodiversity. Such changes in land use have enabled humans to
appropriate an increasing share of the planet's resources, but they also potentially undermine
the capacity of ecosystems to sustain food production, maintain freshwater and forest
resources, regulate climate and air quality, and ameliorate infectious diseases (Chawla,
2012). We face the challenge of managing trade-offs between immediate human needs and
maintaining the capacity of the biosphere to provide goods and services in the long term
(Foley et al., 2005). Land-use decision processes are influenced not only by the biophysical
environment, but also by markets, laws, technology, politics, perceptions, and culture. Yet
there is evidence that climate adaptation considerations are playing an increasingly large role
in land decisions, even in the absence of a formal federal climate policy. A study on the

33
conversion of forest to agriculture in the Amazon region leads to local temperature increase
comparable to that simulated as being due to the radiative effect of the addition of carbon
dioxide into the atmosphere (Pielke, 2005). Thus land use planning plays a significant role in
local government activities to both mitigate greenhouse gases (GHGs) and adapt to a
changing climate (Gurran et al., 2008; Bajracharya et al., 2011; Richardson and Otero, 2012).
Key strategies for coping with climate change linking land use planning include:
• Increase in vehicle-related GHGs emissions are very much influenced by
transportation infrastructure.
• Compact developmental programs protect ecologically valuable open space and
require less energy and materials to build and operate.
• Reducing GHGs emissions due to deforestation requires effective implementation of
policies to protect forest areas and other valuable carbon sinks.
• Land use planning is also critical in enabling communities to adapt to sea level rise,
more frequent extreme weather conditions, and other climate-related hazards.
• Smart development and conservation strategies that help protect the natural
environment and make communities more attractive, economically stronger, and
more socially diverse.
2.5 Forestry and Climate Change Adaptation
Forest and adaptation are linked together as forests play an important role in the adaptation of
communities (i.e., forests for adaptation); however, adaptation is also required for forests
(i.e., adaptation for forest). Because forests provide a range of ecosystem services that
contribute to human well-being and reduce social vulnerability, forests should be considered
when planning adaptation policies and practices in areas of the economy beyond the forest
sector also (Takasaki et al., 2004; TEEB, 2009; Pramova et al., 2012). Secondly, as climate
change drives the changes in forests, there is need to define and implement measures for
reducing the negative impacts of climate change on forests also. In addition to sequestering
atmospheric carbon di oxide (CO2), forests maintain and regulate water supplies and quality,
provide habitat and soil stability, and much more. Being a safety net, forests help
communities cope with climate shocks. Many forest products (i.e., timber, fuelwood and
non-timber forest products) are more resilient to climate variability and extremes as
compared to crops, and thus are crucial to the resilience of local livelihoods (Fisher et al.,
34
2010; Liswanti et al., 2011). Other products are mushrooms, sago, fruits and bushmeat as
food and tree fodder ensures the survival of livestock for months (Djoudi et al., 2012). Unlike
agriculture and livestock activities, which are very much sensitive to climate change, the
non-timber forest products are less sensitive to it and appear to be a safety net for the local
people. Further, forests contribute to regulating river flows – base flows during dry seasons
and peak flows during rainfall events thus minimizing the risks related to water scarcity and
floods (Locatelli and Vignola, 2009). A forest watershed has observed increasing base flows
and reduces the impacts of drought on downstream agrarian communities (Pattanayak et al.,
2001). Tropical forests influence precipitation and can have a cooling effect on a region
through increased evaporation and cloud cover (Betts et al., 2007).
Trees on farms protect the soil and regulate water and microclimate, and help protect crops
and livestock from climate variability. Crops grown in agroforestry systems are more
resilient to drought, excess precipitation, and temperature fluctuations and extremes (Verchot
et al., 2007). Trees or forests help increase agriculture production by conserving and
regulating soil, water and microclimate in agricultural lands and regulating water quality and
protecting soil from erosion and landslides in a watershed (Enfors and Gordon, 2008;
Pramova et al., 2012b). Leguminous trees make agriculture more drought resilient by
improving water infiltration and increasing productivity through nitrogen fixation (Garrity et
al., 2010). Trees regulate temperature and reduce pollution level in urban areas. Thus
planting tree on agriculture land, for restoration of degraded forestlands or hills are parts of
adaptation by conserving soil and water, ensuring fodder and fuelwood supply and securing
livelihoods (Singh, 2011). Indigenous knowledge about local vegetation management in
Rajasthan is extensive and clearly reflects adaptation to fluctuating climatic conditions. Some
of these are home gardens, trees on farmlands and on farm bunds, trees around water points,
sacred groves and grazing lands etc. Combination of these practices serve multiple and cost-
effective functions including livelihood improvement, local resource conservation and
protection to local infrastructure (Sekhar, 2004; Swarnkar and Katewa, 2008). However, the
young and newly planted trees, together with street trees and trees in hedgerows are likely to
be the most affected by climate change resulting in loss of productivity of many species,
because of both frequent and intense summer droughts. Further, this will also affect the
species suitability and thus it is important to consider the planting stock and species adapting
to the changing climate developed through research and trials. Though major emphases are

35
given on indigenous species for afforestation, but exotics can also be tried for immediate or
short term solutions/benefits. Protected forests help conserve ecosystems that provide habitat,
shelter, food, raw materials, genetic materials, a barrier against disasters, a stable source of
resources and many other goods and services – and thus have an important role in helping
species, people and countries adapt to climate change. By virtue of their protective status,
these forests should remain free from destructive human intervention.
Climate change also imposes a growing role for natural forest restoration, even though it is
relatively more expensive than avoiding degradation and deforestation of a current forest. In
general natural forest restoration is targeted to promote connectivity between existing patches
of stable natural forest to maximize cost-effectiveness. Rivers and rail corridors provide
opportunities for restoring natural forest along these gradients. A portion of the cost of
stabilizing a natural forest from degradation and deforestation could be offset directly
through carbon financing (e.g. REDD) and indirectly through downstream hydrological
benefits (clean water provision for drinking and farming). For example, average REDD
potential of forest in Madagascar is about $45 ha-1 year-1, whereas downstream net present
hydrological benefits was $44/Ha (Carret and Loyer, 2003). The estimated avoiding forest
degradation cost ($160-265 ha-1) and avoiding deforestation cost ($160-880 ha-1) appears
substantially cheaper in ensuring forest cover than restoring natural forest once it has been
cleared costing $802-2650 ha-1 (Busch et al., nil). Revenue for forest conservation offer
potential to achieve financing for ecosystem based adaptation on the scale required to ensure
biodiversity security under climate change.
2.6 Climate Change Adaptation and Livelihood
An integrated approach is required to manage climate risks at the national and local level and
implement the activities to promote adaptation and reduce livelihood vulnerability,
particularly among women and poor communities (Selvaraju et al., 2006). Adaptations are
spontaneous or planned, mechanistic or value based or a combination of all crafted by men
and women both in a region. These adaptations are physical like water-harvesting structures,
or institutions/norms like village councils for collective irrigation management or groups of
seasonal migration in search of livelihood in fluctuating monsoons (Singh et al., 2010).
Likewise, movement of Raika along with their livestock in different regions of a province or
different provinces is an important example of adaptation relating livelihood in western
36
Rajasthan. Integrating tree on farmlands in the form of Agroforestry is way of life in arid
western region of Rajasthan that secure people livelihood by providing a range of economic,
environmental, and socioeconomic benefits in addition to sequester carbon (Roy et al., 2011).
Scattered trees on agricultural fields in arid regions of western Rajasthan are multipurpose in
nature and they have ability to satisfy the expectations of rural folks regarding production of
their basic needs. Local farmers in dry areas including Rajasthan in India have been adapting
to prevailing climatic conditions by selecting drought-resistant crop varieties, moisture-
conserving cropping systems, mixed farming and agroforestry (Delgado et al., 2011).
Rajasthan has rich and intricate tradition of rainwater harvesting too (Mahnot et al., 2003;
Pandey et al., 2003). There is a clear correlation between heightened historical human efforts
in construction of rainwater harvesting structures in response to climate fluctuations such as
aridity and drought (Pandey et al., 2003).
2.7 Government of India initiatives
Under National Action Plan on Climate Change (NAPCC), following are the eight missions
that outline policies and programs addressing climate mitigation and adaptation. In addition
each state has been directed to come up with state action plans on climate change (SAPCCs)
which are more adaptation centric particularly at the state or regional level.
Jawaharlal Nehru National Solar Mission
National Mission for Enhanced Energy Efficiency
National Mission on Sustainable Habitat
National Water Mission
National Mission for Sustainable Agriculture
National Mission for Sustaining the Himalayan Ecosystem
National Mission for a Green India
National Mission on Strategic Knowledge for Climate Change
There are many programmes which deal directly with the building of resilience, reducing
vulnerability, social safety nets, etc particularly to reduce the risks of climatic variations and
extremes (Table 2.1). Besides, there are other programmes, which are implemented in
associations with the NGOs working throughout India (Table 2.2).

37
Table 2.1. Government of India's programmes related to building resilience, reducing
vulnerability, social safety nets, etc.
SNo Programmes* Budget 2015‐16 (Crores)
1 Mahatma Gandhi National Rural Employment Guarantee Scheme
34699
2 Prime Minister’s Employment Generation Programme 1050 3 Pradhan Mantri Krishi Sinchai Yojana (includes watershed
development, micro‐irigation etc) 5300
4 Rashtriya Krishi Vikas Yojana (integrated pest management, soil health, seed farms, market development, etc
4500
5 National Crop Insurance Programme 2823 6 National rural livelihood mission 3343 7 Forestry (National Afforestation and Eco-Development) 688 8 Urban Rejuvenation Mission 6000
++ Others include programmes of NABARD, pilot initiatives of NICRA, etc; Table 2.2 Adaptation through collaboration with NGOs.
Name of Project Agency
Focus Area
Climate Change Adaptation in Rural Areas of India (CCA‐RAI)
GiZ, MOEFCC Implementation in 4 states ‐MP, Rajasthan, TN, and WB. Supported SAPCC in18 states
Climate Smart villages CGIAR‐CCAFS Haryana, Bihar, Punjab and Maharashtra – 1000 villages
Climate Change Adaptation (in Semi-arid regions)
Watershed Organisation Trust (WOTR)
Maharashtra, MP, Rajasthan, (Arid regions) Telangana, Andhra Pradesh, Orissa, Jharkhand
Programme on Sustainable agriculture, livestock, water resource management and other
BAIF Development Research Foundation
Multiple states across country
Small Holder Agriculture & Climate Change and Natural Resource Management
Oxfam (India) Through numerous grass root NGOs
Assam, Bihar, Chhattisgarh, Jharkhand Orissa, Uttar Pradesh and Uttarakhand
Toolkit to enable local governments to develop climate resilience strategies and plan of action
ICLEI Three cities: Shimla, Bhubaneswar and Mysore.
Adapting to Climate Change in Urbanising Watersheds (ACCUWa)
ATREE Karnataka, Tamil Nadu
Mitigating Poverty in Western Rajasthan
Different NGOs Western Rajasthan

38
There are many programmes like DDP, DPAP, CDP, MNREGS etc implemented in western
Rajasthan to combat desertification, build capacity of the local people to become more
resilient and better adapt to climate change and mitigate the effects of climate change as well
as desertification. Important livelihood options in western Rajasthan are: i) Agriculture
intensification, ii) Animal Husbandry, and iii) Migration. Different livelihood strategies are
being adopted by various caste and communities in western Rajasthan (http://www.undp.org)
includes:
Agriculture is the dominant livelihood source for the forward castes. For the
scheduled caste population migration accounts for over half of the total household
incomes, whereas, other sources are more important for the intermediate caste groups.
Animal husbandry is important for the non-tribal peasant castes in the region,
whereas there is not much variation in livelihood strategies across different
communities in the tribal areas of Rajasthan.
Cultivation is equally important for all communities in the Desert areas. Animal
husbandry is important for the Muslim and upper caste communities, whereas it
occupies a lower position for the scheduled castes. Wage labour is important for both
Muslims and scheduled castes, who derive a significant part of their income from
nonfarm sources also. In Desert region, migration is most important adaptation
strategy for upper castes.
In irrigated areas, cultivation is the most important source of income for the upper
and intermediate caste groups and wage labour for the scheduled castes.
Farmers are irrigating their farmlands using tube-wells to cultivate commercial crops
as an adaptation. While tube wells irrigation is making farmers less susceptible to
rainfall variability in the short term, the conditions set up appears to be dangerous and
going to collapse when the water table gets depleted in the long term.
Indigenous knowledge on agricultural practices adapting climate change includes
agroforestry, land preparation, cropping pattern, use of seed varieties, seed storage,
soil & water conservation measures etc (Vom Brocke, et al. 2003; Jhunjhunwala,
2005; Singh et al., 2011).
Majority of the practices have developed in response to climatic fluctuations in the
region coupled with perpetual scarcity of soil moisture and water.

39
3. CLIMATE CHANGE MITIGATION
Climate change mitigation means using new technologies and renewable energies, making
older equipment more energy efficient, or changing management practices or consumer
behavior (www.unep.org). Greenhouse gases accumulating in the atmosphere can be reduced
by supply-side mitigation options (i.e., reducing GHG emissions per unit of land/ animal, or
per unit of product), or by demand-side options (i.e., changing demand for food and fibre
products, reducing waste etc.). Climate change and climate extremes influences people for
land use conversion and corresponding soil carbon sequestration (Li and Wu, 2010). An
estimate indicates that removal of atmospheric CO2 from the Land Use, Land Use change &
Forestry (LULUCF) sector offset about 13% of total U.S. greenhouse gas emissions, where
forests (including vegetation, soils, and harvested wood) accounted for about 88% of
LULUCF CO2 flux in 2013. In this sector, there exists opportunities both to reduce emissions
and increase the potential to sequester carbon from the atmosphere by enhancing sinks
adopting different management practices (Table 2.3). Though there are various strategies to
mitigate climate change, but no strategies are complete or successful without reducing
emissions from agriculture, forestry, and other land uses. However, climate change
mitigation depends on awareness of the problem, capacity to change, and the willingness to
do so (Burton, 2007).
Table 2.3. Management options for reducing emissions and enhancing sinks to mitigate
climate change effects.
Type Methods of reducing emissions and enhancing sink
Example
Change in use of land
Increasing carbon storage by using land differently or maintaining carbon storage by avoiding land degradation.
Encouraging the transformation of cropland to forest.
Avoiding the conversion of forest land to settlements.
Change in land management
Improving management practices on existing land-use types.
Reducing soil erosion to minimize losses in soil carbon storage.
Planting after natural or human-induced forest disturbances to accelerate vegetation growth and minimize soil carbon losses.
Land-based carbon sequestration offers the possibility of large-scale removal of greenhouse
gases from the atmosphere by way of plant photosynthesis. Major strategies for reducing and
sequestering terrestrial greenhouse gas emissions are: (i) enriching soil carbon, (ii) Farming

40
or retaining woody perennials, (iii) climate friendly livestock production, (iv) maintaining
and protecting natural forests and habitat, (v) restoring degraded watersheds and rangelands,
and (vi) improved use of biomass and fuel.
3.1 Enriching soil carbon
Soil organic carbon (SOC) is the carbon associated with soil organic matter, which is the
organic fraction of the soil made up of decomposed plant and animal materials as well as
microbial organisms. However, it does not include fresh and un-decomposed plant materials
like straw and litter lying on the soil surface. Soil organic carbon is important for all three
aspects of soil fertility like chemical, physical and biological fertility (Lal, 2010; Olson et al.,
2014). Soil carbon can also be present in inorganic forms, e.g. lime or carbonates in some
soils in the drier areas including Rajasthan. One important method to reduce atmospheric
carbon dioxide is to increase the global storage of carbon in soils, which is an important
carbon pool on the Earth’s surface (Schlesinger, 1999). An added benefit to this solution is
the potential for simultaneous enhancement in agricultural production. According an estimate
30 - 60% of the atmospheric carbon dioxide absorbed by plants is deposited into the soil as
organic matter particularly in the form of bud sheaths for protecting the delicate root tips and
as a range of other root excretions, which is 5-33% of daily photo-assimilates (Bardgett et al.,
2005). However, the quantity of exudates is likely greatest in fast-growing plant species,
especially in those, which show highly branched fine root systems (Personeni and Loiseau,
2004). These root excretions are complex carbon compounds containing a complete range of
minerals used by plants and on which billions of microbes like actinomycetes, bacteria and
fungi feeds (Leu, 2007).
Soil organic carbon varies in different soils and conditions ranging from about 10% in the
alpine soils to less than 0.5% in the desert soils (Singh, 2014). The amount of SOC stored in
the soil profile is also considered. For example, a 1% SOC over 30 cm soil depth stores about
42 tons of SOC stored over 1 hectare of land. Usually, the surface layer has the highest level
of SOC which decreases with depth down the soil profile (Franzluebbers and Stuedemann,
2008; Singh et al., 2007). The actual amount of SOC present in a soil depends on a number
of factors like rainfall, air temperature, vegetation, soil types, topography etc. (Emerson,
1995; Singh, 2011). Though increasing the SOC pool is a major challenge, especially in
developing countries, where crop productions are low, climate is harsh, and water and

41
nutrients are limited (Lal, 2009). However, adoptions of appropriate management practices
like tree integration, no-tillage, organic manuring, soil and water conservation etc., high rates
of SOC sequestration can be achieved (Singh, 2005; Swart et al., 2003; Wang et al., 2015).
For example, Follett et al. (2005) reported a sequestration rate of 1.0 to 1.9 Mg C ha-1 yr-1 in
an irrigated Vertisol in Central Mexico and observed a significant correlation between the
aboveground crop residue carbon produced and the amount of SOC sequestered. Likewise,
soil C pool rate of 2- 3 Mg C ha−1 yr−1 observed in sodic soils in northern India under
agroforestry practices (Garg, 1998). A SOC sequestration rate of 3.37-6.58 tons ha-1 y-1
(Average 4.93 tons ha-1 y-1) has also been observed in 0-40 cm soil layer under afforestation
and rainwater harvesting during 65 moths of restoration of degraded hills (Singh, 2013). This
indicated variations in rate of carbon sequestration because of both topography as well as
rainwater harvesting devices.
Both organic and inorganic forms of carbon are found in soils, where land use and
management typically have a larger impact on soil organic carbon. There are several national
and regional estimates of carbon sequestration potential in cropland soils (Gupta and Rao,
1994; Lal and Bruce, 1999) indicating that with a large land area and diverse eco-regions,
there is a considerable potential of terrestrial/soil carbon sequestration in India (Lal, 2004).
Soil management practices such as tillage, fertilizer, irrigation, crop residue management,
etc. modify microbial population and soil carbon stock to varying degrees (Lal, 2004, King,
2011). Organic farming system attributes regarding cropping, floral, and habitat diversity,
nutrient intensity, soil management, energy and pesticide use, etc. impart potentially
important environmental benefits (Lynch, 2009). Reducing the intensity and frequency of
ploughing and leaving crop residues on the soil surface as mulch also adds enhancing soil
organic carbon (SOC) content. Judicious use of nutrient is crucial to SOC sequestration
particularly in tropical soils (Battacharya et al., 2007; Mandal et al., 2007). Long-term
manure application increases the SOC pool, the effects which may persist for a century
(Gilley and Risse, 2000; Gong et al., 2009).
Inputs of biosolids-derived organic matter also lead to both short-term and long-term increase
in soil organic carbon (Torri et al., 2014; Diacono and Montemurro, 2010; Virginia et al.,
2015). Conversion of land to organic farming contributes to soil carbon sequestration
(Gattinger et al., 2012), whereas regular applications of composts increase the number and
42
diversity of microbial species living in the soil biomass ensuring storage of a significant
proportion of soil carbon and making mineralized plant available nutrients and protecting the
health of the plants (Zhang et al., 2015). A combination of fertilizer and organic manure are
more useful in soil carbon sequestration as compared to the individual ones (Srinivasarao et
al., 2009; Kumara and Antil, 2014). In long term manorial trials conducted in dry area of
Andhra Pradesh, India under rain fed conditions indicates the rate of carbon sequestration in
groundnut production as 0.08 - 0.45 tons ha-1 year-1 with different nutrient management
systems (Srinivasarao et al. 2009). In alfisol region of Karnataka, the rate of carbon
sequestration was 0.04 to 0.38 tons ha-1 year-1 in finger millet system, whereas under Rabi
sorghum production system in vertisol region of Maharashtra the sequestration rate ranged
from 0.1 to 0.29 tons ha-1 year-1 with different management options. In soybean system in
black soils of Madhya Pradesh the potential rate of carbon sequestration was up to 0.33 tons
ha-1 year-1 in top 20 cm soil depth (Srinivasarao et al. 2009).
Soil amendment with biochar is another technological option for increasing SOC pool
(Meinhausen et al., 2009). Biochar is formed from low temperature pyrolysis of biomass in
the absence of oxygen to produce charcoal. The concentrations of carbon and extractable
nutrients in biochar are affected by feedstock selection, whereas the biochar is influenced by
high treatment temperature between 450–550 °C (Crombie et al., 2015). There are reports
that soil biochar amendment may sequester 1 billion tons C/yr or more, though long term
field-based studies provides reliable data on C sequestration through the application of
biochar as 2-5 tons ha-1 on grazing and croplands (Lal, 2011; Lehmann et al., 2006; Sohi et
al., 2010).
3.2 Maintaining and farming woody perennials
Perennial crops, grasses, shrubs and trees constantly maintain and develop their root and
woody biomass that helps in increasing the associated carbon in addition to providing
vegetative cover to the soils (De Deyn et al., 2008; Singh et al., 2013a). In arid regions where
soil moisture restricts plant growth, the traits that enable the survival and growth under the
extremes of precipitation and temperature regimes through opportunistic or persistence
strategies (Ogle and Reynolds, 2004) and the traits that govern carbon distribution
throughout the soil profile (Jobbagy and Jackson, 2000; Schenk and Jackson, 2002) directly
influence carbon storage through primary productivity and carbon stabilization in soil. A tree
43
transpire about 500 kg of water for each kg of carbon fixed on annual basis in arid areas,
where about 60% of this carbon returns to the atmosphere by respiration and loss of water
vapor through stomata is far more than 1000 times the net carbon gain making an unfortunate
tradeoff in the region (Sabaté and Gracia, 2011).
There is large potential to substitute annual tilled crops with perennials, particularly for
animal feed and vegetable oils, as well as to incorporate woody perennials into annual
cropping systems in the form of agroforestry systems. Managing and promoting trees or
woody shrubs (Zizyphus spp., Punica granatum etc) in agroecosystems like agroforestry,
ethnoforests, and trees outside forests mitigate GHGs emissions and provides a better climate
change mitigation option than oceanic, and other terrestrial options because of the secondary
environmental benefits (Box 2). It helps to attain food security and secure land tenure in
developing countries, increasing farm income, restoring and maintaining above-ground and
below-ground biodiversity, corridors between protected forests, as CH4 sinks, maintaining
watershed hydrology, and soil conservation (Singh et al., 2007; Singh et al., 2013b).
Agroforestry also fulfils the demand for wood and reduces pressure on natural forests.
Promoting woodcarving industry facilitates long-term locking-up of carbon in carved wood
and new sequestration through intensified tree growing. By making use of local knowledge,
equity, livelihood security, trade and industry, can be supported. There is need to support
development of suitable policies, assisted by robust country-wide scientific studies aimed at
better understanding the potential of agroforestry and ethnoforestry for climate change
mitigation and human well-being (Pandey, 2002).
Box 2: Mitigation through AFOLU Reductions in CH4 or N2O emissions from croplands, grazing lands, and livestock. Conservation of existing carbon stocks, i.e. forest biomass, peat lands, and soil carbon
that would otherwise be lost. Reductions of carbon losses from biota and soils, i.e. management changes within the
same land-use type (e.g., reducing soil carbon loss by switching from tillage to no-till cropping) or by reducing losses of carbon-rich ecosystems, i.e. reduced deforestation, rewetting of drained peat lands.
Enhancement of carbon sequestration in soils, biota, and long lived products through increases in the area of carbon-rich ecosystems such as forests (afforestation, reforestation), increased carbon storage per unit area by increasing stocking density in forests, carbon sequestration in soils, and wood use in construction activities.
Changes in albedo resulting from land-use and land-cover change that increase
44
reflection of visible light. Provision of products with low GHG emissions that can replace products with higher
GHG emissions for delivering the same service (i.e., replacement of concrete and steel in buildings with wood materials).
Reductions of direct (i.e., agricultural machinery, pumps, fishing craft) or indirect (i.e., production of fertilizers, emissions resulting from fossil energy use in agriculture, fisheries, aquaculture, and forestry or from production of inputs).
Source: Smith et al. (2011)
Plants are the primary vehicle for adding carbon to terrestrial environments and planting
grass may help to increase soil carbon storage (Diaz et al., 2009). While replanting trees that
have been removed through cutting or fire is called as reforestation, planting of tress in areas
that are not currently forest is referred to as afforestation. These are the ecological site
specific management practices that are assumed to increase carbon stocks on forests or
rangelands. Promoting reforestation and encouraging afforestation on marginal lands areas
including range lands is important carbon sink (Adesina et al., 1999). Restoring woody
vegetation on cleared land, restoring croplands by reconverting them to rangelands, restoring
vegetation to bare soils, and restoring soil stability could all increase carbon sequestration as
well as storage (Brooker et al., 2013). Providing incentives may encourage farmers and land
users to maintain natural vegetation through product certification, payments for climate
services, securing tenure rights, and community fire control (Asbjornsen et al., 2013).
Declaration on Forests of the New York Climate Summit (September 2014) has committed to
restore 150 million hectares land globally by 2020 and 350 million hectares by 2030. The
Bonn Challenge (www.bonnchallenge.org), a global aspiration is also focusing to restore 150
million hectares of the world’s degraded and deforested lands by 2020. Likewise Green India
Mission has a target of 10 million hectares of forest/non-forest land to reforest/afforest in 10
years, starting from 2015 itself. The all are promoting to generate carbon sink to mitigate
climate change effects. Although, trees are difficult to grow at xeric end of the gradients in a
region; however, the mesic regions are known to grow broadleaf and coniferous trees.
Several studies suggest that introducing or reintroducing broadleaf trees have favorable
impact on carbon sequestration on marginal lands or degraded forestland seeing that they
have large root systems that promote the growth of forbs and grasses beneath the canopy (De
Deyn et al., 2008; Singh et al., 2013).
Although reforestation positively influence the soil carbon stock and sequestration rate on

45
forestlands or rangelands, but environmental and social tradeoffs arise because of site
specific nature of this activity (Singh et al. 2013). Soil type, species, nutrient management
and the climate influence the rate and magnitude of carbon sequestration with afforestation
and as such it may not always positively influence the SOC pool (Johnson and Curtis, 2001).
For example, litter produced by invasive exotic plants may differs from native plant litter in
quality and quantity affecting litter decomposition and soil respiration in ways that depend on
whether exotic and native plant litters decompose in mixtures. Exotic Alternanthera produces
rapidly decomposing litter which accelerates the decomposition of native plant litter in litter
mixtures and enhances soil respiration rates affecting total soil carbon storage negatively
(Zhang et al., 2014). According to a prediction, mitigation potential of agriculture and
forestry observed to be about 4-18 billion tons CO2 equivalent by 2030 (Table 2.4. In this
highest expectation is from forests and its conservation followed by agriculture.
Table 2.4. Mitigation potential in agriculture and forestry by 2030 (Source: FAO, 2005) Land use 2030 reductions billion t CO2e Global 15-25 Agriculture 1.5-5.0 Reduction of non CO2 gases (0.3-1.5) Agro forestry (0.5-2) Enhanced soil carbon sequestration (0.5-1.5) Forest 2.5-12 REDD+ (1-4) SFM (1-5) FR including A/R (0.5-3) Bio-energy 0.1-1.0 TOTAL 4-18
Carbon sequestration is also coupled with the silicon (Si) cycle, where a persistent
component of the carbon is occluded within plant phytoliths (Rajendiran et al., 2012; Song et
al., 2014a). Phytoliths is nothing but a silica body produced by plants as a result of
biomineralization process. During this, occlusion of carbon takes place within the phytoliths.
Major agricultural crops like barley, maize, rice, sorghum, sugarcane and wheat are known to
be prolific producers of phytolith and the occluded carbon. In India, an estimate indicates that
these crops may annually contribute about 87 million tons such carbon. However, the rate of
phytolith production and the carbon occlusion vary among the plant community. These crops
may annually contribute about 87 million tons but growing the cultivars with high phytolith
occluded carbon may additionally produce 1.05 million tons. A study indicates that the

46
Chinese cropland phytolith sink is about 18% of world's croplands (24.39 ± 8.67 Tg yr−1) and
sequester 4.39 ± 1.56 Tg yr−1 of carbon dioxide (CO2), which is more than the USA or India.
Cultivation of deep rooting crops, erosion mitigation with buffer strips, fertilization of Si-rich
materials are some of the potential management strategies to increase both crop production
and carbon sequestration coupled with the Si cycle thereby mitigate climate change (Song et
al., 2014b).
3.3 Managing livestock production
Grazing lands are thought to encompass as much as 30% of terrestrial carbon stocks (FAO,
2009) and account for about one-fourth of potential carbon sequestration in world soils
(Follett and Reed, 2010). Both as sustenance of livelihoods and rapid growth in demand for
livestock products trigger a huge rise in the number of animals, particularly in arid and semi-
arid areas. Abiotic factors such as weather, soil structure, erosion, and water table depth are
the dominant drivers of pasturelands productivity and species composition (Ho, 2001) and
that the relationship with livestock grazing is often non-linear (Westoby et al., 1989; Ellis
and Swift, 1988). Livestock related emissions (i.e., carbon dioxide, methane and nitrous
oxide) contribute both directly and indirectly to climate change and account for about 18%
(7.1 billion tons CO2 equivalent) of total GHGs emissions globally, which is more than the
transport sector (http://www.fao.org/agriculture/lead/themes0/climate/en/). Because of large
covers throughout the world, rangelands or pasturelands can sequester substantial amounts of
atmospheric carbon dioxide in the form of soil organic carbon and mitigate climate change if
properly managed and maintained (Brooker et al., 2013). The best management practices,
site-specific policies and technological options are important approaches to manage the
pasturelands in mitigating the impact of current climate variations. The associated co-benefits
with pastureland management include carbon storage improving soil quality and resilience,
agronomic productivity, advancing global food security and restoring ecosystem diversity
(McDermot and Elavarthi, 2014).
While uncontrolled grazing in arid region reduces soil carbon stock (Singh, 2015), no grazing
also deteriorate plant-soil system (Reeder et al., 2001). Plants in natural plant communities
are generally damaged and forage production reduced with increase in stocking rates under
grazing and trampling by the domestic animals (Ellison, 1960; Belsky, 1986; Painter and
Belsky, 1993; Holechek et al., 1999). This also leads to simplification of plant communities,

47
establishment of woody vegetation in grasslands, and regression to earlier successional stages
or conversion to invasive dominated communities (Reisner et al., 2013). Thus grazing at an
appropriate stocking rate is beneficial for plant composition, forage production and carbon
sequestration. A reduction in livestock numbers may be important option and perhaps the
most effective means of altering GHG emissions (Ripple et al. 2014). However, reports is
also available that indicates an increase in carbon accumulation with increases in stocking
rate, i.e. optimal stocking rate of 5 sheep equivalent ha-1 with 40% vegetation utilization rate
(Fig 2.1), where the relationship between nitrogen changes and stocking rates showed a
partial decoupling with carbon changes at stocking rate of 4 SE/ha coupled with 30%
vegetation utilization rate (Chen et al., 2015).
Adoption of improved pastures, intensification of ruminant diets, changes in land-use
practices, and changing breeds of large ruminants are other options to reduce GHGs
emissions. Thornton and Herrero (2010) estimated mitigation potential of these options in the
land-based livestock systems at about 7% of the global agricultural mitigation potential by
2030. Probable mitigation potential of these options estimated to 4% of global agricultural
GHG mitigation that is on the order of $1.3 billion per year at a price of $20 per tons CO 2-eq
(Thornton and Herrero, 2010). Likewise manure management, methane capture for biogas
production and improved feeds and feed additives further enhance climate change mitigation
(Reddy, 2015). Likewise targeted application of animal waste can provide important
nutrients to plants and soil microbes leading to increase carbon storage (Ceotto, 2002).
Fig 2.1. Effects of stocking rate (50 kg sheep equivalent/ha) on X-axis ranging from 2-8 sheep on soil carbon storages indicated by solid symbol and vegetation utilization rate
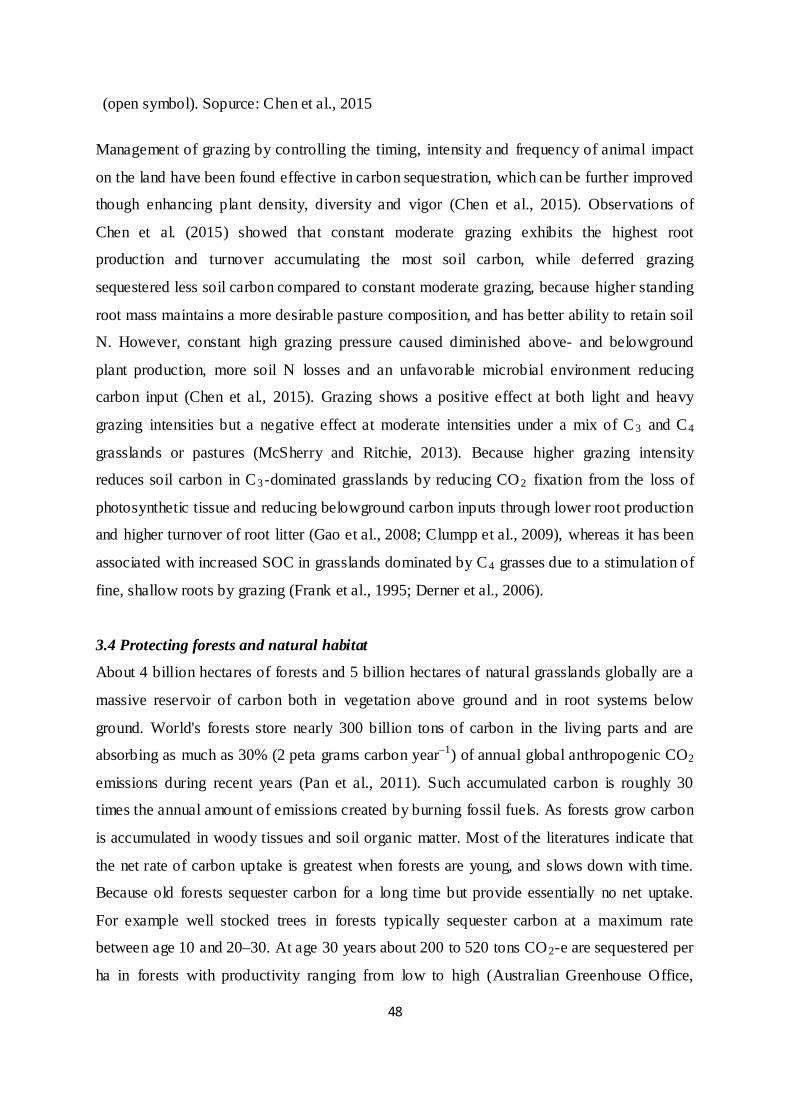
48
(open symbol). Sopurce: Chen et al., 2015
Management of grazing by controlling the timing, intensity and frequency of animal impact
on the land have been found effective in carbon sequestration, which can be further improved
though enhancing plant density, diversity and vigor (Chen et al., 2015). Observations of
Chen et al. (2015) showed that constant moderate grazing exhibits the highest root
production and turnover accumulating the most soil carbon, while deferred grazing
sequestered less soil carbon compared to constant moderate grazing, because higher standing
root mass maintains a more desirable pasture composition, and has better ability to retain soil
N. However, constant high grazing pressure caused diminished above- and belowground
plant production, more soil N losses and an unfavorable microbial environment reducing
carbon input (Chen et al., 2015). Grazing shows a positive effect at both light and heavy
grazing intensities but a negative effect at moderate intensities under a mix of C3 and C4
grasslands or pastures (McSherry and Ritchie, 2013). Because higher grazing intensity
reduces soil carbon in C3-dominated grasslands by reducing CO2 fixation from the loss of
photosynthetic tissue and reducing belowground carbon inputs through lower root production
and higher turnover of root litter (Gao et al., 2008; Clumpp et al., 2009), whereas it has been
associated with increased SOC in grasslands dominated by C4 grasses due to a stimulation of
fine, shallow roots by grazing (Frank et al., 1995; Derner et al., 2006).
3.4 Protecting forests and natural habitat
About 4 billion hectares of forests and 5 billion hectares of natural grasslands globally are a
massive reservoir of carbon both in vegetation above ground and in root systems below
ground. World's forests store nearly 300 billion tons of carbon in the living parts and are
absorbing as much as 30% (2 peta grams carbon year–1) of annual global anthropogenic CO2
emissions during recent years (Pan et al., 2011). Such accumulated carbon is roughly 30
times the annual amount of emissions created by burning fossil fuels. As forests grow carbon
is accumulated in woody tissues and soil organic matter. Most of the literatures indicate that
the net rate of carbon uptake is greatest when forests are young, and slows down with time.
Because old forests sequester carbon for a long time but provide essentially no net uptake.
For example well stocked trees in forests typically sequester carbon at a maximum rate
between age 10 and 20–30. At age 30 years about 200 to 520 tons CO2-e are sequestered per
ha in forests with productivity ranging from low to high (Australian Greenhouse Office,

49
2001). After this age, rate of sequestration slows gradually until maturity at about 80 to 100+
years and flattens out from then because the growth is balanced by decay (Jonson and
Coburn, 2010). However, a nature report indicates that mass growth rate increases
continuously with tree size for most species, thus large, old trees do not act simply as
senescent carbon reservoirs but actively fix large amounts of carbon compared to smaller
trees (Stephenson et al., 2014). The accelerated production of dead wood or coarse woody
debris and the attendant maintenance of the growing space for live carbon accumulation also
expand the carbon sink in old forests (McGarvey et al., 2015).
There are three main ways by which forestry practices promote sustainable management of
forests and at the same time conserve and sequester carbon. The first one is management for
conservation of existing carbon pools in forests by reducing deforestation, changing
harvesting regimes, and protecting forests from other anthropogenic disturbances. Second is
the management for expanding carbon storage by increasing the area and/or carbon density in
native forests, plantations, and agroforestry and/or in wood products. Third one is
management for substitution by increasing the transfer of forest biomass carbon into products
such as biofuels and long- lived wood products that can be used instead of fossil- fuel based
products.
Conserving old forests also serves many political objectives, which include protection of
biodiversity and climate mitigation by conserving forest carbon stock and avoiding GHGs
emission to the atmosphere. Forest-management techniques that increase both the amount of
wood produced and the carbon stock retained in the forest needs prioritization (Mohapatra,
2008). Replacing dying or low-productivity stands, protecting young sprouts from damage
after harvest, planting tree mixes that are more resilient, and optimizing fertilizer use and tree
growth by adding nitrogen-fixing species in afforestation programmes will all contribute to
climate-change mitigation no matter how the global carbon sink evolves.
When forests are harvested, the carbons they contain quickly return to the atmosphere as the
woody tissue is burned or converted to products, such as paper, that are short- lived.
Alternative use of wood in construction work or in making furniture retains carbon during
their life-times and act as carbon sinks. Thus a post harvest approach that reduces waste and
puts most of the wood into long- lived products is an effective strategy to help reduce global

50
atmospheric carbon. Effective forest management like fertilization and use of N-fixing
vegetation also leads to enhance soil carbon and nitrogen (Johnson and Curtis, 2001). While
deforestation, land clearing, and forest and grassland fires are major sources of GHGs
emissions, their conservation provides multiple benefits by conserving biodiversity and
regulating climate change effects. Incentives of different forms may encourage the
communities to maintain natural regeneration payments for climate services and community
fire control (Johnson and Coburn, 2010).
Utilization of resilient characters of forests by which forest recovers following major
disturbances also leads to enhanced carbon storage (Gunderson, 2000). Forest resilience is an
emergent ecosystem property resulting from biodiversity at multiple scales, from genetic to
landscape diversity (Thompson et al., 2009). To sustain the goods and services forest eco-
systems must recover after disturbances and should not degrade over time. A related concept
of resilience is resistance, which is the capacity of a forest to resist minor disturbances over
time like death of a few trees or a chronic level of herbivory by insects. In the process the
surviving and recruited plants grow more quickly in response to the reduced competition, and
carbon productivity and live basal area recover to pre-outbreak levels within a few years or
decades (Carlson et al., 2012; Frokling et al., 2009; Hansen, 2014). Thus forests are generally
stable and change little as a result of minor disturbances and minor changes. For example,
canopy gaps created by the death of individual or small groups of trees are quickly filled by
the new and young trees (Martin et al., 2013). Forests may also be resistant to certain
environmental changes, such as weather patterns over time, because of redundancy among
the functional species (i.e., overlap or duplication in ecological functions performed by a
group of species) (Díaz and Cabido, 2001).
3.5 Restoring degraded watersheds and rangelands
Extensive areas of the world have been denuded of vegetation through land clearing for crops
or grazing and from overuse and poor management and the degradation of our environment
have exceeded the rate of conservation (Cairns Jr. 1998). Degradation has not only generated
a huge amount of GHGs emissions, but local people have lost a valuable livelihood asset as
well as essential watershed functions. Extent of degradation of forest and grazing lands can
be understood by a study carried out in Jodhpur district of Rajasthan, where average organic
carbon stock (both live biomass both above- and below-ground, SOC in top 1 m soil layer)
51
ranged from 16.16 Mg ha-1 in pastureland to 26.83 Mg ha-1 in sacred groves showing spatial
variation from 14.43 Mg ha-1 in Bilara to 25.67 Mg ha-1 in Balesar range (Singh, 2015).
Restoring vegetative cover on degraded lands can be a win-win-win strategy for addressing
climate change, rural poverty, and water scarcity (Arnalds, A., 2004; Singh and Rathod,
2002; Singh et al., 2013). Improved land management could offset a quarter of global
emissions from fossil fuel use in a year and one need to pursue land use solutions in addition
to efforts to improve energy efficiency and speed the transition to renewable energy for
enhancing carbon storage. Likewise, use of native species selected in the vicinity of the
working area, as well as the implementation of soil obtained from the nearby forest
fragments, could allow better restoration and carbon sequestration (Araujo et al., 2014). For
all of these, watershed approach is an important element, which help both in adaptation and
mitigation to climate change as soil and water conservation, moderation of the runoff,
enhancing ground water recharge and minimizing floods even during high intensity rainfall
enhance vegetation recovery and carbon sequestration (Bhati et al., 1997).
Restoration of degraded lands through afforestation not only improves herbaceous
biodiversity but also enhances water availability, people livelihoods and carbon
sequestration. For example, carbon sequestered during 2005 to 2010 in both vegetation and
soils ranged from 23.86 to 36.94 tons C ha-1 depending upon slopes categories, i.e. 29.92 t C
ha-1 in <10% slope to 34.08 tons C ha-1 in >20% slope, and rainwater harvesting devices, i.e.
30.29 tons C ha-1 in gradonie plots to 32.64 tons C ha-1 in box trench as compared to 25.29
tons C ha-1 in the control (Singh, 2013). The annual rate of carbon sequestration was 1.10
tons C ha-1 year-1 in vegetation and 4.93 tons C ha-1 year-1 in soils (Singh, 2013). Land-
sparing schemes that encourage the protection and regeneration of natural forests provide a
synergy between carbon and biodiversity conservation, and represent a promising strategy for
reducing the negative impacts of degraded land in tropical ecosystems (Gilroy et al., 2014).
However, trees use large quantity of water which may reduce water availability for other
vegetation, affecting hydrological cycle and put a limitation on plant growth and may create
a tradeoff between water use and carbon fixation (Holtum and Winter, 2010). Hetherington
and Woodward (2003) also estimated annual gross uptake of ~120 x 109 tons of carbon from
the atmosphere by vegetation worldwide by transpiring ~32.1 x 10¹² tons of H2O. Thus
plants lose, on average, 180 molecules of water for each molecule of CO 2 fixed at global
level.

52
Intensification and protection of ranglands from grazing also improves vegetation
characteristics and soil properties. In the study of Rong et al. (2014) vegetation biomass and
soil properties improved by removal of sheep grazing, but a less impact has been observed on
the species richness and diversity in extremely dry region. Li et al. (2014) observed increase
in vegetation cover, height and above- and belowground biomass, soil organic carbon and
total nitrogen concentration and a decrease in soil pH, electrical conductivity and soil bulk
density in the protected area. These authors also found recovery of vegetation in 6 years after
fencing, soil pH in 8 years, soil organic carbon in 16 years, total nitrogen in 30 years and
total phosphorus concentrations in 19 years after fencing. It was recommended to reduce
stocking rate by 1/3 of the current carrying capacity, managing grazing regime as 1-year of
grazing followed by a 2-year rest to sustain the current status and application of N- fertilizer
to shorten the differed period depending on the rate of application (Li et al., 2014).
Application of treatment like grazing plus ploughing resulted in the least SOC
(15.30 Mg C ha−1), whereas protection from grazing and shrub removal led to
28.49 Mg C ha−1 (Daryanto et al., 2013).
3.6 Efficient uses of fuels to reduce GHGs emission
Replacing fossil fuels with sustainably-produced biomass can reduce the net flow of CO2 to
the atmosphere. Substituting biomass for fossil fuels in electricity and heat production is, in
general, less costly and provides larger CO2 reduction per unit of biomass than substituting
biomass for gasoline or diesel used in vehicles (Gustavsson et al., 1995). Fuelwood
extraction from forests is an important driver of deforestation and forest degradations.
According to an estimate, about 2.7 billion people or 40% of the global population rely on
the use of biomass to meet their residential energy needs, particularly for cooking (IEA,
2006; IEA, 2010). Conventional methods of cooking is not efficient and results in the
unnecessary use of fuelwood by people. Thus emissions of GHS especially CO 2 can also be
reduced with the help of improved biomass cook-stoves. Development of biomass stoves
with better efficiency for meeting household cooking energy requirement will not only
beneficial in reducing GHGs accumulation in atmosphere but also reduce the accelerating
pressure on existing biomass resources. The study of Panwar et al. (2009) indicated better
acceptability of double pot stoves (85%) as compared to single pot stoves (30%), which
showed about 21% and 25% efficiency, respectively. It was observed that an improved
53
biomass cookstove can save about 161 kg of CO2 annually. Likewise LPG also has potential
impact in reducing GHGs emission. For example, 1 GJ (giga joule) of cooking heat can be
delivered by using 400 kg of air-dried wood or 36 kg of LPG (a bit less than three typical 13-
kg cylinders). In terms of CO2 emissions, there is emission of 700.7 kg CO2 per GJ energy
generation, whereas same amount of energy can be generated by emitting 116.8 kg CO 2
when LPG is used. A developing world household consumes about 2 tons of wood per year
which is the equivalent of approximately 10 trees or 180 kg of LPG. Thus switching from
harvested wood to LPG can reduce net carbon emissions by 67% (Johnson, nil).
Emission from woods equivalent to (105.1 /15%) ×100% = 700.7 Kg CO2/GJ
Emission from LPG is (70.1/60%) × 100% =116.8 kg CO2/GJ
According to a survey, Chen et al. (2015) observed that approx. 98% of households collect
firewood from nearby forests and use it as fuel wood for cooking, whereas the remaining 2%
use both charcoal and fuel wood for this purpose. Average fuel wood consumption was
2.0±0.1 Mg household−1 yr−1 for daily cooking or 3.8±0.2 Mg CO2 of carbon emissions
while using three-stone cooking stove. Likewise burning wood for protecting cattle from
insects consumed 4.3±0.2 Mg wood household−1 yr−1 or 7.9±0.3 Mg CO2 of carbon
emissions. Conservative calculation by using improved cook stoves and mosquito nets to
protect cattle indicated a reduction in emission up to 1.1 Tg CO 2 for the whole study site. To
realize this substitution, approx. US$ 15–25 MgCO 2−1 is needed depending on discount rates
and amounts of emission reduction. Likewise Beyene et al. (2015) estimated that on average
one improved stove saves approx. 634 kilograms of fuel wood per year or about 0.94 tons of
carbon dioxide equivalent per year is cheaper for which the carbon sequestration from each
stove deployed appeared worth about $12.59 at May 2015 California auction price of
$13.39/ton.
4. SYNTHESIS AND FUTURE PERSPECTIVES
Anthropogenic activities including land use changes have accelerated the rate of GHGs
accumulation in atmosphere contributing more than natural factors in increasing our earth’s
temperature. Such global change in climate is influencing the local patterns of temperature
and precipitation and is ultimately affecting food supplies and farmer livelihoods. Production
of livestock, an important source of income and livelihood security in dry areas, has many
54
significant ecological impacts also that include destruction of soil biocrusts, killing of
predators, water pollution, clearing of forests for pasture etc., contributing to global GHG
emissions. Further, rural people of developing countries are least worried about climate
change or environmental amelioration and are rather more cautious about feeding their
families. To mitigate the effects of increasing atmospheric GHGs one must give a thought to
work on both to control and reduce the GHGs emissions and sequester atmospheric gases by
applying various technological and management options. For this, reduction in and efficient
use of fossil fuels/biomass, harnessing of alternative sources of energy, use of improved
stoves/LPG and effective management of land resources including forests are on one side and
enriching soil carbon, promoting woody perennials including grasses, increasing land under
reforestation and afforestation, restoration of degraded lands by conserving soil and water,
and effective management of grazing lands and livestock are the mitigation options of
climate change. But most of these involve effective participation of local people, which can
only be done by ensuring their day to day needs. Equally important is the ability of different
sectors to adapt to changing patterns of climate so that resource availability could be
enhanced, yield and productivity could be increased and production cost could be reduced.
Planned adaptation including changes in policies, institutions and dedicated infrastructure
may facilitate and maximize the long-term benefits of adaptation responses to climate
change. Some important adaptations and mitigation to climate change could be:
Increasing water availability through rainwater harvesting for both drinking and rainfed
irrigation.
Improving water, soil and nutrition management practices, reducing inefficiency in
water use, adjusting to the pattern of food consumption and promoting eco- friendly
adaptation.
Research and application of crop improvement that includes preservation and
enhancement in plant and animal genetic resources, adoption of crop varieties resistant
or adapted to increasing heat and drought stress, and cropping according to time or
location of cropping activities conducive to local weather pattern.
Use of drip irrigation for horticulture and vegetable crops and night sprinkler in
agriculture to minimize water uses.
Diversifying towards rotation systems, integrated farming system including tree
integration and shelter belts for improved soil–water retention and reduced soil erosion;

55
Integrated pest and pathogen management and developing and using varieties and
species resistant to pests and diseases.
Optimizing livestock stocking rates and grazing, adjusting pasture rotation and forage
composition (C3 and C4 species), altering animal species/breeds more suited to
climatic variations and reassessing fertilizer use and supplementary feeds and
concentrates for livestock to minimize carbon emission.
Many dryland grasslands have shifted to Prosopis juliflora/ mesquite invasion. Though
many ecologists consider this shift as degradation, but deep-rooted mesquite had far
more carbon storage than the grasslands and help carbon sequestration.
Species selection for reforestation and afforestation considering climatic variation and
changing forest management option that includes mixed species and shifting to more
productive areas under new climate conditions and pest control management systems.
Involving local people in forest conservation, control of fire and species invasion, and
forest-based activities for diversification of rural incomes.

56
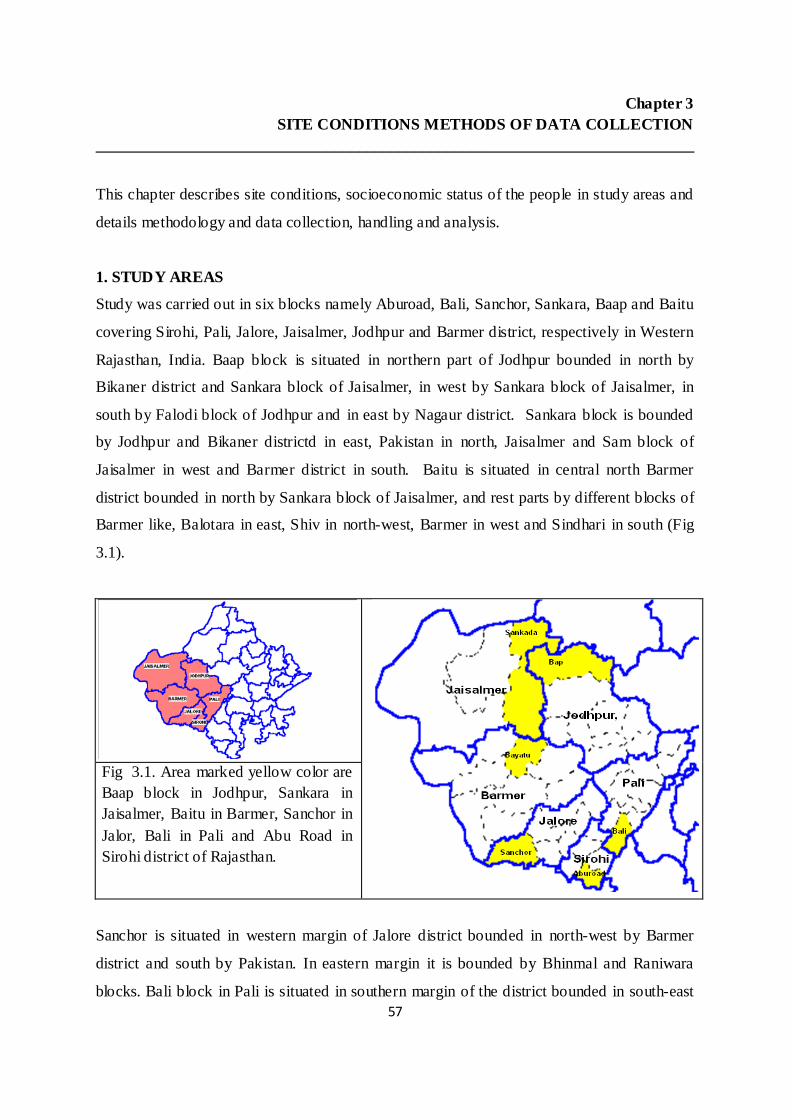
57
Chapter 3 SITE CONDITIONS METHODS OF DATA COLLECTION
___________________________________________________________________________
This chapter describes site conditions, socioeconomic status of the people in study areas and
details methodology and data collection, handling and analysis.
1. STUDY AREAS
Study was carried out in six blocks namely Aburoad, Bali, Sanchor, Sankara, Baap and Baitu
covering Sirohi, Pali, Jalore, Jaisalmer, Jodhpur and Barmer district, respectively in Western
Rajasthan, India. Baap block is situated in northern part of Jodhpur bounded in north by
Bikaner district and Sankara block of Jaisalmer, in west by Sankara block of Jaisalmer, in
south by Falodi block of Jodhpur and in east by Nagaur district. Sankara block is bounded
by Jodhpur and Bikaner districtd in east, Pakistan in north, Jaisalmer and Sam block of
Jaisalmer in west and Barmer district in south. Baitu is situated in central north Barmer
district bounded in north by Sankara block of Jaisalmer, and rest parts by different blocks of
Barmer like, Balotara in east, Shiv in north-west, Barmer in west and Sindhari in south (Fig
3.1).
Fig 3.1. Area marked yellow color are Baap block in Jodhpur, Sankara in Jaisalmer, Baitu in Barmer, Sanchor in Jalor, Bali in Pali and Abu Road in Sirohi district of Rajasthan.
Sanchor is situated in western margin of Jalore district bounded in north-west by Barmer
district and south by Pakistan. In eastern margin it is bounded by Bhinmal and Raniwara
blocks. Bali block in Pali is situated in southern margin of the district bounded in south-east
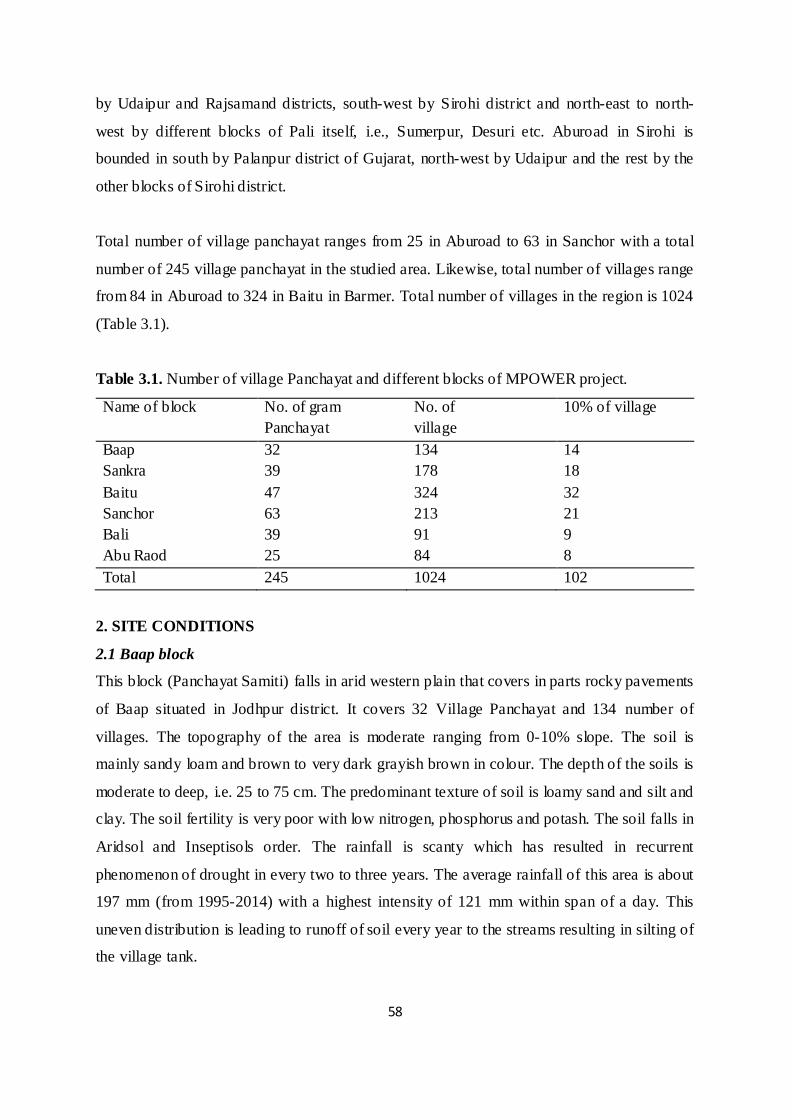
58
by Udaipur and Rajsamand districts, south-west by Sirohi district and north-east to north-
west by different blocks of Pali itself, i.e., Sumerpur, Desuri etc. Aburoad in Sirohi is
bounded in south by Palanpur district of Gujarat, north-west by Udaipur and the rest by the
other blocks of Sirohi district.
Total number of village panchayat ranges from 25 in Aburoad to 63 in Sanchor with a total
number of 245 village panchayat in the studied area. Likewise, total number of villages range
from 84 in Aburoad to 324 in Baitu in Barmer. Total number of villages in the region is 1024
(Table 3.1).
Table 3.1. Number of village Panchayat and different blocks of MPOWER project.
Name of block No. of gram Panchayat
No. of village
10% of village
Baap 32 134 14 Sankra 39 178 18 Baitu 47 324 32 Sanchor 63 213 21 Bali 39 91 9 Abu Raod 25 84 8 Total 245 1024 102
2. SITE CONDITIONS
2.1 Baap block
This block (Panchayat Samiti) falls in arid western plain that covers in parts rocky pavements
of Baap situated in Jodhpur district. It covers 32 Village Panchayat and 134 number of
villages. The topography of the area is moderate ranging from 0-10% slope. The soil is
mainly sandy loam and brown to very dark grayish brown in colour. The depth of the soils is
moderate to deep, i.e. 25 to 75 cm. The predominant texture of soil is loamy sand and silt and
clay. The soil fertility is very poor with low nitrogen, phosphorus and potash. The soil falls in
Aridsol and Inseptisols order. The rainfall is scanty which has resulted in recurrent
phenomenon of drought in every two to three years. The average rainfall of this area is about
197 mm (from 1995-2014) with a highest intensity of 121 mm within span of a day. This
uneven distribution is leading to runoff of soil every year to the streams resulting in silting of
the village tank.
59
2.2 Sankara block
It is part of hyper arid zone with high level rocky structural plains between Pokharan–
Jaisalmer with isolated hills of granites, rhyolites, sandstones, limestone and rocky
pavements and a Panchyat Samiti of Jaisalmer district of Rajasthan. There were 39 Village
Panchayat and 178 villages in this block according to census 2001. The areas have
undulating dunes, sandy plains with shallow soils and saline depressions. Overall the area is
plain with gentle slope. Rainfall varies between 20 and 30 cm annually, where the southern
part of the block receives relatively more rainfall as compared to the northern part of the
block. Average annual rainfall in this region during 1995-2014 is 258.3 mm with average
rainy days of 14.7 (Table 3.2 & 3.3). Summer temperatures are always high that touches
50°C during the day and falls to less than 0°C during the night of winter months of December
and January. The soil is sandy which is porous comprising of more of gravel and less silt and
clay content, though it varied up to sandy- loam in texture. The consistency and depth vary
according to the topographical features. On gently sloping rocky structural plains between
Pokharan and Jaisalmer it supports shallow, excessively drained, loamy/sandy skeletal,
slightly alkaline and lithic soils of varying colours. In the gently sloping interdunal plains,
soils consist of moderately deep to deep, well drained, coarse loamy to sandy, slightly to
moderately alkaline. The low-lying loams are heavier and may have a hard pan of clay,
calcium carbonate (CaCO3) or gypsum.
2.3 Baitu block
There were 47 village panchayat and 324 villages in this block, which is in 'Arid Western
plain' agroclimatic zone and a Panchayat Samiti of Barmer district. The area is a vast sand
covered tract with substratum of gneiss, hornblende and quartz. The sandy plain is broken by
sand hills of height ranging from 91 to 122 m. This area is dreary and inhospitable and forms
part of Thar Desert. The soil texture is sandy to sandy loam, becoming slightly heavier with
depth. Calcium carbonate is at varying depth sand is frequently cemented. The average
annual rainfall is 271.5 mm. However data recorded for 1995 to 2014 indicated average
rainfall and number of rain days 271.5 mm and 14.5 days, respectively. The temperature in
the area ranges between 28º to 48º C during summer and 7º to 32º C during winter. The
major crops in the area are Bajra, Moong, Moth, Til, Guar and 65% land is under cultivation,
5% land fallow and 5% land is wasteland. The soils are commonly occurring on gently to
moderately sloping dunes or gently sloping interdunal plains as either dominant or

60
subdominant soils. Qualitatively the soils are very poor and devoid of humus content. These
soils are very deep and sandy in nature, mostly associated with dunes, inter dunes and sandy
plain. These soils cover about 31 percent of the area.
2.4 Sanchor block
This block falls in the agro-climatic zone 'Transitional Plain of Luni Basin' and part of Jalore
district of Rajasthan. According to census 2011, there were 63 village panchayat and 213
villages in this block. The region has arid climate with an annual rainfall of 150 to 700 mm.
It is drained by river Luni, which is seasonal and flows only during the rainy season.
However, the average annual rainfall recorded during 1995-2014 is about 414.2 mm. The
temperature in the area ranges between 38 - 48º C during summer and 20 – 25º C during
winter. The soil texture is sandy loam. The major crop in the area is Bajra. About 85% land
is under cultivation, 15% land fallow and 36.45% land is irrigated through tube wells. In this
region, about 990 households are BPL, 165 are landless, and 685 are small and marginal
farmers. Average land holding in the area is about 3.54 ha. About 91.27% area is single
cropped area and 8.71% is double cropped. Major communities are Rajput, Dewasi, Kumhar,
Suthar, Megwal and Bhil.
2.5 Bali block
This block falls in between 'Transitional Plain of Luni Basin' and Sub-humid Southern Plains
and the Aravalli Hills' agroclimatic zone in Pali district of Rajasthan. There were 39 village
panchayat and 91 villages in Bali block according to census 2001. Annual average rainfall is
300-600 but the average annual rainfall is 587.1 mm during 1995-2014. The temperature in
the area ranges between 45 - 50º C during summer. Soil texture in this region is sandy loam
to clay loam in arable area and in non-arable areas the soil texture is sandy loam mixed with
Kankar and Pebbles, somewhere disintegrated rock and few area is rock-out. The major crops
in the area are Maize, Wheat, Arandi, Urad, Masturd, Groundnut, Cotton, Chilly and Tomato.
About 37.63% land is under cultivation, 2.79% land is fallow and 39.19% land is wasteland.
About 13.26% land is irrigated through wells and saran (irrigated through diverted stream
water). Average land holding in the area is 0.64 ha. About 26.11% area is single cropped and
11.51% is double cropped. The main source of irrigation is wells and Saran.

61
2.6 Abu road block
This block covered under 'Sub humid Southern Plain' agroclimatic zone and situated in Sirohi
district. Number of village panchayat and villages in this block was 25 and 84 according to
census 2001. Annual rainfall varies from 500 to 600 mm (sometimes >1000 mm) with an
increasing trend towards the east, though data of 1995 to 2014 indicated average annual
rainfall and number of rain days as 685.9 mm and 31.4 days, respectively. Summer
temperature reaches up to 45 ºC during summer and minimum temperature goes down to 8°C
during winter. The landscape is mainly comprised of pediments, hills, intervening basins,
plains. A significant portion is occupied by rock outcrops while the pediment and plains are
having very deep to deep, with intermittent moderately shallow to moderately deep, either
calcareous or non-calcareous, fine loamy/coarse loamy soils occurring in association as
dominant and subdominant soil families. Hillocks have moderately shallow to moderately
deep, well drained, coarse loamy to fine loamy slightly alkaline soils, whereas gently sloping
hills have moderately deep to deep, well drained fine loamy soils.
2.7 Rainfall pattern in study area
Rainfall in different study areas showed high temporal as well as spatial variations. It ranges
from 197.0 mm in Falodi (Baap area) to 689.5 mm annually in Aburoad area (Table 3.2). The
area in Jodhpur, Jaisalmer and Barmer indicates lesser rainfall as compared to those in Jalore,
Pali and Sirohi areas. During 1995 to 2014, lowest annual rainfall was in 2002 ranging from
48.5 mm in Sankada area to 268.0 mm in Bali with an average value 118.60 mm across the
studied areas. The average annual rainfall was highest (711.4 mm) in 2006, though it varied
widely in the studied area. For example, the average rainfall was highest in 2013 in Baap
area, in 2010 in Sankada and Sanchor areas and in 2006 in rest of the areas (Table 3.2). As
compared to the overall average of 402.33 mm annually, below average rainfall was in the
years 1995, 1996, 1998, 1999, 2000, 2001, 2002, 2004, 2005, 2008, 2009, 2012 and 2014.
Among the blocks, Baap, Sankara and Baitu showed low annual rainfall as compared to the
other three blocks. Average number of rain days in the studied blocks ranges from 6-28 in
Baap areas, Jodhpur, 5-22 days in Sankada area, Jaisalmer, 9-22 in Baitu area, Barmer, 7-37
in Sanchor area of Jalore, 14-43 in Bali area of Pali, and 15-50 in Aburoad, Sirohi district,
average value of rain days was 14.8, 14.7, 14.5, 18.7, 24.9 and 31.4 in respective block.
Across the studied blocks, average rain days observed in the studied areas ranged between
9.8 days in 2002 to 32.0 days in 2010 with overall average of 19.8 days in the areas. As
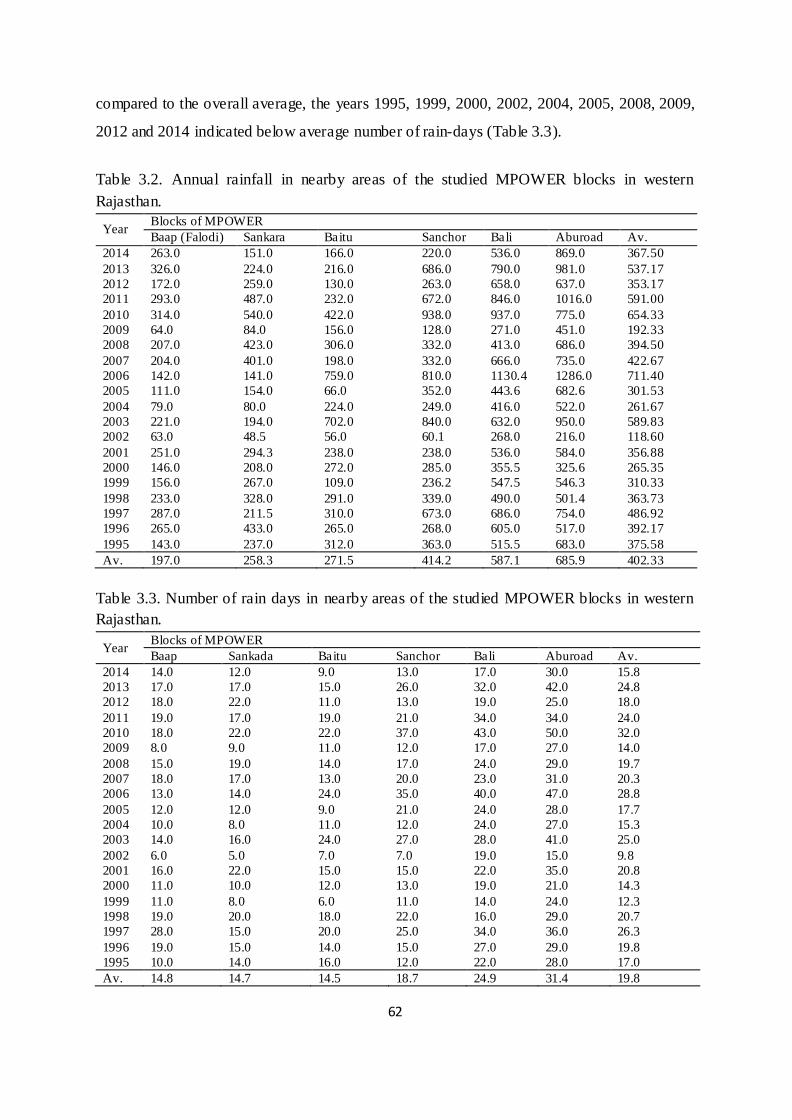
62
compared to the overall average, the years 1995, 1999, 2000, 2002, 2004, 2005, 2008, 2009,
2012 and 2014 indicated below average number of rain-days (Table 3.3).
Table 3.2. Annual rainfall in nearby areas of the studied MPOWER blocks in western Rajasthan.
Year Blocks of MPOWER Baap (Falodi) Sankara Baitu Sanchor Bali Aburoad Av.
2014 263.0 151.0 166.0 220.0 536.0 869.0 367.50 2013 326.0 224.0 216.0 686.0 790.0 981.0 537.17 2012 172.0 259.0 130.0 263.0 658.0 637.0 353.17 2011 293.0 487.0 232.0 672.0 846.0 1016.0 591.00 2010 314.0 540.0 422.0 938.0 937.0 775.0 654.33 2009 64.0 84.0 156.0 128.0 271.0 451.0 192.33 2008 207.0 423.0 306.0 332.0 413.0 686.0 394.50 2007 204.0 401.0 198.0 332.0 666.0 735.0 422.67 2006 142.0 141.0 759.0 810.0 1130.4 1286.0 711.40 2005 111.0 154.0 66.0 352.0 443.6 682.6 301.53 2004 79.0 80.0 224.0 249.0 416.0 522.0 261.67 2003 221.0 194.0 702.0 840.0 632.0 950.0 589.83 2002 63.0 48.5 56.0 60.1 268.0 216.0 118.60 2001 251.0 294.3 238.0 238.0 536.0 584.0 356.88 2000 146.0 208.0 272.0 285.0 355.5 325.6 265.35 1999 156.0 267.0 109.0 236.2 547.5 546.3 310.33 1998 233.0 328.0 291.0 339.0 490.0 501.4 363.73 1997 287.0 211.5 310.0 673.0 686.0 754.0 486.92 1996 265.0 433.0 265.0 268.0 605.0 517.0 392.17 1995 143.0 237.0 312.0 363.0 515.5 683.0 375.58 Av. 197.0 258.3 271.5 414.2 587.1 685.9 402.33
Table 3.3. Number of rain days in nearby areas of the studied MPOWER blocks in western Rajasthan.
Year Blocks of MPOWER Baap Sankada Baitu Sanchor Bali Aburoad Av.
2014 14.0 12.0 9.0 13.0 17.0 30.0 15.8 2013 17.0 17.0 15.0 26.0 32.0 42.0 24.8 2012 18.0 22.0 11.0 13.0 19.0 25.0 18.0 2011 19.0 17.0 19.0 21.0 34.0 34.0 24.0 2010 18.0 22.0 22.0 37.0 43.0 50.0 32.0 2009 8.0 9.0 11.0 12.0 17.0 27.0 14.0 2008 15.0 19.0 14.0 17.0 24.0 29.0 19.7 2007 18.0 17.0 13.0 20.0 23.0 31.0 20.3 2006 13.0 14.0 24.0 35.0 40.0 47.0 28.8 2005 12.0 12.0 9.0 21.0 24.0 28.0 17.7 2004 10.0 8.0 11.0 12.0 24.0 27.0 15.3 2003 14.0 16.0 24.0 27.0 28.0 41.0 25.0 2002 6.0 5.0 7.0 7.0 19.0 15.0 9.8 2001 16.0 22.0 15.0 15.0 22.0 35.0 20.8 2000 11.0 10.0 12.0 13.0 19.0 21.0 14.3 1999 11.0 8.0 6.0 11.0 14.0 24.0 12.3 1998 19.0 20.0 18.0 22.0 16.0 29.0 20.7 1997 28.0 15.0 20.0 25.0 34.0 36.0 26.3 1996 19.0 15.0 14.0 15.0 27.0 29.0 19.8 1995 10.0 14.0 16.0 12.0 22.0 28.0 17.0 Av. 14.8 14.7 14.5 18.7 24.9 31.4 19.8
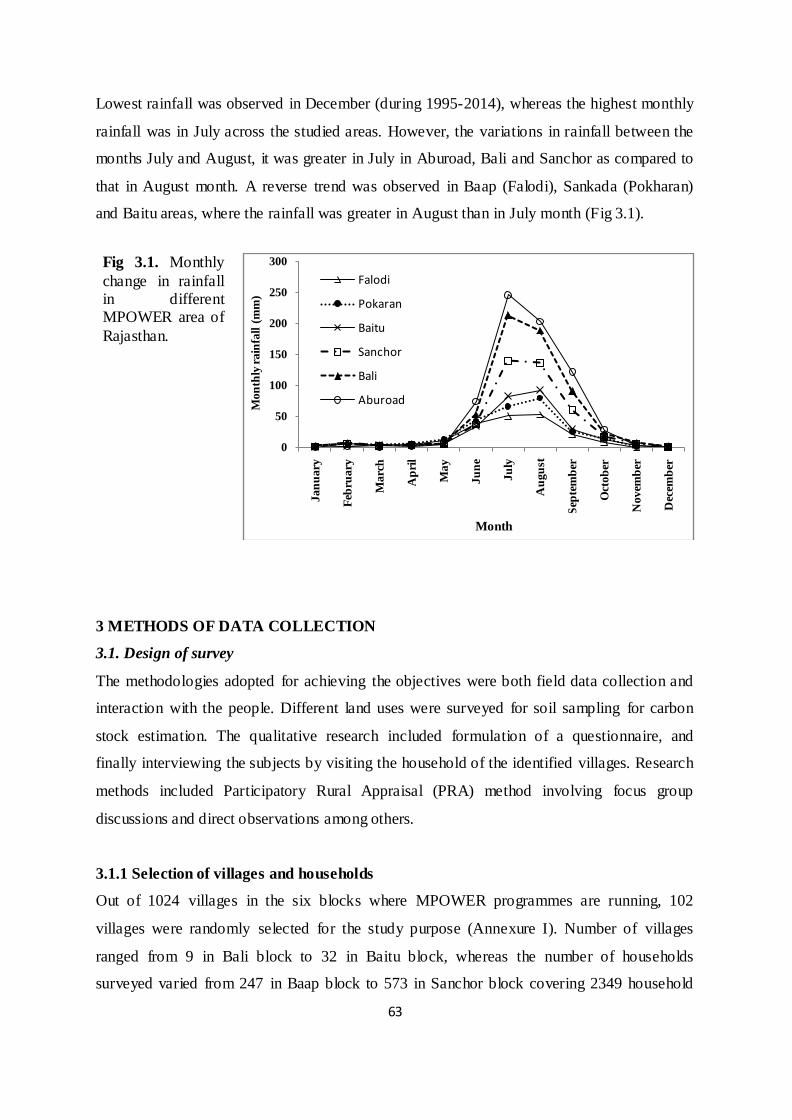
63
Lowest rainfall was observed in December (during 1995-2014), whereas the highest monthly
rainfall was in July across the studied areas. However, the variations in rainfall between the
months July and August, it was greater in July in Aburoad, Bali and Sanchor as compared to
that in August month. A reverse trend was observed in Baap (Falodi), Sankada (Pokharan)
and Baitu areas, where the rainfall was greater in August than in July month (Fig 3.1).
Fig 3.1. Monthly change in rainfall in different MPOWER area of Rajasthan.
3 METHODS OF DATA COLLECTION
3.1. Design of survey
The methodologies adopted for achieving the objectives were both field data collection and
interaction with the people. Different land uses were surveyed for soil sampling for carbon
stock estimation. The qualitative research included formulation of a questionnaire, and
finally interviewing the subjects by visiting the household of the identified villages. Research
methods included Participatory Rural Appraisal (PRA) method involving focus group
discussions and direct observations among others.
3.1.1 Selection of villages and households
Out of 1024 villages in the six blocks where MPOWER programmes are running, 102
villages were randomly selected for the study purpose (Annexure I). Number of villages
ranged from 9 in Bali block to 32 in Baitu block, whereas the number of households
surveyed varied from 247 in Baap block to 573 in Sanchor block covering 2349 household
0
50
100
150
200
250
300
Janu
ary
Febr
uary
Mar
ch
Apr
il
May
June
July
Aug
ust
Sept
embe
r
Oct
ober
Nov
embe
r
Dec
embe
r
Falodi
Pokaran
Baitu
Sanchor
Bali
AburoadMon
thly
rain
fall
(mm
)
Month

64
across the study areas (Table 3.4). To understand local communities’ perceptions on climate
variability issues and establish its impacts and adaptation strategies, primary data were
obtained using different Participatory Research Approaches (PRA) including focus group
discussions and household questionnaires by surveying a sample size of 10% of all
households of a village (Lema and Majule, 2009).
Four levels of stratification were done to ensure proper representation of the block. The first
level was geographic, i.e. number of villages and the second level of stratification was the
size of the village. Household is the unit of analysis, where ‘household’ is defined as a farm
family unit consisting of a group of interrelated people living together, sharing the same
dwelling house, working on the family farm, making farm-level decisions (including
adaptation) and pooling their labour to manage their farm under the prime leader-ship of the
household head (Davies and Bennett 2007; Solomon et al., 2007). In the third level of
stratification, villages were further divided on the basis of economy as well as castes like
scheduled caste, scheduled tribe, BPL and Non-BPL households in general. In the fourth
level of stratification, population was divided male and female and their age like <25 year,
25-45 years age and >45 years age.
Table 3.4. Number of soil samples collected based on available land uses in the selected 102
village in different blocks of MPOWER.
SNo Block Total Village in block
Total no of household in the
village
Interaction with household
1. Aburoad 10 3213 320 2. Baitu 32 4823 429 3. Bali 9 5550 339 4. Baap 14 2840 247 5. Sanchore 17 7381 573 6. Sankra 20 4884 441 TOTAL 102 28691 2349
3.1.2 Selection of land use
Out of 9 fold classification of land uses, five major land uses are agriculture, forests,
Oran/sacred groves (community lands), pasture and roadside. However, these five land uses
are not available in all the villages. Therefore, depending upon the availability of land use
types in the selected 102 number of villages soil sampling was done for carbon content

65
analysis. Vegetation status developed through afforestation, tree integration on farmlands or
pastureland was considered to monitor carbon stock in different land uses covering
mitigation option. Number of soil samples was defined based on the availability of land uses
(Table 3.4) and soil sampling from each land uses was done to monitor changes in soil
carbon- mitigating effects of the practice if there is increase in soil carbon and thus soil
carbon stock. Besides these land uses, fallow lands other than the current fallows are also
there, from which the soil samples were also collected (one in each block as the control and
to monitor the soil properties in these lands).
Agriculture land: Cropped area + area under current fallow
Forest land: Same as district forest lands or plantations.
Pastureland: Pasture lands + Culturable wasteland + Parat lands used for animal
grazing
Oran: A vegetated area set aside in name of some village diety and sacred in nature.
Roadside : Area between road and agriculture or other lands, and
Fallow land other than current fallows : areas left out of cultivation since more
than one years
3.2 Data collections
Survey was conducted during 2012-13 and 13-14 in all blocks namely Aburoad, Bali,
Sanchor, Sankra, Baap and Baitu.
3.2.1 Household Survey
Detailed questionnaires were prepared by keeping the objectives as the central theme. A
questionnaire was developed for recording observations and interaction with the people on
household basis (Annexure II). The main emphasis was given to record the data on the
adaptation and mitigation strategies adopted by the villagers. The questions were such
formulated that it sought information with respect to social data, farm holding, change in
irrigated area, cropping pattern, cropping intensity etc. In addition to this, a detailed account
of the topography, perception of soil fertility of the farm by the farmers, presence of water
resources and its adequacy were also collected covering different age classes of male (38.4%)
and female (61.6%) respondents (Table 3.5). An entire section was devoted on the various
aspects of farm management, wherein the performance of crops under mono and mixed
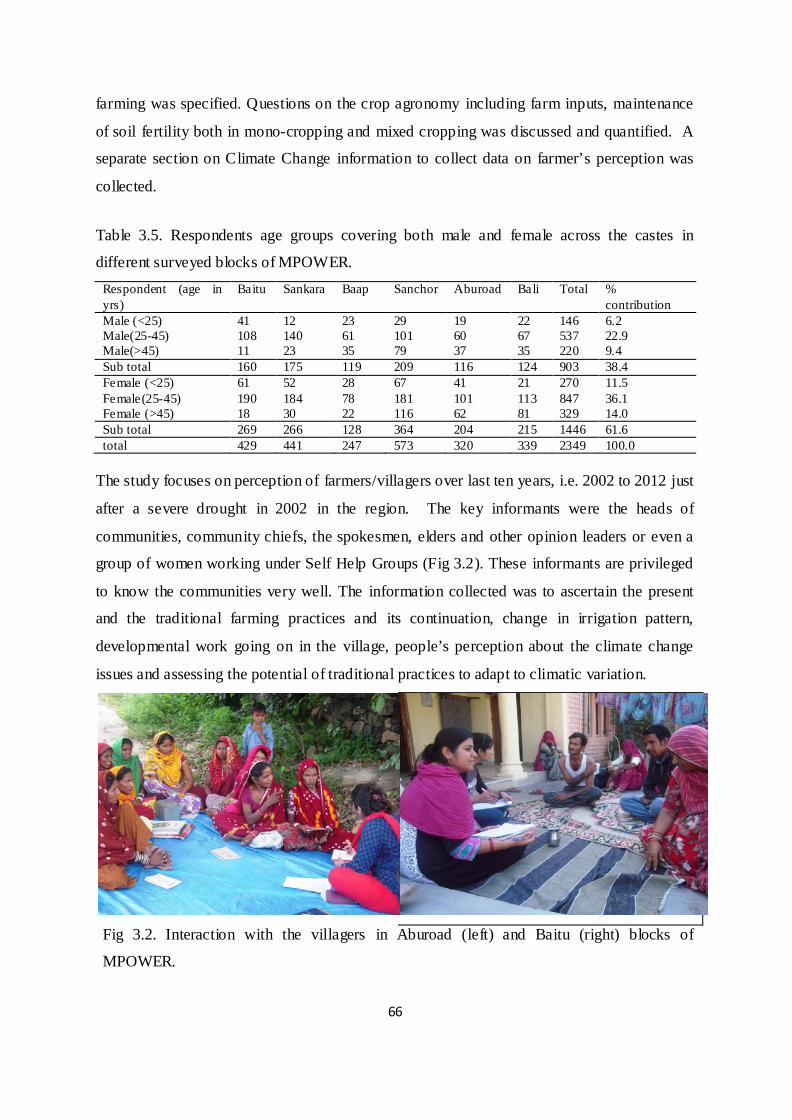
66
farming was specified. Questions on the crop agronomy including farm inputs, maintenance
of soil fertility both in mono-cropping and mixed cropping was discussed and quantified. A
separate section on Climate Change information to collect data on farmer’s perception was
collected.
Table 3.5. Respondents age groups covering both male and female across the castes in
different surveyed blocks of MPOWER. Respondent (age in yrs)
Baitu Sankara Baap Sanchor Aburoad Bali Total % contribution
Male (<25) 41 12 23 29 19 22 146 6.2 Male(25-45) 108 140 61 101 60 67 537 22.9 Male(>45) 11 23 35 79 37 35 220 9.4 Sub total 160 175 119 209 116 124 903 38.4 Female (<25) 61 52 28 67 41 21 270 11.5 Female(25-45) 190 184 78 181 101 113 847 36.1 Female (>45) 18 30 22 116 62 81 329 14.0 Sub total 269 266 128 364 204 215 1446 61.6 total 429 441 247 573 320 339 2349 100.0
The study focuses on perception of farmers/villagers over last ten years, i.e. 2002 to 2012 just
after a severe drought in 2002 in the region. The key informants were the heads of
communities, community chiefs, the spokesmen, elders and other opinion leaders or even a
group of women working under Self Help Groups (Fig 3.2). These informants are privileged
to know the communities very well. The information collected was to ascertain the present
and the traditional farming practices and its continuation, change in irrigation pattern,
developmental work going on in the village, people’s perception about the climate change
issues and assessing the potential of traditional practices to adapt to climatic variation.
Fig 3.2. Interaction with the villagers in Aburoad (left) and Baitu (right) blocks of
MPOWER.

67
Homogeneous groups of 10 to 15 persons were formed for focused group discussions in each
village identified for discussions. Socially active persons such as teachers, social workers,
opinion makers, literary persons, etc. were also interviewed. It was also ensured that the
respondent had fair knowledge about the implementation of the development schemes.
3.2.2 Data on village profile
Survey was also done to collect data on farm characteristics (e.g., type of production system,
households, total land area, landholding size, agricultural practices, income sources etc.) and
sensitivity to climate impacts (e.g., frequency and extent of crop losses) (Annexure IIA).
Data retrieved from the survey and the interviews was to systematize adaptation techniques
to current climate risk already applied by the farmers as well as to document the barriers they
face in incorporating such adjustments. Interviews were also conducted with representatives
of farmers’ cooperatives, agricultural services and meteorological department personnel
about their perception towards adaptational changes and future strategies.
3.2.3 Meteorological data: Data on rainfall was collected from different meteorological
research stations particularly the Tehsil head quarters of the studied area.
3.3 Soil sampling and characterization
Soil samples were collected from the central point of the demarcated plot in each land use. It
was collected in 0-30 cm soil layer using iron core sampler (Fig 3.3). The soil samples were
put in polythene bags and transported to laboratory for analysis work. Soil samples were air
dried and passed through a 2 mm mesh sieve so that stony part (gravel)/ fraction could be
separated from the soils and actual soil fraction (fine earth fraction) could be determined as:
Soil fraction = 1- G (gravel fraction).
3.3.1 Bulk density Measurement
An iron core cutter of fixed volume placed with a steel dolly on top was hammered
adequately and cautiously so that complete core should penetrate into the intact soil. Care
was taken not to rock the core cutter. Core samples were dug out taking care not to damage
the core. End of the core level with the ends of the cutter was trimmed by means of a spatula
and steel knives. Core samples were collected for 0-30 cm soil layer, respectively. In
laboratory, core samples were weighed to the nearest gram and put into dry to constant

68
weight at 110 ° C (for a constant weight) in a hot air Oven after putting the sample into a pre-
weighed glass beaker for 48 to 72 hrs. Dry weight of the samples recorded in g and volume
of the core recorded in cubic centimeters from its dimensions measured to the nearest 0.5
mm. Bulk density was calculated as equation provided below and it is reported as bulk
density in Mg/m³ (equivalent to g/cm³) on an oven-dry basis to the nearest 0.01 Mg/m³.
Bulk density (BD) (Mg/m3) = Mass of dry soil (g)/ Volume of Core (cm3).
Fig 3.3. Soil sampling using mechanical auger in a plantation in Baitu (left) and in a
pastureland in Sankara (right) block of MPOWER.
3.3.2 Soil organic carbon
Soil organic carbon (SOC) was determined using standard procedures (Walkley and Black
1934). Walkley-Black method (1934) of soil organic carbon (SOC) determination provides an
accurate estimate of SOC with 100% recovery and was used. In this potassium dichromate
(K2Cr2O7.5H2O) was used as the oxidant and ferrous ammonium sulphate (FeSO4
(NH4)2SO4.6H2O) as the reducing agent (IPCC, 2007).
% organic carbon =1.334 × [(Vblank -Vsample)/Wt] × 0.003 × M
Where Vblank is volume of ferrous ammonium sulfate required to titrate the blank (ml),
Vsample is the volume of ferrous ammonium sulfate required titrating the sample (ml), Wt is
weight of the soil sample (g), and M is the molarity of ferrous ammonium sulfate solution.

69
3.4 Calculations of soil carbon stock
Soil organic carbon (SOC) stock was calculated using the following equation (Batjes, 1996):
Qi= CiDiEi (1-Gi)*10000
Qi (tons or Mg C ha-1) is soil organic/inorganic carbon content in a soil layer i,
Ei is soil depth in meters),
Ci is carbon content in g C g-1 soil,
Di is bulk density in Mg m-3, and
Gi is volume fraction of coarse (gravel or stones of >2 mm size) elements defined as
SOCG/SICG in preceding sections.
3.5 Problems faced during study
Like other surveys and research studies, this study was also subjected to a variety of
problems, which could not be anticipated. Following problems were encountered during the
field survey:
3.5.1 Female Interviewees
All these districts have lowest female literacy rate. Because of negligible proportion of
working women, it was very difficult to interview female respondents. It is almost impossible
for a male interviewer to speak to a female because of the 'Purdah' system. To overcome this
problem, female interviewers were deputed and help of local functionaries of MPOWER
were taken.
3.5.2 Assembly and Lok Sabha Elections
There were Rajasthan Legislative Assembly elections, 2013 in Rajasthan on 1 December
2013 and the Indian general election of 2014 during 7 April to 12 May 2014. Because of
engagements of field functionaries and villagers in elections during this period almost all the
villages of these district and beneficiaries could not be contacted for interviews. Even the
finalized tour programmes were postponed.
3.5.3 Difficult terrain
The topography of the study area is not only diverse but difficult to survey also. The
settlement pattern is very scattered due to desert topography. Villages are spread over in
70
Dhanis (hamlets) particularly in Baap, Sankara and Baitu blocks which are difficult to reach.
Interviewers had to travel great distances to cover individuals and beneficiary’s households.
3.5.4 Respondent’s Apprehension
Respondents were observed to be very apprehensive in answering the questions. They
resisted in answering most of the questions and it appeared to false sometime. The resistance
was due to fear of not getting any benefit from the government if they revealed truth about
the implementation procedure.
3.6 Statistical Analysis
Data were analyzed statistically using SPSS version 8.0 statistical package. Since the data on
soil samples for bulk density, SOC, and soil carbon stock were obtained from 5 land uses
covering 6 blocks in western Rajasthan, these data were analyzed using two ways Analysis of
Variance (ANOVA). Wherever necessary the data were transformed to reduce
heteroscenesdity (Sokal and Rolf, 1981). Duncan Multiple Range Tests (DMRT) was applied
to group homogeneous subsets of districts at the P < 0.05 levels. To obtain relations among
rainfall, SOC and soil carbon stock, and population of human and livestock, Pearson
correlation coefficient was calculated.
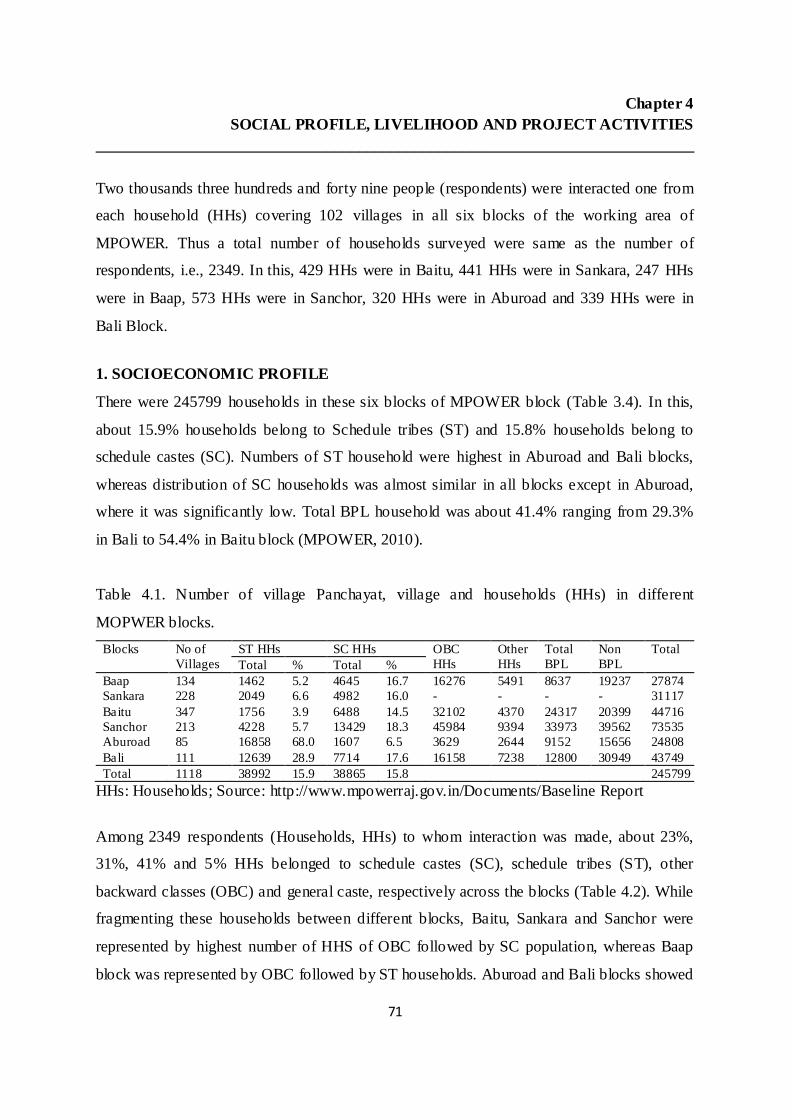
71
Chapter 4 SOCIAL PROFILE, LIVELIHOOD AND PROJECT ACTIVITIES
___________________________________________________________________________ Two thousands three hundreds and forty nine people (respondents) were interacted one from
each household (HHs) covering 102 villages in all six blocks of the working area of
MPOWER. Thus a total number of households surveyed were same as the number of
respondents, i.e., 2349. In this, 429 HHs were in Baitu, 441 HHs were in Sankara, 247 HHs
were in Baap, 573 HHs were in Sanchor, 320 HHs were in Aburoad and 339 HHs were in
Bali Block.
1. SOCIOECONOMIC PROFILE
There were 245799 households in these six blocks of MPOWER block (Table 3.4). In this,
about 15.9% households belong to Schedule tribes (ST) and 15.8% households belong to
schedule castes (SC). Numbers of ST household were highest in Aburoad and Bali blocks,
whereas distribution of SC households was almost similar in all blocks except in Aburoad,
where it was significantly low. Total BPL household was about 41.4% ranging from 29.3%
in Bali to 54.4% in Baitu block (MPOWER, 2010).
Table 4.1. Number of village Panchayat, village and households (HHs) in different
MOPWER blocks. Blocks No of
Villages ST HHs SC HHs OBC
HHs Other HHs
Total BPL
Non BPL
Total Total % Total %
Baap 134 1462 5.2 4645 16.7 16276 5491 8637 19237 27874 Sankara 228 2049 6.6 4982 16.0 - - - - 31117 Baitu 347 1756 3.9 6488 14.5 32102 4370 24317 20399 44716 Sanchor 213 4228 5.7 13429 18.3 45984 9394 33973 39562 73535 Aburoad 85 16858 68.0 1607 6.5 3629 2644 9152 15656 24808 Bali 111 12639 28.9 7714 17.6 16158 7238 12800 30949 43749 Total 1118 38992 15.9 38865 15.8 245799
HHs: Households; Source: http://www.mpowerraj.gov.in/Documents/Baseline Report
Among 2349 respondents (Households, HHs) to whom interaction was made, about 23%,
31%, 41% and 5% HHs belonged to schedule castes (SC), schedule tribes (ST), other
backward classes (OBC) and general caste, respectively across the blocks (Table 4.2). While
fragmenting these households between different blocks, Baitu, Sankara and Sanchor were
represented by highest number of HHS of OBC followed by SC population, whereas Baap
block was represented by OBC followed by ST households. Aburoad and Bali blocks showed

72
highest number of HHs under ST population, while other categories are significantly low in
number. In different blocks, households belongs to BPL (below poverty line) families ranges
from 48% in Sankara block in Jaisalmer to 80% in Bali block of Pali district with an average
value of 56% households in the studied blocks.
Table 4.2. Distributions of household among different casts in the studies areas MPOWER
blocks of western Rajasthan. Caste Baitu Sankara Baap Sanchor Aburoad Bali Total HHs % HHs % HHs % HHs % HHs % HHs % HHs % SC 151 35 146 33 - - 245 43 2 1 8 2 552 23 ST 13 3 7 2 36 15 47 8 311 97 314 93 728 31 OBC 244 57 240 54 181 73 268 47 5 2 17 5 955 41 GEN 21 5 48 11 30 12 13 2 2 1 - - 114 5 Total 429 100 441 100 247 100 573 100 320 101 339 100 2349 100
HHs - number of households
Numbers of household under BPL categories were below average value in all blocks except
in Bali, where the maximum number of households were in BPL category (Fig 4.1). In the
total household surveyed, average families involved in agriculture as the dominant
occupation was 93% in the studied area. It ranges from 88% in Sanchor block to 97% in
Baitu Block. In the studied block, Sankara and Sanchor blocks showed below average value
compared to the families in other blocks indicating their more involvement in other
occupations in addition to agriculture.
Fig 4.1. Percentage of BPL (A) and agrarian (B) families in different MPOWER Block of Western Rajasthan.
1.1 Types of houses
In western Rajasthan, a cluster of a few houses is known as “Dhani”. However, there are
0
20
40
60
80
Baitu Sankara Baap SanchorAburoad Bali
A
BPL
fam
ilies
(%
)
Blocks
0
20
40
60
80
100
Baitu Sankara Baap Sanchor Aburoad Bali
B
Agr
icul
ture
(% h
ouse
hold
s)
Blocks
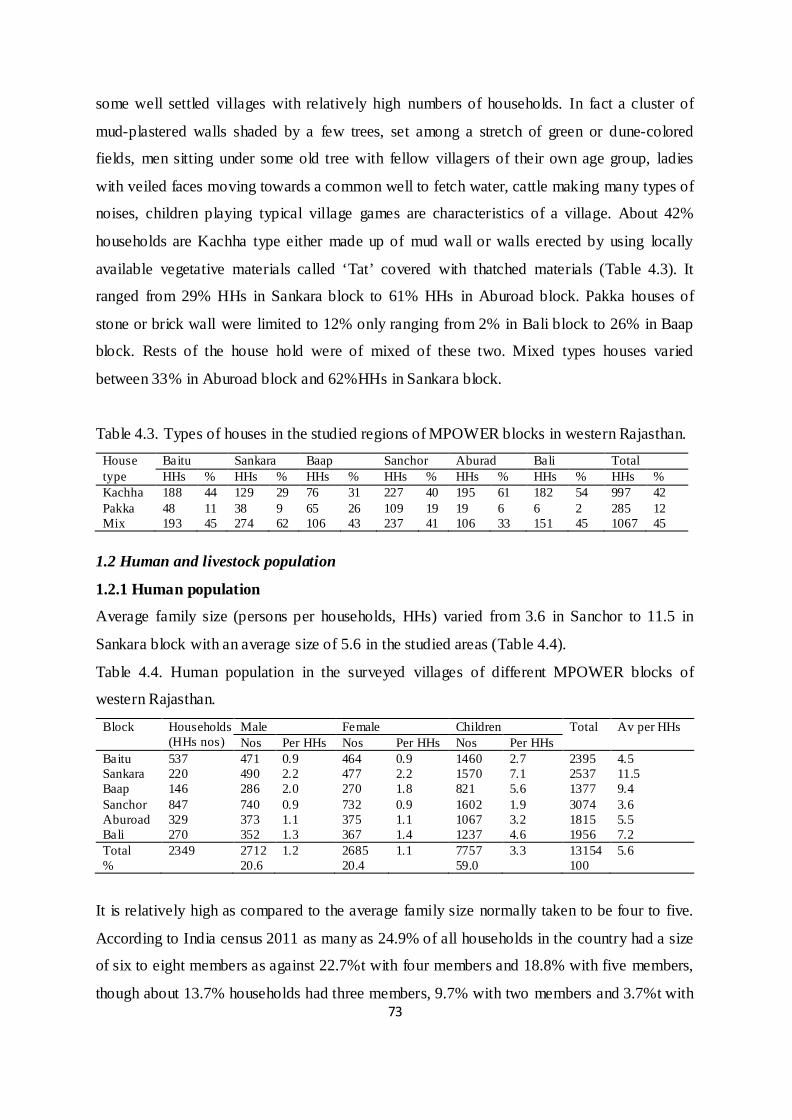
73
some well settled villages with relatively high numbers of households. In fact a cluster of
mud-plastered walls shaded by a few trees, set among a stretch of green or dune-colored
fields, men sitting under some old tree with fellow villagers of their own age group, ladies
with veiled faces moving towards a common well to fetch water, cattle making many types of
noises, children playing typical village games are characteristics of a village. About 42%
households are Kachha type either made up of mud wall or walls erected by using locally
available vegetative materials called ‘Tat’ covered with thatched materials (Table 4.3). It
ranged from 29% HHs in Sankara block to 61% HHs in Aburoad block. Pakka houses of
stone or brick wall were limited to 12% only ranging from 2% in Bali block to 26% in Baap
block. Rests of the house hold were of mixed of these two. Mixed types houses varied
between 33% in Aburoad block and 62%HHs in Sankara block.
Table 4.3. Types of houses in the studied regions of MPOWER blocks in western Rajasthan. House type
Baitu Sankara Baap Sanchor Aburad Bali Total HHs % HHs % HHs % HHs % HHs % HHs % HHs %
Kachha 188 44 129 29 76 31 227 40 195 61 182 54 997 42 Pakka 48 11 38 9 65 26 109 19 19 6 6 2 285 12 Mix 193 45 274 62 106 43 237 41 106 33 151 45 1067 45
1.2 Human and livestock population
1.2.1 Human population
Average family size (persons per households, HHs) varied from 3.6 in Sanchor to 11.5 in
Sankara block with an average size of 5.6 in the studied areas (Table 4.4).
Table 4.4. Human population in the surveyed villages of different MPOWER blocks of
western Rajasthan.
Block Households (HHs nos)
Male Female Children Total Av per HHs Nos Per HHs Nos Per HHs Nos Per HHs
Baitu 537 471 0.9 464 0.9 1460 2.7 2395 4.5 Sankara 220 490 2.2 477 2.2 1570 7.1 2537 11.5 Baap 146 286 2.0 270 1.8 821 5.6 1377 9.4 Sanchor 847 740 0.9 732 0.9 1602 1.9 3074 3.6 Aburoad 329 373 1.1 375 1.1 1067 3.2 1815 5.5 Bali 270 352 1.3 367 1.4 1237 4.6 1956 7.2 Total 2349 2712 1.2 2685 1.1 7757 3.3 13154 5.6 % 20.6 20.4 59.0 100
It is relatively high as compared to the average family size normally taken to be four to five.
According to India census 2011 as many as 24.9% of all households in the country had a size
of six to eight members as against 22.7%t with four members and 18.8% with five members,
though about 13.7% households had three members, 9.7% with two members and 3.7%t with

74
a single member in a family (Sunderarajan, 2012). This indicates that the villages in Sankara,
Baap and Bali showed above average family size and were mostly dominated by tribal
communities or muslim community. The total fertility rate (TFR) in Barmer (highest in
state), Jaisalmer, Jalore and Pali is more the state average of Rajasthan (3.1); Sirohi is almost
equal, whereas Jodhpur showed TFR of 2.8 during 2011-12
(http://www.nihfw.org/Doc/Policy_unit/State%20Brief-%20Rajasthan.pdf). Average male
and female individuals per HH were 1.2 (0.9 in Sanchor to 2.2 in Sankara block) and 1.1 (0.9
in Baitu to 2.2 in Sankara block) across the blocks. Number of children per household ranged
from 1.9 in Sanchor to7.1 in Sankara areas. Contribution of male, female and children to the
total population in the surveyed households was 20.6%, 20.4% and 59.0%, respectively.
1.2.2 Livestock population
Livestock play important role in moderating risks, providing resilience, diversify livelihood
and can be migrated or liquidated during calamities (Louhaichi et al., 2014). However,
livestock production systems in western Rajasthan are characterized by low productivity, low
fertility, shortage of feed resources – especially green forage and greater dependency of
resource poor farmers on livestock as a major source of income (Rangnekar, 2006).
Rajasthan has been famous for the excellent quality of its livestock. Officially recognized
livestock breeds of Rajasthan for example are: 7 breeds of cattle like Tharparkar, Kankrej,
Nagauri, Gir, Rathi, Malvi and Haryana; 8 breeds of sheep like Marwari, Jaisalmeri, Nali,
Magra, Pugal, Chokla, Malpura and Sonadi; 3 breeds of goat like Marwari, Sirohi and
Jakkharana; breeds of camel like Bikaneri, Jaisalmeri, Mewari, Marwari; and Marwari breed
of horse (Rathore, 2001). In present study, the number of livestock per HHs across the types
of animals varied from 2 in Sanchor to 11 in Sankara block with an average value of 4.3
animals per HHs in the region (Table 4.5). In this contribution of cow was 22.1% and that of
goat was 63.5%. Other animals like Buffalo, Ox, Sheep, Camel and Poultry was below <8%
and was greatest for Buffalo in this group. Poultry was observed only in tribal areas of
Aburoad and Bali blocks. While goat and sheep population has been observed high in Baitu
and Sankara, the population of buffalo was greater in Sanchor, Aburoad and Bali block as
compared to other blocks. However there is report about the herd size of livestock that vary
from 42 to 250 small ruminants and 35 to 220 cattle in western Rajasthan (Louhaichi et al.,
2014). Unfortunately, the number of camels in the region is significantly low.

75
Table 4.5. Livestock population in the surveyed villages of different MPOWER blocks of
western Rajasthan. Block HHs
(nos) Animals Total Per HHs Cow Buffalo Ox Goat Sheep Camel Poultry
Baitu 537 367 11 0 1839 53 2 0 2272 4.2 Sankara 220 434 4 2 1751 227 1 0 2419 11.0 Baap 146 450 3 0 656 2 0 0 1111 7.6 Sanchor 847 436 451 6 758 1 1 0 1653 2.0 Aburoad 329 176 196 39 591 3 0 4 1009 3.1 Bali 270 386 145 144 858 0 0 169 1702 6.3 Total 2349 2249 810 191 6453 286 4 173 10166 4.3 % - 22.1 8.0 1.9 63.5 2.8 0.0 1.7 100 -
1.3 Land holdings
Highest numbers of households was in 1-<5 bigha land holding across the blocks. It was
followed by land holding of 10 to <20 bigha in Baitu, >20 bigha in Sankara and Baap blocks,
5 to <10 bigha land holding in Sanchor and Bali blocks and in <1 bigha in Aburoad block
(Table 4.6).
Table 4.6. Landholding ('bigha'*) of surveyed households in different blocks of MPOWER in
Western Rajasthan. Land holding MPOW ER block
Baitu Sankara Baap Sanchor Aburad Bali Total B P B P B P B P B P B P B P
Landless - - 1 1 4 - 1 - - - - - 6 1 <1 bigha 21 26 47 47 6 6 78 78 53 53 12 12 217 222 1 to <5 b igha 186 184 32 32 4 4 377 366 254 254 296 296 1149 1136 5 to <10 bigha 56 58 121 121 38 41 103 100 12 12 31 31 361 363 10 to <20 bigha 98 92 115 113 88 87 9 22 1 1 - - 311 315 >20 b igha 68 69 125 127 107 109 5 7 - - - - 305 312
B: before 10 years; P: present in 2013-14. One 'bigha' is equivalent to about 1628 sq. m.
The lowest number of HHs was in landless category, i.e. about 1%. If we consider the change
inland holding between 2002-03 and 2013-14, there is decrease in number of households
under category of landless and 1 to <5 bigha land holding categories, whereas land holding of
the HHs under other categories has increased (Fig 4.2).
1.4. Occupations and source of income
1.4.1 Occupations
Other occupation includes labour work NREGA and MPOWER programme, private job
(teacher, mines, anganwadi, driver, sewing machine etc., selling of animals, shop,
government service, unskilled labour, agriculture labour, skilled labour, work at other city

76
and factory labour etc. About 81% of households used to engage as labour in NREGA across
the block, where it ranged from 77% in Sanchor to 88% in Bali block (Table 4.7). It was
followed by other types of labour including the work under MPOWER programme. This
indicates that almost 85% population obtained their livelihood through labour work. Other
occupation included animal husbandry (2%), business (4%), and government servant (3%).
Fig 4.2. Change in land holding in the studied area during 10 years period.
About 3% population did not response, whereas another 3% use to migrate for employment
to nearby cities. The most likely destination places during migrations are Bombay,
Ahmadabad, Surat etc. People of about 52% households have been engaged in different
activities of MPOWER across the blocks. However, this percentage varied among the blocks
ranging from 38% in Aburoad block to 76% in Bali block (Fig 4.3A). In Baitu, Sanchor and
Aburoad blocks the working in MPOWER activities showed below average households,
whereas in rest of the block the involvement appeared above average of the studied areas
Table 4.7. Occupations other than the agriculture in different blocks of MPOWER in western
Rajasthan. Occupation Baitu Sankara Baap Sanchor Aburoad Bali Total
HHs % HHs % HHs % HHs % HHs % HHs % HHs % NREGA (Labour) 348 81 331 75 201 81 442 77 280 87 297 88 1899 81 Labour (incl. MPOW ER) 21 5 14 3 11 4 25 5 14 4 17 4 102 4 Animal husbandry 7 2 14 3 8 4 24 4 - - - - 53 2 Business (shop) 8 2 32 7 10 4 22 4 8 3 10 3 90 4 Government servant 21 5 17 4 - - 19 3 9 3 9 3 75 3 No 10 2 26 6 7 3 21 4 6 2 - - 70 3 Migration 14 3 7 2 10 4 20 3 3 1 6 2 60 3
6, 0%
217, 9%
1149, 49%
361, 16%
311, 13%
305, 13%
10 year before
Landless
<1 bigha
1 to <5 bigha
5 to <10 bigha
10 to <20 bigha
>20 bigha
1, 0%
222, 10%
1136, 48%
363, 16%
315, 13%
312, 13%
2013-14
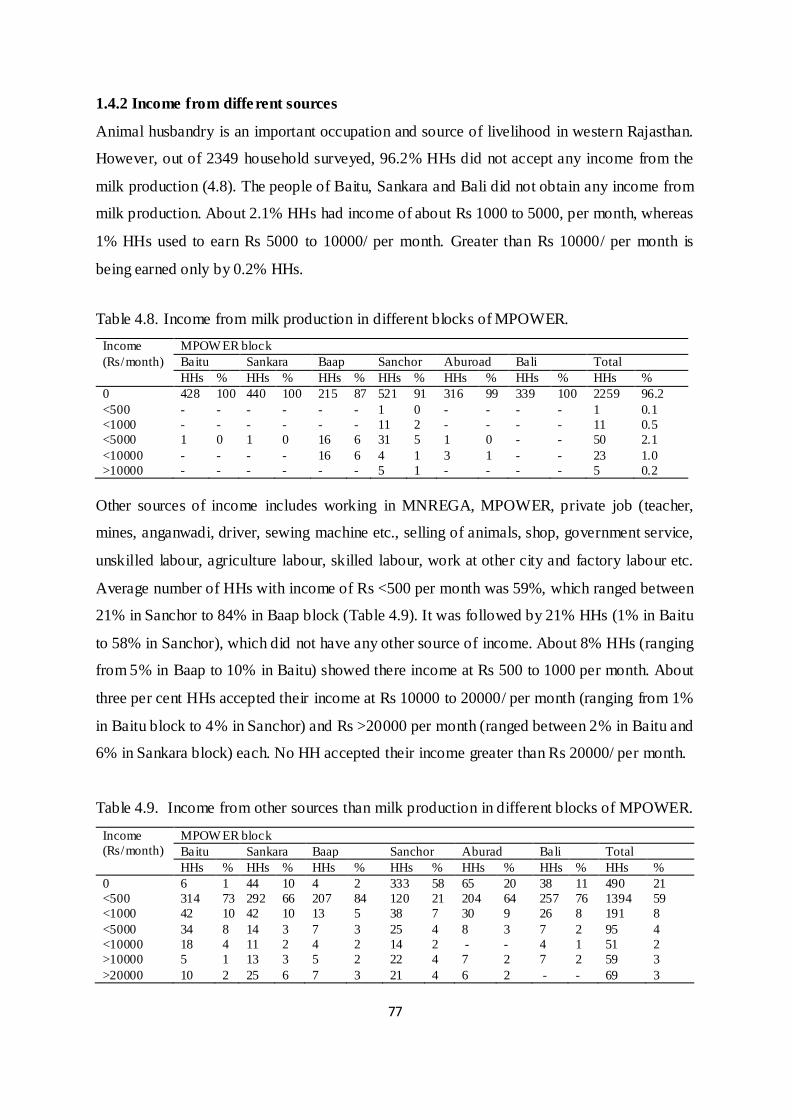
77
1.4.2 Income from different sources
Animal husbandry is an important occupation and source of livelihood in western Rajasthan.
However, out of 2349 household surveyed, 96.2% HHs did not accept any income from the
milk production (4.8). The people of Baitu, Sankara and Bali did not obtain any income from
milk production. About 2.1% HHs had income of about Rs 1000 to 5000, per month, whereas
1% HHs used to earn Rs 5000 to 10000/ per month. Greater than Rs 10000/ per month is
being earned only by 0.2% HHs.
Table 4.8. Income from milk production in different blocks of MPOWER. Income (Rs/month)
MPOW ER block Baitu Sankara Baap Sanchor Aburoad Bali Total HHs % HHs % HHs % HHs % HHs % HHs % HHs %
0 428 100 440 100 215 87 521 91 316 99 339 100 2259 96.2 <500 - - - - - - 1 0 - - - - 1 0.1 <1000 - - - - - - 11 2 - - - - 11 0.5 <5000 1 0 1 0 16 6 31 5 1 0 - - 50 2.1 <10000 - - - - 16 6 4 1 3 1 - - 23 1.0 >10000 - - - - - - 5 1 - - - - 5 0.2
Other sources of income includes working in MNREGA, MPOWER, private job (teacher,
mines, anganwadi, driver, sewing machine etc., selling of animals, shop, government service,
unskilled labour, agriculture labour, skilled labour, work at other city and factory labour etc.
Average number of HHs with income of Rs <500 per month was 59%, which ranged between
21% in Sanchor to 84% in Baap block (Table 4.9). It was followed by 21% HHs (1% in Baitu
to 58% in Sanchor), which did not have any other source of income. About 8% HHs (ranging
from 5% in Baap to 10% in Baitu) showed there income at Rs 500 to 1000 per month. About
three per cent HHs accepted their income at Rs 10000 to 20000/ per month (ranging from 1%
in Baitu block to 4% in Sanchor) and Rs >20000 per month (ranged between 2% in Baitu and
6% in Sankara block) each. No HH accepted their income greater than Rs 20000/ per month.
Table 4.9. Income from other sources than milk production in different blocks of MPOWER.
Income (Rs/month)
MPOW ER block Baitu Sankara Baap Sanchor Aburad Bali Total HHs % HHs % HHs % HHs % HHs % HHs % HHs %
0 6 1 44 10 4 2 333 58 65 20 38 11 490 21 <500 314 73 292 66 207 84 120 21 204 64 257 76 1394 59 <1000 42 10 42 10 13 5 38 7 30 9 26 8 191 8 <5000 34 8 14 3 7 3 25 4 8 3 7 2 95 4 <10000 18 4 11 2 4 2 14 2 - - 4 1 51 2 >10000 5 1 13 3 5 2 22 4 7 2 7 2 59 3 >20000 10 2 25 6 7 3 21 4 6 2 - - 69 3

78
1.5 Light availability
About 62% households have electricity connections in the studied areas. However, the
variation is quite high among the blocks ranging from 45% in Aburoad to 72% in Baitu block
(Fig 4.3B). Three blocks namely Baap, Aburoad and Bali indicated below average electricity
connections.
Fig 4.3 Percentage of HHs involved in working of MPOWER activity (A) and having
electricity connections (B) in different blocks in western Rajasthan.
1.6 Irrigated lands and irrigation facilities
Percentage of irrigated land in Aburoad block was 32.9 for above-poverty line (APL)
category and 20.4% for the below poverty line (BPL) category. Irrigated lands in Baap block
were about 8.2% and 25.2% for BPL and APL category, respectively with an average value
of 13.03%. In Sanchore area, 12.0% and 8.0% area were irrigated in respective category. In
Bali, the respective areas were 16.04% and 23.89%. In Baitu block, the irrigated lands under
the BPL and APL category were 17.8% and 17.0%, respectively.
About 65.6% households depends on rain fed agriculture in the studied regions (Table 4.10).
It ranges from 96% households in Baitu block to 35% households in Aburoad block (Sirohi).
It indicates that agriculture in Aburoad block is relatively less dependent on rainfall only
compared to the other blocks, whereas most of the agriculture lands in Baitu, Sankara and
Baap are rain fed. Among the irrigation sources, most common sources of irrigation in the
regions are wells of different kinds like tube well and dug well. About 8.4% household uses
their own dug well for irrigation, whereas 11.5% HHs use their tube wells for irrigation.
About 1.0% HHs use common well to irrigate their agriculture lands making a total 20.9%
0
10
20
30
40
50
60
70
80
Baitu Sankara Baap Sanchor Aburoad Bali
(A) MPOWER Worker
Blocks
MPO
WE
R w
orke
r (%
hou
seho
lds)
0
10
20
30
40
50
60
70
80
Baitu Sankara Baap Sanchor Aburoad Bali
(B) Light availability
Lig
ht a
vaila
bilit
y (%
hou
seho
lds)
Blocks

79
HHs under well irrigation. It is followed by use of Saran (irrigation channels) mostly in Bali
and Aburoad blocks. However, 5.4% respondents were unable to respond in this regard.
Table 4.10. Source of irrigation at present in different MPOWER block in western Rajasthan. SNo Source of irrigation MPOW ER block
Baitu Sankara Baap Sanchor Aburoad Bali Total HHs % HHs % HHs % HHs % HHs % HHs % HHs %
1 Rainfed 410 96 370 84 206 83 260 45 112 35 184 54 1542 65.6 2 Diversion based irrigation - - - - - - - - 4 1 - - 4 0.2 3 Rainfed + DBI - - - - - - - - 33 10 - - 33 1.4 4 Tubewells of others - - - - - - 9 2 11 3 - - 20 0.9 5 Own well - - - - - - 47 8 97 30 53 16 197 8.4 6 Canal - - - - - - 6 1 - - - - 6 0.3 7 Tubewell 12 3 27 6 31 13 198 35 2 1 - - 270 11.5 8 Well - - - - - - - - 12 4 10 3 22 0.9 9 Saran - - - - - - - - 20 6 69 20 89 3.8 10 Common well - - - - - - - - 23 7 - - 23 1.08 11 Saran+well - - - - - - - - - - 16 5 16 0.7 12 N/A 7 2 44 10 10 4 53 9 6 2 7 2 127 5.4 While comparing changes in irrigation during last 10 years, i.e. 2003-04 to 2013-14 there is
substantial increase in irrigated land as compared to the rainfed farming, which has decreased
from 86% in 2003-04 to 66% in 2013 (Fig 4.4). Diversion based irrigation (DBI) in Aburoad
block in Sirohi, canal irrigation in Sanchor area of Jalor district and Saran based irrigation in
Aburoad and Bali areas are the new developments ensuring irrigation for both kharif or Rabi
crops, whereas significant increase in other types of irrigation particularly dug wells (from
6% to 8%) and tube wells (1% to 12% HHs).
Fig 4.4. Change in irrigation pattern during last ten years in the studied blocks in
Rajasthan.
2020, 86%
1, 0%145, 6%
24, 1%121, 5% 15, 1% 23, 1% 10 years before
RainfedDBIRainfed/DBIOthers tubewellOwn wellcanalTubewellN/AWellSaranCommon wellSaran/well
1541, 66%
4, 0%33, 1%
20, 1%
197, 8%6, 0%
270, 12%
128, 5%
22, 1% 89, 4% 23, 1% 16, 1% 2013-14
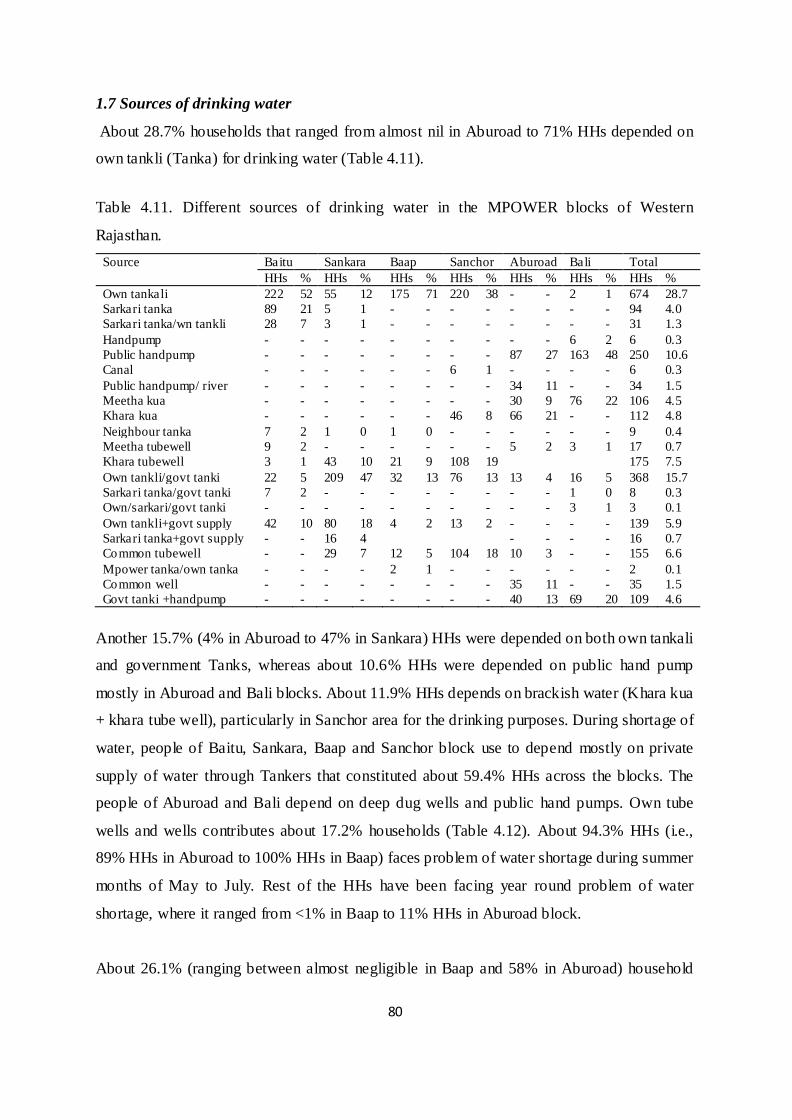
80
1.7 Sources of drinking water
About 28.7% households that ranged from almost nil in Aburoad to 71% HHs depended on
own tankli (Tanka) for drinking water (Table 4.11).
Table 4.11. Different sources of drinking water in the MPOWER blocks of Western
Rajasthan. Source
Baitu Sankara Baap Sanchor Aburoad Bali Total HHs % HHs % HHs % HHs % HHs % HHs % HHs %
Own tankali 222 52 55 12 175 71 220 38 - - 2 1 674 28.7 Sarkari tanka 89 21 5 1 - - - - - - - - 94 4.0 Sarkari tanka/wn tankli 28 7 3 1 - - - - - - - - 31 1.3 Handpump - - - - - - - - - - 6 2 6 0.3 Public handpump - - - - - - - - 87 27 163 48 250 10.6 Canal - - - - - - 6 1 - - - - 6 0.3 Public handpump/ river - - - - - - - - 34 11 - - 34 1.5 Meetha kua - - - - - - - - 30 9 76 22 106 4.5 Khara kua - - - - - - 46 8 66 21 - - 112 4.8 Neighbour tanka 7 2 1 0 1 0 - - - - - - 9 0.4 Meetha tubewell 9 2 - - - - - - 5 2 3 1 17 0.7 Khara tubewell 3 1 43 10 21 9 108 19 175 7.5 Own tankli/govt tanki 22 5 209 47 32 13 76 13 13 4 16 5 368 15.7 Sarkari tanka/govt tanki 7 2 - - - - - - - - 1 0 8 0.3 Own/sarkari/govt tanki - - - - - - - - - - 3 1 3 0.1 Own tankli+govt supply 42 10 80 18 4 2 13 2 - - - - 139 5.9 Sarkari tanka+govt supply - - 16 4 - - - - 16 0.7 Common tubewell - - 29 7 12 5 104 18 10 3 - - 155 6.6 Mpower tanka/own tanka - - - - 2 1 - - - - - - 2 0.1 Common well - - - - - - - - 35 11 - - 35 1.5 Govt tanki +handpump - - - - - - - - 40 13 69 20 109 4.6
Another 15.7% (4% in Aburoad to 47% in Sankara) HHs were depended on both own tankali
and government Tanks, whereas about 10.6% HHs were depended on public hand pump
mostly in Aburoad and Bali blocks. About 11.9% HHs depends on brackish water (Khara kua
+ khara tube well), particularly in Sanchor area for the drinking purposes. During shortage of
water, people of Baitu, Sankara, Baap and Sanchor block use to depend mostly on private
supply of water through Tankers that constituted about 59.4% HHs across the blocks. The
people of Aburoad and Bali depend on deep dug wells and public hand pumps. Own tube
wells and wells contributes about 17.2% households (Table 4.12). About 94.3% HHs (i.e.,
89% HHs in Aburoad to 100% HHs in Baap) faces problem of water shortage during summer
months of May to July. Rest of the HHs have been facing year round problem of water
shortage, where it ranged from <1% in Baap to 11% HHs in Aburoad block.
About 26.1% (ranging between almost negligible in Baap and 58% in Aburoad) household
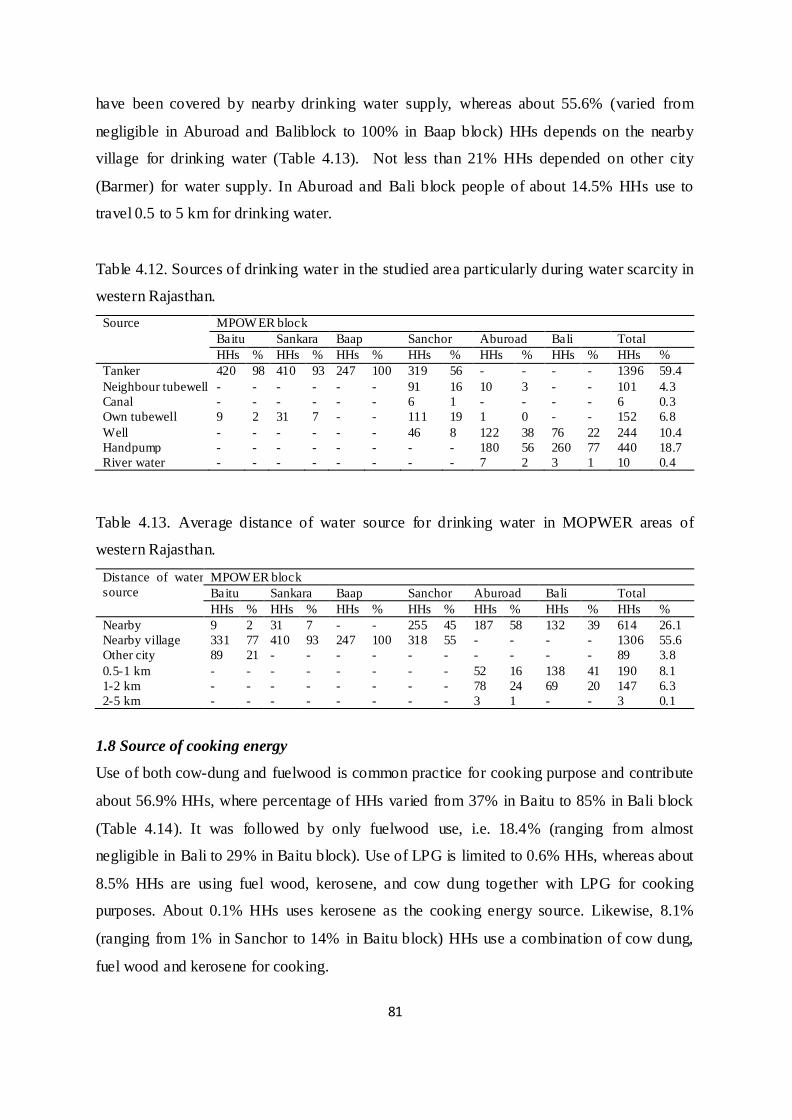
81
have been covered by nearby drinking water supply, whereas about 55.6% (varied from
negligible in Aburoad and Baliblock to 100% in Baap block) HHs depends on the nearby
village for drinking water (Table 4.13). Not less than 21% HHs depended on other city
(Barmer) for water supply. In Aburoad and Bali block people of about 14.5% HHs use to
travel 0.5 to 5 km for drinking water.
Table 4.12. Sources of drinking water in the studied area particularly during water scarcity in
western Rajasthan. Source MPOW ER block
Baitu Sankara Baap Sanchor Aburoad Bali Total HHs % HHs % HHs % HHs % HHs % HHs % HHs %
Tanker 420 98 410 93 247 100 319 56 - - - - 1396 59.4 Neighbour tubewell - - - - - - 91 16 10 3 - - 101 4.3 Canal - - - - - - 6 1 - - - - 6 0.3 Own tubewell 9 2 31 7 - - 111 19 1 0 - - 152 6.8 Well - - - - - - 46 8 122 38 76 22 244 10.4 Handpump - - - - - - - - 180 56 260 77 440 18.7 River water - - - - - - - - 7 2 3 1 10 0.4
Table 4.13. Average distance of water source for drinking water in MOPWER areas of
western Rajasthan.
Distance of water source
MPOW ER block Baitu Sankara Baap Sanchor Aburoad Bali Total HHs % HHs % HHs % HHs % HHs % HHs % HHs %
Nearby 9 2 31 7 - - 255 45 187 58 132 39 614 26.1 Nearby village 331 77 410 93 247 100 318 55 - - - - 1306 55.6 Other city 89 21 - - - - - - - - - - 89 3.8 0.5-1 km - - - - - - - - 52 16 138 41 190 8.1 1-2 km - - - - - - - - 78 24 69 20 147 6.3 2-5 km - - - - - - - - 3 1 - - 3 0.1
1.8 Source of cooking energy
Use of both cow-dung and fuelwood is common practice for cooking purpose and contribute
about 56.9% HHs, where percentage of HHs varied from 37% in Baitu to 85% in Bali block
(Table 4.14). It was followed by only fuelwood use, i.e. 18.4% (ranging from almost
negligible in Bali to 29% in Baitu block). Use of LPG is limited to 0.6% HHs, whereas about
8.5% HHs are using fuel wood, kerosene, and cow dung together with LPG for cooking
purposes. About 0.1% HHs uses kerosene as the cooking energy source. Likewise, 8.1%
(ranging from 1% in Sanchor to 14% in Baitu block) HHs use a combination of cow dung,
fuel wood and kerosene for cooking.

82
Chulha either made up of mud or bricks is the main device used by about76.2% HHS across
the region, where it ranged from 55% HHs in Baap block to 92% HHs in Aburoad (Table
4.15). It is followed by a mix of Chulha and Kerosene stove for cooking (ranging from 1% in
Sanchor to 23% in Sankara block), whereas combination of Chulha and LPG stoves
contribute to about 9.2% HHs. Contribution of kerosene stoves and LPG stoves seemed
negligible in the region.
Table 4.14. Different type energy generated for cooking purpose in studied areas of western Rajasthan. Source of energy MPOW ER block
Baitu Sankara Baap Sanchor Aburoad Bali Total HHs % HHs % HHs % HHs % HHs % HHs % HHs %
Gas (LPG) 14 3 - - - - - - - - - - 14 0.6 Cow dung 1 0 - - - - - - - - - - 1 0.1 Wood 124 29 97 22 32 13 89 16 89 28 - - 431 18.4 Cow dung/wood 157 37 201 46 104 42 385 67 203 63 287 85 1337 56.9 Wood/crop residue 1 0 - - - - 2 1 - - 3 0.1 Cowdung/ wood/crop residue - - - - - - 9 2 1 0 - - 10 0.4 Kerosene 1 0 - - - - - - - - - - 1 0.1 Cowdung/wood/kerosene 61 14 49 11 10 4 7 1 23 7 40 12 190 8.1 Wood/kerosene 25 6 56 13 14 6 - - - - - - 95 4.0 LPG/kerosene/wood 9 2 6 1 1 0 1 0 - - - - 17 0.7 LPG/wood 18 4 2 0 35 14 2 0 - - - - 57 2.4 LPG/cowdung/wood 17 4 2 0 47 19 71 12 2 1 12 4 151 6.4 Wood/cowdung/kerosene/LPG 1 0 28 6 4 2 9 2 - - - - 42 1.8
Table 4.15. Cooking device used in households for cooking food in studied region of
MPOWER block of Western Rajasthan.
Cooking device MPOW ER block Baitu Sankara Baap Sanchor Aburoad Bali Total HHs % HHs % HHs % HHs % HHs % HHs % HHs %
Chulha 280 65 303 69 136 55 492 86 293 92 285 84 1789 76.2 Kerosene stove 1 0 - - - - - - - - - - 1 0.0 LPG stove 13 3 - - - - - - - - - - 13 0.6 Chulha/kerosene stove 89 21 100 23 24 10 5 1 25 8 41 12 284 12.1 Chulha/kerosene/LPG 10 2 33 7 4 2 - - - - - - 47 2.0 Chulha/LPG 36 8 5 1 83 34 76 13 2 1 13 4 215 9.2
About 33% households ranging from almost negligible HHs in Bali block to 77% HHs in
Baap block use to collect fuel wood solely from agriculture land, whereas 16% HHs (i.e.,
negligible in Bali to 31% HHs in Baitu) use to collect fuel wood from other land uses (except
forests) in addition to agriculture land (Table 4.16). Collections of fuel wood from forests
and other land use (except agriculture) are being done by about 40% HHs mostly by the HHs
of Sanchor, Aburoad and Bali block. People of other blocks namely Baitu, Sankara and Bapp
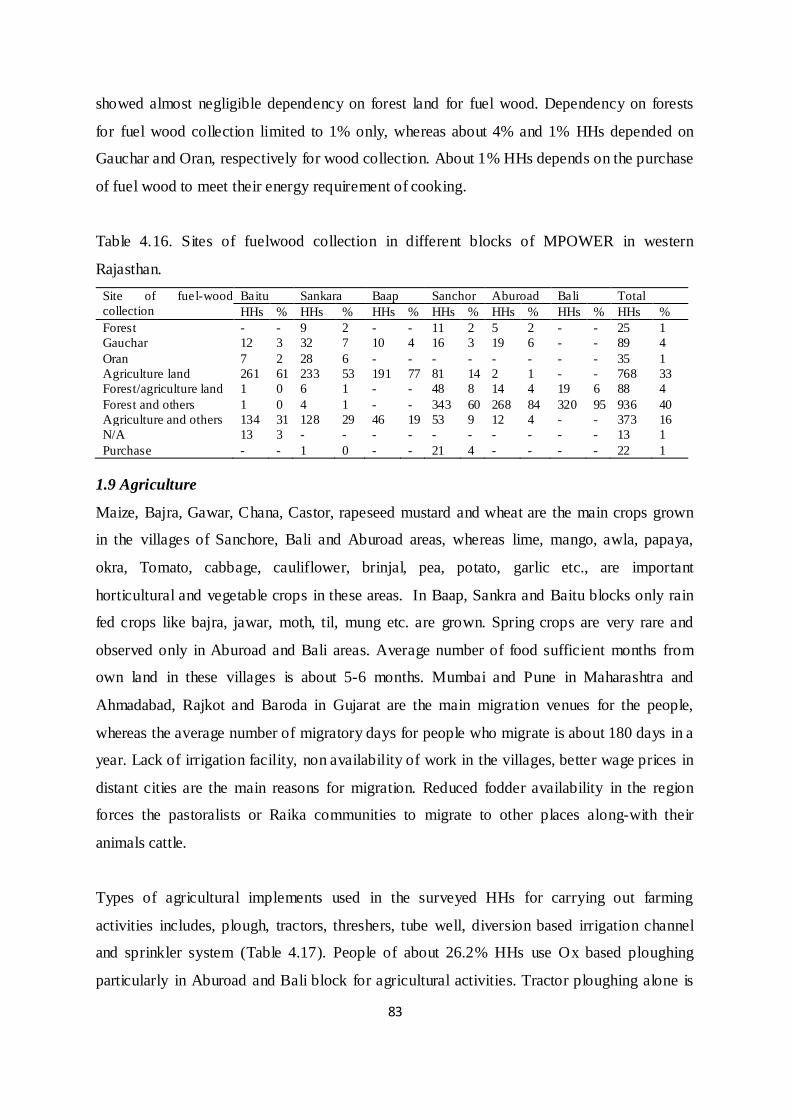
83
showed almost negligible dependency on forest land for fuel wood. Dependency on forests
for fuel wood collection limited to 1% only, whereas about 4% and 1% HHs depended on
Gauchar and Oran, respectively for wood collection. About 1% HHs depends on the purchase
of fuel wood to meet their energy requirement of cooking.
Table 4.16. Sites of fuelwood collection in different blocks of MPOWER in western
Rajasthan. Site of fuel-wood collection
Baitu Sankara Baap Sanchor Aburoad Bali Total HHs % HHs % HHs % HHs % HHs % HHs % HHs %
Forest - - 9 2 - - 11 2 5 2 - - 25 1 Gauchar 12 3 32 7 10 4 16 3 19 6 - - 89 4 Oran 7 2 28 6 - - - - - - - - 35 1 Agriculture land 261 61 233 53 191 77 81 14 2 1 - - 768 33 Forest/agriculture land 1 0 6 1 - - 48 8 14 4 19 6 88 4 Forest and others 1 0 4 1 - - 343 60 268 84 320 95 936 40 Agriculture and others 134 31 128 29 46 19 53 9 12 4 - - 373 16 N/A 13 3 - - - - - - - - - - 13 1 Purchase - - 1 0 - - 21 4 - - - - 22 1
1.9 Agriculture
Maize, Bajra, Gawar, Chana, Castor, rapeseed mustard and wheat are the main crops grown
in the villages of Sanchore, Bali and Aburoad areas, whereas lime, mango, awla, papaya,
okra, Tomato, cabbage, cauliflower, brinjal, pea, potato, garlic etc., are important
horticultural and vegetable crops in these areas. In Baap, Sankra and Baitu blocks only rain
fed crops like bajra, jawar, moth, til, mung etc. are grown. Spring crops are very rare and
observed only in Aburoad and Bali areas. Average number of food sufficient months from
own land in these villages is about 5-6 months. Mumbai and Pune in Maharashtra and
Ahmadabad, Rajkot and Baroda in Gujarat are the main migration venues for the people,
whereas the average number of migratory days for people who migrate is about 180 days in a
year. Lack of irrigation facility, non availability of work in the villages, better wage prices in
distant cities are the main reasons for migration. Reduced fodder availability in the region
forces the pastoralists or Raika communities to migrate to other places along-with their
animals cattle.
Types of agricultural implements used in the surveyed HHs for carrying out farming
activities includes, plough, tractors, threshers, tube well, diversion based irrigation channel
and sprinkler system (Table 4.17). People of about 26.2% HHs use Ox based ploughing
particularly in Aburoad and Bali block for agricultural activities. Tractor ploughing alone is

84
used by about 2.3% HHs and the highest number of HHs belonged mainly of Baitu and
Sankara blocks. About 65.5% households employed tractor as the main implement. In
addition to tractor, 5.3% HHs made use of thresher, 8.6% HHs utilized threshers and tube
well, and 2.8% HHs use the services of thresher, tube well and sprinkler systems on their
farmlands. It was interesting to note that maximum number of HHs of Baitu, Sankara, Baap
and Sanchor made use of tractor as the main ploughing implement for performing
agricultural activities.
Table 4.17. Types of implements the people of different MPOWER block have and used in
agricultural operations in western Rajasthan.
Agricultural equipment MOPW ER block Baitu Sankara Baap Sanchor Aburoad Bali Total HHs % HHs % HHs % HHs % HHs % HHs % HHs %
Ox plough - - - - - - - - 281 88 335 99 616 26.2 Tractor 48 11 6 1 - - - - - - 1 0 55 2.3 Ox plough/Tractor - - - - - - - - - - 1 0 1 0.2 Ox plough/DBI - - - - - - - - 21 7 - - 21 0.9 Tractor/thresher 366 85 348 79 209 85 329 57 11 3 1 0 1264 53.8 Tractor/thresher + tube well 13 3 15 3 - - 173 30 - - 1 0 202 8.6 N/A 2 0 48 11 10 4 57 10 7 2 - - 124 5.3 Tractor/thresher/tubewell (sprinkler) - - 24 5 28 11 14 2 - - - - 66 2.8
The assets available with the households includes tractor, bullock/camel cart, Cycle, Bike,
Tube wells, light pump set, sprinklers, truck and a combinations of these (Table 4.18). About
75.7% HHs were unable to answer about the types of assets in their families. It was followed
by 9.7% HHs with bike (9% in Aburoad to 13% in Baitu block) and 7.2% HHs with cycle
(2% in Sanchore to 22% in Bali block) across the blocks. About 2.5% HHs appears having
tractors and other means of transport and field implements, whereas another 2.5% HHs have
pump-sets for irrigation, particularly in Aburoad block. Carts were also reported in about
0.9% HHs mostly in Sanchor and Bali blocks.
4.8 Fodder availability
Highest number of households (44.8% of total surveyed) depend on a combinations of all
land uses available in the region, though depended mainly on forests for grazing or fodder
collection (4.19). However, it varied from 7% in Baitu block to almost 100% in Bali block.
The people of Baitu, Sankara and Baap block were observed to be less dependent on forests
for fodder collection mainly due to scrubby nature of forests in these blocks. However,

85
people of these blocks depend mostly on agriculture land for fodder. It varied from negligible
number of households in Bali block to 84% HHs in Baap block with an average value of
39.8% HHs across the blocks. About 9.8% HHs used to purchase fodder for their livestock.
Table 4.18. Types of assets the people have in MPOWER block of western Rajasthan.
Type of asset Baitu Sankara Baap Sanchor Aburoad Bali Total HHs % HHs % HHs % HHs % HHs % HHs % HHs %
Tractor 2 0 1 0 5 2 20 3 2 1 4 1 34 1.5 Cart 1 0 - - - - 3 1 - - 18 5 22 0.9 Cycle 12 3 13 3 7 3 14 2 48 15 76 22 170 7.2 Bike 54 13 30 7 29 12 56 10 28 9 31 9 228 9.7 Tubewell 9 2 6 1 1 0 - - - - - - 16 0.7 Light pumpset - - 16 4 - - 2 0 17 5 1 0 36 1.5 Diesel pumpset - - - - - - - - 21 7 - - 21 0.9 Sprinklers - - - - 1 0 - - 1 0 - - 2 0.1 Truck 4 1 - - - - - - - - - - 4 0.2 Bike+truck+other 1 0 1 0 1 0 - - - - - - 3 0.1 Scooter 1 0 - - - - - - - - - - 1 0.1 Tractor+bike+other - - 10 2 4 2 10 2 - - - - 24 1.0 Tractor+pumpset (sprinkler) - - 4 1 1 0 2 0 2 1 - - 9 0.4 Not applicable 345 80 360 82 198 80 466 81 201 63 209 62 1779 75.7
Table 4.19. Sites of fodder collection in studied areas of MPOWER in western Rajasthan Site of fodder collection MPOW ER block
Baitu Sankara Baap Sanchor Aburad Bali Total HHs % HHs % HHs % HHs % HHs % HHs % HHs %
Forest - - - - - - 8 1 - - - - 8 0.3 Agriculture land 311 72 285 65 207 84 131 23 1 0 - - 935 39.8 Gauchar/padat bhumi 4 1 1 0 - - 5 1 14 4 - - 24 1.0 Forest/agriculture - - - - - - 4 1 22 7 - - 26 1.1 Forest and others 28 7 62 14 26 11 353 61 45 76 339 100 1053 44.8 Purchase 73 17 82 19 14 6 61 11 - - - - 230 9.8 N/A 13 3 11 2 - - 11 2 38 12 - - 73 3.1 2. ACTIVITIES IN MPOWER PROGRAMME
The project MPOWER (Mitigating Poverty in Western Rajasthan) is a poverty reduction
initiative, being implemented in western Rajasthan by involving different NGOs. It was to
secure and enhance present livelihoods, to enhance the income of poor people by creating
employment opportunities for a sustainable livelihood and women empowerment, linking
BPL families with SHGs through the Federation attaining financial sustainability. Different
NGOs working in different blocks are listed in Table 4.20. The activities carried out by each
NGO have been summarized in Table 4.21.

86
Table 4.20. List of NGOs working in different MPWER blocks in western Rajasthan.
SNo Name Abbreviation Working block 1 Professional Assistance for Development
Action PRADAN Aburaod
2 Uttari Rajasthan Cooperative Milk Union Ltd
URMUL Baap
3 Gramin Vikas Vigyan Samiti GRAVIS Baap and Sankara 4 Gram Vikas Navyuvak Mandal Laporiya GVNML Baitu 5 Slum Rehabilitation Society SRS Baitu 6 Bhoruka Charitable Trust BCT Baitu and Sankara 7 Society to Uplift Rural Economy SURE Baitu 8 Self-Reliant Initiatives through Joint Action SRIJAN Bali 9 Ambuja Cement Foundation ACF Bali 10 Indian Farmers Fertilizer Cooperative
Limited IFFDC Sanchor
11 Urmidwar innovative action and research foundation
URMIDWAR Sanchor
Table 4.21. Activities carried out by different NGOs in different MPOWER blocks.
Block NGO Different activities of NGOs under MPOWER project Aburoad PRADAN Monthly saving, Revolving Fund, Bank linkage, Seed Capital, Seed
demonstration, Vegetable demonstration, Fertilizer distribution, Polyhouse and vermipit construction, Goat shed and cow shed construction, Trellis for climbing vegetable plants, Sprinkler distribution.
Baap URMUL Monthly saving, Revolving Fund, Bank linkage, Seed Capital, Seed demonstration, Fertilizer distribution, Distribution of bilona machine, Kerosene stove distribution, Orchard(50 plants- fruits).
GRAVIS Monthly saving, Revolving Fund, Bank linkage, Seed Capital, Seed demonstration, Fertilizer distribution, Distribution of bilona machine, Kerosene stove distribution.
Baitu GVNML Monthly saving, Revolving Fund, Bank linkage, Seed Capital, Seed demonstration, Fertilizer distribution, Construction of tanka and boundary(fencing) and hand pump, Orchard (40 plants-fruits), Kerosene stove distribution.
SRS Monthly saving, Revolving Fund, Bank linkage, Seed Capital, Seed demonstration, Fertilizer distribution, Construction of tanka and boundary(fencing) and hand pump, Sewing machine training, Orchard (40 plants- fruits), Kerosene stove distribution.
BCT Monthly saving, Revolving Fund, Bank linkage, Seed Capital, Seed demonstration, Fertilizer distribution, Sewing machine training, Goat shed construction, Plastic pot distribution.
SURE Monthly saving, Revolving Fund, Bank linkage, Seed Capital, Seed

87
demonstration, Fertilizer distribution, Kerosene stove distribution. Bali SRIJAN Monthly saving, Revolving Fund, Bank linkage, Seed Capital, Seed
demonstration, Fertilizer distribution, Vegetable demonstration, Solar light distribution, construction of goat shed.
ACF Monthly saving, Revolving Fund, Bank linkage, Seed Capital, Seed demonstration, Vegetable demonstration, Fertilizer distribution, Construction of saran, plant nursery, Sewing machine training, Construction of Goat shed, Solar light distribution.
Sanchore IFFDC Monthly saving, Revolving Fund, Bank linkage, Seed Capital, Seed demonstration, Fertilizer distribution, Goat shed construction, Orchard (50 plants- fruits, 50 plants- forestry).
URMIDWAR
Monthly saving, Revolving Fund, Bank linkage, Seed Capital, Seed demonstration, Fertilizer distribution, Sewing machine training, Orchard (50 plants- fruits, 50 plants- forestry).
Sankara BCT Monthly saving, Revolving Fund, Bank linkage, Seed Capital, Seed demonstration, Fertilizer distribution, Goat shed construction, Orchard (50 plants- fruits), Sewing machine training.
GRAVIS Monthly saving, Revolving Fund, Bank linkage, Seed Capital, Seed demonstration, Fertilizer distribution, Sewing machine training.
2.1. Formation of SHGs
Self help groups (SHG) have been formed in about 52% of the villages studied. It ranged
from 46% villages in Baap block to 64% villages in Bali block (Fig 4.5)
Fig 4.5. Per cent villages where SHGs
have been formed.
2.2 Monthly saving
This is a system of motivating local people for micro investments or saving (Box 4.1).
Savings are being made by members of Self Help Group (SHG), in which a group of 10-20
0
10
20
30
40
50
60
70
Baitu Sankara Baap SanchorAburoad Bali
SHG
form
ed (
% v
illag
e)
Blocks

88
local people/women use to contribute Rs 50-100/ month on regular intervals in the form of
‘Bachat Peti’. Such type of gatherings commences 2-4 times in a month (Fig 4.6).
Fig 4.6. Interaction with villagers (left) in Aburoad block and monthly saving through
'Bachat Peti' (right) in Bali block.
At the end of the month the money is either given to the needy person on a minimum amount
of interest or deposited in the bank (SHG account) by the head of the group (i.e., secretary,
treasurer etc) and later on given to the group with a revolving fund (RF). As a large number
of poor do not have access to bank, thus SHG play an important role in promoting the saving
habit and linking the poor to the banking system. It also promotes women empowerment
because in most of the cases rural women participate in the monthly saving meeting and
interact to each other as well as the members of the project implementing agency.
2.3 Revolving Fund
It is to Encourage SHGs to take up enterprise activities. In this some fixed amount are
provided by the project implementing agencies to SHGs, i.e. Rs 15,000/ in this programme.
This money is either given to a particular person who required the most or shared by the
SHG members equally. One can say it a small loaning. SHG members utilize this money in
some income generating activities, children education, fodder purchase, house construction
etc. For example, SRS (an FNGO) in Baitu Block constituted 405 SHG’s. In this Rs
5520000/ were provided to 368 SHGs (@ Rs 15,000 each) as revolving fund. In the year
2013-14, another 68 SHG’s received the revolving fund. Likewise at Sanchore Block, a total
of 446 SHG’s received the revolving fund.
89
2.4 Bank linkage
It is a development of linkage between the SHG and the banking system. Establishment of
marketing groups improves farm-gate prices and develops appropriate linkages with the
private sector. This will be especially targeted at all SHG members, but participation by all
women in the communities would be encouraged. In this FNGO help opening bank account
of self help group for their monthly saving and loaning. In Baitu Block, BCT (the FNGO)
opened 325 saving account out of 360 SHG. Likewise in Sanchore Block, Urmidwar
foundation helped opening 446 bank accounts.
2.5 Seed Capital
It is an initial fund to start any business. A bank loan of Rs 50,000 is provided to SHG by
FNGO. In case the SHG return this amount in three subsequent installments, bank release Rs
60,000 more to the SHG. Thus total money an SHG receives from bank as seed capital is Rs
125000, i.e. Rs 50000 + Rs 60000 + Rs 15000 (RF). SHG can utilize this money to start any
income generation activity like animal husbandry, vegetable-fruits shop, snacks vendors,
sweet shop etc. 30 number of SHG have been provided seed capital at Sanchore Block by
Urmidwar foundation, the FNGO.
2.6 Seed demonstration
Improvement in agricultural production to meet food needs and enhance nutrition is primarily
targeted at SHG level, though all community members are encouraged to participate in this
activity. At the start of the project, all 13 FNGO of six MPOWER Blocks distributed free
seeds to all SHG members in their jurisdiction. Number of households covered under this
activity ranged between 44% in Sankara block and 63% in Bali block (Fig 4.7).
2.7 Vegetable demonstration
Some of the NGOs particularly in Aburoad and Bali blocks have distributed the seeds of
different vegetables to increase people livelihoods and income. For example, Pradan (the
FNGO) at Abu Road block has introduced off-season tomato production. By planting
tomatoes during the monsoon season, and controlling insects and fungal diseases with agro-
chemicals, farmers are able to earn handsome prices. Seeds of other vegetables like lauki,
turai, baigan, mirchi etc were also distributed as demonstration among the farmers. Earlier
these farmers were used to sow agricultural crops during ‘rabi’ or ‘khareef’ season or used to

90
go RIICO area in Aburoad to sell fuel wood. Now they have started selling vegetables daily
in Aburoad and are earning about Rs 10000 to 15,000 and are saving some of it.
Fig 4.7. Per cent households covered under seed distribution of agricultural crops.
2.8 Fertilizer distribution
This activity addresses local level production constraints and simultaneously reduces labour
requirements of women. At the start of the project, all FNGO distributed fertilizer free of cost
along with the seeds of agricultural or vegetable crops so that the productivity of such
nutrient deficient soils could be recovered, crop yield enhanced and livelihood improved.
Under this activity, about 2 kg SSP (Single Super Phosphate) and 8 kg urea were distributed
to SHG members in all blocks.
2.9 Polyhouse and vermipit construction
At Abu Road block, Pradan (the FNGO) constructed polyhouse and vermipit. One polyhouse
and vermipit is constructed in association of 2 SHGs. Tomatoes, brinjal, green chilly etc.
vegetables are grown in polyhouse utilizing vermin-compost and are used by the SHG
members (Fig 4.8). Some of the vermipit constructed near polyhouse, receives organic waste
and cow dung, which are decomposed with the help of earthworms providing organic
manure. This organic manure is used by the SHG farmers to increase the fertility of the soils
of farmlands. Because of hilly tract and small holding polyhouse helped farmers to learn
about vegetable farming and utilize the available resources in efficient manner. The SHG
farmers also use to distribute the vegetables cultivated in polyhouse.
0
10
20
30
40
50
60
70
Baitu Sankara Baap Sanchor Aburoad Bali
Seed
dis
trib
utio
n (%
hou
seho
lds)
Blocks

91
Fig 4.8. Constructed polyhouse (left) and growing seedlings of vegetable (right) for
distribution among the members of SHGs.
2.10 Goat shed and cow shed construction
This activity is to intensify livestock, especially small stock production through breed
improvement, better health care and animal husbandry. This is targeted at the SHG members,
where FNGO prepares a list of SHGs requiring animal shed particularly for goats and cows.
Place of construction of shed are also decided. Animal shed is constructed for the SHG
member who has a minimum 5 to 10 number of goats, is poor and do not have enough space
for their animals. In some of the cases a cluster of SHGs members are also made for
preparing a common animal shed. Total cost of construction of goat shed is approximately Rs
25,000. In this money Rs 20,000 is provided from the project and the rest amount viz. Rs
5,000 is provided by the SHG member for whom the goat shed is to be constructed. A total
number of 40 goat-sheds have been constructed in Baitu Block, 200 goat-shed in Bali Block,
1100 goat-shed and 280 cow- shed in Aburoad block. Estimated cost of cow-shed is Rs
40,000 in which the sharing of project and the individuals are Rs 35,000 and Rs 5,000,
respectively.
2.11 Trellis for climbing vegetable plants
It is a practice adopted in Aburoad Block for providing supports to the climbers, particularly
vegetable plants. It requires very little space and expenses as well. These trellis prop-up the
vegetable plants like bottle gourd, chillies, ridged gourd, bitter gourd, broad beans etc., and
enhance the yield of these vegetables supporting livelihoods by sailing the vegetable to the
nearby markets. A total number of 25 trellises have been constructed in Aburoad Block.

92
2.12 Sprinkler distribution
Sprinkler irrigation system has also been distributed among some farmers in Aburoad Block
by PRADAN (the FNGO). It is only to apply irrigation water efficiently along with equal
distribution of water to the farm. A total 130 sprinkler systems have been distributed among
the SHG’s. The cost of a sprinkler is approximately Rs 16,500. Out of this, Rs 15,000 is
provided from the project and the rest amount, i.e. Rs 1500 is shared by the SHG member.
2.13 Distribution of 'Bilona' machine
In Baap Block, GRAVIS (the FNGO) has distributed ‘bilona machine’ under drudgery
reduction scheme. It is useful for extraction of butter from the milk to make ‘ghee’. A lot of
energy is now saved particularly for the women engaged in this work. However, the problem
associated with this electricity driven machine is the non-availability of electricity in most of
the HHs in the region.
2.14 Sewing machine training
This is an expansion of employment opportunities through skills training mostly on a
demand-driven basis and also for selected industries experiencing growth, such as
construction, tourism, handicrafts and transportation. This is targeting youth from the poorest
households. In this 45 days sewing machine training was provided in which Rs 3,000 was
given to each member in Baitu, Bali, Sanchore and Sankara Block. After this training, most
of the SHG women have purchased sewing machine by adding some extra money and started
sewing dresses as income generation activity and are earning Rs 150-250 per day. It helps
improving their livelihood (Fig 4.9, left). A total 143 ladies (5 batches) have been benefited
through sewing machine training in Sanchor Block.
2.15 Kerosene stove distribution
Kerosene stove has also been distributed among the SHG members in Baitu and Baap Blocks
(Fig 4.9, right). It is distributed in drudgery reduction scheme. A total of 1,000 SHG women
out of 1,300 have been benefited under this scheme. It is also beneficial to village women
under extreme condition like rain, wind storm and dust storm, when they are unable to collect
fuel wood from the fields or forests.

93
Fig 4.9. Distribution of sewing machine (left) in Sanchor block and kerosene stove (right) in
Aburoad block.
2.16 Fruit plants distribution
Under this, seedlings of different fruit plants have been distributed to develop a fruit orchard
(i.e., 40- 100 plants) for enhancing livelihoods (Fig 4.10, left). Distribution was made in
Baap, Baitu, Sanchor and Sankara blocks of MPOWER.
2.17 Construction of Tanka
Most important aspect in the regions is to enhance drinking water supply. Under this
activity, water tanks called ‘Tanka’ and boundary of tanka (fencing around tanka) is
constructed by different FNGO in Baitu and Sankara Block (Fig 4.11, right). Handpump has
also been installed near ‘Tanka’ to reduce work load and risk of slipping in the tanka during
drawing out of water from the ‘Tanka’.
Fig 4.10. Planting fruit plants in house premises in Sankara block (left) and construction of
Tanka in Baap block (right)

94
2.18 Construction of saran
In Bali Block, ACF (the FNGO) has helped in constructing 'Saran' –irrigation water channel
for SHG’s (Fig 4.11). It is also used by some non SHG’s families. With the use of saran,
farmers have started growing 'Rabi' crops as well as Khareef crops both in a year. A total 31
Saran have been constructed and are now being utilized by the villagers.
Fig 4.11. Saran in Bali block (left) and diversion channel in Sanchor block (right) for
irrigation purpose.
2.19 Plastic pot distribution
Plastic pots have been distributed by FNGO in Baitu Block under drudgery reduction
programme. As plastic pots are light in weight and not easily breakable, the transport of
drinking water has become easy in this desert region for the women, who used to bring water
from very far water sources.
2.20 Solar light distribution
Solar lights have also been distributed by SRIJAN and ACF (the FNGO) in Bali Block. It is
eco-friendly and very useful in remote villages, where access of electricity is very rare. A
total 175 solar light have been distributed among the SHG members in Bali Block.
2.21 Plant nursery
In Bali block, ACF (the FNGO) has developed small nursery for raising seedlings of
vegetables. In general, one nursery has been developed between 2 SHG members in a group.
Different vegetable crops like tomato, green chilly etc are grown in nursery and utilized by
the SHGs members.
95
Chapter 5 SOIL CARBON AND CLIMATE CHANE MITIGATION
___________________________________________________________________________ Soil-based carbon sequestration offers the possibility of large-scale removal of greenhouse
gases from the atmosphere through plant photosynthesis and its conversion under
decomposition of litter and root turnover as carbon stored in soils worldwide exceeds the
amount of carbon stored in phytomass and the atmosphere (Scharlemann et al., 2014). The
strategies for mitigating greenhouse gas emissions include: (i) enriching soil carbon, (ii)
retaining woody perennials, (iii) maintaining climate friendly livestock, (iv) maintaining and
managing forests, (v) restoring degraded lands, and (vi) minimizing biomass and fuel burning
and their improved uses. The important strategy to reduce atmospheric carbon dioxide is to
increase the global storage of carbon in soils, which has an added benefit of increased
agricultural production. In general, the surface layer has the highest level of SOC which
decreases with depth down the soil profile (Franzluebbers and Stuedemann, 2008; Singh et
al., 2007). The actual amount of SOC present in a soil depends on a number of factors like
rainfall, air temperature, vegetations, soil types and its composition, topography, types of
uses etc. (Emerson, 1995; Singh, 2011), but personal efforts in this direction are more
important in mitigating the effects of climate change (Pandve et al., 2011). Increasing SOC
pool is a major challenge in dry areas, which are climatically harsh and crop productivity is
limited by low availability of water and nutrients (Lal, 2009). Tree integration, no-tillage,
organic manuring, soil and water conservation etc., however enhances carbon sequestration
in both vegetation and soils. Reducing the intensity and frequency of ploughing and leaving
crop residues on the soil surface as mulch also adds soil organic carbon (SOC) content.
1. CLIMATE CHANGE AWARENESS
People perception to climate change and its associated impact on local agriculture, and the
effect of various household and farm attributes vary with age, education level, livestock
holding, access to climate information and extension services, though most participants
perceived climatic change and its negative impact on agricultural and considered climate
change as a salient risk to the future livelihoods and economic development (Debela, 2015).
Though people of this region are not much aware about the climate change but they are in
view that pattern of rainfall is changing and heat socks are more now days as compared to the
earlier ones. However, these views are changing widely among the blocks ranging from 42%

96
population in Bali block to 91% population in Baitu block, with an average value of 66%
population across the blocks (Fig 5.1).
Fig 5.1 Percentage awareness
about climate change among the
peoples of different blocks of
MPOWER in western Rajasthan.
It was worthy to highlight that the people living in relatively more adverse conditions like
those in Baitu, Sankara and Baap block were more aware about climatic abrasions as
compared to those in the other blocks, which are in relatively better in rainfall and
environmental conditions. However, a dramatic increase in newspaper coverage on global
warming has increased public concern on this issue (Sampei and Aoyagi-Usui, 2009). About
34% people were unable to explain their view about climate change across the blocks, though
it varied from 9% in Baitu to 58% in Bali block. People of about 31% HHs that ranged from
1% in Bali to 59% in Baitu block, explained climate change in term of change in
temperature, variations in rainfall and droughts combined (Table 5.1).
Table 5.1. Means by which people in different MPOWER block of western Rajasthan experience climate change. Ways of Climate change MPOW ER block
Baitu Sankara Baap Sanchor Aburad Bali Total HHs % HHs % HHs % HHs % HHs % HHs % HHs %
Temperature rise 3 1 14 3 3 1 39 7 69 22 26 8 154 7 Erratic rainfall - - 1 0 - - 17 3 26 8 15 4 59 3 Temp. rise/erratic rain 7 2 14 3 1 0 66 12 25 8 54 16 167 7 Drought 128 30 25 6 32 13 93 16 12 4 27 8 317 13 Flood - - - - - - 10 2 19 6 5 1 34 1 Tem. rise/drought/erratic rain
251 59 262 59 138 56 59 10 17 5 2 1 729 31
Deforestation - - 25 6 3 1 55 10 6 2 12 4 101 4 Not aware 40 9 100 23 70 28 234 41 146 46 198 58 788 34
0
10
20
30
40
50
60
70
80
90
100
Baitu Sankara Baap Sanchor Aburoad Bali
Climate change awareness
Clim
ate
awar
enes
s (%
hou
seho
lds)
Blocks

97
It was followed by the people relating increased droughts with climate change, whereas
people of 7% HHs and 3% HHs related climate change to rise in temperature and erratic
rainfall, respectively. People of about 4% HHs related climate change with deforestation,
whereas people of 1% HHs blamed climate change for occasional flooding in these dry areas
also. The contribution of deforestation towards climate change also reported in other studies,
where water related issues and direct physical hazards of extreme climatic events that
directly affect human life and health appeared to be the impact of climate change (Pandve et
al., 2011). 2. SOIL PROPERTIES
Carbon stored in soils is affected by changes in vegetation and plant growth, removal of
biomass by harvest and mechanical soil disturbances such as plowing under cultivation . Soil
carbon is also sensitive to environmental changes such as global warming or nitrogen
deposition (von L̈utzow and Kogel -Knabner, 2009; Janssens et al., 2010). Soils parameters
like gravel content, soil bulk density and per cent soil organic carbon at village level has been
presented in Annexure IV.
2.1 Gravel content
Gravel content is an indicator of stoniness or available rock fragments in the soils. Gravel
content can range from <10 % to even >50 % in the soil. High gravel contents affect the
interpretation of other soil quality indicators, as most of the indicators are measured after
sieving (<2 mm) of the soils removal of the gravel. If there is gravel in the soil sample,
laboratory results need to be adjusted as this is separated out before carbon analyses of the
fine earth fraction.
In our observations, average gravel content across the blocks and land uses was 13.99%.
Gravel content varied significantly (P<0.05) in the soils both due to spatial differences in
blocks as well as land uses (Table 5.2). All six block can be easily separated into three
homogeneous groups, where soils of Sanchor and Baitu were in lowest gravel content. Soils
of Baap and Sankara block were similar in gravel content and differed (P<0.05) with Sanchor
and Baitu group as well as with Bali and Aburoad group, the soils of which indicated highest
gravel content. Among the land uses, lowest amount of gravel was in Agriculture land,
whereas it was highest (P<0.05) in forest lands as most of the forests are lying on the hills

98
and stony soils. It was followed by gauchar land and appears to be due to degradation
through vegetation removal and soil losses. Soils of Agriculture land, roadside and fallow
land did not differ in gravel content. Soils of Gauchar did not differ (P>0.05) with the soils of
Oran, but differed significantly (P<0.05) with the soils of forest lands. Both blocks and land
uses behaved independently indicated by non-significant block × land use interaction. It was
highest in forests of Aburoad and lowest in agriculture land of Sanchor block (Fig 5.2).
Table 5.2. Effects of spatial variations and land uses on soil gravel content. Values are
mean±SE of multiple replications.
Land use Blocks Bali Baitu Aburoad Sanchor Baap Sankara
Forest 45.48±5.40 6.01±3.87 51.71±2.1 0.79±0.36 3.66±2.05 9.09±4.75 Oran 40.15±10.71 5.83±2.31 38.58±6.25 0.78±0.13 17.00±9.40 22.77±6.79 Pastureland 39.86±5.49 4.72±1.85 42.2±5.28 3.28±2.23 10.64±5.08 11.24±5.74 Agriculture 31.37±3.93 1.73±0.63 36.4±3.82 0.85±0.16 8.80±3.05 9.35±2.75 Roadside 35.04±3.63 4.55±0.9 37.77±5.27 4.66±2.58 4.36±1.02 4.81±1.48 Fallowland 28.47±0.00 0.61±0.00 22.95±0.00 1.82±0.00 13.71±0.00 4.70±0.00 Two-way ANOVA F value P value Block 44.57 0.000 Land use 2.50 0.031 Block × land use 1.21 0.230
Fig 5.2 Changes in soil gravel content due to spatial variations (A) and land uses (B) in
western Rajasthan. Error bars are ±1SE of multiple replications.
05
1015202530354045
Bali
Baitu
Abu
road
Sanc
hor
Baap
Sank
ara
A
Block
Gra
vel c
onte
nt (%
, w/w
)
0
5
10
15
20
25
30
Fore
st
Gua
char
Ora
n
Agr
ic.
Roa
dsid
e
Fallo
w
B
Land use
Gra
vel c
onte
nt (%
, w/w
)

99
2.2 Soil bulk density
Soil bulk density (BD) is an estimate required to calculate soil organic carbon stocks in tons
of carbon per hectare (tons carbon ha-1). Bulk density is the dry weight of a known volume of
soil. It can be taken using a core, exhaust tube or pipe hammered into soil for a given depth.
Bulk density values are affected by soil texture but are not easily correlated with soil types.
Soil bulk density is an indicator of soil porosity and compactness also. It varies from 1.2 g
cm-3 to 1.8 g cm-3 depending upon soil types and availability of organic matter
(http://www.soilquality.org.au/factsheets/making-sense-of-physical- indicators). Higher the
soil bulk density greater is the soil compactness and lower is the soil quality. It varied
significantly both due to blocks as well as land uses (Table 5.3). Average soil bulk density
was 1.46 g cm-3 across the blocks and land uses. It differed (P<0.05) both due to spatial
differences in the blocks as well as the land use.
Table 5.3. Effects of spatial variations and land uses on soil bulk density (g cm-3). Values are
mean±1SE of multiple replications.
Land use MPOWER blocks Bali Baitu Aburoad Sanchor Baap Sankara
Forest 1.32±0.02 1.41±0.07 1.45±0.02 1.52±0.03 1.55±0.01 1.49±0.02 Oran 1.45±0.02 1.47±0.03 1.45±0.02 1.47±0.03 1.55±0.01 1.48±0.02 Pastureland 1.36±0.03 1.47±0.02 1.45±0.02 1.50±0.01 1.54±0 1.51±0.02 Agriculture 1.38±0.04 1.46±0.01 1.42±0.02 1.47±0.02 1.51±0.02 1.47±0.02 Roadside 1.44±0.02 1.46±0.01 1.40±0.02 1.43±0.02 1.45±0.02 1.47±0.01 Fallowland 1.48±0.00 1.50±0.00 1.51±0.00 1.56±0.00 1.56±0.00 1.58±0.00 Two-way ANOVA F value P value Block 10.32 0.000 Land use 4.14 0.001 Block × land use 1.94 0.005
Among the blocks, bulk density was lowest in the soils of Bali block and highest in Baap
block (Fig 5.3). Soils of these blocks can be categorized into four groups of increasing order
of bulk density like Bali<Aburoad<Baitu~Sanchor~Sankara<Baap. Soils of Baitu, Sanchor
and Sankara blocks were almost similar in soil bulk density and appeared to be due to their
occurrence in associated soil patch dominated by soils developed by wind deposited sands.
Among the land uses, soil bulk density was highest (P<0.05) in fallow land. It indicates that
abandoning land leads to soil compaction in the region. Soil bulk density was lowest in the
soils along the road side, but it did not differ with the bulk density of the soils in forest land,
agriculture land, pasture land and Oran. Block × land use interactions was significant
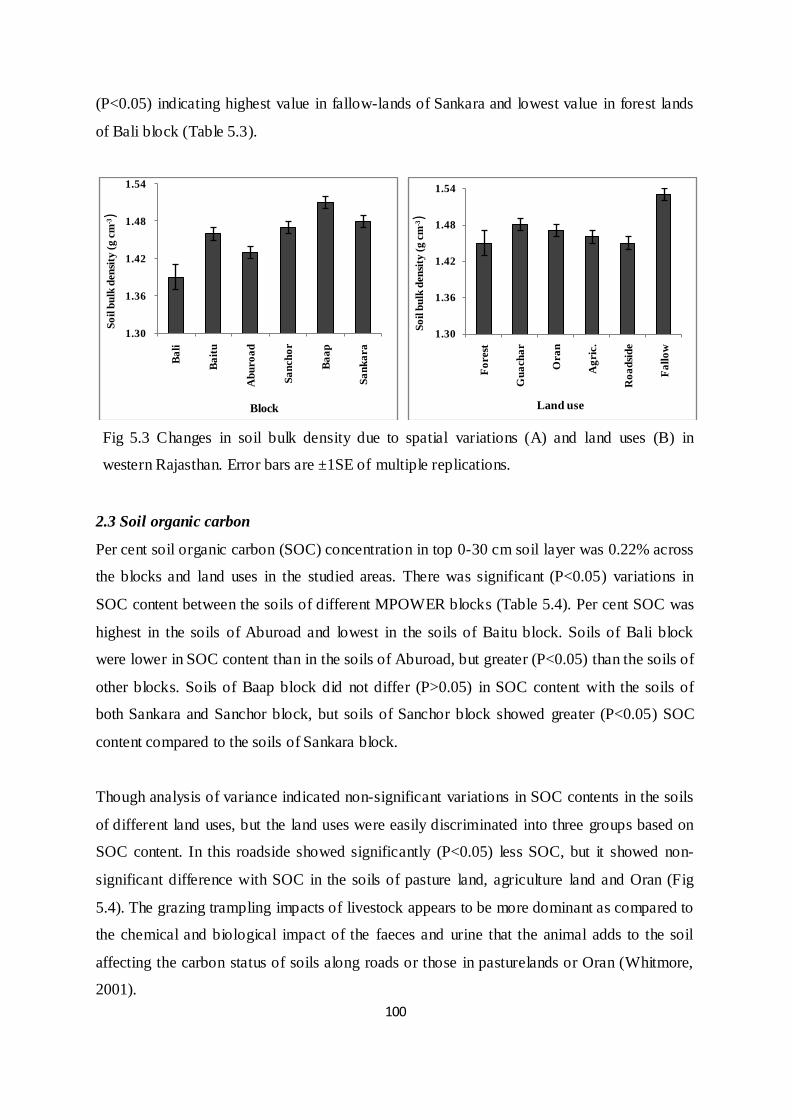
100
(P<0.05) indicating highest value in fallow-lands of Sankara and lowest value in forest lands
of Bali block (Table 5.3).
Fig 5.3 Changes in soil bulk density due to spatial variations (A) and land uses (B) in
western Rajasthan. Error bars are ±1SE of multiple replications.
2.3 Soil organic carbon
Per cent soil organic carbon (SOC) concentration in top 0-30 cm soil layer was 0.22% across
the blocks and land uses in the studied areas. There was significant (P<0.05) variations in
SOC content between the soils of different MPOWER blocks (Table 5.4). Per cent SOC was
highest in the soils of Aburoad and lowest in the soils of Baitu block. Soils of Bali block
were lower in SOC content than in the soils of Aburoad, but greater (P<0.05) than the soils of
other blocks. Soils of Baap block did not differ (P>0.05) in SOC content with the soils of
both Sankara and Sanchor block, but soils of Sanchor block showed greater (P<0.05) SOC
content compared to the soils of Sankara block.
Though analysis of variance indicated non-significant variations in SOC contents in the soils
of different land uses, but the land uses were easily discriminated into three groups based on
SOC content. In this roadside showed significantly (P<0.05) less SOC, but it showed non-
significant difference with SOC in the soils of pasture land, agriculture land and Oran (Fig
5.4). The grazing trampling impacts of livestock appears to be more dominant as compared to
the chemical and biological impact of the faeces and urine that the animal adds to the soil
affecting the carbon status of soils along roads or those in pasturelands or Oran (Whitmore,
2001).
1.30
1.36
1.42
1.48
1.54Ba
li
Baitu
Abu
road
Sanc
hor
Baap
Sank
ara
Soil
bulk
den
sity
(g cm
-3)
Block
1.30
1.36
1.42
1.48
1.54
Fore
st
Gua
char
Ora
n
Agr
ic.
Roa
dsid
e
Fallo
w
Soil
bulk
den
sity
(g cm
-3)
Land use

101
Table 5.4. Effects of spatial variations and land uses on per cent soil organic carbon content. Values are mean±1SE of multiple replications. Land use MPOWER block
Bali Baitu Aburoad Sanchor Baap Sankara Forest 0.53±0.08 0.05±0.02 0.70±0.07 0.14±0.04 0.12±0.02 0.12±0.02 Oran 0.36±0.08 0.05±0.01 0.60±0.10 0.16±0.02 0.12±0.03 0.15±0.01 Pastureland 0.41±0.11 0.07±0.01 0.63±0.06 0.17±0.02 0.12±0.01 0.12±0.01 Agriculture 0.48±0.04 0.09±0.01 0.69±0.15 0.22±0.03 0.14±0.02 0.12±0.01 Roadside 0.30±0.06 0.04±0.01 0.55±0.10 0.21±0.04 0.19±0.02 0.13±0.02 Fallowland 0.54±0.00 0.06±0.00 0.87±0.00 0.12±0.00 0.12±0.00 0.06±0.00 Two-way ANOVA F value P value Block 60.36 0.000 Land use 1.44 0.210 Block × land use 0.96 0.523
Soils of fallow land and forest lands were similar in SOC content, but soils of Oran,
agriculture and pasture lands were significantly low (P<0.05) than forests but did not differ in
SOC content in the soils of fallow land. However, soils of fallow lands of Bali and Aburoad
block had highest amount of SOC content than other land uses, whereas it was lesser in other
blocks. Soils of forest land had highest concentrations of SOC concentrations in general.
Interactions terms of block and land use for SOC concentration was also not significant
indicating independent behaviour of these two variables (Table 5.4).
Fig 5.4 Changes in per cent soil organic carbon due to spatial variations (A) and land uses
(B) in western Rajasthan. Error bars are ±1SE of multiple replications.
3. VARIATIONS IN SOIL CARBON STOCK
Change of land use in favour of forests or organic farming enhances soil carbon stock in
general. Estimated soil carbon stocks in 0-30 cm soil layer was 7.12±0.33 (mean ±1SE) tons
0.00
0.10
0.20
0.30
0.40
0.50
0.60
0.70
0.80
Bali
Baitu
Abu
road
Sanc
hor
Baap
Sank
ara
Soil
orga
nic c
arbo
n (%
, w/w
)
Block
0.000.050.100.150.200.250.300.350.400.45
Fore
st
Gua
char
Ora
n
Agr
ic.
Roa
dsid
e
Fallo
w
Soil
orga
nic c
arbo
n (%
, w/w
)
Land use
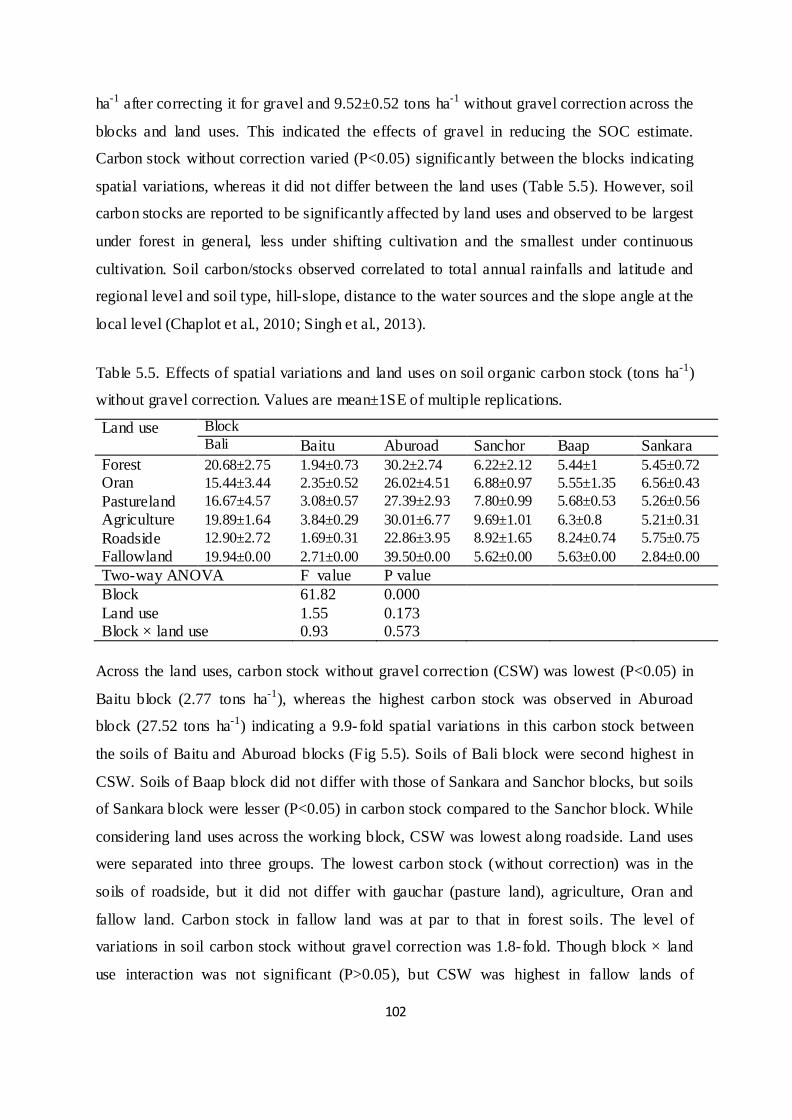
102
ha-1 after correcting it for gravel and 9.52±0.52 tons ha-1 without gravel correction across the
blocks and land uses. This indicated the effects of gravel in reducing the SOC estimate.
Carbon stock without correction varied (P<0.05) significantly between the blocks indicating
spatial variations, whereas it did not differ between the land uses (Table 5.5). However, soil
carbon stocks are reported to be significantly affected by land uses and observed to be largest
under forest in general, less under shifting cultivation and the smallest under continuous
cultivation. Soil carbon/stocks observed correlated to total annual rainfalls and latitude and
regional level and soil type, hill-slope, distance to the water sources and the slope angle at the
local level (Chaplot et al., 2010; Singh et al., 2013).
Table 5.5. Effects of spatial variations and land uses on soil organic carbon stock (tons ha-1)
without gravel correction. Values are mean±1SE of multiple replications.
Land use Block Bali Baitu Aburoad Sanchor Baap Sankara
Forest 20.68±2.75 1.94±0.73 30.2±2.74 6.22±2.12 5.44±1 5.45±0.72 Oran 15.44±3.44 2.35±0.52 26.02±4.51 6.88±0.97 5.55±1.35 6.56±0.43 Pastureland 16.67±4.57 3.08±0.57 27.39±2.93 7.80±0.99 5.68±0.53 5.26±0.56 Agriculture 19.89±1.64 3.84±0.29 30.01±6.77 9.69±1.01 6.3±0.8 5.21±0.31 Roadside 12.90±2.72 1.69±0.31 22.86±3.95 8.92±1.65 8.24±0.74 5.75±0.75 Fallowland 19.94±0.00 2.71±0.00 39.50±0.00 5.62±0.00 5.63±0.00 2.84±0.00 Two-way ANOVA F value P value Block 61.82 0.000 Land use 1.55 0.173 Block × land use 0.93 0.573
Across the land uses, carbon stock without gravel correction (CSW) was lowest (P<0.05) in
Baitu block (2.77 tons ha-1), whereas the highest carbon stock was observed in Aburoad
block (27.52 tons ha-1) indicating a 9.9-fold spatial variations in this carbon stock between
the soils of Baitu and Aburoad blocks (Fig 5.5). Soils of Bali block were second highest in
CSW. Soils of Baap block did not differ with those of Sankara and Sanchor blocks, but soils
of Sankara block were lesser (P<0.05) in carbon stock compared to the Sanchor block. While
considering land uses across the working block, CSW was lowest along roadside. Land uses
were separated into three groups. The lowest carbon stock (without correction) was in the
soils of roadside, but it did not differ with gauchar (pasture land), agriculture, Oran and
fallow land. Carbon stock in fallow land was at par to that in forest soils. The level of
variations in soil carbon stock without gravel correction was 1.8-fold. Though block × land
use interaction was not significant (P>0.05), but CSW was highest in fallow lands of

103
Aburoad and lowest in the soils along roadside of Baitu block (Table 5.5).
Carbon stock after gravel (CSG) correction varied significantly (P<0.05) due to blocks,
whereas it approached (P=0.071) significant value for the land uses (Table 5.6). Average
values of CSG across the land uses showed lowest and highest values in the soils of Baitu
(2.66 tons ha-1) and Aburaod (16.33 tons ha-1) block, respectively (Fig 5.5). Soils of Baap and
Sanchor were almost similar (P>0.05) in CSG. The order of block in SCG was:
Baitu<Sankara<Baap<Sanchor<Bali <Aburoad. Lowest SOC stock in Baitu appears to be
due to sandy nature of the soils as indicated by a study in Ajmer district of Rajasthan where
soils with clay texture were observed to be higher (i.e., 0.58 %) in organic carbon than soils
having textures of loamy sand (i.e., 0.36 %) and sand with about 0.2 % SOC (Giri et al.,
2007).
Fig 5.5. Changes in per cent soil organic carbon due to spatial variations (A) and land uses
(B) in western Rajasthan. Error bars are +1SE of multiple replications.
Among the land uses (across the blocks), the lowest CSG (6.17 tons ha-1) was in the soils of
roadside, but it did not differ with the carbon stock in the soils of Oran, gauchar, agriculture
and forest lands. The highest (10.08 tons ha-1) amount of CSG was in fallow land, but CSG in
the soils of forest lands and agriculture land were at par (P>0.05) with that in the fallow land.
Relatively less estimate of SOC stock (CSG) in forests as compared to fallow land was due to
higher content of gravel and stone in former as compared that in the latter type of land use. In
contrast Shrestha et al. (2004) observed higher SOC stock in the topsoil (0 -10 cm) of
0
5
10
15
20
25
30
Bali
Baitu
Abu
road
Sanc
hor
Baap
Sank
ara
No correction Gravel correction
Block
Soil
orga
nic c
arbo
n (t
ons h
a-1)
0
5
10
15
20
25
30Fo
rest
Gua
char
Ora
n
Agr
ic.
Roa
dsid
e
Fallo
w
No correction Gravel correction
Land use
Soil
orga
nic c
arbo
n (t
ons h
a-1)

104
grazing land compared to forest soil and cultivated soil. The higher content of gravel and
stone in forest soil resulted in a lower estimate of the SOC stock per unit area despite of
similar SOC contents in forest and grazing lands (Shrestha et al. (2004).
Table 5.6. Effects of spatial variations and land uses on soil carbon stock (tons ha-1) after
gravel correction. Values are mean±1SE of multiple replications. Land use Block
Bali Baitu Aburoad Sanchor Baap Sankara Forest 11.16±1.69 1.85±0.76 14.42±1.12 6.18±2.12 5.17±0.81 4.86±0.67 Oran 8.97±2.38 2.16±0.45 16.13±3.19 6.82±0.96 4.56±0.94 5.02±0.51 Pastureland 10.47±3.43 2.9±0.52 16.71±3.27 7.45±0.93 5.09±0.58 4.72±0.59 Agriculture 13.91±1.72 3.77±0.29 18.63±4.43 9.6±1.00 5.68±0.75 4.65±0.26 Roadside 8.47±2.01 1.61±0.29 14.22±2.43 8.4±1.52 7.87±0.7 5.38±0.68 Fallowland 14.26±0.00 2.69±0.00 30.43±0.00 5.51±0.00 4.83±0.00 2.70±0.00 Two-way ANOVA F value P value Block 34.95 0.000 Land use 2.95 0.071 Block × land use 1.02 0.444
The order of land uses for CSG was: Roadside<Oran<gauchar<agriculture
land<Forest<Fallow land. Block × land use did not differ though the value of CSG was
highest (30.43 tons ha-1) in fallow land of Aburoad and lowest (1.61 tons ha-1) in the soils
along roadside of Baitu block. This indicates effects of land use on spatial variations in SOC
stock, though it was also related to rainfall and soil conditions (Venkanna et al., 2014). In a
study Liu et al (2011) also observed significant regional impact of rainfall, temperature,
elevation, clay and silt contents and land use on soil carbon density. However, a negative
impact of human activities has also been observed on SOC accumulation in the above study
(Liu et al., 2011). Higher estimate of SOC stock in fallow land followed by agriculture lands
of Aburoad/Bali block appeared to be due to organic manure added. The changes in the order
of block and land uses for the soil carbon stock with and without gravel correction was due to
gravel content. However, relatively greater soil carbon stock in fallow land suggests the
benefit of leaving farmlands as fallow to recoup the SOC and nutrients, whereas continuous
cultivations expose the soil leading to decrease in SOC by oxidation process.
4. ORGANIC MANURING
Use of organic manure and compost generated through domestic animals wastes or use of
vermi-compost promoted in the regions by the concerned NGOs found favourable for
increasing soil organic carbon and enhanced soil carbon stock and soil fertility useful in

105
increasing yield of agricultural crops and vegetables. It has also been indicated by greater
SOC in agriculture land and fallow land particularly in Bali and Aburoad areas. In general
soils where the higher quantity of organic matter in the form of farm yard manure (FYM) is
added, the content of organic carbon is higher than the soils which receives less quantity or
frequency of added FYM (Giri et al., 2007).
5. ALTERNATIVE ENERGY SOURCES
In addition to afforestation and effective management of land resources for enhancing carbon
in soils and biomass following are the ways by which one can mitigate climate change effects
by minimizing the green house gas emissions. As the amount of carbon per kg of wood,
dung, biogas and kerosene vary widely (i.e., 418 g, 334 g, 396 g and 843 g, respectively), the
amount of energy delivered varied accordingly like 15.1 MJ (mega joule), 11.8 MJ, 17.7 MJ
and 43.1 MJ, respectively (Smith et al., 2000). LPG and kerosene burns with lesser
emissions. The wood has only a modest advantage over these fossil fuels (i.e., 26 g carbon as
CO2 per MJ delivered compared with 39 g for kerosene and 34 g for LPG). Because of high
efficiency combustion, biogas is far the lowest GWC emitted (2 g per MJ delivered) at the
stove per meal indicating the advantage of upgraded fuels made from biomass (Smith et al.,
2000). An estimate indicates that charcoal has 2-10 times greater global warming effect in
cooking than with firewood and 5-16 times than with kerosene or LPG. Followings are
measures tthat help reduing GHGs emissions:
Reduction in use of fossil fuels, cow-dung, crop residue and wood for cooking,
Use of improved chulha, kerosene stoves for efficient use of fuel resources
Use of LPG and kerosene in place of cow-dung, crop residue and wood
Use of solar light in place of fossil fuel or electricity for lighting etc.
An estimate in India during 2004–2005 indicates that one third household uses kerosene as
the primary source of lighting, i.e. 44.4% HHs in rural and 7.1% HHs in urban areas (NSSO,
2007). While approximately 60% of households in India use kerosene for lighting (Parikh,
2010), a single fuel-based lantern utilized for 4 hour per day estimated to emit more than 100
kg of CO2 per year, which corresponds to 190 million tons CO2 annually by all fuel-based
lighting in houses without electricity (Mills, 2005) with additional amount of different
toxicants (Lam et al., 2012).

106
In the present study interactions indicated that people of these blocks mostly depended on
fuel wood, crop residue and cow-dung for cooking before10 years (i.e., 2004-04). In this,
about 26% households used to cook their foods by fuel wood, 73% HHs used cow-dung and
fuel wood mix for this purpose and the remaining HHs utilized solely crop residue, and a
combination of cow dung, fuel wood and crop residue as the energy sources for cooking
foods (Fig 5.6A). A typical ultimate analysis of cow dung by weight indicates that it has
carbon content of about 31.6%, hydrogen about 05.18%, oxygen about 37.8%, nitrogen about
06.12% and ash content about 19.3% by weight indicating its poor quality in combustion as
compared to wood and can better to utilize in producing biogas or producing farm manure for
soil fertilization to enhance farm production
(http://www.appropedia.org/Efficient_Cooking_Stove_fueled_by_Cow_Dung). The United
Nations Framework Convention on Climate Change (UNFCCC) has approved and issued
carbon credits to two Nepalese biogas projects in which animal dungs are used in producing
biogas for the cooking purposes. This is the largest worldwide issuance of carbon credits, or
Certified Emission Reductions (CERs), in a Least Developed Country (LDC), whereas two
more similar projects from Nepal are now at an advanced stage of being registered with the
UNFCCC (Sahoo, 2011). In present study 26% HHs used fuel wood alone for cooking during
2003-04 which reduced to 18% during the surveyed period of 2013-14, whereas 73% HHs
used to burn cow-dung and fuel wood mix for cooking (during 2003-04) which was reduced
to 57% during the surveyed period of 2013-14. About 1% HHs shifted towards utilizing LPG
for cooking, whereas another 16% HHs utilizes kerosene, wood and cow dung in addition to
LPG for this purpose (Fig 5.6B).
Fig 5.6. Change in use of energy generation for cooking purpose in studied area of western
Rajasthan.
602, 26%
3, 0%
1717, 73%
6, 0%21, 1% A: Befor 10 yrs
Gas (LPG)Cow dungWoodCrop residueCow dung/woodWood/crop residueCowdung/ wood/crop residueKeroseneCowdung/wood/keroseneWood/keroseneLPG/kerosene/woodLPG/woodLPG/cowdung/woodWood/cowdung/kerosene/LPG
14, 1%1, 0%
431, 18%
1337, 57%
3, 0%
10, 0%
1, 0%190, 8%
95, 4%17, 1%
57, 2%
151, 7% 42, 2% B: 2013-14 yrs

107
Thus there is minimization in extent of GHGs emissions by expected reduction in the use of
cow dung, crop residue and fuel wood for cooking purpose. However, it was observed that
despite of availability of LPG or kerosene people in general try to use fuel wood for cooking
or other form of energy generation as it is easily collected from different common pool lands
including forest lands. Amount of emission from each type of energy source used can be
easily calculated as provided in Box 5.1. Sharma and Agarwal (2011) conducted an
estimation for the carbon credit potential of biogas plant at Goushala, Durgapura, Jaipur,
which has 250 cows generating 750 kg (dry weight) of dung daily or over 273.8 tons of dung
annually. If this dung is disposed of in the form of lagoons or stored outdoors to decompose
naturally, it will emit methane and nitrous oxide equivalent to 594 tons CO2 per year. At
current price of US $10 per 1 tons CO2 equivalent, carbon credit of US$ 5940 per year can
be generated under UNFCCC. This type of activity can also be explored for generating
carbon credit for beneficial utilization of animal waste which otherwise is left to nature that
contributes to GHGs emission.
Box 5.1 Calculation of Carbon foot print
Electricity: Collection of data on annual electricity bills, in number of power units (i.e., one
unit is equivalent to 1KWh of electricity). The monthly electricity bills can be multiplied by
12 to convert consumption per year (A in KWh/yrs).
Petrol/Diesel: Number of litres of petrol/diesel used in car/motorcycle/pump set/tractor etc
consumed in a year can be calculated (B, in litres/year). In case of missing data average
values can be used.
LPG: In general, one LPG cylinder is around 14 kg of liquefied petroleum gas. Total
number of cylinders used in a year can be multiplied by 14 to get the annual uses of LPG (C
in kg/yrs).
The carbon footprint of electricity is A × 0.85 (Emission factor) Kg of CO2; petrol is B
×2.296 (EF) Kg CO2; diesel is B × 2.653 (EF) Kg CO2 and LPG is C × 2.983 (EF) Kg CO2.
Total Carbon Footprint can be calculated by adding all of the above to get output value in
Kg CO2, which after dividing by 1000 shows total carbon footprint in tons CO2.
Source: http://greencleanguide.com/2011/09/14/calculate-your-carbon-footprint/

108
6. PROMOTION OF PLANTATION
There have been distributions of seedlings of different horticultural and silvi-species to the
SHGs and their members in this programme. During the process of growth and litter and root
turn over this certainly help sequestering carbon. Afforestation, land abandonment and forage
planting on arable land lead to sequestration of carbon, however, the carbon sink effect after
abandonment may not be sustainable because of negative effects of varying types of
degradation of such lands (Zhang et al., 2012). However, the numbers of seedlings
distributed or planted are just symbolic and needs to be promoted on larger scale particularly
in restoring degraded pasture and other wastelands to enhance productivity and fodder and
fuel wood availability.
7. RELATIONSHIP AMONG DIFFERENT VARIABLES
There was positive correlation between annual average rainfall and gravel content, per cent
SOC and soil carbon stock, number of household (HHs) per village, human and livestock
population (buffalo and Ox), but it showed negative correlations with soil bulk density,
number of animals per HHs (cow, goat and sheep), land holdings and area of the village at
the regional level, i.e. across the studies areas (Table 5.7).
Table 5.7 Correlations in different variables of soils and socio-economic profile of a village
in the studied area of MPOWER.
Variable Gravel %SOC BD CSW CSG Rainfall HHs Gravel - 0.578** -0.252** 0.574** 0.321** 0.660** 0.208** %SOC 0.578** - -0.297** 0/997** 0.926** 0.745** 0.160* Soil bulk density -0.252** -0297** - -0.243** -0.195** -0.365** -0.153** Rainfall 0.660** 0.745** -0.365** 0.740** 0.626** - 0.342** Population 0.187** 0.129* -0.133* 0.118* 0.117* 0.338** 0.984** Pop./HHs 0.129* 0.100 - 0.100 - - - Livestock 0.225** - -0.170** - - 0.241** 0.874** LS/HHS - -0.144** - -0.148* -0.181* -0.174** -0.247** Cow - -0.129* - -0.128* -0.114* -0.245** -0.186** Buffalo 0.179* 0.362** -0.126* 0.364** 0.395** 0.579** 0.217** Ox 0.548** 0.435** -0.427** 0.410** 0.315** 0.599** 0.458** Goat -0.105* -0.198** - -0.201** -0.233** -0.238** -0.262** Seep - -0.126* - -0.125** -0.123* -0.167** - Land holding -0.303** -0.374** 0.302** -0.367** -0.320** -0.627** -0.313** Irrigated land -0.143** -0.371** 0.311** - -0.313** -0.626** -0.298** Unirrigated land -0.190** -0.282** 0.224** -0.363** -0.243** -0.419** 0.180* Culturable land -0.167* 0.200** -0.161** -0.139** -0.329** - Not Av. cultivation 0.239** - - - - 0.146* 0.482 Village area - -.160* 0.164* -0.160* -0.143* -0.229** 0.498**
109
Per cent soil organic carbon and carbon stock were negatively correlated to soil bulk density,
livestock per HHs, cow, goat and sheep population, irrigated and unirrigated lands and total
village area, but had positive correlations to human, buffalo and Ox populations. Number of
HHs indicated positive correlation-ships with gravel content, per cent SOC, CSW and CSG,
rainfall, total human and livestock population (buffalo and Ox), total village area and
unirrigated land and area not available for cultivation. However, it was negatively related to
soil bulk density, animals per HHs including cow and goat population and land holding per
HHs. This indicates that villages with smaller number of HHs had greater number of
domestic animals particularly small ruminants and thus lesser stock of SOC content and SOC
stock. It appears that physical impact like over grazing, vegetation removal and soil structure
deterioration is more as compared to the added benefits of organic wastes of these animals
(Whitmore, 2001; York, 2013). Land holding decreased (r=-0.627, P<0.01) with increase in
rainfall, but land holding showed positive correlation with animals per HHs (r=0.325,
P<0.01) and population of cow (r=0.503, P<0.01), goat (r=253, P<0.01), sheep (r=0.187,
P<0.01) and camel (r=0.235, P<0.01).
Per cent SOC content showed an increasing trend as the average annual rainfall increases
(F2/359 = 291.3, R2=0.618, P<0.001). This indicates the beneficial effects of soil water
availability through rainfall on soil organic carbon as observed in the other studies, where
soil carbon content and stock were favoured by rainfall at regional level (Chaplot et al., 2010;
Singh, 2014). It was also indicated by highest SOC content and SOC stock in Bali and
Aburoad with relatively high annual rainfall as compared to the other blocks. However, soil
types also played role on these variables as observed in Baitu block dominated by dune soils
that is sandy in nature. Soil bulk density showed a decreasing trend with increase in rainfall
indicating the effects of increased soil organic matter (Fig 5.7). Beneficial effects of rainfall
are through increased soil water availability favouring vegetation growth and biomass
production and subsequently soil organic carbon enrichment and thus soil structure.
Sustaining carbon uptake however, relies on growth and development of vegetation, which
requires careful balance with biomass removal through grazing or harvesting affecting
carbon sequestration (Derner and Schuman 2007; Thomey et al., 2014). Grazing at light,
moderate, and heavy stocking rates have been observed to increase SOC (Reeder and
Schuman 2002; Reeder et al., 2004) in top soil layers, while moderate and heavy grazing for
a long time reported to increase SOC in deeper soil layers in mixed-prairie (Liebig et al.,

110
2010).
Fig 5.7. Trend line relationships between rainfall and soil organic carbon and soil bulk density.
Rainfall has been observed related to soil organic carbon stock by a quadratic relationship in
both after correction for gravel content (F2/359 = 127.6, R2=0.415, SE = 5.09, P<0.001) and
without gravel correction (F2/359 = 288.9, R2=0.617, SE = 6.24, P<0.001). In this SOC stock
without gravel correction appeared better related than the SOC stock after gravel correction.
However, difference between these two values increased with increase in annual rainfall (Fig
5.8). It appears to be due to increased gravel content with rainfall because of loss of soils
under erosion affecting fine earth fraction of the bulk soils.
Fig 5.8. Relationship between rainfall and soil organic carbon stock with and without gravel correction.
Soil carbon stock, i.e. both after gravel correction (F1/360 = 3.24, R2=0.009, SE = 6.32,
y = 3E‐06x2 ‐ 0.001x + 0.322R² = 0.618
y = ‐0.000x + 1.522R² = 0.131
0
0.2
0.4
0.6
0.8
1
1.2
1.4
1.6
1.8
0 150 300 450 600 750
%SOC Bulk density
Average annual rainfall of 1995-2014 (mm)
SOC
(%)/B
ulk
dens
ity (g
/cm
3 )
Y = 6E-05x2 - 0.024x + 7.169R² = 0.42
Y = 0.000x2 - 0.075x + 14.99R² = 0.616
0.0
10.0
20.0
30.0
40.0
50.0
60.0
70.0
80.0
0 150 300 450 600 750
Gravel corrected Without correctionGravel corrected Without correction
SOC
stoc
k (t
onsh
a-1)
Average annual rainfall of 1995-2014 (mm)

111
P=0.073) and without correction (F1/360 = 3.659, R2=0.01, SE = 10.01, P=0.054) increased
with number of individuals per household by approaching to a significant level. However soil
carbon stock without gravel correction decreased linearly (F1/360 = 8.11, R2=0.022, SE =
9.95, P<0.01) and after correction for gravel it followed a logarithmic decreasing trend (F1/360
= 15.08, R2=0.04, SE = 6.22, P<0.001) with increase in number of livestock per household
(Fig 5.9). However, total population of livestock at village level had no relationship with
SOC stock. The decrease in SOC stock was more significant with increased population of
goat (F1/360 = 20.65, P<0.001) and significant (F1/360=4.73, P<0.05) with increased cow
population, but SOC stock increased with increase in buffalo population (F1/360 = 66.67,
P<0.001). The probable cause indicating positive effect of buffalo population on increased
SOC stock was their stall feeding particularly in area with increase water availability and its
manure applied to the farm for increasing farm productivity (Ngo et al., 2014).
Fig 5.9. Relationships of soil organic carbon stock with (dotted line) and without gravel
(solid line) corrections with human (left) and livestock (right) population per household.
0
10
20
30
40
50
60
70
80
3.00 6.00 9.00
Gravel corrected Without correction
Human population (nos per household)
SOC
Sto
ck (t
ons h
a-1)
SOC = -2.45ln(Pop) + 10.65R² = 0.040
SOC = -0.555*Pop + 12.19R² = 0.022
0
10
20
30
40
50
60
70
80
0.00 5.00 10.00 15.00 20.00
Gravel corrected Without correction
Livestock population (nos per household)
SOC
Sto
ck (t
ons h
a-1)

112
113
CHAPTER 6
PEOPLE PERCEPTIONS AND CLIMATE CHANGE ADAPTATIONS
___________________________________________________________________________
Vulnerability is defined as the degree to which a system is susceptible to, or unable to cope
with, adverse effects of climate change, including climate variability and extremes. It is a
function of the character, magnitude, and rate of climate variation to which a system is
exposed, its sensitivity, and its adaptive capacity. Adaptation is defined as the adjustment in
natural or human systems in response to actual or expected climatic stimuli or their effects,
which moderates harm or exploits beneficial opportunities (IPCC, 2001).
1. CLIMATE CHANGE ADAPTATION
Because of its geographical position Rajasthan suffers from water scarcity and has the
maximum probability of draught occurrence. The state falls in the region of high climate
sensitivity and vulnerability and low adaptive capacity. Climate change affects every aspect
of society, environment and economy requiring adjustments in behaviour, livelihoods,
infrastructure, laws, policies and institutions in response to experienced based expected
climatic events. Western Rajasthan is known for its primitive, shy and socially and
economically backward rural citizens very much vulnerable to climate change (Mathur,
2014). The expected increase in the mean annual air temperature will be 2-4°C towards the
end of the 21st century (RSAPCC, 2011). While mean annual precipitation is predicted to
decrease slightly, the extreme precipitation is expected to increase in frequency and intensity.
This shows that the region’s climate is projected to become harsher. Without action in terms
of adaptation of social, human, economic, and natural resource management systems, these
climatic variations are predicted to result in decreasing surface and ground water availability,
flash floods, degradation of soil resources, decrease in crop yields, greater vulnerability to
crop pest outbreaks, and declines in forest and pastureland goods and services. This will
make the agricultural and pastoral communities more vulnerable to weather related losses of
life, livelihood and food security. Adapting to climate change requires adjustments and
implementation at every level starting from community to national and international.
Harshness in the environmental conditions has made the people of western Rajasthan to
adapt to weather adversities and devise various means and ways to cope up with such

114
climatic variations. Khadin system of cultivation is one of them originally developed by
desert dwellers in medieval times in Jaisalmer (Dhir, 2010). This system was designed earlier
with a 10 to 50 times runoff to runon area, where even 50 mm rainfall spell was sufficient to
ensure a successful crop in the runon area. During past few decades, a modified version of
this system has been deployed for the 200-300 mm rainfall areas of Jodhpur, Barmer and
Jaisalmer districts that has resulted in building of as many as 3500 such structures during this
period. Devising various methods of rainwater harvesting including ‘Chauka System’ to
ensure drinking water supply and conserved soil moisture, traditional agro forestry for
ensured fodder, fuel and food and alternative land use systems involving livestock for
enhanced livelihood are other types of adaptations (Bhati, 2010). There exists a diversity of
rainwater harvesting and ground water management by constructing different in-situ and ex-
situ structures like Nadi, check dams, percolation ponds, artificial recharge through dug wells
structures, etc.
Chauka System
‘Chauka System’ is an innovative method of soil and moisture conservation developed by
the Gram Vikas Navyuvak Mandal, Laporiya (GVNML) in Jaipur region of Rajasthan. It
integrates fodder production and pasture improvement with augmentation of ground water
resources through a scientifically designed, low-cost technique for management of water
run-off in the regions with relatively less slope. Application of Chauka system has increased
net and gross area under agriculture, improved biomass availability, and enhanced milk
yield of domestic cattle that have contributed to reduce youth migration of the associated
villages.
http://slem-cpp.icfre.gov.in/UserFiles/File/Management-of-Rain-water-and-community.pdf
Water scarcity has both its origins and it’s most immediate and visible effects on agriculture.
For ensured crop production in dry areas people use to irrigate these mostly through bore
wells so that they can enhance the crop yields and livelihood. But increased irrigation leads
to excessive groundwater abstraction, ultimately affecting everyone, urban and rural, large
landowner and marginal farmer alike. Sanghi and Mendelsohn (2008) concluded through a
study that in much of southern and eastern Rajasthan, the elevated temperatures and evapo-
transpiration are likely to result in net decreases in farm income. Given that a small
percentage of the state’s farmers have access to irrigation, resilience strategies for

115
agricultural production needs consideration on a variety of options, based on local conditions,
agro-climatic variations, and water availability, in addition to offering options for farmers
with different landholding sizes. Besides the use of traditional and/or improved crops and
varieties which can withstand low water, heat, and soil salinity, promoting agricultural
practices that improve soil fertility, enhance soil moisture retention, and confer pest
resistance, such as intercropping of diverse crops, green manuring, mulching, vermin-
composting, and low-till methods have been reported to build the systems that require low
inputs and increases the returns ensuring both food security and livelihoods. Adoption of
horticulture (fruits, vegetables, flowers) is observed to be more beneficial and its expansion
will provide a more diverse income base, and needed nutritional additions to subsistence
farmers (ICAR, 2010). Likewise agro- forestry plantations have significant co-benefits like
soil retention, water infiltration, micro-climate amelioration, and fuel wood provisioning,
though tree-based farming requires an investment in time before yields start.
Various studies reveal that a proper communication system coupled with traditional
knowledge can mitigate the effects of disasters that help in risk reduction. Pareek and Trivedi
(2011) documented how the tribal communities like Bhil, Meena, Banjara, Kathodi, Rabaris,
Sansi and Kanjar perceive and manage natural disasters and extreme weather events. This
included their strategies for early detection of coming events and for coping with these
events, as well as their perceptions of their short and long term impacts on biodiversity.
However, lack of benchmark makes indigenous knowledge difficult to harmonize and
integrate into conventional forecasting system because indigenous knowledge is mainly
based on relative experience and local experience. Thus systematic documentation,
quantification and subsequent integration of indigenous knowledge into conventional
weather forecasting system may be helpful in improving the accuracy and reliability of
seasonal forecasting information. The study by Bowler et al. (2003) in Australia
demonstrates that most striking climatic change during last 60 kyr occurred near 40 kyr ago
forced the lake-shore Homo sapiens to adapt to increasing aridity and deteriorating climate.
Other responses to societal disruptive climate change like prolonged drought and floods
suggested to the population dislocations, abandonment of villages and urban centers, and
even state collapse (deMenocal, 2001; Polyak, and Asmerom, 2001; Weiss et al., 1993; Haug
et al., 2003). Majorities of indigenous population residing in the desert area of Rajasthan use
to rear livestock, which is a major component of their livelihood. Migration during the time

116
of scarcity of fodder, food and water is the mitigation strategy against drought. Living a
nomadic life, these people have gained knowledge about the traditional phenomenon that
helps them in climate screening and building their livelihood resilience.
Rajasthan State Action Plan on Climate Change (RSAPCC, 2011) provides a clear priority to
the developmental activities that meet a combined set of seven climate-proofing criteria,
which can be verified through measurable indicators for ecological, economic and social
sustainability. These are (i) reduction and/or sequestration of greenhouse gases, (ii)
biodiversity conservation and ecosystem functioning, (iii) enhancing the yield of livelihoods
goods and services to local people, (iv) reduction in poverty and vulnerability and enhancing
the resilience and adaptive capacity, (v) local empowerment and capacity development, (vi)
synergy with objectives of international instrument and conventions, and (vii) coherence with
local strategies for sustainable development. Many of these activities have been taken under
Mahatma Gandhi National Rural Employment Guarantee Act (MNREGA) to address both
poverty and climate change mitigation and adaptation in Rajasthan (Singh et al., 2010).
2. PEOPLE PERCEPTONS
People perceptions are community expectations for support from government and
nongovernment organizations to overcome the regional or community problems arising out
of climatic adversities.
2.1. People perceptions about the work
About 31% respondents (ranging from almost negligible number of HHs in Sankara, Bali and
Baap to about 63% HHs in Aburoad block) have been observed not aware about the
MPOWER work. Another 20% population (ranged between 4% HHs in Aburoad and 48%
HHs in Sankara block) were unable to or hesitant in commenting about the quality of
work/activity/programme implemented in different working blocks. In rest 49% respondent,
23% population has find the activities carried out in the region as good, though it range from
18% HHs in Sanchor to 28% HHs in Baitu block. Another 9% population varying from
almost zero HHs in Baitu block to 35% HHs in Bali block has not been satisfied with the
activities conducted in the blocks (Table 6.1). About 8% population opined that the work
carried out in their region under MPOWER is average (i.e., 4% in Baitu to 15% in Aburoad),
whereas another 8% population rated the activities very good (ranging between 1% in
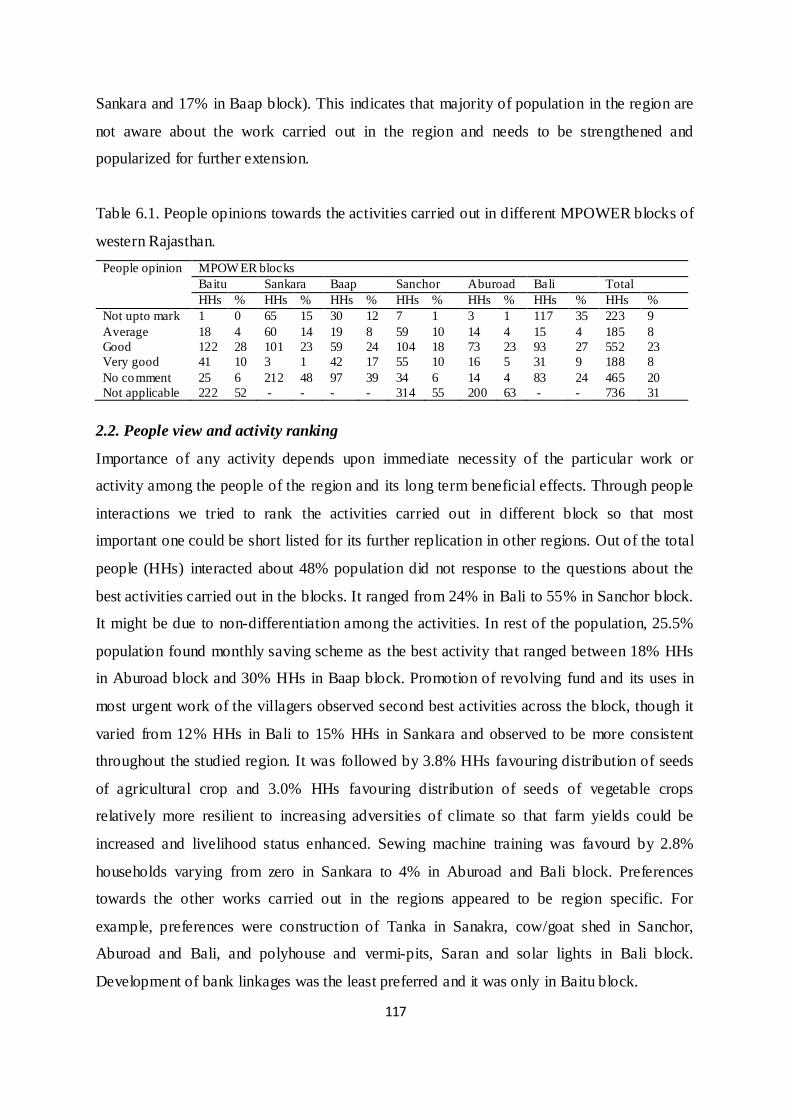
117
Sankara and 17% in Baap block). This indicates that majority of population in the region are
not aware about the work carried out in the region and needs to be strengthened and
popularized for further extension.
Table 6.1. People opinions towards the activities carried out in different MPOWER blocks of
western Rajasthan. People opinion MPOW ER blocks
Baitu Sankara Baap Sanchor Aburoad Bali Total HHs % HHs % HHs % HHs % HHs % HHs % HHs %
Not upto mark 1 0 65 15 30 12 7 1 3 1 117 35 223 9 Average 18 4 60 14 19 8 59 10 14 4 15 4 185 8 Good 122 28 101 23 59 24 104 18 73 23 93 27 552 23 Very good 41 10 3 1 42 17 55 10 16 5 31 9 188 8 No comment 25 6 212 48 97 39 34 6 14 4 83 24 465 20 Not applicable 222 52 - - - - 314 55 200 63 - - 736 31
2.2. People view and activity ranking
Importance of any activity depends upon immediate necessity of the particular work or
activity among the people of the region and its long term beneficial effects. Through people
interactions we tried to rank the activities carried out in different block so that most
important one could be short listed for its further replication in other regions. Out of the total
people (HHs) interacted about 48% population did not response to the questions about the
best activities carried out in the blocks. It ranged from 24% in Bali to 55% in Sanchor block.
It might be due to non-differentiation among the activities. In rest of the population, 25.5%
population found monthly saving scheme as the best activity that ranged between 18% HHs
in Aburoad block and 30% HHs in Baap block. Promotion of revolving fund and its uses in
most urgent work of the villagers observed second best activities across the block, though it
varied from 12% HHs in Bali to 15% HHs in Sankara and observed to be more consistent
throughout the studied region. It was followed by 3.8% HHs favouring distribution of seeds
of agricultural crop and 3.0% HHs favouring distribution of seeds of vegetable crops
relatively more resilient to increasing adversities of climate so that farm yields could be
increased and livelihood status enhanced. Sewing machine training was favourd by 2.8%
households varying from zero in Sankara to 4% in Aburoad and Bali block. Preferences
towards the other works carried out in the regions appeared to be region specific. For
example, preferences were construction of Tanka in Sanakra, cow/goat shed in Sanchor,
Aburoad and Bali, and polyhouse and vermi-pits, Saran and solar lights in Bali block.
Development of bank linkages was the least preferred and it was only in Baitu block.

118
Table 6.2. People perceptions about the most favoured activities implemented in different
MPOWER blocks of western Rajasthan. Activities MPOW ER blocks
Baitu Sankara Baap Sanchor Aburoad Bali Total HHs % HHs % HHs % HHs % HHs % HHs % HHs %
Monthly saving 107 25 120 27 75 30 158 28 59 18 80 24 599 25.5 Revolving fund 54 13 64 15 34 14 52 9 38 12 41 12 283 12.1 No response 222 52 213 48 97 39 314 55 199 62 83 24 1128 48.0 Tanka for drinking - - 23 5 - - - - - - - - 23 1.0 Sewing machine training 9 2 14 3 - - 16 3 12 4 15 4 66 2.8 Seed capital 5 1 1 0 - - 2 0 5 2 5 1 18 0.8 Bank linkage 1 0 - - - - - - - - - - 1 0.1 Seed distribution 25 6 - - 33 13 16 3 7 2 8 2 89 3.8 Goat shed 6 1 - - - - 4 1 - - 11 3 21 0.9 Poly-house/vermin-pit - - 6 1 1 0 2 0 - - 16 5 25 1.1 Vegetable seeds distribution - - - - 7 3 9 2 - - 54 16 70 3.0 Saran - - - - - - - - - - 21 6 21 0.9 Solar light - - - - - - - - - - 5 1 5 0.2 2.3. Requirements of the local people
During interactions and group discussion, various requirements were placed before the
interacting team. The highest population requires development of Kutir Udyog and other
employment generation activities. Percentage population in this category was 36.6 across the
region that ranged from 33% in Aburoad to 39% in Bali block. Increasing water availability
in the region has been preferred by about 26.6% population (Table 6.3).
Table 6.3. Listed requirement of the villagers in different blocks of MPOWER in western
Rajasthan. Requirement MPOW ER blocks
Baitu Sankara Baap Sanchor Aburoad Bali Total HHs % HHs % HHs % HHs % HHs % HHs % HHs %
No 2 0 5 1 6 2 3 1 - - 8 2 24 1.0 Medical facility 6 1 6 1 26 11 14 2 5 2 15 4 72 3.1 Employment 9 2 33 7 1 0 8 1 17 5 14 4 82 3.5 Toilets 45 10 20 5 37 15 37 6 49 15 55 16 243 10.3 Kutir Udyog and other 164 38 163 37 84 34 212 37 104 33 133 39 860 36.6 Medical + education 2 0 7 2 21 9 26 5 12 4 23 7 91 3.9 Medical/education/employment - - 3 1 - - 2 0 - - 5 1 10 0.4 Medical/education/toilets - - 3 1 2 1 - - 3 1 1 0 9 0.4 Water availability 140 33 140 32 35 14 192 34 86 27 32 9 625 26.6 Light availability 3 1 4 1 3 1 11 2 - - 11 3 32 1.4 Khaad, beej etc 6 1 - - 3 1 6 1 10 3 4 1 29 1.2 Fee fodder 17 4 30 7 - - 21 4 15 5 4 1 87 3.7 Animal (goat/sheep) 17 4 23 5 13 5 18 3 6 2 7 2 84 3.6 Fruit p lants for income 10 2 4 1 1 0 3 1 8 3 7 2 33 1.4 Money - - - - 15 6 20 3 5 2 16 5 56 2.4 Farming train ing 8 2 - - - - - - - - 4 1 12 0.5
However, it varied from requirements of 9% population in Bali block to 32% population in
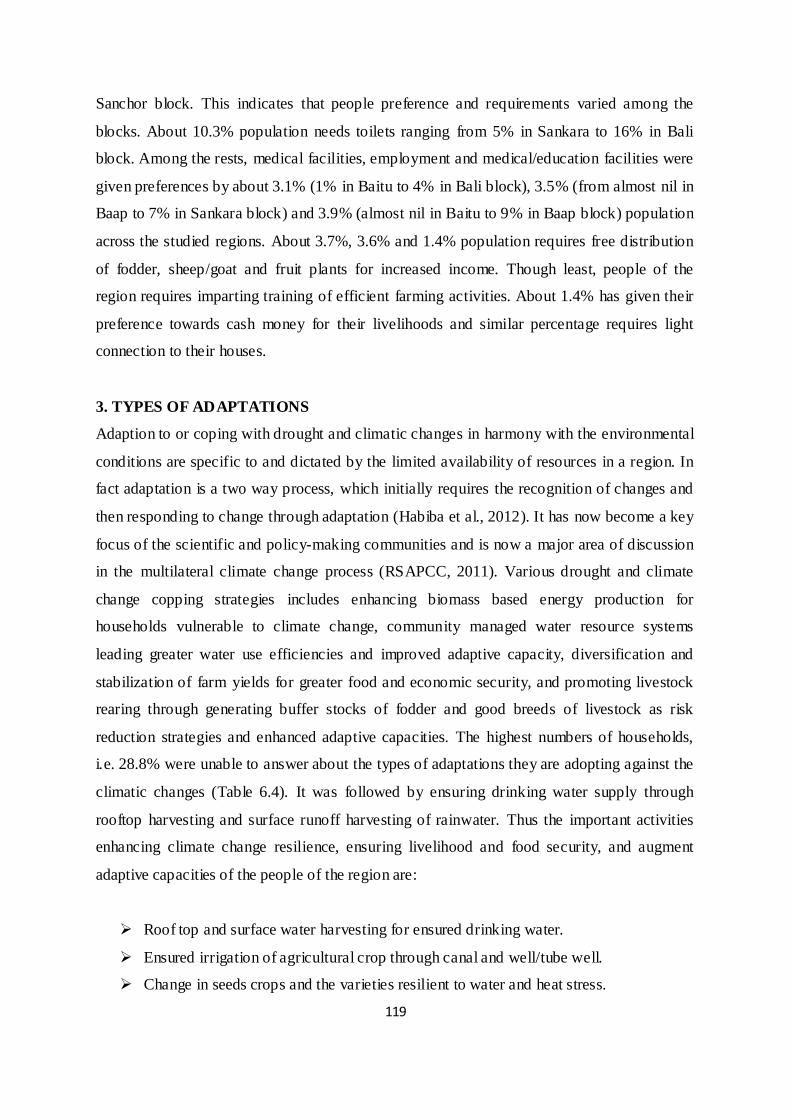
119
Sanchor block. This indicates that people preference and requirements varied among the
blocks. About 10.3% population needs toilets ranging from 5% in Sankara to 16% in Bali
block. Among the rests, medical facilities, employment and medical/education facilities were
given preferences by about 3.1% (1% in Baitu to 4% in Bali block), 3.5% (from almost nil in
Baap to 7% in Sankara block) and 3.9% (almost nil in Baitu to 9% in Baap block) population
across the studied regions. About 3.7%, 3.6% and 1.4% population requires free distribution
of fodder, sheep/goat and fruit plants for increased income. Though least, people of the
region requires imparting training of efficient farming activities. About 1.4% has given their
preference towards cash money for their livelihoods and similar percentage requires light
connection to their houses.
3. TYPES OF ADAPTATIONS
Adaption to or coping with drought and climatic changes in harmony with the environmental
conditions are specific to and dictated by the limited availability of resources in a region. In
fact adaptation is a two way process, which initially requires the recognition of changes and
then responding to change through adaptation (Habiba et al., 2012). It has now become a key
focus of the scientific and policy-making communities and is now a major area of discussion
in the multilateral climate change process (RSAPCC, 2011). Various drought and climate
change copping strategies includes enhancing biomass based energy production for
households vulnerable to climate change, community managed water resource systems
leading greater water use efficiencies and improved adaptive capacity, diversification and
stabilization of farm yields for greater food and economic security, and promoting livestock
rearing through generating buffer stocks of fodder and good breeds of livestock as risk
reduction strategies and enhanced adaptive capacities. The highest numbers of households,
i.e. 28.8% were unable to answer about the types of adaptations they are adopting against the
climatic changes (Table 6.4). It was followed by ensuring drinking water supply through
rooftop harvesting and surface runoff harvesting of rainwater. Thus the important activities
enhancing climate change resilience, ensuring livelihood and food security, and augment
adaptive capacities of the people of the region are:
Roof top and surface water harvesting for ensured drinking water.
Ensured irrigation of agricultural crop through canal and well/tube well.
Change in seeds crops and the varieties resilient to water and heat stress.
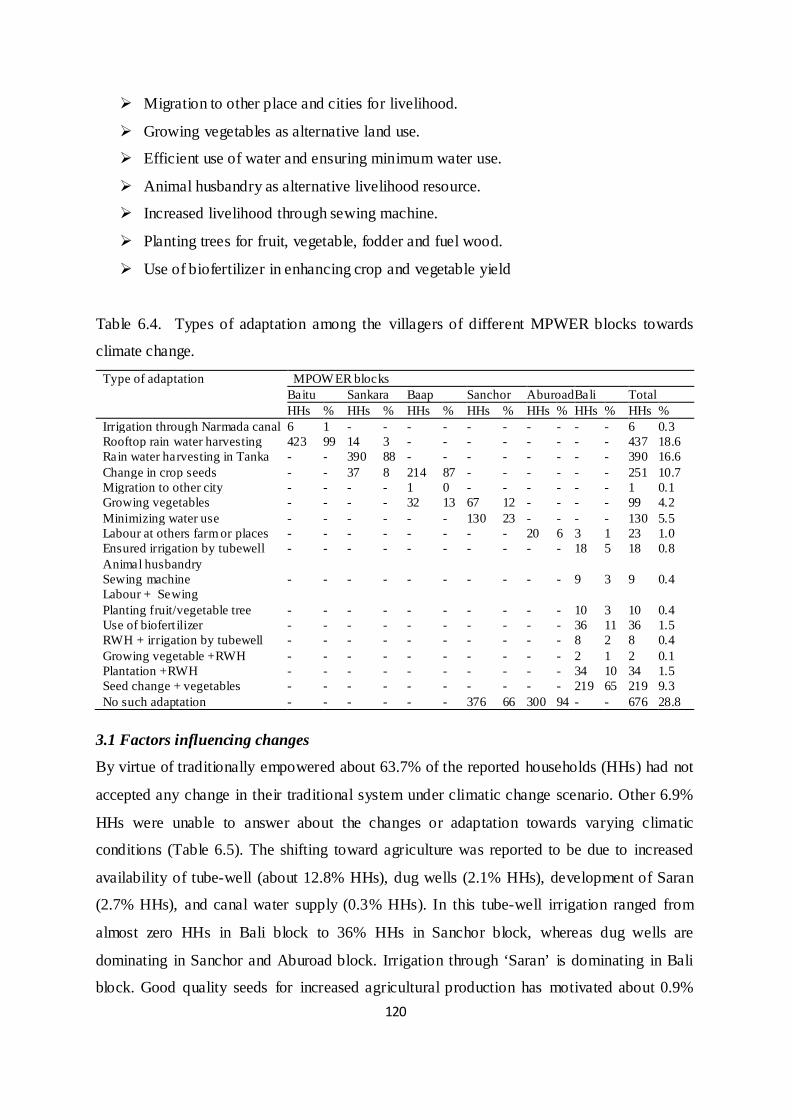
120
Migration to other place and cities for livelihood.
Growing vegetables as alternative land use.
Efficient use of water and ensuring minimum water use.
Animal husbandry as alternative livelihood resource.
Increased livelihood through sewing machine.
Planting trees for fruit, vegetable, fodder and fuel wood.
Use of biofertilizer in enhancing crop and vegetable yield
Table 6.4. Types of adaptation among the villagers of different MPWER blocks towards
climate change.
Type of adaptation MPOW ER blocks Baitu Sankara Baap Sanchor Aburoad Bali Total HHs % HHs % HHs % HHs % HHs % HHs % HHs %
Irrigation through Narmada canal 6 1 - - - - - - - - - - 6 0.3 Rooftop rain water harvesting 423 99 14 3 - - - - - - - - 437 18.6 Rain water harvesting in Tanka - - 390 88 - - - - - - - - 390 16.6 Change in crop seeds - - 37 8 214 87 - - - - - - 251 10.7 Migration to other city - - - - 1 0 - - - - - - 1 0.1 Growing vegetables - - - - 32 13 67 12 - - - - 99 4.2 Minimizing water use - - - - - - 130 23 - - - - 130 5.5 Labour at others farm or places - - - - - - - - 20 6 3 1 23 1.0 Ensured irrigation by tubewell - - - - - - - - - - 18 5 18 0.8 Animal husbandry Sewing machine - - - - - - - - - - 9 3 9 0.4 Labour + Sewing Planting fruit/vegetable tree - - - - - - - - - - 10 3 10 0.4 Use of biofert ilizer - - - - - - - - - - 36 11 36 1.5 RWH + irrigation by tubewell - - - - - - - - - - 8 2 8 0.4 Growing vegetable +RWH - - - - - - - - - - 2 1 2 0.1 Plantation +RWH - - - - - - - - - - 34 10 34 1.5 Seed change + vegetables - - - - - - - - - - 219 65 219 9.3 No such adaptation - - - - - - 376 66 300 94 - - 676 28.8
3.1 Factors influencing changes
By virtue of traditionally empowered about 63.7% of the reported households (HHs) had not
accepted any change in their traditional system under climatic change scenario. Other 6.9%
HHs were unable to answer about the changes or adaptation towards varying climatic
conditions (Table 6.5). The shifting toward agriculture was reported to be due to increased
availability of tube-well (about 12.8% HHs), dug wells (2.1% HHs), development of Saran
(2.7% HHs), and canal water supply (0.3% HHs). In this tube-well irrigation ranged from
almost zero HHs in Bali block to 36% HHs in Sanchor block, whereas dug wells are
dominating in Sanchor and Aburoad block. Irrigation through ‘Saran’ is dominating in Bali
block. Good quality seeds for increased agricultural production has motivated about 0.9%

121
HHs in enhancing their livelihoods. Adoption of alternative livelihood resources for better
adaptability towards climatic vagaries was motivated due to decreased water table affecting
agricultural production (1.1% HHs), for income generation (0.1%), motivated by MPOWER
programme (6.4%) and after visual observation on the ensured benefits and livelihood
activities of different SHGs.
Table 6.5. Probable reasons for adopting alternative practices over the traditional ones in
MPOWER blocks in western Rajasthan. Reason of change MPOW ER blocks
Baitu Sankara Baap Sanchor Aburad Bali Total HHs % HHs % HHs % HHs % HHs % HHs % HHs %
Income generation - - - - - - - - 1 0 - - 1 0.1 Suggestion by MPOWER - - 1 0 - - 1 0 131 41 18 5 151 6.4 After watching SHG - - - - - - - 72 23 - - 72 3.1 Canal supply - - - - - - 6 1 - - - - 6 0.3 Good quality seeds 15 3 - - - - - - 5 2 - - 20 0.9 Tubewell 12 3 43 10 32 13 207 36 7 2 - - 301 12.8 Availability of well - - - - - - 46 8 4 1 - - 50 2.1 Water level decrease - - - - - - 25 4 - - - - 25 1.1 Development of saran - - - - - - - - - - 64 19 64 2.7 N/A 11 3 48 11 9 4 67 12 16 5 12 4 163 6.9 No change 391 91 349 79 206 83 221 39 84 26 245 72 1496 63.7
3.2 Water availability
Water scarcity lies at the root of most of the adaptation challenges that people in the dry
areas are facing. This scarcity has its origins on the continuously increasing water demands,
inequity of access and safe drinking water, low water use efficiency all leading to
unsustainable use of water (Spross, 2015). On an average 90% of drinking water and 60% of
agricultural water is extracted from groundwater reserves, whereas about 207 blocks have
been designated as groundwater “dark zones” out of 237 administrative blocks in Rajasthan.
In these blocks abstraction rates of ground water have exceeded recharge rates and natural
recovery appears to be impossible. Water availability in Rajasthan is about 780 m3 per
annum per capita, which is far short against the accepted minimum requirement of about
1000 m3 for arid zone areas, whereas projected drop in supply is going to reduced to 450 m3
by the year 2050 (Hussain and Husain, 2012). Demands on water resources particularly in the
rural areas have increased largely because of increased irrigation and required building
capacity to harvest and conserve rainwater by generating and managing people’s own
resources (Chatterjee et al., 2005). About 18.6% HHs followed rooftop harvesting of
rainwater, whereas 16.6% HHs followed rainwater harvesting in traditional or improved

122
Tanka to ensure drinking water supply. Rainwater harvesting is dominating in Baitu, Sankara
and Baap blocks, where rainfall is relatively low and other sources of drinking water are
limited in number (Table 6.4). Another 2% HHs are adopting rainwater harvesting for
planted seedlings in house premises or farmlands as well as developing kitchen garden along
with drinking water.
3.3 Change in cropping pattern
Change in agricultural yields are going to be affected both by change in crop distribution
pattern under various climatic change scenarios and change in area under different crops
(Hassanein et al., 2012; Iizumi and Ramankutty, 2015; Xie et al., 2014). However, such crop
shifting will not be determined by temperature alone as soil is going to play an important role
as well, as there is less crop adaptation on prime soils than on lower quality soils (Xie et al.,
2014). Thus changes in cropping pattern in favour of species, varieties or cultivars, more
resilient to drought and heat stress is an important climate change adaptation strategy in
enhancing food security and livelihood (Hegazy et al., 2008; Fahim et al., 2013). People in
western Rajasthan since ages have followed the practice of mixed cropping along with the
traditionally growing trees like Prosopis cineraria and Tecomella undulata. Because of
various initiatives of government departments and NGOs as well as their own experiences
people of the region are now using different agricultural crops or their varieties and cultivars
more suited to water stress and heat stress.
Distribution of 2-3 kg ‘Bajra’ (Pennesetum glaucum), 1-1.5 kg of moong (Vigna radiata,
MRG-427) and 1-1.5 kg of moth (Vigna aconitifolia) seeds in different block was to ensure
crop yield even during low rainfall or to increase yield under ensured irrigation. Bajra (HHB
67) was distributed in water deficient blocks like Baitu, Baap and Sankara because of its low
requirement of water. In Sanchore Block, seeds of Bajra-9444 were distributed to the SHG’s
due to relatively more water availability in the working area. In Bali Block, ACF (the FNGO)
distributed 4 kg of maize (Same 2) and 20 kg of wheat seeds (Raj 4037) for its sowing in the
respective region. During the study, about 48% households have been covered under seed
distribution of different crop varieties to improve production and food security. Among the
studied households, about 61% of the HHs has used crop varieties relatively more resilient
and hardy to the variable rains and soil water stress during the Kharif season. However, it
varied from 19% HHs in Aburoad block to 95% in Baitu block. Use of more climate resilient
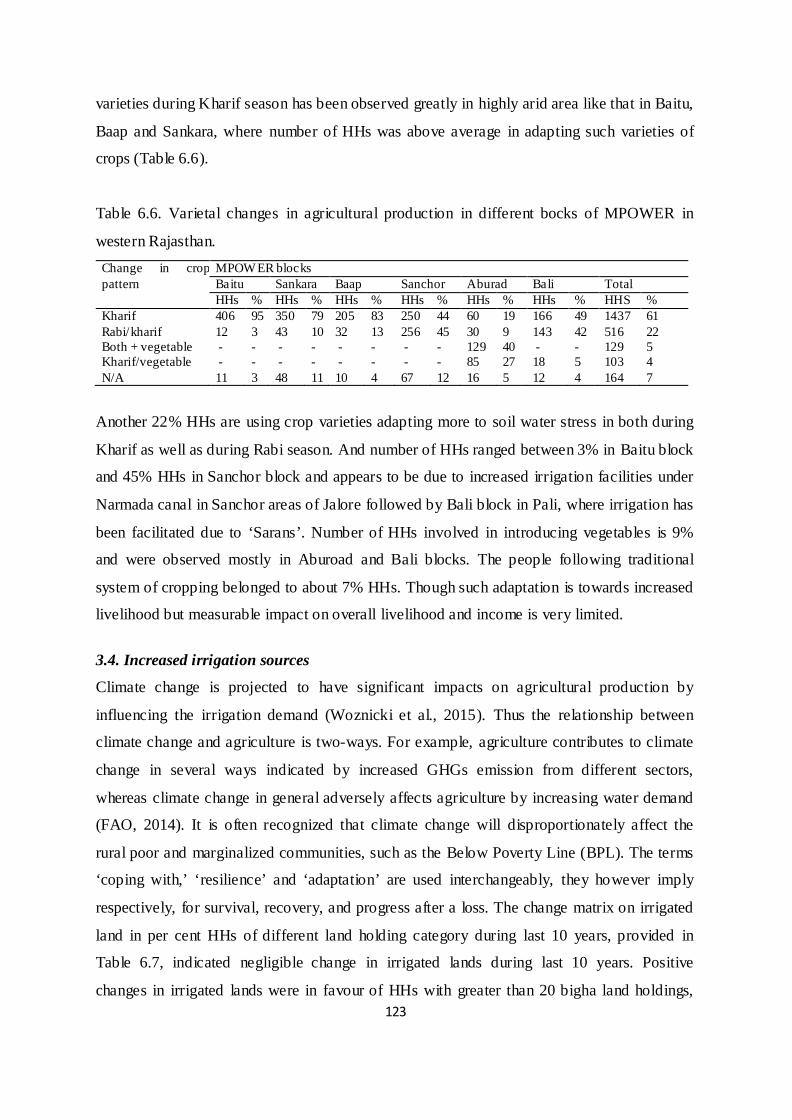
123
varieties during Kharif season has been observed greatly in highly arid area like that in Baitu,
Baap and Sankara, where number of HHs was above average in adapting such varieties of
crops (Table 6.6).
Table 6.6. Varietal changes in agricultural production in different bocks of MPOWER in
western Rajasthan. Change in crop pattern
MPOW ER blocks Baitu Sankara Baap Sanchor Aburad Bali Total HHs % HHs % HHs % HHs % HHs % HHs % HHS %
Kharif 406 95 350 79 205 83 250 44 60 19 166 49 1437 61 Rabi/kharif 12 3 43 10 32 13 256 45 30 9 143 42 516 22 Both + vegetable - - - - - - - - 129 40 - - 129 5 Kharif/vegetable - - - - - - - - 85 27 18 5 103 4 N/A 11 3 48 11 10 4 67 12 16 5 12 4 164 7
Another 22% HHs are using crop varieties adapting more to soil water stress in both during
Kharif as well as during Rabi season. And number of HHs ranged between 3% in Baitu block
and 45% HHs in Sanchor block and appears to be due to increased irrigation facilities under
Narmada canal in Sanchor areas of Jalore followed by Bali block in Pali, where irrigation has
been facilitated due to ‘Sarans’. Number of HHs involved in introducing vegetables is 9%
and were observed mostly in Aburoad and Bali blocks. The people following traditional
system of cropping belonged to about 7% HHs. Though such adaptation is towards increased
livelihood but measurable impact on overall livelihood and income is very limited. 3.4. Increased irrigation sources
Climate change is projected to have significant impacts on agricultural production by
influencing the irrigation demand (Woznicki et al., 2015). Thus the relationship between
climate change and agriculture is two-ways. For example, agriculture contributes to climate
change in several ways indicated by increased GHGs emission from different sectors,
whereas climate change in general adversely affects agriculture by increasing water demand
(FAO, 2014). It is often recognized that climate change will disproportionately affect the
rural poor and marginalized communities, such as the Below Poverty Line (BPL). The terms
‘coping with,’ ‘resilience’ and ‘adaptation’ are used interchangeably, they however imply
respectively, for survival, recovery, and progress after a loss. The change matrix on irrigated
land in per cent HHs of different land holding category during last 10 years, provided in
Table 6.7, indicated negligible change in irrigated lands during last 10 years. Positive
changes in irrigated lands were in favour of HHs with greater than 20 bigha land holdings,

124
whereas it a decrease in the HHs was observed in category of 10 to <20 bigha land holding. It
was only in relatively dry blocks like Baitu, Sankara and Baap blocks, where availability of
surface water for irrigation is very limited.
Table 6.7. Change in per cent households with different land holding categories during last
10 years in different blocks of MPOWER in western Rajasthan. Land holding MPOWER blocks
Baitu Sankara Baap Sanchor Aburoad Bali Total Landless -1 0 +2 +1 0 0 0 <1 bigha 0 0 - 0 0 0 0 1 to <5 bigha +1 0 0 0 0 0 0 5 to <10 bigha 0 0 -2 +1 0 0 0 10 to <20 bigha -1 -3 -3 -2 0 0 -2 >20 bigha +1 +3 +3 0 0 0 +2
We did not observe any change in irrigated land area in Aburoad and bali blocks probably
because of small land holding in these blocks. It indicates that peoples with greater land
holding probably have developed water sources for irrigation. Increased number of bore
wells/ tube well in most of the region, renovation and application of diversion channels or
'Sarans' in Aburoad and Bali and commencement of canal particularly in Sanchor area have
enhanced the irrigation facilities ensuring food security to some extent. While comparing
changes in irrigation during last 10 years, i.e. 2003-04 to 2013-14 there is substantial increase
in irrigated land as compared to the rain fed farming, which has decreased from 86% in
2003-04 to 66% in 2013 (Fig 6.1).
Fig 6.1. Change in irrigation pattern during last ten years in the studied blocks in
Rajasthan.
2020, 86%
1, 0%145, 6%
24, 1%121, 5% 15, 1% 23, 1% 10 years before
RainfedDBIRainfed/DBIOthers tubewellOwn wellcanalTubewellN/AWellSaranCommon wellSaran/well
1541, 66%
4, 0%33, 1%
20, 1%
197, 8%6, 0%
270, 12%
128, 5%22, 1%89, 4%23, 1% 16, 1% 2013-14
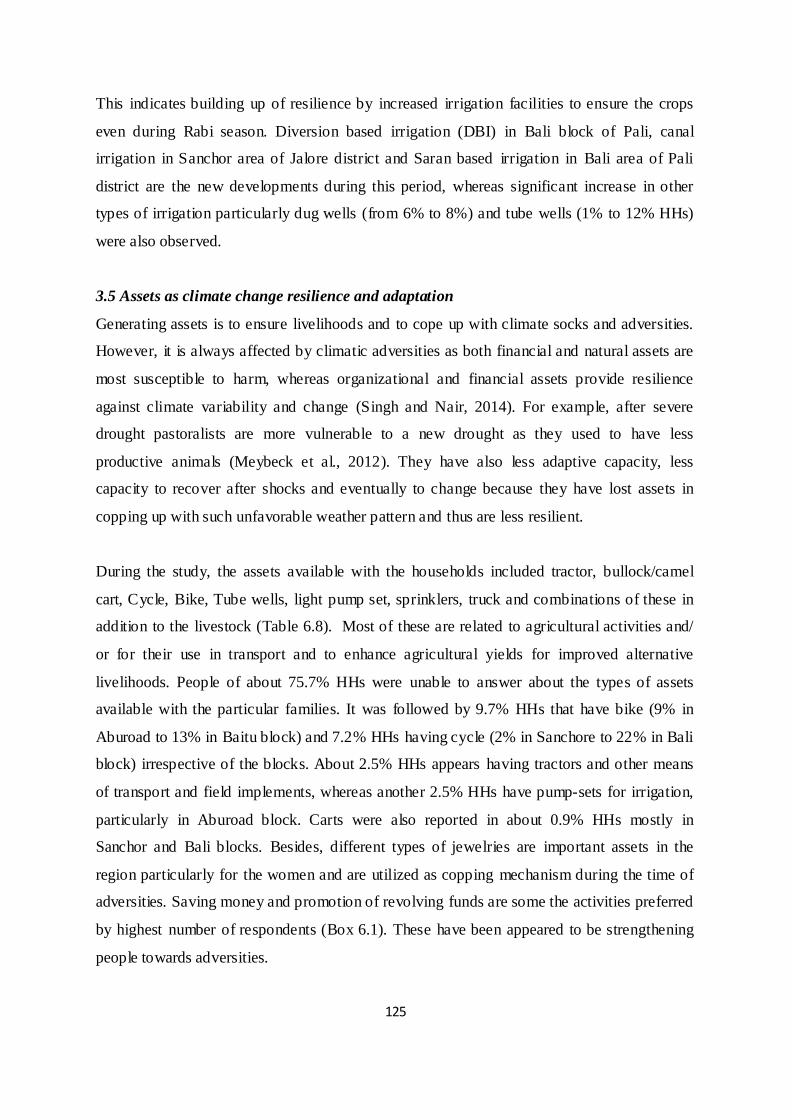
125
This indicates building up of resilience by increased irrigation facilities to ensure the crops
even during Rabi season. Diversion based irrigation (DBI) in Bali block of Pali, canal
irrigation in Sanchor area of Jalore district and Saran based irrigation in Bali area of Pali
district are the new developments during this period, whereas significant increase in other
types of irrigation particularly dug wells (from 6% to 8%) and tube wells (1% to 12% HHs)
were also observed.
3.5 Assets as climate change resilience and adaptation
Generating assets is to ensure livelihoods and to cope up with climate socks and adversities.
However, it is always affected by climatic adversities as both financial and natural assets are
most susceptible to harm, whereas organizational and financial assets provide resilience
against climate variability and change (Singh and Nair, 2014). For example, after severe
drought pastoralists are more vulnerable to a new drought as they used to have less
productive animals (Meybeck et al., 2012). They have also less adaptive capacity, less
capacity to recover after shocks and eventually to change because they have lost assets in
copping up with such unfavorable weather pattern and thus are less resilient.
During the study, the assets available with the households included tractor, bullock/camel
cart, Cycle, Bike, Tube wells, light pump set, sprinklers, truck and combinations of these in
addition to the livestock (Table 6.8). Most of these are related to agricultural activities and/
or for their use in transport and to enhance agricultural yields for improved alternative
livelihoods. People of about 75.7% HHs were unable to answer about the types of assets
available with the particular families. It was followed by 9.7% HHs that have bike (9% in
Aburoad to 13% in Baitu block) and 7.2% HHs having cycle (2% in Sanchore to 22% in Bali
block) irrespective of the blocks. About 2.5% HHs appears having tractors and other means
of transport and field implements, whereas another 2.5% HHs have pump-sets for irrigation,
particularly in Aburoad block. Carts were also reported in about 0.9% HHs mostly in
Sanchor and Bali blocks. Besides, different types of jewelries are important assets in the
region particularly for the women and are utilized as copping mechanism during the time of
adversities. Saving money and promotion of revolving funds are some the activities preferred
by highest number of respondents (Box 6.1). These have been appeared to be strengthening
people towards adversities.
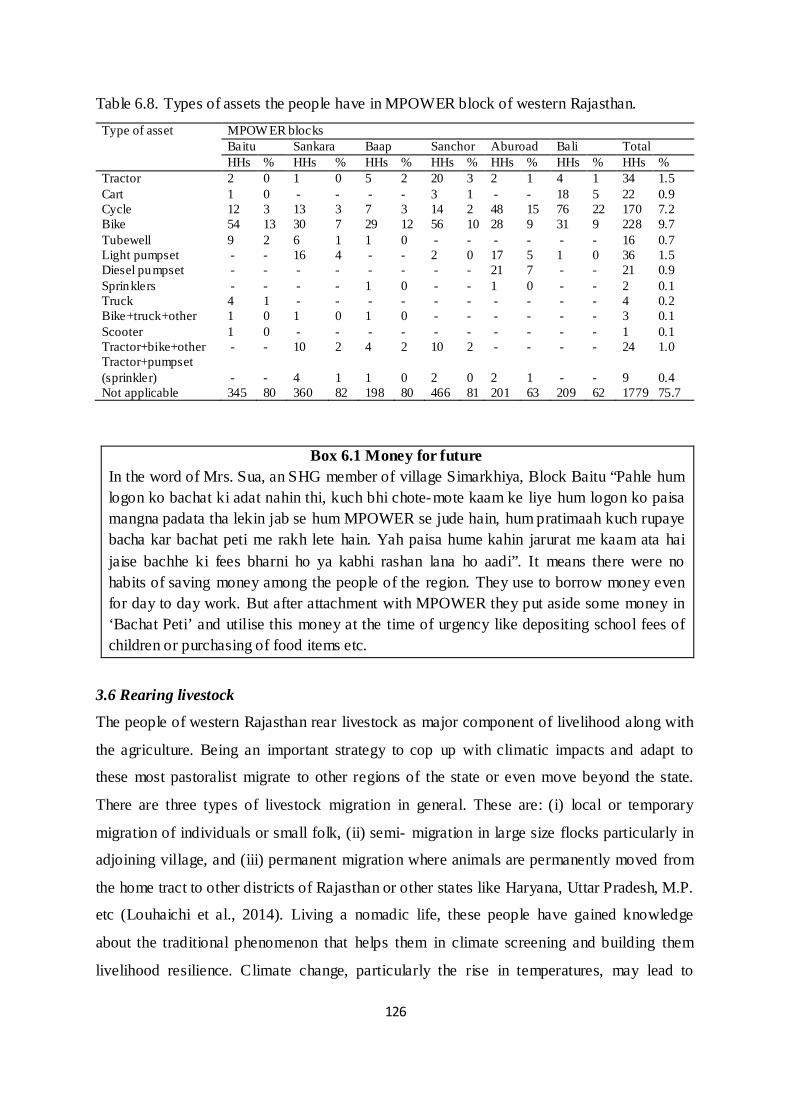
126
Table 6.8. Types of assets the people have in MPOWER block of western Rajasthan. Type of asset MPOW ER blocks
Baitu Sankara Baap Sanchor Aburoad Bali Total HHs % HHs % HHs % HHs % HHs % HHs % HHs %
Tractor 2 0 1 0 5 2 20 3 2 1 4 1 34 1.5 Cart 1 0 - - - - 3 1 - - 18 5 22 0.9 Cycle 12 3 13 3 7 3 14 2 48 15 76 22 170 7.2 Bike 54 13 30 7 29 12 56 10 28 9 31 9 228 9.7 Tubewell 9 2 6 1 1 0 - - - - - - 16 0.7 Light pumpset - - 16 4 - - 2 0 17 5 1 0 36 1.5 Diesel pumpset - - - - - - - - 21 7 - - 21 0.9 Sprinklers - - - - 1 0 - - 1 0 - - 2 0.1 Truck 4 1 - - - - - - - - - - 4 0.2 Bike+truck+other 1 0 1 0 1 0 - - - - - - 3 0.1 Scooter 1 0 - - - - - - - - - - 1 0.1 Tractor+bike+other - - 10 2 4 2 10 2 - - - - 24 1.0 Tractor+pumpset (sprinkler) - - 4 1 1 0 2 0 2 1 - - 9 0.4 Not applicable 345 80 360 82 198 80 466 81 201 63 209 62 1779 75.7
Box 6.1 Money for future In the word of Mrs. Sua, an SHG member of village Simarkhiya, Block Baitu “Pahle hum logon ko bachat ki adat nahin thi, kuch bhi chote-mote kaam ke liye hum logon ko paisa mangna padata tha lekin jab se hum MPOWER se jude hain, hum pratimaah kuch rupaye bacha kar bachat peti me rakh lete hain. Yah paisa hume kahin jarurat me kaam ata hai jaise bachhe ki fees bharni ho ya kabhi rashan lana ho aadi”. It means there were no habits of saving money among the people of the region. They use to borrow money even for day to day work. But after attachment with MPOWER they put aside some money in ‘Bachat Peti’ and utilise this money at the time of urgency like depositing school fees of children or purchasing of food items etc.
3.6 Rearing livestock
The people of western Rajasthan rear livestock as major component of livelihood along with
the agriculture. Being an important strategy to cop up with climatic impacts and adapt to
these most pastoralist migrate to other regions of the state or even move beyond the state.
There are three types of livestock migration in general. These are: (i) local or temporary
migration of individuals or small folk, (ii) semi- migration in large size flocks particularly in
adjoining village, and (iii) permanent migration where animals are permanently moved from
the home tract to other districts of Rajasthan or other states like Haryana, Uttar Pradesh, M.P.
etc (Louhaichi et al., 2014). Living a nomadic life, these people have gained knowledge
about the traditional phenomenon that helps them in climate screening and building them
livelihood resilience. Climate change, particularly the rise in temperatures, may lead to

127
physiological stresses on livestock that would reduce their productivity of milk, wool, meat,
and draught ability, and affect reproduction. Heat stress will also result in greater water and
food needs of livestock, and increases in disease incidence. While breeding and livestock
improvement programmes may begin to address some of the probable problems, it is clear
that there must be a resilience strategy for livestock as well that relies on maintaining animal
health and immunity by ensuring water, amount and quality of fodder, and maintaining
breeds that are appropriate for local conditions. Over the longer-term, indigenous breeds
appears to be more valuable for continued breeding and artificial selection.
About 97% of the interacted HHs is rearing animals, the population of which varied widely
(Table 6.9). Rest 4% HHs had no any livestock. The highest number of HHs are having 2-4
animals, i.e. 55% HHs ranging from 48% HHs in Aburoad to 58% in Baap block. It was
followed by 19% HHs (ranging between 6% HHs in Sanchore and 39% in Bali block) with 5-
10 animals per HHs. About 4% HHs had 10-<20 animals per HHs and it ranged from 1% in
Sanchore to 8% HHs in Baitu and Sankara blocks. Greater than 20 animals per HHs were
recorded in 1% HHs and were mostly in Baitu, Sankara, Sanchore and Aburoad block.
Among the types of animals goat and sheeps are dominating in Baitu, Sankara, Baap and
Aburoad regions, whereas buffalo is dominating in Sanchor area.
Table 6.9. Range of animals reared by the people in MPOWER blocks of western Rajasthan.
Category of animal population
MPOW ER blocks Baitu Sankara Baap Sanchor Aburoad Bali Total HHs % HHs % HHs % HHs % HHs % HHs % HHs %
No animals 15 3 11 2 1 0 16 3 37 12 - - 80 3 1 animal 35 8 59 13 28 11 180 31 79 25 11 3 392 17 2 - <5 an imal 235 55 243 55 144 58 331 58 152 48 191 56 1296 55 5 - <10 animal 103 24 79 18 66 27 33 6 37 12 132 39 450 19 10 - <20 animal 34 8 37 8 8 3 8 1 13 4 5 1 105 4 >20 animal 7 2 12 3 - - 5 1 2 1 - - 26 1
Promotion of construction of goat and cow shed is the activity adopted to intensify livestock,
especially small stock production through breed improvement, better health care and animal
husbandry. Work in direction of increased fodder supply through fodder banking or restoring
degraded pasture land or other community lands by integration of fodder trees and grasses
and promotion of growing fodder grasses on farmlands needs to be strengthened. However,
there is need to control stocking rate and promoting cut and carry system rather than open
and uncontrolled grazing.

128
3.7 Dependency on forests and grazing lands
Livestock provides communities with a resilience strategy. While different communities are
maintaining both herding and agriculture to different extents traditionally and thus
maintaining some degree of distinct resource needs. Decreased migratory herding and
increased sedentary approach are resulting in increased pressures on common property
resources like panchayat land, revenue wastelands or forest lands. The landless or marginal
landowners rely largely on common property resources for grazing their animals and
collecting fodder and fuel wood. Besides, these common resources help enhancing people
income. Crop failures also result in farm-based fodder shortages, thus adding another
component of pressures on the commons.
Based on interaction with the villagers there is marginal change in the number of HHs on fuel
wood collections (Table 6.10). Though lesser number of HHs, but people of this region also
use to collect fuel wood from the Oran, the sacred groves. The changes are decrease in fuel
wood collection from forest land (3% HHs to 1% at present), guachar (4% HHs 10 year
before to 3% HHs at present) and other common lands (excluding forests) including
agriculture land (from 19% HHs to 16% HHs), and increase in dependency on agriculture
land and forests and other common lands. However, it varied in different blocks depending
upon availability of this resource. Shifting from one resource to other particularly towards
agriculture lands might also be due to deterioration of common property resources.
Table 6.10. Percent of households utilizing different sources for fuel wood collection in
different blocks of MPOWER in western Rajasthan. Site of fuel-wood collection
MPOW ER block Baitu Sankara Baap Sanchor Aburoad Bali Total B P B P B P B P B P B P B P
Forest - - 3 2 - - 2 2 15 2 - - 3 1 Gauchar 5 3 7 7 3 4 3 3 6 6 - - 4 3 Oran 2 2 6 6 - - - - - - - - 1 1 Agriculture land 48 61 53 53 75 77 13 14 1 1 - - 30 33 Forest/agriculture land - 0 1 1 - - 9 8 4 4 5 5 4 4 Forest and others - 0 1 1 - - 60 60 70 84 95 95 38 40 Agriculture and others 44 31 29 30 22 19 10 9 4 3 - - 19 16 Purchase 1 - - 0 - - 3 4 - - - - 1 1 N/A 3 - - - - - 1
Maximum number of HHs (i.e., 45% HHs) depends upon forests and other common property
lands for grazing and collecting fodder, whereas about 40% HHs solely depends upon
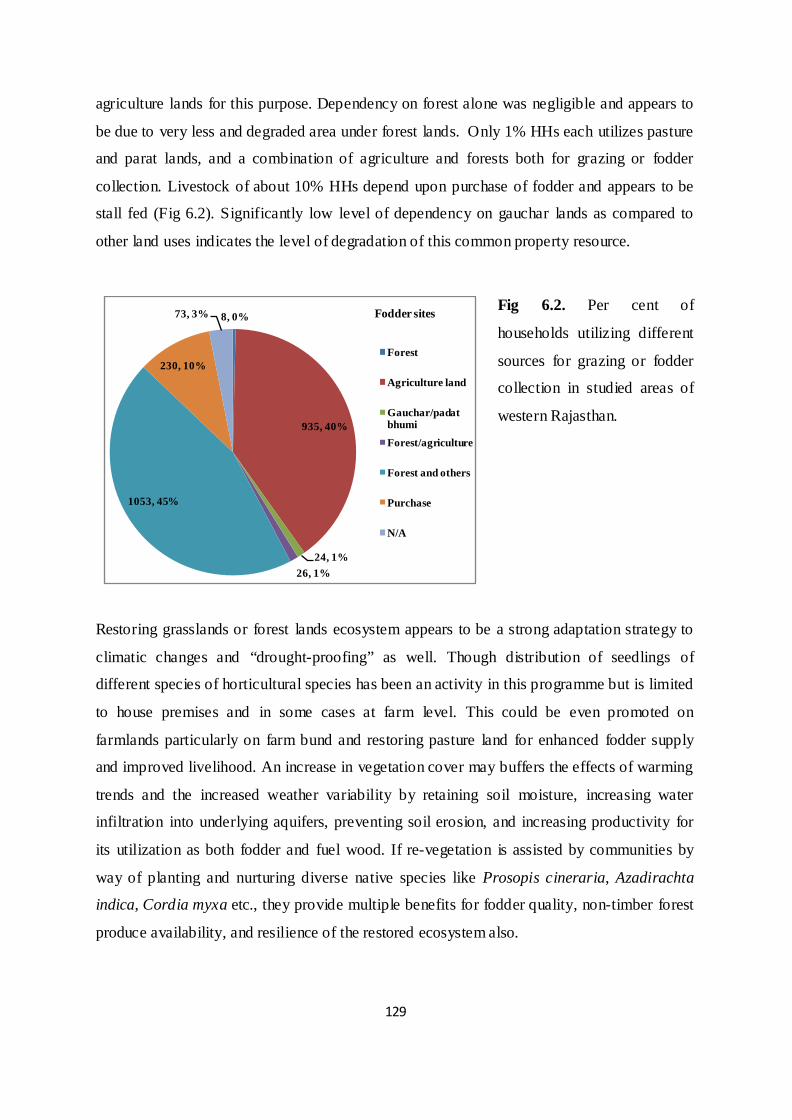
129
agriculture lands for this purpose. Dependency on forest alone was negligible and appears to
be due to very less and degraded area under forest lands. Only 1% HHs each utilizes pasture
and parat lands, and a combination of agriculture and forests both for grazing or fodder
collection. Livestock of about 10% HHs depend upon purchase of fodder and appears to be
stall fed (Fig 6.2). Significantly low level of dependency on gauchar lands as compared to
other land uses indicates the level of degradation of this common property resource.
Fig 6.2. Per cent of
households utilizing different
sources for grazing or fodder
collection in studied areas of
western Rajasthan.
Restoring grasslands or forest lands ecosystem appears to be a strong adaptation strategy to
climatic changes and “drought-proofing” as well. Though distribution of seedlings of
different species of horticultural species has been an activity in this programme but is limited
to house premises and in some cases at farm level. This could be even promoted on
farmlands particularly on farm bund and restoring pasture land for enhanced fodder supply
and improved livelihood. An increase in vegetation cover may buffers the effects of warming
trends and the increased weather variability by retaining soil moisture, increasing water
infiltration into underlying aquifers, preventing soil erosion, and increasing productivity for
its utilization as both fodder and fuel wood. If re-vegetation is assisted by communities by
way of planting and nurturing diverse native species like Prosopis cineraria, Azadirachta
indica, Cordia myxa etc., they provide multiple benefits for fodder quality, non-timber forest
produce availability, and resilience of the restored ecosystem also.
8, 0%
935, 40%
24, 1%26, 1%
1053, 45%
230, 10%
73, 3% Fodder sites
Forest
Agriculture land
Gauchar/padat bhumiForest/agriculture
Forest and others
Purchase
N/A

130
2.8 Alternative livelihoods
Distribution of 'Bilona' machine in some of the blocks appears useful in extracting butter
from the milk for making ‘ghee’. According to Mrs Sharda, an SHG woman of Bajrang bali
SHG, village Jambeshwar nagri of Baap block “Bilona machine dene se hamari mehnat kam
hui hai, ab hum kam samay mein ghee bana lete hain. Lekin ek samasya yah bhi hai ki ye
light se chalti hai, aur kabhi hamare gaanv me light hoti hai to kabhi nahi hoti hai”.
Expansion of employment opportunities through skills training, i.e. ‘sewing machine’
targeting youth from the poorest households has been observed beneficial for the villagers.
After this training, most of the SHG women have purchased sewing machine by adding some
extra money (Box 6.2) which helps improving their livelihood.
Box 6.2
Before 2010, Kamla devi and her family were struggling with their life. They had 20
beega land mostly culturable wastelands situated in Baitu block of Barmer in Western
Rajasthan. The major issue of this family was food security and livelihood. After getting
training on sewing machine she started sewing all type of dresses some of them are
salwar suit, ghaghra- choli etc., and is now earning Rs 200 daily. It has made her family
little bit relieved by providing livelihood and the family has started to save money under
monthly saving scheme.
BCT (the FNGO), Baitu Block
Promotion of vegetable farming like tomatoes during the monsoon season, and by controlling
insects and fungal diseases with agro-chemicals, farmers are able to earn handsome prices
(Fig 6.3). A total of 350 SHG member households cultivated tomatoes on their small land
holding of about 0.02 ha (200 m2). Sales of tomatoes yielded income ranging from Rs 4,000
to 80,000, averaging around Rs 10,000. Seeds of other vegetables like lauki, turai, baigan,
mirchi etc were also distributed as demonstration among the farmers. Earlier these farmers
were used to sow agricultural crops during ‘rabi’ or ‘khareef’ season or used to go RIICO
area in Aburoad to sale fuelwood. Now they have started selling vegetables daily in Aburoad
and are earning about Rs 10000 to 15,000 and are saving some of it as well.
131
Fig 6.3. Growing vegetables on farmlands in Baitu block (left) and in Aburoad block
(right).
2.8. People migration
Movement due to weather related change is not a new concept in Rajasthan as climatic
adversities has made the pastoral tribes like Rebari, Ghosi, Ahir etc migrated to a long
distance in search of food and fodder as well as grazing lands for the livestock. Likewise,
non- pastoral nomads such as artisans, acrobats, jugglers, snake charmers etc and tribes like
Nats, Kalbeliyas etc. used to put their skills on hold and migrates to different cities and
locations in search of livelihoods. Thus migration has been a traditional resilience strategy.
As agricultural economies become less viable, migration from resource-poor areas has
become commonplace as people follow opportunities to earn a supplemental income with
daily wage labour. Studies of multiple drought and flood events in South Asia (Moench and
Dixit, 2004) showed that maintaining non-farm income sources through seasonal or
permanent migration was the single most important measure of a family’s ability to cope and
rebuild their farm-based livelihoods after an extreme event. This indicates that diversification
into non-agricultural livelihoods is not only a critical short-term coping strategy, it is also
critical for the resilience of agricultural livelihood systems. However, the MNREGA
programme has provided work opportunities accommodating almost 81% population in the
studies areas (Fig 6.4). Another 4% HHs have been reported engaged in MPOWER work
leaving only 15% population for the rests of the activities. According to our survey and
interactions with the villagers only 3% population was observed to be migrating to cities like
Jodhpur, Ahmadabad, Surat, Mumbai etc in search of job and livelihood. Available work and
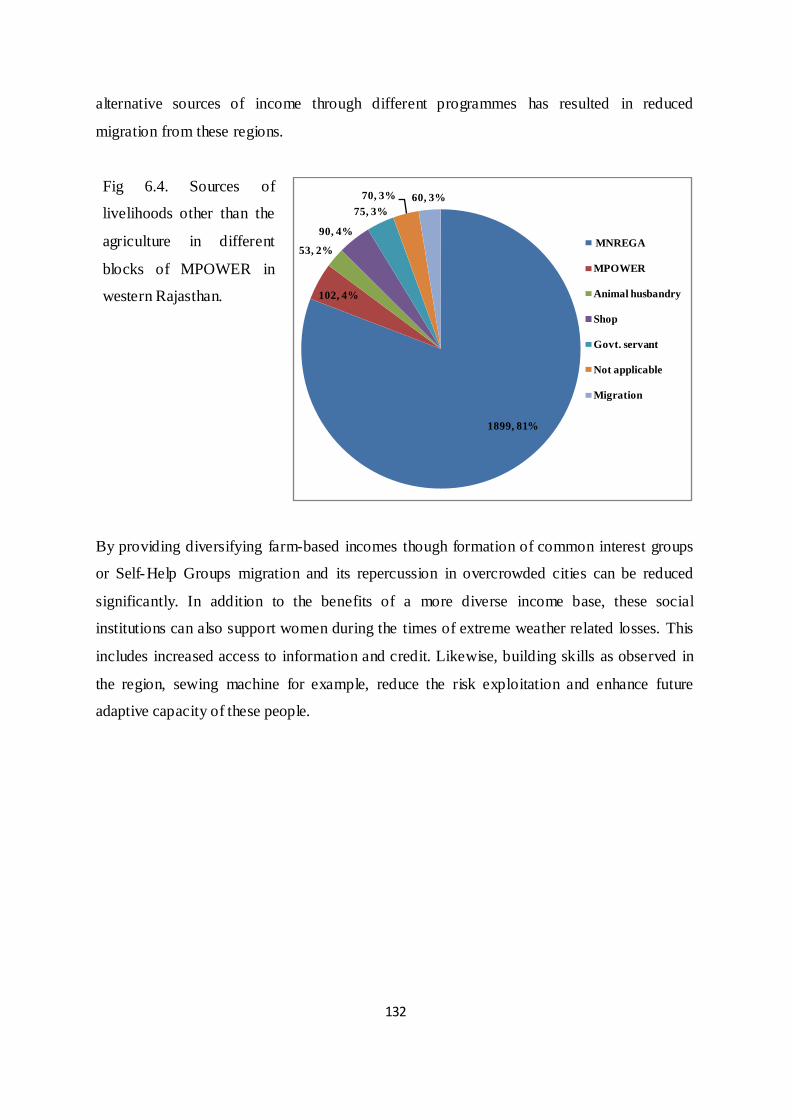
132
alternative sources of income through different programmes has resulted in reduced
migration from these regions.
Fig 6.4. Sources of
livelihoods other than the
agriculture in different
blocks of MPOWER in
western Rajasthan.
By providing diversifying farm-based incomes though formation of common interest groups
or Self-Help Groups migration and its repercussion in overcrowded cities can be reduced
significantly. In addition to the benefits of a more diverse income base, these social
institutions can also support women during the times of extreme weather related losses. This
includes increased access to information and credit. Likewise, building skills as observed in
the region, sewing machine for example, reduce the risk exploitation and enhance future
adaptive capacity of these people.
1899, 81%
102, 4%
53, 2%
90, 4%
75, 3%70, 3% 60, 3%
MNREGA
MPOWER
Animal husbandry
Shop
Govt. servant
Not applicable
Migration
133
Chapter 7
CONCLUSION AND RECOMMENDATIONS ___________________________________________________________________________
1. SOCIOECONOMY AND LIVELIHOOD
Among the six blocks, Baitu, Baap, Sankara and Sanchor are dominated by other backward
caste (OBC). Aburoad and Bali blocks are dominated by schedule tribes (ST), where Bheel
and the Garasiya are two most dominant tribes. Based on the economic status, families under
below poverty line (BPL) are about 56% which ranged from 48% in Sankara to 80% in Bali
block. Houses in most of the villages are Kachha or mixed types except Sankara, where
houses are constructed using sand stones. Likewise, highest numbers of respondents have
land holding 0-5 bigha particularly in Bali, Aburoad and Sanchor blocks. Relatively higher
land holdings are in Baap and Sankara blocks. Access to electricity is relatively poor in Baap,
Aburoad and Bali blocks. Purdah and Ghoonghat system in women still prevails in the region
indicating social conservatism and the decisions taken at the household level are largely male
dominated. However, participants were hesitant to discuss and even skeptical about
government plans and existing government services in the villages.
There is scarcity of water in the region where about 94.3% HHs faces water shortage during
May to July, whereas rests faces year round problem of water scarcity. Main sources of
drinking water are stored water in individual Tanka, government tanks, dug wells (despite of
unfit for consumption) and open ponds. During water scarcity, people of Baitu, Sankara,
Baap and Sanchor block depend mostly on private water supply, whereas the people of
Aburoad and Bali depend on deep dug wells and public hand pumps. During scarcity
drinking water is even transported from nearby water supply and nearby village. In Aburoad
and Bali blocks drinking water is transported even by travelling 0.5 to 5 km.
Agriculture and animal husbandry are the main source of livelihood of >90% respondents in
the region. About 65.6% households depend on rain fed agriculture being highest (96% HHs)
in Baitu and lowest (35% HHs) in Aburoad. However, agriculture in Baitu, Sankara and
Baap is mostly rain fed. Most common sources of irrigation are wells (tube well and dug
well) adopted by 20.9% respondents. However, Saran (irrigation channels) appears important
source of irrigation in Bali and Aburoad blocks. Because of small and marginal land holding,
farmers in Aburoad and Bali mostly use Ox based ploughing, whereas farmers of Baitu,

134
Sankara, Baap and Sanchor are mostly employing tractor ploughing. Rest uses camels or a
combination of these. This indicates mechanization of agriculture, but there is a need for
increasing water availability by increasing investment in rural irrigation infrastructure to
increase agricultural productivity and people livelihood.
Family size and number of livestock per HHs have been observed low in Sanchor that
increased to highest (11.5 persons and 11.0 animals per HHs) in Sankara block against the
region average of 5.6 and 4.3, respectively. This indicates almost similar population of
persons and domestic animals per HHs in the region. Majority of HHs have 2-4 animals,
whereas percentage of HHs with >10 animals limited to 5% dominated by cow and goat that
contributed 22.1% and 63.5%, respectively to the total animal population. Goat and sheep
dominated in Baitu, Sankara, Baap and Aburoad regions. Preferences towards livestock
rearing particularly small ruminants is due to ensured earnings, and in principal small
ruminants are well attuned to the natural resource base in the region. However, increased
population of buffalo in Sanchor, Aburoad and Bali areas was due to increased water
availability and was in view to increase income and livelihoods by adopting milking animals.
Introduction of high yield and hybrid seeds of crops, which are more resilient to drought and
heat stress and increased irrigation facilities helps in enhancing the productivity, farming of
vegetables like tomato, brinjal, creepers increase nutrition value and HHs income as well.
There is need to scale up high value crops like cumin, castor and other condiment crops with
better package of practices and good marketing support. However, milk productivity is
relatively low and has insignificant contribution in income. For example, above 95%
respondents do not consider milk as source of income, whereas income through milk selling
ranging between Rs 1000/ and >10000/ per month is limited to 3.3% HHs. However, it is fact
that milk enterprise has potential in generating income on regular basis against the crop
enterprise which is more prone to climatic adversities. Introduction of good breeds and
provision of value added services may improve animal based income.
The earning of almost 80% HHs was less than Rs 500/ from different sources, where as Rs
>20000/ per month was earned only by 3% HHs. Unskilled daily labour is the main source of
income in these villages as more than 85% respondents are engaged in MNREGA (81%
ranging 77% in Sanchor to 88% in Bali block) and MPOWER programme (4% respondents).
In spite of the fact that a large percentage of people practice agriculture, the relative cash

135
flow from this activity is low. Livestock accounts for a substantially larger share of the total
asset value as well as gross farm income in the villages. Other sources of income are limited
to about 10% that includes animal husbandry, business, government service, private job and
alternative livelihoods, which needs to be strengthened.
Most of the work related to food and fodder are carried out by women, who spent almost 14-
16 hours of a day. The scarcity of resources like water, fuel wood, fodder and food cooking
are putting up all the more burden on the rural women. Fuel-wood, cow-dung and crop
residue are the dominant sources of energy for cooking and are mostly collected by the
women. Sole use of LPG and kerosene is limited to <1% HHs. Easy access to fuel wood
leads to use of it despite of availability of alternative sources like LPG or kerosene. Further,
more than 75% HHs uses traditional Chulha as the main device for cooking food, though
increasing trend in there towards use of LPG and kerosene stoves. Fuel wood collection is
done from agriculture land by 33% HHs and by 56% HHs collects from forests and other
common lands including Gauchar and Oran. People of Baitu, Sankara and Baap block were
observed to be most dependent on agriculture land for both fuel wood and fodder. A
combination of all available land uses are used by about 44.8% HHs for grazing and fodder
collection though they depend mainly on forests. However, purchased fodder for their
livestock by about 9.8% respondent indicates the trend of stall feeding.
2. PEOPLE PERCEPTIONS
Participants did not seem to have any idea about the functioning of Self Help Groups in many
of the villages as said by 52% respondents, whereas 31% respondents were not aware about
the MPOWER works. A significant number of respondents were hesitant on saying any thing
about the programme activity. Out of 49%, about 23% respondents rated the activities of
MPOWER ‘good’, 8% respondents rated ‘very good’ and other rated them average or not up
to mark.
While considering enhancing agriculture and non agriculture based livelihood activities in
the villages, most of the respondents had difficulty in thinking beyond traditional farming
system. It is indicated by lack of capacity in about 48% respondent in ranking different
practices adopted in the region. Respondent’s preference to best practice varied among the
blocks or region. Promotion of monthly saving, revolving fund, distribution of climate

136
resilient seeds of crop and vegetable, sewing machine training are the best practices. Other
region specific best practices are construction of Tanka in Sankara, cow/goat shed in
Sanchor, Aburoad and Bali block, and polyhouse and vermi-pits, Saran distributaries and
solar lights in Bali block. Development of bank linkages observed least preferred activity
(Table 7.1). This indicates that people of the region have major concerns for promoting
livelihood and income related actions. Besides, highest number of respondent were in need of
promoting cottage industry for increased employment followed by requirement of increased
water availability - the main problems in the region. People are expecting toilets, medical
and education facilities. May be due to lack of income sources not less than 10%
respondents were in view of free distribution of fodder, sheep/goat and fruit plants for
increased income and resilient to better adaptation.
Table 7.1. Ranking of different activities implemented in different MPOWER blocks of
western Rajasthan.
SNo
Activities MPOWER blocks rank Region rank Baitu Sankar
a Baap Sanch
or Aburoad
Bali
1 Monthly saving 1 1 1 1 1 1 1 2 Revolving fund 2 2 2 2 2 3 2 3 Crop seed distribution 3 3 3 3 5 8 3 4 Vegetable seeds
distribution - - 4 5 - 2 4
5 Sewing machine training
4 4 - 4 3 6 5
6 Poly-house/vermin-pit - 5 0 0 - 5 6 7 Tanka for drinking - 3 - - - - 7 8 Cow and goat shed 6 - - 1 6 7 8 9 Saran - - - - - 4 9 10 Seed capital 5 0 - 0 4 9 10 11 Solar light - - - - - 10 11 12 Bank linkage 7 - - - - - 12 Some respondents have given preference to capacity building particularly for efficient
farming activities, cash money for their livelihoods and light connections to their houses, and
skill based training to the villagers particularly the youth for generating employment
opportunities in the rural areas. By developing effective local institutions, capacity building
through training of farmers and providing off- farm employment opportunities could
safeguard the livelihoods of people in these areas (Badal et al., 2006).

137
3. CLIMATE CHANGE MITIGATION
Variations in temperature and precipitation patterns have impacts on various aspects of local
life. Despite of increased communications about 34% respondents are less aware about the
global warming and climate change (CC). However, people perceptions of climate variability
indicate that temperatures have increased and there has been a fluctuation in the rainfall
pattern. People are in view that climate change in caused by increased atmospheric
temperature and deforestation, and is influencing rainfall pattern, drought and flood.
Perception of local temperature change has also been observed as the strongest predictor in
many African and Asian countries. Improving basic education, climate literacy, and public
understanding of the local dimensions of climate change are vital to public engagement and
their support for developing climate related programme (Lee et al., 2015). Important
strategies to mitigate climate change in the MPOWER programme are reducing atmospheric
carbon dioxide by increasing soil carbon storage through plantation of distributed seedlings
of horticultural species and addition of organic manure to farmlands etc. Mitigation is also
done through reducing emission by shifting towards use of kerosene stoves, LPG, solar light,
improved Chulha etc and reduction in use of cowdung, fuelwood and crop residue burning in
the region.
Variations in SOC stock in 0-30 cm soil layer from 2.66 tons ha-1 Baitu to 16.33 tons ha-1 in
Aburoad SOC (Baitu<Sankara<Baap<Sanchor<Bali<Aburoad) indicated the impact of water
availability through rainfall, vegetation status, soil conditions and anthropogenic pressures in
the form of crop intensification and rearing of large herd of livestock. Liu et al (2011)
observed significant regional impact of rainfall, temperature, elevation, clay and silt contents
and land use on soil carbon density. However, a negative impact of human activities was also
observed on SOC accumulation (Liu et al., 2011). Lowest SOC stock in Baitu appears to be
due to sandy nature of the soils as indicated by a study in Ajmer district of Rajasthan where
soils with clay texture observed higher in organic carbon than soils having textures of loamy
sand and sand (Giri et al., 2007). Among the land uses, the order was Roadside (6.17 tons ha-
1) <Oran<gauchar<agriculture land<Forest<Fallow land (10.08 tons ha-1). While increased
soil loss through erosion and increased content of gravel and stone leading to low estimate of
SOC stock in forests than fallow land, increased pressure of livestock on Orans and Guachar,
organic manuring of farmland and climatic influences had influenced SOC stock. Thus land
use, rainfall, soil types and anthropogenic activities influenced spatial variations in SOC
138
stock (Venkanna et al., 2014). While increased herding particularly of small ruminants had
negative impact on Orans and Gauchar (pastureland) throughout the region, the addition of
organic manure enhanced SOC stock significantly in agriculture and fallow lands particularly
in Aburoad/Bali block. This indicates that most of the common resources are overexploited
in term of carbon stock and needs to be restored not only for enhancing SOC but also for
increasing diversity and productivity for increased fodder and fuel wood supply.
The wood has a modest advantage over fossil fuels in CO2 emission but biogas and kerosene
has advantage generating more energy per unit mass (Smith et al., 2000). Further, LPG and
kerosene burns with lesser emissions. Thus shifting from dung and crop residue to LPG and
kerosene and promoting use of kerosene stoves, improved Chulha, LPG and solar light will
further reduce CO2 emission. If these practices are applied at larger scale and biogas is
added, it will help mitigate climate change substantially.
4. CLIMATE CHANGE ADAPTATION
Natural resource degradation and increasing poverty are severe problems in the region that
may intensify in future if present scenario of climate change continues. Inadequate resources
to cope with the climatic disaster will further enhance the vulnerability. More than 60% HHs
follow traditional ways of cultivation and livelihood. The increase in the availability of
irrigation water through tube-well, dug wells, Saran and canal water supply and promotion of
quality seeds of crop more resilient to drought and heat stress had motivated some of the HHs
for adaptive agriculture. Decreased water table affecting agricultural production, need to
increase HHs income, inspiration of MPOWER programme and visual observation on the
ensured benefits and livelihood activities of different SHGs working in the regions had
motivated people for alternative livelihood.
From food security point of view integrated natural resource management is essential to
enhance the yield and emphasize the best use of the land and water resources and promotions
of agroforestry systems. Considering the highest risk on farm production adaptation options
like crop improvement, risk financing, draught proofing, disaster management, etc. needs to
be strengthened (Shah, 2011). Increased water supply for drinking and irrigation and
construction of goat and cow shed to intensify livestock production system particularly small
stock through improved breed and health care are important activities promoting resilience to

139
CC adaptation. Training and distributing 'Bilona' and ‘Sewing Machine’ are skills
development that promoted self employment opportunities and resulted in purchase of
sewing machine by most of the SHG women adding extra income and improving livelihood.
Promotion of vegetable farming and its selling also help generating income for better
resilience and adaptation. Similarly, a decrease in fuel wood collection from forest land,
guachar and other common lands and increasing dependency on agriculture appears in favour
of these common lands. However, deterioration of these common resources might also be
responsible for such shifting. Only 3% population was observed to be migrating as adaptation
to different cities like Jodhpur, Ahmadabad, Surat, Mumbai etc in search of employment and
livelihood. Increased availability of employment opportunity and alternative sources of
income through different programmes has alleviated the problem of livelihood to some extent
and has reduced migration from these regions. However, planning for climate change
adaptation needs to build the capacity of diverse local institutions in effective ways and
improve the relationships between local and national- level adaptation planning (Brown and
Sonwa, 2015).
4. RECOMMENDATIONS
People of this region have traditionally developed adaption strategies and coping mechanism
against climatic hostility that includes drought or water paucity. These include different soil
and water conservation measures and ensuring drinking water supply through rainwater
harvesting. The respondents of Baap, Sankara and Baitu suggest for rain water conservation
and harvesting, which could be augmented by renovation and upgrading of small water
harvesting structures to enhance water storage capacity and groundwater recharge. Likewise,
up-gradation of traditional diversion channels or Saran for improved water distribution
efficiency could ensure irrigation for rain fed crops in relatively high rainfall area like Pali
and Sirohi and will help improving crop yield and people livelihood. Almost all villagers use
common resources like Orans and pastureland for their livestock but lack of community
initiatives in this regard put emphasis to restore and manage these community resources. If
re-vegetation is assisted by communities by way of planting and nurturing diverse native
species like Prosopis cineraria, Azadirachta indica, Cordia myxa, Ziziphus mauritiana,
Punica granatum, Carica papaya etc., then it will provide multiple benefits and will make
people more resilience to adapt climate change. Other important ways for better climate
change mitigation and adaptation includes:

140
Reviving traditional practices and improving knowledge on rainwater harvesting,
managing community forests and diversify crop and livelihood for better coping with
climatic variability.
Empowering communities with information, technological skills, education and
employment to address climate change vulnerability. However, care should be taken
that poor and vulnerable people should not be marginalized against economically,
socially or politically powerful people (Artur and Hilhorst, 2012).
Credit instruments and crop insurance should be made farmer friendly by
strengthening Self help groups and village development committees.
Introduction of efficient irrigation technology, i.e. sprinklers and drip- irrigation for
agricultural and trees or horticultural crops.
Adoption of innovative conservation farming techniques and smart agriculture
utilizing seasonal climate forecasts will be more beneficial.
Promotion of traditional crop varieties ant trees and shrub species to understand their
adaptation potential and utilization against climate change scenario.
Improvement of goat breeds with major emphasis on indigenous domesticated animal
with high adaptive abilities and encouragement of productivity based under controlled
herd size. Promotion of milch animal based livestock in Sanchore, Bali and Aburoad
areas will be an important option for the landless.
Supporting alternative livelihood resources like pottery, tailoring, mason-work, and
Idol making to increase HHs income. This also includes practices of saving and
revolving funds by local people for increased resilience to effective adaptation and
drought-proofing measures.
Encouraging and promoting use of biogas, improved chullahs, LPG and solar cooker
for food cooking and solar light will reduce CO2 emission. Use of dung and crop
residue should be discouraged.
Climate change is also going to lead more intense and possibly more frequent hydro-
meteorological hazards that will put emphasis on how to make disaster risk reduction
more climate-sensitive.
Promoting organic-farming through incentives for enhanced soil carbon storage and
agricultural production.

141
Encouraging each person to be aware about their carbon footprint generated and
lowering such carbon foot prints by reducing emission or sequestering atmospheric
carbon by involving in restoration and plantation activities.

142

143
BIBLIOGRAPHY ________________________________________________________________________
Ackerman, F., DeCanio, S.J., Howarth, R.B. and Sheeran, K. (2009). Limitations of
integrated assessment models of climate change. Climate Change, 93(3): 295-315.
Adesina, F.A., Siyambola, W.O., Oketola, F.O., Pelemo, D.A., Ojo, L.O. and Adegbuge,
A.O. (1999). Potentials of Agro-forestry for Climate Change Mitigation in Nigeria
some Preliminary Estimates. Global Ecology Biogeography, 8:163-173.
Alcamo, Flörke, J.M. and Märker, M. (2007). Future long-term changes in global water
resources driven by socio-economic and climatic changes. Hydrological Sciences
Journal, 52:247-275.
Araujo, I.C.L., Dziedzic, M., Maranho, L.T. (2014). Management of the environmental
restoration of degraded areas. Braz. arch. biol. technol. vol.57 no.2 Curitiba.
doi.org/10.1590/S1516-89132014000200018.
Arnalds, A. (2004). Carbon sequestration and the restoration of land health. Climate Change,
65: 333-346.
Artur, L. and Hilhorst, D. (2012). Everyday realities of climate change adaptation in
Mozambique. Global Environmental Change, 22: 529–536
Asbjornsen, H., Hernandez-Santana, V., Liebman, M., Bayala, J., Chen, J., Helmers, M.,
Ong, C.K. and Schulte, L.A. (2013). Targeting perennial vegetation in agricultural
landscapes for enhancing ecosystem services. Renewable Agriculture and Food
Systems: doi:10.1017/S1742170512000385.
Australian Greenhouse Office (2001). Home Heating and Cooling, Lights, Refrigerators and
Freezers, Transport. http://www.greenhouse. gov.au/pubs/gwci.
Badal, P.S., Kumar, P. and Bisaria, G. (2006). Dimensions and Determinants of
Peoples’Participation in Watershed Development Programmes in Rajasthan.
Agricultural Economics Research Review, 19: 57-69.
Bajracharya, SR.; Mool, PK. & Shrestha BR. (2008). 'Global climate change and melting of
Himalayan glaciers.' In Ranade, PS; ed. Melting glaciers and rising sea levels:
impacts and implications, Hyderabad, India, Icfai University Press, 28–46.
Bardgett, R.D., Bowman, W.D., Kaufmann, R. and Schmidt, S.K. (2005). A temporal
approach to linking aboveground and belowground ecology. Trends Ecol. Evol., 20:
634–641.
144
Batjes, N.H. (1996). Total carbon and nitrogen in the soils of the world. European Journal of
Soil Science, 47(2): 151-163.
Belsky, A.J. (1986). Does herbivory benefit plants? A review of the evidence. American
Naturalist, 127: 870–892.
Betts, R.A., Falloon, P.D., Goldewijk, K.K. and Ramankutty, N. (2007). Biogeophysical
effects of land use on climate: Model simulations of radiative forcing and large-scale
temperature change. Agricultural and Forest Meteorology 142: 216–233.
Beyene, A., Bluffstone, R., Gebreegzhiaber, Z., Martinsson, P., Mekonnen, A. and Vieider,
F. (2015). Do Improved Biomass Cookstoves Reduce Fuelwood Consumption and
Carbon Emissions? Evidence from Rural Ethiopia Using a Randomized Treatment
Trial with Electronic Monitoring. Policy Research Working Paper 7324.
Bhati, T.K. (1997). Sustainable farming systems for natural resource conservation in arid
natural resource conservation in arid watersheds and index catchments watersheds
and index catchment. CAZRI, Jodhpur. http://www.icrisat.org/what-we-do/agro-
ecosystems/CA_Watersheds/bhati_Jul2k7.pdf.
Bhati, T.K. (2010). Integrated farming system for drought management and improved
productivity in arid zones. In 'Adapting water harvesting to climate change' a
conference held at Maharaja Gaj Singh Jal Sansthan, Jal Darshan Marg, Near
Kayalana Lake, Bijolai, Jodhpur on 12th and 13th, February, 2010.
Bhattacharyya,T., Pal, D.K., Easter,M.,etal. (2007). Modeledsoilorganiccarbonstocks and
changes in the Indo-Gangetic Plains, India from 1980 to 2030. Agric. Ecosyst.
Environ., 122: 84–94.
Bowler, J. M., Johnston, H., Olley, J. M., Prescott, J. R., Roberts, R. G., Shawcross, W. and
Spooner, N. A. (2003). New ages for human occupation and climatic change at Lake
Mungo, Australia. Nature, 421:837–840.
Brooker, K., Huntsinger, L., Bartolome, J.W., Sayre, N.F. and Stewart, W. (2013). What can
ecological science tell us about opportunities for carbon sequestration on arid
rangelands in the United States? Global Climate Change, 23: 240-251.
Brown, H.C.P. and Sonwa, D.J. (2015). Rural local institutions and climate change
adaptation in forest communities in Cameroon. Ecology and Society, 20(2): 6.
http://dx.doi.org/10.5751/ES-07327-200206.
Bunclark, L. and Lankford, B., (2011) Rainwater harvesting: A suitable poverty reduction
strategy for small-scale farmers in developing countries? Waterlines, Vol 30, No 4.
145
Burton, D. (2007). Evaluating Climate Change Mitigation Strategies in South East
Queensland. Urban Research Program Research Paper 11 March 2007.
Busch, J., Dave, R., Hannah, L., Ashkenazi, E., Cameron, A., Fischman, D., Rasolohery, A.
and Schatz, G. (nil). Climate change and the cost of conserving biodiversity in
Madagascar.http://www.gripweb.org/gripweb/sites/default/files/disaster_risk_profiles
/climate%20change%20and%20the%20cost%20of%20conserving%20biodiversity%2
0in%20Madagascar.pdf
Cairns Jr. (1998). Eco-societal restoration: rehabilitating human society's life support system.
In: Rana, B.C. (ed). Damaged Ecosystems and Restoration. Delhi: World Scientific;
1998.
Cairns, J.E., Crossa, J., Zaidi, P.H., Grudloyma, P., Sanchez, C., Araus, J.L., Thaitad, S.,
Makumbi, D., Magorokosho, C., Bänziger, M., Menkir, A., Hearne, S. and Atlin,
G.N. (2013). Identification of drought, heat, and combined drought and heat tolerant
donors in maize. Crop Science, 53: 1335-1346.
Carlson, C.H., Dobrowski, S.Z. and Safford, H.D. (2012). Variation in tree mortality and
regeneration affect forest carbon recovery following fuel treatments and wildfire in
the Lake Tahoe Basin, California, USA. Carbon Balance Manag. 2012; 7: 7. doi:
10.1186/1750-0680-7-7.
Carret, J.C. and Loyer, D. (2003). Madagascar protected area network sustainable financing:
Economic analysis perspective. Presentation to the World Parks Congress, Durban,
South Africa.
Ceotto, (2002). The issue of energy and carbon cycle: new perspective of assessing the
environmental impact of animal waste utilization.
http://www.ramiran.net/DOC/F7.pdf. Accessed on 12th October 2015.
CGW (2007). Central groundwater board, Ministry of Water Resources, GOI.
Chaplot, V. Bouahom, B. and Velentin, C. (2010). Soil organic carbon stocks in Laos: spatial
variations and controlling factors. Global Change Biology, 16(4): 1380–1393.
Chatterjee, K., Chatterjee, A. and Das, S. (2005). Case study 2: India. Community adaptation
to drought in Rajasthan. IDS Bulletin, 36(4): 33-52.
Chawla, S. (2012). Land Use Changes in India and its Impacts on Environment. Journal of
Environment, 1(1): 14-20.
Chen, S., Sasaki , N. and Ninomiya, H. (2015). Carbon emission reductions by substitution of
improved cookstoves and cattle mosquito nets in a forest-dependent community.
146
Global Ecology and Conservation, 4: 434–444.
Chitonge, H. (2013). Land Use and Rural Livelihoods in South Africa: Emerging Evidence
from the Eastern Cape. Agrarian South: Journal of Political Economy, 2(1): 1-40.
Crombie, K., Mašek, O., Cross, A. and Sohi, S. (2015). Biochar – synergies and trade-offs
between soil enhancing properties and C sequestration potential. GCB Bioenergy, 7:
1161–1175.
Daryanto, S., Eldridge, D.J. and Throop, H.L. (2013). Managing semi-arid woodlands for
carbon storage: Grazing and shrub effects on above- and belowground carbon.
Agriculture, Ecosystems & Environment, 169: 1-11.
Davies, J. and Bennett, R. (2007). Livelihood adaptation to risk: Constraints and
opportunities for pastoral development in Ethiopia's afar region. Journal of
Development Studies, 43 (3): 490-511.
De Deyn, G.B., Cornelissen, J.H.C. and Bardgett, R.D. (2008). Plant functional traits and soil
carbon sequestration in contrasting biomes. Ecology Letters, Vol. 11, 0.1111/j.1461-
0248.2008.01164.x
Debela, N., Mohammed, C., Bridle, K, Corkrey, R. and McNeil, D. (2015). Perception of
climate change and its impact by smallholders in pastoral/agropastoral systems of
Borana, South Ethiopia. Springer Plus, 4: 236, DOI 10.1186/s40064-015-1012-9.
Delgado, J.A., Groffman, P.M., Nearing, M.A., Goddard,T., Reicosky, D., Lal, R., Kitchen,
N.R., Rice, C.W., Towery, D. and Salon, P. (2011). Conservation practices to
mitigate and adapt to climate change. Journal of Soil and Water Conservation, 66:
118A-129A.
deMenocal, P. B. (2001). Cultural responses to climate change during the late Holocene,
Science, 2001, 292: 667–673.
Derner, J.D. and G.E. Schuman. 2007. Carbon sequestration and rangelands: A synthesis of
land management and precipitation effects. Journal of Soil and Water Conservation.
62:77-85.
Derner, J.D., Boutton, T.W. and Briske, D.D. (2006). Grazing and ecosystem carbon storage
in the North American Great Plains. Plant and Soil, 280:77-90
Dhir, R.P. (2010). Their increased relevance in a changed climate scenario. In 'Adapting
water harvesting to climate change' a conference held at Maharaja Gaj Singh Jal
Sansthan, Jal Darshan Marg, Near Kayalana Lake, Bijolai, Jodhpur on 12tha nd 13th
February, 2010.
147
Diacono, M. and Montemurro, F. (2010). Long-term effects of organic amendments on soil
fertility. A review. Agronomy for Sustainable Development, 30(2): 401-422.
Diaz, S., Hector, A., and Wardle, D.A. (2009). Biodiversity in forest carbon sequestration
initiatives: not just a side benefit, Current Opinion in Environmental Sustainability,
Volume 1, Issue 1, October 2009.
Diaz,S.andCabido,M.(2001).Viveladifference:plantfunctionaldiversitymaYerst
oecsystemprocesses.TrendsinEcology&Evolution,16: 646‐655.
Djoudi, H., Brockhaus, M., Locatelli,B. (2012). Once there was a lake: vulnerability to
environmental changes in Northern Mali. Regional Environmental Change,
http://dx.doi.org/ 10.1007/s10113-011-0262-5
Ellis, J.E. and Swift, D.M. (1988). Stability of African pastoral ecosystems: alternate
paradigms and implications for development. Journal of Range Management, 41:
450-459.
Ellison, L. (1960). Influence of grazing on plant succession of Rangelands. The Botanical
Review, 26: 1–78.
Emerson, W.W. (1995). Water retention, organic carbon and soil texture. Aust. J. Soil Res.
33: 241–251.
Enfors, E.I. and Gordon, L.J. (2008). Dealing with drought: The challenge of using water
system technologies to break dryland poverty traps. Global Environ. Change, 18: 607
-616.
Fahim, M. A., Hassanein, M.K., Abolmaty, S. M., Khalil, A. A. and Abou Hadid, A. F.
(2013). Climate change adaptation needs for food security in Egypt. Nat. Sci., 1(12):
68-74.
FAO (2007). Modernizing irrigation management – the MASSCOTE approach. FAO
Irrigation and Drainage Paper 63. (Available at: http://www.fao.org/nr/water/docs
/masscote/technical/Masscote.pdf)
FAO (2009). The state of food and agriculture. Food and Agriculture Organization, Rome,
Italy.
FAO (2015). Agriculture's greenhouse gas emissions on the rise.
http://www.fao.org/news/story/en/item/216137/icode/
FAOSAT (2013). Food and Agriculture Organization of the United Nations data set.
http://faostat.fao.org/site/291/default.aspx. Accessed on 26th October 2015.
Fezzi, C., Harwood, A.R., Lovett, A.A. and Bateman, I.J. (2015). The environmental impact

148
of climate change adaptation on land use and water quality. Nature Climate Change,
5: 255–260
Fisher, M., Chaudhury, M. and Mccusker, B. (2010). Do forests help rural households adapt
to climate variability? Evidence from southern Malawi. World Development, 38:
1241-1250
Follett, R.F. and Reed, D.A. (2010). Soil carbon sequestration in grazing lands: societal
benefits and policy implications. Rangeland Ecol. Manage., 63:4–15.
Follett, R.F., J.G. Castellanos, and E.D. Buenger. 2005. Carbon dynamics and sequestration
in an irrigated Vertisol in Central Mexico. Soil Tillage Res. 83:148–158.
Frank, A.B., Tanaka, D.L., Hofmann, L. and Follett, R.F. (1995). Soil carbon and nitrogen of
Northern Great Plains grasslands as influenced by long-term grazing. J. Range
Manage., 48: 47-74.
Franzluebbers, A.J. and Stuedemann, J.A. (2008). Soil-profile organic carbon and total
nitrogen during 12 years of pasture management in the Southern Piedmont USA.
Agriculture, Ecosystems and Environment, doi:10.1016/j.agee.2008.06.013).
Frolking, S., Palace, M.W., Clark, D.B., Chambers, J.Q., Shugart, H.H. and Hurtt, G.C.
(2009). Forest disturbance and recovery: A general review in the context of
spaceborne remote sensing of impacts on aboveground biomass and canopy structure.
Journal of Geophysical Research, vol. 114, G00E02, doi:10.1029/2008JG000911.
Garg, V.K. 1998. Interaction of tree crops with a sodic soil environment: Potential for
rehabilitation of degraded environments. Land Degrad. Dev., 9: 81-93.
Garrity, D., Akinnifesi, F., Ajayi, O., Sileshi, G.W., Mowo, J.G., Kalinganire, A., Larwanou,
M. and Bayala, J. (2010). Evergreen Agriculture: a robust approach to sustainable
food security in Africa. Food Security, 2(3): 197-214.
Gattinger, A., Muller, A., Haeni, M., Skinner, C., Fliessbach, A., Buchmann, N., Mäder, P.,
Stolze, M., Smith, P., Scialabba, N.E. and Niggl, U. (2012).Enhanced top soil carbon
stocks under organic farming. www.pnas.org/cgi/doi/10.1073/pnas.1209429109.
Gilley, J.E. and Risse, L.M. (2000). Runoff and soil loss as affected by the application of
manure. Trans ASAE 43:1583-1588.
Gilroy, J.J., Woodcock, P., Edwards, F.A., Wheeler, C., Medina, Uribe, C.A., Haugaasen, T.
and Edwards, D.P. (2014). Optimizing carbon storage and biodiversity protection in
tropical agricultural landscapes. Glob Chang Biol., 20 (7): 2162-2172.
Giri, J.D., Singh, S.K., Singh, R.S. and Shyampura, R.L. (2007). Carbon stock and its
149
distribution in soils of Ajmer district and management strategies for carbon
sequestration. Agropedology, 18 (1): 21-32.
Gong, W., Yan, X.-Y., Wang, J.-Y., Hu, T.-X. and Gong ,Y.-B. (2009). Long-term manuring
and fertilizer effects on soil organic carbon pools under a wheat-maize cropping
system in North China Plain. Plant and Soil, 314: 67-76.
GoR (2012). Statistical abstract. Directorate of economics and statistics, Rajasthan,
Government of Rajasthan, Jaipur.
Grainger et al. (2009). Supra note 25, at 363; UNEP, UNCCD, and UNDD, Climate change
in the African drylands: options and opportunities for adaptation and mitigation, at
38.
Gunderson, L. H. (2000), Resilience in theory and practice,Annu. Rev. Ecol. Syst.,31: 425-
439.
Gupta, G.N. (1995). Rain-water management for tree planting in the Indian desert. J. Arid
Environ., 31: 219-235.
Gupta, R.K. and Rao, D.L. (1994). Potential of wasteland for sequestering carbon by
reforestation. Current Science, 66: 378-80.
Gurran, N., Hamin,E.,& Norman, B.(2008).Planning forclimate change: Leading
practiceprinciples and models for sea change communities in coastal
Australia.Sydney:University of Sydney, Faculty of Architecture and the Sea Change
Task Force.Hamnett, S. (2006). Special edition on learning from urban disasters:
planning forresilient cities.Built Environment, 32(4).
Gustavsson, L., Bijrjesson, P., Johansson, B.and Svenningsson, P. (1995). Reducing CO2
emissions by substituting biomass for fossil fuels. Energy, 20: 1097-l113.
Gwambene, B and Majule A. (2010).‘Contribution of tillage practices on adaptation to
climate change and variability on agricultural productions in semi-arid areas of
central Tanzania’ Climate change, Agriculture, food security and human health, 9th
European IFSA Symposium, 4-7 July 2010, Vienna (Austria) WS3.1 pp. 1300-1306.
Habiba, U., R. Shaw, and Y. Takeuchi. (2012). Farmer’s perception and adaptation practices
to cope with drought: Perspectives from northwestern Bangladesh. International
Journal of Disaster Risk Reduction, 1: 72-84.
Hansen, E.M. (2014). Forest development and carbon dynamics after mountain pine beetle
outbreaks. Forest Science, 60(3): 476-488.
Hassanein M. K.; M. Elsayed and A.A. Khalil 2012. Impacts of sowing date, cultivar,

150
irrigation regimes and location on bread wheat production in Egypt under climate
change conditions. Nature and Science, 10(12): 141-150.
Haug, G. H., Gunther, D., Peterson, L. C., Sigman, D. M., Hughen, K. A., Aeschlimann, B.
(2003). Climate and the collapse of Maya Civilization, Science, 299: 1731-1735.
Hegazy A. K.; Medany, M. A., Kabiel, H. F. and Meaz, M. M., 2008. Spatial and temporal
projected distribution of four crop plants in Egypt. Natural resources Forum, 32: 316-
326.
Herrman, S.M. and Hutchinson, C.F. (2005). The changing context of desertification debate.
J. Arid Environment, 63(3): 538-555.
Hetherington, A.M. and Woodward, F.I. (2003). The role of stomata in sensing and driving
environmental change. Nature, 424(6951): 901-908.
Ho, P. (2001). Rangeland Degradation in China Revisited? The Journal of Development
Studies, 37(3): 99 -132.
Holechek, J.L., Gomez, H., Molinar, F. and Galt, D. (1999). Grazing studies: what we've
learned. Rangelands, 21: 12-16.
Holtum, J.A.M. and Winter, K. (2010). Elevated [CO2] and forest vegetation: more a water
issue than a carbon issue? Functional Plant Biology, 37: 694-702.
Howden, S.M., J.-F. Soussana, F.N. Tubiello, N. Chhetri, N. Dunlop, and H. Meike. 2007.
Adapting agriculture to climate change. Proc. Natl. Acad. Sci. USA 104: 19691-
19696.
Howe, P.D. and Leiserowitz, A. (2013). Who remembers a hot summer or a cold winter?
The asymmetric effect of beliefs about global warming on perceptions of local
climate conditions in the U.S. Global Change Biology,
http://dx.doi.org/10.1016/j.gloenvcha.2013.09.014.
Hughes, D.A., Andersson, L., Wilk, J and Savenije, H.H.G. (2006). Regional calibration of
the Pitman model for the Okavango River. Journal of Hydrology, 331: 30- 42.
Hussain, J. and Husain, I. (2012).Water Harvesting to Augment Water Resources: Traditional
Technology and Communities are Part of the Solution, Workshop Abstracts
proceedings, Water and Food Security, 94, Stockholm.
Hussain, M. M. (2006). Rainwater harvesting tanks for supplementing minor irrigation tanks
during drought. In: National seminar on rainwater harvesting and water management
11-12 Nov. 2006, Nagpur.
ICAR (2010-2011). Annual Report, ICAR network project on climate change.

151
IEA (2006). World Energy Outlook. International Energy Agency. Paris Cedex 15, France.
596pp.
IEA (2010). World Energy Outlook. International Energy Agency. Paris Cedex 15, France.
Executive summary, 15pp
Iizumi, T. and Ramankutty, N. (2015). How do weather and climate influence cropping area
and intensity? Global Food Security, 4(3): 46-50.
Iizumi, T. and Ramankutty, N. (2015). How do weather and climate influence cropping area
and intensity? Global Food Security, 4: 46-50.
IPCC (2001), -Climate Change 2001: Impacts, Adaptation and Vulnerability-, Working
Group II Contribution to the Third Assessment Report of the Intergovernmental Panel
on Climate Change, -Chapter 18: Adaptation to Climate Change in the Context of
Sustainable Development and Equity-, Cambridge University Press, Cambridge, pp.
877-912.
IPCC (2007). IPCC Report on Good Practice Guidance for Land Use, Land-Use Change and
Forestry. 204 pp.
IPCC (2014). Fifth Assessment Report, Mitigation. Intergovernmental Panel on Climate
Change, Technical Summary, at 12 (2014).
Jain, L.K. (2014). Economics and gap analysis in isabgol cultivation through frontline
demonstrations in western Rajasthan. Int. J. Agr. Ext., 2(2): 109-114
Janssens, I. A., Dieleman, W., Luyssaert, S., Subke, J. A., Reich-stein, M., Ceulemans, R.,
Ciais, P., Dolman, A. J., Grace, J.,Matteucci, G., Papale, D., Piao, S. L., Schulze, E.
D., Tang, J., and Law, B. E. (2010). Reduction of forest soil respiration in response to
nitrogen deposition, Nat. Geosci., 3: 315-322.
Jhunjhunwala, B. (2003). Traditional Agricultural and Water Technologies of Western
Rajasthan. Kalpaz Publications, Delhi, India.
Jobbagy, E.G. and Jackson, R.B. (2000). The vertical distribution of soil organic carbon and
its relation to climate and vegetation. Ecol. Appl., 10: 423-436.
Johnson, D.W. and Curtis, P.S. (2001). Effects of forest management on soil C and N
storage: meta analysis. Forest Ecology and Management, 140: 227-238
Johnson, E. (nil). Substituting LP Gas for Wood: Carbon and Deforestation Impacts. A report
of the World LP Gas Association http://www.cooking-for-
life.org/uploads/Modules/Documents/substituting- lp-gas-for-wood---carbon-and-
deforestation-impacts.pdf. Accessed on 13th October 2015.

152
Johnson, I. and Coburn, R. (2010). Trees for carbon sequestration.
http://www.forestrycorporation.com.au/__data/assets/pdf_file/0006/438234/Trees-
for-carbon-sequestration.pdf.
Johnson, I. and Coburn, R. (2010). Trees for carbon sequestration.Primefacts.
http://www.forestrycorporation.com.au/__data/assets/pdf_file/0006/438234/Trees-
for-carbon-sequestration.pdf. Accessed on 10th September 2015.
Kalisch,A., Zemek, O. and Schellhardt, S. (2011). Adaptation in Agriculture in Porsché,I.,
Kalisch, A. and Füglein,R. (eds.) Adaptation to Climate Change With a Focus on
Rural Areas and India, Deutsche Gesellschaft für Internationale Zusammenarbeit
(GIZ), New Delhi.
King, G.M. (2011). Enhancing soil carbon storage for carbon remediation: potential
contributions and constraints by microbes. Trends in Microbiology, 19: 75-84.
Koomen, E., Rietveld, P., & De Nijs, T. (2008). Modelling land-use change for spatial
planning support; Editorial.Annals of Regional Science, 42(1): 1–10.
Lal, R. (2004). Soil carbon sequestration impacts on global climate change and food security.
Science, 304(5677): 1623-1627.
Lal, R. (2009). Sequestering carbon in soils of arid ecosystems. Land Degradation &
Development, 20(4): 441-454.
Lal, R. (2010). Enhancing eco-efficiency in agroecosystem through soil carbon sequestration.
Crop Science, 50: S120-131.
Lal, R. (2011). Sequestering carbon in soils of agro-ecosystems. Food Policy, 36: S33-S39.
Lal, R. and Bruce, J.P. (1999). The potential of world cropland soils to sequester C and
mitigate the greenhouse effect. Environ. Sci. Policy., 2: 77-185.
Lam, N.L., Smith, K.R., Gauthier, A. and Bates, M.N. (2012) Kerosene: a review of
household uses and their hazards in low- and middle- income countries. J Toxicol
Environ Health B Crit Rev. 2012; 15(6): 396–432.
Lee, T.M., Markowitz, E.M., Howe, P.D., Ko, C.-Y. and Leiserowitz, A.A. (2015).
Predictors of public climate change awareness and risk perception around the world.
Nature Climate Change, 5: 1014–1020.
Lehmann J, Gaunt J, Rondon M (2006) Bio-char sequestration in terrestrial ecosystems - a
review. Mitigation and Adaptation Strategies for Global Change, 11: 403-427.
Lema M.A. and Majule A.E. (2009). Impacts of climate change, variability and adaptation
strategies on agriculture in semi arid areas of Tanzania, the case of manyoni district in
153
Singida Regio, Tanzania,African Journal of Environmental Science and Technology,
3(7): 206-218.
Lema, M.A and Majule, A.E. (2009). Impacts of Climate Change, variability and adaptation
strategies on Agriculture in semi arid areas of Tanzania: The Case of Manyoni
District in Singida Regio, Tanzania. African Journal of Environmental Science and
Technology, 3 (7): 206-218.
Leu, A. (2007). Organics and Soil Carbon: Increasing soil carbon, crop productivity and farm
profitability. Managing the Carbon Cycle’ Katanning Workshop 21-22 March 2007.
www.amazingcarbon.com.
Li., M. and Wu, J.J. (2010). Predicting China’s Land-use Change and Soil Carbon
Sequestration under Alternative Climate Change Scenarios.
http://ageconsearch.umn.edu/handle/61671.Accessed on 20th October 2015.
Liebig, M.A., J.R. Gross, S.L. Kronberg, R.L. Phillips, and J.D. Hanson. 2010. Grazing
management contributions to net global warming potential: A long-term evaluation in
the Northern Great Plains. Journal of Environmental Quality, 39: 799-809.
Lipper, L., Thornton, P., Campbell, B.M., Baedeker, T., Braimoh, A., Bwalya, M., Caron, P.,
Cattaneo, A., Garrity, D., Henry, K., Hottle,R., Jackson, L., Jarvis, A., Kossam, F.,
Mann, W., McCarthy, N., Meybeck, A., Neufeldt, H., Remington, T., Sen, P.T.,
Sessa, R., Shula, R., Tibu, A. and Torquebiau, E.F. (2014). Climate-smart agriculture
for food security. Nat. Clim. Change, 4: 1068-1072.
Liswanti, N., Sheil, D., Basuki, I., Padmanaba, M., Mulcahy, G. (2011). Falling back on
forests: How forestdwelling people cope with catastrophe in a changing landscape. Int
Forest Rev., 13(2): 442-455.
Liu, Z., Shao, M. and Wang, Y. (2011). Effect of environmental factors on regional soil
organic carbon stocks across the Loess Plateau region, China. Agriculture, Ecosystem
and Environment, 142: 184-194.
Locatelli, B. and Vignola, R. (2009). Managing watershed services of tropical forests and
plantations: Can meta-analyses help? Forest Ecology and Management, 258(9): 864-
1870.
Louhaichi, M., Chand, K., Mishra, A.K., Gaur, M.K., Ashutosh, S., Johnson, D.E. and Roy,
M.M. (2014). Livestock Migration in the Arid Region of Rajasthan (India) - Strategy
to cope with fodder and water scarcity. J. Arid Land Studies, 24(1): 61-64.
Mahnot, S.C., Sharma, D.C., Mishra A, Singh, P.K. and Roy, K.K. (2003). Water harvesting
154
management, SDC/ICU, Jaipur.
Mall, R.K., Singh, R., Gupta, A., Srinivasan, G. and Rathore, L.S. (2006). Impact of Climate
Change on Indian Agriculture: A Review. Climatic Change, 78(2): 445-478.
Mandal,B., Majumder, B., Bandyopadhyay,P.K.,etal. (2007).The potential of cropping
systems and soil amendments for carbon sequestration in soils under long-term
experiments in subtropical India. Global Change Biol., 13: 357-369.
Mathur, B. (2014). Impact of climate change on the indigenous people of Rajasthan. Journal
of Studies in Dynamics and Change, 1: 2348-7038.
Mati, B.M. (2012) Runoff harvesting for crop production: practical solutions for dry land
agriculture. Training Manual 1. Nile Basin Initiative (NBI), Nile Equatorial Lakes
Subsidiary Action Programme (NELSAP)- Regional Agricultural and Trade
Programme (RATP), Bujumbura, Burundi.
McCarthy, J.J., Canziani, O.F., Leary, N.A., Dokken, D.J. and White, K.S. (eds). (2001).
Climate change 2001: impacts, adaptation, and vulnerability. Cambridge University
Press, Cambridge.
McDermot C and Elavarthi S (2014). . Rangelands as Carbon Sinks to Mitigate Climate
Change: A Review. J Earth Sci Clim Change 2014, 5:8
http://dx.doi.org/10.4172/2157-7617.1000221.
McGarvey, J.C., Thompson, J.R., Epstein, H.E. and Shugart, Jr. H.H. (2015). Carbon storage
in old-growth forests of the Mid-Atlantic: toward better understanding the eastern
forest carbon sink. Ecology, 96: 311-317.
McLean, K.G. (2010). Advance guard: Climate change impacts, adaptation, mitigation and
indigenous peoples–A compendium of case studies. United Nations University-
Traditional Knowledge Initiative, Darwin. Available via http://www. unutki.
org/news. php.
McSherry, M.E. and Ritchie, M.E. (2013). Effects of grazing on grassland soil carbon: a
global review. Global Change Biology, 19(5): 1347-1357.
Meinhausen M, Meinhausen N, Hare W, Raper SCB, Frieler K, et al. (2009).Greenhouse gas
emission targets for limiting global warming to 2°C. Nature, 458: 1158-1162.
Meybeck, A., Lankoski, J., Redfern, S., Azzu, N. and Gitz, V. (2012). Building resilience for
adaptation to climate change in the agriculture sector. Proceedings of a Joint
FAO/OECD Workshop. 23–24 April 2012, FAO, Rome.
Miller, K., and Yates, D. (2006). Climate change and water resources: a primer for municipal

155
water poviders. AwwaRF.
Mimi, Z.A. and Jamous, S.A. (2010). Climate change and agricultural water demand:
impacts and adaptations. Afr. J. Environ. Sci. Technol., 4 (4): 183-191.
Moench, M. and Dixit, A. (2004), Adaptive Capacity and Livelihood Resilience: Adaptive
Strategies for Responding to Floods and Droughts in South Asia, The Institute for
Social and Environmental Transition, International, Boulder, Colorado, U.S.A. and
Institute for Social and Environmental Transition, Nepal.
Mohapatra, A.K. (2008). Forestry based carbon sequestration options in India. Indian J.
Forestry, 31: 483-490.
MPOWER (2010). mitigating poverty in western Rajasthan project project design completion
report.
Mustapha, S., Undiandeye, U. and Gwary, M. (2012). The Role of Extension in Agricultural
Adaptation to Climate Change in the Sahelian Zone of Nigeria. Journal of
Environment and Earth Science, 2(6): 48-58.
Ngigi, S.N. (2003) Rainwater harvesting for improved food security: Promising technologies
in the Greater Horn of Africa. Greater Horn of Africa Rainwater Partnership
(GHARP), Kenya Rainwater Association (KRA), Nairobi, Kenya. 266p.
Ngo, P.T., Rumpel, C., Thu, T.D., des-Tureaux, T.H., Dang, D.K. and Jouquet, P. (2014).
Use of organic substrates for increasing soil organic matter quality and carbon
sequestration of tropical degraded soil: a 3-year mesocosms experiment. Carbon
Management, 5(2): 155-168
NOAA (2014). National Oceanic and Atmospheric Administration
https://www.ncdc.noaa.gov/sotc/global/201408. Accessed on 9th November 2015.
NRC, 2010: Adapting to Impacts of Climate Change. America’s Climate Choices: Report of
the Panel on Adapting to the Impacts of Climate Change. National Research Council.
The National Academies Press, 292 pp
NSSO (2007). National Sample Survey Organisation; Govt. of India, Ministry of Statistics
and Programme Implementation, editor. Energy sources of India household for
cooking and lighting, NSS 61st Round (July 2004–June 2005), Report no. 511
(61/1.0/4) New Delhi: National Sample Survey Organization; 2007.
Nyakudya I. W., Jimu, L., Muripira, V. and Chikuvire, T.J. (2012). A comparative analysis
of yield performance of maize (Zea mays L.) under different tillage methods in
Musana communal area, Zimbabwe. Journal of Agricultural Biotechnology and

156
Sustainable Development, 4(4): 45-49.
Ogle, K. and Reynolds, J.F. (2004). Plant responses to precipitation in desert ecosystems:
integrating functional types, pulses, thresholds, and delays. Oecologia, 141: 282–294.
Olson, K.R., Al-Kaisi, M.M., Lal, R. and Lowery, B. (2014). Experimental consideration,
treatments, and methods in determining soil organic carbon sequestration rates. Soil
Sci. Soc. Am. J., 78: 348-360.
Painter, E.L. and Belsky, A.J. (1993). Application of herbivore optimization theory to
rangelands of the western United States. Ecological Appplications, 3: 2-9.
Pan, Y., Birdsey, R.A., Fang, J., Houghton, R., Kauppi, P.E., Kurz, W.A., Phillips, O.L.,
Shvidenko, A., Lewis, S.L., Canadell, J.G., Ciais, P., Jackson, R.B., Pacala, S.W.,
McGuire, A.D., Piao, S., Rautiainen, A., Sitch, S. and Hayes, D. (2011). A large and
persistent carbon sink in the world's forests. Science, 333: 988-993.
Pandey, D.N., Gupta, A.K. and Anderson, D.M. (2003). Rainwater harvesting as an
adaptation to climate change. Current Science, 85: 46-59.
Pandey, D.N., Gupta, A.K. and Anderson, D.M. (2003). Rainwater harvesting as an
adaptation to climate change. Current Science, 85(1): 46-59.
Pandve, H.T., Chawla, P.S., Fernandez, K., Singru, S.A., Khismatrao, D. and Pawar, S.
(2011). Assessment of awareness regarding climate change in an urban community.
Indian J Occup Environ Med., 15(3): 109-112.
Pandy, D.N. (2002). Global climate change and carbon management in multifunctional
forests. Current Science, 83 (5): 593-602.
Panwar, N.L., Kurchania, A.K. and Rathore, N.S. (2009). Mitigation of greenhouse gases by
adoption of improved biomass cookstoves. Mitigation and Adaptation Strategies for
Global Change, 14 (6): 569-578
Pareek, A. and Trivedi, P.C. (2011). Cultural values and indigenous knowledge of climate
change and disaster prediction in Rajasthan, India. Indian Journal of Traditional
Knowledge, 10(1): 183-189.
Parry, M.L., O.F. Canziani, J.P. Palutikof, P.J. van der Linden, and C.E. Hanson (eds.)
(2008). Cambridge University Press, Cambridge, UK, 717-743.
Pathak, P., Chourasia, A.K., Wani, S.P. and Sudi, R. (2013). Multiple impact of integrated
watershed management in low rainfall semi-arid region: a case study from eastern
Rajasthan, India. Journal of Water Resource and Protection, 5: 27-36.
Pattanayak, S.K. (2004). Valuing watershed services: concepts and empirics from southeast

157
Asia. Agriculture, Ecosystems and Environment 104: 171–184.
Personeni, E. and Loiseau, P. (2004). How does the nature of living and dead roots affect the
residence time of carbon in the root litter continuum? Plant Soil, 267: 129-141.
Polyak,V. J. and Asmerom, Y. (2001). Late Holocene climate and cultural changes in the
Southwestern United States, Science, 294: 148-151.
Poonia, S. and Rao, A.S. (2013). Climate change and its impact on Thar desert ecosystem.
Journal of Agricultural Physics, 13(1): 71-79.
Pramova, E., Locatelli, B., Brockhaus, M. and Fohlmeister, S. (2012a). Ecosystem services
in the national adaptation programmes of action. Climate Policy, 2012, 1-17.
doi:10.1080/14693062.14692011.14647848.
Pramova, E., Locatelli, B., Djoudi, H. and Somorin, O.A. (2012). Forests and trees for social
adaptation to climate variability and change. WIREs Climate Change, 3: 581-596.
Rajendiran, S., Coumar, M.V., Kundu, S., Ajay, M., Dotaniya, L. and Rao, A.S. (2012). Role
of phytolith occluded carbon of crop plants for enhancing soil carbon sequestration in
agro-ecosystems. Current Science, 103: 911-920.
Rangnekar, D.V. (2006). Livestock in the livelihood of the underprivileged communities in
India: a review. International Liestock Research Institute. Nairobi, Kenya. 72pp.
Rathore, H.S. (2001). Indigenous institutions for managing livestock genetic diversity in
Rajasthan (India). In: Experiences in Farmer’s Biodiversity Management, Maier, J.,
Ricardo Armonia, R. and Gura, S. (Eds), Report on the International Workshop on
Animal and Plant Genetic Resources in Agriculture at the Biosphere Reserve
Schorfheide-Chorin, Germany during 16-18 May 2000., German NGO Forum on
Environment & Development Am Michaelshof 8-10 D-53177 Bonn.
Reeder, J.D. and G.E. Schuman. 2002. Influence of livestock grazing on C sequestration in
semi-arid mixed-grass and short-grass rangelands. Environmental Pollution, 116:
457-463.
Reeder, J.D., Franks, C.D., Milchunas, D.G. (2001). Root biomass and microbial processes.
In: Follett, R.F., Kimble, J.M., Lal, R. (Eds.), 'The Potential of US Grazing Lands to
Sequester Carbon and Mitigate the Greenhouse Effect. Lewis Publishers, Boca Raton
FL, pp. 139-166.
Reeder, J.D., G.E. Schuman, J.A. Morgan, and D.R. LeCain. 2004. Response of organic and
inorganic carbon and nitrogen to long-term grazing of the shortgrass steppe.
Environmental Management. 33: S485-S495.

158
Reisner, M.D., Grace, J. B. Pyke, D.A. and Doescher, P.S. (2013). Conditions favoring
Bromus tectorum dominance of endangered sagebrush steppe ecosystems. Journal of
Applied Ecology, 50: 1039-1049.
Rockström, J. (2002) potential of rainwater harvesting to reduce pressure on freshwater
resources. International Water Conference, Hanoi, Vietnam, October 14-16, 2002.
Rong, Y., Yuan, F. and Ma, L. (2014). Effectiveness of exclosures for restoring soils and
vegetation degraded by overgrazing in the Junggar Basin, China. 60: 118-124.
Rosenzweig, C., and Tubiello, F.N. (2007). Adaptation and mitigation strategies in
agriculture: an analysis of potential synergies. Mitig. Adapt. Strategies Global
Change, 12: 855-873.
Roy, M.M, Tewari, J.C. and Molla Ram, 2011.Agroforestry for climate change adaptations
and Livelihood improvement in Indian hot arid regions. International Journal of
Agriculture & Crop Sciences, 3(2): 43-54.
RSACC (2011). Rajasthan State Action Plan on Climate Change. Government of Rajasthan,
[http://rpcb/ReportsAndPaper/ClimateChange.PDF] (Accessed on June 20, 2014).
Sabate´ S, Gracia CA (2011) Water processes in trees: transpiration and photosynthesis. In:
Birot Y, Gracia C, Palahı́ M (edn) What Science Can Tell Us1,Water for Forests and
People in the Mediterranean Region—A Challenging Balance 72-75 European Forest
Institute, Joensuu, Finland.
Sahoo, K.C. (2011). From cow dung to biogas to carbon credits for Nepal.
http://blogs.worldbank.org/climatechange/cow-dung-biogas-carbon-credits-nepal.
Accessed on 6th November 2015.
Sampei, Y. and Aoyagi-Usui, M. (2009). Mass-media coverage, its influence on public
awareness of climate-change issues, and implications for Japan’s national campaign
to reduce greenhouse gas emissions. Global Environmental Change, 19(2): 203–212
Sanghi, A. and Mendelsohn R. (2008). The impacts of global warming on farmers in
Braziland India,Global Environmental Change, 18: 655–665.
Scharlemann, J.P.W., Tanner, E.V.J., Hiederer, R. and Kapos, V. (2014). Global soil carbon:
understanding and managing the largest terrestrial carbon pool. Carbon Management,
5(1): 81-91.
Schenk, H.J. and Jackson, R.B. (2002). Rooting depths, lateral spreads, and below-ground ⁄
above-ground allometries of plants in water- limited ecosystems. J. Ecol., 90: 480-
494.

159
Schlenker, W. and and Roberts, M.J. (2009). Nonlinear Temperature Effects Indicate Severe
Damages to US Crop Yields under Climate Change. Proceedings of the National
Academy of Sciences, 106(37): 15594-15598.
Schlesinger, W.H. 1999. Carbon sequestration in soils. Science, 284: 2095.
Scott, M., Marshall, E., Aillery, M., Heisey, P., Livingston, M. and Day-Rubenstein, K.
(2012). Agricultural Adaptation to a Changing Climate: Economic and Environmental
Implications Vary by U.S. Region, ERR-136, U.S. Department of Agriculture,
Economic Research Service, July 2012
Sekhar, N. U. (2004). Local versus expert knowledge in forest management in a semi-arid
part of India. Land Degradation & Development, 15: 133-142.
Selvaraju,R., A.R. Subbiah, S. Baas and I. Juergens. 2006. Livelihood adaptation to climate
variability and change in drought-prone areas of Bangladesh. Case Study Project
Under Institution For Rural Development, Pp. 1-76.
Shah, T. (2009). Groundwater Governance and Irrigated Agriculture. Global Water
Partnership Technical Committee (TEC). The background paper no. 19. Stockholm,
Sweden.
Shamseddin, M. and Adeeb, A. (2014). Topsoiling and subsoiling as rainwater harvesting
techniques for arid climates: a case study from Sudan. In: Planet@Risk, 2(1), Special
Issue on Desertification: 40-46, Davos: Global Risk Forum GRF Davos.
Sharma, D.K. and Agrawal, G.D. (2011). Carbon credit potential of biogas plants at
Durgapura Goushala, Jaipur. Proc. of the International Conference on Science and
Engineering, pp. 298-301.
Shrestha, B.M., Sitaula, B.K., Singh, B.R. and Bajracharya, R.M. (2004). Soil organic carbon
stocks in soil aggregates under different land use systems in Nepal. Nutrient Cycling
in Agroecosystems, 70: 201-213
Singh, G. (2005). Carbon sequestration under an agri-silvicultural system in the arid region.
Indian Forester 131(4): 543-552.
Singh, G. (2011). Effects of rainwater harvesting devices in controlling runoff losses and
enhancing productivity in Aravalli ranges. Project report AFRI Jodhpur submitted to
ICFRE, Dehradun.
Singh, G. (2012). Enhancing growth and biomass production of plantation and associated
vegetation through rainwater harvesting in degraded hills in southern Rajasthan. New
Forests, 43: 349-364.
160
Singh, G. (2013). Carbon sequestration during rehabilitation of degraded hills. Pamphlet,
AFRI, Jodhpur.
Singh, G. (2014). Studies on carbon sequestration in different forest types of Rajasthan. A
project report of AFRI, Jodhpur submitted to ICFRE, Dehradun, India.
Singh, G. and Rathod, T.R. (2002). Plant growth, biomass production and soil water
dynamics in a shifting dune of Indian desert. Forest Ecology and Management, 171:
309-320.
Singh, G., Chouhan, S. and Rathod, T.R. (2008). Vegetation diversity and socioeconomic
profile relations in some selected villages of Indian desert. Indian Forester, 134(6):
744-756.
Singh, G., Khan, A.U., Kumar, A., Bala, N. and Tomar, U.K. (2012). Effects of rainwater
harvesting and afforestation on soil properties and growth of Emblica officinalis
while restoring degraded hills in western India. African J. Environ. Sci. Technology,
6(8): 300-311.
Singh, G., Mishra, D., Singh, K. and Parmar, R. (2013). Effects of rainwater harvesting on
plant growth, soil water dynamics and herbaceous biomass during rehabilitation of
degraded hills in Rajasthan, India. Forest Ecology and Management, 310: 612-622.
Singh, G., Mishra, D., Singh, K. and Parmar, R. (2013b). Effects of rainwater harvesting on
plant growth, soil water dynamics and herbaceous biomass during rehabilitation of
degraded hills in Rajasthan, India. Forest Ecology and Management, 310: 612-622.
Singh, G., Mutha, S. and Bala, N. (2007). Growth and productivity of Prosopis cineraria
based agroforestry system at varying spacing regimes in the arid zone of India. J. Arid
Environment, 70(1): 152-163.
Singh, G., Rathod, T.R., Komara, S.S. and Limba, N.K. (2013). Rainwater harvest influences
habitat heterogeneity, nutrient build up and herbage biomass production in Aravalli
hills Rajasthan, India. Tropical Ecology, 54(1): 73-88.
Singh, G., Singh, B. and Rathore, T.S. (2013a). Effects of agroforestry land use on
microclimate modification and productivity in dry areas. Indian J. Agroforestry, 15:
58-78.
Singh, K (2015). Effect of land use types on floral diversity and carbon stock in Jodhpur
district of Rajasthan. Theses submitted to FRI University, Dehradun for award of Ph.
D. degree.
Singh, K. (2015). Effects of land use types on floral diversity and carbon stock in Jodhpur
161
district of Rajasthan. Ph. D. Thesis submitted to FRI University for award of Ph. D.
Singh, P.K. and Nair, A. (2014). Livelihood vulnerability assessment to climate variability
and change using fuzzy cognitive mapping approach. Climatic Change, 127: 475-491.
Singh, R.B. and Kumar, A. (2014). Vulnerability of Agriculture to Climate Change in Arid
Regions: a Case Study of Western Rajasthan, India, in Vulnerability of Land Systems
in Asia (eds A. K. Braimoh and H. Q. Huang), John Wiley & Sons, Ltd, Chichester,
UK. doi: 10.1002/9781118854945.ch6.
Singh, R.B. and Kumar, A. (2015). Climate variability and water resource scarcity in
drylands of Rajasthan, India. Geoenvironmental Disasters, 2015, 2:7
doi:10.1186/s40677-015-0018-5.
Singh, S., Park, J. and Litten-Brown, J. (2011). The economic sustainability of cropping
systems in Indian Punjab: A farmers’ perspective.
http://ageconsearch.umn.edu/bitstream/116007/2/Singh_Sukhwinder_557a.pdf.
Accessed on 20th October 2015.
Singh, V.S., Pandey, D.N., Gupta, A.K. and Rabindranath, N.H. (2010). Climate Change
Impacts, Mitigation and Adaptation: Science for Generating Policy Options in
Rajasthan, India. RSPCB, Jhaalana Dungari Industrial Area, Jaipur.
Smit, B. and Pilifosova, O. (2001). Adaptation to climate change in the context of sustainable
development and equity. Chapter 18 in Climate Change 2001: Impacts, Adaptation,
and Vulnerability—Contribution of Working Group II to the Third Assessment
Report of the Intergovernmental Panel on Climate Change. Cambridge University
Press, Cambridge, UK.
Smith P., M. Bustamante, H. Ahammad, H. Clark, H. Dong, E. A. Elsiddig, H. Haberl, R.
Harper, J. House, M. Jafari, O. Masera,C. Mbow, N. H. Ravindranath, C. W. Rice, C.
Robledo Abad, A. Romanovskaya, F. Sperling, and F. Tubiello, (2014). Agriculture,
Forestry and Other Land Use (AFOLU). In: Climate Change 2014: Mitigation of
Climate Change. Contribution of Working Group III to the Fifth Assessment Report
of the Intergovernmental Panel on Climate Change [Edenhofer, O., R.Pichs-Madruga,
Y. Sokona, E. Farahani, S. Kadner, K. Seyboth, A. Adler, I. Baum, S. Brunner, P.
Eickemeier, B. Kriemann, J. Savolainen, S. Schlömer, C. von Stechow, T. Zwickel
and J.C. Minx (eds.)]. Cambridge University Press, Cambridge, United Kingdom and
New York, NY, USA.
Smith P., M. Bustamante, H. Ahammad, H. Clark, H. Dong, E. A. Elsiddig, H. Haberl, R.
162
Harper, J. House, M. Jafari, O. Masera, C. Mbow, N. H. Ravindranath, C. W. Rice, C.
Robledo Abad, A. Romanovskaya, F. Sperling, and F. Tubiello, 2014: Agriculture,
Forestry and Other Land Use (AFOLU). In: Climate Change 2014: Mitigation of
Climate Change. Contribution of Working Group III to the Fifth Assessment Report
of the Intergovernmental Panel on Climate Change [Edenhofer, O., R. Pichs-
Madruga, Y. Sokona, E. Farahani, S. Kadner, K. Seyboth, A. Adler, I. Baum, S.
Brunner, P. Eickemeier, B. Kriemann, J. Savolainen, S. Schlömer, C. von Stechow, T.
Zwickel and J.C. Minx (eds.)]. Cambridge University Press, Cambridge, United
Kingdom and New York, NY, USA.
Smith, K.R., Uma, R., Kishore, V.V.N., Zhang, J., Joshi,V. and Khalil, M.A.K. (2000).
Greenhouse implications of household stoves: An Analysis for India. Annu. Rev.
Energy Environ., 25: 741- 763.
Sohi SP, Krull E, Lopez-Capel E, Bol R (2010). A review of biochar and its use and function
in soil. Advances in Agronomy, 105: 47-82.
Sokal, R.R. and Rolf, P.J. (1981). Biometery 2nd edition, W.H. Freeman, New York.
Solomon S., Qin, D., Manning, M., Chen, Z., Marquis, M., Averyt, K.B., Tignor, M. and
Miller, H.L. (eds.) (2007). Climate change 2007: the synthesis report. Contribution of
Working Group I to the Fourth Assessment Report of the Intergovernmental Panel on
Climate Change. Cambridge, United Kingdom and New York: Cambridge University
Press. 996 p.
Song, Z., Müller, K. and Wang, H. (2014b). Biogeochemical silicon cycle and carbon
sequestration in agricultural ecosystems. Earth Science Reviews, 139: 268-278.
Song, Z., Wang, H., Strong, P.J. and Guo, F. (2014a). Phytolith carbon sequestration in
China’s croplands. European Journal of Agronomy, 53: 10-15.
Spanger-Siegfried, E. and Dougherty, B. (2005). User's Guidebook. In: Lim B. and Spanger-
Siegfried, E. (Eds), Adaptation policy framework for climate change: developing
strategies, policies and measures, UNDP and GEF.
Spross, M. (2015). Perceptions of Potable Water in Rajasthan’s Jodhpur and Barmer
Districts.. Independent Study Project (ISP) Collection.Paper 2082.
Srinivasarao, C., Vittal, K.P.R., Venkateswarlu, B., Wani, S.P., Sahrawat, K.L., Marimuthu,
S. and Kundu, S. (2009). Carbon Stocks in Different Soil Types under Diverse
Rainfed Production Systems in Tropical India. Communications in Soil Science and
Plant Analysis, 40: 2338-2356.

163
Stern, N. (2006). What is the economics of climate change? World Economics, 7(2): 1-10.
Sullivan, C.A., Meigh, J.R. and Giacomello, A.M. (2003). The Water Poverty Index:
Development and application at the community scale. Natural Resources Forum, 27:
189-199
Sunderarajan, P. (2012). Several States in north India cling on to joint families. The Hindu,
16th March 2012.
Swain, M., Kalamkar, S.S. and Ojha, M. (2012). State of Rajasthan Agriculture 2011-12.
AERC Report 145. Sardar Patel University Vallabh Vidyanagar, Dist. Anand,
Gujarat.
http://spuvvn.edu/academics/academic_centres/agro_economic_centre/research_studi
es/R.%20No.%20145%20State%20of%20Rajasthan%20Agriculture.pdf. Accessed on
10th September 2015.
Swarnkar, S. and Katewa,S.S.(2008). Ethnobotanical observation on tuberous plants from
tribal area of Rajasthan (India). Ethnobotanical leaflets, 12: 647-666.
Swart, R., Robinson, J. and Cohen, S. (2003). Climate change and sustainable development:
expanding the options. Climate Policy, 3S1: S19–S40.
Takasaki, Y., Barham, B.L. and Coomes, O.T. (2004). Risk coping strategies in tropical
forests: floods, illnesses, and resource extraction. Environ Dev. Econ., 9: 203 – 224.
Tarleton, M. and Ramsey, D. (2008). Adaptive capacity to climate change and other forces in
Manitoba Agriculture. Journal of Rural and Community Development, 3(2): 47-63.
TEEB (2009). The Economics of Ecosystems and Biodiversity: Responding to the Value of
Nature 2009. Summary for National and International Policy Makers. Turner, W.R.,
Oppenheimer, M. and Wilcove, D.S., 2009. A force to fight global warming. Nature,
462: 278-279.
Thomalla, F., Downing, T., Spanger-Siegfried, E., Han, G. and Rockström, J. (2006).
Reducing hazard vulnerability: towards a common approach between disaster risk
reduction and climate adaptation.
http://www.geo.mtu.edu/volcanoes/06upgrade/Social-
KateG/Attachments%20Used/ReducingVulnerability.pdf. Accessed on 21st
September 2015.
Thomey, M.L., Ford, P.L., Reeves, M.C., Finch, D.M., Litvak, M.E., Collins, S.L. (2014).
Review of climate change impacts on future carbon stores and management of warm
deserts of the United States. Gen. Tech. Rep. RMRS-GTR-316. Fort Collins, CO:

164
U.S. Department of Agriculture, Forest Service, Rocky Mountain Research Station.
26 p.
Thompson, I., Mackey, B., McNulty, S., Mosseler, A. (2009). Forest Resilience,
Biodiversity, and Climate Change. A synthesis of the biodiversity/resilience/stability
relationship in forest ecosystems. Secretariat of the Convention on Biological
Diversity, Montreal. Technical Series no. 43, 67 pages.
Thornton, P.K. and Herrero, M. (2010). Potential for reduced methane and carbon dioxide
emissions from livestock and pasture management in the tropics. PNAS, 107: 19667–
19672.
Torri, S.I., Corrêa, R.S. and Renella, G. (2014). Soil carbon sequestration resulting from
biosolids application,” Applied and Environmental Soil Science, vol. 2014, Article ID
821768, 9 pages, 2014.
Tubiello, F.N. and van der Velde, M. (2004). Land and water use options for climate change
adaptation and mitigation in agriculture. SOLAW Background Thematic Report-
TR04A. GET-Carbon, New York, USA.
Ubuoh, A., Egbe, C.A, Ogbuji, S. and Onifade, S. (2012). Potentials of domestic rainwater
harvesting in akwa ibom state, Nigeria using supply side approach. J. Envir. Sci.
Resour. Manag., 4: 1-9.
UNEP (2009).The role of ecosystem management in climate change adaptation and disaster
risk reduction. Issues Paper prepared for the Global Platform for Disaster Risk
Reduction, June 2009.
http://www.preventionweb.net/files/9685_UNEPissuespaperonecosysmgmtCCADRR
.pdf. Accessed on 8th October 2015.
Venkanna, K., Mandal, U.K., Raju, A.J.S., Sharma, K.L., Adake, R.V., Pushpanjali, Reddy,
B.S., Masane, R.N., Venkatravamma, K. and Babu, B.P. (2014). Carbon stocks in
major soil types and land-use systems in semiarid tropical region of southern India.
Current Science, 106: 604-611.
Venkateswarlu, B. (2009). Climate change and sustainable agriculture: securing the small
and marginal farmer in India. The Human Impact of Climate Change: Policy Notes
for Parliamentarians. CLRA: New Delhi.
Venkateswarlu, B. (2010). Climate change: adaptation and mitigation strategies for rainfed
agriculture. The 21st Dr. S.P. Roy memorial lecture, at Birsa Agriculture University
Ranchi, Jharkhand on 25th September, 2010.
165
Venkateswarlu, B. and Shanker, A.K. (2009). Climate change and agriculture: adaptation and
mitigation strategies. Indian J. Agron., 54: 226-230.
Verchot, L.V., Van Noordwijk, M., Kandji, S., Tomich, T., Ong, C., Albrecht, A.,
Mackensen, J., Bantilan, C., Anumpama, K.V. and Palm, C. (2007). Climate change:
linking adaptation and mitigation through agroforestry. Mitigation and Adaption
Strategies for Global Change, 12: 901-918.
Virginia L. Jin, Kenneth N. Potter, Mari-Vaughn V. Johnson, R. Daren Harmel, and Jeffrey
G. Arnold, (2015). Surface-applied biosolids enhance soil organic carbon and
nitrogen stocks but have contrasting effects on soil physical quality. Applied and
Environmental Soil Science, vol. 2015, Article ID 715916, 10 pages, 2015.
doi:10.1155/2015/715916.
Vohland, K. and Barry, B. (2009). A review of in situ rainwater harvesting (RWH) practices
modifying landscape functions in African drylands. Agric., Ecos. Envir., 134: 119-
127.
Vom Brocke, K., Christinck, A., Weltzien, R.E., Presterl, R.T. and Geiger, H. H. (2003).
Farmers’ seed systems and management practices determine pearl millet genetic
diversity patterns in semiarid regions of India. Crop Science, 43: 1680–1689.
von L̈utzow , M. and K̈ogel -Knabner, I.. (2009). Temperature sensitivity of soil organic
matter decomposition-what do we know? Biol. Fert. Soils, 46: 1-15.
Walkley, A and I.A. Black (1934). An examination of the Degtiareff method for determining
soil organic matter and proposed modification of the chromic acid titration method.
Soil Sci., 63: 29-38.
Wang, G., Welham, C., Feng, C., Chen, L. and Cao, Fuliang (2015). Enhanced soil carbon
storage under agroforestry and afforestation in subtropical China. Forests 2015, 6,
2307-2323; doi:10.3390/f6072307.
Weiss, H., Courty, M.-A., Wetterstrom, W., Guichard, F., Senior, L., Meadow, R., Curnow,
A. (1993). The genesis and collapse of third millennium north Mesopotamian
civilization, Science, 261: 995-1004.
Westoby, M., Walker, B. and Noymeir, I. (1989). Opportunistic management for rangelands
not at equilibrium. Journal of Range Management, 42: 266-274.
Whitmore, A.P. (2001). Impact of Livestock on Soil.
http://agriculture.de/acms1/conf6/ws4lives.htm. Accessed on 5th November 2015.
Woznicki, S.A., Nejadhashemi, A.P. and Parsinejad, M. (2015). Climate change and
166
irrigation demand: Uncertainty and adaptation. Journal of Hydrology: Regional
Studies, 3: 247-264.
Xie, L., Lewis, S., Auffhammer, M. and Berck, P. (2014). Crop adaptation to climate
change.
http://www.vatt.fi/file/torstaiseminaari%20paperit/2014/berck_seminar_paper1.pdf.
Accessed on 31st October 2015.
Yadao, R. and Sharma, K.C. (2015). A study of irrigation, cropping pattern and ground water
scenario in Viratnagar Tehsil (Rajasthan, India). Global Journal for Research
Analysis, 4(2): 96-99.
York, P. (2013). The Environmental Impacts of Intensive Livestock Operations in Canada.
http://scienceforpeace.ca/the-environmental- impacts-of- intensive- livestock-
operations-in-canada. Accessed on 6th November 2015.
Zhang, G., Dong, J., Zhou, C., Xu, X., Wang, M., Ouyang, H. and Xiao, X. (2013).
Increasing cropping intensity in response to climate warming in Tibetan Plateau,
China. Field Crop. Res., 142: 36-46
Zhang, L., Wang, H., Zou, J., Rogers, W.E. and Siemann, E. (2014). Non-native plant litter
enhances soil carbon dioxide emissions in an invaded annual grassland. PLoS ONE
9(3): e92301. doi:10.1371/journal.pone.0092301.
Zhang, L.H., 1∗, Xie, Z.K., Zhao, R. and Wang, Y.J. (2012). The impact of land use change
on soil organic carbon and labile organic carbon stocks in the Longzhong region of
Loess Plateau. Journal of Arid Land, 4(3): 241-250
Zhang, W., Liu, K., Wang, J., Shao, X., Xu, M., Li, J., Wang, X. and Murphy, D.V. (2015).
Relative contribution of maize and external manure amendment to soil carbon
sequestration in a long-term intensive maize cropping system. Scientific Reports 5,
Article number: 10791, doi:10.1038/srep10791.
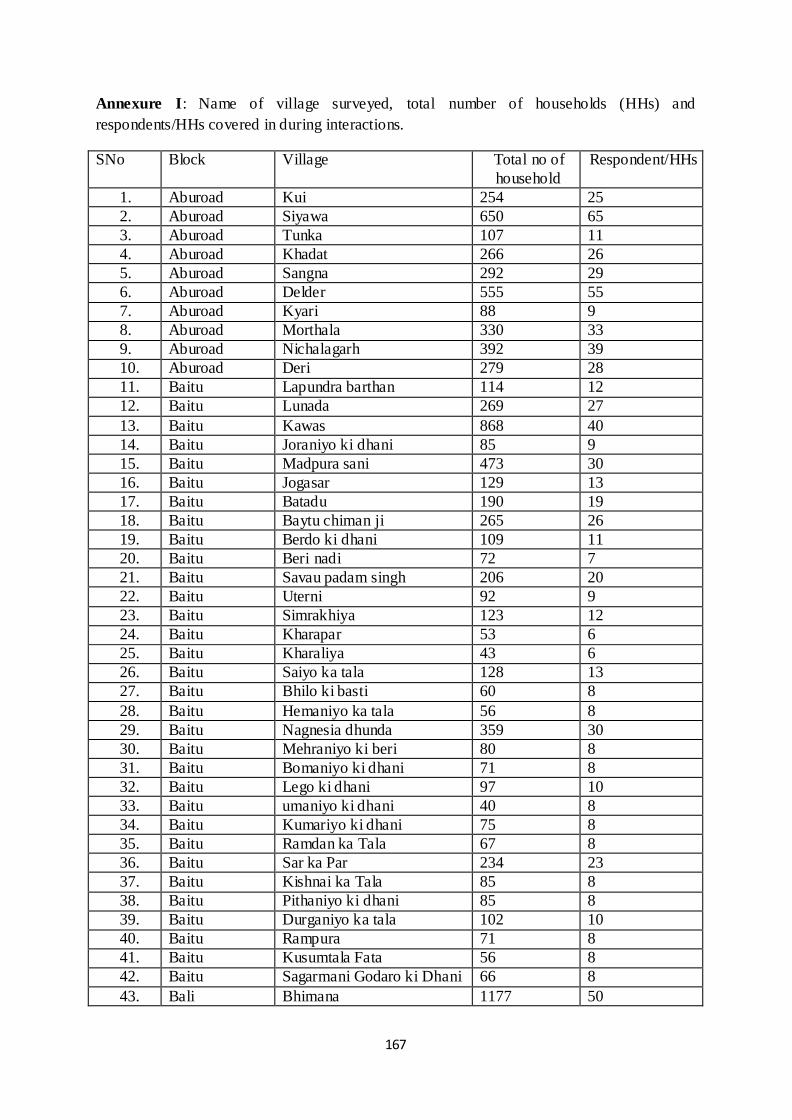
167
Annexure I: Name of village surveyed, total number of households (HHs) and respondents/HHs covered in during interactions.
SNo Block Village Total no of household
Respondent/HHs
1. Aburoad Kui 254 25 2. Aburoad Siyawa 650 65 3. Aburoad Tunka 107 11 4. Aburoad Khadat 266 26 5. Aburoad Sangna 292 29 6. Aburoad Delder 555 55 7. Aburoad Kyari 88 9 8. Aburoad Morthala 330 33 9. Aburoad Nichalagarh 392 39 10. Aburoad Deri 279 28 11. Baitu Lapundra barthan 114 12 12. Baitu Lunada 269 27 13. Baitu Kawas 868 40 14. Baitu Joraniyo ki dhani 85 9 15. Baitu Madpura sani 473 30 16. Baitu Jogasar 129 13 17. Baitu Batadu 190 19 18. Baitu Baytu chiman ji 265 26 19. Baitu Berdo ki dhani 109 11 20. Baitu Beri nadi 72 7 21. Baitu Savau padam singh 206 20 22. Baitu Uterni 92 9 23. Baitu Simrakhiya 123 12 24. Baitu Kharapar 53 6 25. Baitu Kharaliya 43 6 26. Baitu Saiyo ka tala 128 13 27. Baitu Bhilo ki basti 60 8 28. Baitu Hemaniyo ka tala 56 8 29. Baitu Nagnesia dhunda 359 30 30. Baitu Mehraniyo ki beri 80 8 31. Baitu Bomaniyo ki dhani 71 8 32. Baitu Lego ki dhani 97 10 33. Baitu umaniyo ki dhani 40 8 34. Baitu Kumariyo ki dhani 75 8 35. Baitu Ramdan ka Tala 67 8 36. Baitu Sar ka Par 234 23 37. Baitu Kishnai ka Tala 85 8 38. Baitu Pithaniyo ki dhani 85 8 39. Baitu Durganiyo ka tala 102 10 40. Baitu Rampura 71 8 41. Baitu Kusumtala Fata 56 8 42. Baitu Sagarmani Godaro ki Dhani 66 8 43. Bali Bhimana 1177 50

168
44. Bali Nana 1904 80 45. Bali Koyalwav 841 42 46. Bali Gordhanpura 327 32 47. Bali Kuran 387 38 48. Bali Kheterlai 275 27 49. Bali Bothara 170 17 50. Bali Kundal 330 33 51. Bali Kotiwara 139 14 52. Baap Raneri 195 19 53. Baap Kanasariya 69 7 54. Baap Naneu 673 50 55. Baap Jambeshawar Nagri 84 8 56. Baap Jambha 191 19 57. Baap Jaiseri 73 7 58. Baap Rampura 73 7 59. Baap Singhda 319 31 60. Baap Masala 42 6 61. Baap Amarpura 67 7 62. Baap Tekra 329 32 63. Baap Anoopnagar 78 8 64. Baap Jambha ki Dhani 565 40 65. Baap Jhadasar 82 8 66. Sanchor Chora 698 50 67. Sanchor Sarnau 583 50 68. Sanchor Choti virol 350 35 69. Sanchor Panchala 541 40 70. Sanchor Hadetar 406 40 71. Sanchor Sankad 724 40 72. Sanchor Gundau 687 50 73. Sanchor Pamana 586 40 74. Sanchor Medajagir 438 43 75. Sanchor Arnay 906 50 76. Sanchor Data 359 35 77. Sanchor Pathmeda 54 6 78. Sanchor Sediya 342 34 79. Sanchor Raghunathpura 62 6 80. Sanchor Teetop 322 32 81. Sanchor Badi virol 261 26 82. Sanchor Pratapgarh 62 6 83. Sankara Jhalaria 241 24 84. Sankara Lawa 382 38 85. Sankara Phalsund 556 40 86. Sankara Balusingh ki dhani 79 8 87. Sankara Padroda 129 12 88. Sankara Rajmathai 369 36 89. Sankara Bheekhodai 144 14 90. Sankara Chandni 137 13 91. Sankara Lathi 452 45

169
92. Sankara Bhensda 322 32 93. Sankara Unjala 327 32 94. Sankara Chenpura 157 16 95. Sankara Badlimanda 107 10 96. Sankara Bhurjgarh 64 7 97. Sankara Rampura 99 10 98. Sankara Balad 194 19 99. Sankara Sankra 566 30 100. Sankara Chacha 172 17 101. Sankara Kesulapana 165 16 102. Sankara Indranagar 222 22

170
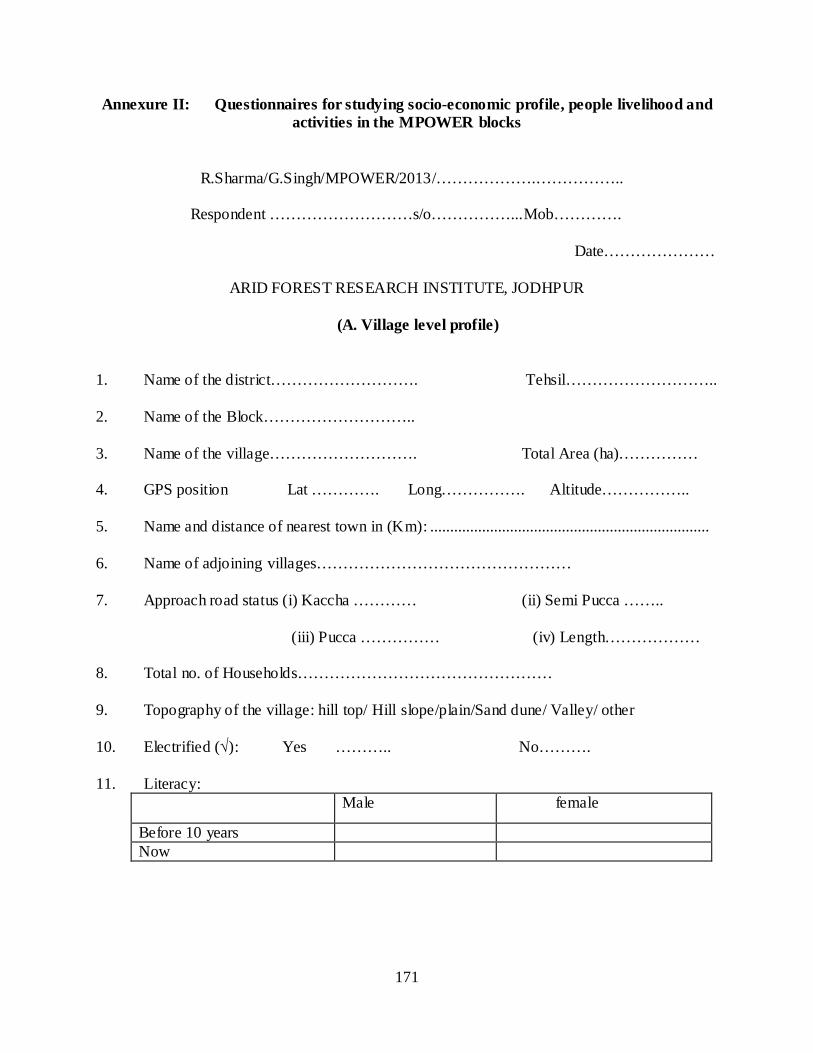
171
Annexure II: Questionnaires for studying socio-economic profile, people livelihood and activities in the MPOWER blocks
R.Sharma/G.Singh/MPOWER/2013/……………….……………..
Respondent ………………………s/o……………...Mob…………. Date…………………
ARID FOREST RESEARCH INSTITUTE, JODHPUR
(A. Village level profile)
1. Name of the district………………………. Tehsil……………………….. 2. Name of the Block……………………….. 3. Name of the village………………………. Total Area (ha)…………… 4. GPS position Lat …………. Long……………. Altitude…………….. 5. Name and distance of nearest town in (Km): ...................................................................... 6. Name of adjoining villages………………………………………… 7. Approach road status (i) Kaccha ………… (ii) Semi Pucca …….. (iii) Pucca …………… (iv) Length……………… 8. Total no. of Households………………………………………… 9. Topography of the village: hill top/ Hill slope/plain/Sand dune/ Valley/ other 10. Electrified (√): Yes ……….. No………. 11. Literacy:
Male female
Before 10 years Now
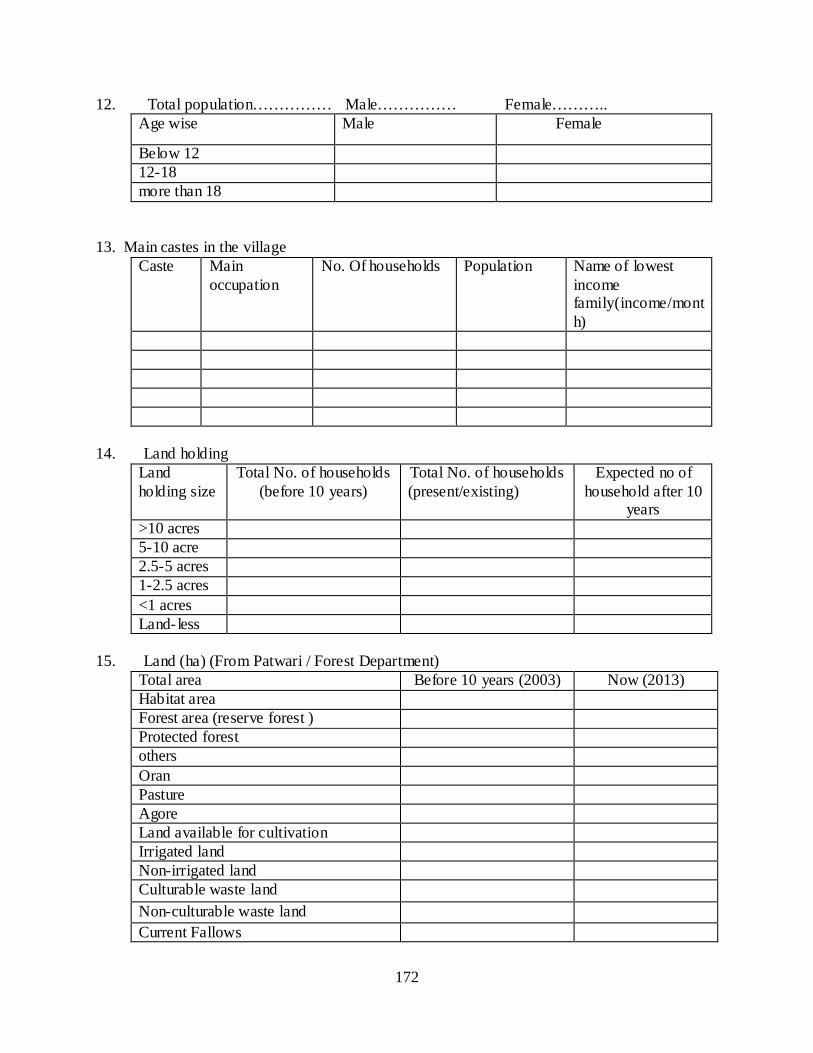
172
12. Total population…………… Male…………… Female………..
13. Main castes in the village
Caste Main occupation
No. Of households Population Name of lowest income family(income/month)
14. Land holding
Land holding size
Total No. of households (before 10 years)
Total No. of households (present/existing)
Expected no of household after 10
years >10 acres 5-10 acre 2.5-5 acres 1-2.5 acres <1 acres Land- less
15. Land (ha) (From Patwari / Forest Department)
Age wise Male Female
Below 12 12-18 more than 18
Total area Before 10 years (2003) Now (2013) Habitat area Forest area (reserve forest ) Protected forest others Oran Pasture Agore Land available for cultivation Irrigated land Non-irrigated land Culturable waste land Non-culturable waste land Current Fallows

173
16. Major occupation in the region
Sex Agriculture Services MGNEREGS MPOWER Livestock/dairy Others Male Female Total
17. Which type of occupation exist in the village
SNo. Type of work Total no. of involved people Total income (Rs/month) Male Female Total
1. Basket making 2. Rope making 3. Broom making 4. Bamboo work 5. Lac cultivation 6. Handicraft work 7.
18. Whether the water availability is satisfactory in general: Yes…….. No……….
If yes, sources are: a) Poor quality (Y/N) b) Inadequate (Y/N) c) Distant sources (Y/N) d) Others(Y/N)
19. Water quality: Semi Saline ………………… Saline…………………….
Semi Alkaline………………. Alkaline………………….. Fluoride availability………....
20. Drinking water facilities in the village sources Before 10 years Present Sources distance Quantity Sources distance Quantity Well Canal Tube well pond Govt. tube well
Fallow lands other than current fallows Permanent pastures and other Grazing lands
wasteland Horticulture / Scrub land Total land area (ha)

174
21. Sources of irrigation in the village
SNo. Source of Irrigation Area Irrigated (Hectares) Before 10 years Present
1 Canals 2 Talab 3 Well & Tube Well 4 Anicut 5 Others
Total 22. Agricultural production
SN. Crops Before 10 years Present Area (ha) Production (kg) Area (Ha) Production (kg)
A Kharif 1 Pearl millet(bajra) 2 Sorgham(jvar) 3 Guar gum 4 Maize(makka) 5 Sesame(til) 6 Groundnut 7 8 B Rabi 1 Wheat 2 Mustard 3 Cumin seed 4 5 6 7 10 C Jaid Rabi 1 Cucumber 2 Musk melon 3 Water melon 4 Bitter guard 5 6
23. Livestock population in the village.
SNo. Types 2003 2013 No. income No. income 1 Cattle 2 Buffaloes 3 Sheep

175
4 Goats 5 Horses 6 Mules 7 Donkeys 8 Camels 9 Pigs 10 Rabits 11 Total Live Stock 12 Others
24. Employment generation at village level in any project
Type of wage Yes/No Wages Remarks Grass sowing/ Plantation Soil working Protection and Maintenance Grass harvesting Others if any
25. Ongoing/completed Government/panchayat Programmes in the village
26. Benefits accrued under MPOWER project
SNo Programme Type of work
Year Local agency
Status Total no. of Employed villagers
Wages (Rs/month)
1 2 3 4 5
SNo. Types of activities Present 1. Employment generation (no. of villagers) 2. Increase in irrigated area 3. Pasture improvement/ fodder availability 4. Availability of water 5. Fuel wood availability 6. Increase in crop production 7. Crop diversification 8. 9.

176
Name of village…………................ ARID FOREST RESEARCH INSTITUTE, JODHPUR
(B. household schedule)
Note: Select one BPL/ST/SC/ Women participant/ Lower income group and one higher income participant in the village. 1. Head of household…………………. Father’s name…………………… 2. Caste: (1) SC….…….. (2) ST …………… (3) OBC………….. (4) GEN…………… 3. Do you have BPL Card ? (√): Yes / No 4. Family details:
5. Employment status of family members
6. Which type of occupation exist in the village
S. No. Type of work Total no. of involved people Total income (Rs/month) Male Female Total
1. Basket making 2. Rope making 3. Broom making 4. Bamboo work 5. Handicraft work 7. Others (if any) 8.
Class Male Female Children Total Number Illiterate <8 class 8-12 class >12
S. No. Employment No. of days employed in a month
No. of months employed in a year
Place of work
Monthly income
1. Farmer 2. Agr. Labour 3. Skilled labour 4. Unskilled labour 5. Factory labour 6. Factory employee 7. Govt. servant 8. Animal husbandry

177
5. Type of house (√): 1. Kachha (mud)…… 2. Pucca (brick)….. 3. Semi pucca(stone)….. 6. Electrification (√): yes…………. No……. 7. Drinking water facilities used by household
8. Months of the water shortage…………………………………… 9. Distance and name of the sources during scarcity period
SNo Sources Distance
10. Ground water level (1) Before 10 years………………………… (2) Now …………………………………… 11. Average annual rainfall for the last ten years (2001-02 to 2012-13):
SNo. Rating Years Extent of severity
crop yield (low, good, very good)
1 Very good Rainfall (25% more than the average)
2 Good Rainfall (10-25% more than the average)
3 Average Rainfall 4 Below Average Rainfall
(20% below average)
5 Severe draught (shortage more than 20% below average)
12. Household wise Fuel use pattern
Source well Hand pump
Any other(river, pond, nallah, tap)
Distance from water sources
Own Public Neighbor
Fuel used for cooking and lighting
Before 10 years (no.) Now Future 10 years
Gas Cow dung Fuel wood(species)
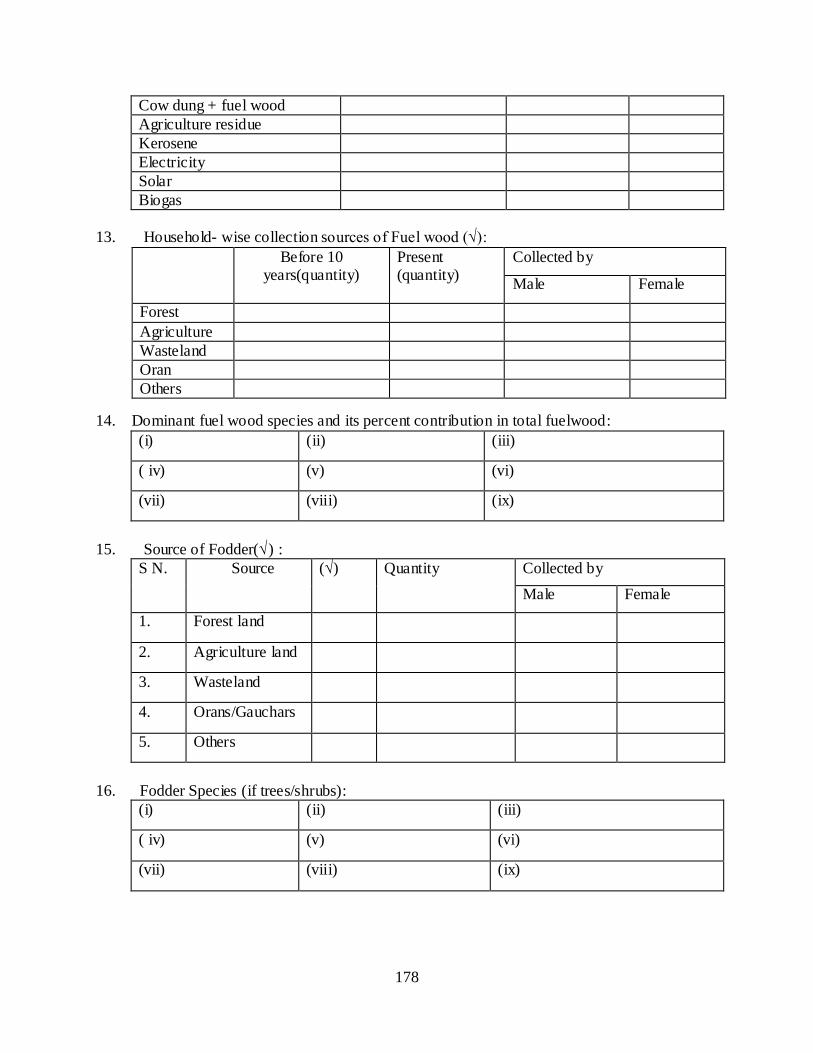
178
13. Household- wise collection sources of Fuel wood (√): 14. Dominant fuel wood species and its percent contribution in total fuelwood:
15. Source of Fodder(√) :
16. Fodder Species (if trees/shrubs):
Cow dung + fuel wood Agriculture residue Kerosene Electricity Solar Biogas
Before 10 years(quantity)
Present (quantity)
Collected by
Male Female
Forest Agriculture Wasteland Oran Others
(i) (ii) (iii)
( iv) (v) (vi)
(vii) (viii) (ix)
S N. Source (√) Quantity Collected by Male Female
1. Forest land
2. Agriculture land
3. Wasteland
4. Orans/Gauchars
5. Others
(i) (ii) (iii)
( iv) (v) (vi)
(vii) (viii) (ix)

179
17. Use of equipment in Agriculture(√):
18. Assets (numbers):
19. Cattle population
20. Income from milk production
21. Total land area for cultivation:
22. Crop varieties:
(i) Plough-Ox (ii) Solar energy (iii) Tractor
( iv) Fodder Machine (v) Harvesting machine (vi) Pump set
(vii) Thrasher machine (ix) Others
Tractor Diesel pump set cart Thresher Bicycle Any other Electric pump set
Motor bike
Details No. Fodder consumption/day(kg)
Grazing(no.) Place of grazing
Buffaloes Cow Bullocks Sheep/goat others
Type of cattle
Total milk production/day(litres)
Sold externally(litres) income
Buffalo Cow Other
Before 10 years present Total land area for cultivation Net irrigated land Un irrigated land
SN. Crops Before 10 years Present
1. 2. 3. 4. 5. 6.

180
22. Crops grown
23. Sources of irrigation
24.1 Are you paying for irrigated water: yes…… no….. 24.2 if yes, how much you pay for irrigation water in a year? Rs…………../year 24.3 Are you hiring pumpset for irrigation: yes……….no 24.4 if yes, rent/day? Rs…………../day 24.5 Number of days hired in a year……………..days. 25. Types of cooking devices in use (No.)
Crops Before 10 years Present Selling (Rs/quintal)
Area (ha)
Production (quintal)
Area (ha)
Production (quintal)
Market price
Support price (govt)
Rabi
Kharif
Summer
SN. Sources of irrigation Before 10 years
Present Irrigated area
Before 10 years
Present
1. Own bore well 2. Other farmer’s bore well 3. Canal 4. Khul from dam 5. 6.

181
Mud chullah………… keosene stove……… Lpg stove……... Biogas……… 26. Fuel consumption summer(s), winter(w)
27. Time consumed in fuel wood collection
28. Number of employed persons in different programmes including MPOWER.
29. Assets developed under MPOWER project
Fuel consumption per day Cooking Lighting S W S W
Dung cake(kg) Wood(kg) Crop residue(kg) LPG(cylinders/month) Kerosene(liters/month) other
Fuel type Source of collection
No. of person Total collection (kg/day)
No of days in a month
No of month in a year M F C
Wood dung
Programmes No of employed persons
No of days in a month
Income/month
MNERAGA MPOWER Others 1 2 3 4 5
S.No. Before 10 years Present 1. Employment generation (no. of villagers) 2. Increase in irrigated area 3. Pasture improvement/ fodder availability 4. Availability of water 5. Fuel wood availability 6. Increase in crop production 7. Increase in fuel wood availability 8.

182
30. Types of benefits obtained/provided under MPOWER project
31. Have you changed your crops then before? If yes. (a) Types of crops are cultivated at present………………………………………………. (b) Why is it cultivated…………………………………………..
32. Are you aware about climate change? (a) Yes (b) No If yes , then what are the measures taken to nullify the effects of climate change
1…………………………………. 2………………………………………… 3………………………………………… 4………………………………………… 5………………………………………..
33. In what ways MPOWER programme is beneficial to you? 34. What is your view about MPOWER projects?
S.No. Present 1. Employment generation (no. of villagers) 2. Land development 3. Pasture development 4. Availability of water under irrigation 5. Increase in crop production 6. Increase in fuel wood availability 7. Any others 8.
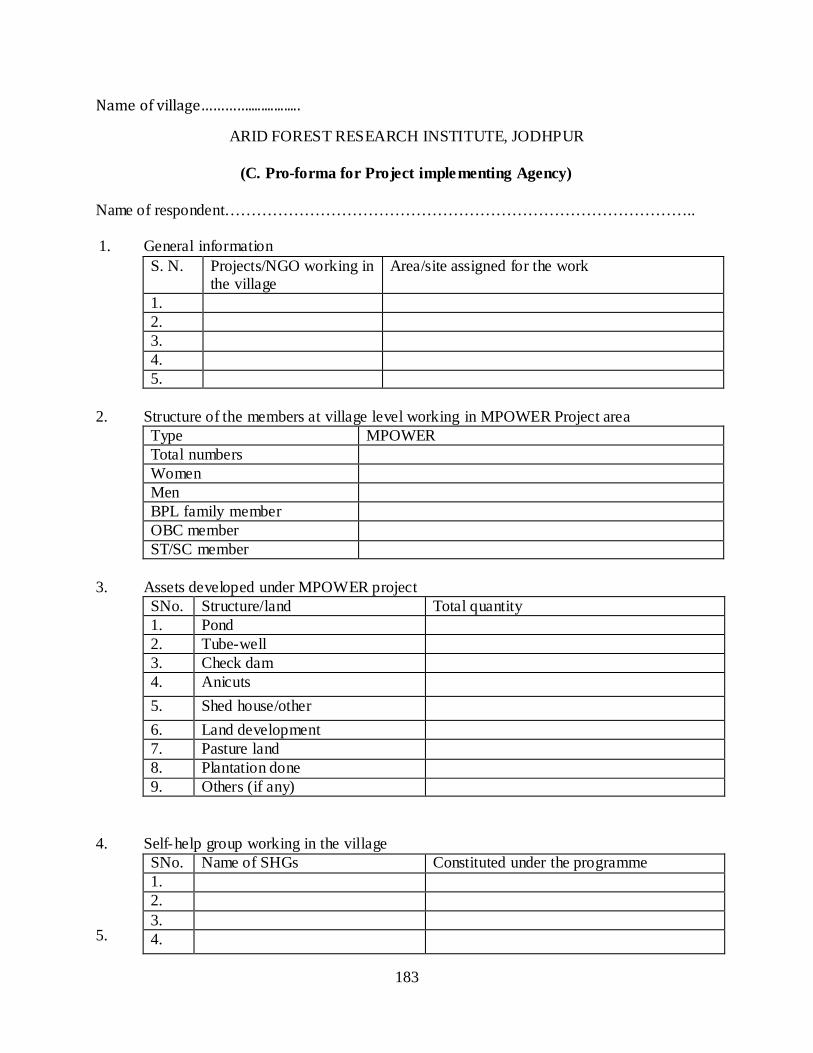
183
Name of village…………................
ARID FOREST RESEARCH INSTITUTE, JODHPUR
(C. Pro-forma for Project implementing Agency) Name of respondent…………………………………………………………………………….. 1. General information
S. N. Projects/NGO working in the village
Area/site assigned for the work
1. 2. 3. 4. 5.
2. Structure of the members at village level working in MPOWER Project area
Type MPOWER Total numbers Women Men BPL family member OBC member ST/SC member
3. Assets developed under MPOWER project 4. Self-help group working in the village 5.
SNo. Structure/land Total quantity 1. Pond 2. Tube-well 3. Check dam 4. Anicuts 5. Shed house/other 6. Land development 7. Pasture land 8. Plantation done 9. Others (if any)
SNo. Name of SHGs Constituted under the programme 1. 2. 3. 4.

184
Different activities carrying out under MPWER project SN. Activities Total quantity (nos./area/volume) 1. Plantations 2. Dairy development 3. Pasture Development 4. Rainwater harvesting Checkdam Pond Bunding 5. Irrigation facilities 6. Seed distribution 7. Others if any 8.
6. Employment generation in different activities at village level in any project
Type of wage Yes/No Wages (nos.) Remarks Plantations /shelterbelt Dairy development Pasture Development Rainwater harvesting
Checkdam Pond Bunding Anicut Others
Irrigation facilities Other soil & water conservation measures
Others if any 7. Types of support from the project-implementing agency
Types Yes/No Details Financial Technical Training/exposure visits Inputs for plantation activities Providing tree seedlings Providing seeds of vegetatble Market linkages Linkages with banks Others if any
8. Trainings provided and number of trainees under MPOWER project
SNo. Types of training Nos. of trainees 1.

185
9. Benefits of trainings provided under MPOWER project 10. Types of crops growing in the area of MPOWER project 11. Ecological benefits
SNo. Activities Yes/No (%/absolute increase/decrease)
1. Reduction in pond siltation
2. 3. 4. 5. 6.
SNo. Types of training Nos. of trainees engaged so far and income generated from it
1. 2. 3. 4. 5. 6.
SNo. Before project implementation
Present
Kharif Crop 1. Bajra 2. Jowar 3. Gwar 4. Mung 5. Others (if any) Rabi Crop 1. Wheat 2. 3. 4. 5. Jayad (if any) 1. 2. 3.

186
2. Reduction in soil erosion 3. Increase in water table 4. Increase in water availability time 5. Increase in agriculture under irrigation 6. Increase in irrigation facilities 7. Improvement in vegetation status 8. Number of seedlings planted in house
/pond premises
9. 12. Other benefits under MPOWER project
SNo. Before project implementation
Present
1. Through employment generation 2. Increase in irrigated area 3. Pasture development/ fodder
availability
4. Time involve in water collection 5. Increase in fuel wood availability Time involve in fuel wood
collection
6. Increase in crop production 7. Change in crop pattern 8. Plantation done (if any) 9. Increase in milk producing animals 10. Increase in self help groups 11. Numbers of trained personals
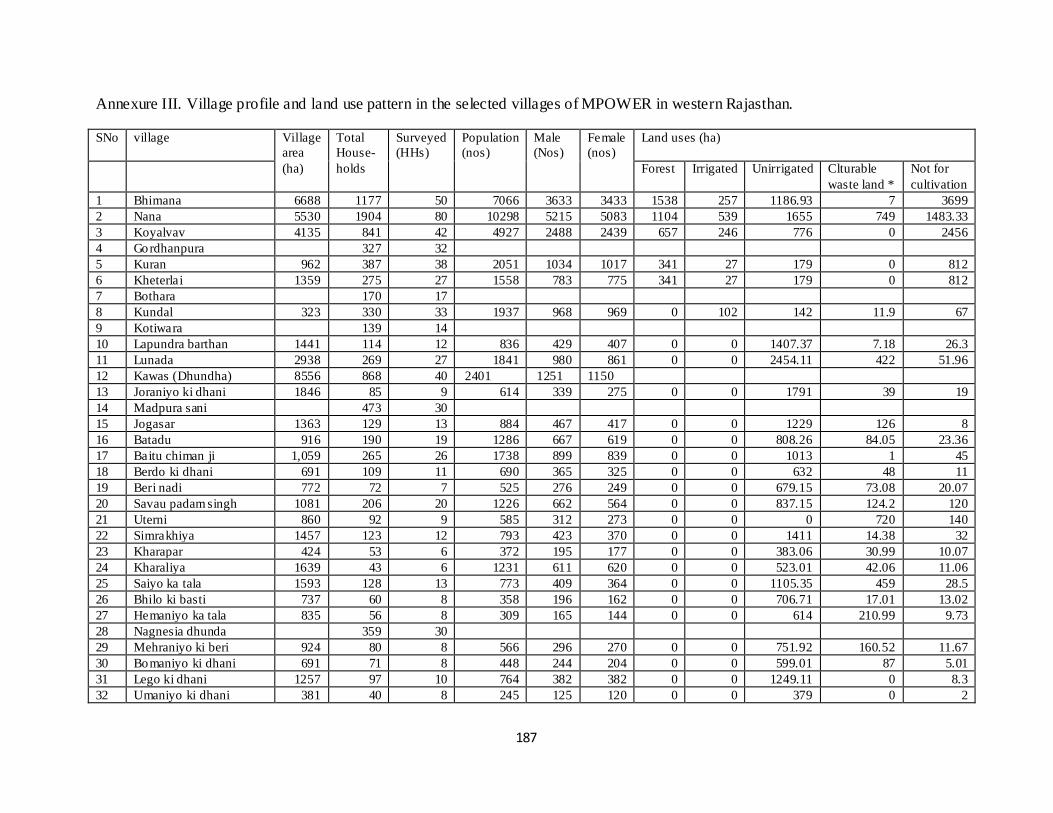
187
Annexure III. Village profile and land use pattern in the selected villages of MPOWER in western Rajasthan.
SNo village Village area (ha)
Total House-holds
Surveyed (HHs)
Population (nos)
Male (Nos)
Female (nos)
Land uses (ha)
Forest Irrigated Unirrigated Clturable waste land *
Not for cultivation
1 Bhimana 6688 1177 50 7066 3633 3433 1538 257 1186.93 7 3699 2 Nana 5530 1904 80 10298 5215 5083 1104 539 1655 749 1483.33 3 Koyalvav 4135 841 42 4927 2488 2439 657 246 776 0 2456 4 Gordhanpura 327 32 5 Kuran 962 387 38 2051 1034 1017 341 27 179 0 812 6 Kheterlai 1359 275 27 1558 783 775 341 27 179 0 812 7 Bothara 170 17 8 Kundal 323 330 33 1937 968 969 0 102 142 11.9 67 9 Kotiwara 139 14 10 Lapundra barthan 1441 114 12 836 429 407 0 0 1407.37 7.18 26.3 11 Lunada 2938 269 27 1841 980 861 0 0 2454.11 422 51.96 12 Kawas (Dhundha) 8556 868 40 2401 1251 1150 13 Joraniyo ki dhani 1846 85 9 614 339 275 0 0 1791 39 19 14 Madpura sani 473 30 15 Jogasar 1363 129 13 884 467 417 0 0 1229 126 8 16 Batadu 916 190 19 1286 667 619 0 0 808.26 84.05 23.36 17 Baitu chiman ji 1,059 265 26 1738 899 839 0 0 1013 1 45 18 Berdo ki dhani 691 109 11 690 365 325 0 0 632 48 11 19 Beri nadi 772 72 7 525 276 249 0 0 679.15 73.08 20.07 20 Savau padam singh 1081 206 20 1226 662 564 0 0 837.15 124.2 120 21 Uterni 860 92 9 585 312 273 0 0 0 720 140 22 Simrakhiya 1457 123 12 793 423 370 0 0 1411 14.38 32 23 Kharapar 424 53 6 372 195 177 0 0 383.06 30.99 10.07 24 Kharaliya 1639 43 6 1231 611 620 0 0 523.01 42.06 11.06 25 Saiyo ka tala 1593 128 13 773 409 364 0 0 1105.35 459 28.5 26 Bhilo ki basti 737 60 8 358 196 162 0 0 706.71 17.01 13.02 27 Hemaniyo ka tala 835 56 8 309 165 144 0 0 614 210.99 9.73 28 Nagnesia dhunda 359 30 29 Mehraniyo ki beri 924 80 8 566 296 270 0 0 751.92 160.52 11.67 30 Bomaniyo ki dhani 691 71 8 448 244 204 0 0 599.01 87 5.01 31 Lego ki dhani 1257 97 10 764 382 382 0 0 1249.11 0 8.3 32 Umaniyo ki dhani 381 40 8 245 125 120 0 0 379 0 2

188
33 Kumariyo ki dhani 683 75 8 483 253 230 0 0 632 28.8 21.8 34 Ramdan ka tala 1194 67 8 464 252 212 0 0 817.94 365.56 10.98 35 Sar ka par 1362 234 23 1528 802 726 40.6 2 36 Kishnai ka tala 849 85 8 594 308 286 0 0 619.55 215 14.03 37 Pithaniyo ki dhani 1038 85 8 577 298 279 0 0 980.22 52.18 5.56 38 Durganiyo ka tala 1096 102 10 630 334 296 0 0 910.28 178 8.16 39 Rampura 556 71 8 439 230 209 0 0 514.39 40 1.57 40 Kusumtala fata 1583 56 8 366 181 185 0 0 1433.15 124 26 41 Sagarmani godaro ki
dhani 1014 66 8 472 242 230 0 0 1003 0 11
42 Kui 667 254 25 1587 774 813 352.48 45 176 24 70 43 Siyawa 1828 650 65 3721 1877 1844 931 118 242 141 396 44 Tunka 342 107 11 609 295 314 123.02 63.6 30 35.68 89.7 45 Khadat 487 266 26 1448 745 703 112.78 140.98 64 81 88 46 Sangna 769 292 29 1689 872 817 441 48 115 165 0 47 Delder 1471 555 55 2829 1456 1373 632.1 297.1 262.1 158.5 121.1 48 Kyari 771 88 9 473 229 244 656 34 43 0 38 49 Morthala 283 330 33 1478 831 647 0 48 115 0 120 50 Nichalagarh 1652 392 39 2264 1191 1073 1234 71 187 0 160 51 Deri 2706 279 28 1671 853 818 2390 29 153 0 134 52 Chora 2727 698 50 4837 2530 2307 0 1668 707 196 156 53 Sarnau 2331 583 50 3838 1970 1868 0 1133 889 9 300 54 Virol Chhoti 1656 350 35 2471 1279 1192 0 870 608 126 52 55 Panchala 1804 541 40 3674 1899 1775 0 1438 213 72 81 56 Hadetar 1390 406 40 2853 1442 1411 0 752 494 39 105 57 Sankad 2974 724 40 5339 2767 2572 0 1553 1168 103 150 58 Gundau 3489 687 50 4488 2209 2279 0 179 2744 0 566 59 Pamana 2688 586 40 3989 2106 1883 0 1651 584 349 104 60 Medajagir 1833 438 43 3177 1644 1533 0 1104 301 221 207 61 Arnay 3988 906 50 6008 3059 2949 0 472.2 3126.97 169.05 220.12 62 Data 1657 359 35 2325 1208 1117 0 726.47 808.28 0 122.25 63 Pathmeda 158 54 6 465 244 221 0 139 0 16 3 64 Sediya 1227 342 34 2352 1169 1183 0 417 745 0 65 65 Raghunathpura 502 62 6 454 213 241 0 0 455 12 35 66 Teetop 1421 322 32 2468 1269 1199 0 820 350 91 160 67 Virol Bad i 1341 261 26 1695 846 849 0 588 692 30 31 68 Pratappura 755 62 6 1242 631 611 0 418 0 169 168 69 Raneri 3549 195 19 1223 643 580 0 0 1401.04 1261.7 886.03 70 Kanasariya 1325 69 7 513 264 249 0 0 1124.19 187 14
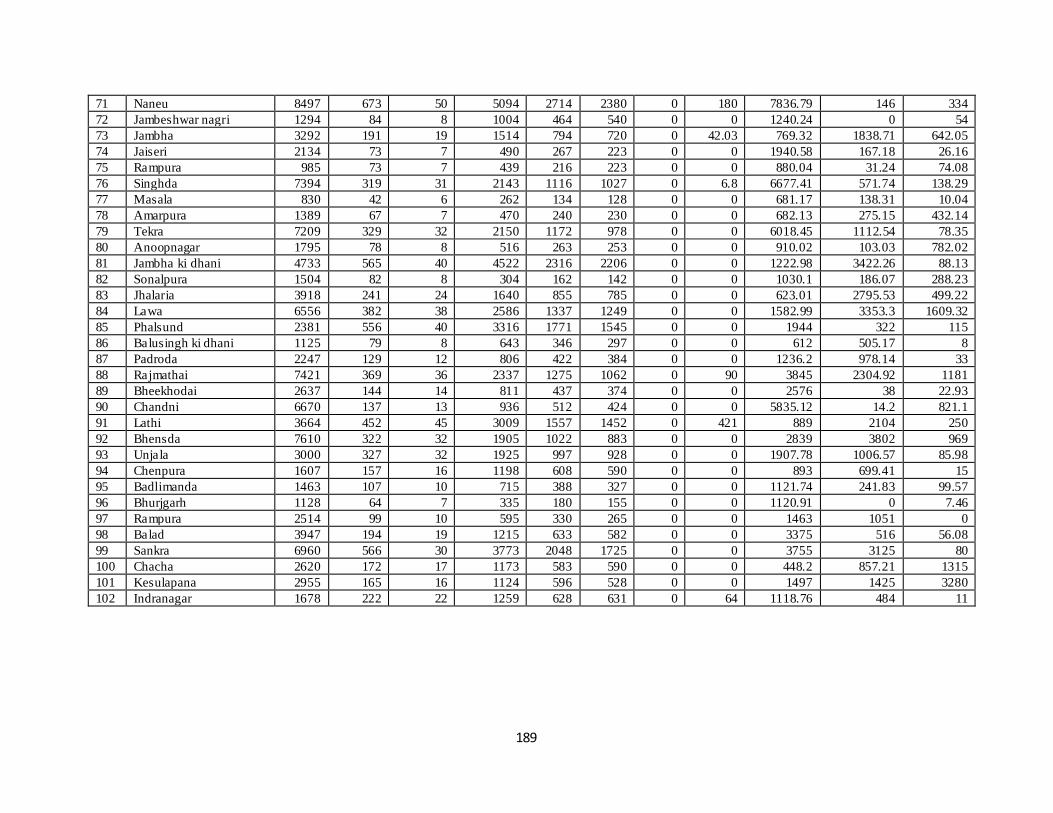
189
71 Naneu 8497 673 50 5094 2714 2380 0 180 7836.79 146 334 72 Jambeshwar nagri 1294 84 8 1004 464 540 0 0 1240.24 0 54 73 Jambha 3292 191 19 1514 794 720 0 42.03 769.32 1838.71 642.05 74 Jaiseri 2134 73 7 490 267 223 0 0 1940.58 167.18 26.16 75 Rampura 985 73 7 439 216 223 0 0 880.04 31.24 74.08 76 Singhda 7394 319 31 2143 1116 1027 0 6.8 6677.41 571.74 138.29 77 Masala 830 42 6 262 134 128 0 0 681.17 138.31 10.04 78 Amarpura 1389 67 7 470 240 230 0 0 682.13 275.15 432.14 79 Tekra 7209 329 32 2150 1172 978 0 0 6018.45 1112.54 78.35 80 Anoopnagar 1795 78 8 516 263 253 0 0 910.02 103.03 782.02 81 Jambha ki dhani 4733 565 40 4522 2316 2206 0 0 1222.98 3422.26 88.13 82 Sonalpura 1504 82 8 304 162 142 0 0 1030.1 186.07 288.23 83 Jhalaria 3918 241 24 1640 855 785 0 0 623.01 2795.53 499.22 84 Lawa 6556 382 38 2586 1337 1249 0 0 1582.99 3353.3 1609.32 85 Phalsund 2381 556 40 3316 1771 1545 0 0 1944 322 115 86 Balusingh ki dhani 1125 79 8 643 346 297 0 0 612 505.17 8 87 Padroda 2247 129 12 806 422 384 0 0 1236.2 978.14 33 88 Rajmathai 7421 369 36 2337 1275 1062 0 90 3845 2304.92 1181 89 Bheekhodai 2637 144 14 811 437 374 0 0 2576 38 22.93 90 Chandni 6670 137 13 936 512 424 0 0 5835.12 14.2 821.1 91 Lathi 3664 452 45 3009 1557 1452 0 421 889 2104 250 92 Bhensda 7610 322 32 1905 1022 883 0 0 2839 3802 969 93 Unjala 3000 327 32 1925 997 928 0 0 1907.78 1006.57 85.98 94 Chenpura 1607 157 16 1198 608 590 0 0 893 699.41 15 95 Badlimanda 1463 107 10 715 388 327 0 0 1121.74 241.83 99.57 96 Bhurjgarh 1128 64 7 335 180 155 0 0 1120.91 0 7.46 97 Rampura 2514 99 10 595 330 265 0 0 1463 1051 0 98 Balad 3947 194 19 1215 633 582 0 0 3375 516 56.08 99 Sankra 6960 566 30 3773 2048 1725 0 0 3755 3125 80 100 Chacha 2620 172 17 1173 583 590 0 0 448.2 857.21 1315 101 Kesulapana 2955 165 16 1124 596 528 0 0 1497 1425 3280 102 Indranagar 1678 222 22 1259 628 631 0 64 1118.76 484 11

190
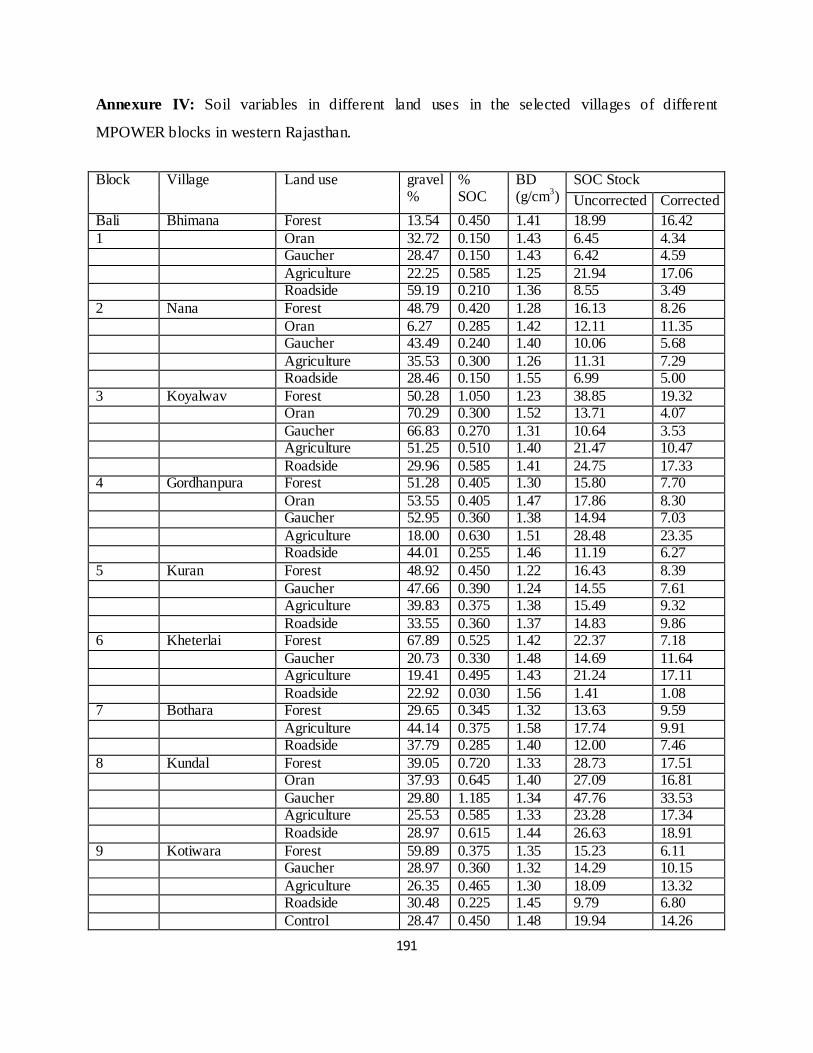
191
Annexure IV: Soil variables in different land uses in the selected villages of different
MPOWER blocks in western Rajasthan.
Block Village Land use gravel
% % SOC
BD (g/cm3)
SOC Stock Uncorrected Corrected
Bali Bhimana Forest 13.54 0.450 1.41 18.99 16.42 1 Oran 32.72 0.150 1.43 6.45 4.34 Gaucher 28.47 0.150 1.43 6.42 4.59 Agriculture 22.25 0.585 1.25 21.94 17.06 Roadside 59.19 0.210 1.36 8.55 3.49 2 Nana Forest 48.79 0.420 1.28 16.13 8.26 Oran 6.27 0.285 1.42 12.11 11.35 Gaucher 43.49 0.240 1.40 10.06 5.68 Agriculture 35.53 0.300 1.26 11.31 7.29 Roadside 28.46 0.150 1.55 6.99 5.00 3 Koyalwav Forest 50.28 1.050 1.23 38.85 19.32 Oran 70.29 0.300 1.52 13.71 4.07 Gaucher 66.83 0.270 1.31 10.64 3.53 Agriculture 51.25 0.510 1.40 21.47 10.47 Roadside 29.96 0.585 1.41 24.75 17.33 4 Gordhanpura Forest 51.28 0.405 1.30 15.80 7.70 Oran 53.55 0.405 1.47 17.86 8.30 Gaucher 52.95 0.360 1.38 14.94 7.03 Agriculture 18.00 0.630 1.51 28.48 23.35 Roadside 44.01 0.255 1.46 11.19 6.27 5 Kuran Forest 48.92 0.450 1.22 16.43 8.39 Gaucher 47.66 0.390 1.24 14.55 7.61 Agriculture 39.83 0.375 1.38 15.49 9.32 Roadside 33.55 0.360 1.37 14.83 9.86 6 Kheterlai Forest 67.89 0.525 1.42 22.37 7.18 Gaucher 20.73 0.330 1.48 14.69 11.64 Agriculture 19.41 0.495 1.43 21.24 17.11 Roadside 22.92 0.030 1.56 1.41 1.08 7 Bothara Forest 29.65 0.345 1.32 13.63 9.59 Agriculture 44.14 0.375 1.58 17.74 9.91 Roadside 37.79 0.285 1.40 12.00 7.46 8 Kundal Forest 39.05 0.720 1.33 28.73 17.51 Oran 37.93 0.645 1.40 27.09 16.81 Gaucher 29.80 1.185 1.34 47.76 33.53 Agriculture 25.53 0.585 1.33 23.28 17.34 Roadside 28.97 0.615 1.44 26.63 18.91 9 Kotiwara Forest 59.89 0.375 1.35 15.23 6.11 Gaucher 28.97 0.360 1.32 14.29 10.15 Agriculture 26.35 0.465 1.30 18.09 13.32 Roadside 30.48 0.225 1.45 9.79 6.80 Control 28.47 0.450 1.48 19.94 14.26

192
Baitu Lapundra barthan
Forest 2.14 0.060 1.48 2.66 2.61 10 Oran 14.73 0.060 1.46 2.63 2.24 Gaucher 2.14 0.060 1.52 2.73 2.67 Agriculture 0.68 0.120 1.42 5.12 5.09 Roadside 3.05 0.000 1.34 0.00 0.00 11 Lunada Oran 17.14 0.105 1.53 4.81 3.98 Agriculture 0.89 0.090 1.52 4.10 4.06 Roadside 8.40 0.080 1.60 3.83 3.51 12 Kawas Gaucher 10.70 0.210 1.48 9.32 8.33 Agriculture 0.95 0.105 1.45 4.57 4.52 Roadside 18.07 0.110 1.48 4.88 4.00 13 Joraniyo ki dhani Gaucher 2.77 0.060 1.41 2.54 2.47 Agriculture 0.13 0.075 1.42 3.20 3.19 Roadside 3.44 0.015 1.46 0.66 0.63 14 Madpura sani Gaucher 28.61 0.075 1.52 3.42 2.44 Agriculture 3.53 0.060 1.50 2.70 2.60 Roadside 4.46 0.015 1.38 0.62 0.59 15 Jogasar Oran 2.56 0.015 1.27 0.57 0.56 Gaucher 0.11 0.075 1.31 2.94 2.94 Agriculture 0.36 0.090 1.37 3.71 3.69 Roadside 1.40 0.070 1.43 3.01 2.97 16 Batadu Forest 9.87 0.030 1.34 1.21 1.09 Oran 6.59 0.030 1.50 1.35 1.26 Gaucher 1.78 0.075 1.50 3.38 3.31 Agriculture 0.02 0.090 1.52 4.10 4.09 Roadside 0.70 0.060 1.52 2.73 2.71 17 Baytu chiman ji Gaucher 1.68 0.030 1.47 1.33 1.30 Agriculture 0.52 0.180 1.47 7.94 7.90 Roadside 19.98 0.015 1.49 0.67 0.54 18 Berdo ki dhani Gaucher 0.52 0.060 1.39 2.50 2.48 Agriculture 0.40 0.090 1.38 3.72 3.70 Roadside 5.39 0.015 1.41 0.63 0.60 19 Beri nadi Gaucher 3.60 0.165 1.55 7.67 7.40 Agriculture 1.85 0.045 1.49 2.02 1.98 Roadside 3.22 0.015 1.46 0.66 0.64 20 Savau padam
singh Oran 2.04 0.030 1.50 1.35 1.32
Gaucher 0.44 0.015 1.52 0.68 0.68 Agriculture 1.37 0.150 1.51 6.80 6.70 Roadside 1.27 0.012 1.50 0.54 0.53 21 Uterni Oran 2.00 0.090 1.46 3.93 3.85 Gaucher 2.31 0.105 1.51 4.77 4.66 Agriculture 0.27 0.030 1.45 1.30 1.30 Roadside 2.07 0.150 1.44 6.47 6.33 22 Simrakhiya Gaucher 1.18 0.015 1.55 0.70 0.69 Agriculture 0.15 0.030 1.41 1.27 1.26 Roadside 3.89 0.045 1.32 1.78 1.71 23 Kharapar Oran 0.93 0.030 1.50 1.35 1.33

193
Gaucher 5.46 0.030 1.47 1.33 1.25 Agriculture 3.50 0.150 1.43 6.42 6.20 Roadside 1.58 0.015 1.51 0.68 0.67 24 Kharaliya Gaucher 0.45 0.060 1.47 2.64 2.63 Agriculture 0.21 0.075 1.47 3.30 3.29 Roadside 4.72 0.150 1.41 6.36 6.06 25 Saiyo ka tala Gaucher 0.43 0.015 1.38 0.62 0.62 Agriculture 1.73 0.075 1.42 3.19 3.13 Roadside 2.04 0.015 1.52 0.69 0.67 26 Bhilo ki basti Gaucher 0.41 0.075 1.41 3.17 3.16 Agriculture 0.80 0.075 1.40 3.15 3.12 Roadside 0.96 0.090 1.48 4.00 3.96 27 Hemaniyo ka
tala Agriculture 0.83 0.105 1.38 4.36 4.32
Roadside 1.71 0.015 1.43 0.64 0.63 28 Nagnesia dhunda Oran 0.63 0.060 1.54 2.77 2.75 Agriculture 0.23 0.045 1.51 2.04 2.03 Roadside 0.44 0.012 1.45 0.52 0.52 29 Mehraniyo ki
beri Agriculture 2.46 0.060 1.42 2.56 2.49
Roadside 4.61 0.090 1.42 3.83 3.65 30 Bomaniyo ki
dhani Agriculture 3.70 0.075 1.51 3.40 3.27
Roadside 0.45 0.030 1.41 1.27 1.27 31 Lego ki dhani Agriculture 0.89 0.135 1.54 6.25 6.20 Roadside 1.54 0.015 1.43 0.64 0.63 32 Umaniyo ki
dhani Agriculture 0.21 0.090 1.46 3.93 3.92
Roadside 4.34 0.015 1.54 0.69 0.66 33 Kumariyo ki
dhani Agriculture 3.87 0.060 1.50 2.69 2.59
Roadside 1.42 0.015 1.43 0.65 0.64 34 Ramdan ka tala Agriculture 1.01 0.105 1.46 4.59 4.54 Roadside 14.49 0.012 1.49 0.54 0.46 35 Sar ka par Gaucher 17.58 0.060 1.48 2.66 2.19 Agriculture 20.17 0.090 1.48 4.00 3.19 Roadside 14.11 0.030 1.46 1.31 1.13 36 Kishnai ka tala Agriculture 1.21 0.120 1.50 5.41 5.35 Roadside 5.61 0.030 1.42 1.28 1.21 37 Pithaniyo ki
dhani Agriculture 0.63 0.090 1.52 4.10 4.07
Roadside 2.04 0.015 1.43 0.64 0.63 38 Durganiyo ka
tala Agriculture 0.10 0.015 1.43 0.64 0.64
Roadside 0.59 0.030 1.43 1.29 1.28 39 Rampura Agriculture 0.54 0.075 1.50 3.38 3.36 Roadside 2.09 0.030 1.52 1.37 1.34 40 Kusumtala fata Agriculture 1.50 0.120 1.48 5.32 5.24 Roadside 6.50 0.015 1.49 0.67 0.63 41 Sagarmani
godaro ki dhani Agriculture 0.70 0.075 1.54 3.47 3.45
Roadside 0.91 0.015 1.50 0.68 0.67 Control 0.61 0.060 1.50 2.71 2.69 Aburoad Kui Forest 47.86 0.675 1.44 29.16 15.20 42 Oran 36.75 0.705 1.45 30.74 19.44 Gaucher 46.56 0.615 1.44 26.57 14.20
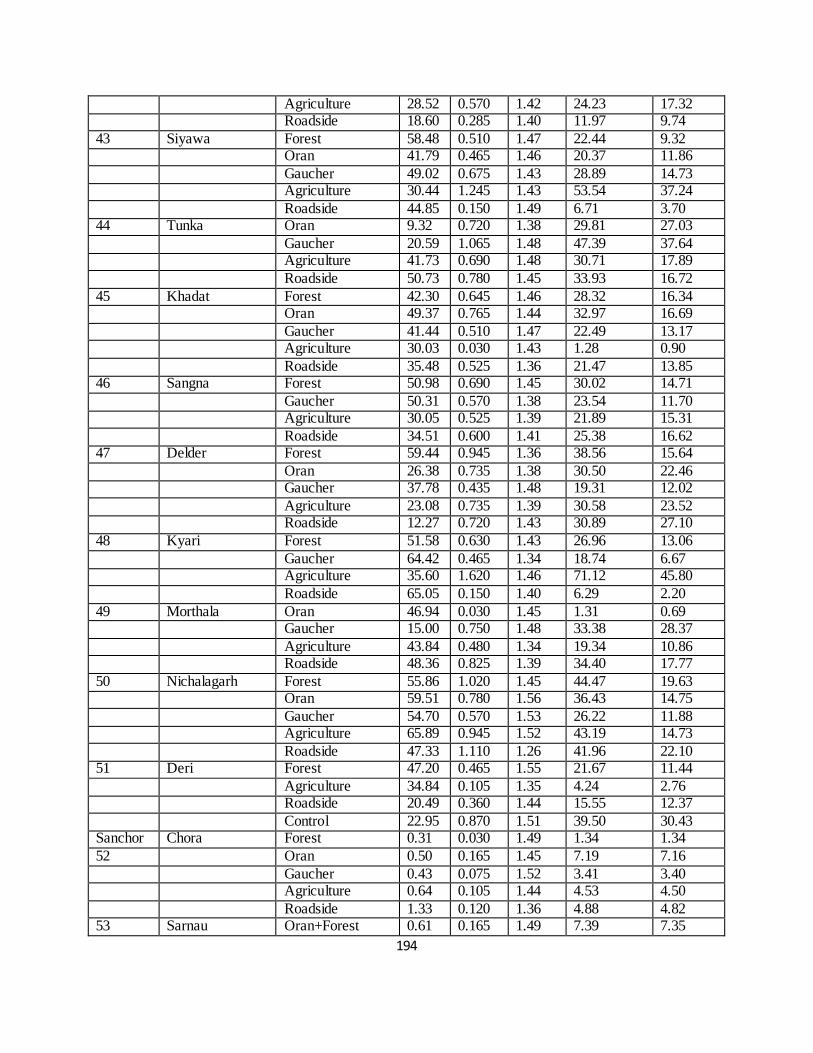
194
Agriculture 28.52 0.570 1.42 24.23 17.32 Roadside 18.60 0.285 1.40 11.97 9.74 43 Siyawa Forest 58.48 0.510 1.47 22.44 9.32 Oran 41.79 0.465 1.46 20.37 11.86 Gaucher 49.02 0.675 1.43 28.89 14.73 Agriculture 30.44 1.245 1.43 53.54 37.24 Roadside 44.85 0.150 1.49 6.71 3.70 44 Tunka Oran 9.32 0.720 1.38 29.81 27.03 Gaucher 20.59 1.065 1.48 47.39 37.64 Agriculture 41.73 0.690 1.48 30.71 17.89 Roadside 50.73 0.780 1.45 33.93 16.72 45 Khadat Forest 42.30 0.645 1.46 28.32 16.34 Oran 49.37 0.765 1.44 32.97 16.69 Gaucher 41.44 0.510 1.47 22.49 13.17 Agriculture 30.03 0.030 1.43 1.28 0.90 Roadside 35.48 0.525 1.36 21.47 13.85 46 Sangna Forest 50.98 0.690 1.45 30.02 14.71 Gaucher 50.31 0.570 1.38 23.54 11.70 Agriculture 30.05 0.525 1.39 21.89 15.31 Roadside 34.51 0.600 1.41 25.38 16.62 47 Delder Forest 59.44 0.945 1.36 38.56 15.64 Oran 26.38 0.735 1.38 30.50 22.46 Gaucher 37.78 0.435 1.48 19.31 12.02 Agriculture 23.08 0.735 1.39 30.58 23.52 Roadside 12.27 0.720 1.43 30.89 27.10 48 Kyari Forest 51.58 0.630 1.43 26.96 13.06 Gaucher 64.42 0.465 1.34 18.74 6.67 Agriculture 35.60 1.620 1.46 71.12 45.80 Roadside 65.05 0.150 1.40 6.29 2.20 49 Morthala Oran 46.94 0.030 1.45 1.31 0.69 Gaucher 15.00 0.750 1.48 33.38 28.37 Agriculture 43.84 0.480 1.34 19.34 10.86 Roadside 48.36 0.825 1.39 34.40 17.77 50 Nichalagarh Forest 55.86 1.020 1.45 44.47 19.63 Oran 59.51 0.780 1.56 36.43 14.75 Gaucher 54.70 0.570 1.53 26.22 11.88 Agriculture 65.89 0.945 1.52 43.19 14.73 Roadside 47.33 1.110 1.26 41.96 22.10 51 Deri Forest 47.20 0.465 1.55 21.67 11.44 Agriculture 34.84 0.105 1.35 4.24 2.76 Roadside 20.49 0.360 1.44 15.55 12.37 Control 22.95 0.870 1.51 39.50 30.43 Sanchor Chora Forest 0.31 0.030 1.49 1.34 1.34 52 Oran 0.50 0.165 1.45 7.19 7.16 Gaucher 0.43 0.075 1.52 3.41 3.40 Agriculture 0.64 0.105 1.44 4.53 4.50 Roadside 1.33 0.120 1.36 4.88 4.82 53 Sarnau Oran+Forest 0.61 0.165 1.49 7.39 7.35
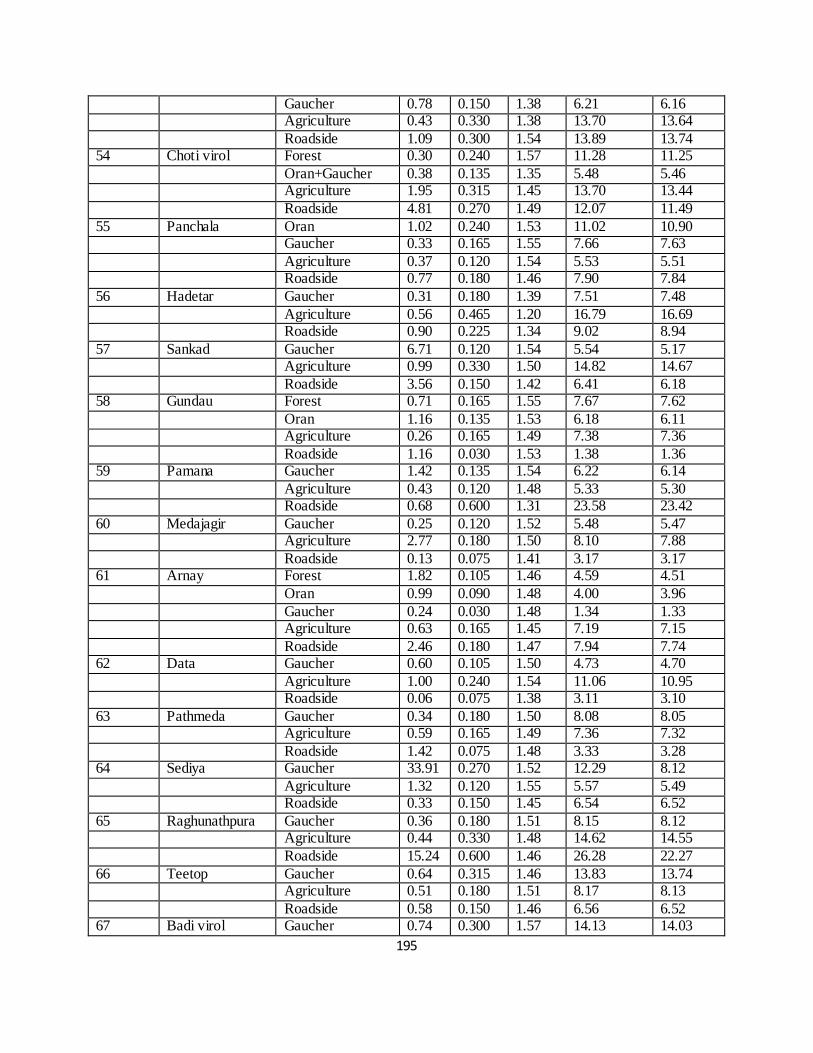
195
Gaucher 0.78 0.150 1.38 6.21 6.16 Agriculture 0.43 0.330 1.38 13.70 13.64 Roadside 1.09 0.300 1.54 13.89 13.74 54 Choti virol Forest 0.30 0.240 1.57 11.28 11.25 Oran+Gaucher 0.38 0.135 1.35 5.48 5.46 Agriculture 1.95 0.315 1.45 13.70 13.44 Roadside 4.81 0.270 1.49 12.07 11.49 55 Panchala Oran 1.02 0.240 1.53 11.02 10.90 Gaucher 0.33 0.165 1.55 7.66 7.63 Agriculture 0.37 0.120 1.54 5.53 5.51 Roadside 0.77 0.180 1.46 7.90 7.84 56 Hadetar Gaucher 0.31 0.180 1.39 7.51 7.48 Agriculture 0.56 0.465 1.20 16.79 16.69 Roadside 0.90 0.225 1.34 9.02 8.94 57 Sankad Gaucher 6.71 0.120 1.54 5.54 5.17 Agriculture 0.99 0.330 1.50 14.82 14.67 Roadside 3.56 0.150 1.42 6.41 6.18 58 Gundau Forest 0.71 0.165 1.55 7.67 7.62 Oran 1.16 0.135 1.53 6.18 6.11 Agriculture 0.26 0.165 1.49 7.38 7.36 Roadside 1.16 0.030 1.53 1.38 1.36 59 Pamana Gaucher 1.42 0.135 1.54 6.22 6.14 Agriculture 0.43 0.120 1.48 5.33 5.30 Roadside 0.68 0.600 1.31 23.58 23.42 60 Medajagir Gaucher 0.25 0.120 1.52 5.48 5.47 Agriculture 2.77 0.180 1.50 8.10 7.88 Roadside 0.13 0.075 1.41 3.17 3.17 61 Arnay Forest 1.82 0.105 1.46 4.59 4.51 Oran 0.99 0.090 1.48 4.00 3.96 Gaucher 0.24 0.030 1.48 1.34 1.33 Agriculture 0.63 0.165 1.45 7.19 7.15 Roadside 2.46 0.180 1.47 7.94 7.74 62 Data Gaucher 0.60 0.105 1.50 4.73 4.70 Agriculture 1.00 0.240 1.54 11.06 10.95 Roadside 0.06 0.075 1.38 3.11 3.10 63 Pathmeda Gaucher 0.34 0.180 1.50 8.08 8.05 Agriculture 0.59 0.165 1.49 7.36 7.32 Roadside 1.42 0.075 1.48 3.33 3.28 64 Sediya Gaucher 33.91 0.270 1.52 12.29 8.12 Agriculture 1.32 0.120 1.55 5.57 5.49 Roadside 0.33 0.150 1.45 6.54 6.52 65 Raghunathpura Gaucher 0.36 0.180 1.51 8.15 8.12 Agriculture 0.44 0.330 1.48 14.62 14.55 Roadside 15.24 0.600 1.46 26.28 22.27 66 Teetop Gaucher 0.64 0.315 1.46 13.83 13.74 Agriculture 0.51 0.180 1.51 8.17 8.13 Roadside 0.58 0.150 1.46 6.56 6.52 67 Badi virol Gaucher 0.74 0.300 1.57 14.13 14.03

196
Agriculture 0.67 0.135 1.51 6.10 6.06 Roadside 1.18 0.225 1.24 8.37 8.27 68 Pratapgarh Gaucher 2.15 0.285 1.46 12.45 12.19 Agriculture 0.93 0.330 1.49 14.75 14.61 Roadside 43.55 0.165 1.46 7.24 4.09 Control 1.82 0.120 1.56 5.62 5.51 Baap Raneri Forest 11.69 0.195 1.57 9.17 8.09 69 Gaucher 1.22 0.105 1.55 4.88 4.82 Agriculture 26.86 0.135 1.55 6.28 4.59 Roadside 8.02 0.295 1.53 13.57 12.48 70 Kanasariya Forest 2.88 0.105 1.53 4.81 4.67 Oran 2.64 0.120 1.57 5.65 5.50 Gaucher 4.15 0.090 1.55 4.18 4.00 Agriculture 0.32 0.060 1.53 2.75 2.74 Roadside 3.92 0.240 1.41 10.18 9.78 71 Naneu Forest 2.13 0.075 1.54 3.46 3.38 Oran 2.12 0.090 1.51 4.08 3.99 Gaucher 1.18 0.120 1.54 5.53 5.47 Agriculture 12.39 0.105 1.48 4.66 4.08 Roadside 8.90 0.135 1.45 5.89 5.36 72 Jambeshwar Forest 0.27 0.090 1.54 4.16 4.15 Gaucher 1.26 0.120 1.55 5.58 5.51 Agriculture 0.94 0.090 1.33 3.59 3.56 Roadside 0.44 0.180 1.43 7.72 7.69 73 Jambha Forest 1.33 0.120 1.56 5.62 5.54 Oran 0.53 0.120 1.56 5.60 5.57 Gaucher 0.61 0.060 1.52 2.73 2.71 Agriculture 6.36 0.120 1.54 5.54 5.19 Roadside 2.10 0.285 1.43 12.23 11.97 74 Jaiseri Gaucher 20.02 0.135 1.54 6.22 4.98 Agriculture 7.59 0.195 1.53 8.95 8.27 Roadside 1.93 0.240 1.42 10.20 10.00 75 Rampura Gaucher 10.41 0.135 1.53 6.18 5.54 Agriculture 39.34 0.165 1.52 7.51 4.55 76 Singhda Oran 43.39 0.045 1.56 2.11 1.19 Agriculture 8.73 0.090 1.50 4.05 3.70 Roadside 1.62 0.165 1.38 6.83 6.72 77 Masala Gaucher 12.52 0.135 1.54 6.25 5.47 Agriculture 0.91 0.270 1.53 12.42 12.31 Roadside 1.13 0.165 1.40 6.95 6.87 78 Amarpura Gaucher 2.65 0.210 1.56 9.81 9.55 Agriculture 0.53 0.075 1.55 3.48 3.46 Roadside 2.11 0.120 1.57 5.64 5.52 79 Tekra Oran 36.32 0.225 1.53 10.31 6.56 Gaucher 5.04 0.135 1.53 6.21 5.90 Agriculture 12.35 0.255 1.55 11.88 10.41 Roadside 1.62 0.165 1.55 7.66 7.53 80 Anoopnagar Gaucher 57.98 0.105 1.56 4.91 2.06
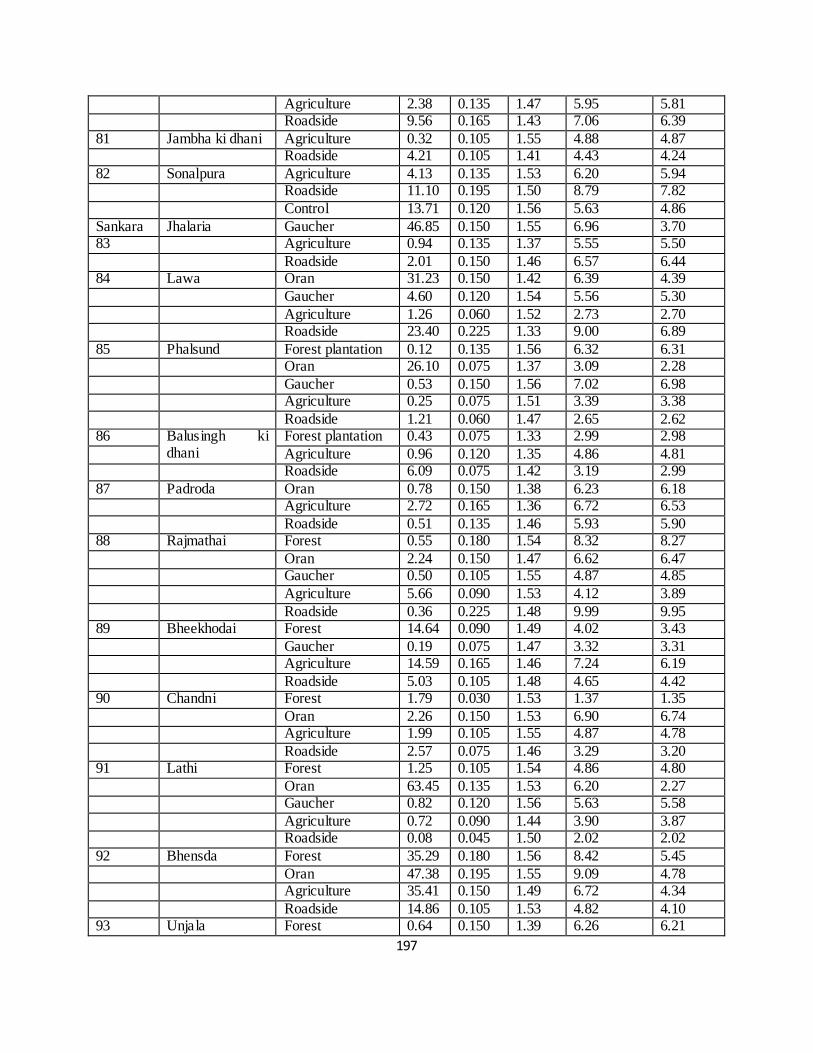
197
Agriculture 2.38 0.135 1.47 5.95 5.81 Roadside 9.56 0.165 1.43 7.06 6.39 81 Jambha ki dhani Agriculture 0.32 0.105 1.55 4.88 4.87 Roadside 4.21 0.105 1.41 4.43 4.24 82 Sonalpura Agriculture 4.13 0.135 1.53 6.20 5.94 Roadside 11.10 0.195 1.50 8.79 7.82 Control 13.71 0.120 1.56 5.63 4.86 Sankara Jhalaria Gaucher 46.85 0.150 1.55 6.96 3.70 83 Agriculture 0.94 0.135 1.37 5.55 5.50 Roadside 2.01 0.150 1.46 6.57 6.44 84 Lawa Oran 31.23 0.150 1.42 6.39 4.39 Gaucher 4.60 0.120 1.54 5.56 5.30 Agriculture 1.26 0.060 1.52 2.73 2.70 Roadside 23.40 0.225 1.33 9.00 6.89 85 Phalsund Forest plantation 0.12 0.135 1.56 6.32 6.31 Oran 26.10 0.075 1.37 3.09 2.28 Gaucher 0.53 0.150 1.56 7.02 6.98 Agriculture 0.25 0.075 1.51 3.39 3.38 Roadside 1.21 0.060 1.47 2.65 2.62 86 Balusingh ki
dhani Forest plantation 0.43 0.075 1.33 2.99 2.98
Agriculture 0.96 0.120 1.35 4.86 4.81 Roadside 6.09 0.075 1.42 3.19 2.99 87 Padroda Oran 0.78 0.150 1.38 6.23 6.18 Agriculture 2.72 0.165 1.36 6.72 6.53 Roadside 0.51 0.135 1.46 5.93 5.90 88 Rajmathai Forest 0.55 0.180 1.54 8.32 8.27 Oran 2.24 0.150 1.47 6.62 6.47 Gaucher 0.50 0.105 1.55 4.87 4.85 Agriculture 5.66 0.090 1.53 4.12 3.89 Roadside 0.36 0.225 1.48 9.99 9.95 89 Bheekhodai Forest 14.64 0.090 1.49 4.02 3.43 Gaucher 0.19 0.075 1.47 3.32 3.31 Agriculture 14.59 0.165 1.46 7.24 6.19 Roadside 5.03 0.105 1.48 4.65 4.42 90 Chandni Forest 1.79 0.030 1.53 1.37 1.35 Oran 2.26 0.150 1.53 6.90 6.74 Agriculture 1.99 0.105 1.55 4.87 4.78 Roadside 2.57 0.075 1.46 3.29 3.20 91 Lathi Forest 1.25 0.105 1.54 4.86 4.80 Oran 63.45 0.135 1.53 6.20 2.27 Gaucher 0.82 0.120 1.56 5.63 5.58 Agriculture 0.72 0.090 1.44 3.90 3.87 Roadside 0.08 0.045 1.50 2.02 2.02 92 Bhensda Forest 35.29 0.180 1.56 8.42 5.45 Oran 47.38 0.195 1.55 9.09 4.78 Agriculture 35.41 0.150 1.49 6.72 4.34 Roadside 14.86 0.105 1.53 4.82 4.10 93 Unjala Forest 0.64 0.150 1.39 6.26 6.21

198
Oran 48.37 0.180 1.41 7.63 3.94 Gaucher 59.03 0.060 1.37 2.46 1.01 Agriculture 20.00 0.150 1.36 6.14 4.91 Roadside 5.33 0.225 1.47 9.90 9.37 94 Chenpura Gaucher 1.08 0.030 1.45 1.31 1.29 Agriculture 8.80 0.075 1.52 3.43 3.13 Roadside 1.38 0.300 1.42 12.81 12.63 95 Badlimanda Forest 43.87 0.135 1.46 5.91 3.32 Agriculture 30.01 0.105 1.52 4.78 3.34 Roadside 19.15 0.270 1.46 11.80 9.54
96 Bhurjgarh Agriculture 0.16 0.090 1.47 3.97 3.96 Roadside 1.97 0.105 1.49 4.70 4.61 97 Rampura Oran 21.75 0.135 1.52 6.16 4.82 Agriculture 19.07 0.150 1.50 6.77 5.47 Roadside 6.64 0.135 1.48 5.99 5.60 98 Balad Forest 0.45 0.075 1.44 3.25 3.23 Gaucher 9.74 0.120 1.49 5.38 4.85 Agriculture 6.31 0.150 1.51 6.81 6.38 Roadside 0.17 0.015 1.41 0.63 0.63 99 Sankra Oran 1.65 0.150 1.52 6.86 6.74 Gaucher 1.65 0.150 1.50 6.77 6.65 Agriculture 0.72 0.120 1.53 5.51 5.47 Roadside 2.08 0.090 1.53 4.14 4.05 100 Chacha Forest 0.99 0.180 1.53 8.24 8.16 Oran 5.31 0.150 1.55 6.99 6.62 Gaucher 1.70 0.150 1.54 6.95 6.83 Agriculture 36.35 0.135 1.53 6.21 3.95 Roadside 0.94 0.135 1.55 6.29 6.23 101 Kesulapana Gaucher 8.22 0.150 1.53 6.89 6.32 Agriculture 0.54 0.090 1.55 4.18 4.15 Roadside 1.30 0.090 1.43 3.87 3.82 102 Indranagar Agriculture 0.48 0.150 1.42 6.38 6.34 Roadside 1.21 0.060 1.49 2.68 2.65 Control 4.70 0.060 1.58 2.84 2.70