studies on the variation of cell dimensions of mullite with iron oxide and titania additions
TRANSCRIPT
X-RAY SPECTROMETRY, VOL. 17, 187-188 (1988)
Studies on the Variation of Cell Dimensions of Mullite with Iron Oxide and Titania Additions
P. Das and R. Choudhury Research and Development Centre for Iron and Steel, Doranda, Ranchi 834 002, India
An analysis has been made of Cameron’s data on the variation of the cell dimensions of mullite for compositions with additions of more than 1.0% of Fe + Ti for samples crystallizing out of the melt phase. It was observed that, depending on the amount of either iron oxide or titania added, the cell dimensions change with respect to changes in cell volume, exhibiting shrinkage along either the b or c cell edges. Increasing amounts of titania appear to influ- ence the c cell edge in preference to the a and b edges. The overall cell symmetry, however, is preserved with a simultaneous increase in the a cell edge with change in the cell volume.
Mullite takes up iron oxide and titania in its lattice to form a solid solution. Gelsdorf et d.,’ using reagent- grade and thoroughly mixed raw materials, showed that 3.0 and 1.5% of FeO and TiOz, respectively, can be taken up by the mullite lattice, causing an expansion of the lattice. Murthy and Hummel’ showed that at 1600°C a maximum of 2.040% of titania and at 1300°C 10.&12.0% of Fe,O, can be absorbed by the lattice, causing increases in the lattice parameters and the cell volume. However, the basic question regarding the specific mechanism by which retention of the orthorhombic cell symmetry is preserved, even after expansion of the lattice, remains unanswered.
We have analysed this problem by utilizing the data published by Cameron4 on the lattice parameters of a series of ironoxide- and titania-containing samples crys- tallized from the melt phase (Table 1). Cameron con- cluded that for pure mullites (containing less than 0.5 wt-”/o of iron oxide and titania) the plot of the a cell edge vs cell volume plot is a straight line whereas those having greater amounts of Fe + Ti lie above the line of best fit. The extent of this difference was approximate as both Fe and Ti exhibits specific effects while bringing about such changes.
Cameron’s data points were analysed as regards the change in the cell parameters 6a, 6b and 6c with respect to the change in cell volume 6V from the simple relationship
V = abc (1)
where V is the cell volume and a, b and c are the cell parameters. It can be deduced that
be(da/dV) + cu(bb/dV) + ab(dc/dV) = 1 (2) and the three unknowns 6a/6V, 6b/GV and 6c/6V can be evaluated forming three sets of equations, containing the three unknowns, from all the reported parameters. An analysis of Cameron’s data indicates that the data points could be divided into two broad groups, having four titania-rich compositions (specimens 2, RB, 7 and 13) containing approximately 1.&1.5% of Fe + Ti and two (specimens 10 and 12) iron oxide-rich compositions containing approximately 1.4-1.5% of Fe + Ti. One specimen (14) contained approximately equal amounts of iron oxide and titania. The other samples were either pure or contained less than 0.1 % of iron oxide.
We analysed those compositions with maximum iron oxide and titania levels and a matrix of 35 sets of equa- tions were solved by use of the inverse matrix. The method was programmed to give values of 6a/6V, 6b/6 V and 6c/6 V .
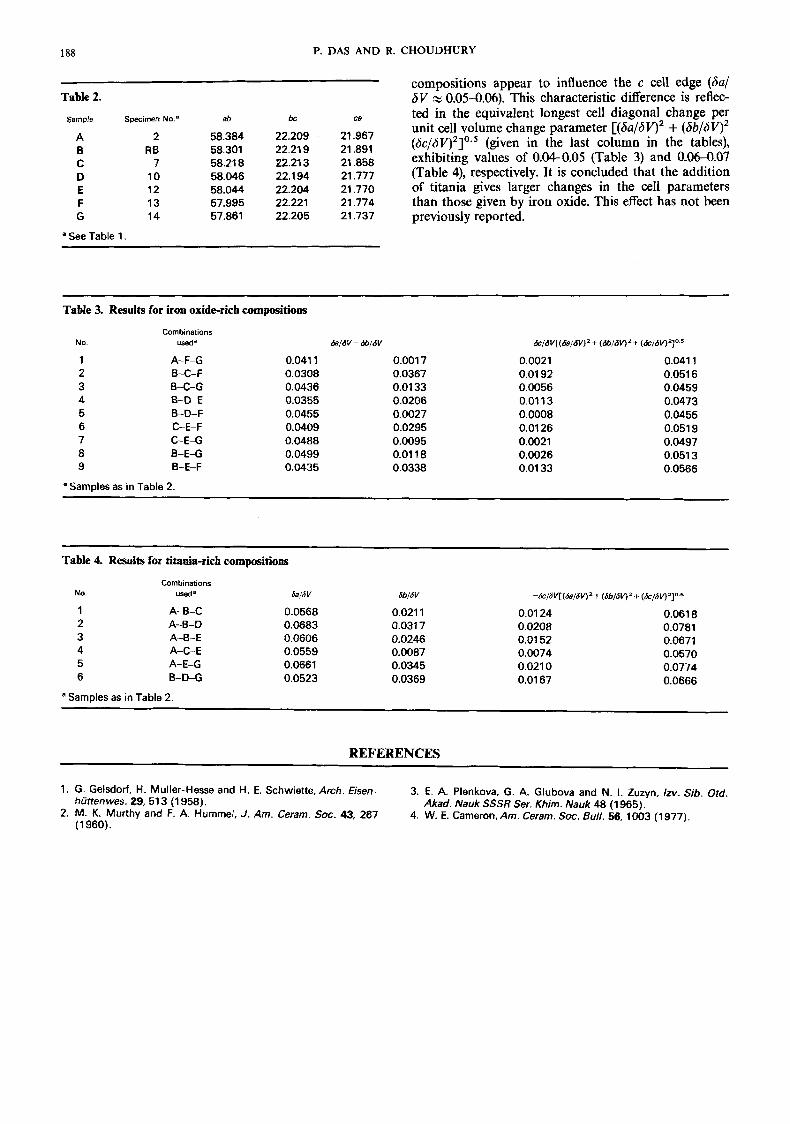
Table 2 gives values of the coefficients associated with the unknown parameters and Tables 3 and 4 give values of 6a/6V, 6b/6V and 6c/6V. Table 3 gives only those values having Sa/SV % 0.03-0.04 and all negative values of 6b/6V, whereas Table 4 gives values with 6a/ 6V % 0.05-0.06 with all negative values of 6c/6V. This is interesting in view of the observation that iron oxide- rich compositions appear preferentially to influence the b cell edge (6a/S V x 0.034.04), whereas the titania-rich
Table 1. Composition and cell dimensions of mullite crystallized from the melt phase4
Specimen No.
2 R 6
7 10 12 13 14
A403
78.7 75.7 73.6 70.7 69.3 68.9 67.6
Composition (wt-%) SIO, TIO,
20.5 1 .o 23.4 1 .o 24.7 1.1 27.8 28.7 0.2 29.5 1 .o 30.6 0.7
-
F e A
0.1 0.1 0.2 1.4 1.4 0.5 0.6
8
7.5992 7.5790 7.5689 7.5469 7.5440 7.5384 7.5260
Cell dimensions (A) b
7.6829 7.6925 7.691 8 7.691 3 7.6941 7.6933 7.6882
c
2.8907 2.8884 2.8879 2.8856 2.8858 2.8884 2.8882
0049-8246/88/050187-02 $05.00 0 1988 by John Wiley & Sons, Ltd.
Received 29 December 1987 Accepted (revised) 9 May 1988
188 P. DAS AND R. CHOUDHURY
Table 2.
Sample Specimen No.’
A 2 0 RB C 7 D 10 E 12 F 13 G 14
a See Table 1
ab
58.384 58.301 58.21 8 58.046 58.044 57.995 57.861
bc
22.209 22.21 9 22.21 3 22.1 94 22.204 22.221 22.205
21.967 21.891 21.858 21.777 21.770 21.774 21.737
compositions appear to influence the c cell edge (ha/ 6V z 0.05-0.06). This characteristic difference is reflec- ted in the equivalent longest cell diagonal change per unit cell volume change parameter [(Sa/SV)’ + (Sb/SV)’ ( ~ c / S V ) ’ ] * . ~ (given in the last column in the tables), exhibiting values of 0.04-0.05 (Table 3) and 0.060.07 (Table 4), respectively. It is concluded that the addition of titania gives larger changes in the cell parameters than those given by iron oxide. This effect has not been previously reported.
Table 3. Results for iron oxide-rich compositioos
No
1 2 3 4 5 6 7 8 9
Combinations Used*
A-F-G 8-C-F 6-C-G 6-0-E B-D-F C-E-F C-E-G 6-E-G B-E-F
0.041 1 0.0308 0.0436 0.0355 0.0455 0.0409 0.0488 0.0499 0.0435
&/6V - &/6V
0.001 7 0.0367 0.01 33 0.0206 0.0027 0.0295 0.0095 0.01 18 0.0338
ac/dV[(aa/dv)2+ (&16U1+ (ac/6v)210.5
0.0021 0.041 1 0.01 92 0.051 6 0.0056 0.0459 0.01 13 0.0473 0.0008 0.0455 0.01 26 0.051 9 0.0021 0.0497 0.0026 0.051 3 0.01 33 0.0566
a Samples as in Table 2.
Table 4. Results for titania-rich compositions
Combinations No. useda &/6V
1 A-B-C 0.0568 2 A-6-D 0.0683 3 A-8-E 0.0606 4 A-C-E 0.0559 5 A-E-G 0.0661 6 B-D-G 0.0523
a Samples as in Table 2.
Sb/W
0.021 1 0.031 7 0.0246 0.0087 0.0345 0.0369
- h ~ / 6 V [ ( d a / S V ) ~ + (Sb/dV)’+ (&/SV)~”.’
0.01 24 0.061 8 0.0208 0.0781 0.01 52 0.0671 0.0074 0.0570 0.021 0 0.0774 0.01 67 0.0666
REFERENCES
1. G. Gelsdorf, H. Muller-Hesse and H. E. Schwiette,Arch. €isen-
2. M. K. Murthy and F. A. Hommel, J. Am. Ceram. SOC. 43, 267
3. E. A. Plenkova, G. A. Glubova and N. 1. Zutyn, Izv. Sib. Otd.
4. W. E. Cameron, Am. Ceram. SOC. Bull. 56, 1003 (1977). huttenwes. 29,513 (1958).
(1960).
Akad. Nauk SSSR Ser. Khim. Nauk 48 (1 965).