studies on vitamin b12 and folate deficiency markers in ...162503/fulltext01.pdf · studies on...
TRANSCRIPT
Comprehensive Summaries of Uppsala Dissertationsfrom the Faculty of Medicine 1242
Studies on Vitamin B12 and FolateDeficiency Markers in the Elderly
A Population-based Study
BY
KARIN BJÖRKEGREN
ACTA UNIVERSITATIS UPSALIENSISUPPSALA 2003
Dissertation to be publicly examined in Rudbeckssalen, Rudbeckslaboraroriet, UppsalaUniversity, on Friday, May, 9, 2003 at 13:15, for the Degree of Doctor of Philosophy (Facultyof Medicine). The examination will be conducted in Swedish.
AbstractBjörkegren, K. 2003. Studies on Vitamin B12 and Folate Deficiency Markers in the Elderly.A Population-based Study. Acta Universitatis Upsaliensis. Comprehensive Summaries ofUppsala Dissertations from the Faculty of Medicine 1242. 45 pp. Uppsala. ISBN91-554-5581-6.
The aims of this study were to document the levels of cobalamin, folate, methylmalonic acid(MMA) and total homocysteine (tHcy) in serum and their relations to symptoms, clinicalfindings, and other factors in order to improve the possibilities of detecting early deficiency ofvitamin B12 or folate, and to study the effects of cobalamin and folic acid treatment over athree-year period.The study population consisted of a 20% random sample of persons 70 years or older living
in Älvkarleby in mid-Sweden. They were invited to a survey and 224 (88.4%) personsresponded. Data were obtained by questionnaire, laboratory investigations and physicalexamination for the period 1993 – 1999.In a multivariate analysis performed at baseline, serum MMA and tHcy were significantly
and independently correlated to age, serum cobalamin, and creatinine levels, and tHcy also tosex and serum folate. Neither serum cobalamin, folate, MMA nor tHcy had any significantcorrelation to haemoglobin or mean red cell volume. Almost half of the study population hadsigns of low tissue levels of vitamin B12 or folate. Among those who took multivitaminpreparations, the proportion was much lower, 25%.Among traditional symptoms and clinical findings that have been linked to vitamin B12 or
folate tissue deficiency, only changes in the tongue mucosa and mouth angle stomatitis weresignificantly associated with abnormal serum folate and tHcy levels. Traditional symptoms ofvitamin deficiency may appear later in the course.69 persons who had laboratory indications of early or overt tissue deficiency of vitamin
B12 or folate and who had no ongoing vitamin treatment were given cobalamin for sixmonths. Those whose MMA or tHcy levels did not normalise were given folic acid in additionto cobalamin. After further treatment for three months, all persons but one had normal levels.The laboratory effect still remained after three years of treatment. There was a tendencytowards improvement of vibration sense, especially in the long nerve paths, and improvementof neurological symptoms and oral mucosa findings.Conclusion: A substantial proportion of elderly persons have laboratory signs of incipient
tissue deficiency of vitamin B12 and folate. Treatment normalises lab parameters and somesymptoms.
Keywords: Cobalamin, folate, MMA, tHcy, multivitamin, symptoms, survey, treatment trial
Karin Björkegren, Department of Public Health and Caring Sciences, Uppsala University,Uppsala Science Park, SE-751 85 Uppsala, Sverige.
© Karin Björkegren 2003
ISSN 0282-7476ISBN 91-554-5581-6URN:NBN:se:uu:diva-3364(http://urn.kb.se/resolve?urn=urn:nbn:se:uu:diva-3364)

Till TorbjörnMin tålmodige och förstående make
Original papers
This thesis is based on the following papers:
1. Björkegren K, Svärdsudd K. Serum cobalamin, folate, methylmalonic acid
and total homocysteine as vitamin B12 and folate tissue deficiency markers
amongst elderly Swedes - a population-based study. J Int Med 2001; 249: 423-
32.*)
2. Björkegren K, Svärdsudd K. Reported symptoms and clinical findings in
relation to serum cobalamin, folate, methylmalonic acid and total homocysteine
among elderly Swedes. A population-based study. Manuscript.
3. Björkegren K, Svärdsudd K. Elevated serum levels of methylmalonic acid
and homocysteine in elderly people. A population-based intervention study. J Int
Med 1999; 246: 603-11.*)
4. Björkegren K, Svärdsudd K. A population-based intervention study on
elevated serum levels of methylmalonic acid and homocysteine in elderly
people. Results after 36 months of follow-up. Manuscript.
Offprints were made with the permission from the publishers.
*) © Blackwell Publishing
Contents
Introduction.....................................................................................................1
Aims of the study............................................................................................3 Study population and methods........................................................................4
Setting........................................................................................................4 Sampling....................................................................................................4 Data collection...........................................................................................6 Statistical analysis......................................................................................7
Results.............................................................................................................8 Characteristics of the study population......................................................8 Haemoglobin, EVF, MCV and creatinine in the study population..........10 Serum cobalamin, folate, MMA and tHcy in the study population .........10 Symptoms and signs in early stages of vitamin B12 or folate deficiency16 The effects of treatment with cobalamin or folic acid .............................16
General discussion ........................................................................................23 Conclusions...................................................................................................33 Acknowledgements.......................................................................................35 References.....................................................................................................36

1
IntroductionElderly people often see their general practitioner with vague symptoms that might be caused by vitamin B12 or folate deficiency. It has been estimated that between 5 and 15% of elderly people might have a vitamin B12 deficiency [1-3] but few population studies on the subject have been presented.
Vitamin B12 is excreted from the liver with the bile. The major part is reabsorbed in the small intestine and enters an enterohepatic cycle. The half-life is two to three years [4], whereas for intracellular folate it is approximately 100 days [5]. This means that a deficiency of vitamin B12 develops slowly whereas a folate deficiency may develop faster.
It has been suggested that the most common causes of vitamin B12 and folate deficiency are inadequate nutrition and malabsorption but lifestyle factors, such as smoking and high alcohol consumption, and certain diseases, drugs and enzyme defects may also affect the metabolism of these vitamins [6-8]. In addition, aging of the intestinal mucosa might cause a lower degree of absorption and reabsorption [6, 9]. Also, the ability to produce gastric acid decreases with age [10], the most common cause of which is atrophic gastritis. Up to 30% of persons above 65 years of age are reported to be affected [11, 12], and Krasinski et al. [13] estimated that the prevalence was as high as 50% among persons aged 70 years or more. The decrease of gastric acid production impairs the absorption of both vitamin B12 and folate.
These conditions may lead to moderate deficiencies of vitamin B12 and folate, which are not detectable by the commonly used laboratory tests, such as serum cobalamin and folate. It is well known that there may be a deficiency of tissue vitamin B12 within the so-called low and normal serum cobalamin range and, vice versa, that subnormal serum cobalamin values may be found without evidence of tissue deficiency [14-17]. Similar conditions apply to serum folate [1, 18].
In 1855 Thomas Addison described mental and neurological symptoms of pernicious anaemia in addition to haematological symptoms, today regarded as the classical vitamin B12 deficiency symptoms together with gastrointestinal symptoms. These classical symptoms usually occur at advanced stages of the deficiency [16, 19]. In the clinical setting, especially in primary health care, the whole panorama of deficiency stages is seen. The advanced stages seldom cause any diagnostic problems. The problem is rather the marginal deficiencies. A number of studies have shown that a slight cognitive impairment might be an early symptom. However, few studies on other possible early signs and symptoms have been published.
2
The implications of these circumstances are that serum cobalamin and folate values may be of limited value in the clinical work-up of patients with suspected early deficiency of tissue-vitamin B12 or tissue-folate who have few and vague symptoms. There is thus a need for better diagnostic tools.
In the last decade, measurement of serum methylmalonic acid (MMA) or serum total homocysteine (tHcy) has been suggested as a better tool to diagnose the deficiency of vitamin B12 or folate. Vitamin B12 is a coenzyme in the conversion of methylmalonyl-CoA to succinyl-CoA. In a situation with deficiency of vitamin B12, methylmalonyl-CoA is converted to MMA rather than to succinyl-CoA [20]. In addition, vitamin B12 is needed to convert Hcy to methionine, which means that serum MMA and tHcy both increase if there is a deficiency of vitamin B12 [21, 22]. Methylenetetrahydrofolate is required for Hcy remethylation to methionine, which means that if there is a deficiency of folate, serum tHcy is accumulated in spite of availability of vitamin B12 [21-23]. Hcy is also remethylated, forming methionine by another reaction, which is dependent on betaine and the enzyme betaine-homocysteine methyl transferase (BHMT) [24, 25]. Finally, there is a correlation between impaired renal function and increased serum MMA and serum tHcy [26-28].
Serum MMA and tHcy are therefore considered to reflect the vitamin B12 and folate status in the tissues better than serum cobalamin and folate levels [21-23, 29, 30]. A reciprocal relationship between serum cobalamin and folate on the one hand and serum MMA and tHcy on the other has been reported [24, 31]. High serum MMA or tHcy levels are often found in the elderly population [1, 3]. Treatment with vitamin cobalamin and folic acid has been shown to reduce the serum MMA and tHcy levels [1, 3, 18, 26, 32] but the effects on symptoms and signs are less clear. There is thus a scarcity of data on the serum cobalamin, folate, tHcy and MMA levels and their interrelationships among elderly people in the general population. Most studies in elderly people are either based on patient groups with unknown representativeness for the general population, or are population-based but with fairly extensive exclusions for various reasons, so that the representativeness of the findings may have been violated. Consequently, comparison of results from various studies may be difficult.
For this reason, we decided to perform a population-based study of elderly persons in a primary health care district in northern Uppsala County in order to study the interrelationships between laboratory measures of potential tissue deficiency of vitamin B12 and folate, reported symptoms and signs found at a physical examination. Moreover, we wanted to study the dynamics in these variables after vitamin cobalamin and folic acid treatment.
3
Aims of the study
The aims of this study were – to document the serum levels of cobalamin, folate, MMA and tHcy and
their relations to other factors in an elderly normal population, in order to estimate the proportion with incipient or overt vitamin B12 and folate tissue deficiency.
– to analyse the occurrence of symptoms or clinical findings in the early stages of vitamin B12 and folate deficiency in a general population sample.
– to study laboratory variables in connection with systematic cobalamin and folic acid treatment in a subset of the survey population with indications of incipient or overt vitamin deficiency.
– to study haematological variables, symptoms and clinical findings in a long-term follow-up after treatment with cobalamin and folic acid.
4
Study population and methods
SettingThe Borough of Älvkarleby is located in the County of Uppsala in mid-Sweden. It contains a number of municipalities surrounded by rural areas. The main municipality is located approximately 160 kilometres north of Stockholm and 100 kilometres northeast of the university city of Uppsala. In 1993-1995 the Borough of Älvkarleby had a population of 9,300 residents. Of these, 1361 (14.6%) were 70 years or older. The corresponding proportion in the national Swedish population was 12.9%. The age and sex distributions in Älvkarleby are close to the national population. The sociodemographic status among those 70 years or older was similar to the corresponding age segment of the Swedish national population [33].
SamplingAll Swedish residents have a unique registration number that includes date of birth, sex and other statistics. These numbers are stored in a population register, which by law has to be kept up to date. From the population register, all persons 70 years old or older, born on dates ending with 3 (i. e. the 3rd, 13th, or 23rd day of each month) and living in the area, were sampled in 1993. Two years later, a new sample, based on dates of birth ending with 4, was drawn. Altogether 266 persons fulfilled the sampling criteria.
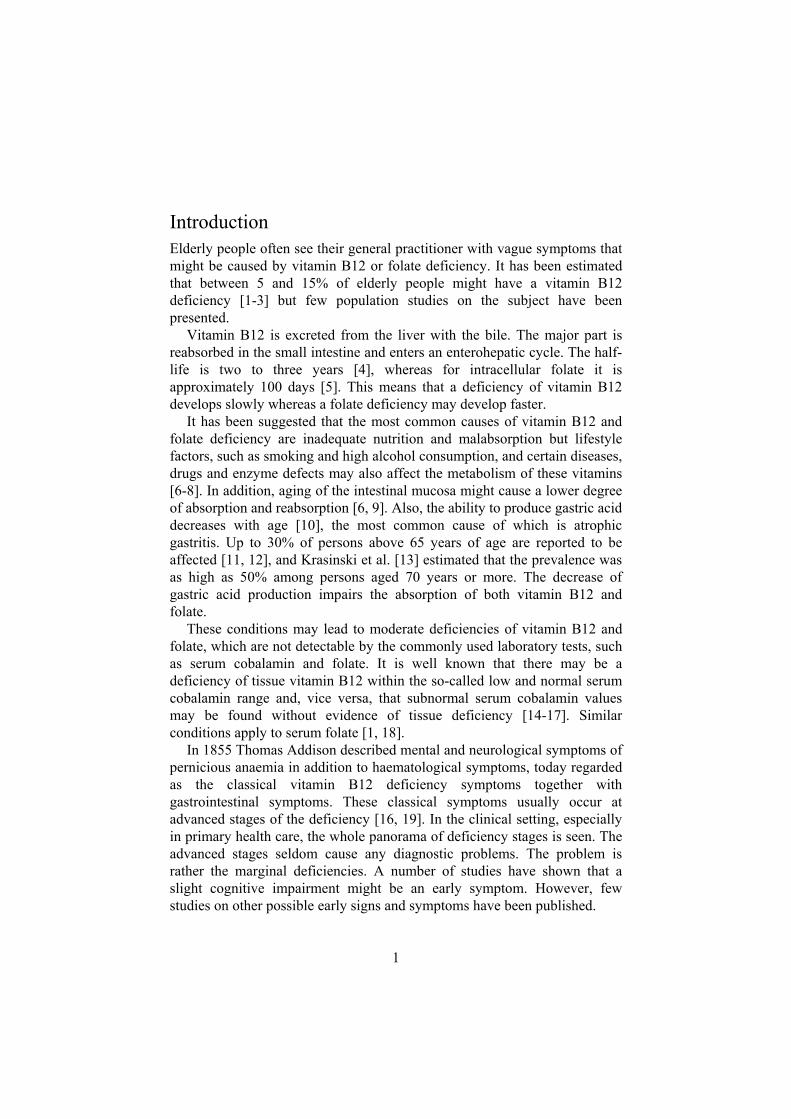
These persons received a letter of invitation to a screening examination at the local primary health care centre, out of whom 235 (88.4%) responded to the invitation. However, 11 persons had advanced diseases, such as malignancies with metastases (n=6), or uraemia (n=2), that were expected to interfere with the study objectives, or were in hospital for diseases not related to the study objectives (n=3), leaving 224 persons as the final study population in the first report, figure 1.
Of the 224 participants, 35 were on treatment with cobalamin, 1 mg per day orally. Five of these were on folic acid treatment, 5 mg per day, as well. Of the remaining 189, 3 persons were on folic acid treatment. Twenty-five subjects were multivitamin users but had no prescribed cobalamin or folic acid treatment. The multivitamin preparations contained 1-50 µg cobalamin and 50-400 µg folic acid per tablet. The remaining 161 persons, who had no medication containing cobalamin or folic acid, constituted the final study population in the second report.

5
Figure 1. Flow chart of the study population. Bold boxes indicate (from the top) the study populations in the four reports.
Among those 186 persons who had no cobalamin or folic acid medication, 69 persons had serum cobalamin less than 300 pmol/L and serum MMA 0.37 µmol/L, or serum tHcy 15 µmol/L. These 69 persons were given cobalamin treatment for 6 months. The treatment was given in two steps. Those who had neurological or psychiatric symptoms were offered 1 mg of hydroxocobalamin given by intramuscular injection 5 days a week for two weeks and then once a week for two months and finally once monthly. The remaining persons were given tablets containing 2 mg cyanocobalamin twice a day for one month and then 1 mg daily. During the 6 months, 6 persons died, from 1 person no blood samples could be obtained for technical reasons and 1 person declined further participation. 61 patients thus completed the treatment and were the study population in the third report. Those who still had serum MMA or serum tHcy levels above the laboratory reference value after 6 months had folic acid treatment added to
No multivitaminintake n=161
Folic acid sub-stitution n=3
Cobalamin andfolic acid substi-
tution n=5
Cobalamin substi-tution n=30
Multivitaminintake only n=25
No cobalamin or folic acidsubstitution n=186
Cobalamin or folic acidsubstitution n=38
Study populationn=224
Samplen=266
Respondersn=235
Critically ill personsn=11
Non-respondersn=31
B12<300 pmol/Land high MMA ortHcy levels n=69
Died, declined,or technical
problems n=8Completed treatment
9 months n=61
Completed treatment36 months n=44
Died, declined orin hospital n=17
No treatments, nomultivitamins n=57

6
the cobalamin treatment, in the form of folic acid tablets 5 mg once daily, and were checked up after 3 months.
All persons were then followed for another 30 months, which period was completed by 44 subjects. During this later follow-up period, another 11 died, 4 were in hospital and 2 declined participation. In addition, another 57 of the original 224 persons in the study population who had no cobalamin, folic acid or multivitamin treatment did not participate in the treatment study and were therefore used as referents. These two groups constitute the final study population for the fourth report. Altogether 19 persons (27.5%) of the 69 in the treated group died during the 3 years of follow-up, compared to the 37 persons (22.7%) among the other 155 persons in the study population.
Data collection Information on previous and present diseases, ongoing prescribed and over-the-counter medication, the presence or absence of 19 symptoms relating to vitamin B12 deficiency, and food intake during a typical day was obtained by questionnaire. The 19 symptoms were grouped into gastrointestinal, neurological, psychiatric and miscellaneous symptoms. Gastrointestinal symptoms included reduced appetite, mouth angle stomatitis or tongue mucosa atrophy, nausea, vomiting and heartburn. Neurological symptoms included numbness, paraesthesias in the feet and fingers, walking difficulties, fumblingness and impaired touch perception, and the psychiatric symptoms included irritability, memory impairment, depression and being easily moved to tears. Miscellaneous symptoms included fatigue, shortness of breath, palpitations and ankle oedema.
An interview was performed by a general practitioner during which the questionnaire responses were verified. In addition, information on smoking habits and alcohol intake, occupational history and medical history was obtained. Smoking was measured as grammes of tobacco used per day. Alcohol consumtion frequency was estimated by interview and graded as no alcohol consumption, less than once a week, once a week or more often than once a week. 56.4% reported no alcohol consumtion, 32.7% less than once a week, 8.2% weekly and 2.7% more than once a week.
A physical examination was performed, including height and weight measurement, oral cavity examination with special attention paid to atrophy of the tongue mucosa and mouth angle stomatitis, heart and lung auscultation, blood pressure measurement and abdominal palpation. The vibration perception threshold was measured (Somedic Vibrameter type IV) at three standardised sites, the dorsomedial aspect of the first metatarsal bone, the flat surface of the proximal part of the tibia and the dorsum of the metacarpal bone of the index finger. Two measurements were made at each site and the mean value was used.
7
The biceps, brachioradial, triceps, patellar and achilles reflexes were tested bilaterally at standardised sites. The responses were recorded as 0-3, where 0 meant no response and 3 meant a maximum one. For this report, the mean value of the bilateral responses was computed, rounded off to the nearest integer. Romberg's sign was tested in the erect position. Possible outcomes were normal or abnormal. A Mini Mental State Examination (MMSE) was performed [34]. Possible scores were 0-30, with low scores indicating cognitive impairment.
Venous blood was drawn after overnight fasting from the right arm with light stasis in the sitting position. Some of the analyses, such as haemoglobin, mean cell volume (MCV) and erythrocyte volume fraction (EVF), were performed instantly. The remaining blood samples were kept at room temperature and centrifuged for 10 minutes at 3000 G within half an hour after venipuncture. Serum was then frozen at -20oC and shipped for analysis in batch.
Serum cobalamin and folate concentrations were analysed with a competitive radioligand method (Quantaphase II B12 and Folate Radioassays), blood folate was measured with an immunoligand method in hemolysate, and serum creatinine concentration was analysed according to Jaffe’s photometric method (Clinical Chemistry Laboratory, University Hospital, Uppsala, Sweden). The concentration of serum total homocysteine (tHcy) was analysed as previously described [31], and serum methylmalonic acid (MMA) according to the method described by Rasmussen [14] (Clinical Chemistry Laboratory, Uddevalla Hospital, Uddevalla, Sweden). The reference values given by the laboratory were 115-470 pmol/L for serum cobalamin, <0.37 µmol/L for serum MMA, <15 µmol/L for serum tHcy, 3.7-22 nmol/L for serum folate, and 275-700 nmol/L for blood folate. Serum iron concentration was measured with the standard method used by the Clinical Chemistry Laboratory, University Hospital, Uppsala, Sweden.
All participants gave their informed consent to participation. For persons with dementia or memory disturbances, permission for inclusion was obtained from their children, who also supplemented some of the information that the respondent could not provide him or herself. In addition, information from medical records was used in these instances. The Research Ethics Committee of Uppsala University approved the project
Statistical analysis The analyses were performed with the JMP [35] and the StatView program [36] and the SAS program packages [37]. To increase the statistical power of the study, data were measured and coded in graded form whenever possible. Moreover, trend tests were used when possible. Summary statistics such as medians, means, standard deviations and 95% confidence intervals were computed according to conventional methods.
8
Linear regression and analysis of variance were used in the multivariate analyses of factors influencing the serum cobalamin, folate, methylmalonic acid and homocysteine levels. These methods were also used for the adjustments in figures 3 and 4. Change of cobalamin values, folate values, etcetera during treatment periods was tested with the paired t-test.
In the multivariate analyses of possible relationships between serum cobalamin, folate, methylmalonic acid and total homocysteine levels on the one hand and symptoms and signs on the other, two approaches were used. First a standard least square technique was applied using ungrouped data. In the second approach, the symptoms and signs data were classified into groups. The testing was then repeated with the ordinal logistic regression technique. The results with the two approaches were similar and therefore only the results of the latter approach are presented. A procedure, available in the JMP program package, based on the standard least square method and allowing the use of continuous, ordinal and nominal data in the same analysis, was used for the adjustments in figure 5. For the tests of linear trends in Paper 4, a stacked file was created with group identification, measurement results, time factor and covariates as variables. Linear regression was then performed with the measurement variable as the dependent variable and group identification, time factor and covariates as the independent variables.
All results were adjusted for the influence of age, sex and serum creatinine, unless otherwise stated in the text. In addition, further adjustments were done in some instances but these are indicated in the text. Only two-tailed tests were used. P-values less than 5 % were regarded as statistically significant. Very small p-values are indicated as <0.0001, even when they were much smaller.
Results
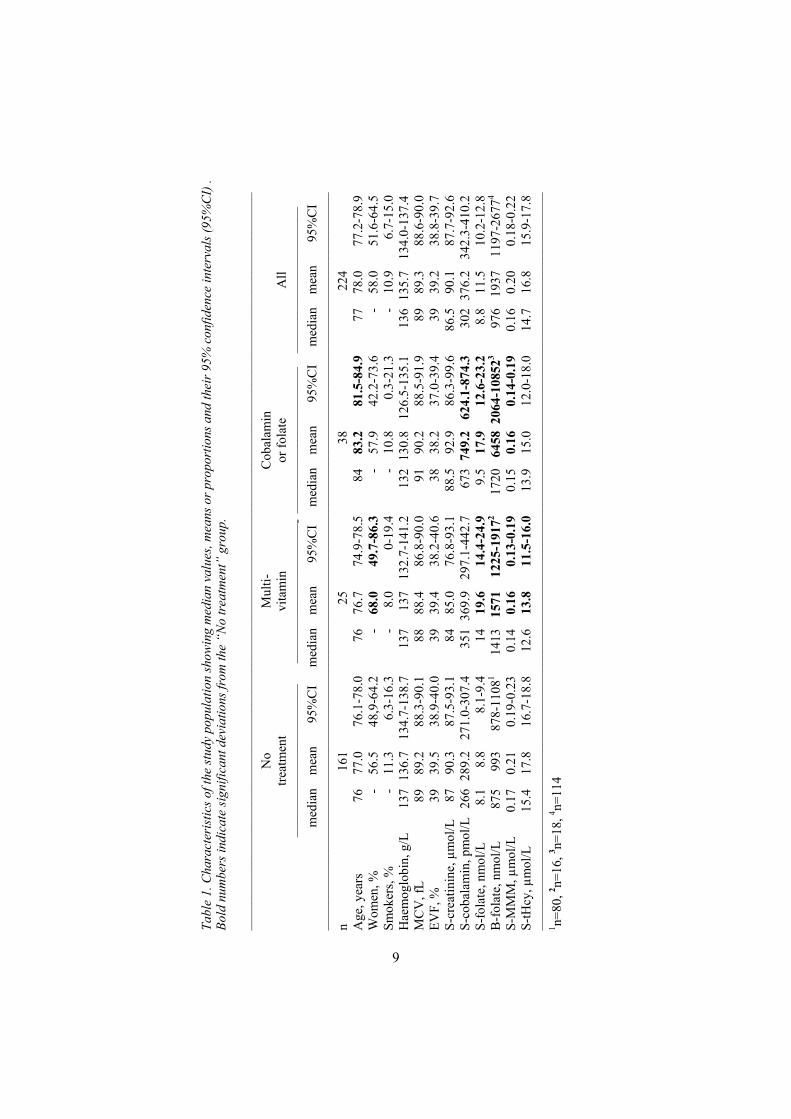
Characteristics of the study population The mean age was 78 years, 58% were women and 8% were living in nursing homes or other institutions. More than half of the study population had some form of comorbidity, such as cardiovascular disease, diabetes mellitus, rheumatoid arthritis, hypothyroidism or other diseases. Table 1 shows characteristics of the study population, grouped according to type of substitution treatment. The alcohol consumption data are not shown for the various treatment groups due to the low reported alcohol consumption.
Tabl
e 1.
Cha
ract
eris
tics o
f the
stud
y po
pula
tion
show
ing
med
ian
valu
es, m
eans
or p
ropo
rtio
ns a
nd th
eir 9
5% c
onfid
ence
inte
rval
s (95
%C
I) .
Bold
num
bers
indi
cate
sign
ifica
nt d
evia
tions
from
the
“No
treat
men
t” g
roup
.
––––
––––
––––
––––
––––
––––
––––
––––
––––
––––
––––
––––
––––
––––
––––
––––
––––
––––
––––
––––
––––
––––
––––
––––
––––
––––
––––
–––
N
o M
ulti-
C
obal
amin
treat
men
t vi
tam
in
orfo
late
A
ll
––––
––––
––––
––––
––––
–––
––––
––––
––––
––––
––––
–- –
––––
––––
––––
––––
––––
– ––
––––
––––
––––
––––
––––
m
edia
n m
ean
95%
CI
med
ian
mea
n 95
%C
I m
edia
n m
ean
95%
CI
med
ian
mea
n 95
%C
I ––
––––
––––
––––
––––
––––
––––
––––
––––
––––
––––
––––
––––
––––
––––
––––
––––
––––
––––
––––
––––
––––
––––
––––
––––
––––
––––
––––
– n
16
1
25
38
22
4 A
ge, y
ears
76
77
.0
76.1
-78.
0 76
76
.7
74.9
-78.
5 84
83
.2
81.5
-84.
9 77
78
.0
77.2
-78.
9 W
omen
, %
- 56
.5
48,9
-64.
2 -
68.0
49
.7-8
6.3
- 57
.9
42.2
-73.
6 -
58.0
51
.6-6
4.5
Smok
ers,
%
- 11
.3
6.3-
16.3
-
8.0
0-19
.4
- 10
.8
0.3-
21.3
-
10.9
6.
7-15
.0
Hae
mog
lobi
n, g
/L
137
136.
7 13
4.7-
138.
7 13
7 13
7 13
2.7-
141.
2 13
2 13
0.8
126.
5-13
5.1
136
135.
7 13
4.0-
137.
4 M
CV
, fL
89
89.2
88
.3-9
0.1
88
88.4
86
.8-9
0.0
91
90.2
88
.5-9
1.9
89
89.3
88
.6-9
0.0
EVF,
%
39
39.5
38
.9-4
0.0
39
39.4
38
.2-4
0.6
38
38.2
37
.0-3
9.4
39
39.2
38
.8-3
9.7
S-cr
eatin
ine,
µm
ol/L
87
90
.3
87.5
-93.
1 84
85
.0
76.8
-93.
1 88
.5
92.9
86
.3-9
9.6
86.5
90
.1
87.7
-92.
6 S-
coba
lam
in, p
mol
/L 2
66 2
89.2
27
1.0-
307.
4 35
1 36
9.9
297.
1-44
2.7
673
749.
2 62
4.1-
874.
3 30
2 37
6.2
342.
3-41
0.2
S-fo
late
, nm
ol/L
8.
1 8.
8 8.
1-9.
4 14
19
.6
14.4
-24.
9 9.
5 17
.9
12.6
-23.
2 8.
8 11
.5
10.2
-12.
8 B
-fol
ate,
nm
ol/L
87
5 99
3 87
8-11
081
1413
15
71
1225
-191
72 17
20
6458
206
4-10
8523
976
1937
11
97-2
6774
S-M
MM
, µm
ol/L
0.
17
0.21
0.
19-0
.23
0.14
0.
16
0.13
-0.1
9 0.
15
0.16
0.
14-0
.19
0.16
0.
20
0.18
-0.2
2 S-
tHcy
, µm
ol/L
15
.4
17.8
16
.7-1
8.8
12.6
13
.8
11.5
-16.
0 13
.9
15.0
12
.0-1
8.0
14.7
16
.8
15.9
-17.
8 ––
––––
––––
––––
––––
––––
––––
––––
––––
––––
––––
––––
––––
––––
––––
––––
––––
––––
––––
––––
––––
––––
––––
––––
––––
––––
––––
––––
– 1 n=
80, 2 n=
16, 3 n=
18, 4 n=
114
9
10
Compared to those who had no vitamin treatment, the cobalamin or folate users were significantly older and had higher serum cobalamin, serum and blood folate levels and lower serum MMA and tHcy levels. Those who took multivitamins had higher serum cobalamin och serum folate and and blood folate levels and lower serum MMA and serum tHcy levels than those who did not take such vitamins. In other respects the groups were fairly similar.
Haemoglobin, EVF, MCV and creatinine in the study population Women had lower haemoglobin levels than men, and in both sexes elderly individuals had lower levels than younger persons (p<0.0001), table 2. The relationship of EVF to age and sex was similar to that of haemoglobin. Smokers had a significantly higher MCV than nonsmokers (p<0.05). Women had lower serum creatinine levels than men and older persons had higher values (p<0.0005).
Serum cobalamin, folate, MMA and tHcy in the study population Serum cobalamin levels were affected by vitamin treatment, as shown in table 1, and women had higher serum cobalamin levels than men (p<0.05). Serum folate and blood folate levels were not correlated to age or sex. Serum MMA was in multivariate analyses significantly and independently correlated to age, serum cobalamin and creatinine levels, table 2. Serum tHcy was in a multivariate analysis significantly and independently correlated to age, sex, serum folate, cobalamin, and creatinine levels and to smoking habits.
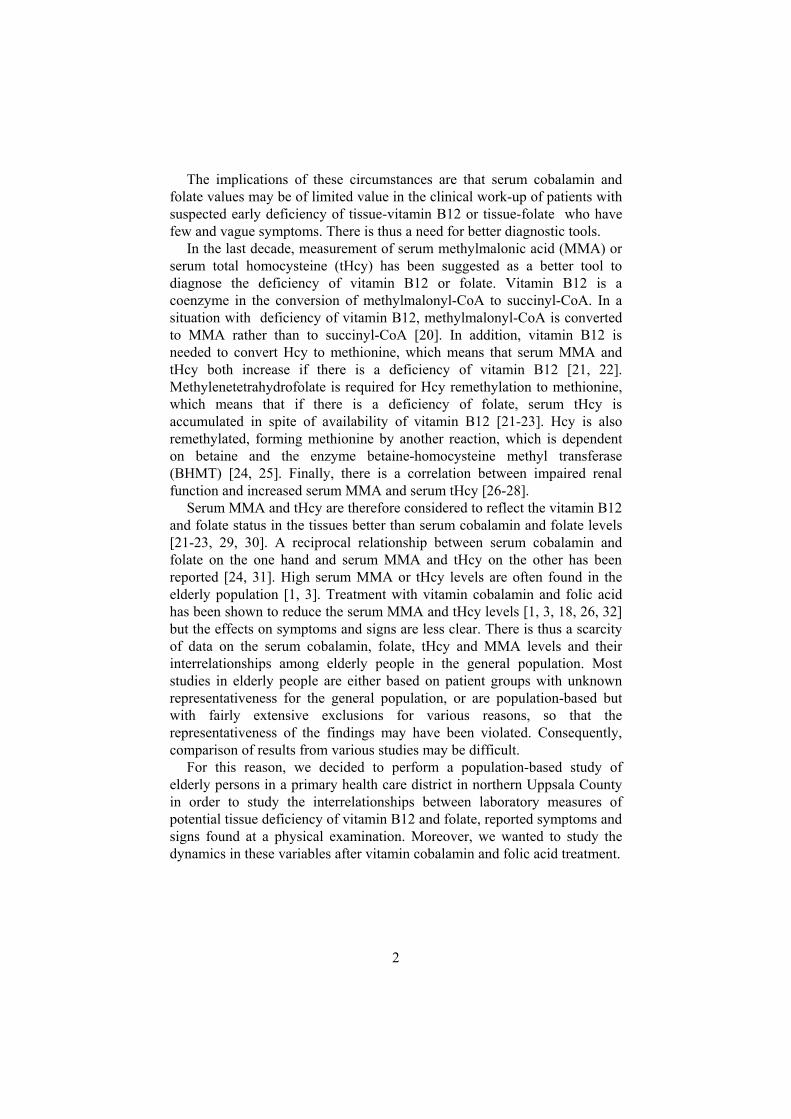
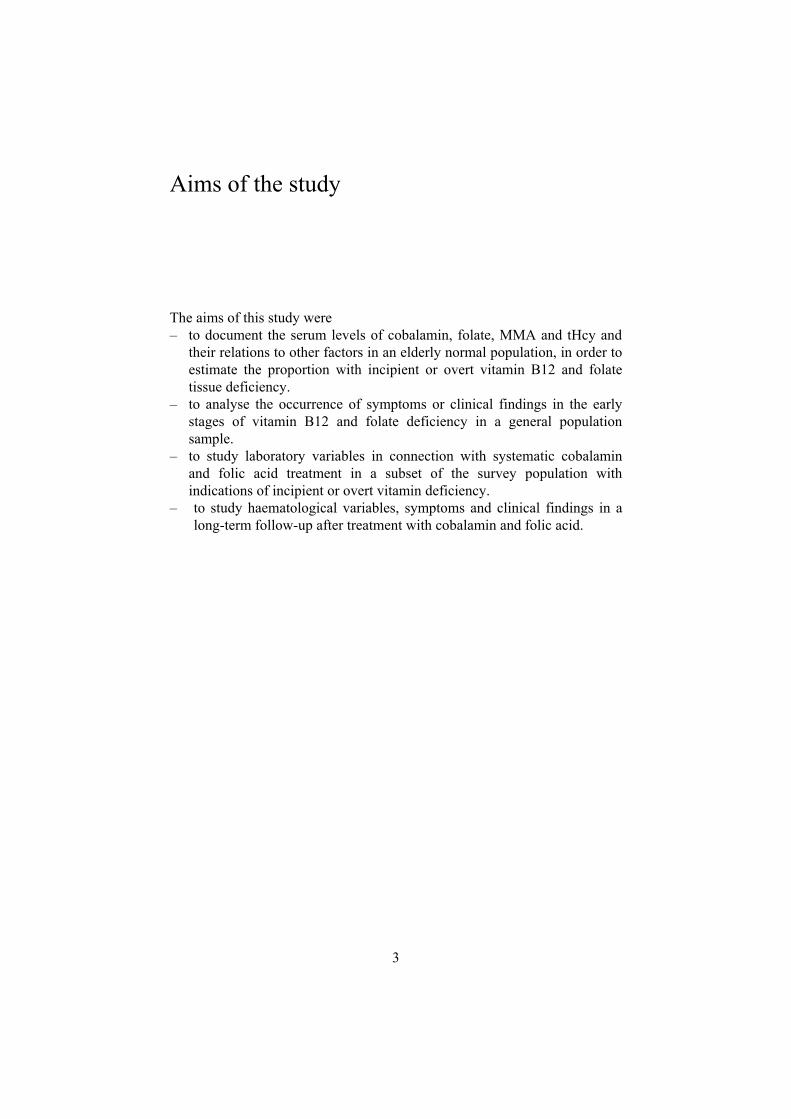
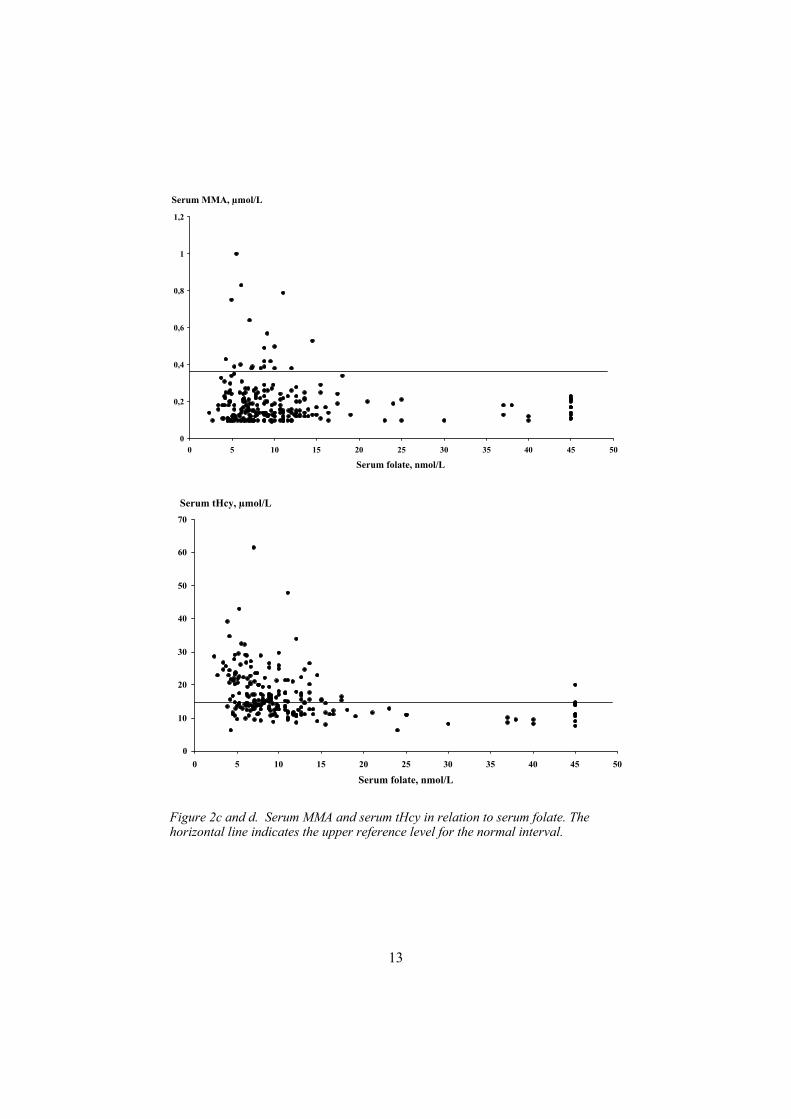
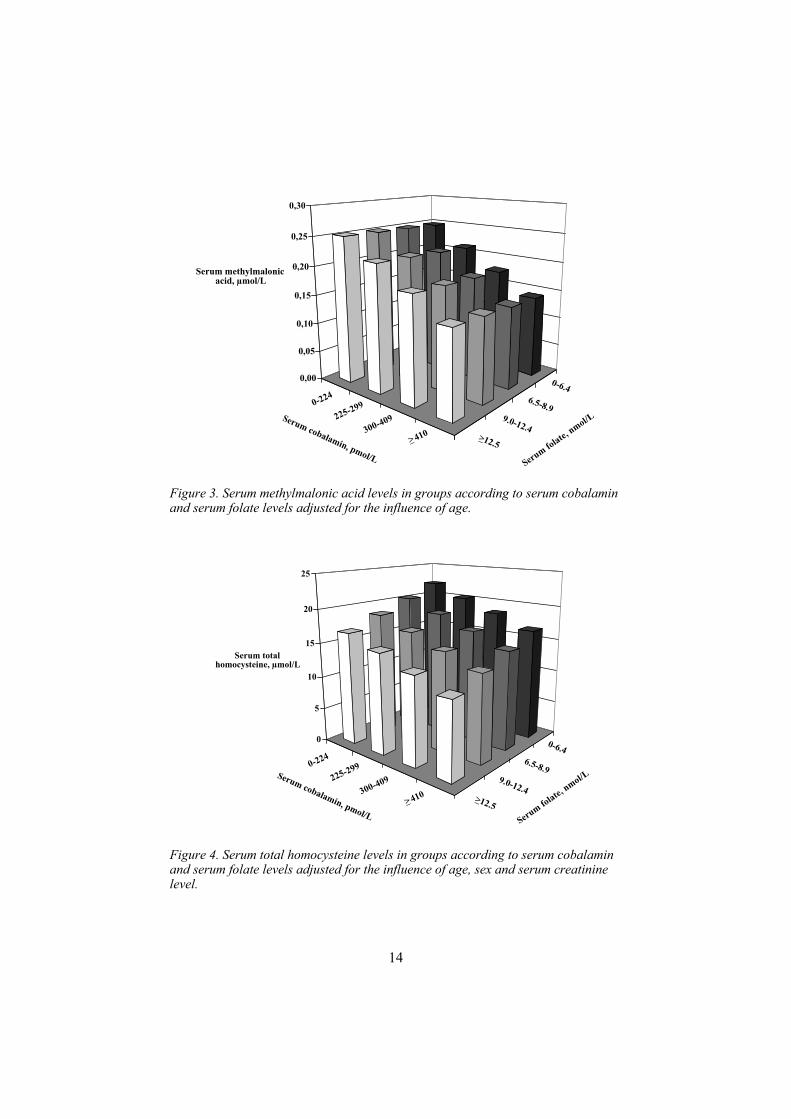
The distribution of serum MMA and tHcy in relation to serum cobalamin and to serum folate is shown in figure 2. There was an inverse relationship between serum cobalamin and folate on the one hand and serum tHcy and MMA on the other. However, since vitamin B12 and folate deficiency often occur simultaneously, a multivariate analysis of the influence of serum cobalamin and folate on serum MMA and tHcy was performed. As shown in figure 3, there was a consistent trend of lower serum cobalamin levels the higher the serum MMA level was irrespective of serum folate level. The corresponding data for serum tHcy are shown in figure 4. The serum tHcy levels increased with decreasing levels of serum cobalamin as well as decreasing levels of serum folate. The highest serum tHcy levels were seen in those with combined low serum cobalamin and folate levels.
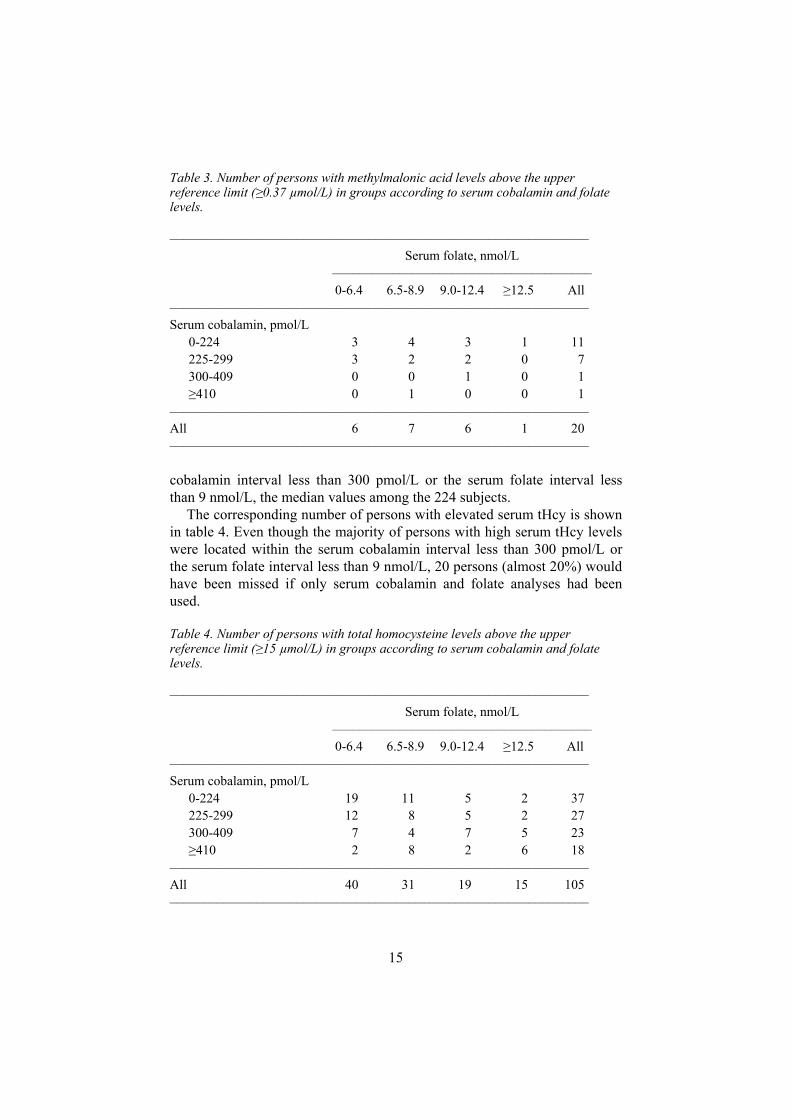
110 of the 224 persons (49.1%) had elevated serum MMA or tHcy levels, 94 (58.4%) in the no treatment group, 6 (24.0%) in the multivitamin group and 10 (26.3%) in the cobalamin and/or folic acid-treated group. The number of persons with abnormally high serum MMA levels is shown in table 3 in groups according to serum folate and serum cobalamin levels. Out of the 20 persons with high serum MMA levels, 19 were located within the serum
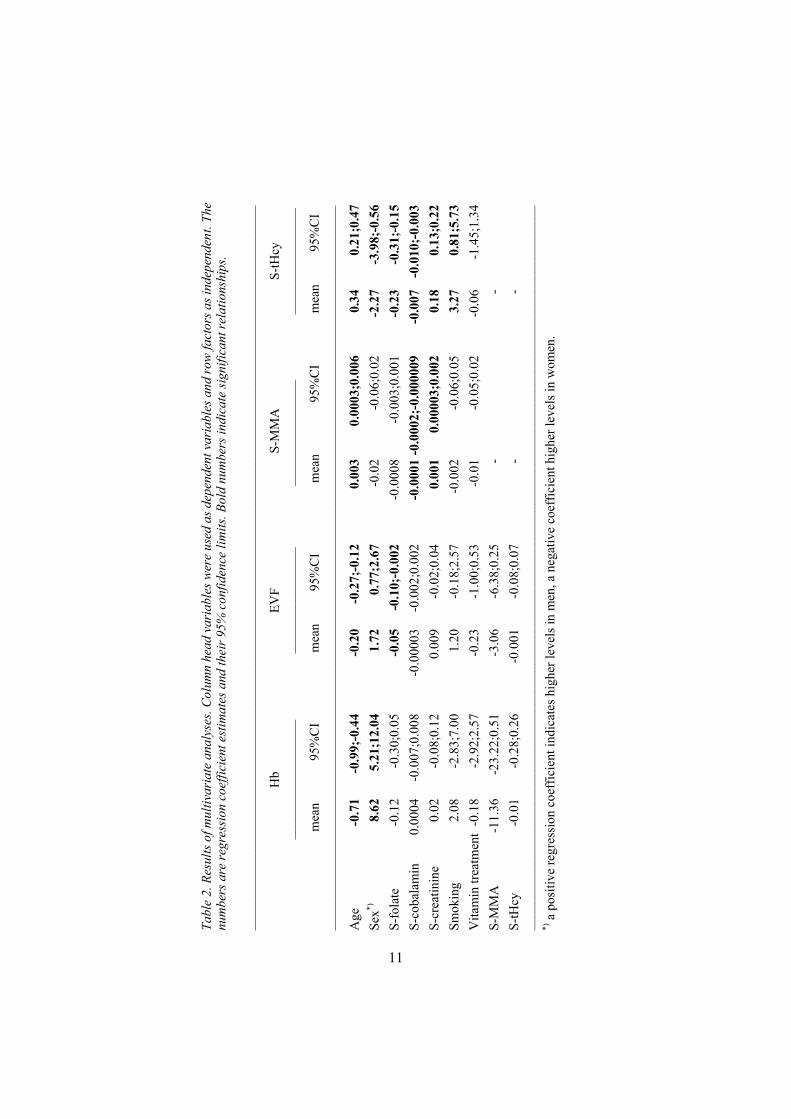
Tabl
e 2.
Res
ults
of m
ultiv
aria
te a
naly
ses.
Colu
mn
head
var
iabl
es w
ere
used
as d
epen
dent
var
iabl
es a
nd ro
w fa
ctor
s as i
ndep
ende
nt. T
he
num
bers
are
regr
essi
on c
oeffi
cien
t est
imat
es a
nd th
eir 9
5% c
onfid
ence
lim
its. B
old
num
bers
indi
cate
sign
ifica
nt re
latio
nshi
ps.
––––
––––
––––
––––
––––
––––
––––
––––
––––
––––
––––
––––
––––
––––
––––
––––
––––
––––
––––
––––
––––
––––
––––
––––
––––
––––
––––
–
Hb
EVF
S-M
MA
S-
tHcy
––––
––––
––––
––––
––
––––
––––
––––
––––
––
––––
––––
––––
––-
––––
––––
––––
––––
mea
n 95
%C
I m
ean
95%
CI
mea
n 95
%C
I m
ean
95%
CI
––––
––––
––––
––––
––––
––––
––––
––––
––––
––––
––––
––––
––––
––––
––––
––––
––––
––––
––––
––––
––––
––––
––––
––––
––––
––––
––––
– A
ge
-0.7
1 -0
.99;
-0.4
4-0
.20
-0.2
7;-0
.12
0.00
3 0.
0003
;0.0
06
0.34
0.
21;0
.47
Sex*)
8.62
5.
21;1
2.04
1.
72
0.77
;2.6
7 -0
.02
-0.0
6;0.
02
-2.2
7 -3
.98;
-0.5
6 S-
fola
te
-0.1
2 -0
.30;
0.05
-0
.05
-0.1
0;-0
.002
-0
.000
8 -0
.003
;0.0
01
-0.2
3
-0.3
1;-0
.15
S-co
bala
min
0.
0004
-0
.007
;0.0
08
-0.0
0003
-0
.002
;0.0
02
-0.0
001
-0.0
002;
-0.0
0000
9-0
.007
-0
.010
;-0.
003
S-cr
eatin
ine
0.02
-0
.08;
0.12
0.
009
-0.0
2;0.
04
0.00
1 0.
0000
3;0.
002
0.18
0.
13;0
.22
Smok
ing
2.08
-2
.83;
7.00
1.
20
-0.1
8;2.
57
-0.0
02
-0.0
6;0.
05
3.27
0.
81;5
.73
Vita
min
trea
tmen
t -0
.18
-2.9
2;2.
57
-0.2
3 -1
.00;
0.53
-0
.01
-0.0
5;0.
02
-0.0
6 -1
.45;
1.34
S-
MM
A
-11.
36
-23.
22;0
.51
-3.0
6 -6
.38;
0.25
-
-
S-tH
cy
-0.0
1 -0
.28;
0.26
-0
.001
-0
.08;
0.07
-
-
––––
––––
––––
––––
––––
––––
––––
––––
––––
––––
––––
––––
––––
––––
––––
––––
––––
––––
––––
––––
––––
––––
––––
––––
––––
––––
––––
– *)
a p
ositi
ve re
gres
sion
coe
ffic
ient
indi
cate
s hig
her l
evel
s in
men
, a n
egat
ive
coef
ficie
nt h
ighe
r lev
els i
n w
omen
.
11

12
Figure 2 a and b. Serum MMA and serum tHcy in relation to serum cobalamin. Thehorizontal line indicates the upper reference level for the normal interval.
0
0,2
0,4
0,6
0,8
1
1,2
0 200 400 600 800 1000 1200 1400 1600
Serum cobalamin, pmol/L
Serum MMA, µmol/L
0
10
20
30
40
50
60
70
0 200 400 600 800 1000 1200 1400 1600Serum cobalamin, pmol/L
Serum tHcy, µmol/L
13
Figure 2c and d. Serum MMA and serum tHcy in relation to serum folate. The horizontal line indicates the upper reference level for the normal interval.
0
0,2
0,4
0,6
0,8
1
1,2
0 5 10 15 20 25 30 35 40 45 50
Serum folate, nmol/L
Serum MMA, µmol/L
0
10
20
30
40
50
60
70
0 5 10 15 20 25 30 35 40 45 50
Serum folate, nmol/L
Serum tHcy, µmol/L
14
Figure 3. Serum methylmalonic acid levels in groups according to serum cobalamin and serum folate levels adjusted for the influence of age.
Figure 4. Serum total homocysteine levels in groups according to serum cobalamin and serum folate levels adjusted for the influence of age, sex and serum creatinine level.
0-224
>_12.5
0,00
0,05
0,10
0,15
0,20
0,25
0,30
Serum methylmalonic acid, µmol/L
0
5
10
15
20
25
Serum total homocysteine, µmol/L
225-299
300-409
>_ 410
9.0-12.4
6.5-8.9
0-6.4
0-224
>_12.5
225-299
300-409
>_ 410
9.0-12.4
6.5-8.9
0-6.4
Serum cobalamin, pmol/LSeru
m folate,
nmol/L
Serum cobalamin, pmol/LSeru
m folate,
nmol/L
15
Table 3. Number of persons with methylmalonic acid levels above the upper reference limit ( 0.37 µmol/L) in groups according to serum cobalamin and folate levels.
––––––––––––––––––––––––––––––––––––––––––––––––––––––––––––––– Serum folate, nmol/L ––––––––––––––––––––––––––––––––––––––– 0-6.4 6.5-8.9 9.0-12.4 12.5 All ––––––––––––––––––––––––––––––––––––––––––––––––––––––––––––––– Serum cobalamin, pmol/L 0-224 3 4 3 1 11 225-299 3 2 2 0 7 300-409 0 0 1 0 1
410 0 1 0 0 1 ––––––––––––––––––––––––––––––––––––––––––––––––––––––––––––––– All 6 7 6 1 20 –––––––––––––––––––––––––––––––––––––––––––––––––––––––––––––––
cobalamin interval less than 300 pmol/L or the serum folate interval less than 9 nmol/L, the median values among the 224 subjects.
The corresponding number of persons with elevated serum tHcy is shown in table 4. Even though the majority of persons with high serum tHcy levels were located within the serum cobalamin interval less than 300 pmol/L or the serum folate interval less than 9 nmol/L, 20 persons (almost 20%) would have been missed if only serum cobalamin and folate analyses had been used.
Table 4. Number of persons with total homocysteine levels above the upper reference limit ( 15 µmol/L) in groups according to serum cobalamin and folate levels.
––––––––––––––––––––––––––––––––––––––––––––––––––––––––––––––– Serum folate, nmol/L ––––––––––––––––––––––––––––––––––––––– 0-6.4 6.5-8.9 9.0-12.4 12.5 All ––––––––––––––––––––––––––––––––––––––––––––––––––––––––––––––– Serum cobalamin, pmol/L 0-224 19 11 5 2 37 225-299 12 8 5 2 27 300-409 7 4 7 5 23
410 2 8 2 6 18 ––––––––––––––––––––––––––––––––––––––––––––––––––––––––––––––– All 40 31 19 15 105 –––––––––––––––––––––––––––––––––––––––––––––––––––––––––––––––
16
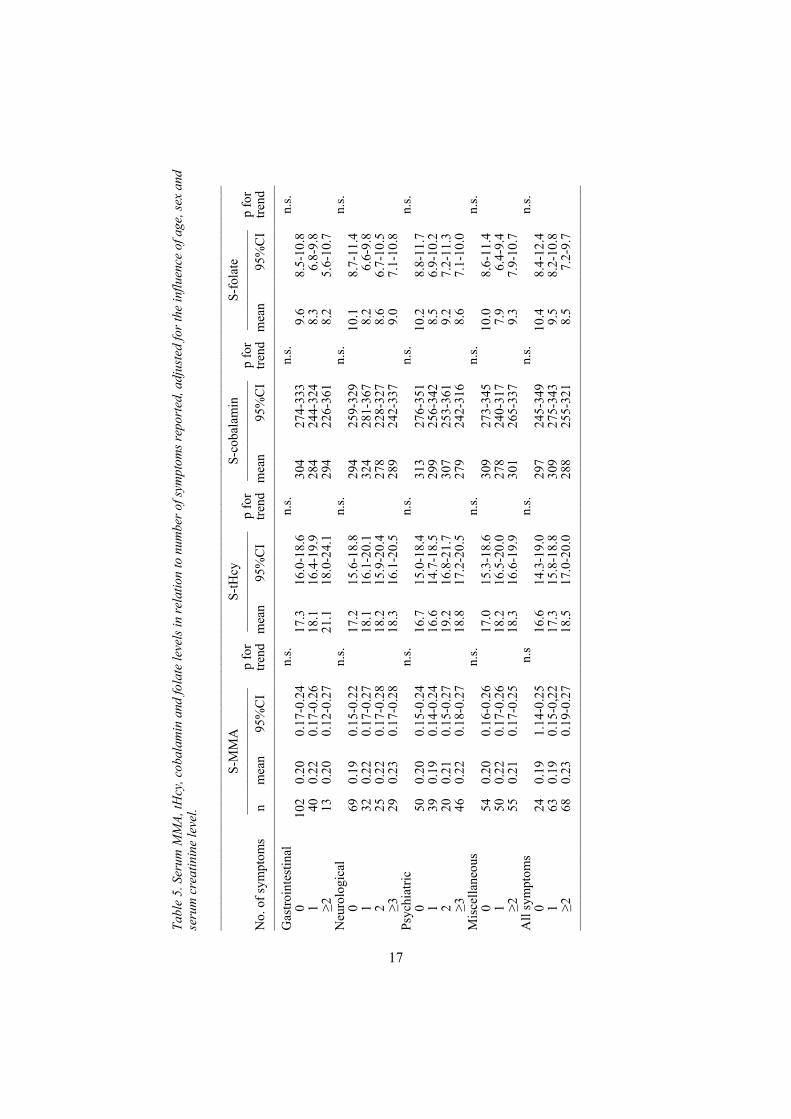
Symptoms and signs in early stages of vitamin B12 or folate deficiencyThe levels of serum MMA, serum tHcy, serum cobalamin and serum folate among those with various levels of symptom reporting are given in table 5. After adjustment for the influence of age, sex and serum creatinine level, there was a tendency towards increasing levels of tHcy with increased number of symptoms reported, but none of these tendencies were statistically significant. There were similar tendencies for serum MMA versus neurological and psychiatric symptoms. For serum cobalamin and serum folate there were no clear tendencies.
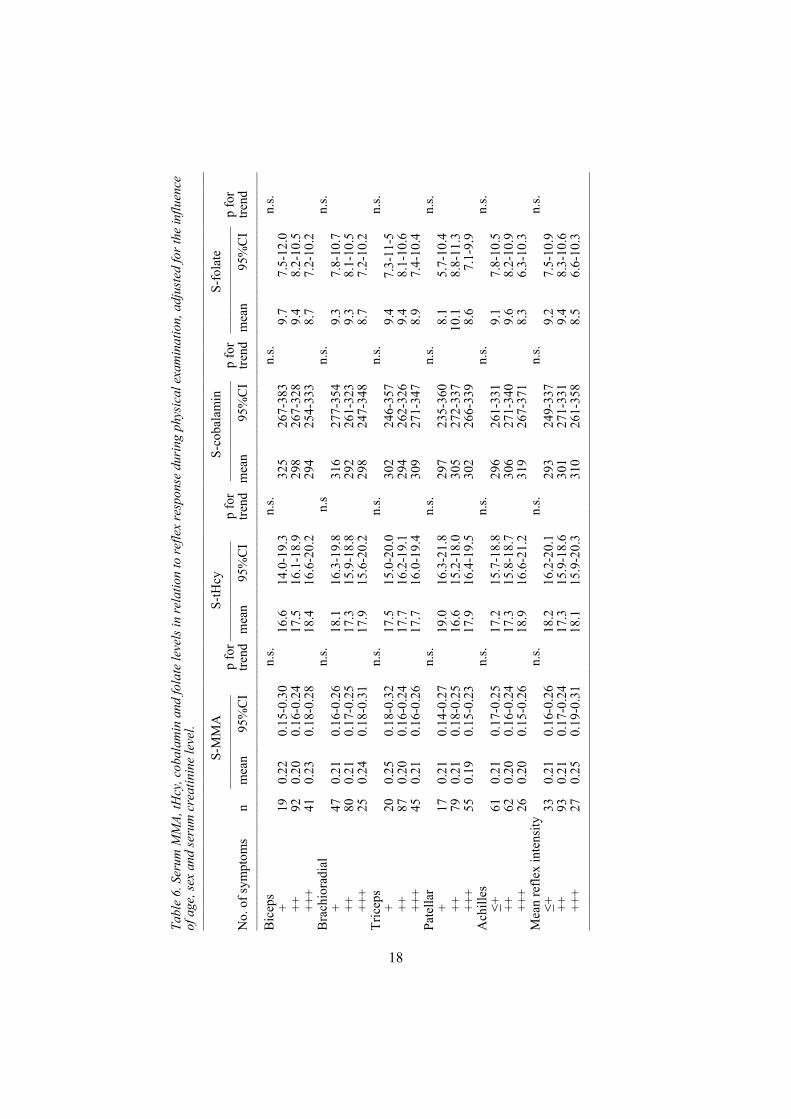
The corresponding data for reflex response are given in table 6. There were no significant trends or even tendencies of trends. The same was true for vibration sense, Romberg's sign and Mini Mental State Examination, table 7. However, those who had abnormal findings in the tongue mucosa or mouth angle stomatitis had significantly higher serum tHcy levels and significantly lower serum folate levels than those who had normal mucosal findings. There were similar but nonsignificant trends for serum MMA and cobalamin presence. The results remained unchanged when the influence of serum iron was taken into consideration.
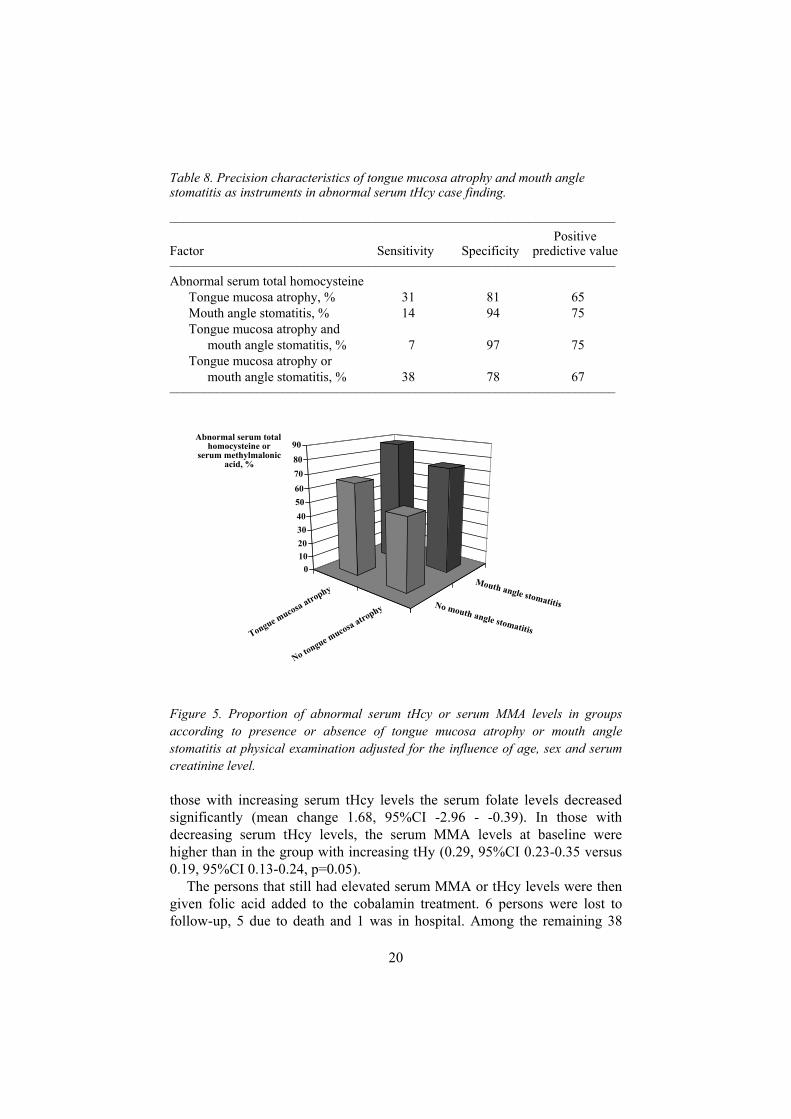
The tongue mucosa atrophy and mouth angle stomatitis findings were thus the only significant clinical determinants of abnormal serum tHcy and folate levels. The precision of these clinical findings in the screening procedure is shown in table 8. Both clinical findings had a low sensitivity but fairly good specificity, especially when combined. The predictive value was fairly high, 65-75%.
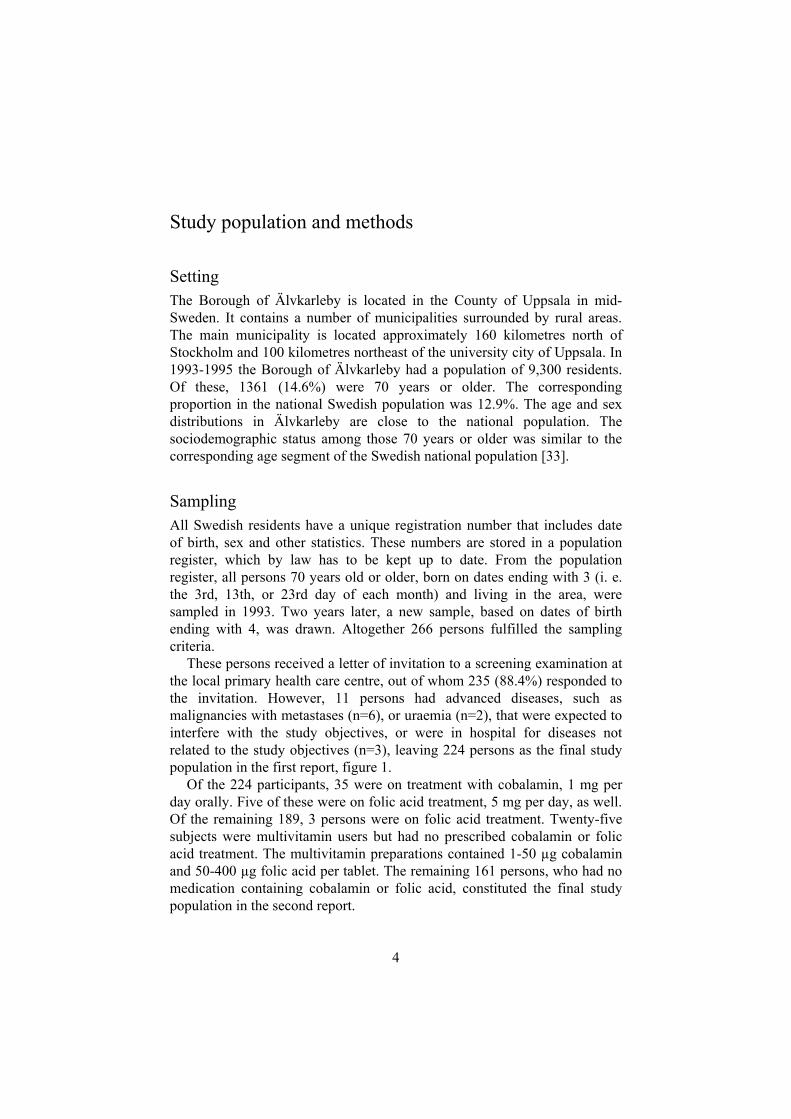
The proportion of persons with abnormal serum tHcy or MMA levels in the various combinations of presence or absence of tongue changes or mouth angle stomatitis is shown in figure 5. Among those who had neither finding, 51% had indications of a tissue deficiency of B12 or folate, as compared to 88% among those who had both findings, after adjustment for the influence of age, sex and serum creatinine level.
The effects of treatment with cobalamin or folic acid 61 persons completed the 6 months’ treatment with cobalamin (described above). Serum cobalamin normalised in all persons. 13 of the 15 persons (86.7%) with an elevated serum MMA became normal and 12 out of the 56 persons, 21.4%, who had an elevated serum tHcy became normal. Thus 44 (78.6%) subjecs still had serum tHcy 15 µmol/L or more.
The serum tHcy levels decreased in 47 persons but increased in 14. Among those with decreasing serum tHcy levels, the serum folate levels were unchanged (mean change 0.36, 95%CI -0.57-1.28) whereas among
Tabl
e 5.
Ser
um M
MA,
tHcy
, cob
alam
in a
nd fo
late
leve
ls in
rela
tion
to n
umbe
r of s
ympt
oms r
epor
ted,
adj
uste
d fo
r the
influ
ence
of a
ge, s
ex a
nd
seru
m c
reat
inin
e le
vel.
––––
––––
––––
––––
––––
––––
––––
––––
––––
––––
––––
––––
––––
––––
––––
––––
––––
––––
––––
––––
––––
––––
––––
––––
––––
––––
––––
––––
S-
MM
A
S-
tHcy
S-co
bala
min
S-fo
late
––
––––
––––
––––
––––
– p
for
––––
––––
––––
–––
p fo
r ––
––––
––––
––––
– p
for
––––
––––
––––
–––
p fo
r N
o. o
f sym
ptom
s n
mea
n 95
%C
I tre
nd
mea
n 95
%C
I tre
nd
mea
n 95
%C
I tre
nd
mea
n 95
%C
I tre
nd
––––
––––
––––
––––
––––
––––
––––
––––
––––
––––
––––
––––
––––
––––
––––
––––
––––
––––
––––
––––
––––
––––
––––
––––
––––
––––
––––
––––
G
astro
inte
stin
al
n.
s.
n.
s.
n.
s.
n.
s.
0 10
2 0.
20
0.17
-0.2
4
17.3
16
.0-1
8.6
30
4 27
4-33
3
9.6
8.5-
10.8
1 40
0.
22
0.17
-0.2
6
18.1
16
.4-1
9.9
28
4 24
4-32
4
8.3
6.8-
9.8
213
0.
20
0.12
-0.2
7
21.1
18
.0-2
4.1
29
4 22
6-36
1
8.2
5.6-
10.7
N
euro
logi
cal
n.
s.
n.
s.
n.
s.
n.
s.
0 69
0.
19
0.15
-0.2
2
17.2
15
.6-1
8.8
29
4 25
9-32
9
10.1
8.
7-11
.4
1
32
0.22
0.
17-0
.27
18
.1
16.1
-20.
1
324
281-
367
8.
2 6.
6-9.
8
2 25
0.
22
0.17
-0.2
8
18.2
15
.9-2
0.4
27
8 22
8-32
7
8.6
6.7-
10.5
3
29
0.23
0.
17-0
.28
18
.3
16.1
-20.
5
289
242-
337
9.
0 7.
1-10
.8
Psyc
hiat
ric
n.
s.
n.
s.
n.
s.
n.
s.
0 50
0.
20
0.15
-0.2
4
16.7
15
.0-1
8.4
31
3 27
6-35
1
10.2
8.
8-11
.7
1
39
0.19
0.
14-0
.24
16
.6
14.7
-18.
5
299
256-
342
8.
5 6.
9-10
.2
2
20
0.21
0.
15-0
.27
19
.2
16.8
-21.
7
307
253-
361
9.
2 7.
2-11
.3
346
0.
22
0.18
-0.2
7
18.8
17
.2-2
0.5
27
9 24
2-31
6
8.6
7.1-
10.0
M
isce
llane
ous
n.
s.
n.
s.
n.
s.
n.
s.
0 54
0.
20
0.16
-0.2
6
17.0
15
.3-1
8.6
30
9 27
3-34
5
10.0
8.
6-11
.4
1
50
0.22
0.
17-0
.26
18
.2
16.5
-20.
0
278
240-
317
7.
9 6.
4-9.
4 2
55
0.21
0.
17-0
.25
18
.3
16.6
-19.
9
301
265-
337
9.
3 7.
9-10
.7
All
sym
ptom
s
n.s
n.s.
n.s.
n.s.
0
24
0.19
1.
14-0
.25
16
.6
14.3
-19.
0
297
245-
349
10
.4
8.4-
12.4
1 63
0.
19
0.15
-0,2
2
17.3
15
.8-1
8.8
30
9 27
5-34
3
9.5
8.2-
10.8
2
68
0.23
0.
19-0
.27
18
.5
17.0
-20.
0
288
255-
321
8.
5 7.
2-9.
7 ––
––––
––––
––––
––––
––––
––––
––––
––––
––––
––––
––––
––––
––––
––––
––––
––––
––––
––––
––––
––––
––––
––––
––––
––––
––––
––––
––––
––
17
Tabl
e 6.
Seru
m M
MA,
tHcy
, cob
alam
in a
nd fo
late
leve
ls in
rela
tion
to re
flex
resp
onse
duri
ng p
hysi
cal e
xam
inat
ion,
adj
uste
d fo
rthe
influ
ence
of a
ge, s
exan
d se
rum
cre
atin
ine
leve
l.––
––––
––––
––––
––––
––––
––––
––––
––––
––––
––––
––––
––––
––––
––––
––––
––––
––––
––––
––––
––––
––––
––––
––––
––––
––––
––––
––––
––––
S-M
MA
S-tH
cyS-
coba
lam
inS-
fola
te––
––––
––––
––––
pfo
r–––
––––
––––
––––
pfo
r––
––––
––––
––––
–p
for
––––
––––
––––
––––
pfo
rN
o. o
f sym
ptom
s n
mea
n 95
%C
I tre
nd
mea
n 95
%C
I tre
nd
mea
n 95
%C
I tre
nd
mea
n 95
%C
I tre
nd
––––
––––
––––
––––
––––
––––
––––
––––
––––
––––
––––
––––
––––
––––
––––
––––
––––
––––
––––
––––
––––
––––
––––
––––
––––
––––
––––
––––
––
Bic
eps
n.
s.
n.
s.
n.
s.
n.
s.
+ 19
0.
22
0.15
-0.3
0
16.6
14
.0-1
9.3
32
5 26
7-38
3
9.7
7.5-
12.0
++
92
0.20
0.
16-0
.24
17
.5
16.1
-18.
9
298
267-
328
9.
4 8.
2-10
.5
++
+ 41
0.
23
0.18
-0.2
8
18.4
16
.6-2
0.2
29
4 25
4-33
3
8.7
7.2-
10.2
B
rach
iora
dial
n.s.
n.s
n.s.
n.s.
+
47
0.21
0.
16-0
.26
18
.1
16.3
-19.
8
316
277-
354
9.
3 7.
8-10
.7
++
80
0.
21
0.17
-0.2
5
17.3
15
.9-1
8.8
29
2 26
1-32
3
9.3
8.1-
10.5
+++
25
0.24
0.
18-0
.31
17
.9
15.6
-20.
2
298
247-
348
8.
7 7.
2-10
.2
Tric
eps
n.
s.
n.
s.
n.
s.
n.
s.
+ 20
0.
25
0.18
-0.3
2
17.5
15
.0-2
0.0
30
2 24
6-35
7
9.4
7.3-
11-5
++
87
0.20
0.
16-0
.24
17
.7
16.2
-19.
1
294
262-
326
9.
4 8.
1-10
.6
++
+ 45
0.
21
0.16
-0.2
6
17.7
16
.0-1
9.4
30
9 27
1-34
7
8.9
7.4-
10.4
Pa
tella
r
n.s.
n.s.
n.s.
n.s.
+
17
0.21
0.
14-0
.27
19
.0
16.3
-21.
8
297
235-
360
8.
1 5.
7-10
.4
++
79
0.
21
0.18
-0.2
5
16.6
15
.2-1
8.0
30
5 27
2-33
7
10.1
8.
8-11
.3
++
+ 55
0.
19
0.15
-0.2
3
17.9
16
.4-1
9.5
30
2 26
6-33
9
8.6
7.1-
9.9
Ach
illes
n.s.
n.s.
n.s.
n.s.
+61
0.
21
0.17
-0.2
5
17.2
15
.7-1
8.8
29
6 26
1-33
1
9.1
7.8-
10.5
++
62
0.20
0.
16-0
.24
17
.3
15.8
-18.
7
306
271-
340
9.
6 8.
2-10
.9
++
+ 26
0.
20
0.15
-0.2
6
18.9
16
.6-2
1.2
31
9 26
7-37
1
8.3
6.3-
10.3
M
ean
refle
x in
tens
ity
n.
s.
n.
s.
n.
s.
n.
s. +
33
0.21
0.
16-0
.26
18
.2
16.2
-20.
1
293
249-
337
9.
2 7.
5-10
.9
++
93
0.
21
0.17
-0.2
4
17.3
15
.9-1
8.6
30
1 27
1-33
1
9.4
8.3-
10.6
+++
27
0.25
0.
19-0
.31
18
.1
15.9
-20.
3
310
261-
358
8.
5 6.
6-10
.3
––––
––––
––––
––––
––––
––––
––––
––––
––––
––––
––––
––––
––––
––––
––––
––––
––––
––––
––––
––––
––––
––––
––––
––––
––––
––––
––––
––––
––
18

Tabl
e 7.
Ser
um M
MA,
tHcy
, cob
alam
in a
nd fo
late
leve
ls in
rela
tion
to v
ibra
tion
sens
e an
d so
me
findi
ngs a
t the
phy
sica
l exa
min
atio
n, a
djus
ted
for t
he in
fluen
ce o
f age
, sex
and
seru
m c
reat
inin
e le
vel,
mic
ron=
0.00
1 m
illim
etre
s.––
––––
––––
––––
––––
––––
––––
––––
––––
––––
––––
––––
––––
––––
––––
––––
––––
––––
––––
––––
––––
––––
––––
––––
––––
––––
––––
––––
––––
S-
MM
A
S-
tHcy
S-co
bala
min
S-fo
late
––
––––
––––
––––
– p
for
––––
––––
––––
––
p fo
r ––
––––
––––
––––
– p
for
––––
––––
––––
––––
p
for
No.
of s
ympt
oms
n m
ean
95%
CI
trend
m
ean
95%
CI
trend
m
ean
95%
CI
trend
m
ean
95%
CI
trend
––
––––
––––
––––
––––
––––
––––
––––
––––
––––
––––
––––
––––
––––
––––
––––
––––
––––
––––
––––
––––
––––
––––
––––
––––
––––
––––
––––
––––
V
ibra
tion
sens
e, m
icro
ns
C
arpa
l
n.s.
n.s.
n.s.
n.s.
0-2.
5 13
1 0.
21
0.17
-0.2
3
17.6
16
.3-1
8.8
30
6 27
8-33
4
9.4
8.3-
10.5
>2
.5
12
0.23
0.
14-0
.30
20
.1
16.9
-23.
4
245
169-
316
7.
2 4.
4-10
.0
Ti
bial
n.s.
n.s.
n.s.
n.s.
0-20
13
1 0.
21
0.18
-0.2
4
17.3
16
.1-1
8.5
30
5 27
6-33
3
9.4
8.6-
10.1
>2
0 10
0.
17
0.08
-0.2
7
17.9
14
.1-2
1.6
31
3 22
6-39
9
9.4
7.0-
11.8
Tars
al
n.
s.
n.
s.
n.
s.
n.
s.
0-
80
127
0.21
0.
17-0
.24
17
.3
16.0
-18.
5
305
276-
334
9.
4 8.
6-10
.2
>80
13
0.21
0.
14-0
.29
18
.4
15.3
-21.
4
310
240-
381
9.
5 7.
6-11
.4
M
ean
n.
s.
n.
s.
n.
s.
n.
s.
0-
35
130
0.21
0.
18-0
.24
17
.7
16.5
-18.
9
302
275-
330
9.
3 8.
2-10
.3
>35
14
0.18
0.
10-0
.26
17
.2
14.0
-20.
3
302
231-
374
9.
1 6.
4-11
.8
Rom
berg
's si
gn
n.
s.
n.
s.
n.
s.
n.
s.
norm
al
139
0.21
0.
18-0
.24
17
.6
16.3
-18.
8
300
274-
327
9,
2 8.
1-10
.2
ab
norm
al
11
0.18
0.
10-0
.26
18
.7
15.5
-21.
9
312
240-
383
9.
7 6.
9-12
.4
Tong
ue m
ucos
a
n.s.
<0
.000
5
n.
s.
0.
01
norm
al
117
0.21
0.
17-0
.24
17
.0
15.8
-18.
2
304
277-
330
9.
6 8.
6-10
.6
at
roph
y 40
0.
24
0.19
-0.2
9
20.5
18
.7-2
2.3
28
2 24
1-32
2
7.6
6.0
-9.1
M
outh
ang
le st
omat
itis
n.
s.
<0.
01
n.s.
<
0.05
no
141
0.21
0.
17-0
.24
17
.3
16.1
-18.
5
305
279-
331
9.
4 8.
4-10
.4
ye
s 16
0.
25
0.17
-0.3
2
20.9
18
.3-2
3.5
25
7 20
0-31
4
7.0
4.8-
9.2
Min
i Men
tal S
tate
, sco
re
n.
s.
n.
s.
n.
s.
n.
s.
24-3
0 14
3 0.
21
0.18
-0.2
4
17.8
16
.6-1
9.1
29
8 27
1-32
4
9.2
8.2-
10.2
0-23
16
0.
24
0.17
-0.3
1
17.0
14
.2-1
9.8
32
0 25
9-38
2
8.7
6.4-
11.0
––
––––
––––
––––
––––
––––
––––
––––
––––
––––
––––
––––
––––
––––
––––
––––
––––
––––
––––
––––
––––
––––
––––
––––
–
19
20
Table 8. Precision characteristics of tongue mucosa atrophy and mouth angle stomatitis as instruments in abnormal serum tHcy case finding.
––––––––––––––––––––––––––––––––––––––––––––––––––––––––––––––––––– Positive Factor Sensitivity Specificity predictive value ––––––––––––––––––––––––––––––––––––––––––––––––––––––––––––––––––– Abnormal serum total homocysteine Tongue mucosa atrophy, % 31 81 65 Mouth angle stomatitis, % 14 94 75 Tongue mucosa atrophy and mouth angle stomatitis, % 7 97 75 Tongue mucosa atrophy or mouth angle stomatitis, % 38 78 67 –––––––––––––––––––––––––––––––––––––––––––––––––––––––––––––––––––
Figure 5. Proportion of abnormal serum tHcy or serum MMA levels in groups according to presence or absence of tongue mucosa atrophy or mouth angle stomatitis at physical examination adjusted for the influence of age, sex and serum creatinine level.
those with increasing serum tHcy levels the serum folate levels decreased significantly (mean change 1.68, 95%CI -2.96 - -0.39). In those with decreasing serum tHcy levels, the serum MMA levels at baseline were higher than in the group with increasing tHy (0.29, 95%CI 0.23-0.35 versus 0.19, 95%CI 0.13-0.24, p=0.05).
The persons that still had elevated serum MMA or tHcy levels were then given folic acid added to the cobalamin treatment. 6 persons were lost to follow-up, 5 due to death and 1 was in hospital. Among the remaining 38
Tongue mucosa atrophy
No tongue mucosa atrophy No mouth angle stomatitis
Mouth angle stomatitis
0102030405060708090
Abnormal serum total homocysteine or
serum methylmalonic acid, %

21
patients, the serum tHcy level decreased during the three-month combined treatment period from 21.4 ±11.08 to 10.1 ±2.14 µmol/L (p<0.0001).
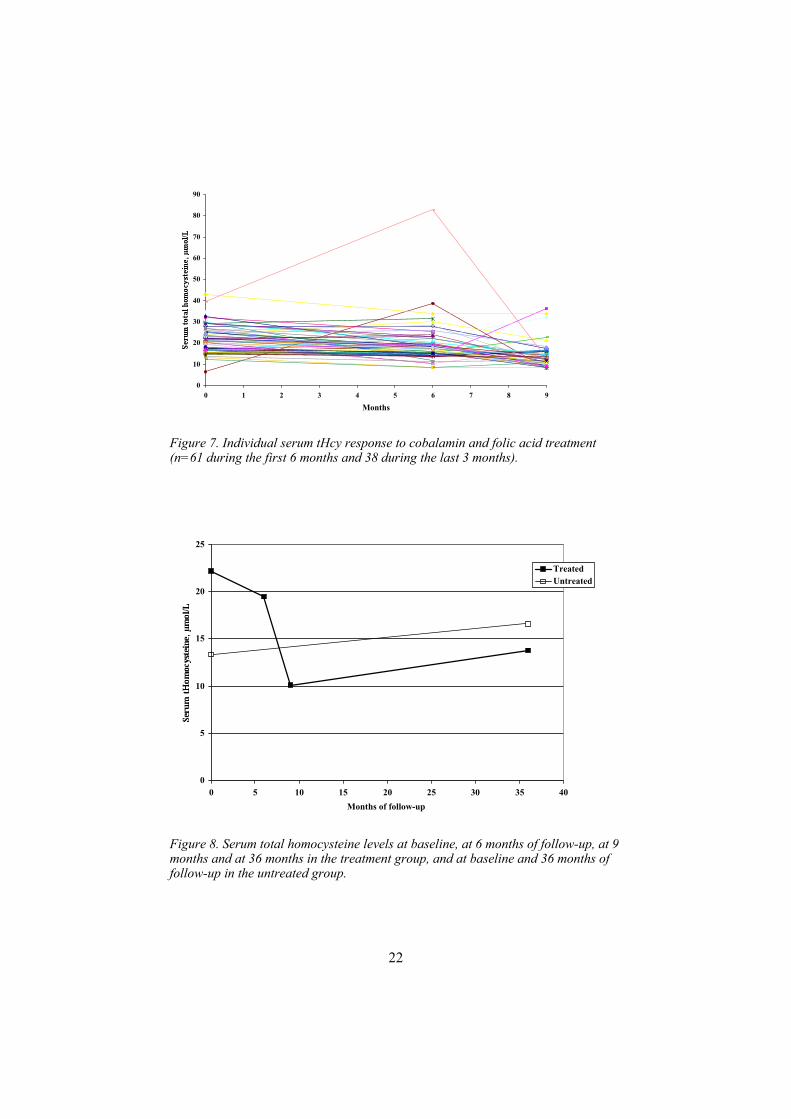
The individual levels of serum MMA and the effects of the cobalamin treatment are shown in figure 6. All patients but two had normalised serum MMA values and for one patient the initially normal serum MMA became abnormal. The corresponding data for the effect of cobalamin and combined cobalamin and folic acid treatment on serum tHcy are shown in figure 7. It is evident that the mean values were reduced during both treatment periods, but in more than 75% of the cases addition of folic acid treatment was needed for the normalisation of serum tHcy. Thus, after combined treatment all patients but one had normal serum tHcy values. The non-normalised patient had serum tHcy 15.0 µmol/L, which was the upper normal limit of the laboratory.
Figure 6. Individual serum MMA response to cobalamin treatment (n=61).
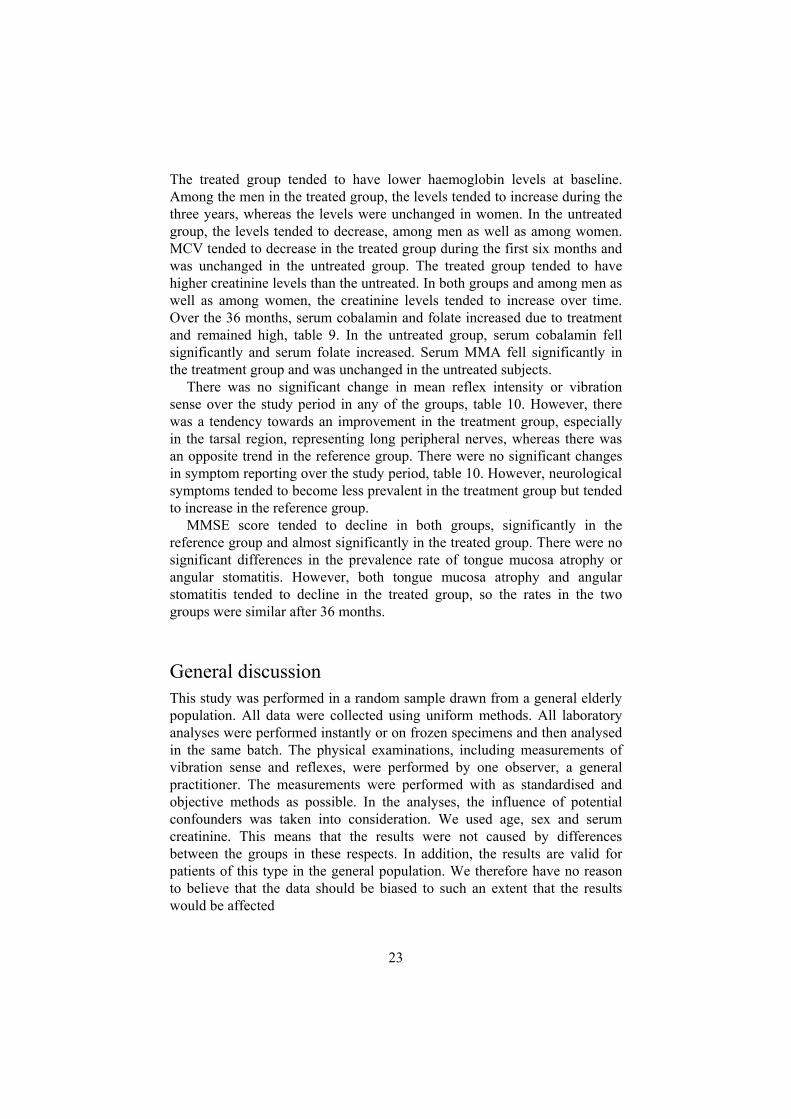
After 36 months of follow-up, 44 persons from the treatment group remained and 57 from the original 224 persons that still had no cobalamin or folic acid or multivitamin treatment were used as referents. When folic acid treatment was added after six months, the serum tHcy levels decreased significantly in the treatment group until the check-up at nine months, and then increased until the 36-months follow-up. However, the levels remained under the upper reference value of the laboratory, figure 8. The serum tHcy levels increased in the untreated group as well but passed the reference value. The treated group was on average older than the untreated group, and also had a more balanced gender mix.
0
0,2
0,4
0,6
0,8
1
1,2
0 1 2 3 4 5 6
Months
22
Figure 7. Individual serum tHcy response to cobalamin and folic acid treatment (n=61 during the first 6 months and 38 during the last 3 months).
Figure 8. Serum total homocysteine levels at baseline, at 6 months of follow-up, at 9 months and at 36 months in the treatment group, and at baseline and 36 months of follow-up in the untreated group.
0
10
20
30
40
50
60
70
80
90
0 1 2 3 4 5 6 7 8 9
Months
0
5
10
15
20
25
0 5 10 15 20 25 30 35 40Months of follow-up
TreatedUntreated
23
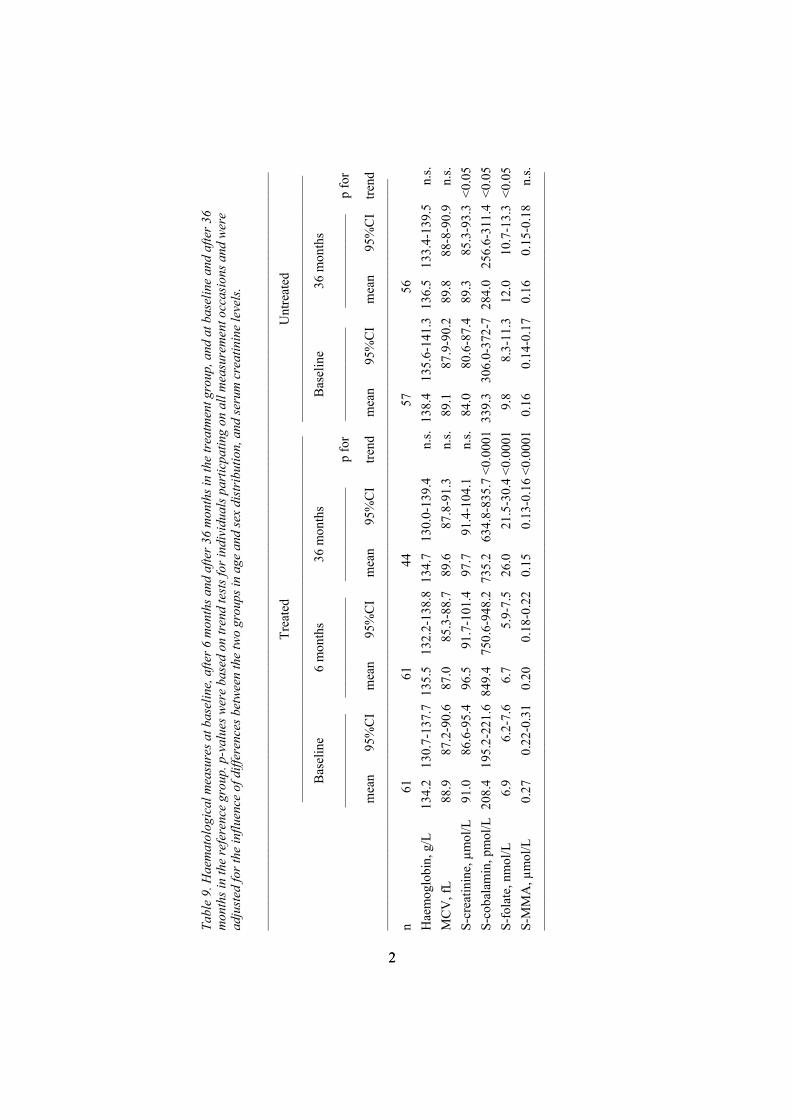
The treated group tended to have lower haemoglobin levels at baseline. Among the men in the treated group, the levels tended to increase during the three years, whereas the levels were unchanged in women. In the untreated group, the levels tended to decrease, among men as well as among women. MCV tended to decrease in the treated group during the first six months and was unchanged in the untreated group. The treated group tended to have higher creatinine levels than the untreated. In both groups and among men as well as among women, the creatinine levels tended to increase over time. Over the 36 months, serum cobalamin and folate increased due to treatment and remained high, table 9. In the untreated group, serum cobalamin fell significantly and serum folate increased. Serum MMA fell significantly in the treatment group and was unchanged in the untreated subjects.
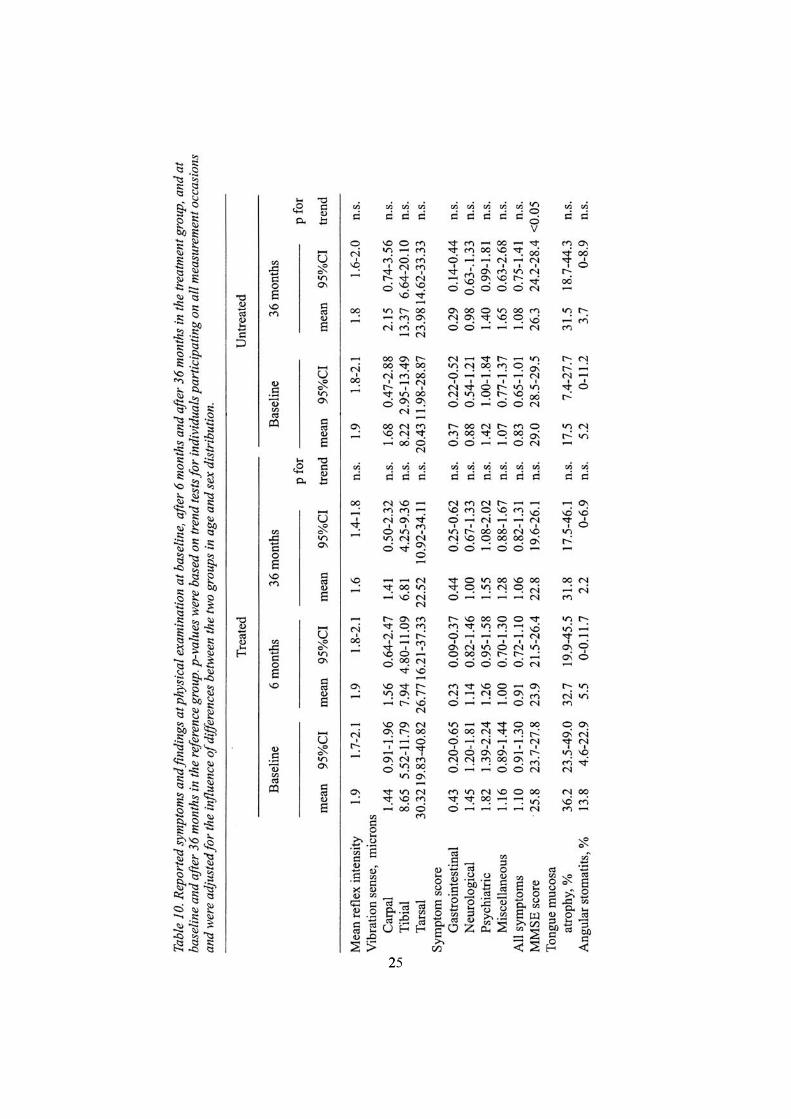
There was no significant change in mean reflex intensity or vibration sense over the study period in any of the groups, table 10. However, there was a tendency towards an improvement in the treatment group, especially in the tarsal region, representing long peripheral nerves, whereas there was an opposite trend in the reference group. There were no significant changes in symptom reporting over the study period, table 10. However, neurological symptoms tended to become less prevalent in the treatment group but tended to increase in the reference group.
MMSE score tended to decline in both groups, significantly in the reference group and almost significantly in the treated group. There were no significant differences in the prevalence rate of tongue mucosa atrophy or angular stomatitis. However, both tongue mucosa atrophy and angular stomatitis tended to decline in the treated group, so the rates in the two groups were similar after 36 months.
General discussion This study was performed in a random sample drawn from a general elderly population. All data were collected using uniform methods. All laboratory analyses were performed instantly or on frozen specimens and then analysed in the same batch. The physical examinations, including measurements of vibration sense and reflexes, were performed by one observer, a general practitioner. The measurements were performed with as standardised and objective methods as possible. In the analyses, the influence of potential confounders was taken into consideration. We used age, sex and serum creatinine. This means that the results were not caused by differences between the groups in these respects. In addition, the results are valid for patients of this type in the general population. We therefore have no reason to believe that the data should be biased to such an extent that the results would be affected
Tabl
e 9.
Hae
mat
olog
ical
mea
sure
s at b
asel
ine,
afte
r 6 m
onth
s and
afte
r 36
mon
ths i
n th
e tr
eatm
ent g
roup
, and
at b
asel
ine
and
afte
r 36
mon
ths i
n th
e re
fere
nce
grou
p. p
-val
ues w
ere
base
d on
tren
d te
sts f
or in
divi
dual
s par
ticpa
ting
on a
ll m
easu
rem
ent o
ccas
ions
and
wer
e ad
just
ed fo
r the
influ
ence
of d
iffer
ence
s bet
ween
the
two
grou
ps in
age
and
sex
dist
ribu
tion,
and
seru
m c
reat
inin
e le
vels
.
––––
––––
––––
––––
––––
––––
––––
––––
––––
––––
––––
––––
––––
––––
––––
––––
––––
––––
––––
––––
––––
––––
––––
––––
––––
––––
––––
––––
––
Tr
eate
d U
ntre
ated
––––
––––
––––
––––
––––
––––
––––
––––
––––
––––
––––
––––
––––
–––
––––
––––
––––
––––
––––
––––
––––
––––
––––
– B
asel
ine
6 m
onth
s 36
mon
ths
B
asel
ine
36 m
onth
s
––––
––––
––––
––
––––
––––
––––
–––
––––
––––
––––
––
p fo
r ––
––––
––––
––––
––
––––
––––
––––
p
for
mea
n 95
%C
I m
ean
95%
CI
mea
n 95
%C
I tre
nd
mea
n 95
%C
I m
ean
95%
CI
trend
––
––––
––––
––––
––––
––––
––––
––––
––––
––––
––––
––––
––––
––––
––––
––––
––––
––––
––––
––––
––––
––––
––––
––––
––––
––––
––––
––––
–––
n 61
61
44
57
56
Hae
mog
lobi
n, g
/L
134.
2 13
0.7-
137.
7 13
5.5
132.
2-13
8.8
134.
7 13
0.0-
139.
4 n.
s. 13
8.4
135.
6-14
1.3
136.
5 13
3.4-
139.
5 n.
s. M
CV
, fL
88.9
87
.2-9
0.6
87.0
85
.3-8
8.7
89.6
87
.8-9
1.3
n.s.
89.1
87
.9-9
0.2
89.8
88
-8-9
0.9
n.s.
S-cr
eatin
ine,
µm
ol/L
91
.0
86.6
-95.
4 96
.5
91.7
-101
.4
97.7
91
.4-1
04.1
n.
s. 84
.0
80.6
-87.
4 89
.3
85.3
-93.
3 <0
.05
S-co
bala
min
, pm
ol/L
208
.4
195.
2-22
1.6
849.
4 75
0.6-
948.
2 73
5.2
634.
8-83
5.7
<0.0
001
339.
3 30
6.0-
372-
7 28
4.0
256.
6-31
1.4
<0.0
5 S-
fola
te, n
mol
/L
6.9
6.2-
7.6
6.7
5.9-
7.5
26.0
21
.5-3
0.4
<0.0
001
9.8
8.3-
11.3
12
.0
10.7
-13.
3 <0
.05
S-M
MA
, µm
ol/L
0.
27
0.22
-0.3
1 0.
20
0.18
-0.2
2 0.
15
0.13
-0.1
6 <0
.000
1 0.
16
0.14
-0.1
7 0.
16
0.15
-0.1
8 n.
s. ––
––––
––––
––––
––––
––––
––––
––––
––––
––––
––––
––––
––––
––––
––––
––––
––––
––––
––––
––––
––––
––––
––––
––––
––––
––––
––––
––––
––––
22
225
26
Comparisons with results from other studies are difficult to make due to exclusions in most studies of persons with certain diseases and treatments. However, by and large, the serum cobalamin and serum and blood folate levels found in this study are similar to those reported by others [30, 31, 38]. The proportion of the population on specific cobalamin treatment was 15.6%. The prevalence in corresponding age groups has been estimated to be 10-20% [6]. The prevalence of folate treatment and multivitamin use varies over the world and therefore no relevant comparisons with the use in other areas can be made [39]. In most studies, including the present, serum cobalamin and folate were not related to age [31, 40, 41]. However, an age relationship may be difficult to show due to the age restriction applied in most studies.
In our study, serum cobalamin was inversely correlated to serum MMA but serum folate was not. Similar relationships were found in the Framingham Heart Study [26]. In a German study, elevated Hcy increased with age and serum creatinine and decreased with serum folate levels, as in our study, but, contrary to our findings, they found no correlation between tHcy and serum cobalamin [42]. In an Italian heart study, low folate levels were associated with high levels of Hcy, but no effects of cobalamin intake on the Hcy levels were found [43]. Higher serum tHcy and MMA levels were found in the elderly persons in our study. Similar relationships have been reported by others [24, 26, 31, 40, 44, 45]. In our study, serum tHcy was inversely correlated to serum cobalamin and folate levels even when the influence of age, sex and serum creatinine levels was taken into account. Similar relationships were found in the Heart Study, in the Hordaland study, in another Swedish study and in a Dutch study [24, 31, 40, 44, 46].
Studies in Hordaland in Norway have shown that lifestyle factors, such as exercise, intake of multivitamins, fruit and vegetables, smoking, coffee and alcohol consumption, may influence the plasma tHcy levels [7, 44, 47], which can make the evaluation more difficult.
Age-related changes can affect the vitamin status of the elderly in many ways [48]. A poor diet is common in old age. Factors such as reduced income, social isolation due to death of the partner, a bad set of teeth or sickness, such as cognitive impairment, can affect the amount and types of food eaten. Many elderly people have their food delivered from institutional kitchens. Heating or reheating food affects the vitamin content negatively. Microwave heating may destroy as much as 30-40% of the vitamin B12 content in food [49]. Also, boiling of vegetables reduces the folate content up to 50% [50]. Steaming results in no significant decrease in folate content.
Atrophic gastritis is reported to be more common in the elderly. The suggested rate is about 30% [12] , whereas pernicious anaemia is found in only 1-1.9% [26, 51]. Food cobalamin malabsorption is common among patients with atrophic gastritis, whether or not they also have Helicobacter pylori infection, or reduced acid secretion [4, 9, 52, 53].
27
A large number of medications affect the absorption of vitamin B12 and folate. Metformin is a common antidiabetic drug which reduces the absorption of vitamin B12 [54, 55] and also interferes with the absorption of folic acid [56]. Patients treated with phenytoin have been shown to have low serum folate and high Hcy levels [57, 58]. Trimethoprim, a common antibiotic drug for urinary tract infections, also affects the folate metabolism. Long-term use of acid suppressive drugs, such as proton pump inhibitors and H2-receptor antagonists, reduces the absorption of vitamin B12 [59, 60]. These preparations can now be bought over the counter in many countries. A large number of factors may thus affect the vitamin B12 and folate status among the elderly.
Occurrence of the TT genotype for the common methylenetetra-hydrofolate reductase (MTHFR) polymorphism (C677T) may also affect the tHcy levels [8, 61]. This mutation leads to thermolability of the enzyme, which results in a greater than 70% reduction in enzyme activity and increased sensitivity to low folate concentrations [61, 62]. About 12% of the white population is homozygous [62], and this frequently results in hyperhomocysteinemia when serum folate is below the median population concentrations. MTHFR was not measured in this study and not in most other population-based studies either.
Renal impairment may to some extent contribute to the elevated plasma tHcy [63]. The inverse correlation between glomerular filtration rate and plasma Hcy is present from normal to end stage renal disease [24, 45]. As in our study, the UK National Diet and Nutrition Survey (NDNS) found that both age and serum creatinine were directly and serum cobalamin and folate levels inversely correlated to serum tHcy [64]. The third National Health and Nutrition Examination Survey (NHANES III) reported higher Hcy concentrations in males than in females and a strong correlation with creatinine levels [65].
It is well known that there may be a deficiency of tissue vitamin B12 or folate within the so-called low and normal serum range and, vice versa, that subnormal serum values may be found without evidence of tissue deficiency [1, 14-18]. Do elevated serum levels of MMA or tHcy then reflect the deficiency better? A substantial proportion of the study population, 49% overall and 58% of those without any vitamin therapy, had elevated serum tHcy or MMA levels, suggesting a latent or overt lack of tissue vitamin B12 or folate or both. Similar results have been reported by others [1, 3, 42]. The majority of these persons did not have abnormally low levels of serum cobalamin or folate according to the so-called normal reference levels of the laboratory. Even though the MMA-reaction is dependent on vitamin B12 as a cofactor only, and the levels of serum tHcy can be influenced by other factors, measurement of serum MMA was in the U.S.A. and Denmark in the 1990s suggested to be a better diagnostic tool for vitamin B12 deficiency than tHcy [14, 20, 28, 66]. However, a recent Danish study has suggested
28
that the concentration of plasma MMA might be affected by conditions other than vitamin B12 deficiency and the authors do not recommend use of an increased plasma MMA as a sole indicator for starting lifelong cobalamin treatment [67]. Others even suggest the omission of serum MMA [68].
Vitamin B12 deficiency may be associated with normal or even increased serum folate levels, since vitamin B12 deficiency hampers the conversion of folate precursors to active folate, which may result in an accumulation of serum folate (or actually the precursor which is included in the measurement of serum folate). This is called the “methylfolate-trap” [69] and is in our study illustrated by the fact that all of the 30 persons who had pharmacological cobalamin substitution had normal serum cobalamin levels but 10 (33.3%) still had increased serum tHcy levels. In Kuzminski's study, 5 of 38 vitamin B12-deficient persons who received cobalamin substitution still had increased serum tHcy and were found to have folate deficiency [70].
Vitamin B12 and folate are necessary for the biosynthesis and repair of DNA and RNA. There is constant damage and repair of the DNA in the body, which is dependent on methyl-groups and on zinc. The two vitamins B12 and folate act concerted and are necessary for the transfer of one-carbons and methyl-groups. A vitamin deficiency can lead to impaired cell replication and axonal degeneration neuropathy in the peripheral nervous system and demyelinating lesions in the central nervous system [71-73]. The fast replication tissues, such as blood cells and mucous membranes, should be affected at an early stage. The red blood cells become bigger and the MCV levels increase. The classical symptoms of vitamin B12 deficiency are known as anaemic and neurological. The megaloblastic anaemia could be diagnosed by the haemoglobin value and the big red blood cells by MCV. In our study, we found that women and elderly individuals had lower blood haemoglobin and erythrocyte volume fraction (EVF), but we found no age dependence of MCV. In the ‘70-year-old people in Göteborg’ study, similar findings were made [74]. We found no correlations between serum cobalamin and folate on the one hand and haemoglobin, MCV and EVF on the other. In the Framingham Heart Study, neither serum folate nor serum cobalamin concentrations were correlated to the EVF or MCV [26] and in the ‘70-year-old people in Göteborg’ study no correlation between serum cobalamin and haemoglobin or MCV was found [38]. Nor did we find any correlation between serum cobalamin, folate, MMA or tHcy and haemoglobin or MCV. This means that neither haemoglobin nor MCV appears to be very suitable for screening for tissue vitamin B12 and folate deficiency.
We found few published studies where symptoms were analysed in relation to deficiency markers. Stabler et al. [16] and Healton et al. [19] found a correlation between serum cobalamin and neurological symptoms in patients with low levels of serum cobalamin. Hvas et al. [75] found no correlation between serum MMA and gastrointestinal and neurological
29
symptoms, anaemia, vibration sense or Romberg´s test in patients with elevated serum MMA. Thongprason et al. [76] found significantly lower blood folate levels in dental patients with stomatitis or glossitis than in patients with no oral symptoms but no difference in serum cobalamin or folate levels was found between the groups. In addition, a number of studies have analysed deficiency markers versus gastrointestinal chemical atrophy markers, such as pepsinogen and gastrin and in some cases biopsy findings, but not versus reported symptoms [12, 77-79].
In other studies, the correlations between deficiency markers and cognitive function have been tested [80-93]. The results were at variance. It appeared that there was an overt correlation between cognitive impairment in advanced stages of the vitamin deficiency on the one hand and serum cobalamin, serum folate and serum tHcy on the other, whereas the correlation with serum MMA appears to be less well documented, even though there is some support for the notion that serum MMA may be higher in patients with Alzheimer's disease than in age matched referents [94]. The SENECA study made an assessment of the mental health of the elderly in ten European countries and its correlations with micronutrient plasma levels. 880 randomised subjects aged 74 to 79 years were examined. The investigators found highly significant but weak correlations between the total MMSE scores and cobalamin and folate plasma levels [80]. Their study population was bigger than ours, and our opinion is strengthened by their results.
Are there any early signs or symptoms of vitamin B12 or folate deficiency? Among a large number of symptoms and clinical findings that traditionally have been linked to vitamin B12 or folate tissue deficiency, only changes in the tongue mucosa and mouth angle stomatitis turned out to be significantly associated with abnormal serum folate and tHcy levels in our study. It is reasonable to assume that the more the deficiency proceeds, the more symptoms appear. Associations between deficiency markers and the classical deficiency symptoms are usually found in study populations with a large proportion of persons with advanced deficiency. In population-based studies, the classical symptoms appear to be less pronounced, because persons with deficiency have on average a less advanced condition. Since we selected the untreated “healthy” group of 161 persons, and since it is fairly small, we were able to find correlations with the haematological variables, but the power was probably too small for a significant correlation with signs and symptoms.
A more efficient way of identifying early signs and symptoms might be to study the change of prevalence rate of symptoms and signs after treatment with cobalamin and folic acid. The number of persons available for our treatment study was rather low. The statistical power was sufficient for the documentation of haematological effects but still somewhat too low for the symptoms and findings at the physical examination. The reason for the low
30
power was that the study population was old and thus had a high mortality rate during the fairly long follow-up time. Moreover, during this long time, the survivors stopped or started vitamin medication in a way that we could not completely control. We were therefore obliged to interpret trends even when they were not significant. An example of this type of reasoning is the trends regarding angular stomatitis. We are fairly convinced that the falling rate in the treatment group is a true one even though the decrease did not reach significance. In other instances, the trends were less convincing. However, we gave our interpretation, which may be tested in later studies with better statistical power.
A number of vitamin treatment studies have been published [3, 15, 21, 46, 95-106]. Most of these studies were based on small samples and none was population based or had a known study base from which patients or volunteers were sampled. The group that we treated with cobalamin and folic acid tended to have lower haemoglobin levels at baseline. The haemoglobin levels among the men then tended to increase during the three years, whereas the levels among women were unchanged. In the untreated group, the levels tended to decrease, among men as well as among women. MCV tended to decrease in the treated group during the first six months and was unchanged in the untreated group. The decrease may be an indication of the possibility that we treated an early vitamin deficiency.
In spite of the low power of most of the studies, a pattern of treatment effects can be seen. Cobalamin treatment generally normalises serum MMA, but serum tHcy only to a minor extent, whereas folic acid treatment normalises serum tHcy. No effect of folic acid treatment on serum MMA has been reported [16, 32]. The effect of B6 treatment on tHcy appears to be small [107].
The study of Rasmussen et al. [101], which so far had the largest study population, had a study design similar to ours, except that all subjects were given cobalamin treatment or combined cobalamin and folic acid treatment irrespective of serum MMA or tHcy levels. After cobalamin treatment, a small but significant reduction of serum tHcy was found but no significant change of serum MMA, whereas serum tHcy was further reduced by folic acid treatment. In our study, after treatment with cobalamin for 6 months, all elevated serum MMA values except two and 21.4% of the raised serum tHcy levels were normalised. After further treatment with cobalamin plus folic acid for three months, all serum tHcy values except one (97.4%) were normalised. Similar findings have been made in a number of intervention studies on selected subjects [18, 21, 46, 99, 101, 106]. Thus, there is reason to believe that elevated serum tHcy and MMA levels indicate a tissue deficiency of vitamin B12 and/or folate.
During the first treatment phase with cobalamin, most patients followed the expected pattern, i.e., decreasing serum MMA and tHcy levels. However, there is reason to believe that the 23% who had increasing serum tHcy and
31
falling serum folate levels also had a folate deficiency. In a situation where they needed both vitamins, they received only cobalamin, which speeded up the cobalamin turnover, which in turn required a methyl group from the accumulated folate molecule, which in turn lowered the serum folate levels. On adding folic acid to the treatment, the serum tHcy levels decreased. In retrospect, we found that those who responded to the cobalamin treatment had a significantly higher MMA than the non-responders, indicating a pure vitamin B12 deficiency. However, the MMA values were still within the laboratory-defined normal range and could not have been used to separate those with pure vitamin B12 deficiency from those with folate or mixed deficiency.
According to the textbooks and some studies, neurological symptoms and findings appear to be irreversible [19, 71, 73]. Carmel et al. reported that patients older than 70 had less improvement from neuropathy and myelopathy than those below that age [108]. However, in our study, vibration sense measures, especially in the long nerve paths, as well as neurological symptoms tended to improve during the follow-up period. Perhaps advanced neurological damage is irreversible whereas early changes may be possible to reverse? There was also a tendency towards improvement of oral mucosa findings. After the treatment period, the treated persons had a sign and symptom prevalence similar to the referents.
Hvas et al. performed a randomised placebo-controlled study of men and women 18 years or older who had a plasma MMA of 0.40-2.00 µmol/L [109]. The outcome variable was health-related quality of life. They found only a limited effect on health-related quality of life. However, they measured well-being while we measured symptoms presumably related to vitamin deficiency. In a recent study in Denmark, Hvas et al [110] found that cobalamin treatment is efficient in reducing plasma MMA and tHcy, but they question the clinical benefit from cobalamin treatment of increased plasma MMA in the interval 0.40-2.00 µmol/L. They also followed untreated persons with elevated plasma MMA levels over 1.0-3.9 years and found that increased levels of plasma MMA did not predict a further increase with time and clinical vitamin B12 deficiency manifestations [67].
Those who had cobalamin or folic acid treatment had, as expected, higher serum cobalamin and folate levels and lower levels of serum tHcy and MMA. However, those who took multivitamins showed the same tendency, as also reported from the Framingham Offspring Study and NHANES III [111, 112], and lower serum tHcy and MMA levels than those who had no vitamin treatment. The Atherosclerosis Risk in Communities (ARIC) Study also found a lower plasma Hcy level among users of vitamin supplements than among nonusers [113]. Similar findings were reported from the Framingham Heart Study, from the New Mexico Aging Process Study, from the Hordaland study, from another Swedish study and from a study from Albuquerque [7, 24, 29, 41, 107].

32
Amongst those who were multivitamin users, only 25% had increased serum MMA or tHcy levels, findings similar to those reported by Kato et al. [114], about the same proportion as among those who had cobalamin or folic acid therapy. The effects of multivitamin preparations appear to be similar to those of cobalamin or folic acid in spite of the lower doses. The positive effect may be due to the fact that multivitamin preparations contain cobalamin as well as folic acid. The combined preparations seem to be effective, at least as preventive treatment. The positive effect may also be due to the addition of trace elements, mainly zinc, which is necessary for the enzyme betaine-homocysteine methyl transferase (BHMT) [25]. The jejunal brush border enzyme pteroylpolyglutamate hydrolase, often called “folate conjugase”, which cleaves the dietary complex folates into monofolates to make them absorbable, is also zinc dependent [115, 116].
During the last few years, many reports have indicated that increased serum tHcy levels may be not only indicative of vitamin tissue deficiency but also a risk factor for various diseases. Prospective and case-control studies indicate that mild increases of plasma tHcy are associated with an increased risk of cerebrovascular, peripheral vascular and cardiovascular diseases [8, 107, 117-120 ]. It is still under debate whether elevated serum tHcy is a causal risk factor or only a risk marker. Increased tHcy levels have been suggested to exert a toxic effect on the vascular endothelium or to have thrombogenic effects, i.e. be a causal factor [119, 120]. On the other hand, increased serum tHcy levels may be a result or a sign of a metabolic disturbance. It has been suggested that Hcy might be an acute phase reactant [121].
More recently, there has been interest in the potential links between tHcy, folate and cancer prevalence rate [122, 123]. Folate deficiency causes uracil misincorporation into DNA and chromosomal breakage. Such breaks could contribute to the risk of cancer and also to neuronal damage [124]. Giovannucci et al. reported that intake of multivitamins containing folic acid could reduce the prevalence of colorectal cancer [125], and Zhang et al. reported that folic acid will reduce the excess risk of breast cancer associated with alcohol consumption [122]. During periods of rapid cell generation and growth, e.g. pregnancy, it is extremely injurious to be deficient of B12 or folate. Infertility, spontaneous abortion, neural tube and other birth defects and pregnancy complications [126-129] have all been associated with vitamin deficiency and enzyme defects.
For a long time, folate status has been supposed to be associated with various mental disorders, such as dementia of both vascular origin and Alzheimer`s disease [130, 131]. A suggested plausible pathogenic mechanism is the involvement of folate in maintaining an adequate supply of methyl groups for the many methylation reactions which are essential in maintaining normal brain metabolism and function. Increased levels of serum or plasma tHcy have also been found to be associated with cognitive
33
impairment. A possible explanation might be that increased Hcy levels potentiate endothelial and neuronal oxidative injury in vascular disease and Alzheimer's disease [132, 133].
Are, elevated serum tHcy levels unfavourable or even dangerous then? Would the risk of contracting disease decrease if incipient deficiency were treated? So far, there are no clear answers to these questions but large-scale, prospective studies are under way and might provide the answers [134, 135].
During a 12-month period, about 50% of the population see their general practitioner, and 85% do so during a 5-year period [136]. Due to this circumstance, opportunistic screening might be used to find the early cases. Opportunistic screening in this case means that when an elderly person sees his or her doctor special attention should be paid to the possibility of vitamin deficinecy, especially if symptoms, such as oral or tongue symptoms, are present. The economic balance is positive, since the costs for opportunistic screening are small compared to the care costs when neuropathy or dementia has developed and may be irreversible. In addition, unnecessary suffering may be avoided.
ConclusionsHalf or more of the general population 70 years or older had laboratory
indications of a latent or overt deficiency of tissue vitamin B12 or folate. Among those who took multivitamin preparations, the proportion was about one fourth. The majority of those who had laboratory signs of latent or overt tissue vitamin B12 or folate deficiency had fairly normal serum cobalamin and folate levels and normal haematology. For these reasons, serum MMA and tHcy should be considered as possible complements to the serum cobalamin and folate blood tests in cases of suspected tissue vitamin B12 or folate deficiency.
In early deficiency of vitamin B12 or folate, there are few clinical symptoms. Changes in the oral mucosa were the only signs and symptoms found in this study, indicating that these may be the early symptoms. The traditional symptoms of vitamin deficiency seem to appear later in the course.
Cobalamin treatment normalises increased serum MMA values and combined cobalamin and folic acid treatment normalises serum tHcy, suggesting a pretreatment deficiency of tissue vitamin B12 and folate in spite of serum cobalamin and folate values within the conventional laboratory ranges in the majority of cases.
The haematological changes regarding serum cobalamin, folate, MMA and tHcy seen after 6-9 months of follow-up remained after 36 months. There was a tendency towards improvement of vibration sense, especially in the long nerve paths, improvement of neurological symptoms and

34
improvement of oral mucosa findings. No improvement in other symptoms, reflex activity or Minimental State Examination score was seen. These results indicate that vitamin treatment of elderly individuals in the early phase of the condition may reverse damage that otherwise may become lingering or irreversible. If treatment is instituted, it should be combined cobalamin and folic acid treatment.
35
Acknowledgements I wish to express my sincere gratitude to:
Professor Kurt Svärdsudd, my supervisor, for outstanding scientific teaching, for sharing his extensive knowledge and for always having such a good mood and sense of humour.
The late Professor Gösta Tibblin, for his enthusiasm and for making a fire of my first glow of research.
Margaretha Eriksson, my understanding research colleague at the Department of Public Health and Caring Sciences, Family Medicine and Clinical Epidemiology Section, who never stops encouraging and feeding me.
The staff at the Family Medicine and Clinical Epidemiology Section, Annika Bardel, Karin Modin, Anna-Lena Blom, Annie Lundberg, and Barbro Rolén, for help, support and friendship.
Ingrid Wennström, for excellent laboratory service. Sten Jameson, for his good advice, extensive knowledge and mentorship. John Gulliver, for linguistic revision of the English manuscripts. My GP colleague and best friend, Maria Sandblom, for always being there. My GP colleagues and workmates at the Primary Health Care, who believed
in me. Mrs Katharina Svärdsudd, for all her patience with telephone calls during
dinners and at weekends and holidays. The 224 persons who participated, their relatives and the staff in elderly care
who made this study possible. My mother, Gurli, who taught me to be independent, that nothing is
impossible, and that women are capable of doing almost anything. My beloved husband Torbjörn, for his outstanding patience, his generous
attitude and for giving me joy in my life. Our lovely children, Ulrika, Magnus, Maria and Kristina and their families,
for support and for giving me so much love and encouragement through the years, and for just being there.
This study was supported by grants from Uppsala County Council, Pharmacia & Upjohn Research Foundation, Dumex Research Foundation, Orion Research Foundation, Salus Research Foundation and Uppsala University.

36
References1. Joosten E, van den Berg A, Riezler R, Naurath HJ, Lindenbaum J,
Stabler SP, Allen RH. Metabolic evidence that deficiencies of vitamin B-12 (cobalamin), folate, and vitamin B-6 occur commonly in elderly people. Am J Clin Nutr 1993; 58: 468-76.
2. Stabler SP, Lindenbaum J, Allen RH. Vitamin B-12 deficiency in the elderly: current dilemmas. Am J Clin Nutr 1997; 66: 741-9.
3. Pennypacker LC, Allen RH, Kelly JP, Matthews LM, Grigsby J, Kaye K, Lindenbaum J, Stabler SP. High prevalence of cobalamin deficiency in elderly outpatients. J Am Geriatr Soc 1992; 40: 1197-1204.
4. Scott JM. Bioavailability of vitamin B12. Eur J Clin Nutr 1997; 51 Suppl. 1: S49-S53.
5. Gregory III J. Bioavailability of folate. Eur J Clin Nutr 1997; 51 Suppl. 1:S54-S59.
6. Nilsson-Ehle H. Age-related changes in cobalamin (vitamin B12) handling. Drugs & Aging 1998; 12: 277-92.
7. Nygård O, Refsum H, Ueland PM, Vollset SE. Major lifestyle determinants of plasma total homocysteine distribution: the Hordaland Homocysteine Study. Am J Clin Nutr 1998; 67: 263-70.
8. Ueland PM, Hustad S, Schneede J, Refsum H, Vollset SE. Biological and clinical implications of the MTHFR C677T polymorphism. Trends Pharmacol Sci 2001; 22: 195-201.
9. Carmel R: Malabsorption of food cobalamin. Baillière´s Clin Haematol 1995; 639-55.
10. Kasper H. Vitamin absorption in the elderly. Int J Vitam Nutr Res 1999; 69: 169-72.
11. Rosenberg IH, Miller JW. Nutritional factors in physical and cognitive functions of elderly people. Am J Clin Nutr 1992; 55: 1237S-43S.
12. van Asselt DZB, de Groot LCPGM, van Staveren WA, Blom HJ, Wevers RA, Biemond I, Hoefnagels WHL. Role of cobalamin intake and atrophic gastritis in mild cobalamin deficiency in older Dutch subjects. Am J Clin Nutr 1998; 68: 328-34.
13. Krasinski SD, Russell RM, Samloff M, Jacob RA, Dallal GE, McGandy RB, Hartz SC. Fundic atrophic gastritis in an elderly population. J Am Geriatr Soc 1986; 34: 800-6.
14. Rasmussen K. Solid-phase sample extraction for rapid determination of methylmalonic acid in serum and urine by a stable-isotope-dilution method. Clin Chem 1989; 35: 260-4.
15. Lindenbaum J, Healton EB, Savage DG, Brust JCM, Garrett TJ, Podell ER, Marcell PD, Stabler SP, Allen RH. Neuropsychiatric
37
disorders caused by cobalamin deficiency in the absence of anemia or macrocytosis. N Engl J Med 1988; 318: 1720-8.
16. Stabler SP, Allen RH, Savage DG, Lindenbaum J. Clinical spectrum and diagnosis of cobalamin deficiency. Blood 1990; 76: 871-81.
17. Moelby L, Rasmussen K, Jensen MK, Pedersen KO. The relationship between clinically confirmed cobalamin deficiency and serum methylmalonic acid. J Intern Med 1990; 228: 373-8.
18. Naurath HJ, Joosten E, Riezler R, Stabler SP, Allen RH, Lindenbaum J. Effects of vitamin B12, folate, and vitamin B6 supplements in elderly people with normal serum vitamin concentrations. Lancet 1995; 346: 85-9.
19. Healton EB, Savage DG, Brust JCM, Garrett TJ, Lindenbaum J. Neurologic aspects of cobalamin deficiency. Medicine 1991; 70: 229-45.
20. Stabler SP. Screening the older population for cobalamin (vitamin B12) deficiency. J Am Geriatr Soc 1995; 43: 1290-7.
21. Brattström LE, Israelsson B, Jeppsson J-O, Hultberg BL. Folic acid - an innocuous means to reduce plasma homocysteine. Scand J Clin Lab Invest 1988; 48: 215-21.
22. Kang S-S, Wong PWK, Norusis M. Homocysteinemia due to folate deficiency. Metabolism 1987; 36: 458-62.
23. Stabler SP, Marcell PD, Podell ER, Allen RH, Savage DG, Lindenbaum J. Elevation of total homocysteine in the serum of patients with cobalamin or folate deficiency detected by capillary gas chromatography-mass spectrometry. J Clin Invest 1988; 81: 466-74.
24. Brattström L, Lindgren A, Israelsson B, Andersson A, Hultberg B. Homocysteine and cysteine: determinants of plasma levels in middle-aged and elderly subjects. J Intern Med 1994; 236: 633-41.
25. Norman S, Garrow M, Garrow TA. Human betaine–homocysteine methyltransferase is a zinc metalloenzyme. Arch Biochem Biophys1998; 356: 93-8.
26. Lindenbaum J, Rosenberg IH, Wilson PWF, Stabler SP, Allen RH. Prevalence of cobalamin deficiency in the Framingham elderly population. Am J Clin Nutr 1994; 60: 2-11.
27. Hultberg B, Andersson A, Sterner G. Plasma homocysteine in renal failure. Clin Nephrol 1993; 40: 230-4.
28. Nexö E, Hansen M, Rasmussen K, Lindgren A, Gräsbeck R. How to diagnose cobalamin deficiency. Scand J Clin Lab Invest 1994; 54 (Suppl 219): 61-76.
29. Koehler KM, Romero LJ, Stauber PM, Pareo-Tubbeh SL, Chi Liang H, Baumgartner RN, Garry PJ, Allen RH, Stabler SP. Vitamin supplementation and other variables affecting serum homocysteine and methylmalonic acid concentrations in elderly men and women. J Am Coll Nutr 1996; 15: 364-76.

38
30. Nilsson K, Gustafson L, Hultberg B. Plasma homocysteine is a sensitive marker for tissue deficiency of both cobalamines and folates in a psychogeriatric population. Dement Geriatr Cogn Disord 1999; 10: 476-82.
31. Selhub J, Jacques PF, Wilson PWF, Rush D, Rosenberg IH. Vitamin status and intake as primary determinants of homocysteinemia in an elderly population. JAMA 1993; 270: 2693-8.
32. Allen RH, Stabler SP, Savage DG, Lindenbaum J. Diagnosis of cobalamin deficiency I: Usefulness of serum methylmalonic acid and total homocysteine concentrations. Am J Hematol 1990; 34: 90-8.
33. Statistical Yearbook of Sweden. Stockholm: Statistic Sweden. 1994. 34. Folstein MF, Folstein SE, McHugh PR. “Mini-Mental State”: A
practical method for grading the cognitive state of patients for the clinician. J Psychiat Res 1975; 12: 189-98.
35. JMP version 3.1.5. SAS Institute Inc. SAS Campus Drive, Cary, NC, USA 1995.
36. StatView SE, Abacus Concepts, Inc. 1988. 37. Statistical Analysis System. SAS Institute Inc. SAS Campus Drive,
Cary, NC, USA 1995. 38. Nilsson-Ehle H, Jagenburg R, Landahl S, Lindstedt S, Svanborg A,
Westin J. Serum cobalamins in the elderly: A longitudinal study of a representative population sample from age 70 to 81. Eur J Haematol 1991; 47: 10-6.
39. Schroll K, Carbajal A, Decarli B, Martins I, Grunenberger F, Blauw YH, de Groot CPGM. Food patterns of elderly Europeans. SENECA investigators. Eur J Clin Nutr 1996; 50, Suppl 2: S86-100.
40. Joosten E, Lesaffre R, Riezler R. Are different reference intervals for methylmalonic acid and total homocysteine necessary in elderly people? Eur J Haematol 1996; 57: 222-6.
41. Tucker KL, Selhub J, Wilson PWF, Rosenberg IH. Dietary intake pattern relates to plasma folate and homocysteine concentrations in the Framingham Heart Study. J Nutr 1996; 126: 3025-31.
42. Herrmann W, Quast S, Ullrich M, Schultze H, Bodis M, Geisel J. Hyperhomocysteinemia in high-aged subjects: relation of B-vitamins, folic acid, renal function and methylenetetrahydrofolate reductase mutation. Atherosclerosis 1999; 144: 91-101.
43. Marcucci R, Prisco D, Brunelli T, Pepe G, Gori AM, Fedi S, Capanni M, Simonetti I, Federici G, Pastore A, Abbate R, Gensini GF. Tissue factor and homocysteine levels in ischemic heart disease are associated with angiographically documented clinical recurrences after coronary angioplasty. Thromb Haemostat 2000; 83: 826-32.
44. Nygård O, Vollset SE, Refsum H, Stensvold I, Tverdal A, Nodrehaug JE, Ueland PM, Kvåle G. Total plasma homocysteine and cardiovascular risk profile. JAMA 1995; 274: 1526-33.
39
45. Arnadottir M, Hultberg B, Nilsson-Ehle P, Thysell H. The effect of reduced glomerular filtration rate on plasma total homocysteine concentration. Scand J Clin Lab Invest 1996; 56: 41-6.
46. den Heijer M, Brouwer IA, Bos GMJ, Blom HJ, van der Put NMJ, Spaans AP, Rosendaal FR, Thomas CMG, Haak HL, Wijermans PW, Gerrits WBJ. Vitamin supplementation reduces blood homocysteine levels. Arterioscler Thromb Vasc Biol 1998; 18: 356-61.
47. Nygård O, Refsum H, Ueland PM, Stensvold I, Nordrehaug JE, Kvåle G, Vollset SE. Coffee consumption and plasma total homocysteine: The Hordaland Homocysteine Study. Am J Clin Nutr 1997; 65: 136-43.
48. Haller J. The vitamin status and its adequacy in the elderly: an international overview. Int J Vitam Nutr Res 1999; 69; 160-8.
49. Watanabe F, Abe K, Fujita T, Goto M, Hiemori M, Nakano Y. Effects of microwave heating on the loss of vitamin B(12) in foods. J Agric Food Chem 1998; 46: 206-10.
50. McKillop DJ, Pentieva K, Daly D, McPartlin JM, Hughes J, Strain JJ, Scott JM, McNulty H. The effect of different cooking methods on folate retention in various foods that are amongst the major contributors to folate intake in the UK diet. British Journal of Nutrition 2002; 88: 681-8.
51. Carmel R. Prevalence of undiagnosed pernicious anemia in the elderly. Arch Intern Med 1996; 156: 1097-100.
52. Andrès E, Goichot B, Schlienger JL. Food cobalamin malabsorption: ausual cause of vitamin B12 deficiency. Arch Intern Med 2000; 160: 2061-2.
53. van Asselt DZ, Blom HJ, Zuiderent R, Wevers RA, Jakobs C, van den Broek WJ, Lamers CB, Cortens FH, Hoefnagels WH. Clinical significance of low cobalamin levels in older hospital patients. Netherl J Med 2000; 57: 41-9.
54. Adams JF, Clark JS, Ireland JT, Kesson CM, Watson WS. Malabsorption of vitamin B12 and intrinsic factor secretion during biguanide therapy. Diabetologia 1983; 24: 16-8.
55. Tomkin GH, Hadden DR, Weaver JA, Montgomery DAD. Vitamin B12 status of patients on long-term metformin therapy. Br Med J 1971; 2: 685-7.
56. Carlsen SM, Følling I, Grill V, Bjerve KS, Schneede J, Refsum H. Metformin increases total serum homocysteine levels in non-diabetic male patients with coronary heart disease. Scand J Clin Invest 1997; 57: 521-7.
57. Fröscher W, Maier V, Laage M, Wolfersdorf M, Straub R, Rothmeier J, Steinert T, Fiaux A, Frank U, Grupp D. Folate deficiency, anticonvulsant drugs, and psychiatric morbidity. Clin Neuropharm 1995; 18: 165-82.

40
58. James GK, Jones MW, Pudek MR. Homocyst(e)ine levels in patients on phenytoin therapy. Clin Biochem 1997; 30: 647-9.
59. Marcuard SP, Albernaz L, Khazanie PG. Omeprazole therapy causes malabsorption of cyanocobalamin (Vitamin B12). Ann Intern Med 1994; 120: 211-5.
60. Salom IL, Silvis SE; Doscherholmen A. Effect of cimetidine on absorption of vitamin B12. Scand J Gastroenterol. 1982; 17: 129-31.
61. Brattström L, Wilcken DEL. Homocysteine and cardiovascular disease: cause or effect? Am J Clin Nutr 2000; 72: 315-23.
62. Brattström L, Wilcken DEL, Öhrvik J, Brudin L. Common methylenetetrahydrofolate reductase gene mutation leads to hyperhomocysteinemia but not to vascular disease. Circulation 1998; 98: 2520-6.
63. Nilsson K, Gustafson L, Hultberg B. Role of impaired renal function as a cause of elevated plasma homocysteine concentration in psychogeriatric patients. Scand J Clin Lab Invest 2002; 62: 385-390.
64. Bates CJ, Mansoor MA, van der Pols J, Prentice A, Cole TJ, Finch S. Plasma total homocysteine in a representative sample of 972 British men and women aged 65 and over. Eur J Clin Nutr 1997; 51: 691-7.
65. Jacques PF, Rosenberg IH, Rogers G, Selhub J, Bowman BA, Gunter EW, Wright JD, Johnson CL. Serum total homocysteine concentrations in adolescent and adult Americans: results from the third National Health and Nutrition Examination Survey. Am J Clin Nutr 1999; 69: 482-9.
66. Allen RH, Stabler SP, Savage DG, Lindenbaum J. Metabolic abnormalities in cobalamin (vitamin B12) and folate deficiency. FASEB J 1993; 7: 1344-53.
67. Hvas A-M, Ellegaard J, Nexø E. Increased plasma methylmalonic acid level does not predict clinical manifestations of vitamin B12 deficiency. Arch Intern Med 2001; 161: 1534-41.
68. Nilsson K, Gustafson L, Hultberg B. Optimal use of markers for cobalamin and folate status in a psychogeriatric population. Int J Geriatr Psychiatry 2002; 17: 919-25.
69. Waters AH, Mollin DL. Observations on the metabolism of folic acid in pernicious anaemia. Brit J Haemat 1963; 9: 319-26.
70. Kuzminski AM, Del Giacco EJ,. Allen RH, Stabler SP, Lindenbaum J. Effective treatment of cobalamin deficiency with oral cobalamin. Blood 1998; 92: 1191-8.
71. Fine EJ, Soria E, Paroski MW, Petryk D, Thomasula L. The neurophysiological profile of vitamin B12 deficiency. Muscle Nerve 1990; 13: 158-64.
72. Nations SP, Saperstein DS, Wolfe GI, Bryan WW, Barohn RJ. Clinical profile of vitamin B12 neuropathy. Neurology 1998; 50 (suppl): A208-9.
41
73. Saperstein DS, Barohn RJ. Peripheral neuropathy due to cobalamin deficiency. Curr Treat Options Neurol 2002; 4: 197-201.
74. Nilsson-Ehle H, Jagenburg R, Landahl S, Svanborg A, Westin J. Decline of blood haemoglobin in the aged: a longitudinal study of an urban Swedish population from age 70 to 81. Br J Haematol 1989; 71: 437-42.
75. Hvas A-M, Ellegard J, Nexø E. Vitamin B12 treatment normalizes metabolic markers but has limited clinical effect: A randomized placebo-controlled study. Clin Chem 2001; 47: 1396-404.
76. Thongprasom K, Youngnak P, Aneksuk V. Folate and vitamin B12 levels in patients with oral lichen planus, stomatitis or glossitis. S Asian J Trop Med Public Health 2001; 32: 643-7.
77. Nilsson-Ehle H, Landahl S, Lindstedt G, Netterblad L, Stockbruegger R, Westin J, Åhren C. Low serum cobalamin levels in a population study of 70- and 75-year-old subjects. Gastrointestinal causes and hematological effects. Dig Dis Sci 1989; 34: 716-23.
78. Lindgren A, Lindstedt G, Kilander AF. Advantages of serum pepsinogen A combined with gastrin or pepsinogen C as first-line analytes in the evaluation of suspected cobalamin deficiency: a study in patients previously not subjected to gastrointestinal surgery. J Intern Med 1998; 244: 341-9.
79. Regland B, Gottfries C-G, Lindstedt G. Dementia patients with low serum cobalamin concentration: Relationship to atrophic gastritis. Aging Clin Exp Res 1992; 4: 35-41.
80. Haller J, Weggemans RM, Ferry M, Guigoz Y. Mental health: minimental state examination and geriatric depression score of elderly Europeans in the SENECA study of 1993. Eur J Clin Nutr 1996; 50, Suppl 2: S112-6.
81. Goodwin JS, Goodwin JM, Garry PJ. Association between nutritional status and cognitive functioning in a healthy elderly population. JAMA 1983; 249: 2917-21.
82. Levitt AJ, Karlinsky H. Folate, vitamin B12 and cognitive impairment in patients with Alzheimer´s disease. Acta Psychiatr Scand 1992; 86: 301-5.
83. Nilsson K, Gustafson L, Fält R, Andersson A, Brattström L, Lindgren A, Israelsson B, Hultberg B. Hyperhomocysteinaemia – a common finding in a psychogeriatric population. Eur J Clin Invest 1996; 26: 853-9.
84. Riggs KM, Spiro III A, Tucker K, Rush D. Relations of vitamin B-12, vitamin B-6, folate, and homocysteine to cognitive performance in the Normative Aging Study. Am J Clin Nutr 1996; 63: 306-14.
85. Wahlin Å, Hill RD, Winblad B, Bäckman L. Effects of serum vitamin B12 and folate status on episodic memory performance in very old age: A population-based study. Psychol Aging 1996; 11: 487-96.
42
86. Joosten E, Lesaffre E, Riezler R, Ghekiere V, Dereymaeker L, Pelemans W, Dejaeger E. Is metabolic evidence for vitamin B-12 and folate deficiency more frequent in elderly patients with Alzheimer´s disease? J Gerontol A Biol Sci Med 1997; 52A: M76-9.
87. Bernard MA, Nakonezny PA, Kashner TM. The effect of vitamin B12 deficiency on older veterans and its relationship to health. J Am Geriatr Soc 1998; 46: 1199-206.
88. Clarke R, Smith AD, Jobst KA, Refsum H, Sutton L, Ueland PM. Folate, vitamin B12, and serum total homocysteine levels in confirmed Alzheimer disease. Arch Neurol 1998; 55: 1449-55.
89. Ebly EM, Schaefer JP, Campbell NRC, Hogan DB. Folate status, vascular disease and cognition in elderly Canadians. Age and Ageing 1998; 27: 485-91.
90. Lehmann M, Gottfries CG, Regland B. Identification of cognitive impairment in the elderly: Homocysteine is an early marker. Dem Ger Cog Dis 1999; 10: 12-20.
91. Nilsson K, Gustafson L, Hultberg B. The plasma homocysteine concentration is better than that of serum methylmalonic acid as a marker for sociopsychological performance in a psychogeriatric population. Clin Chem 2000; 46: 691-6.
92. Wang H-X, Wahlin Å, Basun H, Fastbom J, Winblad B, Fratiglioni L. Vitamin B12 and folate in relation to the development of Alzheimer's disease. Neurology 2001; 56: 1188-94.
93. Seshadri S, Beiser A, Selhub J, Jaques PF, Rosenberg IH, D'Agostino RB, Wilson PWF, Wolf PA. Plasma homocysteine as a risk factor for dementia and Alzheimer's disease. N Engl J Med 2002; 346: 476-83.
94. Kristensen MØ, Gulmann NC, Christensen JEJ, Østergaard K, Rasmussen K. Serum cobalamin and methylmalonic acid in Alzheimer dementia. Acta Neurol Scand 1993; 87: 475-81.
95. Lindenbaum J, Savage DG, Stabler SP, Allen RH. Diagnosis of cobalamin deficiency: II. Relative sensitivities of serum cobalamin, methylmalonic acid, and total homocysteine concentrations. Am J Hematol 1990; 34: 99-107.
96. Brattström L, Israelsson B, Norrving B, Bergqvist D, Thörne J, Hultberg B, Hamfelt A. Impaired homocysteine metabolism in early-onset cerebral and peripheral occlusive arterial disease. Atherosclerosis 1990; 81: 51-60.
97. Ubbink JB, Vermaak WJH, van der Merwe A, Becker PJ. Vitamin B-12, vitamin B-6, and folate nutritional status in men with hyperhomocysteinemia. Am J Clin Nutr 1993; 57: 47-53.
98. Joosten E, Pelemans W, Devos P, Lesaffre E, Goossens W, Criel A, Verhaeghe R. Cobalamin absorption and serum homocysteine and methylmalonic acid in elderly subjects with low serum cobalamin. Eur J Haematol 1993; 51: 25-30.
43
99. Ubbink JB, Vermaak WJH, van der Merwe A, Becker PJ, Delport R, Potgieter HC. Vitamin requirements for the treatment of hyperhomocysteinemia in humans. J Nutr 1994; 124: 1927-33.
100. Landgren F, Isrealsson B, Lindgren A, Hultberg B, Andersson A, Brattström L. Plasma homocysteine in acute myocardial infarction: homocysteine-lowering effect of folic acid. J Intern Med 1995; 237: 381-8.
101. Rasmussen K, Møller J, Lyngbak M, Holm Pedersen A-M, Dybkjær. Age- and gender- specific reference intervals for total homocysteine and methylmalonic acid in plasma before and after vitamin supplementation. Clinical Chemistry 1996; 42: 630-6.
102. Woodside JV, Yarnell JWG, McMaster D, Young IS, Harmon DL, McCrum EE, Patterson CC, Gey KF, Whitehead AS, Evans A. Effect of B-group vitamins and antioxidant vitamins on hyperhomocysteinemia: a double-blind, randomized, factorial-design, controlled trial. Am J Clin Nutr 1998; 67: 858-66.
103. Dierkes J, Kroesen M, Pietrzik K. Folic acid and vitamin B6 supplementation and plasma homocysteine concentrations in healthy young women. Internat J Vit Nutr Res 1998; 68: 98-103.
104. Santhosh-Kumar CR, Deutsch JC, Ryder JW, Kolhouse JF. Unpredictable intra-individual variations in serum homocysteine levels on folic acid supplementation. Eur J Clin Nutr 1997; 51: 188-92.
105. Lindgren A, Swolin B, Nilsson O, Johansson KW, Kilander AF. Serum methylmalonic acid and total homocysteine in patients with suspected cobalamin deficiency: A clinical study based on gastrointestinal histopathological findings. Am J Hematol 1997; 56: 230-8.
106. Nilsson K, Gustafson L. Plasma methylmalonic acid in relation to serum cobalamin and plasma homocysteine in a psychogeriatric population and the effect of cobalamin treatment. Int J Geriatr Psychiatry 1997; 12: 67-72.
107. Garry PJ, Goodwin JS, Hunt WC. Folate and vitamin B12 status in a healthy elderly population. J Am Geriatr Soc 1984; 32: 719-26.
108. Carmel R, Karnaze DS. Physician response to low serum cobalamin levels. Arch Intern Med 1986; 146: 1161-5.
109. Hvas A-M, Juul S, Nexø E, Ellegaard J. Vitamin B-12 treatment has limited effect on health-related quality of life among individuals with elevated plasma methylmalonic acid: a randomized placebo-controlled study. J Intern Med 2003; 253: 146-52.
110. Hvas A-M, Lous J, Ellegaard J, Nexø E. Use of plasma methylmalonic acid in diagnosing vitamin B-12 deficiency in general practice. Scand J Prim Health Care 2002; 20: 57-9.
44
111. Tucker KL, Rich S, Rosenberg I, Jacques P, Dallal G, Wilson PWF, Selhub J. Plasma vitamin B-12 concentrations relate to intake source in the Framingham Offspring Study. Am J Clin Nutr 2000; 71: 514-22.
112. Ford ES, Bowman BA. Serum and red blood cell folate concentrations, race, and education: findings from the third National Health and Nutrition Examination Survey. Am J Clin Nutr 1999; 69: 476-81.
113. Shimakawa T, Nieto FJ, Malinow MR, Chambless LE, Schreiner PJ, Szklo M. Vitamin intake: a possible determinant of plasma homocyst(e)ine among middle-aged adults. Ann Epidemiol 1997; 7: 285-93.
114. Kato I, Dnistrian AM, Schwartz M, Toniolo P, Koenig K, Shore RE, Zeleniuch-Jacquotte A, Akhmedkhanov A, Riboli E. Epidemiologic correlates of serum folate and homocysteine levels among users and non-users of vitamin supplement. Int J Vitamin Nutr Res 1999; 69: 322-9.
115. Tamura T, Shane B, Baer MT, King JC, Margren S, Stokstad ELR. Absorption of mono- and polyglutamyl folates in zinc-depleted man. Am J Clin Nutr 1978; 31: 1984-7.
116. Chandler CJ, Wang TTY, Halsted CH. Pteroylglutamate hydrolase from human jejunal brush borders. J Biol Chem 1986; 261: 928-33.
117. Refsum H, Ueland PM: Homocysteine and cardiovascular disease; Annu Rev Med 1998; 49: 31-62.
118. Marcucci R, Prisco D, Brunelli T, Pepe G, Gori AM, Fedi S, Capanni M, Simonetti I, Federici G, Pastore A, Abbate R, Gensini GF. Tissue factor and homocysteine levels in ischemic heart disease are associated with angiographically documented clinical recurrences after coronary angioplasty. Thromb Haemost 2000; 83: 826-32.
119. Scott JM. Homocysteine and cardiovascular risk. Am J Clin Nutr 2000; 72: 333-4.
120. Nygård O, Vollset SE, Refsum H, Brattström L, Ueland PM. Total homocysteine and cardiovascular disease. J Int Med 1999; 246: 425-54.
121. Christen WG, Ajani UA, Glynn RJ, Hennekens CH. Blood levels of homocysteine and increased risks of cardiovascular disease. Arch Intern Med 2000; 160: 422-34.
122. Zhang S, Hunter DJ, Hankinson SE, Giovannucci EL, Rosner BA, Colditz GA, Speizer FE, Willett WC. A prospective study of folate intake and the risk of breast cancer. JAMA 1999; 281: 1632-7.
123. Kim YI. Methylenetetrahydrofolate reductase polymorphisms, folate, and cancer risk: A paradigm of gene-nutrient interactions in carcinogenesis. Nutr Rev 2000; 58: 205-9.
45
124. Blount BC, Mack MM, Wehr CM, MacGregor JT, Hiatt RA, Wang G, Wickramasinghe SN, Everson RB, Ames BN. Folate deficiency causes uracil misincorporation into human DNA and chromosome breakage: Implications for cancer and neuronal damage. Proc Natl Acad Sci 1997; 94: 3290-5.
125. Giovannucci E, Stampfer MJ, Colditz GA, Hunter DJ, Fuchs C, Rosner BA, Speizer FE, Willett WC. Multivitamin use, folate and colon cancer in women in the Nurses´ Health Study. Ann Intern Med 1998; 129: 517-24.
126. Wouters MGAJ, Boers GHJ, Blom HJ, Trijbels FJM, Thomas CMG, Borm GF, Stegers-Theunissen RPM, Eskes TKA. Hyperhomocysteinemia: a risk factor in women with unexplained recurrent early pregnancy loss. Fertil Steril 1993; 60: 820-5.
127. Finnell RH, Greer KA, Barber RC, Piedrahita JA, Shaw GM, Lammer EJ. Neural tube and craniofacial defects with special emphasis on folate pathway genes. Crit Rev Oral Biol Med 1998; 9: 38-53.
128. Allen LH. Vitamin B12 metabolism and status during pregnancy, lactation and infancy. Nutrient Regulation during Pregnancy, Lactation, and Infant Growth, Plenum Press, New York 1994; 173-86.
129. Munoz-Moran E, Dieguez-Lucena JL, Fernandez-Arcas N, Peran-Mesa S, Reyes-Engel A. Genetic selection and folate intake during pregnancy. Lancet 1998; 352: 1120-1.
130. Bottiglieri T. Folate, vitamin B12, and neuropsychiatric disorders; Nutr Rev 1996; 54: 382-90.
131. Weir DG, Scott JM. Brain function in the elderly: role of vitamin B12 and folate. Br Med Bull 1999; 55: 669-82.
132. Mc Caddon A, Regland B, Hudson P, Davies G. Functional vitamin B12 deficiency and Alzheimer disease. Neurology 2002; 58: 1395-9.
133. Shea TB, Lyons-Weiler J, Rogers E. Homocysteine, folate deprivation and Alzheimer neuropathology. J Alzheimer´s Dis 2002; 4: 261-7.
134. Spence JD, Howard VJ, Chambless LE, Malinow MR, Pettigrew LC, Stampler M, Toole JF. Vitamin intervention for Stroke Prevention (VISP) trial: Rationale and design. Neuroepidemiology 2001; 20: 16-25.
135. The VITATOPS (Vitamins to Prevent Stroke) Trial: Rationale and design of an international, large, simple, randomised trial of homocysteine-lowering multivitamin therapy in patients with recent
Cerebrovasc Dis 2002; 13: 120-6. 136. Andersson DKG, Svärdsudd K, Tibblin G. Prevalence and incidence
of diabetes in a Swedish community 1972-1987. Diabetic Medicine 1991; 8: 428-34.