study and analysis of solar radiation...
TRANSCRIPT

International Journal of Current Engineering and Technology E-ISSN 2277 – 4106, P-ISSN 2347 – 5161 ©2015 INPRESSCO®, All Rights Reserved Available at http://inpressco.com/category/ijcet
Research Article
3544| International Journal of Current Engineering and Technology, Vol.5, No.6 (Dec 2015)
Study and Analysis of Solar Radiation Models Garima Tiwari‡ , V.K. Katiyar‡, A.K. Katiyarϯ and C. K. Pandey†*
‡Brahmanand Post Graduate College, the Mall, Kanpur-208004, India ϯI.E.T, Sitapur Road Lucknow-226021, India †M. I. T. S, Mohanlalganj, Raebareilly Road, Lucknow, India
Accepted 03 Nov 2015, Available online 08 Nov 2015, Vol.5, No.6 (Dec 2015)
Abstract In this paper, we have reviewed various models from 2001-2014 to find out the most suitable models for the estimation of daily diffuse solar radiation data on horizontal surface. Since, these models were developed using different parameters such as clearness index, sunshine fraction, ambient temperature, humidity, atmospheric water vapor content, etc. Therefore, we have grouped models on the basis of clearness index, sunshine fraction, clearness index and sunshine fraction based models, models from other parameters, and models from extraterrestrial radiation. Further, groups are classified into linear and non-linear correlations to select the appropriate models. The performance of models have been graphically as well as statistically analyzed by four prominent locations viz. Jodhpur (26.280 N, 73.020 E), Ahmedabad (23.030 N, 72.580 E), Kolkata (22.560 N, 88.360 E) and Mumbai (18.970 N, 72.820 E) which represent the varying weather conditions of India. Finally, selected models from various groups compared with the measured data for Mumbai to find the most suitable models for the estimation of diffuse solar radiation data on horizontal surface for Indian locations.
Keywords: Parameters; atmospheric water vapor content; ambient temperature; extraterrestrial radiation. 1. Introduction
1 The demand of energy is increased due to speedy rise in population and advancement in the technology day-to-day. In the entire process of development, growth and continued existence of all living beings, solar energy can play an important role in the socio-economic development of a country. Therefore, countries should have high awareness to utilize alternative sources of energy for the most part the renewable ones. Solar radiation data is an essential component of the global energy balance which drives various systems. Unfortunately, only global radiation measurements are available on meteorological sites however; direct and diffuse solar radiation are also needed separately for many applications. For this purpose, a number of models and methods have been build up to estimate the diffuse solar radiation at poles apart places in the world. These models were typically expressed in terms of linear or polynomial fitting relating with the clearness index, sunshine fraction, some weather elements such as relative cloud cover, relative humidity, solar declination and sometimes have latitude dependency. These radiation models for one location may not successfully apply to other places. Therefore, the aim of this paper is to broadly collect and present the diffuse solar radiation models *Corresponding author: C. K. Panday
available in the literature from 2001 up to 2014. This review in sequential manner will be useful for the selection of models to estimate the diffuse solar radiation for a place of interest. Further, study has been carried out to find out the most suitable correlations for estimating the daily diffuse solar radiation over India.
Nomenclature
Monthly average daily global radiation incident on a horizontal surface (W/m2) Monthly average daily diffuse radiation incident on a horizontal surface (W/m2) H Daily global radiation incident on a horizontal surface (W/m2) Daily diffuse radiation incident on a horizontal surface (W/m2) Daily extraterrestrial radiation incident on a horizontal surface (W/m2)
Monthly average daily clearness index,
Daily clearness index,
S or Monthly average daily number of bright sunshine hours (h) or Monthly average daily maximum possible sunshine duration (h) or day length Solar elevation at solar noon Monthly average daily ambient temperature Monthly average daily relative humidity Nd Day length in hours
Fraction, in eights, of the sky covered by clouds
W Atmospheric water vapor content (in cm) Monthly mean of maximum possible sunshine hours per day

Garima Tiwari et al Study and Analysis of Solar Radiation Models
3545| International Journal of Current Engineering and Technology, Vol.5, No.6 (Dec 2015)
2. Models used A variety of models or correlations have been developed by various authors to estimate the diffuse solar radiation on horizontal surface over the years. In this review paper, we have analyzed 26 models from 2001 up to 2014 which are as follows: Model 1: Miguel et al. model (2001) Miguel et al. developed third order polynomial correlation between diffuse fraction and clearness index using an assembled data set from several countries in the North Mediterranean belt area.
{
(1)
Model 2: Becker model (2001) Becker model follows valko’s approach is based on the calculation of the Linke turbidity factors for the stations Bet-Dagan, Jerusalem, Beer Sheva, Sedom and Eilat. ( ) ( ) (2)
with D diffuse radiation in W/m2 Cj seasonal correction (continual representation according to Jendritzky, 1990) =1+0.11 cos((J−15) 2 /365), with J=number of days in the year (Julian date) DR diffuse radiation by Raleigh dispersion in W/m2
=39.78 sin(h)0.35 (according to Jendritzky, 1990),with h=solar angle; DB diffuse radiation by vapour dispersion in W/m2 =2.6 sin(h)0.66 (103 B−12)0.81, with B=turbidity coefficient according to Schu¨epp; KNLM factor of cloud influence at low and medium level =0.89+0.11 10(0.17 N
LM), with NLM=number of clouds at low and medium level in tenths;
KNH factor of cirrus influence =1+0.035 NH, with NH=number of cirrus in tenths. Model 3: Oliveira et al. model (2002) Oliveira et al. using data from a tropical Sao paulo site, Brazil, proposed a fourth order polynomial correlation for the estimation of daily values of diffuse solar radiation.
{
( )
( )
( )
(3a)
Again, daily values of diffuse radiation for Sao Paulo city, during all months of the year can be estimated by following equation.
(3b)
Model 4: El-Sebaii et al. (2003) El-Sebaii et al using data for four Egyptian locations (Matruh, Al-Arish, Rafah and Aswan) developed three empirical correlations for estimating the monthly average daily diffuse radiation at these locations and claimed that given three models can be used for present locations as well as any Egyptian location.
(4a)
(
) (
)
(4b)
Garima Tiwari et al Study and Analysis of Solar Radiation Models
3546| International Journal of Current Engineering and Technology, Vol.5, No.6 (Dec 2015)
(
) (
)
(4c)
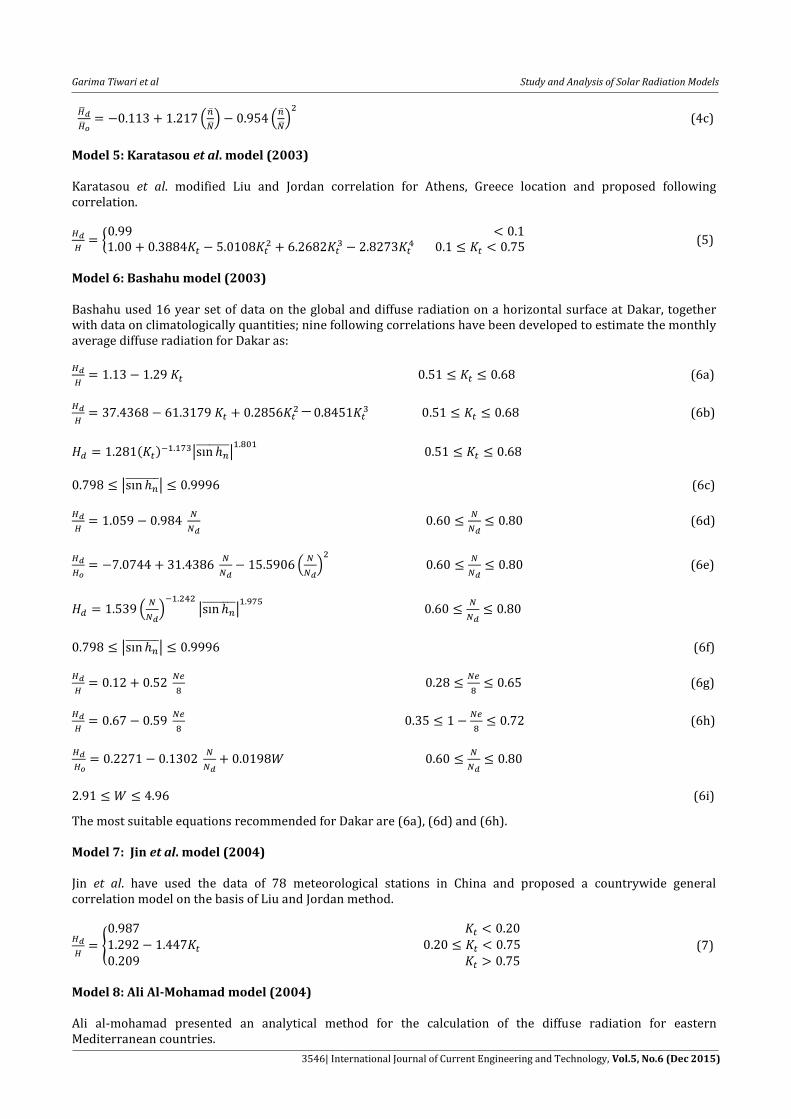
Model 5: Karatasou et al. model (2003) Karatasou et al. modified Liu and Jordan correlation for Athens, Greece location and proposed following correlation.
{
(5)
Model 6: Bashahu model (2003) Bashahu used 16 year set of data on the global and diffuse radiation on a horizontal surface at Dakar, together with data on climatologically quantities; nine following correlations have been developed to estimate the monthly average diffuse radiation for Dakar as:
(6a)
(6b)
( ) | |
| | (6c)
(6d)
(
)
(6e)
(
)
| |
| | (6f)
(6g)
(6h)
(6i)
The most suitable equations recommended for Dakar are (6a), (6d) and (6h). Model 7: Jin et al. model (2004) Jin et al. have used the data of 78 meteorological stations in China and proposed a countrywide general correlation model on the basis of Liu and Jordan method.
{
(7)
Model 8: Ali Al-Mohamad model (2004) Ali al-mohamad presented an analytical method for the calculation of the diffuse radiation for eastern Mediterranean countries.

Garima Tiwari et al Study and Analysis of Solar Radiation Models
3547| International Journal of Current Engineering and Technology, Vol.5, No.6 (Dec 2015)
(8)
Model 9: Tarhan and Sari model (2005) Sefa Tarhan and Ahmet Sari developed two hybrid models over the Central Black Sea Region of Turkey, covering five provinces- Amasya, Corum, Ordu, Samsun and Tokat. Cubic polynomial model
(9a)
Quadratic polynomial model
(9b)
Model 10: Aras et al. model (2006) Haydar Aras,Ozgur Balli and Arif Hepbasli developed twelve hybrid models to predict the monthly average daily diffuse solar radiation on a horizontal surface over Turkey’s Central Anatolia Region (CAR),which covers the 12 provinces (Afyon, Ankara, Cankiri, Corum, Eskisehir, Kayseri, Kirsehir, Konya, Nevsehir, Nigde, Sivas, and Yozgat).
(10a)
(
)
(10b)
(
)
(
)
(10c)
(10d)
(
)
(10e)
(
)
(
)
(10f)
(10g)
(10h)
(10i)
(10j)
(10k)
(10l)
Then most accurate correlation model over any selected city in the CAR of Turkey was in the cubic polynomial form given by Eq. (10i)
Model 11: Benghanem et al. model (2007) Benghanem et al. developed a correlation for medina site (Kingdom of Saudi Arabia).This correlation connecting diffuse irradiation with both clearness index and sunshine duration.
(
) (11)
Garima Tiwari et al Study and Analysis of Solar Radiation Models
3548| International Journal of Current Engineering and Technology, Vol.5, No.6 (Dec 2015)
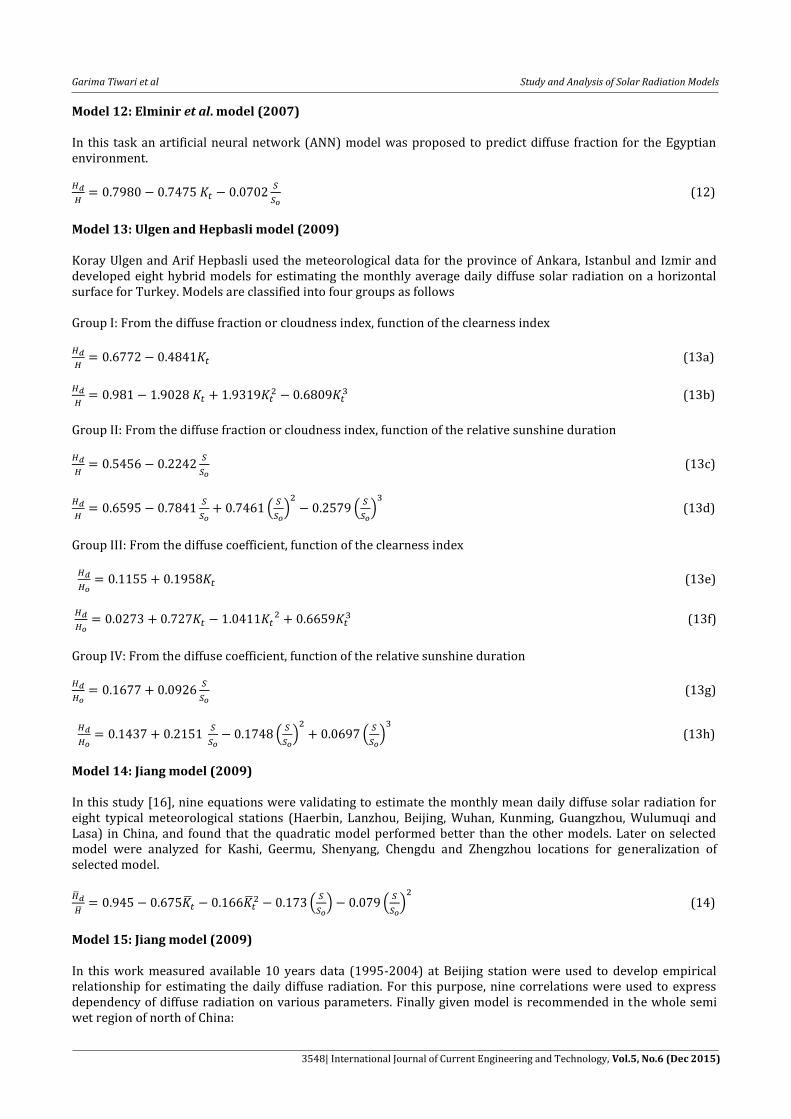
Model 12: Elminir et al. model (2007) In this task an artificial neural network (ANN) model was proposed to predict diffuse fraction for the Egyptian environment.
(12)
Model 13: Ulgen and Hepbasli model (2009) Koray Ulgen and Arif Hepbasli used the meteorological data for the province of Ankara, Istanbul and Izmir and developed eight hybrid models for estimating the monthly average daily diffuse solar radiation on a horizontal surface for Turkey. Models are classified into four groups as follows Group I: From the diffuse fraction or cloudness index, function of the clearness index
(13a)
(13b)
Group II: From the diffuse fraction or cloudness index, function of the relative sunshine duration
(13c)
(
)
(
)
(13d)
Group III: From the diffuse coefficient, function of the clearness index
(13e)
(13f)
Group IV: From the diffuse coefficient, function of the relative sunshine duration
(13g)
(
)
(
)
(13h)
Model 14: Jiang model (2009) In this study [16], nine equations were validating to estimate the monthly mean daily diffuse solar radiation for eight typical meteorological stations (Haerbin, Lanzhou, Beijing, Wuhan, Kunming, Guangzhou, Wulumuqi and Lasa) in China, and found that the quadratic model performed better than the other models. Later on selected model were analyzed for Kashi, Geermu, Shenyang, Chengdu and Zhengzhou locations for generalization of selected model.
(
) (
)
(14)
Model 15: Jiang model (2009) In this work measured available 10 years data (1995-2004) at Beijing station were used to develop empirical relationship for estimating the daily diffuse radiation. For this purpose, nine correlations were used to express dependency of diffuse radiation on various parameters. Finally given model is recommended in the whole semi wet region of north of China:

Garima Tiwari et al Study and Analysis of Solar Radiation Models
3549| International Journal of Current Engineering and Technology, Vol.5, No.6 (Dec 2015)
(
) (
)
(
)
(15)
Model 16: Pandey et al. model (2009) In this study [18] data of four prominent locations (Jodhpur, Kolkata, Mumbai and Pune) have been taken to develop correlations between the diffuse fraction and sunshine fraction for each selected locations and they also developed an All India Correlation (AIC). Pandey et al. models for Jodhpur, Kolkata, Mumbai, Pune in India respectively
(
) (
)
(
)
(16a)
(
) (
)
(
)
(16b)
(
) (
)
(
)
(16c)
(
) (
)
(
)
(16d)
AIC (I) is given as:
(
) (
)
(
)
(16e)
Model 17: El-Sebaii et al. model (2010) El-Sebaii et al. [19] analyzed the data for Jeddah, Saudi Arabia, during the period (1996-2007) and obtained following correlations.
(17a)
(
) (17b)
(
) (17c)
(17d)
Furthermore, ⁄ and ⁄ were correlated for the combination of and (
)
(
) (17e)
(
) (17f)
Model 18: Li et al. model (2011) In this study two models have been proposed to estimate the monthly average daily diffuse solar radiation based on multiple predictors including the clearness index, relative sunshine duration, ambient temperature and relative humidity. One of them was to increase the estimation accuracy.
(
) (18a)
and the other was to estimate diffuse solar radiation direct from other meteorological elements in the absence of the global solar radiation.
Garima Tiwari et al Study and Analysis of Solar Radiation Models
3550| International Journal of Current Engineering and Technology, Vol.5, No.6 (Dec 2015)
(
) (
) (18b)
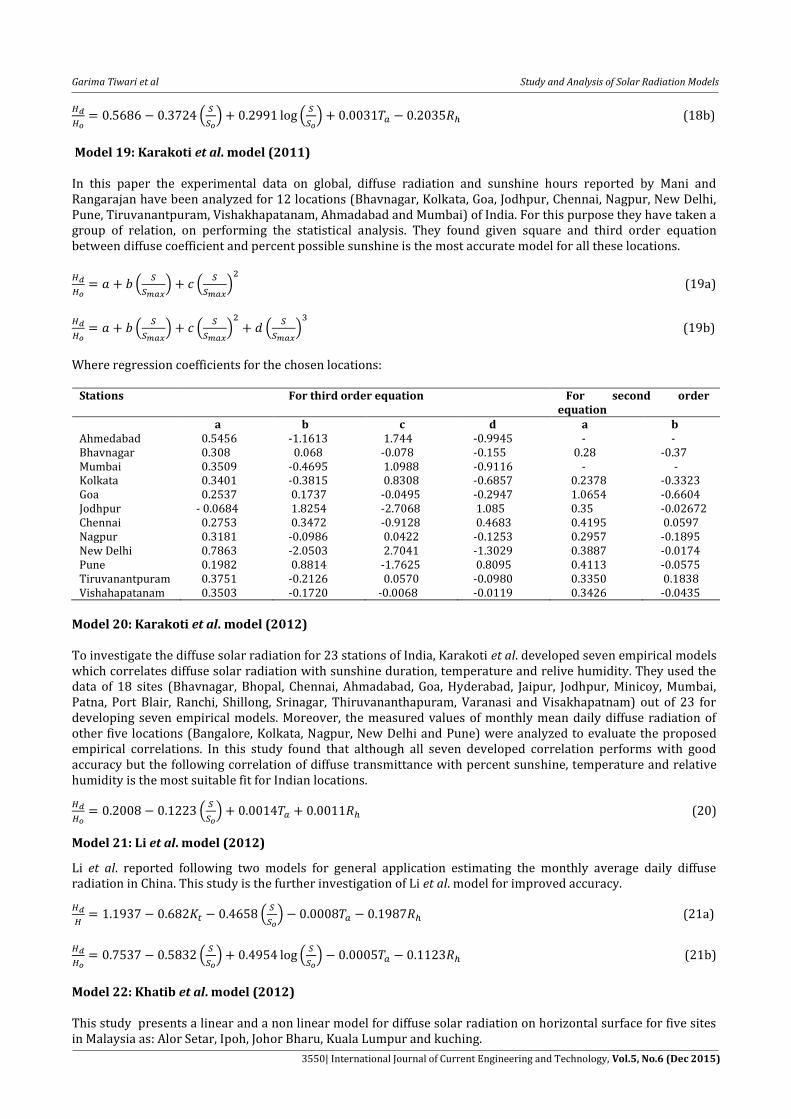
Model 19: Karakoti et al. model (2011) In this paper the experimental data on global, diffuse radiation and sunshine hours reported by Mani and Rangarajan have been analyzed for 12 locations (Bhavnagar, Kolkata, Goa, Jodhpur, Chennai, Nagpur, New Delhi, Pune, Tiruvanantpuram, Vishakhapatanam, Ahmadabad and Mumbai) of India. For this purpose they have taken a group of relation, on performing the statistical analysis. They found given square and third order equation between diffuse coefficient and percent possible sunshine is the most accurate model for all these locations.
(
) (
)
(19a)
(
) (
)
(
)
(19b)
Where regression coefficients for the chosen locations:
Stations For third order equation For second order equation
a b c d a b Ahmedabad 0.5456 -1.1613 1.744 -0.9945 - - Bhavnagar 0.308 0.068 -0.078 -0.155 0.28 -0.37 Mumbai 0.3509 -0.4695 1.0988 -0.9116 - - Kolkata 0.3401 -0.3815 0.8308 -0.6857 0.2378 -0.3323 Goa 0.2537 0.1737 -0.0495 -0.2947 1.0654 -0.6604 Jodhpur - 0.0684 1.8254 -2.7068 1.085 0.35 -0.02672 Chennai 0.2753 0.3472 -0.9128 0.4683 0.4195 0.0597 Nagpur 0.3181 -0.0986 0.0422 -0.1253 0.2957 -0.1895 New Delhi 0.7863 -2.0503 2.7041 -1.3029 0.3887 -0.0174 Pune 0.1982 0.8814 -1.7625 0.8095 0.4113 -0.0575 Tiruvanantpuram 0.3751 -0.2126 0.0570 -0.0980 0.3350 0.1838 Vishahapatanam 0.3503 -0.1720 -0.0068 -0.0119 0.3426 -0.0435
Model 20: Karakoti et al. model (2012) To investigate the diffuse solar radiation for 23 stations of India, Karakoti et al. developed seven empirical models which correlates diffuse solar radiation with sunshine duration, temperature and relive humidity. They used the data of 18 sites (Bhavnagar, Bhopal, Chennai, Ahmadabad, Goa, Hyderabad, Jaipur, Jodhpur, Minicoy, Mumbai, Patna, Port Blair, Ranchi, Shillong, Srinagar, Thiruvananthapuram, Varanasi and Visakhapatnam) out of 23 for developing seven empirical models. Moreover, the measured values of monthly mean daily diffuse radiation of other five locations (Bangalore, Kolkata, Nagpur, New Delhi and Pune) were analyzed to evaluate the proposed empirical correlations. In this study found that although all seven developed correlation performs with good accuracy but the following correlation of diffuse transmittance with percent sunshine, temperature and relative humidity is the most suitable fit for Indian locations.
(
) (20)
Model 21: Li et al. model (2012)
Li et al. reported following two models for general application estimating the monthly average daily diffuse radiation in China. This study is the further investigation of Li et al. model for improved accuracy.
(
) (21a)
(
) (
) (21b)
Model 22: Khatib et al. model (2012) This study presents a linear and a non linear model for diffuse solar radiation on horizontal surface for five sites in Malaysia as: Alor Setar, Ipoh, Johor Bharu, Kuala Lumpur and kuching.

Garima Tiwari et al Study and Analysis of Solar Radiation Models
3551| International Journal of Current Engineering and Technology, Vol.5, No.6 (Dec 2015)
Linear correlation:
(22a)
Non linear correlation:
(22b)
Model 23: Bortolini et al. model (2013) Bortolini et al. proposed a multi-location model to estimate the horizontal daily diffuse component of solar radiation, on considering measured data between 2004 and 2007 by 44 European weather stations. In this study both annual and seasonal scenarios are developed. Consequently, general expressions given as:
Annual correlation
(23a)
For Summer
(23b)
For Winter
(23c)
Model 24: Khalil et al. model (2013) In this work Khalil et al. used measured hourly daily data of diffuse solar irradiation incident on a horizontal surface for Cairo, Egypt (Lat. 30o05’ N and Long. 31o15’E), during the period (1990–2010) and proposed following equations.
(24a)
(
) (24b)
(
) (24c)
(24d)
Furthermore, for improvement ⁄ and ⁄ were correlated for the combination of and (
)
(
) (24e)
(
) (24f)
Model 25: Ahwide et al. model (2013) In this paper, Ahwide et al. used global solar radiation data from three Libyan locations: Sabha-desert region, Ghdames-middle region and Tripoli- Mediterranean region and established a relationship between daily diffuse fraction and daily clearness index.
The seasonal is indicated by sunset hour angle .
For 81.4o
{
(25a)
For 81.4o
{
(25b)
Ahwide et al. also compared this correlation with Liu and Jordan, Choudhury, Erbs et al.[29] and Stanhill correlations and found that the developed correlation for three Libya’s towns are quite similar to Erbs correlation.

Garima Tiwari et al Study and Analysis of Solar Radiation Models
3552| International Journal of Current Engineering and Technology, Vol.5, No.6 (Dec 2015)
Model 26: Khorasanizadeh et al. model (2014) In this study Khorasanizadeh et al. established nine different diffuse solar radiation models from three categories for Tabass. For this purpose long-term daily global solar radiation on a horizontal surface and sunshine hours for period of 1988–2000 were utilized.
(26a)
(26b)
(26c)
(
) (26d)
(
) (
)
(26e)
(
) (
)
(
)
(26f)
(
) (26g)
(
) (
)
(26h)
(
) (
)
(
)
(26i)
Finally, based on statistical indicators they recommended model (26i) is the best diffuse model for Tabass
Table 1: Classification of models used for estimating the daily diffuse solar radiation
Group I: Clearness index based models Sn. Linear co-relations Sn. Non linear co-relations
1. Model [4]:
1. Model [1]:
2. Model [6]:
2. Model [3]:
3. Model [7]:
3. Model [5]:
4. Model [13]:
4. Model [8]:
5. Model [22]:
5. Model [9]:
6. Model [9]:
7. Model [10]:
8. Model [13]:
9. Model [22]:
10. Model [23]:
Group II: Sunshine fraction based models 1. Model [6]:
0.60
1. Model [4]:
(
) (
)
2. Model [13]:
2. Model
[13]:
(
)
(
)
3. Model [16]:
(
) (
)
(
)
Group III: Clearness index and relative sunshine duration based models 1. Model
[11]:
(
) 1. Model
[14]:
(
) (
)
2. Model [12]:
2. Model
[15]:
(
) (
)
(
)
3. Model [17]:
(
) 3. Model
[26]:
(
)
(
)
(
)
4. Model [24]:
(
)

Garima Tiwari et al Study and Analysis of Solar Radiation Models
3553| International Journal of Current Engineering and Technology, Vol.5, No.6 (Dec 2015)
Group IV: Models from other parameters Group V: Models from extraterrestrial radiation 1. Model [6]:
1. Model [4]:
(
) (
)
2. Model [18]:
(
)
2. Model [13]:
3. Model [21]:
(
)
3. Model [13]:
4. Model [13]:
5. Model [13]:
(
)
(
)
6. Model [17]:
(
)
7. Model [18]:
(
) (
)
8 Model [19]:
(
) (
)
9. Model [19]:
(
) (
)
(
)
10. Model [20]:
(
)
11. Model [21]:
(
) (
)
12. Model [24]:
(
)
Jan Feb MarchApril May June July Aug Sep Oct Nov Dec
0
2
4
6
8
10
12
14
Da
ily d
iffu
se r
ad
iatio
n
month
Measured
ElSebaii1
Bashahu
Jin
Ulgen1
Khatib1
Jan Feb MarchApril May June July Aug Sep Oct Nov Dec
0
2
4
6
8
10
12
14
1
2
3
4
5
6
7
8
9
10
11
A
B
C
D
E
FG
H
I
J
K
a
b
c
d
e
f
g
h
i
j
k
Da
ily d
iffu
se r
ad
iatio
n
Month
Measured
Tarhan1
Miguel1 AlialMohamadA Tarhan2a Aras
Khatib.2
Ulgen2
Bortolini
Oliveira
Karatasou
Graph for linear Kt Graph for non linear Kt
Jan FebMarchApril May June July Aug Sep Oct Nov Dec
0
2
4
6
8
10
12
14
Me
asu
red
Month
Measured
Ulgen3
Bashahu2
Jan Feb MarchApril May June July Aug Sep Oct Nov Dec
0
2
4
6
8
10
12
14
da
ily d
iffu
se r
ad
iatio
n
Month
Measured
ElSebaii2
UlgenandH4
Pandey
Graph for linear S/So Graph for non linear S/So
Jan Feb MarchApril May June July Aug Sep Oct Nov Dec
0
2
4
6
8
10
12
14
Da
ily d
iffu
se r
ad
iatio
n
Month
Measured
Benghanem
Elminir
ElSebaii3
Khalil
Measured
Jiang1
Jiang2
Khorasanizadeh
Jan Feb MarchApril May June July Aug Sep Oct Nov Dec
0
2
4
6
8
10
12
14
Da
ily d
iffu
se r
ad
iatio
n
Month Graph for linear Kt and S/So Graph for non linear Kt and S/So
Fig.1 Measured and estimated results for Jodhpur, India
Garima Tiwari et al Study and Analysis of Solar Radiation Models
3554| International Journal of Current Engineering and Technology, Vol.5, No.6 (Dec 2015)
Jan Feb Mar April May June July Aug Sep Oct Nov Dec
0
2
4
6
8
10
12
14
Da
ily d
iffu
se r
ad
iatio
n
Month
Measured
ElSebaii1
Bashahu
Jin
Ulgen1
Khatib1
Jan Feb Mar April May June July Aug Sep Oct Nov Dec
0
2
4
6
8
10
12
14
1
2
3
4
5
6
78
9
10
11
12A
B
C
D
E
F
GH
I
J
K
L
a
bc
d
e
f
g
h
i
j
k
l
Da
ily d
iffu
se r
ad
iatio
n
Month
Measured
Tarhan1
Miguel1 AlialMohamadA Tarhan2a Aras
Khatib2
Ulgen2
Bortolini
Oliveira
Karatasou
Graph for linear Kt Graph for non linear Kt
Jan Feb Mar April May June July Aug Sep Oct Nov Dec
0
2
4
6
8
10
12
14
Me
asu
red
Month
Measured
Ulgen3
Bashahu2
Jan Feb Mar April May June July Aug Sep Oct Nov Dec
0
2
4
6
8
10
12
14
Da
ily d
iffu
se r
ad
iatio
n
Month
Measured
ElSebaii2
Ulgen4
Pandey
Graph for linear S/So Graph for non linear S/So
Jan Feb Mar April May June July Aug Sep Oct Nov Dec
0
2
4
6
8
10
12
14
Da
ily d
iffu
se
ra
dia
tio
n
Month
Measured
Benghanem
Elminir
ElSebaii3
Khalil
Jan Feb Mar April May June July Aug Sep Oct Nov Dec
0
2
4
6
8
10
12
14
Da
ily d
iffu
se r
ad
iatio
n
Month
Measured
Jiang1
Jiang2
Khorasanizadeh
Graph for linear Kt and S/So Graph for non linear Kt and S/So
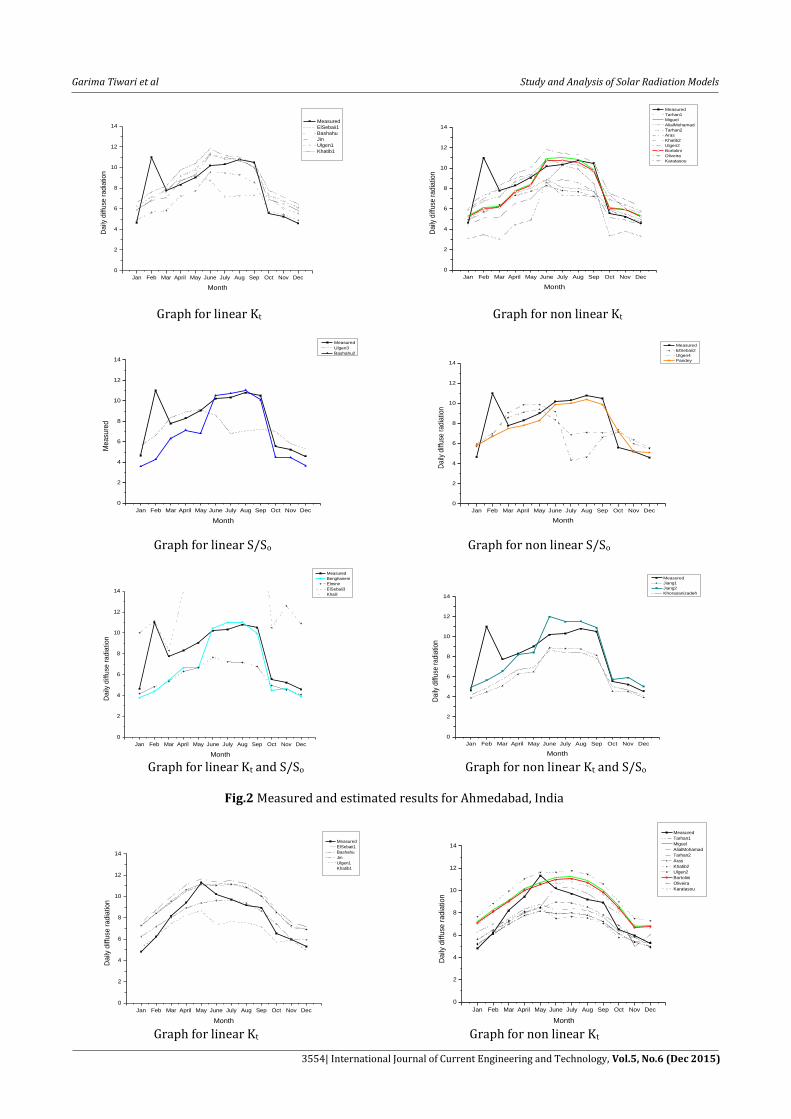
Fig.2 Measured and estimated results for Ahmedabad, India
Jan Feb Mar April May June July Aug Sep Oct Nov Dec
0
2
4
6
8
10
12
14
Da
ily d
iffu
se
ra
dia
tio
n
Month
Measured
ElSebaii1
Bashahu
Jin
Ulgen1
Khatib1
Jan Feb Mar April May June July Aug Sep Oct Nov Dec
0
2
4
6
8
10
12
14
Da
ily d
iffu
se
ra
dia
tion
Month
Measured
Tarhan1
Miguel
AlialMohamad
Tarhan2
Aras
Khatib2
Ulgen2
Bortolini
Oliveira
Karatasou
Graph for linear Kt Graph for non linear Kt

Garima Tiwari et al Study and Analysis of Solar Radiation Models
3555| International Journal of Current Engineering and Technology, Vol.5, No.6 (Dec 2015)
Jan Feb Mar April May June July Aug Sep Oct Nov Dec
0
2
4
6
8
10
12
14
Me
asu
red
Month
Measured
Ulgen3
Bashahu
Jan Feb Mar April May June July Aug Sep Oct Nov Dec
0
2
4
6
8
10
12
14
da
ily d
iffu
se
ra
dia
tio
n
Month
Measured
ElSebaii2
Ulgen4
Pandey
Graph for linear S/So Graph for non linear S/So
Jan Feb Mar April May June July Aug Sep Oct Nov Dec
0
2
4
6
8
10
12
14
Da
ily d
iffu
se r
ad
iatio
n
Month
Measured
Benghanem
Elminir
ElSebaii3
Khalil
Jan Feb Mar April May June July Aug Sep Oct Nov Dec
0
2
4
6
8
10
12
14
Da
ily d
iffu
se r
ad
iatio
n
Month
Measured
Jiang1
Jiang2
Khorasanizadeh
Graph for linear Kt and S/So Graph for non linear Kt and S/So
Fig.3 Measured and estimated results for Kolkata, India
Jan Feb Mar April May June July Aug Sep Oct Nov Dec
0
2
4
6
8
10
12
14
Da
ily d
iffu
se
ra
dia
tio
n
Month
Measured
ElSebaii1
Bashahu
Jin
Ulgen1
Khatib1
Jan Feb Mar April May June July Aug Sep Oct Nov Dec
0
2
4
6
8
10
12
14
Da
ily d
iffu
se r
ad
iatio
n
Month
Measured
Tarhan1
Miguel
AlialMohamad
Tarhan2
Aras
Khatib2
Ulgen2
Bortolini
Oliveira
Karatasou
Graph for linear Kt Graph for non linear Kt
Jan Feb Mar April May June July Aug Sep Oct Nov Dec
0
2
4
6
8
10
12
14
Me
asu
red
Month
Measured
Ulgen3
Bashahu2
Jan Feb Mar April May June July Aug Sep Oct Nov Dec
0
2
4
6
8
10
12
14
Da
ily d
iffu
se r
ad
iatio
n
Month
Measured
ElSebaii2
Ulgen4
Pandey
Graph for linear S/So Graph for non linear S/So

Garima Tiwari et al Study and Analysis of Solar Radiation Models
3556| International Journal of Current Engineering and Technology, Vol.5, No.6 (Dec 2015)
Jan Feb Mar April May June July Aug Sep Oct Nov Dec
0
2
4
6
8
10
12
14
Da
ily d
iffu
se
ra
dia
tio
n
Month
Measured
Benghanem
Elminir
ElSebaii3
Khalil
Jan Feb Mar April May June July Aug Sep Oct Nov Dec
0
2
4
6
8
10
12
14
Da
ily d
iffu
se r
ad
iatio
n
Month
Measured
Jiang1
Jiang2
Khorasanizadeh
Graph for linear Kt and S/So Graph for non linear Kt and S/So
Fig.4 Measured and estimated results for Mumbai, India
Jan Feb Mar April May June July Aug Sep Oct Nov Dec
0
2
4
6
8
10
12
14
Mea
sure
d
Month
Measured
ElSebaii1
Bashahu
Jin
Ulgen1
Khatib1
Tarhan1
Miguel
AlialMohamad
Tarhan2
Aras
Khatib2
Ulgen2
Bortolini
Oliveira
Karatasou
Ulgen3
Elsebaii2
Ulgen4
Pandey
Benghanem
Elminir
Elsebaii3
Khalil
Jiang1
Jiang2
Korasanizadeh
Fig.5 Estimated and measured results from all correlations (2001-2014) for Mumbai
3. Statistical evaluation The accuracy and performance of each selected correlation for predicting daily diffuse radiation is tested by calculating the root mean square error (RMSE), mean bias error (MBE), mean percentage error (MPE) and t-test statistic. These error indices are defined as:
RMSE= √
∑
MBE=
∑
MPE =
∑ (
)
t =√( )
where n is the number of data pairs, is the difference between ith measured and calculated values and is the ith measured value. Generally, low values of RMSE and MPE are desirable. Positive MBE shows overestimation while negative MBE indicates under estimation. Smaller value of t shows better performance of model.

Garima Tiwari et al Study and Analysis of Solar Radiation Models
3557| International Journal of Current Engineering and Technology, Vol.5, No.6 (Dec 2015)
Table 1: Statistical results for the validation of selected correlations
Jodhpur Ahmedabad Kolkata Mumbai
Model MBE RMSE MPE t MBE RMSE MPE t MBE RMSE MPE t MBE RMSE MPE t
Clearness index based Linear models
El-Sebaii et al i (eq.4a) 1.2671 1.6001 -26.51 4.3 0.4259 1.5285 -10.05 0.96 1.4131 1.5552 -20.82 7.22 1.0503 1.3787 -16.67 3.9
Bashahu (eq.6a) -0.298 1.1345 -2.138 0.9 -1.141 1.887 10.765 2.52 0.0499 0.8445 -3.266 0.2 -0.499 1.0193 4.2128 1.86
Jin et al (eq.7) 1.0056 1.3315 -21.7 3.82 0.1665 1.4908 -6.163 0.37 1.3973 1.5564 -20.6 6.76 0.8458 1.1578 -13.46 3.55
Ulgen and H i (eq.13a) 0.0189 1.9721 -12.14 0.03 -0.841 2.1907 3.7489 1.38 -1.141 1.5298 11.944 3.71 -0.562 2.065 1.8779 0.94
Khatib et al. (eq.22a) 1.7104 1.9683 -33.54 5.82 0.8695 1.7067 -16.01 1.96 1.7641 1.8637 -25.35 9.73 1.4803 1.7474 -22.55 5.29
Clearness index based Non Linear models
Miguel et al (eq.1) 0.4909 0.8895 -12.61 2.19 -0.332 1.5847 1.1268 0.71 1.2722 1.4931 -18.99 5.4 0.4085 0.8619 -6.876 1.79
Oliveiraet al(eq.3b) 7.8327 1.9974 25.754 7.65 -2.595 3.2818 32.663 4.28 -0.051 1.2121 -1.879 0.14 -1.683 2.1383 22.944 4.23
Karatasou et al (eq.5) 0.8418 1.3193 -19.97 2.75 0.0115 1.4698 -4.553 0.03 1.0359 1.2525 -15.97 4.88 0.6357 1.0884 -11.07 2.39
Ali Al-Mohamad(eq.8) -0.43 1.5592 -2.297 0.95 -1.322 2.0948 11.71 2.7 -0.764 1.1894 7.1437 2.78 -0.832 1.5695 7.1125 2.07
Tarhan i (eq.9b) -0.782 1.833 2.3555 1.56 -1.582 2.2914 14.981 3.16 -1.178 1.5254 12.498 4.03 -1.141 1.7697 11.257 2.8
Tarhan ii (eq.9a) -0.801 1.8285 2.7569 1.62 -1.611 2.3075 15.396 3.23 -1.179 1.5262 12.514 4.03 -1.162 1.7761 11.554 2.87
Aras et al (eq.10i) -0.982 1.611 7.8087 2.55 -1.787 2.3527 19.088 3.87 -0.684 1.1681 6.227 2.4 -1.156 1.4786 12.921 4.16
Ulgen and H ii (eq.13b) 0.052 2.0811 -13.34 0.08 -0.728 2.2 2.1268 1.16 -1.192 1.5557 12.64 3.96 -0.48 2.0734 0.8046 0.79
Khatib et al.(eq.22b) 1.558 1.7734 -30.42 6.1 0.7418 1.639 -13.87 1.7 1.8817 1.9867 -26.86 9.79 1.398 1.605 -20.87 5.88
Bortolini et al(eq.23a) 0.4062 0.8754 -11.46 1.74 -0.436 1.6036 2.3541 0.94 1.1245 1.3651 -17.09 4.82 0.2987 0.826 -5.583 1.29
Sunshine fraction based Linear models
Ulgen and Hiii(eq.13c -0.07 1.9977 -10.57 0.12 -0.949 2.2928 5.3495 1.51 -1.572 1.8209 18.257 5.67 -0.645 2.1138 3.1209 1.06
Bashahu (eq.6d) -0.318 0.8401 4.1102 1.36 -1.228 2.1934 15.732 2.24 -0.039 2.0601 1.3615 0.06 -0.119 0.7854 2.8486 0.51
Sunshine fraction based Non Linear models
El-Sebaii et al ii(eq4b) 0.3144 2.3513 -16.84 0.45 -1.067 3.1357 5.1312 1.2 -2.179 2.9589 25.862 3.61 -1.049 3.9554 3.9712 0.91
Ulgen and H iv(eq.13d) -0.013 2.1656 -12.66 0.02 -0.805 2.3235 2.9762 1.23 -1.6 1.85 18.444 5.71 -0.526 2.0915 1.538 0.86
Pandey et al(eq.16e) 0.2063 1.2833 -10.84 0.54 -0.351 1.4146 0.7102 0.85 0.7168 2.8105 -13.4 0.87 -0.177 0.9473 1.0525 0.63
Clearness index and sunshine fraction based Linear models
Benghanem et al(eq.11) -0.414 0.7548 5.03 2.17 -1.293 2.2503 16.167 2.33 0.3733 1.614 -5.194 0.79 -0.242 0.9289 4.128 0.89
Elminir et al.(eq.12) -1.488 2.1716 14.247 3.12 -2.346 2.8511 25.504 4.8 -1.738 2.0124 19.946 5.68 -1.84 2.2154 20.945 4.95
El-Sebaii et al iii(eq.17e)
10.427 11.711 -140.6 6.49 9.6996 12.309 -116.1 4.25 17.751 18.126 -230.7 16.06 12.244 13.95 -149.6 6.08
Khalil et al.(eq.24e) 55.902 56.669 -866.1 19.96 55.189 55.827 -730.7 21.75 52.578 53.192 -680 21.62 56.007 56.413 -750.4 27.51
Clearness index and sunshine fraction based Non Linear models
Jiang i (eq.14) -1.094 1.4754 11.717 3.67 -1.996 2.5123 22.944 4.34 -0.794 1.2973 8.5673 2.57 -1.244 1.4502 14.894 5.54
Jiang ii (eq.15) 0.8827 1.051 -15.36 5.13 -0.132 1.7416 0.077 0.25 1.4711 2.0376 -19.82 3.46 0.8502 1.1007 -11.81 4.03
Khorasanizadeh(eq.26i) -0.995 1.5645 8.7204 2.73 -1.853 2.3803 20.338 4.12 -1.052 1.4324 11.879 3.59 -1.188 1.4422 13.559 4.82
4. Results and Discussions The present study was carried out to find the most appropriate model for the prediction of daily diffuse solar radiation data on horizontal surface. For this purpose, all the developed models from 2001-2014 have been used, then estimated results have been compared with measured data of four prominent locations of India viz. Jodhpur, Ahmedabad, Kolkata and Mumbai. To overcome this complexity, these models were categorized into five groups through Table 1 on the basis of clearness index, sunshine
fraction, clearness index and sunshine fraction, models from other parameters, and models from extraterrestrial radiation. On the basis of clearness index, five linear models have been selected from literature and also shown through figs. 1-4 for Jodhpur, Ahemdabad, Kolkata and Mumbai respectively. From the results of Figs. 1-4, it has been found that, for the locations under consideration Jin et al. (Eq.7), El-sebaii et al.(Eq.4a) and Khatib et al.(Eq.22a) models predicts values higher than measured values. Ulgen and Hepsbasli (Eq.13a) did not found good match with the measured data of all

Garima Tiwari et al Study and Analysis of Solar Radiation Models
3558| International Journal of Current Engineering and Technology, Vol.5, No.6 (Dec 2015)
considered locations. Bashahu who used 16 year data on global and diffuse radiation along with data of bright sunshine hours, fraction of sky cloud cover, ambient temp and water vapour pressure in air and three correlations have been recommended for Dakar for their simplicity and higher accuracy. Due to insufficiency of data for model (Eq.6h), we have analyzed only Eq. (6a, 6d) and found that clearness index dependent linear model (Eq.6a) gave less accurate results for Jodhpur, Kolkata and Mumbai and for Ahmedabad result was in underestimation, Eq.(6d) which depends on the relative sunshine duration has excellent fitting with measured data of all considered locations. From the analysis of non linear clearness index models it was found that Tarhan and sari (Eq.9a, 9b), Ali al Mohamad (Eq.8) and Ulgen and Hepsbasli (Eq. 13b) gives under estimated values while Khatib et al. (Eq.22b) model gives over estimated result .Oliveira et al. (3b) and Aras et al. (10i) predicts worst results with the measured data for all considered locations. Miguel et al.(Eq.1) used combined data of Portugal, France and Spain countries to develop correlation. They also compared estimated results with experimental values and Jacovides et al., Frutos et al., and Macagnan et al. developed correlations, and found a small difference between the Miguel et al. (Eq.1) and Macagnan and Frutos correlations. While Bortolini et al (Eq.23a) used measured data of 44 European weather stations for developing a multi location model. From the Figs. 1-4, it was observed that both correlations gave approximate equal results and slightly closes to measured values of considered locations. Karatasou et al. (Eq.5) correlation estimated results were near about with the measured data for Ahemdabad and Mumbai, which were close to Miguel and Bortolini estimation but for Jodhpur and Kolkata values were over estimated. Hence on the basis of clearness index, Miguel et al. and Bortolini et al. models are recommended for the estimation of daily diffuse radiation on horizontal surface for all considered locations of India. All statistical results have also been confirmed for all considered locations and presented through Table 2. Two linear and three non linear correlations have also been taken on the basis of bright sunshine hour and compared with our measured data through Figs. 1-4. From the results of Figs. 1-4 we found that Ulgen and Hepsbasli (Eq.13c, 13d) and El Sebaii (Eq.4b) predicts very poor results with measured data for all considered locations. However, Pandey et al (Eq.16e) All India Correlation (AIC) on the basis of non-linear sunshine fraction based models gave best results than any other selected models. The low values of MBE, RMSE, MPE, and t-test presented in Table 2 also confirmed the accuracy of Bashahu model (Eq.6d) in linear and Pandey et al(Eq.16e) in non-linear.
Furthermore, Four linear and three non linear models have been selected from literature on the basis of clearness index and sunshine fraction dependent models and also shown through Figs. 1-4. From the
Figs. it was observed that El Sebaii (Eq.17e) model for Jeddah (lat. 21o 42’ 37 N, long. 39o 11’ 12 E), Saudi Arabia and Khalil et al.(Eq.24e) model for Cairo, Egypt (Lat. 30o05’ N and Long. 31o15’E) predicts too much higher value than the measured data for all considered locations so we can say that these relations cant be used for the estimation of daily diffuse radiation on horizontal surface for any locations of India. On the other hand, observed result from Elminir (Eq.12) model was below than measured data. However, from all linear sunshine fraction based models Benghanem et al.(Eq.11) has good finding with measured data. Jiang (Eq.15) model from non linear correlations give best results than Jiang (Eq.14) and Khorasanizadeh (Eq.26i). Table2 confirms these results statistically.
Models from other parameters (Eqs. 6h, 18a, 21a) and extraterrestrial radiation dependent models (Eqs. 4c,13e, 13f, 13g, 13h, 17f, 18b, 19a, 19b, 20, 21b, 24f) for estimating daily diffuse solar radiation on horizontal surface were also categorized in this group. These correlations are tabulated in Table 1. Due to insufficient of data, we have made comparison on the basis of clearness index, sunshine fraction, clearness index and sunshine fraction.
Conclusion
The measured data for four prominent locations of
India are used to select the models for estimating horizontal diffuse solar radiation at these locations. Miguel et al. and Bortolini et al. models on the basis of clearness index and Bashahu (6d) model from linear sunshine fraction based models have been proposed with resonable accuracy. A close agreement has been observed between measured and estimated data using Pandey et al (Eq.16e) model on the basis of sunshine fraction whereas Jiang (Eq.15) model give more accurate result on the basis of clearness index and sunshine fraction. Over all comparison of all Figs. and Tables we rercommended Pandey et al model for estimating diffuse solar radiation all over India and the other locations having similar climatic conditions. References A. De Miguel, J. Bilbao, R. Aguiar , H. Kambezidis and E. Negro
(2001), Diffuse solar irradiation model evaluation in the north Mediterranean belt area, Solar Energy , vol. 70, no.2, pp.143-153
S. Becker (2001), Calculation of direct solar and diffuse radiation in Israel, International Journal of Climatology, vol. 21, pp. 1561-1576
P. Valko (1966), Die Himmelsstrahlung in ihrer Beziehung zu den verschiedenen Parametern, Archive for Meteorology, Geophysics and Bioclimatology, Ser. B, vol.14, pp. 336–359
A. P. Oliveira, J.F. Escobedo, A.J. Machado and J. Soares (2002), Correlation models of diffuse solar radiation applied to the city of Sao Paulo, Brazil, Applied Energy, vol. 71, pp. 59-73.
A. A. El-Sebaii and A. A. Trabea (2003), Estimation of horizontal diffuse solar radiation in Egypt, Energy conversion and Management, vol. 44, no. 15, pp. 2471-2482.

Garima Tiwari et al Study and Analysis of Solar Radiation Models
3559| International Journal of Current Engineering and Technology, Vol.5, No.6 (Dec 2015)
S. Karatasou, M. Santamouris and V. Geros (2003), Analysis of experimental data on diffuse solar radiation in Athens, Greece, for building applications, International Journal of Sustainable Energy, vol. 23, no. 1-2, pp. 1-11.
M. Bashahu (2003), Statistical comparison of models for estimating the monthly average daily diffuse radiation at a subtropical African site, Solar Energy, vol. 75, pp. 43-51
Z. Jin, W. Yezheng and Y. Gang (2004), Estimation of daily diffuse solar radiation in China, Renewable Energy, vol. 29, pp. 1537-1548.
B. Y. H. Liu and R. C. Jordan (1960), The interrelationship and characteristic distribution of direct, diffuse and total solar radiation, Solar Energy, vol. 4, no. 3, pp. 1-19.
A. A. Mohamad (2004), Global, direct and diffuse solar radiation in Syria, Applied Energy, vol. 79, pp. 191-200.
S. Tarhan and A. Sari (2005), Model selection for global and diffuse radiation over the Central Black Sea (CBS) region of Turkey, Energy conversion and management, vol. 46, pp. 605-613.
H. Aras, O. Balli and A. Hepbasli (2006), Estimating the horizontal diffuse solar radiation over the Central Anatolia Region of Turkey, Energy conversion and management, vol. 47, no. 15-16, pp. 2240-2249.
M. Benghanem and A. A. Joraid (2007), A multiple correlation between different solar parameters in medina, Saudi Arabia, Renewable Energy, vol. 32, pp. 2424-2435.
H. K. Elminir, Y. A. Azzam and F. I. Younes (2007), Predition of hourly and daily diffuse fraction using neural network, as compared to linear regression models, Energy, vol. 32, pp. 1513-1523.
K. Ulgen and A. Hepbasli (2009), Diffuse solar radiation estimation models for Turkey’s big cities, Energy conversion and Management, vol. 50, no. 1, pp. 149-156.
Y. Jiang (2009), Estimation of monthly mean daily diffuse radiation in China, Applied Energy, vol. 86, no. 9, pp. 1458-1464.
Y. Jiang (2009), Correlation for diffuse radiation from global solar radiation and sunshine data, at Beijing, China, Journal of Energy Engineering, vol. 135, no. 4, pp. 107-111.
C. K. Pandey and A. K. Katiyar (2009), A comparative study to estimate daily diffuse solar radiation over India, Energy, vol. 34, no. 11, pp. 1792-1796.
A. A. El-Sebaii, F. S. Al-Hazmi, A. A. Al-Ghamdi and S. J. Yaghmour (2010), Global, direct and diffuse solar radiation on horizontal and tilted surfaces in Jeddah, Saudi Arabia, Applied Energy, vol. 87, pp. 568-576.
H. Li, W. Ma, X. Wang and Y. Lian (2011), Estimating monthly average daily diffuse solar radiation with multiple predictors: A case study, Renewable Energy, vol. 36, no. 7, pp. 1944-1948
I. Karakoti, B. Pandey and K. Pandey (2011), Evaluation of different diffuse radiation models for Indian stations and predicting the best fit model, Renewable and Sustainable Energy Reviews, vol. 15, pp. 2378-2384.
A. Mani and S. Rangarajan (1982), Solar radiation over India New Delhi: Allied Publishers Pvt. Ltd.
I. Karakoti, P. K. Das and S. K. Singh (2012), Predicting monthly mean daily diffuse radiation for India, Applied Energy, vol. 91, pp. 412-425
H. Li, X. Bu, Y. Lian, L. Zhao and W. Ma (2012), Further investigation of empirically derived models with multiple predictors in estimating monthly average daily diffuse solar radiation over china, Renewable energy, vol. 44, pp. 469-473.
T. Khatib, A. Mohamed, M. Mahmoud and K. Sopian (2012), An assessment of diffuse solar energy models in terms of estimation accuracy, Energy Procedia, vol. 14, pp. 2066-2074.
M. Bortolini, M. Gamberi, A. Graziani, R. Manzini and C. Mora (2013), Multi-location model for the estimation of the horizontal daily diffuse fraction of solar radiation in Europe, Energy Conversion and Management, vol. 67, pp. 208-216.
S. A. Khalil and A.M. Shaffie (2013), A comparative study of total, direct and diffuse solar irradiance by using different models on horizontal and inclined surfaces for Cairo, Egypt, Renewable and Sustainable Energy Reviews, vol. 27, pp. 853-863.
F. Ahwide, A. Spena A and A. El-Kafrawy (2013), Correlation for the average daily diffuse fraction with clearness index and estimation of beam solar radiation and possible sunshine hours fraction in Sabha, Ghdames and Tripoli-Libya, Procedia APCBEE, vol. 5, pp. 208-220.
H. Khorasanizadeh, K. Mohammadi and A. Mostafaeipour (2014), Establishing a diffuse solar radiation model for determining the optimum tilt angle of solar surfaces in Tabass, Iran, Energy Conversion and Management, vol. 78, pp.805-814.
D. G. Erbs, S. A. Klein and J. A. Duffie (1982), Estimation of the diffuse radiation fraction for hourly, daily and monthly average global radiation, Solar Energy, vol. 28, no. 4, pp. 293-304.