study material unit-1 introduction gist of … · · 2018-02-08study material. unit-1 ....
TRANSCRIPT

STUDY MATERIAL UNIT-1 INTRODUCTION GIST OF THE LESSON Meaning of economics: Economics is the science which studies human behavior as a relationship between ends and scarce means which have alternative uses. Meaning of an economy:-Economy is the system which provides people the means to work and earn a living. Or it is a frame work within which economic activities like production, consumption, and capital formation are undertaken. Meaning of scarcity:-It is defined as excess of demand over available supply, i.e, demand of resourses>supply of resources. Economic problem:-The problem of making a choice is called economic problem. Causes of economic problem:- It arises due to Scarcity of resources Unlimited human wants Resources can be put to alternative uses Scarcity and Choice go together:-Scarcity and choice are not separable because resources are limited or scarce and the problem of choice arises due to it. Economising of resources:-Our wants are unlimited and resources are limited, so we have to use the resources fully and efficiently. It means that resources should be best utilized. This is called economizing of resources. Central Problems of an Economy:-Central problem of an economy is Allocation of resources.The three central problems relating to allocation of resources are:- What to produce:-The problem of what to produce and in what quantity is the first basic or central problem. It is related to the selection of goods. Our resources are limited. So first problem that we have to face is which goods and services are to be produced e.g consumer goods or capital goods, war time or peace time goods. After the decision has been taken the quantities of these goods should also be decided. How to produce:- The second important problem is the problem of choice of technique of production. That means we have to decide whether to use labour intensive technique(it uses more of labour than capital) or capital intensive technique(it uses more of capital than labour).How ever the choice of technique depends on the objective of the producer.The producer can use labour intensive ,capital intensive or both technique of production.The main aim is to use the efficient technique of production. For whom to produce:-This is also called the problem of distribution of National Income among the factor of production. For whom to produce is actually the problem of determining wage rate for the use of labour ,rent for the use of land, interest for the use of capital and profits for the producer to ensure equitable distribution of income and welfare in the society. Production possibility curve or frontier A production possibility curve/ frontier shows different combinations of two commodities that can be produced by an economy with the full use of given resources and technology.

(i) Normally, the production possibility curve is concave to the origin. It is because of increasing marginal opportunity cost. (ii) A production possibility curve shifts out due to technological progress or increase in the supply of resources available to an economy or both. Assumptions of PPC-1)Resources are constant. 2)Technology is given. 3)Resources are fully and efficiently used. 4)Production of only two goods can be shown in a PPC. Features of PPC-1) It is downward sloping. 2) It is concave to the origin. PPC can be explained with the help of a schedule


. Shifting/Rotation of PPC Change of Resources

(ii)Change in technology Efficient technology for the production of Commodity – X: Efficient technology for the production of Commodity – X would mean more production of commodity – X with the same resources. Accordingly, PPC would rotate (NOT SHIFT) as shown in Fig
Efficient technology for the production of Commodity – Y : Efficient technology for the production of commodity – Y would mean more production of Y with the same resources. Accordingly, PPC would rotate (NOT SHIFT) as shown in Fig

Efficient technology for the production of both X and Y: Efficient technology for the production of both X and Y would mean much greater production of both X and Y with the same resources. Accordingly, PPC would shift to the right as shown in Fig.
Opportunity Cost (Transformation cost)-

The opportunity cost of a factor is equal to the value of a factor in its next best alternative use.Eg-A plot of land can be used for wheat and rice production.Production of wheat provides earning of Rs. 1 lakh and Production of rice provides earning of Rs. 90000.If we produce wheat then its opportunity cost is Rs. 90000,which is the value of rice sacrificed. Marginal opportunity cost(or Marginal Rate of Transformation)- The marginal opportunity cost of good X is the rate of sacrifice of the other good, say, Y, per unit increase in the production of good X. Or The marginal opportunity cost of good X is defined as the amount / quantity sacrificed of good Y per unit increase in production of good X. Marginal opportunity cost along a PPC.
Production of Good X
Production of Good Y
Marginal Opportunity Cost of Good X in terms of Good Y or amount sacrificed of good Y per unit increase in good X
0 18 - 1 17 1 2 15 2 3 12 3 4 8 4 5 3 5
Note: The above table shows the case of increasing marginal opportunity cost. To produce one more unit of Good X, increasing units of Good Y have to be sacrificed. For example, to produce the first, second, third, fourth and fifth unit of Good X, 1, 2,3,4 and 5 units of Good Y have been sacrificed respectively. The shape of PPC depends on MOC : 1. If MOC is increasing PPC is concave. 2. If MOC is decreasing, PPC is convex. 3.If MOC is constant, PPC is a straight line.

The Fig Illustrates the concept of marginal opportunity cost. It is assumed that initially resources are employed such that, output in Use-1 = OK and output in Use-2=OL M.O.C = Loss of Output of Good Y/Gain of Output of Good X = KK1 / LL1 = ab / bc = Slope of production possibility curve Micro and Macro Economics: Micro economics studies the behaviour of individual economic units of an economy like a consumer, a producer for different goods and services. Macroeconomics studies aggregates at the level of the economy as a whole like aggregate demand, aggregate supply, problem of full employment, total saving, total investment, aggregate price level, etc. DIFFERENCE MICROECONOMICS MACROECO0NOMICS 1. It studies individual economic units. 1. It studies aggregate economic units. 2. It deals with determination of price and output in individual markets.
2. It deals with determination of general price level and national output in the country.
3. It aims at optimal allocation of resources. 3. It aims at determination of aggregate output, national income, price level and employment level in the economy.

4. Example-Theory of demand, theory of supply, theory of price determination,etc.
4. Example- Aggregate demand, aggregate supply, national income,etc.
QUESTIONS FOR BRIGHT LEARNERS VERY SHORT ANSWER TYPE QUESTIONS: - (1 Mark Each) Q.1. Why is there a need for economizing of resources? Ans. Because resources are limited. Q.2. Why does economic problem arise? Ans. It arises mainly because of scarcity of resources. Q.3. Why is PPC downward sloping from left to right? Ans. Because in situation of full employment of resources, production of one good can be increased only with less of other good. Q.4. What does a rightward shift of PPC indicate? Ans. The rightward shift of PPC indicates growth of resources or technological progress. Q.5. Why does the problem of choice arise? Ans. Relative scarcity of resources having alternative uses in relation to unlimited wants, gives rise to an economic problem. Q.6. Why does PPC look concave to the origin? Ans. PPC is concave to the origin because of increasing marginal rate of transformation (or increasing marginal opportunity cost). Q.7. Which factor lead to a shift of PPC towards right hand side? Ans. Growth of resources or technological progress leads to a shift of PPC towards right-hand side. Q.8. What does a point below PPC indicate? Ans. It shows inefficient/underutilization of resources. Q.9.What is the slope of PPC? What does it show? Ans. Slope of PPC refers to MRT (marginal rate of transformation).It shows that in order to produce more units of one good, say X, some units of the other good, say Y must be sacrificed. So slope of PPC= ∆Y/∆X Q.10. When allocation of resources is considered as inefficient? Ans. Allocation of resources is considered as inefficient when economy performs below the PPC curve. Q.11.When can PPC be a straight line? Ans.When MOC is constant. Q.12 What is the opportunity cost of opting for higher studies rather than a job? Ans.It is the amount of wage/salary the person would have earned in a job. SHORT ANSWER TYPE QUESTIONS: (3/4 Marks Each) Q.1. Draw PPC and show the following:- (a) Full employment of resources, (b) Underutilisation of resources, and (c) Growth of resources.

Ans. (a) Full employment of resources - A point anywhere on the PPC, shows the efficient use or full employment of resources. (b) Underutilisation of resources - A point anywhere inside of the curve, shows inefficient/under utilisation of resources. (c) Growth of resources – It refers to the shift in PPC. If more resources are generated, the level of production will increase. In the figure it is represented by a shift in PPC from PP to P’P’. Q.2. Why does PPC look concave to the origin? Explain. Ans. PPC looks concave to the origin because of increasing marginal rate of transformation/substitution (or increasing marginal opportunity cost). It means that more and more units of commodity ‘y’ are to be sacrificed, to get each additional unit of commodity ‘x’. Q.3. What does a PPC show? When will it shift to the right? Ans. Production Possibility Curve shows the different combinations of two goods which an economy can produce with available technology and resources. It would shift towards right-hand side in case of growth of resources or technological progress. Q.4. Does production take place only on the PP curve? Ans. Yes and no, both. Yes, if the given resources are fully and efficiently utilized. No, if the resources are underutilized or inefficiently utilized or both.
O
X
Commodity X
Com
mod
ity Y
(c) Growth of Resources
.
(b) Underutilisation of Resources
Y (a) Full employment of
P’
P P’
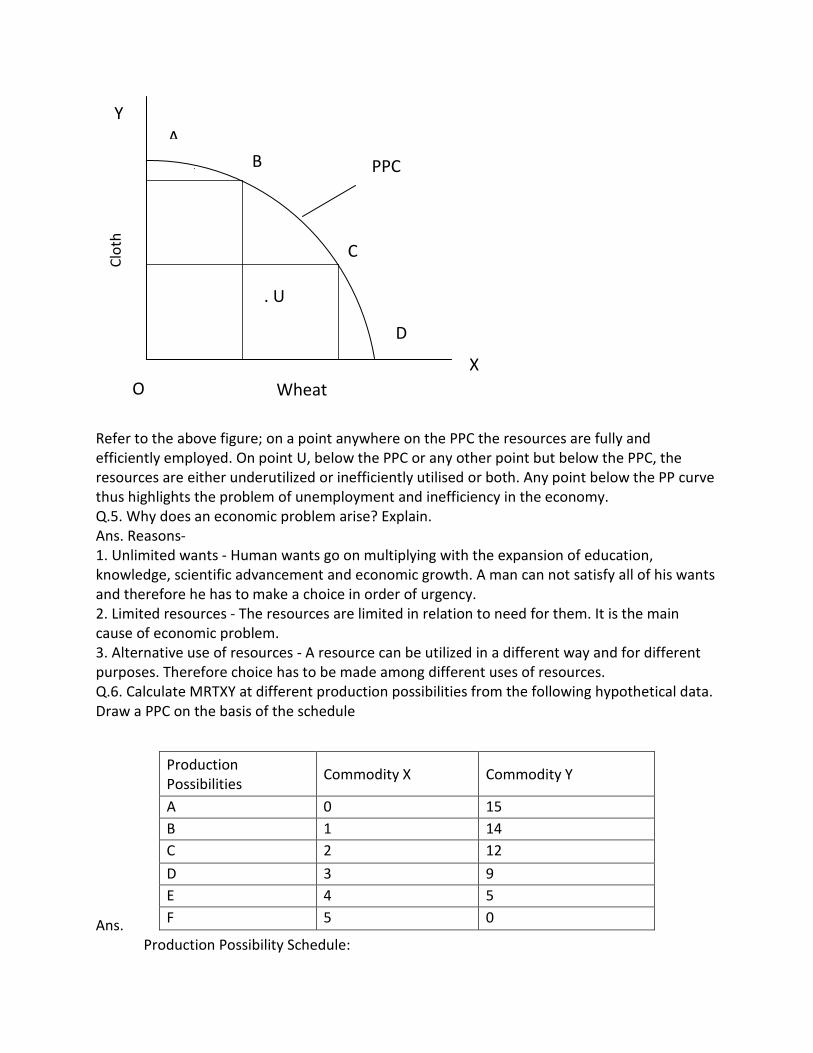
Refer to the above figure; on a point anywhere on the PPC the resources are fully and efficiently employed. On point U, below the PPC or any other point but below the PPC, the resources are either underutilized or inefficiently utilised or both. Any point below the PP curve thus highlights the problem of unemployment and inefficiency in the economy. Q.5. Why does an economic problem arise? Explain. Ans. Reasons- 1. Unlimited wants - Human wants go on multiplying with the expansion of education, knowledge, scientific advancement and economic growth. A man can not satisfy all of his wants and therefore he has to make a choice in order of urgency. 2. Limited resources - The resources are limited in relation to need for them. It is the main cause of economic problem. 3. Alternative use of resources - A resource can be utilized in a different way and for different purposes. Therefore choice has to be made among different uses of resources. Q.6. Calculate MRTXY at different production possibilities from the following hypothetical data. Draw a PPC on the basis of the schedule Ans. Production Possibility Schedule:
Production Possibilities Commodity X Commodity Y
A 0 15 B 1 14 C 2 12 D 3 9 E 4 5 F 5 0
O X
Wheat
PPC
Y Cl
oth
A B
C
D
. U

Value based question:- Q1 A basic economic problem is that there is oil shortage in INDIA. What measures do you suggest to mee t the growing demand of oil? Ans:-Measures taken are : 1) oil is limited so it should be efficiently and fully(optimum use)used. 2)Massive awareness on shortage of oil and people should be encouraged to use public transport system. Q2. The state govt. has sanctioned acertain amount to increase production in rural areas. Which technique of production will you suggest to the state govt. for this project? Ans.:-Labour intensive technique of production. Q3. Why is it that on one hand coal is found in plenty, yet it is scarce , while a rotten fruit is rare but not scarce?
Production Possibilities Commodity X Commodity Y
Marginal Rate of Transformation (MRT) =ΔY/ΔX
A 0 15 --------- B 1 14 1 Y : 1X C 2 12 2 Y : 1X D 3 9 3 Y : 1X E 4 5 4 Y : 1X F 5 0 5 Y : 1X
X
Commodity X
PPC
Y
0 1 2 3 4 5
15
14
12
Com
mod
ity Y

Ans:- Coal is scarce because its demand is greater than its supply.A rotten fruit is not scarce because there is no demand for rotten fruits. Q4. For a devolepmental project, logs of wood another building material have to be carried to the upper floor of building under renovation by the labour .Alternatively elevators and lifts can do the job ,which one will you choose and buy? Ans:- I will choose the second alternative as it is efficient and time and money saving method. Q5. If more and more resources are constantly explored and new and new technique of production are constantly discovered,don’t you think a day will come when our central problems will be solved once for all? Ans:-When new resources are explored and new technology is discovered,PPCwouldexpand,indicating larger and larger flow of goods &services in the economy.But our wants are limlted, so scarcity of resources in relation to human wants will always exist.And,so long as limited resources are to colliding with unlimited wants,central problems can never be solved once for all. QUESTION FOR LATE BLOOMERS Q1.What is microeconomics? Ans:Microecomics is the study of an individual economic unit like a firm, a consumer. Q2.What is PPC? Ans:Production possibility curve shows different combinations of two goods which can be produced with given resources and technology. Q3.What is Opportunity Cost? Ans:It is the value of a factor in its next best alternative use. Q4.What is marginal opportunity cost? Ans:It is the rate at which output of good Y is to be sacrificed for every additional unit of good X. Q5.Write two properties of PPC. Ans:PPC slopes downward from left to right. And PPC is concave to the origin. Q6.Why does an economic problem arise? Ans:An economic problem arises because resources are limited,our wants are unlimited and resources have alternative uses. Q7.What are the 3 basic economic problems of an economy? Ans.The 3 basic economic problems are: 1.What to produce and in what quantity? 2.How to produce? 3.For whom to produce? Q8.Explain the meaning of what to produce? Ans: For answer see gist of the chapter. Q9.Explain the meaning of how to produce? Ans.For answer see gist of the chapter. Q10.Explain the meaning of For whom to produce? Ans:see gist of the chapter for this answer.

Q11.Draw PPC and show the following: 1.Overutilisation of resources. 2.Fullutilisation of resources. 3.Underutilisation of resources. Q12.Write differences between microeconomics and macroeconomics. Ans.See gist of the lesson. TEST PAPER:-CLASS XII CHAPTER :- 1 INTRODUCTION TIME: 45min FM-30 Q.1 What is an economy?( 1) Q.2 What is scarcity .{1} Q.3 Name the central problems of an economy.{1} Q.4 Why do economic problems arise?.{1} Q.5 What is the problem of what to produce? {1} OR Q.6 What is the problem of How to produce? {1} Q.7 What is the problem of ‘for whom to produce’? {1} Q.8 Define a PPC? {1} Q.9 Define opportunity cost.{1} OR Q.10 What is marginal opportunity cost or marginal rate of transformation? {1} Q.11 Define:) Micro economics.{1} OR Q.12 Define M acro economics.{1} Q.13 What does a point on PPC indicate?{1} Q.14 FILL IN THE BLANKS. 1. The PPC would shift to right when there is _------------- of resources. 2) The basic economic problem is the problem of _-----------------------. 3)Cotton textile industry is the subject matter of _----------economics. 3x1 Q.15 What is Rotation of PPC? Explain with diagram. {3} OR Q 16 What is shift in PPC? Explain with diagram {3} Q.17 Why is PPC concave? Explain.{3} Q18. Does production take place only on thePPC? Explain with diagram. {3} Q.19A lot people died and many factories were destroyed in an earthquake{ natural calamity}. How will it affect the PPC? {3} Q20 Draw a ppc to represent the following on it .

a) Underemployment of resources. b) Growth of resources c) Fuller utilization of resources. {4} OR Q21. Draw the shape of PPC when MOC is (a) Decreasing (b) Constant (c) Increasing. {4} OR Q22. Plot the PPC by taking Rice consumption on the X axis. Comment on the shape of the curve. {4} RICE CONSUMPTION FUEL CONSUMPTION 100 0 90 1 70 2 40 3 0 4 ______________________________________

CONTENT ENRICHMENTONE DAY WORKSHOP
On 18-11-2017 at KV SALTLAKE NO-2
Topic: Consumer’s Equilibrium-MU Analysis
By -Dr.J.S.P.Pandey from K.V, Asansol(W.B.)
POINTS TO REMEMBER:-
Consumer :is an economic agent who consumes final goods and services.
Total utility :It is the sum of satisfaction from consumption of all the units
of a commodity at a given time.
Marginal Utility :It is a net increase in total utility by consuming an
additional unit of a commodity.
Law of Diminishing Marginal Utility :As consumer consumes more and
more units of commodity. The Marginal utility derived from the last each
successive units goes on declining.
Consumer Equilibrium :Consumer is in equilibrium when he gets
maximum satisfaction from his limited income.
Lej.kh; fcanq miHkksDrk % ogvkfFkZd ,tsUVgStksvafreoLrqvksa o lsokvksadkmiHkksxdjrkgSA dqymi;ksfxrk % ,d fuf'pr le; es a oLrq dh lHkhbdkb;ks a dkmiHkksxdjusijizkIr larqf"Vdkdqy ;ksx] dqymi;ksfxrkdgykrkgSA lhekarmi;ksfxrk % oLrq dh ,d vfrfjDrbdkbZdkmiHkksxdjusijdqymi;ksfxrk es a gksusokyh 'kq¼ of` ¼ dkslhekarmi;ksfxrkdgrsgaSA àlekulhekarmi;ksfxrkfu;e % fdlhoLrqdhbdkb;ks a dkmÙkjksÙkjmiHkksxdjusij izR;sdvxyhbdkbZlsizkIrgksusokyhlhekarmi;ksfxrkØe'k% ?kVrhpyhtkrhgSA
miHkksDrklarqyu %&miHkksDrklraqyudhvoLFkkes a rcgksrk g S tcogviuhlhekar vk; lsvf/drelarqf"VizkIrdjrkgSA

Meaning with formula–
Utility:- It is the want satisfying power of a commodity. This is measured in terms of ‘utils’.
Utility can be of two types.
(a) Total Utility:- TU is the sum total of satisfaction that the consumer derives when a certain number of units of a particular commodity are consumed.
Tux= f(Qx) or TU = ∑ MU
(b) Marginal Utility:- MU is the additional satisfaction derived from the consumption of an additional unit of the commodity.
MUn = TUn – TUn-1
Alternatively; MUx= ∆ TUx/ ∆/Qx
Q. Define Consumer Equilibrium
Consumer equilibrium refers to such a situation when a consumer maximizes her satisfaction out of her given money income and the price of the desired good(s).
Q.Whataretheconditions of consumerequilibrium?
Incaseofone good:MUx/PX=Mum orMUx/MUm=PXor Mux=PX
Q.DefineMarginalUtilityofmoney.
Itreferstothemarginalutilityofmoneyincomewhichmeanstheutilityderivedfromspendingtheadditional/extraunitofmoneyonthedesiredgoodbytheconsumer.
Q. Consuming two goods , a consumer attains equilibrium when price remain same: a) MUX>MUY b) MUY>MUX c) MUX=MUY d) TUX =TUY ans – (C) Q. when marginal utility is negative, total utility is: a) zerob) diminishing c)maximumd) minimum ans- (B)

Q. A consumer consumes only two goods X and Y. Marginal utilities of X and Y are 3and 4 respectively. Price of X and y are 4 per unit each. Is consumer in equilibrium? What will be further reaction of the consumer? Give reasons.(3Marks) CBSE 2016 Ans: The consumer is not in anequilibrium because- MUX MUY
=
PxPY
Since per rupeeMUx is lower than per rupee MUY the consumer will start buying less of X and more of Y till MUxrisesandMUY fails enough to make. MUX MUY
< or ¾< 4/4 PxPY Q. What happens if MUX / Px>MUY /PY ?
Ans: In this situation, the buyer buys more of good X than Y since he is deriving more utility
from good X. As he keeps on good buying more units of good X, the MU on good X keeps on
falling while the MU on good Y keeps on rising due to Law of diminishing marginal utility
effect. In other words, the good which is sacrificed, the desire to have more of it increase,&
therefore on every additional unit of goods X the MUon good Y rises. The Process continues
till both MUX/PX & MUY/PY are equal to each other.
Q. Explain where does a consumer derive maximum satisfaction in case of two goods
under cardinal approach.
Ans: In case of more than one good, the consumer decides to purchase that quantity of
goods when the ratio of MU and price of the desired goods are equal to each other. This
can be explained with the help of the following example for good A, B, and c: Given the
price of good X and y is Rs. 4 & Rs. 6,andMUm as Re.1=I util.

Units MUx MUy
1 16 12
2 12 8
3 10 6
4 6 4
5 4 2
6 2 0
In this situation a consumer will purchase 5 units of good X, 3 Units of good y to
maximize her satisfaction. The reason is that the ratio of MU and price of these two goods
is 1 which is also equal to Mum. If the price of these goods is assumed to be Rs.2, the
consumer will purchase 6 and 5 units of good X & Y respectively.
Q. Given price of a good, how does a consumer decide as to how much of that good to buy? Ans. Consumer purchases upto the point where marginal utility is equal to the price (MU=P). So long as marginal utility is greater than price, he keeps on purchasing. As he makes purchases MU falls and at a particular quantity of the good MU becomes equal to price. Consumer purchasesupto this point. Q. A consumer consumers only two goods X and Y. State & explain the conditions of consumers equilibrium with the help of utility analysis. Ans. There are two conditions of consumer equilibrium :
(i) MU X MUY
Px = P
Y
Explanation : If
MU X MUY
Px = P
Y the consumer is not in equilibrium because he can raise his total utility by buying less of Y and more of X.
Similarly if

MU X MUY
Px = P
Y the consumer is not in equilibrium as he can raise his total utility by buying less of X and more of Y.
(ii) MU falls as consumption increases :
If MU does not fall asconsumption increases the consumer will end up buying only good which is unrealistic or consumer will never reach the equilibrium position.
Q. Explain relationship between total utility and marginal utility with the help of a schedule.
Ans. Quantity
(Units) Total utility Marginal utility
0 0 –
1 8 8
2 14 6
3 18 4
4 20 2
5 20 0
6 18 – 2
(1) As long as MU is positive, TU increases.
(2) When marginal utility is equal to zero then total utility is maximum.
3)When marginal utility is negative; Total utility starts diminishing. Q. Define marginal utility. State the law of diminishing marginal utility.
Ans. Marginal Utility :It is addition more to the total utility as consumptionis increased by one more unit of the commodity.
Law of Diminishing Marginalutility :It states that as consumerconsumes more and more units of a commodity, the utility derived from each successive unit goes on decreasing. According to this law TU increases at decreasing rate and MU decreases.

Q. DefineLaw of diminishing marginal utility (DMU) and What are its assumptions?
Law of diminishing marginal utility (DMU):- As a consumer goes on consuming more and more units of a commodity the additional benefit that he derives from the additional unit of a commodity goes on falling.
This law is based on following assumptions:-
1. Standard unit of measurement is used.
2. Homogeneous commodity.
3. Continuous consumption.
4. Mental and Social condition of the consumer must be normal.
5. No change in income, tastes, fashion and price.
Q.Explain the relationship between total utility and marginal utility with the help of schedule and diagram.
Ans.Utility schedule and utility curve:- The law of DMU is numerically illustrated in terms of utility schedule. It shows the TU & MU derived by a consumer as he consumes more and more of good X.
Utility function:-
Quantity of Good X TUx MUx = (∆ TUx/ ∆/Qx)
1 18 18
2 34 16
3 46 12
4 51 05
5 51 0
6 43 –8

Mamm
Max = 0
C T U.
Tota
l Util
ity
No. of Units Consumed
T TU
AB
D
Mar
gina
l Util
ity
Ea 3uNo. of Units Consumed
Relationship between TU and MU
• When MU diminishes TU increases as shown in the diagram point A to C and B to D.
• When MU is zero TU is maximum (point C & D)
• When MU is negative TU declines (point E & T)
Q. Consumer’s Equilibrium:- The main aim of the rational consumer is to maximize satisfaction with the given resources (budget constraint) and he does not want to bring any change in it. Suppose a consumer wants to buy a commodity. How much of it should he buy?
Ans: (Two approaches are used for getting an answer to this question.)-
Consumer’s Equilibrium with Utility approach:-Cardinal measurement of utility where utility of different units of a good not be added or subtracted.
2. Consumer’s Equilibrium with Indifference curve approach:- Ordinal measurement of utility where the utility can be compared or ranked. In this theory, utility of different units can not be added or subtracted.
I. Utility approach:-Marshall explained it with cardinal measurement of utility.
Assumptions of Utility approach:-
1. Consumer is rational i.e. Maximum Satisfaction out of his limited income.
2. Utility can be measured in cardinal numbers.
3. Marginal utility of money is constant.
4. Utility of each commodity is independent of the prices and utilities of other commodities.

P
D
E
C
Mux=Px(mum)
Mu>P
Mu
Pric
e
Mu<P mux
X
P
O Q1 Q Q2
Y
5. No change in the taste and prices of the commodities and income of the consumer.
Consumer’s Equilibrium — Single commodity case:-
It is attained when marginal utility of commodity in terms of money becomes equal to its price. MUx = Px
Since it is difficult to compare MU of a good (expressed in utils) with its price (expressed in Rs) therefore MU of a good is first converted in terms of money by dividing MU of a good with MU of a rupee.
(MU of good/MU of a rupee) = Price of the commodity
The above condition can be explained with utility schedule.
Units of X Price of X (Px) MUx
1 5 8 Mu > p
2 5 6
3 5 5 Mu = p
4 5 4 Mu < p
5 5 3
MUx = Px (MUm) -->Point E
MU>P -->Point C
MU<P -->Point D
Consumer Equilibrium in case of two commodities
When a consumer wants to buy two commodities his equilibrium will be determined in accordance with the law of equi-marginal utility. He will distribute his money income

MUx MUy MUmPx Py
= =
MUx MUy MUmPx Py
= =8 units 8 units1unit 1unit
=
O
Muy
LOSS.
Muy
Mux
Mux
Mux Muy =
O1
S1
S
Py
Py
Px
Px
Px Py
R
E
T M
among these goods in such a way as he gets equal marginal utility in terms of money from all the goods. In case of two goods consumer equilibrium would be:
It can be explained with the help of following table and a diagram.
Unit of Money MUx - good (units) MUy - good (units)
1 14 (1) 10 (3)
2 12 (2) 8 (5)
3 10 (4) 6
4 8 (6) 4
5 6 2
6 4 0
In this case when consumer spends 4 units of money on x-good and 2 units of money on y-good, he gets equal marginal utility of 8 units. When Marginal utilities are equalised TU is maximised. Here, TU = 14+12+10+8+10+8 = 62 units. In no other case, consumer can get utility of 62 units or more than.

MUx MUy MUmPx Py
= =
MUx MUyPx Py
>
Utility is maximumwhen
At point T where,
It shows that OT is spent on good x and O, T on good y. Accordingly the consumer is at point R on the MUx curve and at points on MUy curve. There is a loss of utility shown by the shaded area.
This prompts the consumer to transfer some of expenditure from y to x till he reaches to point ‘E’
Q.What is the condition of consumer equilibrium in case of more than one good? Explain with the help of illustration.
Incaseofmorethanonegood:TheratioofMUandpriceof Allthedesiredgoods areequaltoeachother,andfinallytheseratiosare equaltoMUm.Thiscanbeexpressedas: MUxMUy MUz MUn MUm = _____ = ______ = ________ = _______ Px PY PZ Pn Illustration:“GiventhemarketpriceofagoodasRs4,howdoesaconsumerdecidetopurchaseagood?”shalldepend Uponthepointwheretheconsumermaximizehersatisfactionanddonotendtopurchasethegoodatthatpointoftime.
Units TU MU Price
1 14 14 4 MU>P
2 24 10 4
3 32 8 4
4 38 6 4
5 42 4 4 MU=P
6 44 2 4 MU<P
7 44 0 4

From this table we see that the consumer purchase 5 units of the good because the Equal to MU, and will not like to purchase more units because the price of the good is great satisfaction derive from the extra units of MU. When the consumer purchase 1st unit Exceeds the price, and therefore she purchase 2nd unit at which the MU still exceeds the price. Q.StatetheLawofDiminishingMarginalUtility.Explainwiththehelpofanillustration. Ans: Thelawstatesthat,“asaconsumergoesonconsuming More&moreunitsofagood,less& lessshewantstohavemoreofit,ceterisparibus”.
Units
Consumed
TUx( in Utils) MUx
(in Util)
1 20 20
2 34 14 3 43 9
4 48 5 5 50 2
6 50 0 7 48 -2
8 43 -5

2
Q.Giventhemarketpriceofagood,howdoesaconsumerdecideastohowmanyUnitsofthatgoodtobuy?Explain.(3 Marks)(CBSE 2008)
Ans: Consumer,comparespricewithmarginalutility(MU). HecontinuestobuysolongasMUisgreaterthanprice.Ashebuysmore MUfallsandbecomesequaltopriceatacertainquantity.Hestopsbuying WhenMU=P.This maximizes utility.BuyingmorewillmakeMulessthanprice,andreducesutility.
Q. What happens to MU when TU is maximum?
Ans: MU is Zero
Q .What is about TU, When MU is negative?
Ans-TU declines
Q. What is about MU, when TU increases at decreasing rate?

Ans-MU decreases.
Q.What will you say about TU, when MU is zero?
Ans-TU is maximum
Q. (a) Given Px = Rs 2, Py= Rs 1, income = Rs 12. Find how a consumer
spends her
income in order to maximize total utility.
(b) Calculate TU receive by the consumer. Show that the equilibrium
condition for
the consumer are satisfied.
Ans) (a) Consumer will spend 1st and 2ndrupe to buy 1st and 2nd units of Y.
This will give
total of U units. If the 1st two rupees were spent on 1st unit of X then 16
units
would be received.
(b) TU = 93 units
(c) MUx/ Px = MUy/ Py subject to PxX + PyY = M
12/2 = 6/1…. subject to (2)(3) + (1) (6) = 12
NOTE: Please useKurtidev font to show hindi question and answer.
____________THE END__________

Consumer’s Equilibrium with IC approach
1.Define Budget line?
Ans: Budget line shows the combination of two goods that a consumer can buy with the given income and the prices of two goods.
2. Explain Consumers Equilibrium in case of indifference curve Approach?
Ans: Indifference Curves: Indifference curve shows different combination of two goods that yield the same level of utility or satisfaction to the consumer.
Consumers equilibrium: A consumer is said to be in equilibrium when he/she maximises his/her satisfaction with the given lncome and prices of two commodities. Assumptions:
(i) Rationality (ii) Ordinality (iii) Consistency of choice
Conditions of equilibrium:
i) Slope of IC=Slope of budget line or MRSxy=Px/Py ii) Budget line must be tangent ot IC at the point of equilibrium.
Indifference Map Budget Line

3.Define Indifference map. Ans: A group of indifference curves is called indifference map. 4.What is meant by monotonic preference ? Ans: Monotonic preference refers to that preference of a consumer of a bundle which has at least one commodity more than the other bundle. 5.What is Budget set of a consumer ? Ans: A set of two goods that a consumer can buy with given income in his hand and prices of two goods. 6.Explain three properties of indifference curve. Ans. i) ICs are downward sloping. ii) ICs are convex to the origin. iii) ICs never intersect each other. 7.Explain why is an Indifference curve (a) downward sloping and (b) convex. Ans: a) In order to maintain the same level of satisfaction a consumer has to sacrifice one good to get one unit of another good. b) ICs are convex to the origin due to diminishing MRS. 8. Explain the concept of MRS with the help of a numerical example. Also explain its behaviour along an Indifference curve. OR

Explain the concept of marginal rate of substitution with the help of schedule and diagram. Give reason behind diminishing MRSxy.
Ans: Marginal Rate of Substitution of X for Y rfers to the number of units of good Y that a consumer is willing to forego for an additional unit of good X , so as to maintain the same level of satisfaction. MRS= ∆𝑿/∆𝒀 The concept of MRS can be understood with the help of following table: Combination Units of X Units of Y MRS A 1 20 - B 2 16 4Y:1X C 3 13 3Y:1X D 4 11 2Y:1X E 5 10 1Y:1X When consumer moves from combination A to B he sacrifices 4 units of good Y for an additional unit of good X to maintain the same level of satisfaction. Therefore , MRS at this stage is 4. When consumer moves from B to C, from C to D and from D to E, MRS diminishes as the consumer increases the units good X and decreases the units of Good Y. In other words, he acquires constant quantity of good X and gives up smaller and smaller quantity of good Y. 09. Explain the conditions of consumer equilibrium with IC analysis. OR Show diagrammatically the conditions for consumer’s equilibrium, in Hicksian analysis of demand. Ans: As per Hicksian analysis, the given consumer attains equilibrium when the two conditions are met: a) MRS=Px/Py Slope of IC=Slope of Budget line b) MRS falls as more is consumed of one good at the cost of other. The given budget line AB is tangent to the indifference curve IC2 at point E in the given diagram. This is the consumers equilibrium. The utility maximising combination of the two goods is OQx of good X and OQy of good Y.

Q 10. Explain the concept of marginal rate of substitution. Explain the reaction of the consumer when marginal rate of substitution is higher than the rationof prices. i.e., MRS>Px/Py Ans: Marginal Rate of Substitution of X for Y refers to the number of units of good Y that the consumer is willing to forego for an additional unit of good X, so as to maintain the same level of satisfaction. MRS=∆𝒀/∆𝑿 As the given consumer moves downwards along the indifference curve, we observe that MRS(the slope of the indiffeence curve) continuously declines. This implies that the indifference curve is convex. According to question, when MRS>Px/Py, This means to get one more unit of commodity X consumer is willing to sacrifice more units of commodity, Y than the market requires. Consumer will now buy more of commodity and buy less of commodity Y. This will bring down MRS till it becomes equal to Px/Py and the equilibrium is achieved. Q.11. A consumer consumes only two goods X and Y both priced at Rs3 per unit. If the consumer chooses a combination of these two goods with Marginal Rate of Substitution equal to 3, is the consumer in equilibrium ? Give reasons. What will a rational consumer do in this situation ? Explain. Or A consumer consumes only two goods X and Y. At a consumption level of these two goods, he finds that the MRS is higher than the ratio of prices. Explain the reaction of the consumer. Ans: Given, Px=3 and Py=3, MRS=3 We know that a consumer is said to be in equilibrium when MRS=Px/Py. On substituting the above values, 3=3/3( that is MRS>Px/Py) In this case the consumer is not in equilibrum. This implies that the consumer is willing to pay more for good X than the market requires. Thus the consumer will buy more and more units of X .As a result the MRS will fall due to law of diminishing marginal utility. This will continue till the MRS=Px/Py. 12. Define a Budget line. When can it shift to the right ? Ans: Budget line shows the combination of two goods which can be purchased with the given income and the prices of given two goods. Budget line can shift to the right due to the following: i) There is rise in income of the consumer, with prices remaining same ii) Fall in the Px , with no change in income and price of good Y iii) Fall in the Py, with no change in income and the price of good X.

UNIT II: CONSUMER BEHAVIOUR & DEMAND (MARKS 13)
1. What is Demand?
Demand for a commodity refers to willingness and ability of a
consumer to purchase a good at a given price and at a given
unit of time. By the term demand we mean the quantity of a
good which a consumer purchases at a given price and at a
given unit of time.
2. What is Demand Function? Demand function is an
expression which establishes a precise functional
relationship between the demand for a good and its
various determinants i.e. Qdx = f (Px, Py, Y, T…)
3. Explain briefly the determinants of Demand i.e. the factors which affect the demand for a good
# Price of a good (Px) is the most p important factor which may bring the d change in the demand for a good. The rise
in price leads to the fall in the demand for po
a good if other things remaining same and p1
d
# Price of other related good (Py) is also one of the
determinant of the demand for a good. The change in the
price of a good (say Tea) may bring the change in the
demand for other good (say, Coffee or Milk). In case of a
substitute good, the rise in the price of good X (say Tea) will
lead to the increase in the demand for the good Y(say
Coffee), and vice versa. Thus the change in both is directly
related. In case of a complementary good, the price rise in one
good (say Car) may lead to the decrease in the demand for the
related good (say Petrol), & vice versa. Thus, both this are
negatively related. Shift in dd incase of substitute good Shift in dd incase of substitute good
P d1 P
d d

d1
p0 p0
d
d1
d d1
o o
q0 q1 q q0 q1 q
# Income of the consumer (Y):The change in income of a
consumer may lead to the change in demand for a good, and vice versa.
Incase of a normal good, the rise in income leads
to rise in its demand because the purchasing power of the consumer will
rise with the rise in income, and vice versa. On
the other hand, the rise in income leads to decrease in demand for a
inferior good.
Y d1 Y
d
P0
O Q0 Q1 X O Q1 Q0 Qty.of Demand Qty.of Demand Shift in ‘dd’ in case of Shift in‘dd’ Normal good in case of an inferior good
due to rise in income due to rise in income
# the change in Taste, habit and fashion also has the
direct influence on the demand for a good. For e.g. the taste for using
Addjel pens is on rise these days by the students.
B’coz of this, the demand for this kind of pens is also rising.
# the size of population or a family also determines the demand for
a good. The increase in the size of a family may
lead to the rise in the demand for a good. For e.g, if a man
gets married then obviously the no. of members in his family will increase.
P0
P R I C E
P R I C E
d1 d

This will lead to the rise in the demand for milk
& other essential goods.
# Weather & climatic conditions may also have the influence
upon the demand for a good. A poor weather
condition may lead to fall in demand for a certain good, and
vice versa. For e.g, too hot climate may raise the demand for cold drinks.
4. State the law of demand.
“While other things remaining same, the demand for a good rises with the fall in its price, and vice versa.” Thus this law
tells us that there is an inverse relationship between both the
price of a good and its demand.
5. Define Demand schedule & demand curve.
It refers to a tabular presentation of the relationship between price of a good and its demand, while Demand curve is the graphical representation of the demand schedule.
6. What are Giffen goods or Inferior goods?
These are those goods whose demand rises with the fall in income and vice versa. Some of the inferior goods are bajra, wet rice, maize etc.
7. Define Substitute goods & complementary goods.
Substitute goods can be defined as those goods which can be in use
in place of
other goods. In other words, the fall in the price of these goods lead to
the rise in the demand for the other substitute
good. For e.g. the Tea & coffee, pen & pencil etc.
Complementary goods refer to those goods which are
used together or those goods which are demanded together. The
fall in the price of a complementary good leads to the
rise in demand for the other good. For eg., pen & ink, car &
petrol etc.
8.Define Price Elasticity of Demand.
Price elasticity of demand can be defined as the measure/ degree of responsiveness in the change in demand
for a good due to the change in its price.
9. Show how to calculate price elasticity of demand.
Percentage change in qty.
demanded
Coefficient of price elasticity of demand (Ep)= ----------------------------
Percentage change in its price
(Change in qty. / Initial qty.) × 100 (∆q / q)×100

Thus, Ep = ------------------------------ = ----------
(Change in price / Initial price) × 100 (∆p / p) ×100
∆q
____ × 100 Ep =
q _______________ ∆p
---- × 100
p

10.What are the Degrees of price elasticity of demand according to Percentage Method? Show with the diagram.
1. Unitary elastic demand (Ep=1);
2. Relatively elastic demand (Ep>1) ;
3. Relatively Inelastic demand (Ep<1);
4. Perfectly Inelastic demand (Ep=0);
5. Perfectly elastic demand (Ep=∞).

CONSUMER BEHAVIOUR AND DEMAND ( HOTS )
Q 1) What is the curve showing different combinations of two goods , maintaining the same level of satisfaction known as?
Ans. Indifference curve
Q. 2) Give the formula for calculating slope of budget line.
Ans. Slope of budget line is equal to the ratio of the prices of the two commodities i.e. PyPx
Q. 3) What is slope of indifference curve?
Ans. Slope of indifference curve is equal to MRS i.e. marginal rate of substitution.
Q. 4) If the consumer is indifferent between combination A and B of two goods what does this imply?
Ans. It implies that for a consumer , combination A is as good as combination B ,i.e. both combination give equal satisfaction to him and they are equally preferable .
Q. 5) Why is the indifference curve convex to the origin?
Ans. Indifference curve is convex to the origin due to diminishing MRS.
Q. 1) How would you comment on the elasticity of Demands when 8% decrease in price of
a commodity causes 2% increase in the expenditure of commodity ?
Ans. Elasticity of demand must be greater than unity when expenditure on the commodity
responds inversely to any change in price of the commodity .

Q. 2) If demand curve is found to be positively sloped , what it could be due to ?
Give your answer in terms of nature of the commodity , income effect and
substitution effect .
Ans. Positively sloped demand curve violates the law of demand . It is found in case of
giffen goods . These are those inferior goods in case of which income effect is negative
and greater than substitution effect , so that net effect points to a positive relation
between price and quantity demanded of the commodity .
Q. 3) Mention one determinant of demand for a commodity other than price.
Ans. Price of related goods affects the demand for a good.
Q. 4) When demand for a good falls due to rise in its own price , what is the change in demand called?
Ans. Contraction of demand
Q. 5) When will rise in demand be called expansion of demand and when it will be called an increase in demand?
Ans. When the rise in demand is due to fall in the price of the commodity , it is called expansion of demand and when the rise in demand is due to factors other than price such as increase in the income of the buyer etc. it is called increase in demand.
Q. Short answer question ( 3 or 4 marks)
Q. 6) Define law of demand? Draw a unitary elasticity of demand with the help of a demand schedule.
Ans-6 (P) (D)
1 100
2 80
3 60
4 40
5 20

1.1. Inverse relation between price and demand i.e., when price increase and demand for a commodity decreases and vice verse
1.2. Schedule :-Shows q. of demand at different price c)Demand curve :- ‘DD’ curve slopes downward from left to right.
2. A consumer boys 160 units of a good at a price of Rs 8 per unit. Price falls to Rs 6 per unit. How much quantity will the consumer buy at the new price if price elasticity of demand is (-)2) ?
A.
X = 160 = +80
X = +80 + 160 = 240
The Consumer will buy 240 units.
Q.3. How would you comment on the elasticity of demand when 8% decrease in price of a commodity causes 2% increase in expenditure of the commodity?
Ans: Elasticity of demand must be greater than unity (implying a situation of elastic demand) when expenditure on the commodity responds inversely to any change in price of the commodity.

Q. 4. The elasticity of demand for X is twice the elasticity of demand for Y. Price of X
falls by 5% and Price of Y rises by 5% . What will be the % change in the quantity
demanded of X and Y?
A.2 Suppose elasticity of demand for Y = 1 , and
elasticity of demand for X will be = 2
So, % decrease in qt. demanded of Y will be 5% , because price rises by 5%, and
% increase in qt. demanded of X will be 10% , because price falls by 5% .
Q5.Causes of Rightward shift / Leftward shift of demand curve.
Ans.1.Increase/ decrease in income of consuers.
2. increase / decrease in habits of consumers
3. increase /decrease in size of population.
Q 6.What are the factors determine the price elasticity of demand?
Ans.1. price of the commodity.
2. Nature of ;the commodity.
3. Number of uses of the commodity.
4. Proportion of income spent on consumption.
Long answer type question. ( 6 marks)
1. . Explain the factors that affect the market demand of a commodity. (or)
Distinguish between increase in demand and expansion of demand (rise in quantity demanded). Use diagram. (6)
Ans-Expansion demand due to price change and Increase in demand is due to other than price change. Previous one is movement along with same demand curve.

Later one is shifting ‘DD’.
Expansion due to price falls, Increase demand due t Income rise. Expansion
2. . Distinguish between :(a) Individual demand and market demand and
(b) ‘Change in demand’ and ‘change in quantity demanded’
Ans- a) Quantity demanded of a commodity by a buyer at a given price during a
given period is called individual demand. Quantity demanded of a commodity
by all the buyers is called market demand. 3
(b) Change in demand due to change in own price of the given good is called
change in quantity demanded. Change in demand of a good due to any factor
other than the own price of the good is called ‘change in demand’ 3
3. Explain the Consumer’s equilibrium, in case of an single commodity.
Ans.. Consumer’s Equilibrium — Single commodity case:-
It is attained when marginal utility of commodity in terms of money becomes equal to its price. MUx = Px
Since it is difficult to compare MU of a good (expressed in utils) with its price (expressed in Rs) therefore MU of a good is first converted in terms of money by dividing MU of a good with MU of a rupee. (MU of good/MU of a rupee) = Price of the commodity
The above condition can be explained with utility schedule. Units of X Price of X (Px) MUx 1 5 8 Mu > p
2 5 6
3 5 5 Mu = p
4 5 4 Mu < p
5 5 3

MUx = Px (MUm) → Point E
MU>P → Point C
MU<P → Point D
Q.4). Differentiate between Changes in Quantity demanded and Change in demand
Ans.. Change in Quantity demanded Change in demand
1. Other things being equal if quantity 1. If more or less quantity of a commodity demanded increases or decreases is demanded, at the same price, due to due to fall or rise in the price of change in factors other than price of
the commodity it is known as movement commodity, it is called shift in the along a demand curve or change in demand curve or change in demand. quantity demanded 2. The movement is either upward or 2. There is either rightward shift or downward along the same leftward shift of the demand
curve. demand curve 3. An upward movement shows 3. Rightward shift indicates increase in contraction in demand and demand, leftward shift shows decrease downward movement shows in demand. expansion in demand.


Cost and Revenue
Board Questions
•1 Mark questions [COST]
1. What do you mean by cost ?
Ans. Cost is the sum of explicit and implicit cost.
2. Define explicit costs.
Ans. Those monetary payments by producer on factor and non factor payments is called explicit cost. Which are not owned by himself
3. Which cost curve is parallel to ox-axis? Why? Ans. Total fixed cost because TFC remain constant at all level of output.
4. What do you mean by implicit costs?
Ans. Implicit cost is the cost of self owned resources of producer.
5.Define marginal cost.
Ans.Marginal cost is the net addition to total cost when one additional unit of output is produced.
6. Why does the difference between average total cost and average variable cost falls with increase in output? Ans. It is because average fixed cost goes on falling with increase in output.
7. Give an example of explicit cost
Ans. Wages paid to labourers
8.Give another name of fixed cost
Ans. Indirect costs
9. What is meant by per unit cost of a good ?
Ans. Average cost
10. Give an example of implicit cost
Ans. Interest on entrepreneur's own capital
•1 Mark questions ( Revenue)
1. Define Revenue.
Ans. Revenue is the amount received from sale of output.
2. What do you mean by marginal revenue?
Ans. Marginal revenue is net additions to total revenue by sale of one additional unit of output.
3. State any two conditions of producers equilibrium according to marginal revenue and marginal cost approach. Ans. 1. MR = MC
2. Rising portion of Marginal cost curve intersects marginal revenue curve
4. What will be the behaviour of total revenue when marginal revenue is zero? Ans. Total revenue will be maximum.

5. Which concept of revenue is called price ?
Ans. Average revenue
6. What is another name of price line ?
Ans. Firm's demand curve
7. At what rate average and marginal revenue falls, with fall in per unit price of a good? Ans. Marginal revenue falls twice the rate of average
8.What will be the behaviour of Average revenue when total revenue increases at constant rate? Ans. Average revenue remains constant.
9.what is government revenue?
Ans. Government revenue includes all amounts of money (i.e., taxes and fees) received from sources outside the government entity. Large governments usually have an agency or department responsible for collecting government revenue from companies and individuals
10.What is association non-dues revenue ?
Ans. Association non-dues revenue is revenue generated through means besides association membership fees. This revenue can be found through means of sponsorships, donations or outsourcing the association's digital media outlets.
• 3 Marks questions
1.what is the difference between fixed cost and variable cost ?
Ans.
2.Does long period TC starts from origin?
Ans. Yes, long period TC curve starts from origin because in long period, all costs are variable costs and variable cost always vary without output, so that when output is zero, variable costs are also zero.

3.Read the following carefully. Write true and false with reason.
a.Fixed cost is constant even when output is zero
b.Total fixed cost is indicated by a vertical straight line
c.Average cost include both fixed and variable cost.
a.True because fixed cost are incurred even before output actually starts
b.False. Total fixed cost indicates horizontal straight line parallel to x-axis
c.True. AC=AFC+AVC
4.why is short run average cost curve u shaped?
Ans.The nature of short period Average Cost Curve is ‘U’ shaped. To begin with, the Average Costs are high at low levels of output because both the Average Fixed Costs and Average Variable Costs are more.
5.A producer can sell more of a good at same price..Prepare a total revenue and marginal revenue schedule. Take four output levels( all india 2010)
Ans.
6.What is meant by TR,AR and MR?
Ans. TR-“Total revenue is the sum of all sales, receipts or income of a firm.”
AR-“The average revenue curve shows that the price of the firm’s product is the same at each level of output.”
MR-“The marginal revenue is the change in total revenue resulting from selling an additional unit of the commodity.”
7. how does changes in marginal revenue affects total revenue?
Ans. Marginal revenue measures the change in revenue that results from a change in the amount of goods or services sold. It indicates how much revenue increases for selling an additional unit of a good or service. To calculate marginal revenue, divide the change in total revenue by the change in the quantity sold. Therefore, the marginal revenue is the slope of the total revenue curve.
8.Explain the relationship between marginal revenue and total revenue
Ans.Relationship between Marginal Revenue and Total Revenue is as follows: (i) TR increases at increasing rate, if MR is increasing.

(ii) TR increases at diminishing rate, if MR is diminishing. (iii) TR is constant and maximum, if MR is zero. (iv) TR decreases, when MR becomes negative.
9.Explain the relationship between marginal revenue and average revenue using diagram
Ans.Marginal revenue is the addition to total revenue by selling one more unit of the commodity.
Algebraically it is the total revenue earned by selling ‘n’ units of the commodity instead of n-1. Thus,
MRn = TRn – TRn-1; where MRn = Marginal revenue of the nth unit
TRn = Total revenue of n units
TRn-1 = Total revenue of n-1 units
10.Explain marginal and average revenue curve under perfect competition
Ans.Perfect competition is the term applied to a situation in which the individual buyer or seller (firm) represent such a small share of the total business transacted in the market that he exerts no perceptible influence on the price of the commodity in which he deals.
Thus, in perfect competition an individual firm is price taker, because the price is determined by the collective forces of market demand and supply which are not influenced by the individual. When price is the same for all units of a commodity, naturally AR (Price) will be equal to MR i.e., AR = MR.
•.Giving example, explain the meaning of cost in economics. 6 Marks question1
2.Explain the relationship between TC and MC (All India 2008)

3.What is the difference between average total cost and average variable cost decrease with the increase in level of output ? ( Delhi 2008)
4.Define variable cost. Explain the behaviour of total variable cost as output increase. (All India 2011)5.Draw total fixed cost , total variable cost and total cost in a single diagram. State the relationship between total variable cost and total cost
5 . What is the relationship between total revenue , profit and total cost ?
Ans. A small-business owner seeks to maximize both total revenue and profit. When she prepares her annual business plan, the owner and her team determine the expenditures that are required to reach the revenue goals she has set for the upcoming year. To maximize profit, she has to carefully control costs and make difficult decisions about which expenditures are absolutely necessary. By understanding the relationship between total revenue, profit and total costs -- RPC for short -- she can see how each of the decisions she makes impacts her profitability.
6. Is there any difference between revenue and income ? Explain.

Ans. Many people mistake “income” and “revenue” as the same thing. However, there are
many small differences between the two financial concepts.
Both “income” and “revenue” are financial and business terms. Their meanings closely
resemble each other because they are often used in the same context. Both concepts are
applicable in accounting and economic disciplines.
“Revenue,” for instance, is the total amount of money that a business earns by doing its
activities. These activities include selling a product or a service, but it can also be earned by
an indirect means. Indirect business revenue can be gained if a business has placed money
in investments. On the other hand, “income,” also known as “net profit,” is the money left for a business after it subtracts costs and expenses from its revenue. Costs and expenses include the operational costs (salaries and wages, upkeep of machinery, security, expenses for rawmaterials, to name a few), depreciation, and capital. Costs can be categorized into many types (usually in tandem) that include fixed and variable costs, direct and indirect costs, and lastly, product and period costs. Income can also be categorized as positive or negative. Positive income means there is more revenue or less expenses while negative income accounts for a low revenue or high expenses.
7. The following table shows the total cost schedule of a firm. What is the total fixed cost schedule of this firm. Calculate TVC,TFC,AVC,SAC and SMC schedules of the firm.
Q 0 1 2 3 4 5 6
TC 10 30 45 55 70 90 120
---------- x ----------

PRODUERS EQUILIBRIUM
SHORT- QUESTION ANSWERS
1. What is producer’s equilibrium? Ans- producer equilibrium means the level of output where the firm is maximizing its profit and therefore has no tendency to change its output.
2. State the two conditions of Firm’s equilibrium under perfect competition. Ans- (a) MC=MR=AR (P) (b) MC curve should cut the MR curve from below.
3. What is explicit cost? Ans – payment made by a firm for purchasing or hiring inputs from other firm.
4. What is opportunity cost? Ans – cost of a factor in its next best alternate use, which is given up.
5. What is meant by normal profit? Ans- it is the profit level which is required to cover the explicit cost and opportunity cost.
6. What is the condition of a competitive firm’s when it earns super – normal profit in short run? Ans – when MC=MR=AR(P)>SAC OR TR>TC.
7. In the situation of losses, when does competitive firm continue to its production in the short-run? Ans- when firm AR(P) is equal to or greater than SAVC.
8. When does a competitive firm decide to stop production in the short run? Ans- when firm’s price becomes less than SAVC.
9. What should be the minimum price of a competitive firm in the short run,if it produces positive level of output? Ans - the minimum price should be equal to minimum short run AVC.
10. How much maximum losses a competitive firm can bear in the short – run ? Ans – A competitive firm in the short run can bear the maximum losses equivalent to its fixed cost.
11. What is producer’s Equilibrium? State conditions of firm’s equilibrium under perfect competition.
12. Explain why the output level where marginal revenue is greater than marginal cost (MR>MC) cannot be the profit maximizing level of output.
13. Explain why the output level where marginal revenue is less than marginal cost (MR<MC) cannot be the profit maximizing level of output.
14. Can a firm earn supernormal profit in the short run? What is the condition of firm’s equilibrium in this condition?
15. What should be the minimum price for a competitive firm in the short run, if it is produces positive level of output?
Ans – the minimum price should be equal to minimum SAVC. 16. How much profit a competitive firm can earn in the long run?
Ans- only normal profit. 17. What is the condition of of long run equilibrium of a firm under perfect competition.

Ans- MC=MR=AR=minimumLAC. 18. What is break even point? Define it?
Ans- where TR is just equal to TC 19. What do you understand by Producer’s Profit?
Ans- Excess of revenue over cost is called producer’s profit. 20. When does producers profit become the maximum?
Ans- when the difference between TR and TC becomes positive and maximum.
LONG QUESTION ANSWERS 1. Explain producers equilibrium through MC and MR approach with the help of schedule and
diagram. 2. What is meant by firm’s equilibrium? Explain the conditions necessary for firm’s equilibrium
under perfect competition. 3. Can there be a positive level of output that a profit maximizing firm produces in a
competitive market at which the price is not equal to marginal cost? Give explanation. 4. Will a profit maximizing firm in a competitive market ever produce a positive level of output
in the range where the MC is falling? Give explanation. 5. Will a profit maximizing firm in a competitive market ever produce a positive level of output
if the price is less than the minimum of SAVC. Give explanation. 6. Will a profit maximizing firm in a competitive market ever produce a positive level of output
if the price is greater than the minimum of SAVC,but less than the minimum of SAC? Give explanation.
7. With the help of diagram, explain the shut-down point of a profit maximizing competitive firm in the short run.


UNIT:-PRODUCTION FUNCTION
QUESTION BANK
1-Mark Questions
1. Define production.
-Transformation of inputs into outputs is called production.
2.Define production function.
-It explains the functional relationship between physical inputs and physical outputs.
3.Define Marginal Physical Product(MPP)?
-It refers to addition to total product when one more unit of variable factor is employed.
MPP=TPPn-TPPN-1
4.Define average physical product.
-It refers to output per unit of variable input.APP=TPP/Q
5.Define Total physical product(TPP). -It refers to the total quantity of output produced by employing a given factor inputs during a specified period of time.
6.What is short-run? -It refers to the time period during which one factor of production is fixed.
7.What is long-run? -It refers to the time period during which all factor inputs can be changed..
8.What happens to TPP, when MPP becomes negative?
-TPP diminishes
9. What happens to TPP, when MPP increases?
-TPP increases at an increasing rate.
10.What happens to TPP, when MPP becomes zero?
-TPP reaches maximum.

3 or 4-Marks
-Define marginal product. State the behavior of marginal product when only one input is increased and other inputs are held constant.
- Define production function. Distinguish between short run and long run production functions.
-State the behavior of marginal product in the view of variable proportions. Explain the causes of this behavior.
-What does the Law of variable Proportions show? State the behavior of total product according to this law.
-Giving reasons, explain the 'Law of Variable Proportions.
-What does the Law of variable Proportions show? State the behavior marginal product according to this law.
6-MARK QUESTIONS
What are the different phases in the Law of Variable Proportions in terms of marginal product? Give reason behind each phase. Use diagram.
Explain the law of Variable Proportions with the help of total product and marginal product curves.
State the different phases of changes in Total Product and Marginal Product in the Law of Variable proportions. Also show the same in a single diagram.
Explain the law of Variable Proportions with the help of total product and marginal product curves.
Explain the law of variable proportions with the help of total product and marginal product curves.
Explain the law of variable Proportions through the behavior of both Total Product and Marginal Product. Give reasons.
What does the Law of variable proportion show? State the behavior of TP according to this law.

CONTENT ENRICHMENT
C B S E MODEL ANSWERS Define a) Market Period b) Production Function. c) Marginal Physical Product(MPP). d) Normal Profit Ans:- a) Market period – It is defined as a very short time period in which supply of commodity cannot be changed by changing the unit of factors of production. In this case all the factors of production remain constant. b) Production Function- It shows technological relationship between physical inputs and physical outputs. It can be written as follows: Q = f (f1, f2, f3 ….fn). Where Q is physical quantity produced and f1, f2, f3 ….fn are the physical quantities of different factors of production used. c) Marginal Physical Product - The change in total physical product (TPP) by employing an additional unit of variable factor is called Marginal Physical Product (MPP). MPP = TPPn – TPPn-1
d) Normal Profit - Normal profit is the minimum amount of profit which is essential to
keep an entrepreneur in production in the long run.
What do you mean by returns to a factor? Explain the reasons for increasing returns to a factor. Ans: - Returns to a factor means keeping other inputs constant, the change in physical output by increasing only one physical input.

Causes of increasing return:- Following factors lead to increasing returns to a factor- i. Indivisibility of the factors - Increase in units of variable factor leads to better and fuller utilisation of fixed factor. This causes the production to increase at a rapid rate. ii. Efficient utilisation of variable factor - When more units of variable factor are employed with fixed factor, then variable factor is utilised in more efficient way. iii. Optimum combination of factors - In the beginning when quantities of a variable factors are applied to fixed factors, the system moves towards achievement of optimum combination of factors because then underutilised fixed factors (building, machine, land etc) are better and more fully used. Thus lead to increasing returns. iv. Specialisation- With more use of labour, process based division of labour and specialisation becomes possible which increases efficiency and productivity. Explain the likely behaviour of Total Product and Marginal Product when only one input is increased while all other inputs are kept unchanged. Or Briefly explain law of variable proportion or returns to variable factor. Ans: - Law of variable proportion or returns to variable factor - This law state that keeping other factors of production constant, when only one variable factor is increased, in the beginning total physical product increases at an increasing rate, then increases at a decreasing rate and ultimately decline. This law is applicable in short period only. This law has three phases- I- Increasing returns to a factor - In this phase MPP increases so TPP increases at an increasing rate. Reasons for increasing returns to a factor are - better utilisation of fixed factor, increase in efficiency of variable factor, indivisibility of fixed factors. II- Diminishing returns to a factor - In this phase MPP decreases but positive so TPP increases at decreasing rate .This phase ends when MPP is zero & TPP is maximum. Reasons for diminishing returns is that factors of production are imperfect substitutes of each other and after optimum combination of factors when more and more units of variable factors are increased, pressure of production start falling on fixed factors and MPP start decreasing.

III-Negative returns to a factor - In this phase MPP becomes negative so TPP decreases. It happens when variable factor become too much as compared to fixed factors then coordination between variable and fixed factor become very poor and efficiency of factors decrease. Explanation: The law of variable proportion can be explained with the help of a schedule and a diagram as follows.

In above table and diagram- First unit to third unit MPP increasing so TPP increases at an increasing rate. Therefore it’s a phase of increasing return. Fourth unit to sixth unit MPP decreasing but positive & TPP increases at decreasing rate. Therefore it’s a phase of decreasing return. Sixth unit onward MPP become negative & TPP is decreasing. Therefore it’s a phase of negative return.


aa
Explain how input price are a determinant of supply of a good by a firm?


a a aa


CHAPTER : 10
FORMS OF MARKET
Very Short Answer Type questions ( 1 Mark)
1. Define market . 2. When a firm is called price taker ?
3. What is meant by perfect competition ? 4. Define Monopoly . 5. Define monopolistic competition . 6. What is imperfect oligopoly ? 7. Under which market form is the product homogeneous ? 8. When is a firm called price maker ? 9. Define perfect oligopoly . 10. State one feature of oligopoly .
Short Answer Type questions ( 3/4 Mark) 1. Why is there number of firms small in oligopoly market
? 2. Distinguish between behavior of AR of a firm under
monopolistic competition and perfect competition . Use diagram .
3. Explain the implication of homogeneous product in a perfectly competitive market .
4. Distinguish between cooperative and non-cooperative oligopoly .
5. Explain the implication of ‘ freedom of entry and exit of firms’.
6. Explain the implication of large number of buyers in a perfectly competitive market .
7. Why is demand curve more elastic under monopolistic competition than under monopoly ? Explain .

8. Explain how firms are interdependent under oligopoly ? 9. Explain the implication of perfect knowledge about
market under perfect market . 10. Difference between collusive and non-collusive
oligopoly .
Long Answer Type questions ( 6 Mark)
Explain the implication of the followings :
1. Large number of sellers under perfect competition. 2. Homogeneous product under perfect competition. 3. Barriers to entry of new firms under oligopoly . 4. A few or a few big sellers under oligopoly . 5. Non-price competition under oligopoly . 6. Differentiated products under monopolistic competition .
CHAPTER : 11
PRICE DETERMINATION UNDER PERFECT COMPETITION
Very Short Answer Type questions ( 1 Mark)
1. What is meant by equilibrium price ? 2. Which factors are important for determination of equilibrium price? 3. What induces new firm to enter the industry ? 4. What happens to equilibrium price , if there is increase in demand
and decrease in supply ? 5. What is market equilibrium ? 6. An individual firm under perfect competition can not influence the
market price, then who can and how ?

Short Answer Type questions ( 3/4 Mark) 1.How is equilibrium price of a commodity determined under perfect competition ? Explain with the help of a numerical example . 2. How does equilibrium price of a normal commodity change when income of it’s buyers falls ? Explain the chain effect . 3. Explain the changes take place when market price is greater than equilibrium price. Use diagram . 4. Explain the chain effect of excess demand on equilibrium price . 5.What is price ceiling? Explain the effect of price ceiling. 6. What are the effects of price flooron the market for a good ?
Long Answer Type questions ( 6 Mark)
1. Market for a good is in equilibrium . There is a simultaneous decrease in both demand and supply and there is no change in market price .Explain with the help of a schedule how it is possible ?
2. Market for a good is in equilibrium . There is increase in demand for that good . Explain the chain effects of this change . Use diagram .
3. Market for a good is in equilibrium . There is a simultaneous increase in both demand and supply . What are bits effect on equilibrium price and quantity ?
4. Market for a good is in equilibrium . There is increase in supply for that good . Explain the chain effects of this change . Use diagram .

5. If equilibrium price is greater than its market price , explain all the changes that will take place in the market . Use diagram .
6. Market for a good is in equilibrium . Explain the chain of reactions in the market when the price is (i) higher than equilibrium price, (ii) lower than equilibrium price.
7. Market for a good is in equilibrium . Explain the chain of reactions in the market when there is (i) Increase in supply ii decrease in demand .

KENDRIYA VIDYALAYA SANGATHAN
KOLKATA REGION
Assignment for one day work shop on content enrichment
2010
1. Distinguish between real and nominal gross domestic product. Ans.(i) Real GDP at constant prices is the value measured at constant prices of final goods and services produced with in the domestic territory of a country during an accounting year. Nominal GDP at current prices is the value measured at current prices of the final goods and services produced within the domestic territory of a country during an accounting year. (ii) Real GDP will increase only when there is an increase in the production of goods and services while nominal GDP will increase even when there is no increase in production of goods and services but only price happen to increase.
OR
Giving reasons , classify the following into intermediate and final goods.
(i) Machines purchased by a dealer of machines. Ans. It is an intermediate good because it will be resold in the market.
(ii) A car purchased by a household. Ans. It is a final good because car purchase by household will be included
2.How will you treat the following while estimating national income of India? Give reasons for your answer.
(i)Dividends received by a foreigner from investment in shares of an Indian company.
Ans. It is a factor income to abroad and should be subtracted from domestic income.
(ii)Profits earned by a branch of an Indian bank in Canada.
Ans: It is a factor income from abroad and should be added to domestic incometo get national income.
(iii) Scholarship given to Indian students studying in India by a foreign company.
Ans. It is a transfer payment and hence not included in National Income.
OR
Explain the problem of double counting in estimating national income, with the help of an example. Also explain two alternative ways of avoiding the problem.
Ans: The problem of double counting is the problem of estimating the value of goods and services more than once.

For example:-A farmer produces 100 kg of wheat and sells it for Rs.4000 to Miller.
For Miller, wheat is an intermediate good. Miller converts wheat into flour. He sells it for Rs.5000 to a baker.
Baker manufactures bread from flour and sells the entire bread to final consumers for Rs.6000.
As a general practice , every producer treats its product as final output. Total value of output=4000+5000+6000=15000.But the value of wheat and flour are counted more than once.
The problem of double counting can be avoided by (i) Final output method and (ii) Value added Method.
2011
1.What are stock variables?(2013)
2. Define Depreciation.
Ans. It refers to loss of value of fixed assets in use, on account of their normal wear and tear.
3.Explain how ‘non-monetary exchanges’ are a limitation in taking gross domestic product as an index of welfare.
Ans. Non-monetary transactions are quite evident in rural areas where payments for farm-labour are often made in kind rather than cash. But such transactions are not recorded, because they are outside the monetary system of exchange. To this extent GDP remains underestimated. Thus, non-monetary exchanges make gross domestic product an inappropriate index of welfare.
4.Giving reason, explain the treatment assigned to the following while estimating national income:
(i) social security contribution by employees.
Ans.It will not be included because such contribution is made by employees fromm Compensation of employees only.
(ii) Pension paid after retirement.
Ans. It is included as it is treated as part of Compensation of employee.
2012
(i) Define flow variable(2013)
(ii)Define consumption goods
Ans.Goods which satisfy the wants of the consumers directly.
3.Giving reason , explain how should the following be treated while estimating national income:
(i) Expenditure on free services provided by Government

Ans.Yes it will be included in the national income as it is a part of government final consumption expenditure.
(ii)Payment of interest by government firm
Ans.Yes it will be included because the amount is used for production .
2013
1.Give two examples of Intermediate goods.
Ans.Milk used in dairy shop for resale and coal used in factory for further production.
2.Distinguish between ‘real’ gross domestic product and ‘nominal’ gross domestic product.
Which of these is better index of welfare of the people and why ?
Ans. Ans. Of part I is given in 2010.
Of these , real GDP is an better index of economic welfare. This is because only real GDP shows the change in the flow of goods and services.
OR
Distinguish between stocks and flows .Give two examples of each. (2014)
Ans.
Stocks Flows Stock is that quantity of an economic variable which is measured at a Particular point of time.
Flow is that quantity of a economic variable which is measured during period of time.
Stock has no time dimension It has time dimension as per hour, per day, per month. It is a static concept. It is a dynamic concept. Eg. Quantity of money, wealth Eg. Consumption, investment
2014
1.What are externalities ?Give an example of a positive externality and its impact on welfare of the people.
Ans. Externalities are the good and bad impact of an activity without paying the price or penalty for that. Example of a positive externality is when a beautiful garden maintained by Mr. X raises welfare of Mr. Y even when Mr. Y is not paying for it.
Impact of externalities is not accounted in the index of welfare in terms of GDP. To that extent , GDP as an index of welfare is an inappropriate index .It either Underestimates or overestimates the level of welfare.
2.Distinguish between ‘real’ gross domestic product and ‘nominal’ domestic product (2010 )
Ans.CBSE -2010
OR
Distinguish between stocks and flows. Give two examples of each.
Ans.CBSE 2013
3.How should the following be treated in estimating national income of a country ?
(i) Taking care of aged parents
Ans. This will not be included in national income as it does not involve any production of goods and services.
(ii)Payment of corporate tax
Ans. It should not be included in the estimation of national income because it is a transfer payment by the firm. It is paid by out of income and therefore it is not to be separately added in the national income.
(iii)Expenditure on providing police services by the government
Ans. It should be included because expenditure incurred by the government is a part of government’s final consumption expenditure.
2015
1.Giving reasons explain how the following should be treated in the estimation of National Income:
(i)Payment of interest by a firm to a bank
Ans: It will be included in the estimation of National Income as it is a factor income. Also firms take loan for investment.
(ii)Payment of interest by bank to an individual
Ans: It will be included in the estimation of national income because it is a factor income.
(iii)Payment of interest by an individual to a bank
Ans: It will be not included in the estimation of national income as individual takes loan for consumption purposes.
2.Other things remaining the same ,when in a country the market price of a foreign currency falls, National Income is likely _to fall.

2016
1.Define Flows
Ans. Flow variable refers to that variable which is measured over a period of time. eg. National Income.
2.National Income is the sum of factor incomes accruing to –
Ans.(d) Both residents and non-residents.
3.Sale of petrol and diesel cars is rising particularly in big cities. Analyse its impact on the Gross Domestic Product and Welfare.
Ans. Rise in sale of petrol and diesel cars implies that the private consumption expenditure will also rise . It leads to a rise in Gross Domestic Product of the country.
However , it will not lead to an increase in the welfare of the people for the following reasons:
(i)Level of pollution will rise with rise in sale of petrol and diesel cars.
(ii) The traffic congestion on the road will worsen.
(iii)The already depleted reserves of petrol and diesel will be subjected to further depletion.
2017
1.Explain with the help of an example ,the basis of classifying goods into final goods and intermediate of goods.(3)
Ans. The basis of classification is the end –use of the product. Goods which are used by the producers in the process of production such as raw material or goods purchased for resale are known as intermediate goods, eg. shirt purchased by a firm for resale. These goods are still within the production boundary.
Goods which are outside the boundary line of production and are ready for use by their final users are called final goods, eg. shirt purchased by a consumer.
2.Explain the precautions that should be taken while estimating national Income by expenditure method.(6)
Ans. While using expenditure method, the following precautions are required to be taken:
(i)Only final expenditure is to be taken into account to avoid error of double counting.
(ii)Expenditure on second hand goods is not to be included because value of second goods has already been accounted for during the year of their production.
(iii)Expenditure on shares and bonds is not to be included in total expenditure as these are mere paper claims.
(iv)Expenditure on transfer payments by the government is not to be included.

(v)Imputed value of expenditure on goods produced for self-consumption should be taken into account.
OR
Will the following be included in the domestic product of India? Give reasons for your answer.
(a)Profits earned by foreign companies in India.
Ans. It will be included in the estimation of domestic products as these companies have earned profit in India.
(b)Salaries of Indian working in the Russian Embassy in India.
Ans. This will not be included as Russian Embassy in India is not a part of India’s domestic territory . (c)Profits earned by branch of State Bank of India in Japan.
Ans. This will not be included in the domestic income of India as it is not located with in the domestic territory of India.

VERY SHORT ANSWER TYPE QUESTIONS (1 MARK)
1. Define money.
2. What is meant by M1
3. What is meant by the term money supply?
4. What is bank rate?
5. State two primary functions of money.
6. What is meant by credit creation?
7. What is credit multiplier?
8. Write two functions of central banks.
9. What is cash reserve ratio (CRR)?
10. What is statutory liquidity ratio (SLR)?
11. What is demand deposits by banks?
12. State two monetary measures of credit control by central bank.
13. What are various money stock measures?
SHORT ANSWER TYPE QUESTIONS (3-4 MARKS)
1. Explain the function of money as ?Unit of value?.
2. How does money solve the problem of double coincidence of wants?
3. Explain ?Store of value?function of money.
4. What are open market operations? What is their effect on availability of
credit?
5. Explain the ?lender of last resort? function of central bank.
6. Distinguish between SLR and CRR. Explain the Role of SLR and CRR in
credit control.
7. How does changes in Bank rate affect money creation by commercial Bank?
Explain.
8. State the role of central Bank as a banker of the Government.
9. State any four functions of money.

10. Explain the ?Standard of deferred payment?.
11. How central bank is controller of credit?
12. Explain how does followings helps to control the credit creation.
(i) Open market operation
(ii) Margin requirement of loans
H.O.T.S.
13. What is meant by statutory liquidity ratio (SLR). State the effect of rise in
rate of SLR on creation of credit.
14. Explain ?currency authority? and ?controller of credit? functions of central
bank.
15 Explain the process of money creation by commercial bank.

GOVERNMENT BUDGET AND THE ECONOMY
2008
1. Define government budget. (1) Ans. Government budget is a statement of expected receipts and expenditures during a given year.
2. Give meaning of capital expenditure and revenue expenditure in a government budget and an example of each. (3)
Ans. Capital expenditure is the expenditure by government that either creates an asset or reduces a liability. 1 Eg – construction,repayment of loan,etc. (any one) 1/2 Revenue expenditure is the expenditure by government that neither creates an asset nor reduces a liability. 1 Eg – interest payment,subsidy,etc. (any one) 1/2
3. What is revenue deficit? What are its implications? (4) Ans. Revenue deficit is the excess of government’s total revenue expenditure over the total revenue receipts. 1 The deficit is to be covered through borrowings,disinvestment,etc. The borrowing in turn leads to the payment of interest and repayment of loans in future which may mean more deficit in future. 3
4. What is fiscal deficit? What are its implications? (4) Ans. Fiscal deficit is the excess of total government expenditure (revenue and capital both) over total government receipts excluding borrowing/borrowing requirements of the government. 1 Borrowing requires interest payments and repayment of loans in future leading to more deficit. 3
5. Distinguish between: (4)
(i) Balanced budget and surplus budget. (ii) Developmental expenditure and non-developmental expenditure.
Ans. (i) When budget receipts equal budget expenditure,it is called ‘balanced budget’. When budget receipts exceed budget expenditure,it is called ‘surplus budget. 2 (ii) Expenditure on developmental activities by government on different sectors of the economy is called developmental expenditure while expenditure on the essential services of routine nature is called non-developmental expenditure. 2

2009
1. Why are taxes received by the government not capital receipts? (1) Ans. Taxes neither create any liability nor reduce any asset,so they are not capital receipts.
2. Give the meaning of revenue deficit,fiscal deficit and primary deficit. (3)
Ans. Revenue deficit is the excess of government’s total revenue expenditure over the total revenue receipts. 1 Fiscal deficit is the excess of government’s total expenditure over total receipts excluding borrowing. 1 Primary deficit is the difference between fiscal deficit and interest payment. 1
3. Explain any two objectives of a government budget. (4) Ans. Objectives of a government budget : (i) Reducing inequalities of income – It is done by taking measures such as
Imposing higher rate of tax on income of the rich,spending more on providing free services to the poor,etc.
(ii) Reallocation of resources in the economy – This is done by imposing higher rates of taxation on goods, the production of which is to be discouraged.Subsidies are provided on production of goods whose production is to be promoted.
(iii) Reducing regional disparities-The government uses its taxation and expenditure policy for encouraging setting up of production unit in economically backward regions,etc. Or any other relevant objective with explanation. Any two (If explanation of the objective is not given only ½ mark for each of the two objectives be given).
4.What are the implications of revenue deficit? State two measures to reduce this deficit. (4) Ans. Revenue deficit indicates the inability of the government to meet the expenditure on routine functioning of the economy. It implies that revenue deficit either leads to an increase in liability in the form of borrowings or reduces the assets through disinvestments. Higher borrowings will increase the future burden to repay the loan amount and interest payments. 2

Two measures to reduce this deficit are: (a) Reduction of wasteful public expenditure like subsidies and curtailing non-plan
expenditure. (b) Increase revenue by increasing the tax rate and imposing new taxes. Tax
evasion should be controlled. 2
2010
1.What is meant by revenue deficit? (1) Ans. Revenue deficit is the excess of government’s total revenue. expenditure total revenue receipts. 2.Define tax. (1) Ans. A tax is a compulsory payment imposed on the people by the government without any return. 3. Give two examples of direct tax. (1) Ans. Income tax,wealth tax,corporation tax,gift tax. (any two) 4. Explain the allocation function of a government budget. (3) Ans. Government uses budgetary policy to allocate resources. This is done by imposing higher rate of taxation on goods whose production is to be discouraged and subsidies provided on goods whose production is to be promoted.
5.Distinguish between: (4) (i) Capital expenditure and Revenue expenditure. (ii) Fiscal deficit and Primary deficit.
Ans. (i) Capital expenditure is the expenditure that either reduces liabilities or creates assets. Revenue expenditure is the expenditure that neither reduces liabilities nor creates assets. 2 (ii) (a) Fiscal deficit is the excess of total budget expenditure over total budget receipts excluding borrowings. Primary deficit is Fiscal deficit less interest payments. (b) FD numerically equals to borrowings where as PD is that part of borrowing that is actually available for spending. (c)Zero FD is always desired as borrowings will be nil. Zero PD is not desired as it implies FD = interest payments, which means government is borrowing to pay interests only,i.e. it is caught in a debt trap. 2

2011
1. Explain the ‘redistribution of income’ objective of a government budget. (4) OR
Explain the ‘economic stability’ objective of a government budget.
Ans. Government can influence distribution of income by imposing taxes on the rich and spending more on the welfare of the poor. It will reduce income of the rich and raise the standard of living of the poor,thus reducing inequalities in the distribution of income.
OR Government can bring in economic stability,i.e. control fluctuation in general price level,through taxes,subsidies and expenditure. When there is inflation,government can reduce its own expenditure. When there is deflation,government can reduce taxes and give subsidies to encourage spending by the people.
2. From the following data about a government budget find (a) revenue deficit,(b)fiscal deficit and (c) primary deficit: (4)
(₹ arab) (i) Tax revenue 47 (ii) Capital receipts 34 (iii) Non-tax revenue 10 (iv) Borrowings 32 (v) Revenue expenditure 80 (vi) Interest payments 20
Ans. (a) Revenue deficit = Revenue expenditure – (tax revenue + non-tax revenue) = 80 – (47 + 10) = 80 - 57 = ₹ 23 arab 1 ½ (b) Fiscal deficit = Borrowings = ₹ 32 arab 1 ½ (c)Primary deficit = Fiscal deficit – interest payments = 32 – 20 = ₹ 12 arab 1
2012
1. Define a ‘direct tax’. (1) Ans. When the liability to pay and incidence of a tax lie on the same person,it is called a direct tax.
2. Distinguish between revenue receipts and capital receipts in a government budget. Give example in each case. (3)
OR

Explain the role of government budget in bringing economic stability.
Ans. Revenue receipts are receipts which neither reduce assets nor increase liabilities. Eg-tax,etc.
Capital receipts are receipts which either reduce assets or increase liabilities. Eg-borrowing,etc.
OR Government can bring in economic stability i.e. avoiding fluctuation in prices through taxes and expenditure. In case of inflation,government can reduce its own expenditure or increase tax. In case of deflation government can give tax concession or increase expenditure to leave more disposable income in the hands of people.
3. Explain the concept of ‘fiscal deficit’ in a government budget. What does it indicate? (4)
Ans. Same as Q.4 in 2008. 2013
1. What is revenue deficit? (1) Ans. Same as Q.1 in 2010.
2. How can budgetary policy be used to reduce inequalities of income? (3) Ans. Same as Q.3(i) in 2009.
3. State three sources each of revenue receipts and capital receipts in government budget. (3)
Ans. Sources of revenue receipts are direct taxes,indirect taxes and dividend from public sector undertakings,etc. ½ x 3 Three sources of capital receipts are: Borrowings and other liabilities,recovery of loans and sale of shares of public sector undertakings.
4. Distinguish between revenue expenditure and capital expenditure in government budget. Give an example of each. (3)
Ans. Same as Q.5(i) in 2010. Example of revenue expenditure – old age pension,expenditure on administration or defence,etc. (any one) Example of capital expenditure – purchase of shares of MNCs,construction of dams and steel plants,repayment of loans,etc. (any one)

2014
1. Define fiscal deficit. (1) Ans. Same as Q.4 in 2008.
2. Is the following a revenue receipt or a capital receipt in the context of government budget and why? (3) (i) Tax receipt (ii) Disinvestment
Ans. (i) Tax receipts are revenue receipts because these neither create any liability nor reduce asset. 1 ½
(ii) Disinvestment are capital receipts because it reduces assets. 1 ½
3. Tax rates on higher income group have been increased. Which economic value does it reflect? Explain. (4)
Ans. This will reduce the inequalities of income as the difference between disposable incomes of higher income and lower income groups will fall. This will also provide more resource to the government for spending on welfare of the poor.
2015
1. Primary deficit in a government budget is: (choose the correct alternative) (1) (a) Revenue expenditure – revenue receipts (b) Total expenditure – total receipts (c) Revenue deficit – interest payments (d) Fiscal deficit – interest payments
Ans. (d) Fiscal deficit – interest payments
2. Direct tax is called direct because it is collected directly from: (choose the correct alternative) (1) (a) The producers on goods produced (b) The sellers on goods sold (c) The buyers of goods (d) The income earners
Ans. (d) The income earners

3. Explain how the government can use the budgetary policy in reducing inequalities of income? (6)
Ans. Government can reduce inequalities through its tax and expenditure policy. Government can charge higher rate of tax from higher income groups by imposing higher rate of income tax and higher rate on goods and services purchased by the rich. The money so collected can be spent on the poor in the form of free education,free medical facilities,cheaper housing,etc. in order to raise their disposable income.
2016
1. What are revenue receipts in a government budget? (1) Ans. Revenue receipts are the receipts which neither reduce assets nor increase liabilities.
2. Primary deficit equals: (choose the correct alternative) (1) (a) Borrowings (b) Interest payments (c) Borrowings less interest payments (d) Borrowings and interest payments both
Ans. (c) Borrowings less interest payments
3. Define fiscal deficit. (1) Ans. Same as Q.4 in 2008.
4. What are capital receipts in a government budget? (1) Ans. Capital receipts are the receipts which either reduce assets or increase liabilities.
5. What is the difference between revenue expenditure and capital expenditure? Explain how taxes and government expenditure can be used to influence distribution of income in the society. (6)
OR What is the difference between direct tax and indirect tax? Explain the role of government budget in influencing allocation of resources. Ans. Same as Q.5(i) in 2010. 2 Same as Q.3 in 2015. 4

OR Direct tax is the tax whose liability to pay and incidence lies on the same person on whom it is levied. Indirect tax is the tax whose liability to pay an incidence lie on different persons. 2 The government can influence allocation of resources for production of different goods and services through its budget. When the government wants that more resources be used in the production of some goods,it provides incentives to the producers in the form of tax concessions and subsidies. 4
2017
1. Define government budget. (1) Ans. Same as Q.1 in 2008.
2. Define revenue deficit. (1) Ans. Same as Q.1 in 2010.
3. Distinguish between direct taxes and indirect taxes. Give an example of each. (3) Ans. Same as Q.5 in 2016. Example of direct tax – income tax. Example of indirect tax – sales tax.
4. Explain how government budget can be helpful in bringing economic stabilization in the economy. (4) Ans. Same as Q.2 in 2012.
5. What are non-debt creating capital receipts? Give two examples of such receipts. (4) Ans. Capital receipts are those receipts of government which either create liabilities or reduce assets. Capital receipts excluding borrowings are known as non-debt creating capital receipts. 2 Eg – Disinvestment, recovery of loans. 1+1


FOREIGN EXCHANGE & BOP Foreign Exchange:- It means the stock of foreign currency. For example- US Dollar, British Pound etc. are foreign exchange from the view point of India. Foreign Exchange Rate It is the price paid in domestic currency in order to get one unit of foreign currency For example $1 = Rs. 45 Types of Foreign Exchange Rate
1. Fixed Exchange Rate
When exchange rate is officially declared and it is fixed.
2. Flexible Exchange Rate/ Floating Exchange Rate
The rate which is determined by demand and supply of foreign exchange. Determination of Exchange Rate/ Equilibrium Exchange Rate The exchange rate of a country‟s currency is determined by the demand and supply of foreign exchange. Sources of demand for foreign exchange:- People demand for foreign exchange for the following purpose:-
a) To purchase goods and service from other countries (Imports)
b) To send gifts and grants to abroad
c) To purchase financial assets
d) To speculate the value of foreign currencies. There is inverse relationship between demand of foreign currencies for foreign exchange and foreign exchange rate.

84 Sources of supply for foreign exchange:-
a) Exports of the country to the rest of the world
b) Direct foreign investment in home country
c) Speculative purchase by the non- residents in the domestic market.
d) Direct purchase of the goods and services by the non- residents in the domestic market
e) Gifts and grants of the non- residents.
These is direct relationship between Supply of foreign exchange and foreign exchange rate. Equilibrium of Exchange rate
It is determined at a point where demand and supply of foreign exchange are equal.
y
D S $
Rate
of E
xcha
nge
D $
Q x
Demand and supply of US$ In the diagram Demand Curve (DD) and Supply Curve (SS) intersect each other at the point E. Equilibrium exchange rate is OR determined.
BALANCE OF PAYMENTS Balance of Payment:- It is a systematic record of all economic transactions between the residents of the reporting country and residents of Rest of the World during a given period of time. Balance of Trade:- It is a systematic record of transaction of visible items (Export and Import of goods only) between the residents of a reporting country and residents of Rest of the World during a given period to time.
BOT=Value of exports-Value of imports

85 Balance of Payment
Current Account Capital Account
Visible items Invisible Items Govt. Capital Transactions
Private Capital Transactions
Exports Goods Direct Investment or
Portfolio Investment
Imports of Goods Gold Transactions
Services of Banking, Insurance, Shipping etc.
Tourism
Investment Income
Transfer Payment Current Account:- The account records imports and exports of goods and service and unilateral transfer. Capital Account:- It records all international transactions those involve a resident of domestic country changing his asset with a foreign resident or his liabilities to a foreign resident. Autonomous Items:- International economic transactions that take place due to some economic motive such as profit maximization. These items also known as above the line items in the BOP. Accommodating Items:- Transactions that occur because of other activity in the BOP such as government financing. These items also known as below line items. VERY SHORT ANSWER QUESTIONS.
1. Define foreign exchange rate. Ans: Foreign exchange rate is the rate at which currency of one country can be exchanged for currency of another country.
2. What do you mean by Foreign Exchange Market? Ans: The foreign exchange market is the market where international currencies are traded for one another.
3. What is meant by Fixed Exchange Rate?

86 Ans: Fixed Rate of exchange is a rate that is fixed and determined by the government of a country and only the government can change it. 4. What is equilibrium rate of exchange? Ans: Equilibrium exchange rate occurs when supply of and demand for foreign exchange are equal to each other. 5. Define flexible exchange rate. Ans: Flexible rate of exchange is that rate which is determined by the demand and supply of different currencies in the foreign exchange market. 6. Define Spot exchange rate. Ans: The spot exchange rate refers to the rate at which foreign currencies are available on the spot. 7. Define forward market. Ans: Market for foreign exchange for future delivery is known as the forward market. 8. What is meant by balance of payments? Ans: Balance of payments refers to the statement of accounts recording all economic transactions of a given country with the rest of the world. 10. What do you mean by balance of trade? Ans: Balance of trade is the difference between the value of imports and exports of only physical goods. 11. The balance of trade shows a deficit of Rs. 600 crores, the value of exports is Rs.1000 crores. What is value of Imports? Ans: Balance of Trade = Exports of goods – import of goods
Import of good = Export of goods – (B.O.T)
= 1000- (-600)
= Rs. 1600. 12. What is the balance of visible items in the balance of payments account called? Ans:- Balance of trade. 14. List two items of the capital account of BOP account. Ans:- i) external assistance ii) commercial borrowing iii) foreign investment 15. Which transactions bring balance in the BOP account? Ans:- Accommodating transactions bring balance in the BOP account. 16. Define autonomous items in BOP.

87 Ans:- Autonomous items in BOP refers to international economic transaction that take place due to some economic motive such as profit maximization.
17. What is the other name of autonomous items in the BOP?
Ans:- The other name of autonomous items in BOP is above the line item.
18. When does a situation of deficit in BOP arises?
Ans:- A situation of deficit in BOP arise when autonomous receipts are less than autonomous payments.
ANSWER QUESTIONS (3 / 4 MARKS) 1. Why does the demand for foreign exchange rise, when it price falls?Ans:- With a fall in price of foreign exchange , the exchange value of domestic currency increases and that of foreign currency falls. This implies that foreign goods become cheaper and their domestic demand increases. The rising domestic demand for foreign goods implies higher demand for foreign exchange. So there is inverse relationship between price and demand for foreign exchange.
2. When price of a foreign currency falls, the supply of that foreign
currency also fall why? Ans: When price of a foreign currency falls it makes exports, investment by foreign residents costlier as a result supply of foreign currency falls.
3. Distinguish between autonomous and accommodating transaction of balance of payment account.
Ans: Autonomous transactions are done for some economic consideration such as profit, such transactions are independent of the state of B.O.P. Accommodating transactions are under taken to cover the deficit/surplus in balance of payments.
4. Give two examples explain why there is a rise in demand for a foreign currency when its price falls.
Ans: When price of foreign currency falls, imports are cheaper. So, more demand for foreign exchange by importers. Tourism abroad is promoted as it becomes cheaper. So demand for foreign currency rises.

5.Distinguish between fixed and flexible foreign exchange rate.
Ans: When foreign exchange rate is fixed by Central Bank/government, it is called fixed exchange rate. When foreign exchange rate is determined by market forces/mechanism, it is flexible exchange rate.

1.What is meant by Depreciation of domestic currency ? (2017)
Ans.When in the foreign exchange market the price of foreign currency rises in terms of domestic currency,it is depreciation of domestic currency.
2..Indian investers Lend abroad .Answer the following question: ( 2016)
(a)Explain the impact of this lending on market exchange rate.
Ans.Lending abroad increases demand for foreign exchange .Supply of foreign exchange remains unchanged ,exchange rate may rise.
3. Explain two sources each of demand and supply of foreign exchange . (2009)
Ans. Demand for Foreign exchange---
A.Payments of international loans
B.Investment in rest of the world.
Supply of foreign exchange .
APurchage of domestic goods by the foreigners
B.Direct foreign investment as well as portfolio investment in home country .
4.Giving two examples,explain why there is rise in demand for a foreign currency when its price falls. (2010)
Ans.(i)With a fall in price of foreign exchange ,the exchange value of domestic currency increases and that of foreign currency falls and foreign goods become cheaper in relation to domestic goods.The rising domestic demand of foreign goods implies higher demand for foreign exchange.
(ii) When Price of the foreign currency reduces ,tourists from home country find it cheaper to visit abroad .Accordingly ,demand for foreign currency rises.
KENDRIYA VDIAYALAYA,AFS,SALUA PREPARED BY MR. AJAI KUMAR-PGT(ECONOMICS)

5.What is foreign exchange ? (2011)
Foreign exchange refers to demand and supply of the currencies of other countries in the domestic economy.
6.What is a fixed exchanged rate? (2012)
ANS.Fixed rate of exchanged is a rate fixed and determined by the government of a country and the government alone changes it.
7. State two sources of demand for foreign exchange. (2010}
Ans.(i) Paments of international loans.
(ii)Gifts and grants to rest of the world.
8.When price of foreign currency falls,the demand for that foreign currency rises.Explain ,why. (2011)
Ans.(i)Now ,imkports become cheaper than before.Accordingly,imports tend to rise,implying a rise in the demand for foreign currency.
(ii)Travelling abroad now become cheaper ,Accordingly ,demand for the foreign currency rises.
9.when Price of a foreign currency falls,the supply of that foreign currency also falls.Explain why?(2011)
Ans.Fall in the price of a foreign currency causes a fall in its supply,owing to the following reasons;
(i)now domestic currency becomes dearer in the Relation to the foreign currency.Accordingly,foreign investors will make smaller investment in the domestic economy.Implying,a fall in the supply of foreign currency.
(ii)Fall in the price of a foreign currency(say US dollars)would mean less Indian rupees per US dollar.Accordingly,NRI’s would make less transfers to their home country.Implying,a fall in the flow of foreign currency into the domestic economy.

10. Explain the effect of depreciation of domestic currency on Exports?(2013)
Ans.(i)Depreciation is the fall in the value of domestic currency in the relation of foreign currency in a situation when exchange rate is determined by the forces of supply and demand in the international monry market.
(ii) when domestic currency depreciates ,Value of domestic currency in terms of foreign currency falls .Thus,domestic goods become cheaper in terms od foreign currency.Accordingly,exports to foreign country would rise.On the other hand,our imports would decline.
11.Explain the meaning of the managed flexible foreign exchange rate.(2010)?
Ans.It is a system in which exchange rate is determined by the forces of supply and demand in the international money market,but(at times) the govt(central bank) intervenes to place some influence on the exchange rate so that if remains within the desired limits.it is done through the sale and purchase of foreign currency in the international money market.It is also called a system of ‘dirty Floating’.
12.How can Reserve Bank of india help in bringing down the Foreign exchange rate which is very high?
Ans.By selling foreign exchange in the international money market from its reserves, Reserve Bank can increase its supply .This is expected to bring down the foreign exchange rate.
13.what is meant by foreign exchange rate?(2014)
Ans.The rate at which one currency is exchanged for another currency.
14) Describe any three sources of demand for foreign exchange?(2015)
Ans.1) To import from other countries.
2) to send a giftabroad.
3) To purchase financial assests abroad,etc.

15) explain the effect of depreciation of domestic currency on export?(2014)?
Ans.Depreciation od domestic currency mean a fall in the price of domestic currency (say rupee) in terms of foreign currency(say $) .it means one $ can be exchanged for more rupees. So with the same amount of dollars more of goods can be purchased from India.It means exports to USA have become cheaper.They may result in increase of exports to USA.
16.What is fixed exchange rate system? (2008)
Ans. A system in which exchange rate is fixed by the Govt./Monitory authorities and not determined by the market.
17. When exchange rate of foreign currency falls, its demands rises? Explain how?(2008)
Ans. When exchange rate falls imports becomes cheaper. Demand for imports rises and so rises the demand for foreign exchange to purchases more imports.