study number (sn) 0056-00 · format f8.2 measurement nominal ... mean 4.8355 standard deviation...
TRANSCRIPT

Study Number (SN) 0056-00
Title Children’s Profile at School Entry (CPSE) collection 2008 – 2015
Depositor Northside Partnership; Orla Doyle; UCD Geary Institute PFL Evaluation Team
Publisher Irish Social Science Data Archive (ISSDA)
URL www.ucd.ie/issda/cpse
Publication Date 2017
Version 1
Type Data collection
Suggested citation Northside Partnership; Orla Doyle; UCD Geary Institute PFL Evaluation Team (2017). Children’s Profile at School Entry (CPSE) collection 2008 – 2015. [data collection]. Version 1. Dublin: Irish Social Science Data Archive [distributor] SN: 0056-00. www.ucd.ie/issda/cpse

1
Children’s Profile at School Entry (CPSE) teacher survey codebook (v2) Study title: Children’s Profile at School Entry Year: 2008 – 2015 Principal investigator: Orla Doyle, University College Dublin, Ireland.
This codebook Version 2 was prepared by the Children’s Research Network as part of the Prevention and Early Intervention Research Initiative (June 2017). http://www.childrensresearchnetwork.org For full description of the data please refer to the 48 month evaluation report: Doyle, O., & UCD Geary Institute PFL Evaluation Team (2015). Preparing for Life Early Childhood Intervention Assessing the Early Impact of Preparing for Life at Forty-Eight Months. Doyle, O., & UCD Geary Institute PFL Evaluation Team (2016). Preparing for Life Early Childhood Intervention Final Report: Did Preparing for Life Improve Children’s School Readiness? http://geary.ucd.ie
Contents Interview details......................................................... 2
Section 1: Teacher Demographics........................................... 7
Section 2: Measures of school readiness.................................. 11
Short Early Development Instrument (S-EDI)............................... 27
Appendix: List of variables in CPSE Teacher data by domain............... 48

2
Interview details
There are 980 cases in the CPSE Teacher dataset. 155 of these are PFL cases.
CPSE_ID
Value
Standard Attributes Position 1
Label CPSE identifier
Type Numeric
Format F3
Measurement Scale
Role Input
N Valid 980
Missing 0
Central Tendency and
Dispersion
Mean 34603.10
Standard Deviation 132016.120
Percentile 25 3115.50
Percentile 50 12005.50
Percentile 75 21602.50
Note: Unique identifier for child participants in the CPSE study.
PFL_ID
Value
Standard Attributes Position 2
Label PFL identifier for
matching with
PFL data
Type Numeric
Format F3
Measurement Scale
Role Input
N Valid 155
Missing 825
Central Tendency and
Dispersion
Mean 120.05
Standard Deviation 70.428
Percentile 25 61.00
Percentile 50 121.00
Percentile 75 176.00
Note: Unique identifier for child participants in the PFL study. Children who
participated in Northside Partnership’s Preparing for Life early intervention
programme may be identified in the CPSE sample using this variable. These unique
identifiers match the PFL ID codes in the archived PFL collection and this

3
variable can therefore be used to link cases in both data collections.
The majority of PFL children reached school entry age during 2013 and 2014
therefore there are no PFL participants in CPSE for wave 1 – 4 (2008 and 2011).
The number of PFL participants assessed at each wave of CPSE is as follows:
CPSE wave 1 = 0 PFL cases
CPSE wave 2 = 0 PFL cases
CPSE wave 3 = 0 PFL cases
CPSE wave 4 = 0 PFL cases
CPSE wave 5 = 4 PFL cases
CPSE wave 6 = 56 PFL cases
CPSE wave 7 = 63 PFL cases
CPSE wave 8 = 32 PFL cases
PFL_Group
Value Count Percent
Standard Attributes Position 3
Label PFL Treatment
group: high or
low
Type Numeric
Format F8.2
Measurement Nominal
Role Input
Valid Values 1.00 High treatment 76 7.8%
2.00 Low treatment 78 8.0%
996.00 Missing 1 0.1%
997.00 Not applicable 825 84.2%
Note: This variable indicates the treatment group (High or Low treatment) for
children who participated in Northside Partnership’s Preparing for Life early
intervention programme. Children in the ‘low treatment’ group were PFL
participants and received the standard supports from this intervention.
Children in the ‘high treatment’ group were PFL participants and received the
enhanced supports from this intervention. Please refer to the PFL User Guide
for more details on these supports. Children in the ‘not applicable’ group did
not participate in PFL and did not receive any of the supports provided by the
PFL programme, but attended the same Primary School as the PFL participants.
This variable can therefore be used to examine the impact of different PFL
treatment groups on school readiness in comparison to children who did not
participate in PFL.
School
Value Count Percent
Standard Attributes Position 4

4
Label School:
anonymised
Type Numeric
Format F3
Measurement Nominal
Role Input
Valid Values 1 School 1 394 40.2%
2 School 2 317 32.3%
3 School 3 209 21.3%
4 All other schools 60 6.1%
Note: School names were removed during anonymisation
Wave
Value Count Percent
Standard Attributes Position 5
Label Data collection
wave
Type Numeric
Format F3
Measurement Nominal
Role Input
Valid Values 1 Wave 1 103 10.5%
2 Wave 2 133 13.6%
3 Wave 3 111 11.3%
4 Wave 4 106 10.8%
5 Wave 5 112 11.4%
6 Wave 6 160 16.3%
7 Wave 7 113 11.5%
8 Wave 8 142 14.5%
Note: Data were collected at the start of the school year during October,
November, and December. The academic school years for each wave were as follows:
CPSE wave 1 = 2008/09
CPSE wave 2 = 2009/10
CPSE wave 3 = 2010/11
CPSE wave 4 = 2011/12
CPSE wave 5 = 2012/13
CPSE wave 6 = 2013/14
CPSE wave 7 = 2014/15
CPSE wave 8 = 2015/16

5
ChildGender
Value Count Percent
Standard Attributes Position 6
Label Gender of child
in Junior Infants
class
Type Numeric
Format F3
Measurement Nominal
Role Input
Valid Values 1 Male 502 51.2%
2 Female 457 46.6%
Missing Values 996 Missing 21 2.1%
Hand
Value Count Percent
Standard Attributes Position 7
Label Childs hand
preference - left
or right
Type Numeric
Format F3
Measurement Nominal
Role Input
Valid Values 1 Right 753 76.8%
2 Left 94 9.6%
3 Dont know 0 0.0%
Missing Values 996 Missing 133 13.6%
Note: Teacher reported hand preference of child
CompletionAge
Value
Standard Attributes Position 8
Label Childs age on
completion of
survey
Type Numeric
Format F3.2

6
Measurement Scale
Role Input
N Valid 787
Missing 193
Central Tendency and
Dispersion
Mean 4.8355
Standard Deviation .47694
Percentile 25 4.5722
Percentile 50 4.8378
Percentile 75 5.0732

7
Section 1: Teacher Demographics
TAge
Value
Standard Attributes Position 9
Label Q1.1 What is
your age?
Type Numeric
Format F3
Measurement Scale
Role Input
N Valid 960
Missing 20
Central Tendency and
Dispersion
Mean 33.02
Standard Deviation 8.912
Percentile 25 27.00
Percentile 50 31.00
Percentile 75 35.00
Note: Teacher’s age is indicated by this variable
TEducation
Value Count Percent
Standard Attributes Position 10
Label Q1.3 What is
your highest
level of
education
completed?
Type Numeric
Format F3
Measurement Nominal
Role Input
Valid Values 1 Non-degree
Qualification
39 4.0%
2 Primary Degree 473 48.3%
3 Postgraduate
Qualification
448 45.7%

8
Missing Values 996 Missing 20 2.0%
Note: Teacher’s highest completed level of education is indicated by this
variable
TeachingYrs
Value
Standard Attributes Position 11
Label Q1.4 How many
years have you
been teaching?
Type Numeric
Format F3
Measurement Scale
Role Input
N Valid 960
Missing 20
Central Tendency and
Dispersion
Mean 9.79
Standard Deviation 7.836
Percentile 25 5.00
Percentile 50 7.00
Percentile 75 13.00
TeachingJrs
Value
Standard Attributes Position 12
Label Q1.5 How many
years have you
taught junior
infants?
Type Numeric
Format F3
Measurement Scale
Role Input
N Valid 960
Missing 20
Central Tendency and
Dispersion
Mean 3.43
Standard Deviation 3.164
Percentile 25 1.00
Percentile 50 3.00

9
Percentile 75 5.00
Note: Junior Infants is the entry level class for Primary School in the Republic
of Ireland. Most children in Ireland start their Primary School education (also
called national schools) at the age of 4 or 5 years of age.
TeachingSch
Value
Standard Attributes Position 13
Label Q1.6 How many
years have you
been teaching in
this school?
Type Numeric
Format F3
Measurement Scale
Role Input
N Valid 960
Missing 20
Central Tendency and
Dispersion
Mean 8.84
Standard Deviation 7.538
Percentile 25 4.00
Percentile 50 7.00
Percentile 75 10.00
Class_size
Value Count Percent
Standard Attributes Position 14
Label Q1.7 How many
students are in
your class?
Type Numeric
Format F3
Measurement Scale
Role Input
N Valid 960
Missing 20
Central Tendency and
Dispersion
Mean 17.70
Standard Deviation 4.386
Percentile 25 14.00

10
Percentile 50 17.00
Percentile 75 20.00
Labeled Values 12 12 or less 7 0.7%

11
Section 2: Measures of school readiness
Items from Q2.25 to Q2.31 on special skills and talents were developed by the
PFL Evaluation Team.
PFL_specnum
Value Count Percent
Standard Attributes Position 15
Label Q2.25
demonstrates
special
numeracy skills
or talents
Type Numeric
Format F3
Measurement Nominal
Role Input
Valid Values 0 No 711 72.6%
1 Yes 119 12.1%
Missing Values 996 Missing 150 15.3%
PFL_speclit
Value Count Percent
Standard Attributes Position 16
Label Q2.26
demonstrates
special literacy
skills or talents
Type Numeric
Format F3
Measurement Nominal
Role Input
Valid Values 0 No 682 69.6%
1 Yes 192 19.6%
Missing Values 996 Missing 106 10.8%
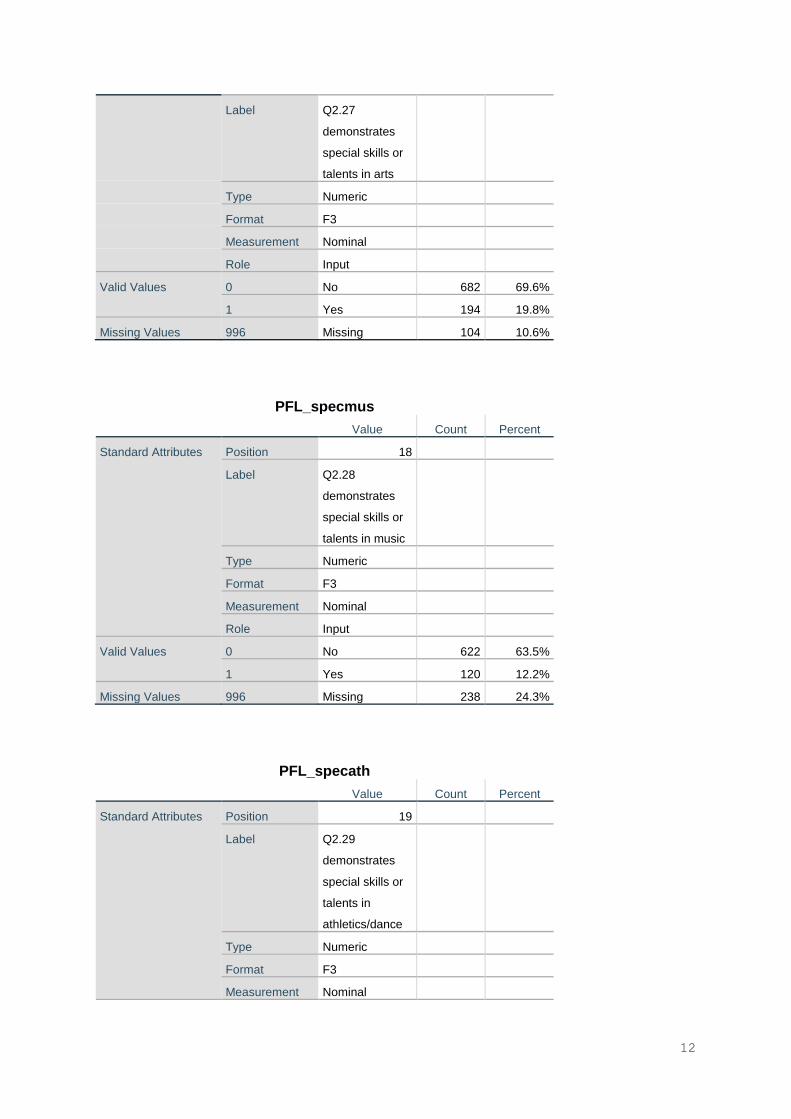
PFL_specart
Value Count Percent
Standard Attributes Position 17
12
Label Q2.27
demonstrates
special skills or
talents in arts
Type Numeric
Format F3
Measurement Nominal
Role Input
Valid Values 0 No 682 69.6%
1 Yes 194 19.8%
Missing Values 996 Missing 104 10.6%
PFL_specmus
Value Count Percent
Standard Attributes Position 18
Label Q2.28
demonstrates
special skills or
talents in music
Type Numeric
Format F3
Measurement Nominal
Role Input
Valid Values 0 No 622 63.5%
1 Yes 120 12.2%
Missing Values 996 Missing 238 24.3%
PFL_specath
Value Count Percent
Standard Attributes Position 19
Label Q2.29
demonstrates
special skills or
talents in
athletics/dance
Type Numeric
Format F3
Measurement Nominal

13
Role Input
Valid Values 0 No 642 65.5%
1 Yes 168 17.1%
Missing Values 996 Missing 170 17.3%
PFL_specprob
Value Count Percent
Standard Attributes Position 20
Label Q2.30
demonstrates
special skills or
talents in
problem solving
Type Numeric
Format F3
Measurement Nominal
Role Input
Valid Values 0 No 600 61.2%
1 Yes 206 21.0%
Missing Values 996 Missing 174 17.8%
PFL_specoth
Value Count Percent
Standard Attributes Position 21
Label Q2.31
demonstrates
special skills or
talents in other
areas
Type Numeric
Format F3
Measurement Nominal
Role Input
Valid Values 0 No 545 55.6%
1 Yes 116 11.8%
Missing Values 996 Missing 319 32.6%

14
PFL_spec
Value Count Percent
Standard Attributes Position 22
Label Any special
skills or talents
(yes to any of
Q2.25 - Q2.31)
Type Numeric
Format F3
Measurement Ordinal
Role Input
Valid Values 0 516 52.7%
1 435 44.4%
Missing Values System 29 3.0%
Note: Value of 1 is given where a child has received a value of ‘yes’ for any
of the items from Q2.25 to Q2.31
The following items (survey Q2.56 - Q2.70) were developed by the PFL Evaluation
Team.
PFL_hypatt2
Value Count Percent
Standard Attributes Position 23
Label Q2.56 is
inattentive
Type Numeric
Format F3
Measurement Nominal
Role Input
Valid Values 1 Often/Very True 184 18.8%
2 Sometimes/Som
ewhat True
355 36.2%
3 Never/Not True 421 43.0%
Missing Values 4 Dont know 0 0.0%
996 Missing 20 2.0%
Note: Item 2 from PFL hyperactivity and inattention construct

15
PFL_def2
Value Count Percent
Standard Attributes Position 24
Label Q2.57 doesnt
seem to feel
guilty after
misbehaving
Type Numeric
Format F3
Measurement Nominal
Role Input
Valid Values 1 Often/Very True 114 11.6%
2 Sometimes/Som
ewhat True
152 15.5%
3 Never/Not True 642 65.5%
Missing Values 4 Dont know 0 0.0%
996 Missing 72 7.3%
Note: Item 2 from PFL defiant behaviour construct
PFL_def1
Value Count Percent
Standard Attributes Position 25
Label Q2.58 is defiant
or refuses to
comply with
requests or rules
Type Numeric
Format F3
Measurement Nominal
Role Input
Valid Values 1 Often/Very True 75 7.7%
2 Sometimes/Som
ewhat True
193 19.7%
3 Never/Not True 690 70.4%
Missing Values 4 Dont know 0 0.0%
996 Missing 22 2.2%
Note: Item 1 from PFL defiant behaviour construct

16
PFL_prosoc1
Value Count Percent
Standard Attributes Position 26
Label Q2.59 tries to
help someone
who has been
hurt
Type Numeric
Format F3
Measurement Nominal
Role Input
Valid Values 1 Often/Very True 332 33.9%
2 Sometimes/Som
ewhat True
417 42.6%
3 Never/Not True 89 9.1%
Missing Values 4 Dont know 0 0.0%
996 Missing 142 14.5%
PFL_hypatt1
Value Count Percent
Standard Attributes Position 27
Label Q2.60 is unable
to concentrate
or pay attention
for long
Type Numeric
Format F3
Measurement Nominal
Role Input
Valid Values 1 Often/Very True 201 20.5%
2 Sometimes/Som
ewhat True
359 36.6%
3 Never/Not True 396 40.4%
Missing Values 4 Dont know 0 0.0%
996 Missing 24 2.4%
Note: Item 1 from PFL hyperactivity and inattention construct

17
PFL_def3
Value Count Percent
Standard Attributes Position 28
Label Q2.61
punishment
doesn’t change
this child’s
behaviour
Type Numeric
Format F3
Measurement Nominal
Role Input
Valid Values 1 Often/Very True 79 8.1%
2 Sometimes/Som
ewhat True
161 16.4%
3 Never/Not True 573 58.5%
Missing Values 4 Dont know 0 0.0%
996 Missing 167 17.0%
Note: Item 3 from PFL defiant behaviour construct
PFL_hypatt3
Value Count Percent
Standard Attributes Position 29
Label Q2.62 has
difficulty waiting
his/her turn in
games
Type Numeric
Format F3
Measurement Nominal
Role Input
Valid Values 1 Often/Very True 108 11.0%
2 Sometimes/Som
ewhat True
243 24.8%
3 Never/Not True 590 60.2%
Missing Values 4 Dont know 0 0.0%
996 Missing 39 4.0%

18
Note: Item 3 from PFL hyperactivity and inattention construct
PFL_agg1
Value Count Percent
Standard Attributes Position 30
Label Q2.63 physically
attacks people
Type Numeric
Format F3
Measurement Nominal
Role Input
Valid Values 1 Often/Very True 28 2.9%
2 Sometimes/Som
ewhat True
94 9.6%
3 Never/Not True 823 84.0%
Missing Values 4 Dont know 0 0.0%
996 Missing 35 3.6%
PFL_el1
Value Count Percent
Standard Attributes Position 31
Label Q2.64
demonstrates
knowledge of
the alphabet
Type Numeric
Format F3
Measurement Nominal
Role Input
Valid Values 1 Yes 741 75.6%
2 No 156 15.9%
Missing Values 3 Dont know 0 0.0%
996 Missing 83 8.5%
Note: Item 1 from PFL emergent literacy construct
PFL_el3
Value Count Percent
Standard Attributes Position 32

19
Label Q2.65.
understands the
purpose of
writing
Type Numeric
Format F3
Measurement Nominal
Role Input
Valid Values 1 Yes 616 62.9%
2 No 167 17.0%
Missing Values 3 Dont know 0 0.0%
996 Missing 197 20.1%
Note: Item 3 from PFL emergent literacy construct
PFL_pi1
Value Count Percent
Standard Attributes Position 33
Label Q2.66. can
do/undo buttons
or zips
Type Numeric
Format F3
Measurement Nominal
Role Input
Valid Values 1 Yes 527 53.8%
2 No 321 32.8%
Missing Values 3 Dont know 0 0.0%
996 Missing 132 13.5%
Note: Item 1 from PFL physical independence construct
PFL_el4
Value Count Percent
Standard Attributes Position 34
Label Q2.67. writes
letters and
words
Type Numeric
Format F3

20
Measurement Nominal
Role Input
Valid Values 1 Yes 479 48.9%
2 No 439 44.8%
Missing Values 3 Dont know 0 0.0%
996 Missing 62 6.3%
Note: Item 4 from PFL emergent literacy construct
PFL_pi2
Value Count Percent
Standard Attributes Position 35
Label Q2.68. can
manage his/her
lunch or snack
on his/her own
Type Numeric
Format F3
Measurement Nominal
Role Input
Valid Values 1 Yes 762 77.8%
2 No 95 9.7%
Missing Values 3 Dont know 0 0.0%
996 Missing 123 12.6%
Note: Item 2 from PFL physical independence construct
PFL_el2
Value Count Percent
Standard Attributes Position 36
Label Q2.69. uses
emerging
reading skills to
make meaning
from print
Type Numeric
Format F3
Measurement Nominal
Role Input
Valid Values 1 Yes 439 44.8%

21
2 No 444 45.3%
Missing Values 3 Dont know 0 0.0%
996 Missing 97 9.9%
Note: Item 2 from PFL emergent literacy construct
PFL_pi3
Value Count Percent
Standard Attributes Position 37
Label Q2.70. is able to
put on his/her
coat
independently
Type Numeric
Format F3
Measurement Nominal
Role Input
Valid Values 1 Yes 719 73.4%
2 No 139 14.2%
Missing Values 3 Dont know 0 0.0%
996 Missing 122 12.4%
Note: Item 3 from PFL physical independence construct
PFL_el
Value
Standard Attributes Position 38
Label PFL: Emergent
literacy construct
Type Numeric
Format F3.2
Measurement Scale
Role Input
N Valid 956
Missing 24
Central Tendency and
Dispersion
Mean 1.6511
Standard Deviation .33891
Percentile 25 1.3333
Percentile 50 1.7500
Percentile 75 2.0000

22
Note: Emergent literacy construct, created from PFL_el, PFL_el2, FL_el3 and
PFL_el4
PFL_def
Value
Standard Attributes Position 39
Label PFL: Defiant
behaviour
construct
Type Numeric
Format F3.2
Measurement Scale
Role Input
N Valid 924
Missing 56
Central Tendency and
Dispersion
Mean 1.3887
Standard Deviation .59210
Percentile 25 1.0000
Percentile 50 1.0000
Percentile 75 1.6667
Note: Defiant behaviour construct, created from PFL_def1, PFL_def2 and PFL_def3
PFL_pi
Value
Standard Attributes Position 40
Label PFL: Physical
independence
construct
Type Numeric
Format F3.2
Measurement Scale
Role Input
N Valid 859
Missing 121
Central Tendency and
Dispersion
Mean 1.7837
Standard Deviation .30010
Percentile 25 1.6667
Percentile 50 2.0000

23
Percentile 75 2.0000
Note: Physical independence construct, created from PFL_pi1, PFL_pi2 and PFL_pi3
PFL_hypatt
Value
Standard Attributes Position 41
Label PFL: Alternative
hyperactivty/inatt
ention
Type Numeric
Format F3.2
Measurement Scale
Role Input
N Valid 960
Missing 20
Central Tendency and
Dispersion
Mean 2.3182
Standard Deviation .62122
Percentile 25 2.0000
Percentile 50 2.3333
Percentile 75 3.0000
Note: Hyperactivity and inattention construct, created from PFL_hypatt1, PFL_
hypatt2 and PFL_hypatt3
SR_Sept
Value Count Percent
Standard Attributes Position 42
Label Q2.77 Rate
childs School
Readiness in
September
Type Numeric
Format F3
Measurement Nominal
Role Input
Valid Values 1 Definitely ready 500 51.0%
2 Somewhat
ready
269 27.4%
3 Definitely not
ready
85 8.7%
Missing Values 996 Missing 126 12.9%

24
Note: Subjective teacher rating of school readiness
SR_Now
Value Count Percent
Standard Attributes Position 43
Label Q2.78 Rate
childs School
Readiness now
Type Numeric
Format F3
Measurement Nominal
Role Input
Valid Values 1 Definitely ready 655 66.8%
2 Somewhat
ready
170 17.3%
3 Definitely not
ready
31 3.2%
Missing Values 996 Missing 124 12.7%
Note: Subjective teacher rating of school readiness
Adjustment
Value Count Percent
Standard Attributes Position 44
Label Q2.79 Based on
your experience
would you say
child had
Type Numeric
Format F3
Measurement Nominal
Role Input
Valid Values 1 Very successful
adjustment to
school, virtually
no problems.
274 28.0%

25
2 Moderately
successful
adjustment to
school, some
problems,
mostly minor.
108 11.0%
3 Difficult
adjustment to
school, serious
concerns or
many problems.
24 2.4%
Missing Values 996 Missing 574 58.6%
Note: Subjective teacher rating of school readiness
Mostimp
Value Count Percent
Standard Attributes Position 45
Label Q2.80a Most
importand for
childs school
readiness
Type Numeric
Format F3
Measurement Nominal
Role Input
Valid Values 1 Physical health
and well-being
94 9.6%
2 Social
competence
264 26.9%
3 Emotional
maturity
285 29.1%
4 Language and
cognitive
development
40 4.1%
5 Communication
skills and
general
knowledge
53 5.4%
Missing Values 996 Missing 244 24.9%
Note: Teacher perception of the most important aspects of development for a

26
child’s school readiness
Leastimp
Value Count Percent
Standard Attributes Position 46
Label Q2.80b Least
important for
childs school
readiness
Type Numeric
Format F3
Measurement Nominal
Role Input
Valid Values 1 Physical health
and well-being
232 23.7%
2 Social
competence
92 9.4%
3 Emotional
maturity
56 5.7%
4 Language and
cognitive
development
214 21.8%
5 Communication
skills and
general
knowledge
142 14.5%
Missing Values 996 Missing 244 24.9%
Note: Teacher perception of the least important aspects of development for a
child’s school readiness

27
Short Early Development Instrument (S-EDI) M. Janus, PhD & E.K. Duku, MSc, P.Stat
Development of the Short Early Development Instrument (S-EDI). Hamilton,
Ontario, Canada: Offord Centre for Child Studies. Retrieved May 30, 2014, from
http://www.offordcentre.com/readiness/files/REPORT.short_edi_june2005.pdf
https://edi.offordcentre.com/
SEDI_phys1
Value
Standard Attributes Position 47
Label SEDI PH1:
Physical
readiness for the
school day
Type Numeric
Format F3.2
Measurement Scale
Role Input
N Valid 958
Missing 22
Central Tendency and
Dispersion
Mean 8.1785
Standard Deviation 2.82872
Percentile 25 6.6667
Percentile 50 10.0000
Percentile 75 10.0000
Note: Early Development Instrument Short version (S-EDI; Janus, Duku & Stat,
2005) Physical Well-being subdomain 1
SEDI_phys2
Value
Standard Attributes Position 48
Label SEDI PH2:
Physical
independence
Type Numeric
Format F3.2
Measurement Scale
Role Input
N Valid 955
Missing 25
Central Tendency and
Dispersion
Mean 8.7766
Standard Deviation 2.28581

28
Percentile 25 6.6667
Percentile 50 10.0000
Percentile 75 10.0000
Note: Early Development Instrument Short version (S-EDI; Janus, Duku & Stat,
2005) Physical Well-being subdomain 2
SEDI_phys3
Value
Standard Attributes Position 49
Label SEDI PH3:
Gross and fine
motor skills
Type Numeric
Format F3.2
Measurement Scale
Role Input
N Valid 938
Missing 42
Central Tendency and
Dispersion
Mean 6.9527
Standard Deviation 2.93733
Percentile 25 5.0000
Percentile 50 7.5000
Percentile 75 10.0000
Note: Early Development Instrument Short version (S-EDI; Janus, Duku & Stat,
2005) Physical Well-being subdomain 3
SEDI_phys
Value
Standard Attributes Position 50
Label SEDI: Physical
health and
wellbeing
domain
Type Numeric
Format F3.2
Measurement Scale
Role Input
N Valid 958

29
Missing 22
Central Tendency and
Dispersion
Mean 8.0053
Standard Deviation 2.00963
Percentile 25 6.8750
Percentile 50 8.7500
Percentile 75 9.4444
Note: Early Development Instrument Short version (S-EDI; Janus, Duku & Stat,
2005) Physical Well-being domain
SEDI_soc1
Value
Standard Attributes Position 51
Label SEDI SC1:
Overall social
competence with
peers
Type Numeric
Format F3.2
Measurement Scale
Role Input
N Valid 960
Missing 20
Central Tendency and
Dispersion
Mean 6.6562
Standard Deviation 2.97323
Percentile 25 5.0000
Percentile 50 6.6667
Percentile 75 10.0000
Note: Early Development Instrument Short version (S-EDI; Janus, Duku & Stat,
2005) Social Competence subdomain 1
SEDI_soc2
Value
Standard Attributes Position 52
Label SEDI SC2:
Responsibility
and respect
Type Numeric

30
Format F3.2
Measurement Scale
Role Input
N Valid 960
Missing 20
Central Tendency and
Dispersion
Mean 8.0825
Standard Deviation 2.51084
Percentile 25 6.6667
Percentile 50 10.0000
Percentile 75 10.0000
Note: Early Development Instrument Short version (S-EDI; Janus, Duku & Stat,
2005) Social Competence subdomain 2
SEDI_soc3
Value
Standard Attributes Position 53
Label SEDI SC3:
Approaches to
learning
Type Numeric
Format F3.2
Measurement Scale
Role Input
N Valid 960
Missing 20
Central Tendency and
Dispersion
Mean 7.8715
Standard Deviation 2.50379
Percentile 25 6.6667
Percentile 50 8.3333
Percentile 75 10.0000
Note: Early Development Instrument Short version (S-EDI; Janus, Duku & Stat,
2005) Social Competence subdomain 3
SEDI_soc4
Value
Standard Attributes Position 54
Label SEDI SC4:
Readiness to
explore new
things
Type Numeric

31
Format F3.2
Measurement Scale
Role Input
N Valid 935
Missing 45
Central Tendency and
Dispersion
Mean 8.6578
Standard Deviation 1.92700
Percentile 25 7.5000
Percentile 50 10.0000
Percentile 75 10.0000
Note: Early Development Instrument Short version (S-EDI; Janus, Duku & Stat,
2005) Social Competence subdomain 4
SEDI_soc
Value
Standard Attributes Position 55
Label SEDI: Social
Competence
domain
Type Numeric
Format F3.2
Measurement Scale
Role Input
N Valid 959
Missing 21
Central Tendency and
Dispersion
Mean 7.8085
Standard Deviation 2.00577
Percentile 25 6.5000
Percentile 50 8.3333
Percentile 75 9.5833
Note: Early Development Instrument Short version (S-EDI; Janus, Duku & Stat,
2005) Social Competence domain
SEDI_emot1
Value
Standard Attributes Position 56

32
Label SEDI EM1:
Proscoial and
helping
behaviour
Type Numeric
Format F3.2
Measurement Scale
Role Input
N Valid 883
Missing 97
Central Tendency and
Dispersion
Mean 5.9003
Standard Deviation 3.23957
Percentile 25 3.3333
Percentile 50 5.0000
Percentile 75 8.3333
Note: Early Development Instrument Short version (S-EDI; Janus, Duku & Stat,
2005) Emotional Maturity subdomain 1
SEDI_emot2
Value
Standard Attributes Position 57
Label SEDI EM2:
Aggressive
behaviour
Type Numeric
Format F3.2
Measurement Scale
Role Input
N Valid 947
Missing 33
Central Tendency and
Dispersion
Mean 8.4706
Standard Deviation 2.51702
Percentile 25 6.6667
Percentile 50 10.0000
Percentile 75 10.0000
Note: Early Development Instrument Short version (S-EDI; Janus, Duku & Stat,
2005) Emotional Maturity subdomain 2

33
SEDI_emot3
Value
Standard Attributes Position 58
Label SEDI EM3:
Hyperactivity
and inattention
Type Numeric
Format F3.2
Measurement Scale
Role Input
N Valid 960
Missing 20
Central Tendency and
Dispersion
Mean 6.3212
Standard Deviation 3.49775
Percentile 25 5.0000
Percentile 50 6.6667
Percentile 75 10.0000
Note: Early Development Instrument Short version (S-EDI; Janus, Duku & Stat,
2005) Emotional Maturity subdomain 3
SEDI_emot4
Value
Standard Attributes Position 59
Label SEDI EM4:
Anxious and
fearful behaviour
Type Numeric
Format F3.2
Measurement Scale
Role Input
N Valid 949
Missing 31
Central Tendency and
Dispersion
Mean 8.1709
Standard Deviation 2.47392
Percentile 25 6.6667
Percentile 50 10.0000
Percentile 75 10.0000
Note: Early Development Instrument Short version (S-EDI; Janus, Duku & Stat,
2005) Emotional Maturity subdomain 4

34
SEDI_emot
Value
Standard Attributes Position 60
Label SEDI: Emotional
Maturity domain
Type Numeric
Format F3.2
Measurement Scale
Role Input
N Valid 951
Missing 29
Central Tendency and
Dispersion
Mean 7.2371
Standard Deviation 1.99398
Percentile 25 5.9091
Percentile 50 7.5000
Percentile 75 8.7500
Note: Early Development Instrument Short version (S-EDI; Janus, Duku & Stat,
2005) Emotional Maturity domain
SEDI_lang1
Value
Standard Attributes Position 61
Label SEDI LC1: Basic
literacy skills
Type Numeric
Format F3.2
Measurement Scale
Role Input
N Valid 951
Missing 29
Central Tendency and
Dispersion
Mean 6.9769
Standard Deviation 3.43616
Percentile 25 5.0000
Percentile 50 6.6667
Percentile 75 10.0000
Note: Early Development Instrument Short version (S-EDI; Janus, Duku & Stat,
2005) Language and Cognitive Development subdomain 1

35
SEDI_lang2
Value
Standard Attributes Position 62
Label SEDI LC2:
Interest in
literacy/numerac
y and memory
Type Numeric
Format F3.2
Measurement Scale
Role Input
N Valid 945
Missing 35
Central Tendency and
Dispersion
Mean 8.9489
Standard Deviation 2.52699
Percentile 25 10.0000
Percentile 50 10.0000
Percentile 75 10.0000
Note: Early Development Instrument Short version (S-EDI; Janus, Duku & Stat,
2005) Language and Cognitive Development subdomain 2
SEDI_lang3
Value
Standard Attributes Position 63
Label SEDI LC3: Basic
numeracy skills
Type Numeric
Format F3.2
Measurement Scale
Role Input
N Valid 876
Missing 104
Central Tendency and
Dispersion
Mean 5.4547
Standard Deviation 4.06682
Percentile 25 .0000
Percentile 50 5.0000
Percentile 75 10.0000
Note: Early Development Instrument Short version (S-EDI; Janus, Duku & Stat,
2005) Language and Cognitive Development subdomain 3

36
SEDI_lang4
Value
Standard Attributes Position 64
Label SEDI LC4:
Advanced
literacy skills
Type Numeric
Format F3.2
Measurement Scale
Role Input
N Valid 933
Missing 47
Central Tendency and
Dispersion
Mean 2.2562
Standard Deviation 2.63143
Percentile 25 .0000
Percentile 50 .0000
Percentile 75 3.3333
Note: Early Development Instrument Short version (S-EDI; Janus, Duku & Stat,
2005) Language and Cognitive Development subdomain 4
SEDI_lang
Value
Standard Attributes Position 65
Label SEDI: Language
and Cognitive
Development
domain
Type Numeric
Format F3.2
Measurement Scale
Role Input
N Valid 911
Missing 69
Central Tendency and
Dispersion
Mean 5.9016
Standard Deviation 2.52620
Percentile 25 4.1667
Percentile 50 6.3636
Percentile 75 8.1818
Note: Early Development Instrument Short version (S-EDI; Janus, Duku & Stat,
2005) Language and Cognitive Development domain

37
SEDI_com
Value
Standard Attributes Position 66
Label SEDI:
Communication
Skills and
General
Knowledge
domain
Type Numeric
Format F3.2
Measurement Scale
Role Input
N Valid 957
Missing 23
Central Tendency and
Dispersion
Mean 5.9204
Standard Deviation 3.51881
Percentile 25 3.3333
Percentile 50 6.6667
Percentile 75 10.0000
Note: Early Development Instrument Short version (S-EDI; Janus, Duku & Stat,
2005). Communication Skills and General Knowledge domain
SEDI_com_miss
Value
Standard Attributes Position 67
Label SEDI: Number
of missing item
scores
Type Numeric
Format F3
Measurement Scale
Role Input
N Valid 980
Missing 0
Central Tendency and
Dispersion
Mean .08
Standard Deviation .449
Percentile 25 .00

38
Percentile 50 .00
Percentile 75 .00
Note: Early Development Instrument Short version (S-EDI; Janus, Duku & Stat,
2005) – indicates number of missing values in items used to generate
Communication Skills and General Knowledge subdomain
SEDI_phys_miss
Value
Standard Attributes Position 68
Label SEDI: Number
of missing item
scores
Type Numeric
Format F3
Measurement Scale
Role Input
N Valid 980
Missing 0
Central Tendency and
Dispersion
Mean .74
Standard Deviation 1.363
Percentile 25 .00
Percentile 50 .00
Percentile 75 1.00
Note: Early Development Instrument Short version (S-EDI; Janus, Duku & Stat,
2005) – indicates number of missing values in items used to generate Physical
Well-being domain
SEDI_lang_miss
Value
Standard Attributes Position 69
Label SEDI: Number
of missing item
scores
Type Numeric
Format F3
Measurement Scale
Role Input
N Valid 980
Missing 0
Central Tendency and Mean .94

39
Dispersion Standard Deviation 2.012
Percentile 25 .00
Percentile 50 .00
Percentile 75 1.00
Note: Early Development Instrument Short version (S-EDI; Janus, Duku & Stat,
2005) – indicates number of missing values in items used to generate Language
and Cognitive Development domain
SEDI_soc_miss
Value
Standard Attributes Position 70
Label SEDI: Number
of missing item
scores
Type Numeric
Format F3
Measurement Scale
Role Input
N Valid 980
Missing 0
Central Tendency and
Dispersion
Mean .36
Standard Deviation 1.738
Percentile 25 .00
Percentile 50 .00
Percentile 75 .00
Note: Early Development Instrument Short version (S-EDI; Janus, Duku & Stat,
2005) – indicates number of missing values in items used to generate Social
Competence domain
SEDI_emot_miss
Value
Standard Attributes Position 71
Label SEDI: Number
of missing item
scores
Type Numeric
Format F3
Measurement Scale
Role Input

40
N Valid 980
Missing 0
Central Tendency and
Dispersion
Mean .69
Standard Deviation 1.838
Percentile 25 .00
Percentile 50 .00
Percentile 75 1.00
Note: Early Development Instrument Short version (S-EDI; Janus, Duku & Stat,
2005) – indicates number of missing values in items used to generate Emotional
Maturity domain
SEDI_phys1_miss
Value
Standard Attributes Position 72
Label SEDI: Number
of missing item
scores
Type Numeric
Format F3
Measurement Scale
Role Input
N Valid 980
Missing 0
Central Tendency and
Dispersion
Mean .14
Standard Deviation .498
Percentile 25 .00
Percentile 50 .00
Percentile 75 .00
Note: Early Development Instrument Short version (S-EDI; Janus, Duku & Stat,
2005) – indicates number of missing values in items used to generate SEDI_phys1
SEDI_phys2_miss
Value
Standard Attributes Position 73
Label SEDI: Number
of missing item
scores
Type Numeric
Format F3

41
Measurement Scale
Role Input
N Valid 980
Missing 0
Central Tendency and
Dispersion
Mean .10
Standard Deviation .469
Percentile 25 .00
Percentile 50 .00
Percentile 75 .00
Note: Early Development Instrument Short version (S-EDI; Janus, Duku & Stat,
2005) – indicates number of missing values in items used to generate SEDI_phys2
SEDI_phys3_miss
Value
Standard Attributes Position 74
Label SEDI: Number
of missing item
scores
Type Numeric
Format F3
Measurement Scale
Role Input
N Valid 980
Missing 0
Central Tendency and
Dispersion
Mean .50
Standard Deviation .646
Percentile 25 .00
Percentile 50 .00
Percentile 75 1.00
Note: Early Development Instrument Short version (S-EDI; Janus, Duku & Stat,
2005) – indicates number of missing values in items used to generate SEDI_phys3
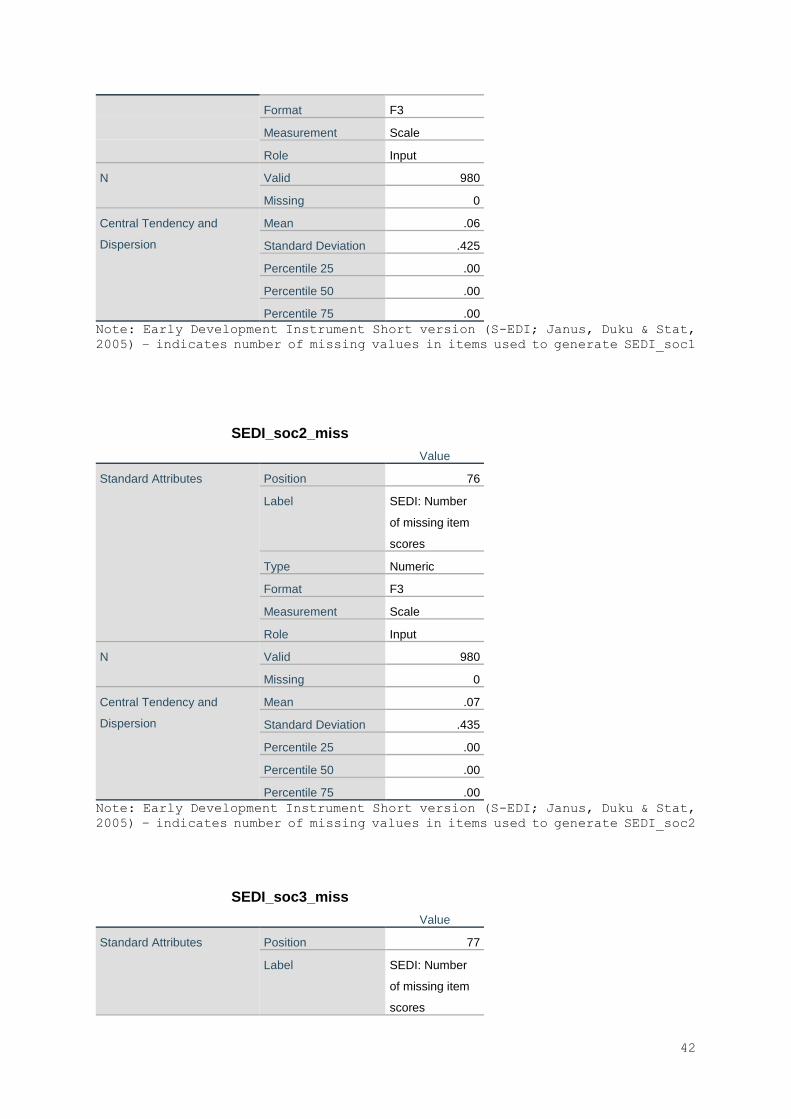
SEDI_soc1_miss
Value
Standard Attributes Position 75
Label SEDI: Number
of missing item
scores
Type Numeric
42
Format F3
Measurement Scale
Role Input
N Valid 980
Missing 0
Central Tendency and
Dispersion
Mean .06
Standard Deviation .425
Percentile 25 .00
Percentile 50 .00
Percentile 75 .00
Note: Early Development Instrument Short version (S-EDI; Janus, Duku & Stat,
2005) – indicates number of missing values in items used to generate SEDI_soc1
SEDI_soc2_miss
Value
Standard Attributes Position 76
Label SEDI: Number
of missing item
scores
Type Numeric
Format F3
Measurement Scale
Role Input
N Valid 980
Missing 0
Central Tendency and
Dispersion
Mean .07
Standard Deviation .435
Percentile 25 .00
Percentile 50 .00
Percentile 75 .00
Note: Early Development Instrument Short version (S-EDI; Janus, Duku & Stat,
2005) – indicates number of missing values in items used to generate SEDI_soc2
SEDI_soc3_miss
Value
Standard Attributes Position 77
Label SEDI: Number
of missing item
scores

43
Type Numeric
Format F3
Measurement Scale
Role Input
N Valid 980
Missing 0
Central Tendency and
Dispersion
Mean .07
Standard Deviation .429
Percentile 25 .00
Percentile 50 .00
Percentile 75 .00
Note: Early Development Instrument Short version (S-EDI; Janus, Duku & Stat,
2005) – indicates number of missing values in items used to generate SEDI_soc3
SEDI_soc4_miss
Value
Standard Attributes Position 78
Label SEDI: Number
of missing item
scores
Type Numeric
Format F3
Measurement Scale
Role Input
N Valid 980
Missing 0
Central Tendency and
Dispersion
Mean .16
Standard Deviation .581
Percentile 25 .00
Percentile 50 .00
Percentile 75 .00
Note: Early Development Instrument Short version (S-EDI; Janus, Duku & Stat,
2005) – indicates number of missing values in items used to generate SEDI_soc4
SEDI_emot1_miss
Value
Standard Attributes Position 79

44
Label SEDI: Number
of missing item
scores
Type Numeric
Format F3
Measurement Scale
Role Input
N Valid 980
Missing 0
Central Tendency and
Dispersion
Mean .37
Standard Deviation .747
Percentile 25 .00
Percentile 50 .00
Percentile 75 .00
Note: Early Development Instrument Short version (S-EDI; Janus, Duku & Stat,
2005) – indicates number of missing values in items used to generate SEDI_emot1
SEDI_emot2_miss
Value
Standard Attributes Position 80
Label SEDI: Number
of missing item
scores
Type Numeric
Format F3
Measurement Scale
Role Input
N Valid 980
Missing 0
Central Tendency and
Dispersion
Mean .13
Standard Deviation .537
Percentile 25 .00
Percentile 50 .00
Percentile 75 .00
Note: Early Development Instrument Short version (S-EDI; Janus, Duku & Stat,
2005) – indicates number of missing values in items used to generate SEDI_emot2

45
SEDI_emot3_miss
Value
Standard Attributes Position 81
Label SEDI: Number
of missing item
scores
Type Numeric
Format F3
Measurement Scale
Role Input
N Valid 980
Missing 0
Central Tendency and
Dispersion
Mean .06
Standard Deviation .426
Percentile 25 .00
Percentile 50 .00
Percentile 75 .00
Note: Early Development Instrument Short version (S-EDI; Janus, Duku & Stat,
2005) – indicates number of missing values in items used to generate SEDI_emot3
SEDI_emot4_miss
Value
Standard Attributes Position 82
Label SEDI: Number
of missing item
scores
Type Numeric
Format F3
Measurement Scale
Role Input
N Valid 980
Missing 0
Central Tendency and
Dispersion
Mean .13
Standard Deviation .519
Percentile 25 .00
Percentile 50 .00
Percentile 75 .00
Note: Early Development Instrument Short version (S-EDI; Janus, Duku & Stat,
2005) – indicates number of missing values in items used to generate SEDI_emot4

46
SEDI_lang1_miss
Value
Standard Attributes Position 83
Label SEDI: Number
of missing item
scores
Type Numeric
Format F3
Measurement Scale
Role Input
N Valid 980
Missing 0
Central Tendency and
Dispersion
Mean .15
Standard Deviation .520
Percentile 25 .00
Percentile 50 .00
Percentile 75 .00
Note: Early Development Instrument Short version (S-EDI; Janus, Duku & Stat,
2005) – indicates number of missing values in items used to generate SEDI_lang1
SEDI_lang2_miss
Value
Standard Attributes Position 84
Label SEDI: Number
of missing item
scores
Type Numeric
Format F3
Measurement Scale
Role Input
N Valid 980
Missing 0
Central Tendency and
Dispersion
Mean .17
Standard Deviation .547
Percentile 25 .00
Percentile 50 .00
Percentile 75 .00
Note: Early Development Instrument Short version (S-EDI; Janus, Duku & Stat,
2005) – indicates number of missing values in items used to generate SEDI_lang2

47
SEDI_lang3_miss
Value
Standard Attributes Position 85
Label SEDI: Number
of missing item
scores
Type Numeric
Format F3
Measurement Scale
Role Input
N Valid 980
Missing 0
Central Tendency and
Dispersion
Mean .20
Standard Deviation .588
Percentile 25 .00
Percentile 50 .00
Percentile 75 .00
Note: Early Development Instrument Short version (S-EDI; Janus, Duku & Stat,
2005) – indicates number of missing values in items used to generate SEDI_lang3
SEDI_lang4_miss
Value
Standard Attributes Position 86
Label SEDI: Number
of missing item
scores
Type Numeric
Format F3
Measurement Scale
Role Input
N Valid 980
Missing 0
Central Tendency and
Dispersion
Mean .42
Standard Deviation .800
Percentile 25 .00
Percentile 50 .00
Percentile 75 1.00
Note: Early Development Instrument Short version (S-EDI; Janus, Duku & Stat,
2005) – indicates number of missing values in items used to generate SEDI_lang4

48
Appendix: List of variables in CPSE Teacher data
by domain
Variable name Variable label Domain
CPSE_ID CPSE identifier Interview details
PFL_ID PFL identifier for matching with PFL data
Interview details
PFL_Group PFL Treatment group: high or low Interview details
School School: anonymised Interview details
Wave Data collection wave Interview details
ChildGender Gender of child in Junior Infants class Interview details
Hand Childs hand preference - left or right Interview details
CompletionAge Childs age on completion of survey Interview details
TAge Q1.1 What is your age? Teacher demographics
TEducation Q1.3 What is your highest level of education completed?
Teacher demographics
TeachingYrs Q1.4 How many years have you been teaching?
Teacher demographics
TeachingJrs Q1.5 How many years have you taught junior infants?
Teacher demographics
TeachingSch Q1.6 How many years have you been teaching in this school?
Teacher demographics
Class_size Q1.7 How many students are in your class?
Teacher demographics
PFL_specnum Q2.25 demonstrates special numeracy skills or talents
School readiness
PFL_speclit Q2.26 demonstrates special literacy skills or talents
School readiness
PFL_specart Q2.27 demonstrates special skills or talents in arts
School readiness
PFL_specmus Q2.28 demonstrates special skills or talents in music
School readiness
PFL_specath Q2.29 demonstrates special skills or talents in athletics/dance
School readiness
PFL_specprob Q2.30 demonstrates special skills or talents in problem solving
School readiness
PFL_specoth Q2.31 demonstrates special skills or talents in other areas
School readiness
PFL_spec Any special skills or talents (yes to any of Q2.25 - Q2.31)
School readiness
PFL_hypatt2 Q2.56 is inattentive School readiness
PFL_def2 Q2.57 doesnt seem to feel guilty after misbehaving
School readiness
PFL_def1 Q2.58 is defiant or refuses to comply with requests or rules
School readiness
PFL_prosoc1 Q2.59 tries to help someone who has been hurt
School readiness
PFL_hypatt1 Q2.60 is unable to concentrate or pay attention for long
School readiness

49
PFL_def3 Q2.61 punishment doesn’t change this child’s behaviour
School readiness
PFL_hypatt3 Q2.62 has difficulty waiting his/her turn in games
School readiness
PFL_agg1 Q2.63 physically attacks people School readiness
PFL_el1 Q2.64 demonstrates knowledge of the alphabet
School readiness
PFL_el3 Q2.65. understands the purpose of writing
School readiness
PFL_pi1 Q2.66. can do/undo buttons or zips School readiness
PFL_el4 Q2.67. writes letters and words School readiness
PFL_pi2 Q2.68. can manage his/her lunch or snack on his/her own
School readiness
PFL_el2 Q2.69. uses emerging reading skills to make meaning from print
School readiness
PFL_pi3 Q2.70. is able to put on his/her coat independently
School readiness
PFL_el PFL: Emergent literacy construct School readiness
PFL_def PFL: Defiant behaviour construct School readiness
PFL_pi PFL: Physical independence construct School readiness
PFL_hypatt PFL: Alternative hyperactivty/inattention
School readiness
SR_Sept Q2.77 Rate childs School Readiness in September
School readiness – subjective measures
SR_Now Q2.78 Rate childs School Readiness now
School readiness – subjective measures
Adjustment Q2.79 Based on your experience would you say child had
School readiness – subjective measures
Mostimp Q2.80a Most importand for childs school readiness
School readiness – subjective measures
Leastimp Q2.80b Least important for childs school readiness
School readiness – subjective measures
SEDI_phys1 SEDI PH1: Physical readiness for the school day School readiness
SEDI_phys2 SEDI PH2: Physical independence School readiness
SEDI_phys3 SEDI PH3: Gross and fine motor skills School readiness
SEDI_phys SEDI: Physical health and wellbeing domain
School readiness
SEDI_soc1 SEDI SC1: Overall social competence with peers
School readiness
SEDI_soc2 SEDI SC2: Responsibility and respect School readiness
SEDI_soc3 SEDI SC3: Approaches to learning School readiness
SEDI_soc4 SEDI SC4: Readiness to explore new things
School readiness
SEDI_soc SEDI: Social Competence domain School readiness
SEDI_emot1 SEDI EM1: Proscoial and helping behaviour
School readiness
SEDI_emot2 SEDI EM2: Aggressive behaviour School readiness
SEDI_emot3 SEDI EM3: Hyperactivity and inattention
School readiness
50
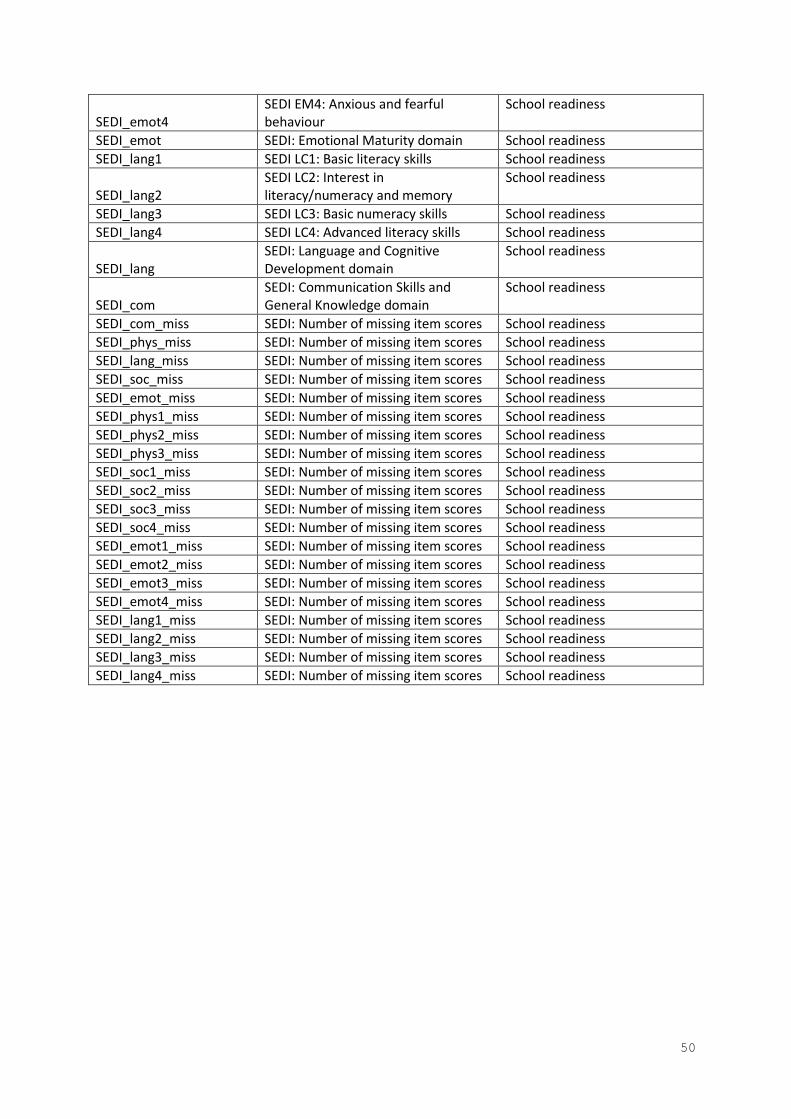
SEDI_emot4 SEDI EM4: Anxious and fearful behaviour
School readiness
SEDI_emot SEDI: Emotional Maturity domain School readiness
SEDI_lang1 SEDI LC1: Basic literacy skills School readiness
SEDI_lang2 SEDI LC2: Interest in literacy/numeracy and memory
School readiness
SEDI_lang3 SEDI LC3: Basic numeracy skills School readiness
SEDI_lang4 SEDI LC4: Advanced literacy skills School readiness
SEDI_lang SEDI: Language and Cognitive Development domain
School readiness
SEDI_com SEDI: Communication Skills and General Knowledge domain
School readiness
SEDI_com_miss SEDI: Number of missing item scores School readiness
SEDI_phys_miss SEDI: Number of missing item scores School readiness
SEDI_lang_miss SEDI: Number of missing item scores School readiness
SEDI_soc_miss SEDI: Number of missing item scores School readiness
SEDI_emot_miss SEDI: Number of missing item scores School readiness
SEDI_phys1_miss SEDI: Number of missing item scores School readiness
SEDI_phys2_miss SEDI: Number of missing item scores School readiness
SEDI_phys3_miss SEDI: Number of missing item scores School readiness
SEDI_soc1_miss SEDI: Number of missing item scores School readiness
SEDI_soc2_miss SEDI: Number of missing item scores School readiness
SEDI_soc3_miss SEDI: Number of missing item scores School readiness
SEDI_soc4_miss SEDI: Number of missing item scores School readiness
SEDI_emot1_miss SEDI: Number of missing item scores School readiness
SEDI_emot2_miss SEDI: Number of missing item scores School readiness
SEDI_emot3_miss SEDI: Number of missing item scores School readiness
SEDI_emot4_miss SEDI: Number of missing item scores School readiness
SEDI_lang1_miss SEDI: Number of missing item scores School readiness
SEDI_lang2_miss SEDI: Number of missing item scores School readiness
SEDI_lang3_miss SEDI: Number of missing item scores School readiness
SEDI_lang4_miss SEDI: Number of missing item scores School readiness