study of aluminium batteries as energy source r(1)
TRANSCRIPT

7/16/2019 Study of Aluminium Batteries as Energy Source r(1)
http://slidepdf.com/reader/full/study-of-aluminium-batteries-as-energy-source-r1 1/92
STUDY OF ALUMINIUM BATTERIES AS ENERGY SOURCE
LOW CHEE LEONG
7/16/2019 Study of Aluminium Batteries as Energy Source r(1)
http://slidepdf.com/reader/full/study-of-aluminium-batteries-as-energy-source-r1 2/92
ii
DECLARATION
I hereby declare that this project report is based on my original work except for
citations and quotations which have been duly acknowledged. I also declare that it
has not been previously and concurrently submitted for any other degree or award at
UTAR or other institutions.

7/16/2019 Study of Aluminium Batteries as Energy Source r(1)
http://slidepdf.com/reader/full/study-of-aluminium-batteries-as-energy-source-r1 3/92
iii
APPROVAL FOR SUBMISSION
I certify that this project report entitled “STUDY OF ALUMINIUM BATTERIES
AS ENERGY SOURCE” was prepared by LOW CHEE LEONG has met the
required standard for submission in partial fulfilment of the requirements for the
award of Bachelor of Degree (Hons.) Chemical Engineering at UniversitiTunku
Abdul Rahman.

7/16/2019 Study of Aluminium Batteries as Energy Source r(1)
http://slidepdf.com/reader/full/study-of-aluminium-batteries-as-energy-source-r1 4/92
iv
The copyright of this report belongs to the author under the terms of the
copyright Act 1987 as qualified by Intellectual Property Policy of UniversityTunku
Abdul Rahman. Due acknowledgement shall always be made of the use of any
material contained in, or derived from, this report.
© 2013, Low Chee Leong.All right reserved.

7/16/2019 Study of Aluminium Batteries as Energy Source r(1)
http://slidepdf.com/reader/full/study-of-aluminium-batteries-as-energy-source-r1 5/92
v
Specially dedicated to
my beloved parents, siblings, lecturer and friends.

7/16/2019 Study of Aluminium Batteries as Energy Source r(1)
http://slidepdf.com/reader/full/study-of-aluminium-batteries-as-energy-source-r1 6/92
vi
ACKNOWLEDGEMENTS
I would like to thank everyone who had contributed to the successful completion of
this project. I would like to express my gratitude to my research supervisor, Miss
TeohHuiChiehfor her invaluable advice, guidance and her enormous patience
throughout the development of the research.
In addition, I would also like to express my appreciation to the beloved
friends who had helped me out when my project encounter the obstacles especially
Carina Hoon Huey Qi and Thanentiran Naidu a/I Subramaniam for checking out my
thesis. Their help is really encouraging me and make my works goes smoothly.
Moreover, I would like to thank to Chew Xing, Chan Junda, Lee Wei Pin and Tai
Wei Xian to figure out the problems with me. Their advices and suggestions are

7/16/2019 Study of Aluminium Batteries as Energy Source r(1)
http://slidepdf.com/reader/full/study-of-aluminium-batteries-as-energy-source-r1 7/92
vii
STUDY OF ALUMINIUM BATTERIES AS COVER
ABSTRACT
Al batteries included Al-air battery, Al-carbon battery and Al-copper battery. In this
project, an Al-air battery was constructed by replacing the cellulose nitrate
membrane with PTFE in a free-catalyst condition. This study focused on the
performance of the Al-batteries which can be affected by the parameters such as
surface area of anode and cathode, and type of electrolyte in different concentration.
The each result of the experiment was conducted over 30 minutes. The depletion
percentage was used to determine the stability of the cell. The higher surface area of
anode and cathode would lead to a higher current produced and lower depletion
percentage. As the concentration of the electrolyte increases, the conductivity of the
electrolyte is also increases. This implied that there are more ions to conduct the

7/16/2019 Study of Aluminium Batteries as Energy Source r(1)
http://slidepdf.com/reader/full/study-of-aluminium-batteries-as-energy-source-r1 8/92
viii
TABLE OF CONTENTS
DECLARATION ii
APPROVAL FOR SUBMISSION iii
ACKNOWLEDGEMENTS vi
ABSTRACT vii
TABLE OF CONTENTS viii
LIST OF TABLES xi
LIST OF FIGURES xiii
LIST OF APPENDICES xvi
CHAPTER
7/16/2019 Study of Aluminium Batteries as Energy Source r(1)
http://slidepdf.com/reader/full/study-of-aluminium-batteries-as-energy-source-r1 9/92
ix
2.3.2 Consideration of Cathode 16
2.3.3 Advantages and Disadvantages of Al-Carbon Battery
18
2.4 Aluminium-Copper Battery (Al-Copper Battery) 18
2.4.1 Working principles of Al-Copper Battery 18
2.4.2 Advantages and Disadvantages of Al-Copper Battery
19
2.5 Depletion of Current 20
2.5.1 Overpotential 20
2.5.2 Polarisation 20
2.5.3 Concentration Polarisation 21
3 METHODOLOGY 22
3.1 Background 22
3.2 Experiment Setup 23
3.2.1 Al-Air Battery 23
3.2.2 Al-Carbon Battery & Al-Copper Battery 24

7/16/2019 Study of Aluminium Batteries as Energy Source r(1)
http://slidepdf.com/reader/full/study-of-aluminium-batteries-as-energy-source-r1 10/92
x
4.3.2 Current at Time = 1 min 42
4.3.3 Current Depletion Percentage 44
4.4 Types of Solution in Different Concentration 46
4.4.1 Current 46
4.4.2 Voltages 48
4.4.3 Current Depletion Percentages 49
4.5 Parameters of Best Performance 51
5 CONCLUSIONS AND RECOMMENDATIONS 55
5.1 Conclusions 55
5.2 Recommendations 56
REFERENCES 57
APPENDICES 60

7/16/2019 Study of Aluminium Batteries as Energy Source r(1)
http://slidepdf.com/reader/full/study-of-aluminium-batteries-as-energy-source-r1 11/92
xi
LIST OF TABLES
TABLE TITLE PAGE
Table 1.1: The Price List of the Metal (Verma, 1994) 2
Table 2.1: Technical Specification of Cellulose Nitrate 13
Table 2.2: The Technical Data of the Double Sided Carbon Tape 17
Table 3.1: Summary of Comparison between Al-Air and Al-Carbon battery 26
Table 3.2: Summary of Comparison between Al-Carbon and Al-Copper battery 27
Table 3.3: Summary of Comparison between Al-Air and Al-
C b b 28

7/16/2019 Study of Aluminium Batteries as Energy Source r(1)
http://slidepdf.com/reader/full/study-of-aluminium-batteries-as-energy-source-r1 12/92
xii
Table 4.6: The Specification Parameters of the Best Performancein Al-Batteries 54
7/16/2019 Study of Aluminium Batteries as Energy Source r(1)
http://slidepdf.com/reader/full/study-of-aluminium-batteries-as-energy-source-r1 13/92
xiii
LIST OF FIGURES
FIGURE TITLE PAGE
Figure 1.1: Comparison between Aluminium and Zinc Anodes(Cuproban, 2009) 3
Figure 2.1: The Size of Conventional Battery and Metal-Air Battery (Toyota-Global.Com, 2012) 6
Figure 2.2: The Energy Densities of Various Types of Batteries(Jang Et Al., 2011) 7
Figure 2.3: The Theoretical Specific Energy of the Various MetalAir Batteries (National Aeronautics and SpaceAdministration [NASA], 2011) 7

7/16/2019 Study of Aluminium Batteries as Energy Source r(1)
http://slidepdf.com/reader/full/study-of-aluminium-batteries-as-energy-source-r1 14/92
xiv
Figure 3.2: Final Set Up of the Al-Air Battery (a) Front View (b)Back View 24
Figure 3.3: Final Setup of the Al-Copper Battery 25
Figure 3.4: The Preparation of Aluminium Anode in DifferenceSurface Area 25
Figure 3.5: The Preparation of Copper Cathode in DifferenceArea 28
Figure 4.1: Current Comparison between the Al-Air Battery andAl-Carbon Battery with Different Surface Area of Aluminium Anode at time = 1 min 35
Figure 4.2: Current Comparison between the Al-Carbon Batteryand Al-Copper Battery with Different Surface Area
of Aluminium Anode at time = 1 min 36
Figure 4.3: The (a) Reactivity series of metal (b) Standard RedoxPotential of Electrochemical Series 38
Figure 4.4: Depletion Percentages versus Surface Area anode between the Al-Air Battery and Al-Carbon Battery 39

7/16/2019 Study of Aluminium Batteries as Energy Source r(1)
http://slidepdf.com/reader/full/study-of-aluminium-batteries-as-energy-source-r1 15/92
xv
Figure 4.12: Current versus Concentration in DifferentElectrolyte at time = 1 Min in Al-Carbon Battery 47
Figure 4.13: Current versus Concentration in DifferentElectrolyte at time = 1 Min in Al-Copper Battery 48
Figure 4.14: Depletion Percentages of Current versusConcentration in Different Electrolyte in Al-Air Battery 49
Figure 4.15: Depletion Percentages of Current versusConcentration in Different Electrolyte in Al-CarbonBattery 50
Figure 4.16: Depletion Percentages of Current versusConcentration in Different Electrolyte in Al-Copper Battery 50

7/16/2019 Study of Aluminium Batteries as Energy Source r(1)
http://slidepdf.com/reader/full/study-of-aluminium-batteries-as-energy-source-r1 16/92
xvi
LIST OF APPENDICES
APPENDIX TITLE PAGE
A Experiment Data 60

7/16/2019 Study of Aluminium Batteries as Energy Source r(1)
http://slidepdf.com/reader/full/study-of-aluminium-batteries-as-energy-source-r1 17/92
1
CHAPTER 1
1 INTRODUCTION
1.1 Background
Nowadays, households and industrial systems rely on the non-renewable and
unsustainable energy such as fossil fuel to generate energy. Fossil fuels are carbon-

7/16/2019 Study of Aluminium Batteries as Energy Source r(1)
http://slidepdf.com/reader/full/study-of-aluminium-batteries-as-energy-source-r1 18/92
2
Another sustainable chemical energy sources to replace the fossil fuels is
aluminium-batteries (Al-batteries) which is affordable and is environmental friendly.
According to Verma research (1994), the aluminium and zinc are among the cheapest
metal material which cost only $1.66/kg and $1.32/kg respectively. The Figure 1.1
shows the price list of metal on world market.
Table 1.1: The Price List of the Metal (Verma, 1994)
MetalM x 10
- a
(kg/mol)
Qm
($/kg)
Li 6.94 44.150
Na 23.00 2.052
Mg 24.32 2.958
Al 26.97 1.660
Zn 65.38 1.324
(a)M- mol.wt.
(b)Qm-price of metal ($) on world market (1982-1984)

7/16/2019 Study of Aluminium Batteries as Energy Source r(1)
http://slidepdf.com/reader/full/study-of-aluminium-batteries-as-energy-source-r1 19/92
3
compared to zinc anodes. In this way it is economically concerned and enhance of
performance by using aluminium rather than zinc (Cuproban, 2009).
The Al-batteries includes the aluminium-air (Al-air) battery, aluminium-
carbon (Al-carbon) battery and aluminium-copper (Al-copper) battery. In this project,
three types of Al-batteries are set up to compare the performance of each battery.
Figure 1.1: Comparison between Aluminium and Zinc Anodes (Cuproban, 2009)

7/16/2019 Study of Aluminium Batteries as Energy Source r(1)
http://slidepdf.com/reader/full/study-of-aluminium-batteries-as-energy-source-r1 20/92
4
1.3 Objectives of Study
The main objective of this study is to build the most suitable Al-battery under
optimum conditions among the three types of batteries. Thus, in order to do so, the
sub-objectives are listed as below:
1. To determine and investigate the construction an Al-air battery
2. To determine the performance of the Al-batteries with different surface area
of anodes
3. To determine the performance of the Al-batteries with different surface area
of cathodes
4. To determine the performance of Al-batteries in different types of electrolytes
in different concentration.

7/16/2019 Study of Aluminium Batteries as Energy Source r(1)
http://slidepdf.com/reader/full/study-of-aluminium-batteries-as-energy-source-r1 21/92
5
CHAPTER 2
2 LITERATURE REVIEW
2.1 Introduction
As mention in Chapter 1, the Al-batteries are recommended because the aluminum as
the anode material has plenty of advantages. Nevertheless, the cathode material and
the built up method are another parameters that can influence the performance of the
7/16/2019 Study of Aluminium Batteries as Energy Source r(1)
http://slidepdf.com/reader/full/study-of-aluminium-batteries-as-energy-source-r1 22/92
6
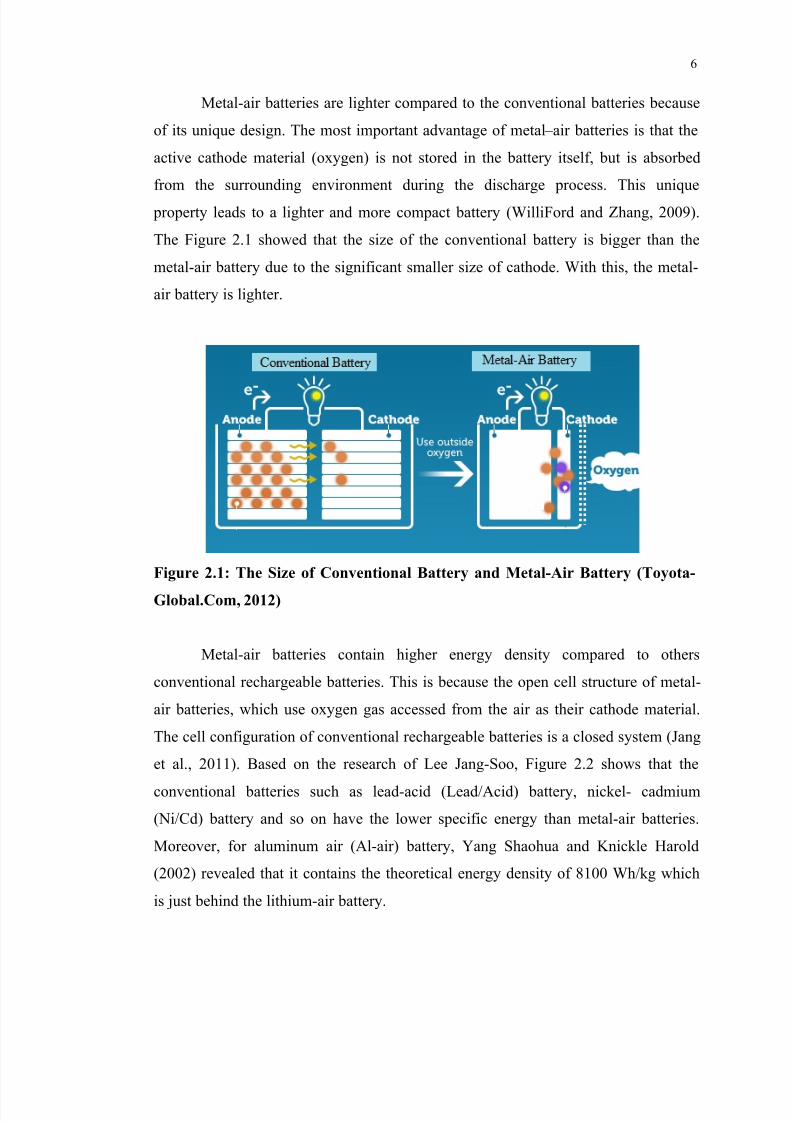
Metal-air batteries are lighter compared to the conventional batteries because
of its unique design. The most important advantage of metal – air batteries is that the
active cathode material (oxygen) is not stored in the battery itself, but is absorbed
from the surrounding environment during the discharge process. This unique
property leads to a lighter and more compact battery (WilliFord and Zhang, 2009).
The Figure 2.1 showed that the size of the conventional battery is bigger than the
metal-air battery due to the significant smaller size of cathode. With this, the metal-
air battery is lighter.

7/16/2019 Study of Aluminium Batteries as Energy Source r(1)
http://slidepdf.com/reader/full/study-of-aluminium-batteries-as-energy-source-r1 23/92
7
Figure 2.2: The Energy Densities of Various Types of Batteries (Jang Et Al.,
2011)
There are several types of metal-air batteries based on different metal speciesat anode. Most metal species including zinc, aluminum, and lithium, are important
and generally utilised in industries due to their high power density. Figure 2.3
provided the comparison of the theoretical energy density among all the metal-air
batteries. It is no doubt that the Li-air battery, Al-air battery and Zn-air battery

7/16/2019 Study of Aluminium Batteries as Energy Source r(1)
http://slidepdf.com/reader/full/study-of-aluminium-batteries-as-energy-source-r1 24/92
8
sensitive to moisture. The other is a water-sensitive system using an electrolyte with
aprotic solvents. This system is degraded by moisture (Jang et al., 2011). Aprotic
solvents such as acetone (CH3COCH3), DMSO (dimethylsulfoxide, CH3SOCH3),
HMPA, can't do H-bonding with the NUC because they have no H covalently
bonded to an electronegative element of the solvent [Jim Hollister]. Based on the
research by Gil Cohn and YairEin-Eli (2010), they utilise aqueous alkaline solutions
due to the high conductivity of such electrolyte and the outstanding ability to regulate
the reduced oxygen ion into hydroxide anions.
The power output of the system is directly related to the concentration and
surface area of both the cathode and the anode. Thus, in order to increase the surface
area of the electrode, the length of the electrode is adjustable. The longer is the
length of the electrode, the higher the surface area of it. Moreover, the distance
between electrodes could be an issue to affect the performance of the cell. Not much
of the reviews is discussing with this topic and in this study is going to investigate
and analyse it (Terre and Haute, 2004).

7/16/2019 Study of Aluminium Batteries as Energy Source r(1)
http://slidepdf.com/reader/full/study-of-aluminium-batteries-as-energy-source-r1 25/92
9
Figure 2.4: The Schematic Diagram of Metal Air Batteries (Cheng and Chen,
2012)
Figure 2.5 showed a typically type of Al-air battery. Al-air battery is
potentially attractive due to integration with aluminium industry, but aluminium-air
batteries have potential for ten to fifteen times the range of lead – acid batteries with a
far smaller total weight, at the cost of substantially increased system complexity. The
electrode reactions for an aluminum-air battery are as follows:
− −

7/16/2019 Study of Aluminium Batteries as Energy Source r(1)
http://slidepdf.com/reader/full/study-of-aluminium-batteries-as-energy-source-r1 26/92
10
2.2.2 Consideration for the Air Cathode
A typical O2-cathode comprised of a carbon black mixed with a polymericbinder.
The porous carbon O2-cathode is required to ensure a large electrolyte/electrode
surface area and accommodate the insoluble discharge product, as well as to facilitate
oxygen diffusion to the reaction site through the cathode film. In addition, the porous
carbon network must provide enough conductivity to deliver electrons to the reaction
site efficiently with low overall impedance. A homogenous distribution of a nano-
sized catalyst may also be required to maximise the performance by increasing the
round trip efficiency by lowering the voltage gap between charge and discharge
processes; however this has been challenged recently as discussed below. An exterior
O2 permeable membrane is required to prevent the ingress of water and carbon
dioxide, whilst still allowing the free passage of oxygen (Laurence and Peter, 2012)
The air cathode is a reactive layer of carbon contained between a nickel grid
current collector and a porous, hydrophobic PTFE film that serves to prevent leakage
of electrolyte. This results in a three-phase contact electrode. Gas, liquid and solid
7/16/2019 Study of Aluminium Batteries as Energy Source r(1)
http://slidepdf.com/reader/full/study-of-aluminium-batteries-as-energy-source-r1 27/92
11
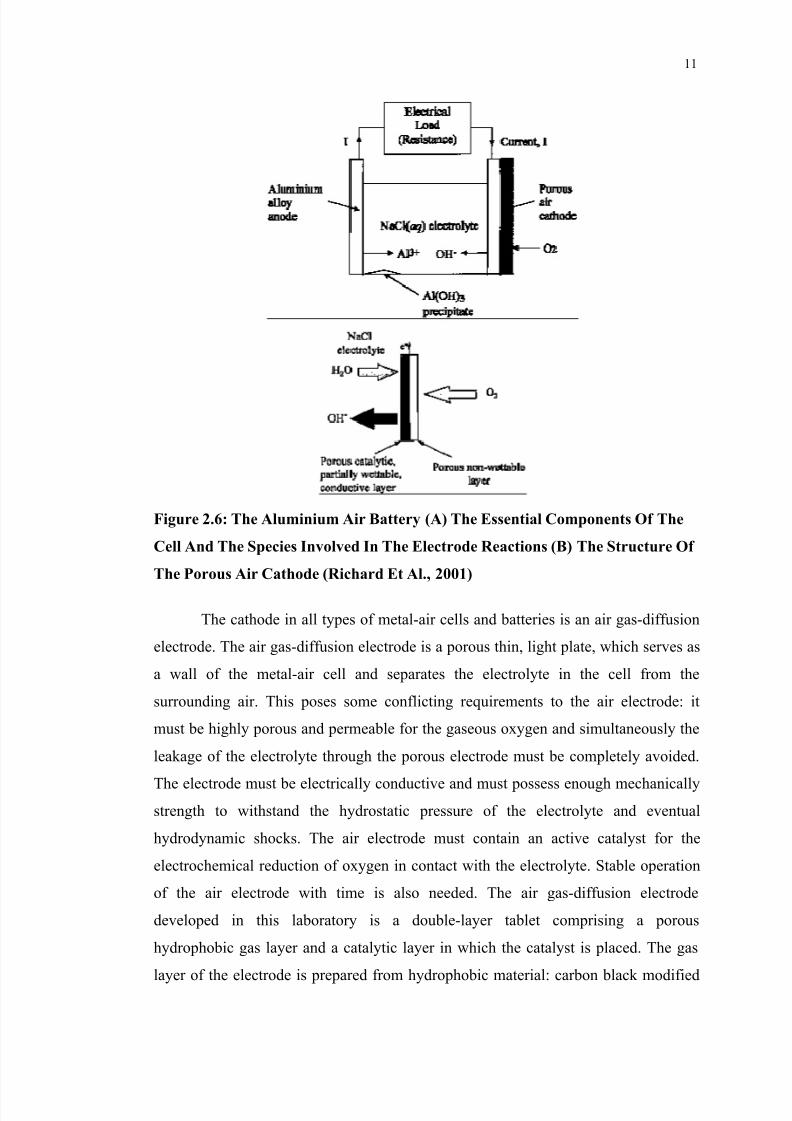
Figure 2.6: The Aluminium Air Battery (A) The Essential Components Of The
Cell And The Species Involved In The Electrode Reactions (B) The Structure Of
7/16/2019 Study of Aluminium Batteries as Energy Source r(1)
http://slidepdf.com/reader/full/study-of-aluminium-batteries-as-energy-source-r1 28/92
12
with PTFE by a special technology. The catalytic layer contains a porous catalyst.
(Anastassia, 2005)
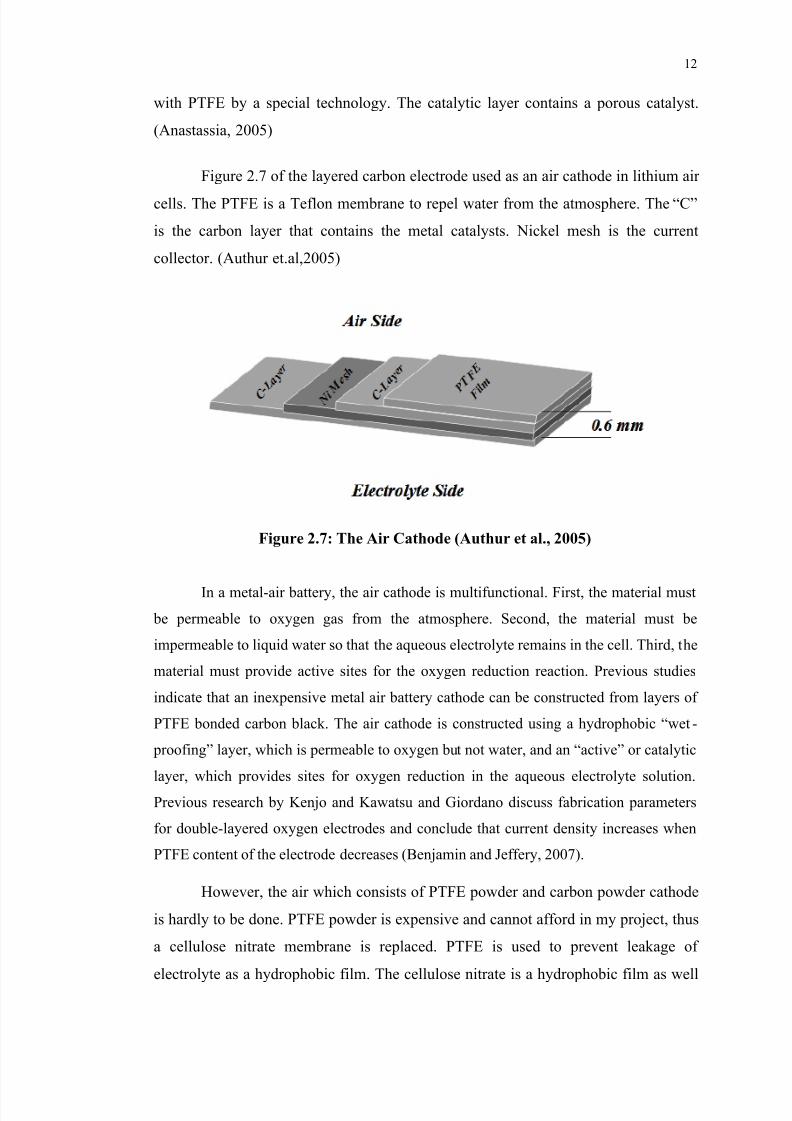
Figure 2.7 of the layered carbon electrode used as an air cathode in lithium air
cells. The PTFE is a Teflon membrane to repel water from the atmosphere. The “C”
is the carbon layer that contains the metal catalysts. Nickel mesh is the current
collector. (Authur et.al,2005)
Figure 2.7: The Air Cathode (Authur et al., 2005)

7/16/2019 Study of Aluminium Batteries as Energy Source r(1)
http://slidepdf.com/reader/full/study-of-aluminium-batteries-as-energy-source-r1 29/92
13
but in a cheaper price and thus, cellulose nitrated is applied. The technical
specification of cellulose nitrate is shown in Table 2.1.
Table 2.1: Technical Specification of Cellulose Nitrate
Technical Specification Cellulose Nitrate
Pore size 0.2 m
Thermal resistance 130 max
Thickness acc. 115-145 m
The carbon cathode is being further discussed and explained in Section 2.3.2
which is porous and conductive double layer carbon tape.
2.2.3 Advantages and Disadvantages of Metal-Air Batteries
Metal-air batteries are the most compact and potentially, the least expensive batteries
available. They are environmentally benign (Electricity Storage Association [ESA],
2011).
7/16/2019 Study of Aluminium Batteries as Energy Source r(1)
http://slidepdf.com/reader/full/study-of-aluminium-batteries-as-energy-source-r1 30/92
14
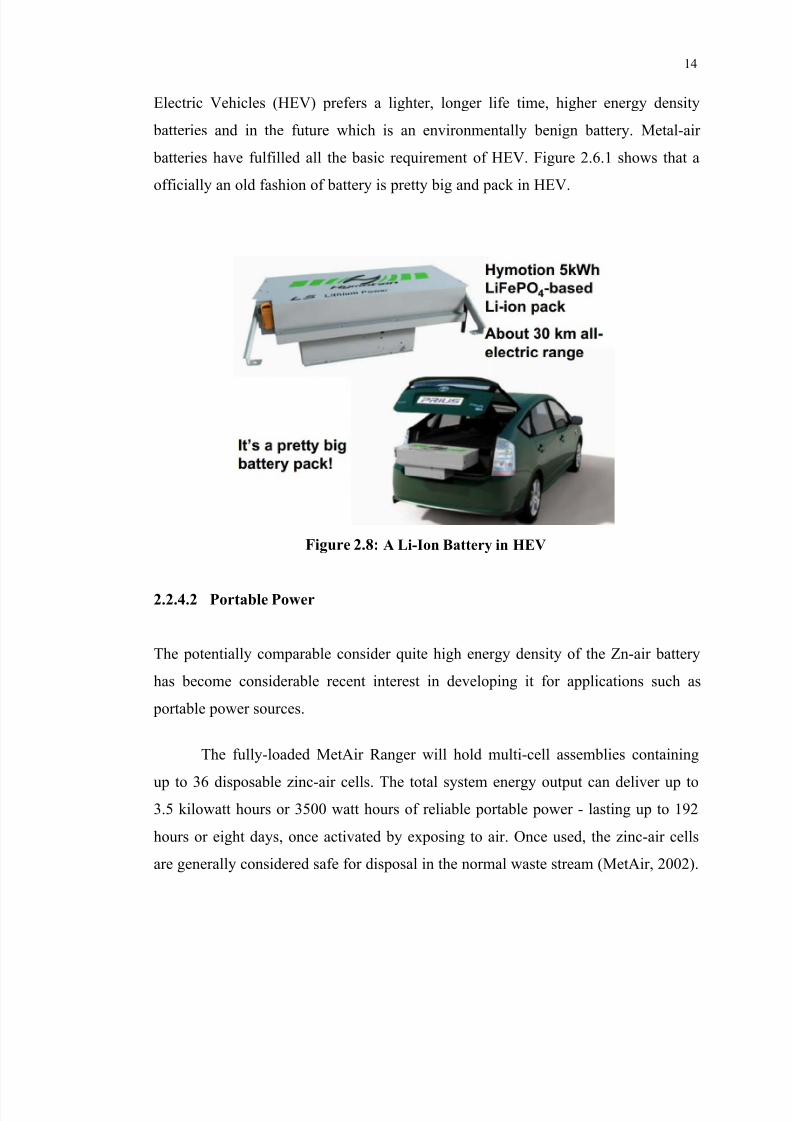
Electric Vehicles (HEV) prefers a lighter, longer life time, higher energy density
batteries and in the future which is an environmentally benign battery. Metal-air
batteries have fulfilled all the basic requirement of HEV. Figure 2.6.1 shows that a
officially an old fashion of battery is pretty big and pack in HEV.
Figure 2.8: A Li-Ion Battery in HEV

7/16/2019 Study of Aluminium Batteries as Energy Source r(1)
http://slidepdf.com/reader/full/study-of-aluminium-batteries-as-energy-source-r1 31/92
15
2.3 Aluminium-Carbon Battery (Al-Carbon Battery)
The Al-Carbon battery is an electrochemical cell that the aluminium is oxidized in
the anode whereas hydrogen ion is reduced to become hydrogen gas in the cathode
site. The application of electrochemical cells in portable power sources has been the
subject of extensive investigation. Apart from the obvious advantages of serving as
localized power sources, electrochemical cells provide pollution-free conversion of
chemical to electrical energy that is direct and, therefore, does not involve an
intervening heat cycle. This considerably increases the efficiency of the power
sources (Verma, 1994).
This redox reaction produced the current flow from cathode to anode. The
difference between the Al-carbon battery and Al-air battery is the set up method. The
cathode of the Al-air battery is exposed to the air on one side and another side is
being contact with the electrolyte. However, the cathode of Al-carbon battery is fully
dipped into the electrolyte to undergo the redox reaction.

7/16/2019 Study of Aluminium Batteries as Energy Source r(1)
http://slidepdf.com/reader/full/study-of-aluminium-batteries-as-energy-source-r1 32/92
16
Figure 2.9: The Setup Of Al-Carbon Battery (1) Solution (2) Graphite Cathode
(3) Aluminium Anode (4) Pyrex Glass Beaker (5) Milliameter (6) Resistance Box,
Millivoltmeter (Verma, 1994)
The electrode reactions for an Al-carbon battery are as follows:
7/16/2019 Study of Aluminium Batteries as Energy Source r(1)
http://slidepdf.com/reader/full/study-of-aluminium-batteries-as-energy-source-r1 33/92
17
electrode is to be used, the recess is packed with a paste that contains carbon
particles, and then the paste is carefully polished to a smooth disk-shaped surface.
Working with a carbon paste electrode is technically more demanding because the
paste can be gouged inadvertently after being polished [Pine Instrument Company,
2000]
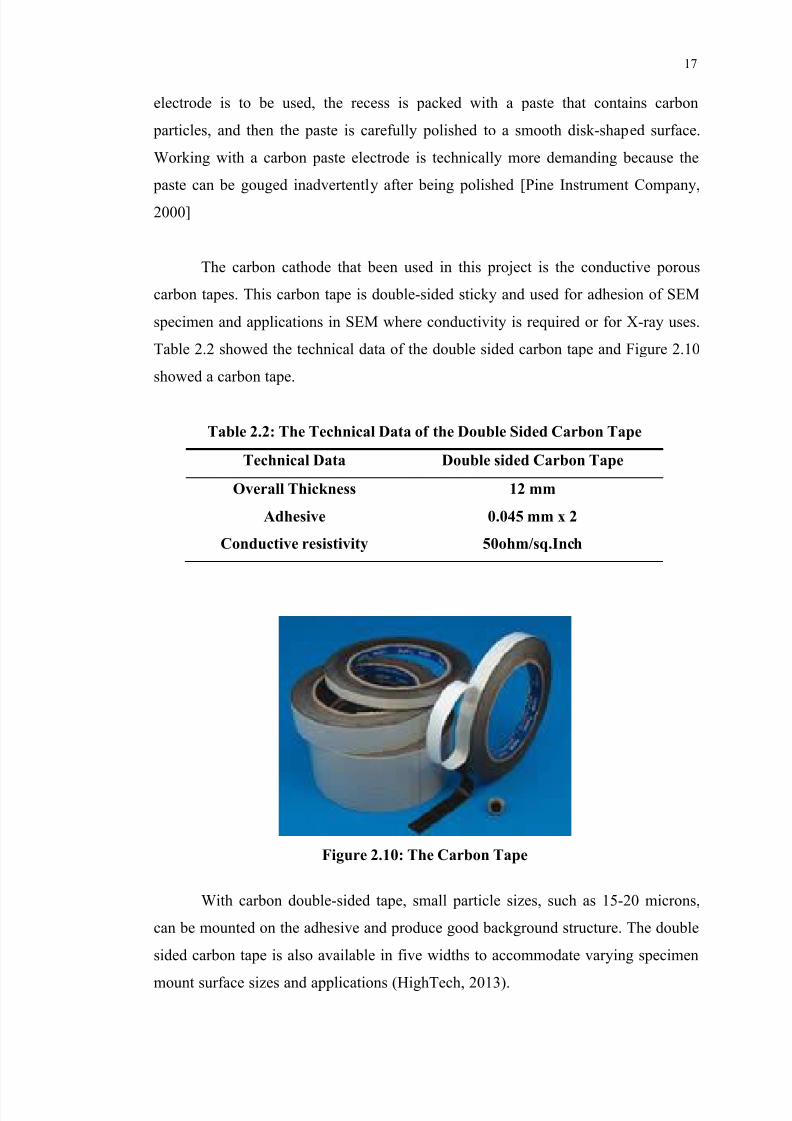
The carbon cathode that been used in this project is the conductive porous
carbon tapes. This carbon tape is double-sided sticky and used for adhesion of SEM
specimen and applications in SEM where conductivity is required or for X-ray uses.
Table 2.2 showed the technical data of the double sided carbon tape and Figure 2.10
showed a carbon tape.
Table 2.2: The Technical Data of the Double Sided Carbon Tape
Technical Data Double sided Carbon Tape
Overall Thickness 12 mm
Adhesive 0.045 mm x 2
Conductive resistivity 50ohm/sq.Inch

7/16/2019 Study of Aluminium Batteries as Energy Source r(1)
http://slidepdf.com/reader/full/study-of-aluminium-batteries-as-energy-source-r1 34/92
18
2.3.3 Advantages and Disadvantages of Al-Carbon Battery
The advantages of the Al-carbon battery are mentioned in the Chapter 2.3. There are
pollution-free to environment and efficiency of the power sources. However, it is
found that activation polarization is the main factor that limits the current output
when using an untreated carbon electrode (Verma, 1994).
2.4 Aluminium-Copper Battery (Al-Copper Battery)
Al-Copper Battery is an electrochemical cell. Oxidation-reduction or redox reactions
take place in electrochemical cells. There are two types of electrochemical cells. The
redox reaction in a galvanic cell is a spontaneous reaction. For this reason, galvanic
cells are commonly used as batteries. Galvanic cell reactions supply energy which is
used to perform work. The energy is harnessed by situating the oxidation and
reduction reactions in separate containers, joined by an apparatus that allows
electrons to flow (About.com 2003).
7/16/2019 Study of Aluminium Batteries as Energy Source r(1)
http://slidepdf.com/reader/full/study-of-aluminium-batteries-as-energy-source-r1 35/92
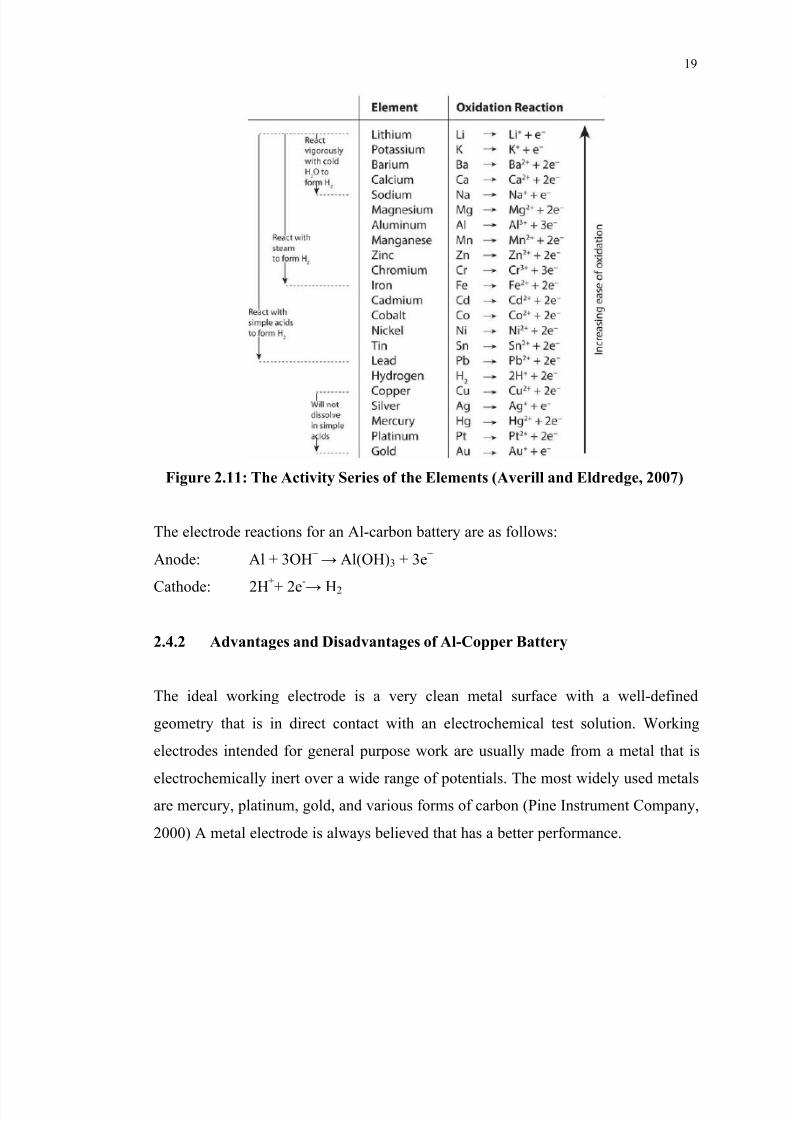
19
Figure 2.11: The Activity Series of the Elements (Averill and Eldredge, 2007)
The electrode reactions for an Al-carbon battery are as follows:
− −

7/16/2019 Study of Aluminium Batteries as Energy Source r(1)
http://slidepdf.com/reader/full/study-of-aluminium-batteries-as-energy-source-r1 36/92
20
2.5 Depletion of Current
2.5.1 Overpotential
The deviation from equilibrium causes an electrical potential difference between the
polarized and the equilibrium (unpolarised) electrode potential known as
overpotential. There are two types of overpotetial, cathodic overpotential and anodic
overpotential which shown in Equation 2.1 and Equation 2.2.
Cathodic Overpotential, ηc = E – Eoc< 0 (2.1)
Anodic Overpotentialm, ηa = E – Eoa> 0 (2.2)
Where
Eoc = Equilibrium potential for cathodic reaction, V
Eoa = Equilibrium potential for anodic reaction, V
E = Real potential, V
7/16/2019 Study of Aluminium Batteries as Energy Source r(1)
http://slidepdf.com/reader/full/study-of-aluminium-batteries-as-energy-source-r1 37/92
21
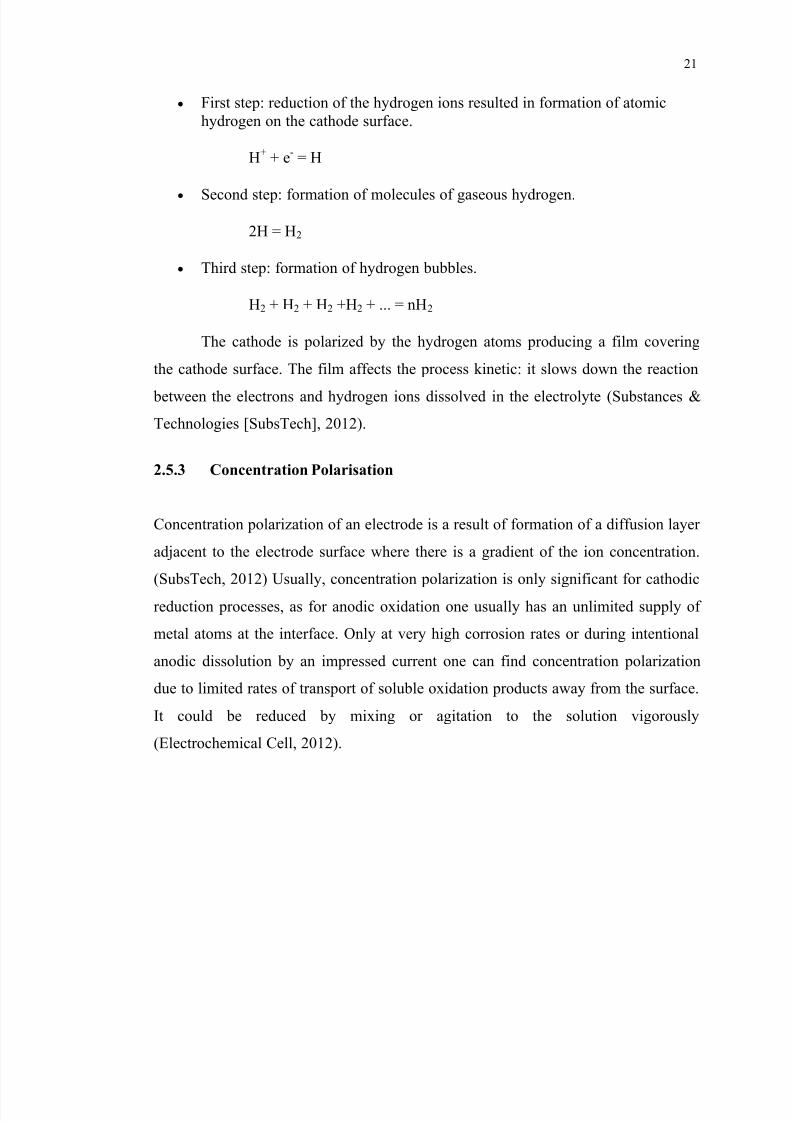
First step: reduction of the hydrogen ions resulted in formation of atomichydrogen on the cathode surface.
H+ + e- = H
Second step: formation of molecules of gaseous hydrogen.
2H = H2
Third step: formation of hydrogen bubbles.
H2 + H2 + H2 +H2 + ... = nH2
The cathode is polarized by the hydrogen atoms producing a film covering
the cathode surface. The film affects the process kinetic: it slows down the reaction
between the electrons and hydrogen ions dissolved in the electrolyte (Substances &
Technologies [SubsTech], 2012).
2.5.3 Concentration Polarisation
Concentration polarization of an electrode is a result of formation of a diffusion layer
adjacent to the electrode surface where there is a gradient of the ion concentration.

7/16/2019 Study of Aluminium Batteries as Energy Source r(1)
http://slidepdf.com/reader/full/study-of-aluminium-batteries-as-energy-source-r1 38/92
22
CHAPTER 3
3 METHODOLOGY
3.1 Background
The main objective of this project is to compare the performances of Al-air battery,
Al-carbon battery and Al-copper battery. The performance of the Al-batteries fully
depends on the parameters of the experiment setup condition. The experiment

7/16/2019 Study of Aluminium Batteries as Energy Source r(1)
http://slidepdf.com/reader/full/study-of-aluminium-batteries-as-energy-source-r1 39/92
23
3.2 Experiment Setup
Different Al-battery has different setup method. In this Section, the fabrication
method of each battery is explained.
3.2.1 Al-Air Battery
In order to allow one side of the air cathode to be exposed toair and the other in
contact with an electrolyte, a container with a hole (5cm x 8cm) on one side for
fabrication of an air cathode is used. 40 cm2 of carbon tape was prepared, which is
shown in Figure 3.1 to cover the hole of the container. The cellulose nitrate which
replaces the PTFE is applied on it to prevent leakage of the solution. The round-
shaped cellulose nitrate is cut into squares to ensure that every surface of the carbon
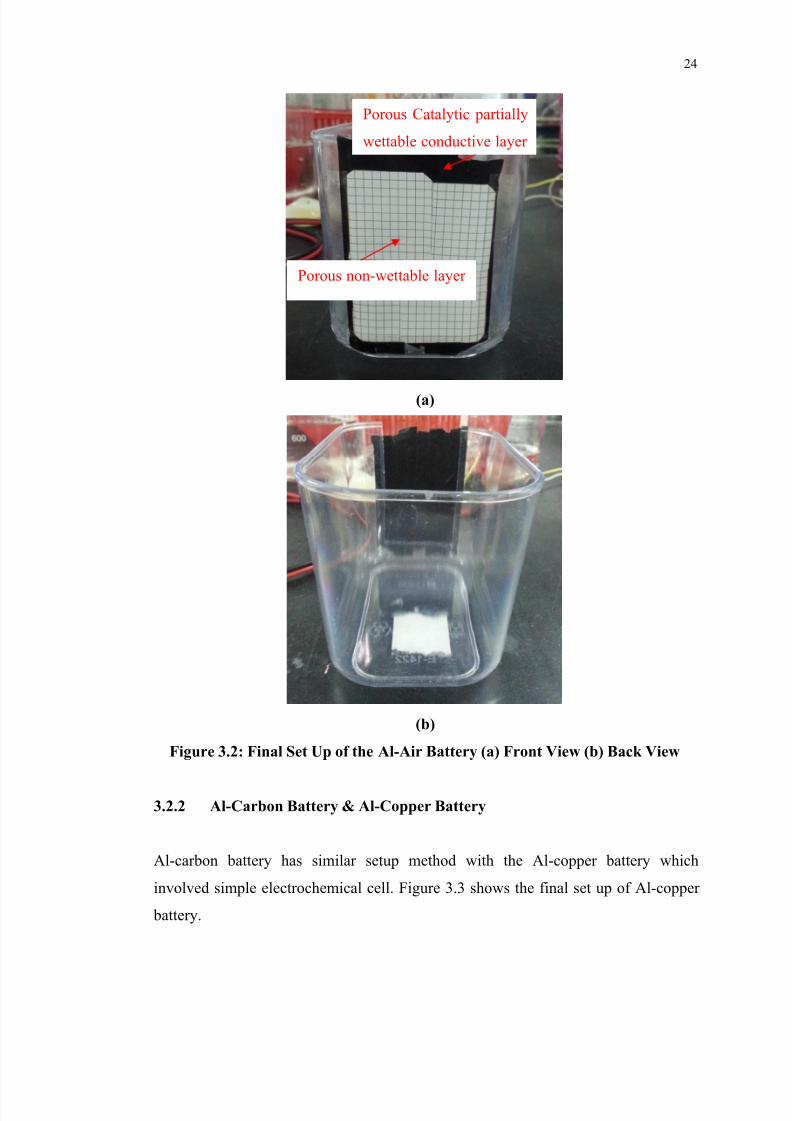
cathode is covered to prevent leakage. Figure 3.2 shows the final setup of the Al-air
battery. This air cathode of Al-air battery is built without catalyst.
7/16/2019 Study of Aluminium Batteries as Energy Source r(1)
http://slidepdf.com/reader/full/study-of-aluminium-batteries-as-energy-source-r1 40/92
24
(a)
Porous non-wettable layer
Porous Catalytic partially
wettable conductive layer

7/16/2019 Study of Aluminium Batteries as Energy Source r(1)
http://slidepdf.com/reader/full/study-of-aluminium-batteries-as-energy-source-r1 41/92
25
Figure 3.3: Final Setup of the Al-Copper Battery
In Figure 3.3, the solution is placed in the beaker and the distance between the
electrodes is fixed at 12 cm.
3.3 Experiments Parameters
3.3.1 Surface Area of Anode

7/16/2019 Study of Aluminium Batteries as Energy Source r(1)
http://slidepdf.com/reader/full/study-of-aluminium-batteries-as-energy-source-r1 42/92
26
3.3.1.1 Comparison Between Al-Air Battery and Al-Carbon Battery
Comparisons between Al-air battery and Al-carbon battery were conducted to
compare the difference in different surface area of anode.
Fixed Variables:
1. 250 ml of 1M Sodium chloride (NaCl)
2. 12 cm distance between the electrodes
3. Cathode : 5 cm2 (250 ml) carbon (Al-air) and 5 cm2 carbon (Al-carbon)
Table 3.1: Summary of Comparison between Al-Air and Al-Carbon battery
Comparison
Between
Anode
(aluminium)
Surface Area
Fixed Cathode Surface Area
Al-air battery
&
16 cm2
24 cm2 5 cm2 (250 ml) carbon (Al-air)
2

7/16/2019 Study of Aluminium Batteries as Energy Source r(1)
http://slidepdf.com/reader/full/study-of-aluminium-batteries-as-energy-source-r1 43/92
27
Table 3.2: Summary of Comparison between Al-Carbon and Al-Copper battery
ComparisonBetween
Anode
(aluminium)
Surface Area
Fixed Cathode Surface Area
Al-carbon battery
&
Al-copper battery
16 cm2
24 cm2
35.2 cm2
40 cm2
80 cm2
29.7 cm2 carbon (Al-carbon)
29.7 cm2 copper (Al-copper)
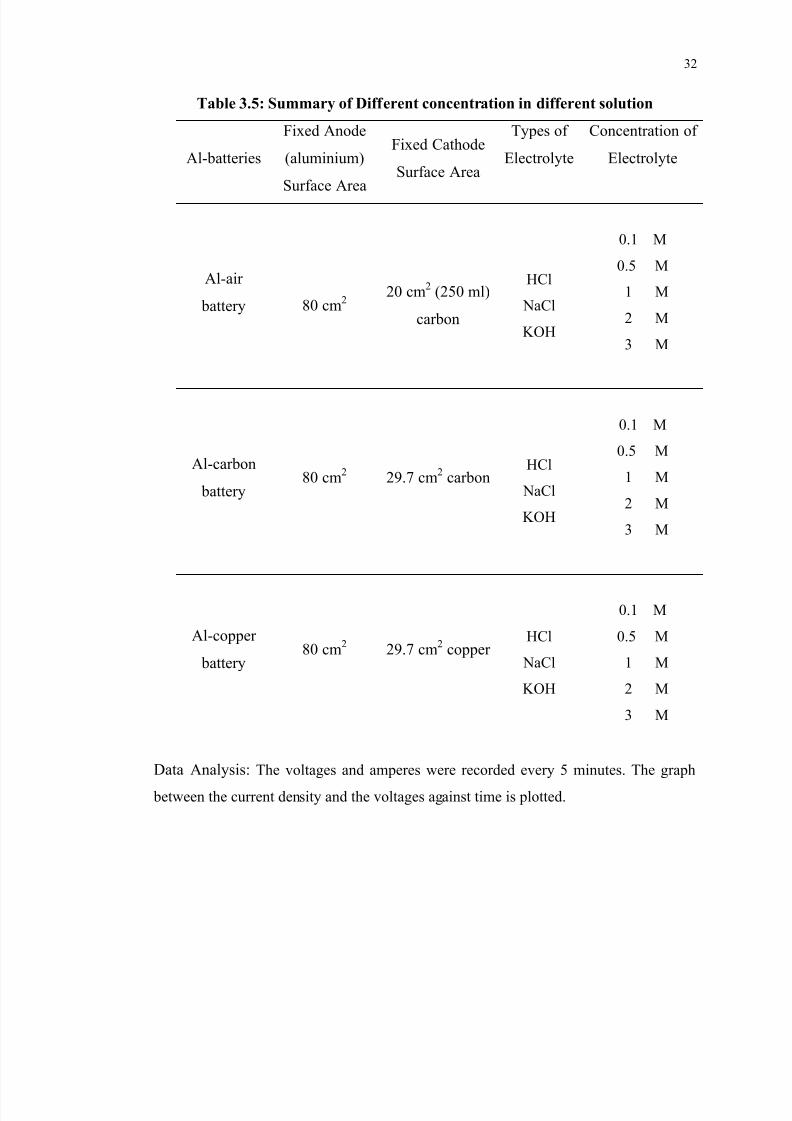
Data Analysis: The voltages and amperes were recorded every 5 minutes. The graph
between the current density and the voltages against time is plotted.
3.3.2 Surface Area of Cathode
The surface area of the cathodes will affect the amperage of the battery and different

7/16/2019 Study of Aluminium Batteries as Energy Source r(1)
http://slidepdf.com/reader/full/study-of-aluminium-batteries-as-energy-source-r1 44/92
28
Table 3.3: Summary of Comparison between Al-Air and Al-Carbon battery
ComparisonBetween
Fixed Anode
(aluminium)
Surface Area
Carbon Cathode Surface Area
Al-air battery
&
Al-carbon battery
80 cm2
5 cm2
10 cm2
15 cm2
20 cm2
25 cm2
Data Analysis: The voltages and amperes were recorded every 5 minutes. The graph
between the current density and the voltages against time is plotted.
3.3.2.2 Comparison between Al-Carbon Battery and Al-Copper Battery
The surface areas of the carbon tape cathode prepared are 14.85 cm 2, 29.7 cm2, 44.55
cm2, 59.4 cm2 and 74.25 cm2 as well. The surface area of a copper cathode is 14.85
2
29

7/16/2019 Study of Aluminium Batteries as Energy Source r(1)
http://slidepdf.com/reader/full/study-of-aluminium-batteries-as-energy-source-r1 45/92
29
Fixed Variables:
1. 1 M Sodium chloride (NaCl)
2. 12 cm between the electrode
3. 80 cm2Aluminium anode
Table 3.4: Summary of Comparison between Al-Carbon and Al-Copper battery
Comparison
Between
Fixed Anode
(aluminium)
Surface Area
Cathode Surface Area
Al-carbon battery
&
Al-copper battery 80 cm2
14.85 cm2
29.7 cm2
44.55 cm2
59.4 cm2
74.25 cm2
Data Analysis: The voltages and amperes were recorded every 5 minutes. The graph
30

7/16/2019 Study of Aluminium Batteries as Energy Source r(1)
http://slidepdf.com/reader/full/study-of-aluminium-batteries-as-energy-source-r1 46/92
30
and KOH is highly exothermic, and the resulting heat may cause heat burns or ignite
flammables. Thus, all direct contact with organic tissue including human skin, eyes
and mouth must be avoided. Secondly, there are several materials that must be kept
away from this substance. One of the substances is aluminum. Any contact with
aluminum must be avoided because the combination of aluminum and NaOH results
in a large production of hydrogen gas as shown in the equation below:
2Al(s) + 6NaOH (aq) → 3H2 (g) + 2Na3AlO3 (aq).
Hydrogen gas is explosive and combustible, any ignition or fire might lead to
an explosion in the experiment lab. Therefore, the aluminum must be kept away from
NaOH and KOH at all times. The others substance is the strong acids which must not
be placed with strong base. Furthermore, NaOH should not come in contact with
nitroaromatic, nitroparaffinic or organohalogen compounds.
Thirdly, as mentioned earlier the alkaline reacts with metals like aluminum,
tin and zinc. Thus, it must not be transported in aluminum containers plus it also
reacts with glass. Hence, glass containers are not suitable for prolonged storage of
31
7/16/2019 Study of Aluminium Batteries as Energy Source r(1)
http://slidepdf.com/reader/full/study-of-aluminium-batteries-as-energy-source-r1 47/92
31
3.3.4 Different Concentration of Solution
Different types of aqueous solution were used to carry out the experiment to find out
the best performance of the system among the electrolytes in different concentrations.
Five concentrations of KOH, NaOH and HCl were prepared where the
concentrations were 0.1 M, 0.5 M, 1 M, 2 M and 3 M respectively.
Fixed Variables:
1. 250 ml of solution
2. 12 cm between the electrode
3. 80 cm2 of aluminium anode
4. 20 cm2(250ml) of carbon cathode ( Al-air battery)
29.7 cm2 of carbon cathode (Al-carbon battery)
29.7 cm2 of copper cathode (Al-copper battery)
32
7/16/2019 Study of Aluminium Batteries as Energy Source r(1)
http://slidepdf.com/reader/full/study-of-aluminium-batteries-as-energy-source-r1 48/92
32
Table 3.5: Summary of Different concentration in different solution
Al-batteries
Fixed Anode
(aluminium)
Surface Area
Fixed Cathode
Surface Area
Types of
Electrolyte
Concentration of
Electrolyte
Al-air
battery 80 cm2 20 cm2
(250 ml)
carbon
HCl
NaCl
KOH
0.1 M
0.5 M
1 M
2 M
3 M
Al-carbon
battery80 cm2
29.7 cm2 carbon HCl
NaCl
KOH
0.1 M0.5 M
1 M
2 M
3 M
33

7/16/2019 Study of Aluminium Batteries as Energy Source r(1)
http://slidepdf.com/reader/full/study-of-aluminium-batteries-as-energy-source-r1 49/92
33
3.4 Calculation of the Analysis
3.4.1 Depletion Percentage
The Depletion Percentage (D %) is used to determine the stability of the cell. The
experimental value (voltages and current) is calculated to determine if it has any
depletion. The Depletion Percentage is defined as:
Where
V s = value start ( t = 1 min)V f = value end ( t = 30 min)
If the depletion percentage is a negative value, it means that there is not
depletion but increasing of the current.
34

7/16/2019 Study of Aluminium Batteries as Energy Source r(1)
http://slidepdf.com/reader/full/study-of-aluminium-batteries-as-energy-source-r1 50/92
34
CHAPTER 4
4 RESULTS AND DISCUSSION
4.1 Background
The experiments were conducted and the results were recorded and discussed in this
chapter. The parameters that affected the performance of the battery as mentioned in
Chapter 3 were discussed in this chapter. The parameters which will be discussed for
35

7/16/2019 Study of Aluminium Batteries as Energy Source r(1)
http://slidepdf.com/reader/full/study-of-aluminium-batteries-as-energy-source-r1 51/92
4.2.1 Current at Time = 1 min
4.2.1.1 Comparison between Al-Air Battery and Al-Carbon Battery
Figure 4.1 showed the current comparison between the Al-Air battery and Al-carbon
battery using different surface area of aluminium anode. Both of the batteries were
conducted with fixed cathode surface area (5 cm2) of carbon cathode. The results
show that the current increased as the surface area of anode increased.
430
520
750780
3 4
4
5.1
5.9
7.1
3.5
4
4.5
5
5.5
6
6.5
7
7.5
250
350
450
550
650
750
850
C u r r
e n t o f A l - a i r b a t t e r y
( µ A )
C u r r e n t o f A l - C a r b o n
b a t t e r y
( µ A )
Al-Carbon Battery
36

7/16/2019 Study of Aluminium Batteries as Energy Source r(1)
http://slidepdf.com/reader/full/study-of-aluminium-batteries-as-energy-source-r1 52/92
4.2.1.2 Comparison between Al-Carbon Battery and Al-Copper Battery
The Figure 4.2 showed the current comparison between the Al-carbon battery and
Al- copper battery. Both of the batteries were conducted with the 29.7 cm2 of carbon
cathode. The Al-copper battery had a higher current as opposed to Al-carbon battery.
1.892.54
3.42
3.49
3.552.76
3.5
4.9
6.1
10.5
0
2
4
6
8
10
12
0 20 40 60 80 100
C u r r e n t ( m A )
Anode Area (cm2)
Al-Carbon Battery
Al Copper Battery
37

7/16/2019 Study of Aluminium Batteries as Energy Source r(1)
http://slidepdf.com/reader/full/study-of-aluminium-batteries-as-energy-source-r1 53/92
4.2.1.3 Discussion on Current and Voltage at Time = 1min Findings
The surface area of the electrodes will affect the number of ions that can be lost or
gained at the same time. If the surface area of the anode is greater, there will be more
aluminum ion and electron being produced in anode. Therefore, with greater surface
area more reactions may occur at the same time and thus increase the current show.
Theoretically the voltage of the batteries is not affected by the surface area of
electrode. The voltage of the Al-batteries is only determined by the potential between
two electrodes. According to the standard redox potential in Figure 4.3, the
equilibrium of Al-air battery theoretically occur at 2.06V and the Al-carbon battery
and Al-copper battery have the potential of 1.66 V. However, the measurement in
practice revealed a lesser potential difference which shown in Table 4.1. This
overpotential was occurred due to loss of voltage through polarisation. The
overpotential and the resistive potential drop across the cell must be established to
allow the reaction proceeds. They represented wasted energy.
38

7/16/2019 Study of Aluminium Batteries as Energy Source r(1)
http://slidepdf.com/reader/full/study-of-aluminium-batteries-as-energy-source-r1 54/92
Figure 4.3: The Standard Redox Potential of Electrochemical Series
39
7/16/2019 Study of Aluminium Batteries as Energy Source r(1)
http://slidepdf.com/reader/full/study-of-aluminium-batteries-as-energy-source-r1 55/92
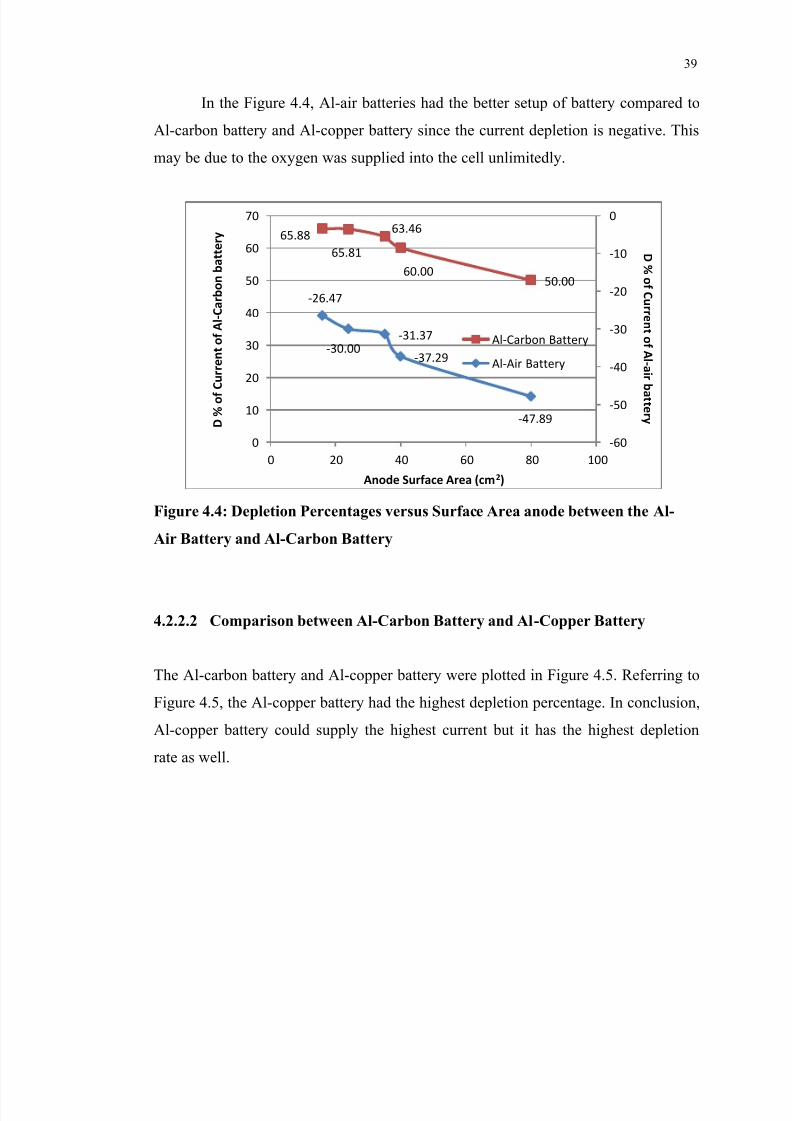
In the Figure 4.4, Al-air batteries had the better setup of battery compared to
Al-carbon battery and Al-copper battery since the current depletion is negative. This
may be due to the oxygen was supplied into the cell unlimitedly.
Figure 4.4: Depletion Percentages versus Surface Area anode between the Al-
Air Battery and Al-Carbon Battery
65.88
65.81
63.46
60.0050.00
-26.47
-30.00-31.37
-37.29
-47.89
-60
-50
-40
-30
-20
-10
0
0
10
20
30
40
50
60
70
0 20 40 60 80 100
D % o f C u r r e n t o f A l - a i r b a t t e r y
D %
o f C u r r e n t o f A l - C a r b
o n b a t t e r y
Anode Surface Area (cm2)
Al-Carbon Battery
Al-Air Battery
40

7/16/2019 Study of Aluminium Batteries as Energy Source r(1)
http://slidepdf.com/reader/full/study-of-aluminium-batteries-as-energy-source-r1 56/92
Figure 4.5: Depletion Percentages versus Surface Area of anode between the Al-
Carbon Battery and Al-Copper Battery
4.2.2.3 Discussion on Current Depletion Percentage Findings
For all the three Al-batteries current depletion percentage decrease when the surface
60.14492754
54.28571429
51.02040816
44.26229508
40.95238095
42.32804233
36.22047244
35.96491228
34.67048711 30.70422535
25
30
35
40
45
50
55
60
65
70
0 20 40 60 80 100
D % o f C u r r e n t
Anode Surface Area (cm2)
Al-Copper Battery
Al-Carbon Battery
41

7/16/2019 Study of Aluminium Batteries as Energy Source r(1)
http://slidepdf.com/reader/full/study-of-aluminium-batteries-as-energy-source-r1 57/92
4.3 Surface Area of Cathode
The different surface area of carbon cathode was prepared in the experiments; they
were 5 cm2, 10 cm2, 14.85 cm2, 15cm2, 20 cm2and 25 cm2, 29.7 cm2, 44.55 cm2, 59.4
cm2and 74.25 cm2.
4.3.1 Investigation on New and Recycle Copper Cathode
An extra experiment has been conducted to test if a recycled copper will give a
different result from a new copper. This is because the copper has a higher cost if
conduct the experiments with a new copper. The result was shown in the Figure 4.6
that the recycled copper gave a lower current depletion percentage (D %) than the
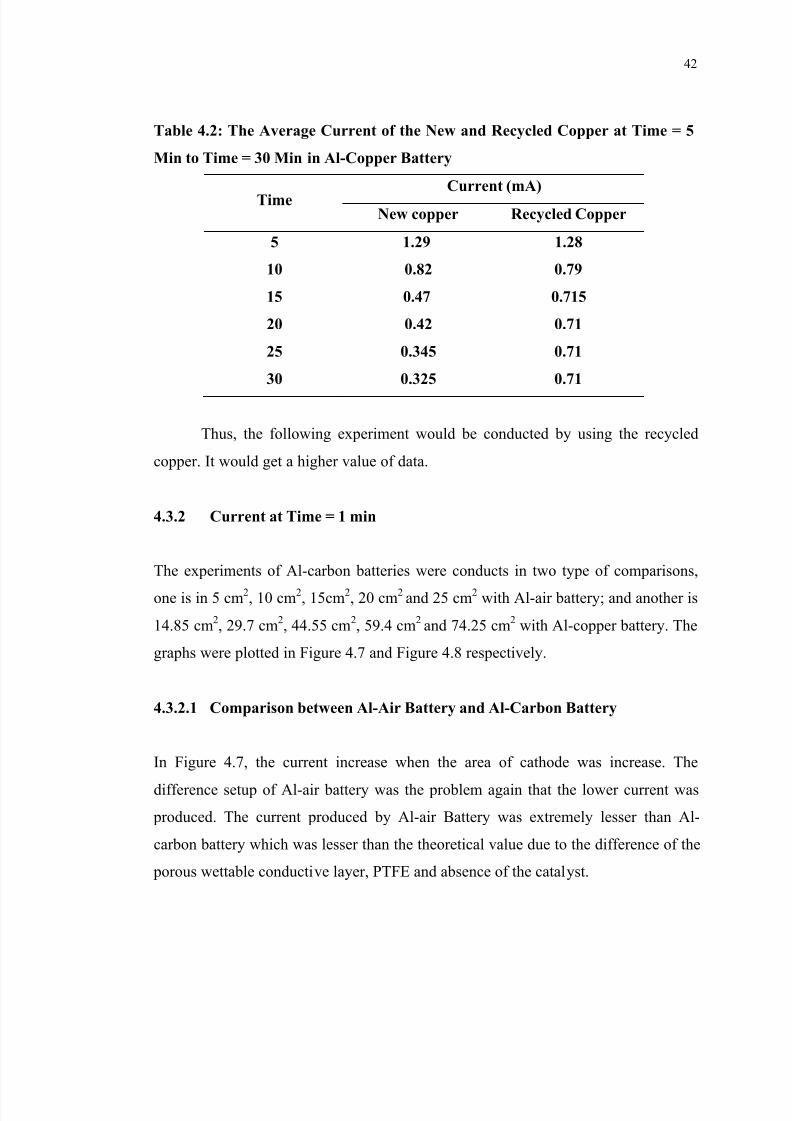
new copper. The higher current D % of the new copper might be caused by theactivation of the copper surface. For recycled copper, the current would be likely
constant afterwards which shown in Table 4.2. The current is almost the same for the
new and recycled copper which around 1.28 mA at time = 5min. However, the new
copper will deplete to almost 0.325 mA at time = 30 min whereas the recycled
42
7/16/2019 Study of Aluminium Batteries as Energy Source r(1)
http://slidepdf.com/reader/full/study-of-aluminium-batteries-as-energy-source-r1 58/92
Table 4.2: The Average Current of the New and Recycled Copper at Time = 5
Min to Time = 30 Min in Al-Copper Battery
TimeCurrent (mA)
New copper Recycled Copper
5 1.29 1.28
10 0.82 0.79
15 0.47 0.715
20 0.42 0.71
25 0.345 0.71
30 0.325 0.71
Thus, the following experiment would be conducted by using the recycled
copper. It would get a higher value of data.
4.3.2 Current at Time = 1 min
43

7/16/2019 Study of Aluminium Batteries as Energy Source r(1)
http://slidepdf.com/reader/full/study-of-aluminium-batteries-as-energy-source-r1 59/92
Figure 4.7: Current Comparison between the Al-Air Battery and Al-Carbon
Battery in Different Surface Area of Cathode
4.3.2.2 Comparison between Al-Carbon Battery and Al-Copper Battery
In Figure 4.8, the current increased as the area of cathode was increased. It revealed
that the Al-copper battery had a higher current as opposed to Al-carbon battery This
8801500
3500
5900
8500
7
10.6
15.2
20.9
31.7
0
5
10
15
20
25
30
35
0
1000
2000
3000
4000
5000
6000
7000
8000
9000
0 5 10 15 20 25 30
C u r r e n t o f A l - a i r b a t t e r y
( µ A )
C u r r e n t o f A l - C a r b o n b a t t
e r y
( µ A )
Cathode Area (cm2)
Al-Carbon Battery
Al-Air Battery
44

7/16/2019 Study of Aluminium Batteries as Energy Source r(1)
http://slidepdf.com/reader/full/study-of-aluminium-batteries-as-energy-source-r1 60/92
4.3.2.3 Discussion on Current at Time = 1 min
As same mentioned above (section 4.2), the higher the surface area of electrode
would give a higher value of current as with greater surface area more reactions may
occur at the same time and thus increase the current show. In this case, the surface
area of cathode increases and allows more electron being react with the cathode
material, and thus the current increases.
4.3.3 Current Depletion Percentage
The current depletion percentage against surface area of cathode between the Al-
carbon battery and Al-air battery were plotted in Figure 4.9 whereas between the Al-
carbon battery and Al-copper battery were plotted in Figure 4.10.
4.3.3.1 Comparison between Al-Air Battery and Al-Carbon Battery
Referring to Figure 4.9, in the cases of Al-air battery, the depletion percentage of the
45

7/16/2019 Study of Aluminium Batteries as Energy Source r(1)
http://slidepdf.com/reader/full/study-of-aluminium-batteries-as-energy-source-r1 61/92
Figure 4.9: Depletion Percentages versus Surface Area of Cathode between the
Al-Air Battery and Al-Carbon Battery
4.3.3.2 Comparison between Al-Carbon Battery and Al-Copper Battery
The Figure 4.10 shows that the high anode surface area will lead to a lower depletion
percentage The Al-copper battery has slightly higher depletion percentage than Al-
67.05
52.67
45.7142.37
38.82
-50.00
-58.96 -64.14-67.94
-71.92
-80
-70
-60
-50
-40
-30
-20
-10
0
0
10
20
30
40
50
60
70
80
0 5 10 15 20 25 30
D
% o f C u r r e n t o f A l - a i r b a t t e r y
D % o f
C u r r e n t o f A l - C a r b o n b a t t e r y
Cathode Area (cm2)
Al-Carbon Battery
Al-Air Battery
46

7/16/2019 Study of Aluminium Batteries as Energy Source r(1)
http://slidepdf.com/reader/full/study-of-aluminium-batteries-as-energy-source-r1 62/92
4.3.3.3 Discussion on Current Depletion Percentage Findings
By comparing the Figure 4.9 and Figure 4.10, the Al-batteries were concluded that
the depletion was decreased as the increase of the surface area of cathode which had
mentioned in section 4.2. This phenomenon might happen because the higher surface
area of cathode allowed more aluminum ion and electron being produced in anode
and react with the cathode material at the same time. The current was produced
almost at the same rate as the time over 30 minutes, and thus, the depletion of the battery was inhibited. Thus, the 25 cm2 of carbon cathode was preferred.
4.4 Types of Solution in Different Concentration
Three types of solutions were being chosen to be the electrolyte: strong acid, neutraland strong base. They are hydroxide chloride (HCl), sodium chloride (NaCl), and
potassium peroxide (KOH). These solutions were prepared in 0.1 M, 0.5 M, 1 M, 2
M and 3 M.
47
7/16/2019 Study of Aluminium Batteries as Energy Source r(1)
http://slidepdf.com/reader/full/study-of-aluminium-batteries-as-energy-source-r1 63/92
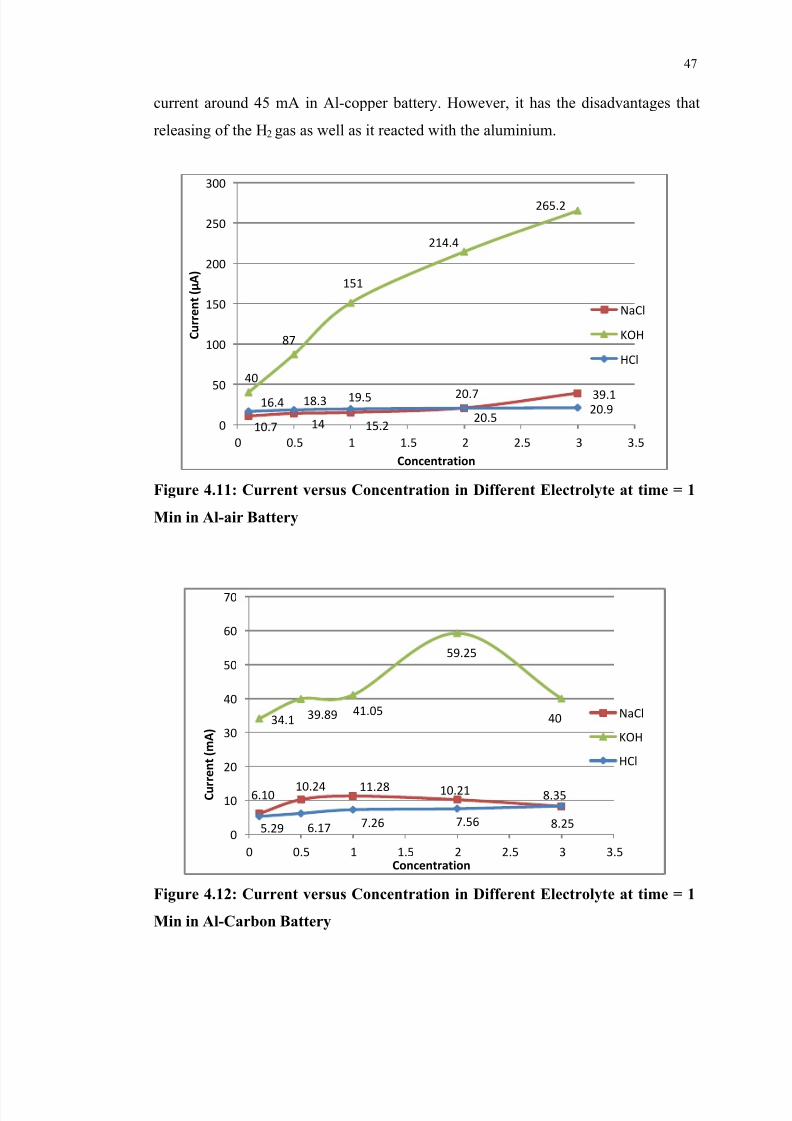
current around 45 mA in Al-copper battery. However, it has the disadvantages that
releasing of the H2 gas as well as it reacted with the aluminium.
Figure 4.11: Current versus Concentration in Different Electrolyte at time = 1
Min in Al-air Battery
10.7 14 15.2
20.7 39.1
40
87
151
214.4
265.2
16.4 18.3 19.5
20.520.9
0
50
100
150
200
250
300
0 0.5 1 1.5 2 2.5 3 3.5
C u r r e n t
( µ A )
Concentration
NaCl
KOH
HCl
48

7/16/2019 Study of Aluminium Batteries as Energy Source r(1)
http://slidepdf.com/reader/full/study-of-aluminium-batteries-as-energy-source-r1 64/92
Figure 4.13: Current versus Concentration in Different Electrolyte at time = 1
Min in Al-Copper Battery
4.4.2 Voltages
The voltages of the cell were not affected as the concentration increased.
Eff f i l f ll i ll Id ll f ld i i
9.75
14.07
19.09
20.11
23.51
4.3 6.1
10.9 12.5
17
15.1
20.89
24.89
40.12
43.56
0
5
10
15
20
25
30
35
40
45
50
0 0.5 1 1.5 2 2.5 3 3.5
C u r r e n t ( m A )
Concentration
HCl
NaCl
KOH
49

7/16/2019 Study of Aluminium Batteries as Energy Source r(1)
http://slidepdf.com/reader/full/study-of-aluminium-batteries-as-energy-source-r1 65/92
4.4.3 Current Depletion Percentages
Figure 4.14, Figure 4.15, and Figure 4.16 presented the current depletion percentagesversus concentration in different concentration in Al-Batteries. It concluded that the
depletion percentages of current were decreased with the concentration of the
electrolyte. The more concentrate of the electrolyte, the lesser is the depletion of the
current in the cell. However, the experiment of 2 M and 3 M of HCl could not be
carried out for 30 minutes due to the corrosion of the aluminium anode in the HClelectrolyte. The aluminium would break and detach from the crocodile clips, and at
the same time a large amount of H2 gas was produced.
However, in Figure 4.15, the depletion percentage was increased in 3 M of
electrolytes (NaCl and KOH) because concentrated solutions are less well ionisedand this factor may reduce the conductivity.
-10
0 0.5 1 1.5 2 2.5 3 3.5
Concentration
50

7/16/2019 Study of Aluminium Batteries as Energy Source r(1)
http://slidepdf.com/reader/full/study-of-aluminium-batteries-as-energy-source-r1 66/92
Figure 4.15: Depletion Percentages of Current versus Concentration in
Different Electrolyte in Al-Carbon Battery
75.25
64.06
79.52
70.62
78.18
42.23
39.3634.91 32.59
59.33
63.71 62.07 61.57
20
30
40
50
60
70
80
90
0 0.5 1 1.5 2 2.5 3 3.5
D %
o f C u r r e n t
Concentration
NaCl
KOH
HCl
51 16
60
51

7/16/2019 Study of Aluminium Batteries as Energy Source r(1)
http://slidepdf.com/reader/full/study-of-aluminium-batteries-as-energy-source-r1 67/92
4.5 Parameters of Best Performance
The experiments were repeated again in the best condition to get the voltage andcurrent value. The sample calculation was shown as below. The Table 4.3, Table 4.4
and Table 4.5 were the result of the battery in the best condition.
Table 4.3: Current and Voltages of Al-Air Battery with 80 cm2
of AluminiumAnode and 25 cm
2of Carbon Cathode in 3 M KOH.
Time
Current
(µA) Voltages (V)
1369.2 0.595
5417.5 0.604
10445.6 0.626
15492.8 0.641
20517.5 0.652
52
7/16/2019 Study of Aluminium Batteries as Energy Source r(1)
http://slidepdf.com/reader/full/study-of-aluminium-batteries-as-energy-source-r1 68/92
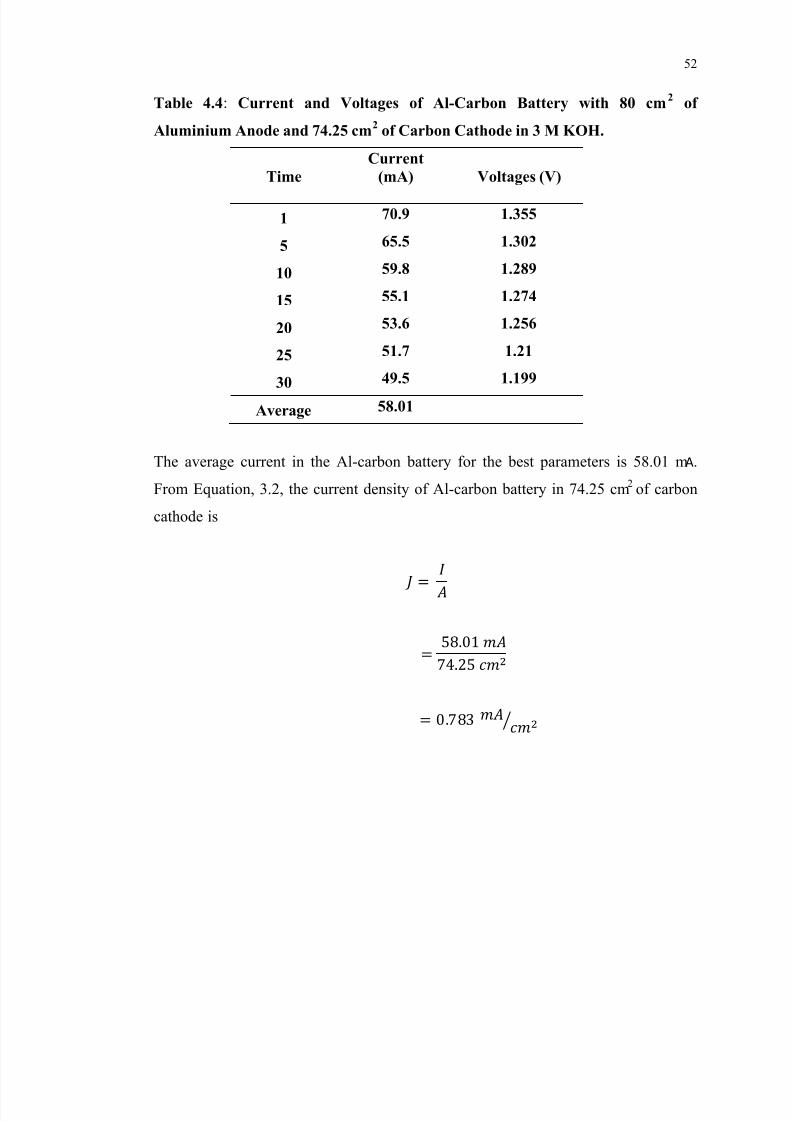
Table 4.4: Current and Voltages of Al-Carbon Battery with 80 cm2
of
Aluminium Anode and 74.25 cm2
of Carbon Cathode in 3 M KOH.
TimeCurrent
(mA) Voltages (V)
1 70.9 1.355
5 65.5 1.302
10 59.8 1.289
15 55.1 1.274
20 53.6 1.256
25 51.7 1.21
30 49.5 1.199
Average 58.01
The average current in the Al-carbon battery for the best parameters is 58.01 mA.
From Equation, 3.2, the current density of Al-carbon battery in 74.25 cm2 of carbon
cathode is
53
2
7/16/2019 Study of Aluminium Batteries as Energy Source r(1)
http://slidepdf.com/reader/full/study-of-aluminium-batteries-as-energy-source-r1 69/92
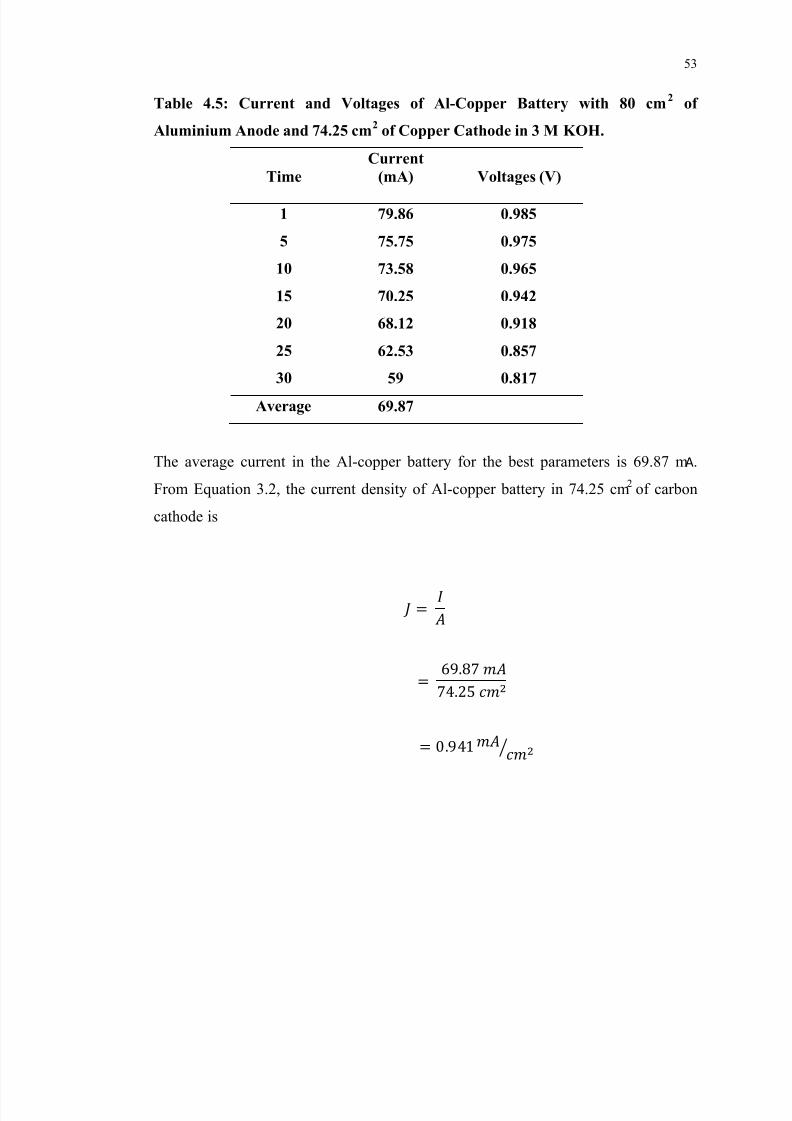
Table 4.5: Current and Voltages of Al-Copper Battery with 80 cm2
of
Aluminium Anode and 74.25 cm2
of Copper Cathode in 3 M KOH.
TimeCurrent
(mA) Voltages (V)
1 79.86 0.985
5 75.75 0.975
10 73.58 0.965
15 70.25 0.94220 68.12 0.918
25 62.53 0.857
30 59 0.817
Average 69.87
The average current in the Al-copper battery for the best parameters is 69.87 mA.
From Equation 3.2, the current density of Al-copper battery in 74.25 cm2 of carbon
cathode is
54

7/16/2019 Study of Aluminium Batteries as Energy Source r(1)
http://slidepdf.com/reader/full/study-of-aluminium-batteries-as-energy-source-r1 70/92
Table 4.6: The Specification Parameters of the Best Performance in Al-Batteries
Specification Technical Value
Anode Surface Area 80cm2
Cathode Surface Area
Al-air battery
25 cm2
Al-carbon battery 74.25 cm2
Al-copper battery 74.25 cm2
Electrolyte KOH
Concentration 3 M
Voltages induced
Al-air battery
0.595 V to 0.675 V
Al-carbon battery 1.199 V to 1.355 V
Al-copper battery 0.817 V to 0.985 V
Current Density
Al-air battery
⁄
Al-carbon battery 0.783 ⁄
Al-copper battery 0.941 ⁄
55
7/16/2019 Study of Aluminium Batteries as Energy Source r(1)
http://slidepdf.com/reader/full/study-of-aluminium-batteries-as-energy-source-r1 71/92
CHAPTER 5
5 CONCLUSIONS AND RECOMMENDATIONS
5.1 Conclusions
Among the three types of batteries, Al-copper battery has the best performance
because it has the highest current density, 0.941 mA/cm2. The Al-air battery
theoretically should have the highest current density but due to the difference
hydrophobic membrane used in the experiment and the absence of catalyst might
56
5 2 R d ti

7/16/2019 Study of Aluminium Batteries as Energy Source r(1)
http://slidepdf.com/reader/full/study-of-aluminium-batteries-as-energy-source-r1 72/92
5.2 Recommendations
The Al- batteries’ voltage could be increased in the following method. The magnitude
of electrode potential depends on the following factors as well. There is (i) Nature of
the electrode (ii) Concentration of the ions in solution, (iii) Temperature.
[Transtutors.com, 2013] It is fulfilling the Nernst equation. The Nernst equation will
have to be applied under nonstandard conditions:
where
Ecell = nonstandard cell potential, V
E˚cell = standard cell potential, V
R = 8.314 J/mol·K
T = temperature, K
n = moles of electrons transferred
57

7/16/2019 Study of Aluminium Batteries as Energy Source r(1)
http://slidepdf.com/reader/full/study-of-aluminium-batteries-as-energy-source-r1 73/92
REFERENCES
Abraham, K. M., 2008. A Brief History of Non-aqueous Metal-Air Batteries A Brief
History of Non-aqueous Metal-Air Batteries [Online]. Available at:
http://ecst.ecsdl.org/content/3/42/67.full.pdf+ [Accessed: 26
th
December 2012]
Anastassia, K., 2005. Metal-Air Batteries: Research, Development, Application
[Online]. Available at:http://www.bas.bg/cleps/poemes/workshops/Proceedings2/Proceedings/L1_A.Kaisheva.pdf [Accessed 20 February 2013]
Angel, C., 2007. Introduction to Electrochemistry [Online]. Available at:
http://bouman.chem.georgetown.edu/S02/lect25/lect25.htm [Accessed 3September 2012]
Arai, H. and Hayashi, M., 2009. Primary Batteries – Aqueous Systems | Zinc – Air
[Online]. Available at:http://www.sciencedirect.com.libezp.utar.edu.my/science/article/pii/B9780444527455001015 [Accessed 27 October 2012]
58
air battery [Online] Available at: http://ac els cdn com/S001346860600199X/1

7/16/2019 Study of Aluminium Batteries as Energy Source r(1)
http://slidepdf.com/reader/full/study-of-aluminium-batteries-as-energy-source-r1 74/92
air battery [Online].Available at: http://ac.els-cdn.com/S001346860600199X/1-s2.0-S001346860600199X-main.pdf?_tid=aa6bbe82-99a3-11e2-bc0d-00000aacb35e&acdnat=1364694079_62c41d149e6857e732a726ea9238aadd[Acc
essed 21 February 2013] Jang,S.L., Sun,T. K.,Cao,R. G., Choi, N.S., Liu,M.L., Lee,K.T.,and Cho, J., 2011,
Metal – Air Batteries with High Energy Density: Li – Air versus Zn – Air [Online].Available at:http://www.google.com.my/url?sa=t&rct=j&q=&esrc=s&source=web&cd=1&cad=rja&ved=0CC8QFjAA&url=http%3A%2F%2Fwww.researchgate.net%2Fpublication%2F227985366_MetalAir_Batteries_with_High_Energy_Density_LiAir_ver sus_ZnAir%2Ffile%2F79e4150bc00683d6b1.pdf&ei=el2IUdiNOs_NrQeIyICwB
g&usg=AFQjCNFDI3nIgYhbtGSlZoKDsWyDjY9D0g&bvm=bv.45960087,d.bmk [Accessed 15 November 2012]
Keith, F. and Anthony, F., 1979 October. Metal/Air Batteries: Their Status And
Potential - A Review [Online]. Available at:
http://193.146.160.29/gtb/sod/usu/$UBUG/repositorio/10301212_Blurton.pdf [Accessed 26 February 2013]
Konstantin, I., Miomir, G. and Predrag, M., 2011. Current Density Distribution In
Electrochemical Cells [Online]. Available at:http://electrochem.cwru.edu/encycl/art-d03-curr-distr.htm[Accessed 12 November 2012]
Lan, C., Chin, T., Lin, P. and Perng, T., 2005. Zn-Al alloy as a new anode-metal of
i i b tt [O li ] A il bl t
59
00000aacb361&acdnat=1364695025 0674e6545c30f0854f793aadf7892c2e

7/16/2019 Study of Aluminium Batteries as Energy Source r(1)
http://slidepdf.com/reader/full/study-of-aluminium-batteries-as-energy-source-r1 75/92
00000aacb361&acdnat=1364695025_0674e6545c30f0854f793aadf7892c2e[Accessed 20 January 2013]
Verma, L.K., 1994. Studies on an aluminium-carbon cell [Online]. Available at:http://www.sciencedirect.com/science/article/pii/0378775394019053 [Accessed28 March 2013]
Zhang, J., Wang, D., Xu, W., Xiao, J., and Williford, R., 2010. Ambient operation of
Li/Air batteries [Online]. Available at:http://www.sciencedirect.com.libezp.utar.edu.my/science/article/pii/S0378775310000777 [Accessed 26 February 2012]
Zhang, X., 2009. Secondary Batteries – Metal-Air Systems | Zinc – Air: Hydraulic
Recharge [Online]. Available at:http://www.sciencedirect.com.libezp.utar.edu.my/science/article/pii/B978044452745500099X [Accessed 15 December 2012]
60
APPENDICES

7/16/2019 Study of Aluminium Batteries as Energy Source r(1)
http://slidepdf.com/reader/full/study-of-aluminium-batteries-as-energy-source-r1 76/92
APPENDIX A: EXPERIMENTS DATA
Figure A.1 Variation in Surface Area of Anode in Al-air battery
61
Figure A.2 Variation in Surface Area of Cathode in Al-air battery

7/16/2019 Study of Aluminium Batteries as Energy Source r(1)
http://slidepdf.com/reader/full/study-of-aluminium-batteries-as-energy-source-r1 77/92
62
Figure A.3 Variation in concentration of HCl in Al-air battery
7/16/2019 Study of Aluminium Batteries as Energy Source r(1)
http://slidepdf.com/reader/full/study-of-aluminium-batteries-as-energy-source-r1 78/92
63
Figure A.4 Variation in concentration of NaCl in Al-air battery

7/16/2019 Study of Aluminium Batteries as Energy Source r(1)
http://slidepdf.com/reader/full/study-of-aluminium-batteries-as-energy-source-r1 79/92
64
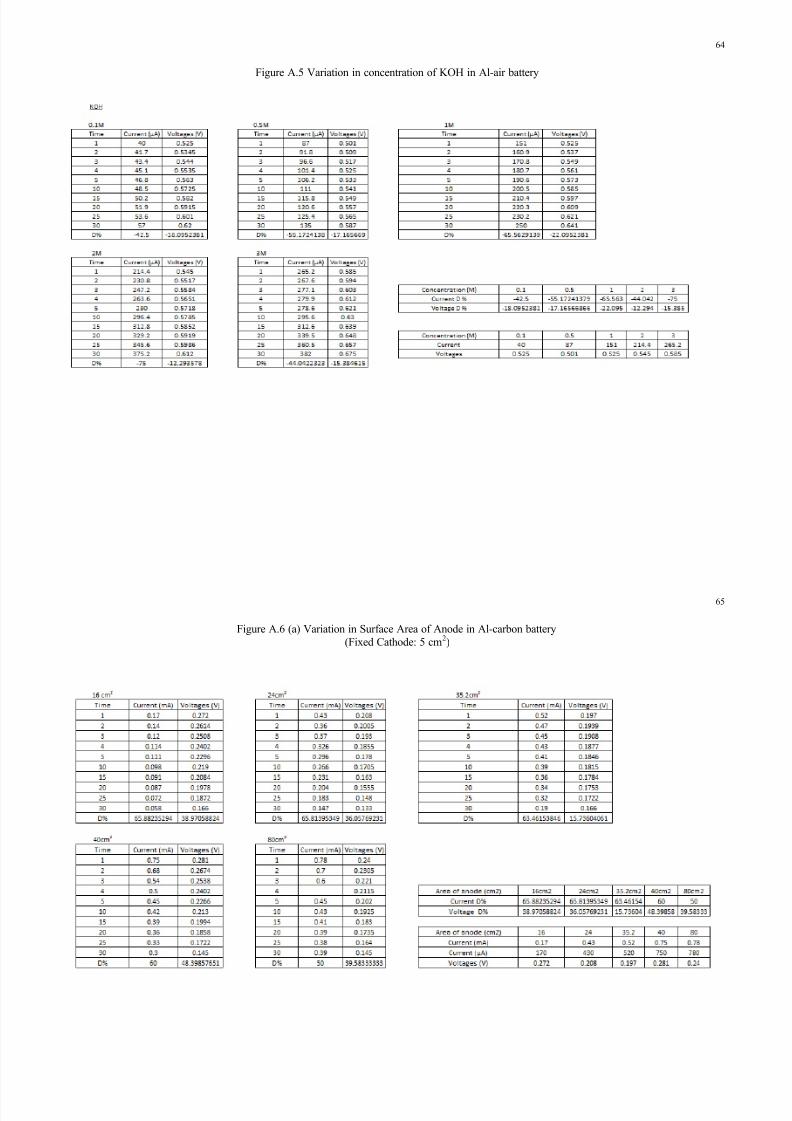
Figure A.5 Variation in concentration of KOH in Al-air battery

7/16/2019 Study of Aluminium Batteries as Energy Source r(1)
http://slidepdf.com/reader/full/study-of-aluminium-batteries-as-energy-source-r1 80/92
65
Figure A.6 (a) Variation in Surface Area of Anode in Al-carbon battery(Fixed Cathode: 5 cm2)
7/16/2019 Study of Aluminium Batteries as Energy Source r(1)
http://slidepdf.com/reader/full/study-of-aluminium-batteries-as-energy-source-r1 81/92
66
Figure A.6 (b) Variation in Surface Area of Anode in Al-carbon battery
(Fixed Cathode: 29 7cm2)

7/16/2019 Study of Aluminium Batteries as Energy Source r(1)
http://slidepdf.com/reader/full/study-of-aluminium-batteries-as-energy-source-r1 82/92
(Fixed Cathode: 29.7cm )
67
Figure A.7 (a) Variation in Surface Area of Cathode in Al-carbon battery

7/16/2019 Study of Aluminium Batteries as Energy Source r(1)
http://slidepdf.com/reader/full/study-of-aluminium-batteries-as-energy-source-r1 83/92
68
Figure A.7 (b) Variation in Surface Area of Cathode in Al-carbon battery

7/16/2019 Study of Aluminium Batteries as Energy Source r(1)
http://slidepdf.com/reader/full/study-of-aluminium-batteries-as-energy-source-r1 84/92
69
Figure A.8 Variation in concentration of HCl in Al-carbon battery

7/16/2019 Study of Aluminium Batteries as Energy Source r(1)
http://slidepdf.com/reader/full/study-of-aluminium-batteries-as-energy-source-r1 85/92
70
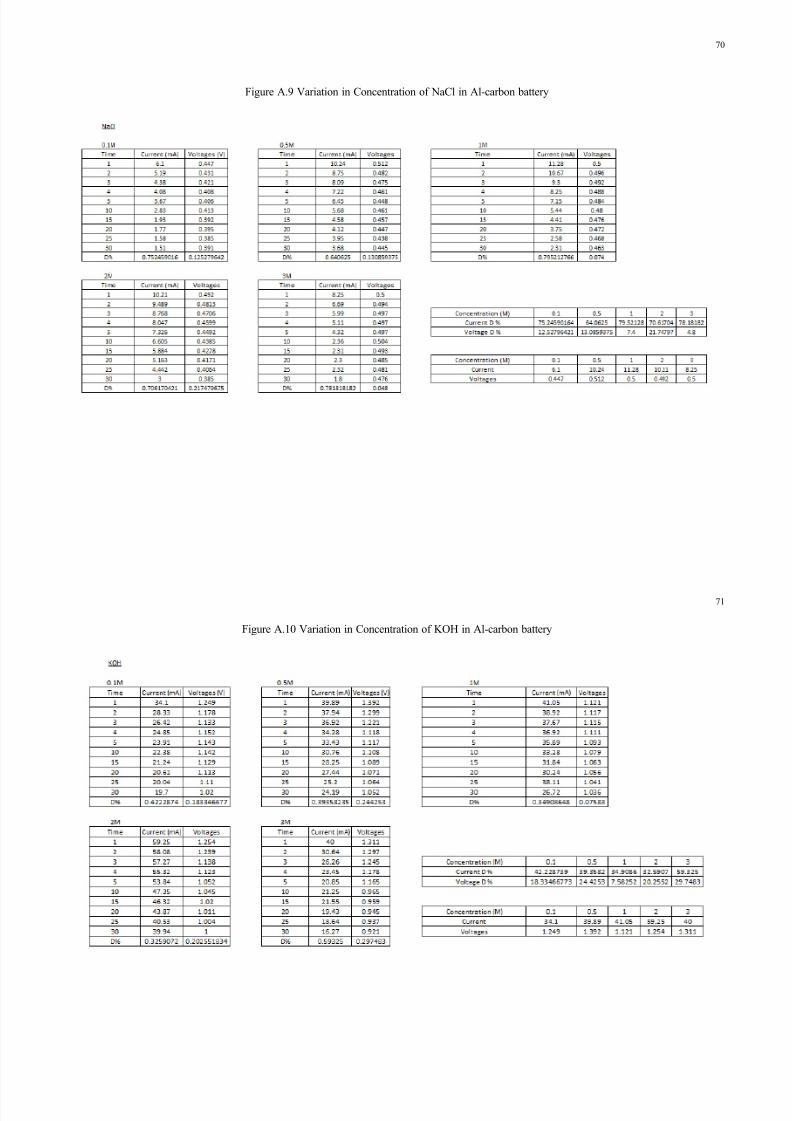
Figure A.9 Variation in Concentration of NaCl in Al-carbon battery

7/16/2019 Study of Aluminium Batteries as Energy Source r(1)
http://slidepdf.com/reader/full/study-of-aluminium-batteries-as-energy-source-r1 86/92
71
Figure A.10 Variation in Concentration of KOH in Al-carbon battery

7/16/2019 Study of Aluminium Batteries as Energy Source r(1)
http://slidepdf.com/reader/full/study-of-aluminium-batteries-as-energy-source-r1 87/92
72
Figure A.11 Variation in Surface area of anode in Al-copper battery

7/16/2019 Study of Aluminium Batteries as Energy Source r(1)
http://slidepdf.com/reader/full/study-of-aluminium-batteries-as-energy-source-r1 88/92
73
Figure A.12 Variation in Surface area of cathode in Al-copper battery

7/16/2019 Study of Aluminium Batteries as Energy Source r(1)
http://slidepdf.com/reader/full/study-of-aluminium-batteries-as-energy-source-r1 89/92
74
Figure A.13 Variation in Concentration of HCl in Al-copper battery

7/16/2019 Study of Aluminium Batteries as Energy Source r(1)
http://slidepdf.com/reader/full/study-of-aluminium-batteries-as-energy-source-r1 90/92
75
Figure A.14 Variation in Concentration of HCl in Al-copper battery

7/16/2019 Study of Aluminium Batteries as Energy Source r(1)
http://slidepdf.com/reader/full/study-of-aluminium-batteries-as-energy-source-r1 91/92
76
Fi A 15 V i i i C i f KOH i Al b

7/16/2019 Study of Aluminium Batteries as Energy Source r(1)
http://slidepdf.com/reader/full/study-of-aluminium-batteries-as-energy-source-r1 92/92
Figure A.15 Variation in Concentration of KOH in Al-copper battery