study of effect of windows location on … · windrose diagram defines the direction and speed of...
TRANSCRIPT
http://www.iaeme.com/IJCIET/index.
International Journal of Civil Engineering and Technology (IJCIET)Volume 8, Issue 7, July 2017, pp. Available online at http://www.iaeme.com/IJCIET/issues.ISSN Print: 0976-6308 and ISSN © IAEME Publication
STUDY OF EFFECT OF W
ON VENTILATION BY CF
Asst. Professor, Civil Engineering Department, Jagadambha Col
Lecturer (Sel Grade)
Principal and Professor, Civil Engineering Department, KDK College of Engineering, Nagpur, India
ABSTRACT
For sustainable design of
proper location of inlet and outlet windows, uniform flow is possible at working area.
Tunnel study was performed by researchers to understand the flow patterns. Since
civil engineering structures are of
civil engineering structures. With availability of advance computing hardware and
software, it is possible to model the air flow on desktop computer. Computational
Fluid Dynamics (CFD)has open new doo
problems on computers. Researchers and software developing company has validated
the software with experimental results.
Paper present the air flow pattern inside the room. Autodesk CFD2016 Simulation
tool was used for simulation. Twelve Simulation cases with different inlet and outlet
window location were defined. For every case, air velocity was measured inside room
at working plane. Cumulative air velocity at observation points are compared between
different cases. Simulation case which give maximum circulation of air on working
plane was selected as best alternative. As per simulation result it is found that, if
windows are placed at crossing, then maximum air circulation can be achieved. Air
flow found to be maximum when inlet and outlet windows are placed on opposite
walls. Vector diagrams of air circulation for different cases are helpful to understand
the air flow inside the room.
Key words: Window Location; Ventilation; Computational Fluid Dynamics (CFD); Autodesk CFD.
IJCIET/index.asp 521 [email protected]
International Journal of Civil Engineering and Technology (IJCIET) 2017, pp. 521–531, Article ID: IJCIET_08_07_056
http://www.iaeme.com/IJCIET/issues.asp?JType=IJCIET&VType=8&IType=76308 and ISSN Online: 0976-6316
Scopus Indexed
STUDY OF EFFECT OF WINDOWS LOCATION
ON VENTILATION BY CFD SIMULATION
Prof. Mahesh R. Nalamwar
Asst. Professor, Civil Engineering Department, dambha College of Engineering& Tech., Yavatmal, India
Dr. Dhananjay K.Parbat
Lecturer (Sel Grade), Civil Engineering Department, Govt. Polytechnic, Nagpur, India
Dr. D.P. Singh
Principal and Professor, Civil Engineering Department, KDK College of Engineering, Nagpur, India
For sustainable design of building ventilation plays very important role. With
proper location of inlet and outlet windows, uniform flow is possible at working area.
Tunnel study was performed by researchers to understand the flow patterns. Since
civil engineering structures are of very big scale, there is limitation on tunnel study of
civil engineering structures. With availability of advance computing hardware and
software, it is possible to model the air flow on desktop computer. Computational
has open new doors for researchers to simulate practical
problems on computers. Researchers and software developing company has validated
the software with experimental results.
Paper present the air flow pattern inside the room. Autodesk CFD2016 Simulation
for simulation. Twelve Simulation cases with different inlet and outlet
window location were defined. For every case, air velocity was measured inside room
at working plane. Cumulative air velocity at observation points are compared between
es. Simulation case which give maximum circulation of air on working
plane was selected as best alternative. As per simulation result it is found that, if
windows are placed at crossing, then maximum air circulation can be achieved. Air
ximum when inlet and outlet windows are placed on opposite
walls. Vector diagrams of air circulation for different cases are helpful to understand
the air flow inside the room.
Window Location; Ventilation; Computational Fluid Dynamics (CFD);
asp?JType=IJCIET&VType=8&IType=7
INDOWS LOCATION
D SIMULATION
& Tech., Yavatmal, India
Principal and Professor, Civil Engineering Department,
building ventilation plays very important role. With
proper location of inlet and outlet windows, uniform flow is possible at working area.
Tunnel study was performed by researchers to understand the flow patterns. Since
very big scale, there is limitation on tunnel study of
civil engineering structures. With availability of advance computing hardware and
software, it is possible to model the air flow on desktop computer. Computational
rs for researchers to simulate practical
problems on computers. Researchers and software developing company has validated
Paper present the air flow pattern inside the room. Autodesk CFD2016 Simulation
for simulation. Twelve Simulation cases with different inlet and outlet
window location were defined. For every case, air velocity was measured inside room
at working plane. Cumulative air velocity at observation points are compared between
es. Simulation case which give maximum circulation of air on working
plane was selected as best alternative. As per simulation result it is found that, if
windows are placed at crossing, then maximum air circulation can be achieved. Air
ximum when inlet and outlet windows are placed on opposite
walls. Vector diagrams of air circulation for different cases are helpful to understand
Window Location; Ventilation; Computational Fluid Dynamics (CFD);

Study of Effect of Windows Location on Ventilation by CFD Simulation
http://www.iaeme.com/IJCIET/index.asp 522 [email protected]
Cite this Article: Prof. Mahesh R. Nalamwar, Dr. Dhananjay K. Parbat and Dr. D.P. Singh. Study of Effect of Windows Location on Ventilation by CFD Simulation.International Journal of Civil Engineering and Technology, 8(7), 2017, pp. 521–531. http://www.iaeme.com/IJCIET/issues.asp?JType=IJCIET&VType=8&IType=7
1. INTRODUCTION
For sustainable design of building ventilation plays very important role. With proper location of inlet and outlet windows, uniform flow is possible at working area. Tunnel study was performed by researchers to understand the flow patterns. Since civil engineering structures are of very big scale, there is limitation on tunnel study of civil engineering structures. With availability of advance computing hardware and software, it is possible to model the air flow on desktop computer. Computational fluid dynamics (CFD)has open new doors for researchers to simulate practical problems on computers[1]. Researchers and software developing company validated the software with experimental results[2][3].
Indoor air circulation of heat and air transfer was studied for indoor transformer room at substation in Nanchang City in china. Different design scheme was studied to study the air circulation and heat transfer in indoor substation. Simulation result provide the guidance for design of ventilation system for indoor substation situated in densely populated area[4]. Natural ventilation study by large eddy current was conducted to understand air flow with natural ventilation. Three models were used to study the air flow in building. Depending on speed of air and ventilation system results vary [5].
Air circulation in model room was performed using k-ε Model and large-eddy simulation model. Experimental setup to study the air circulation in full scale model was very expensive. CFD approach is best solution for study of room airflow since it is low cost. It also allow flexibility to study the effect of various parameters on output results. It is found that experimental results and numerical simulation results, matches reasonably[1].
Parametric study was conducted to understand the effect of windows type, orientation and opening size. Correct design of windows, proper orientation and shadow design is important for reduction of energy consumption in building. With over exposure of window for solar radiation, increase the cooling need of building. Optimum design of window will minimize heating and cooling load[6].
Numerical study of interaction of wind and building opens the new branch of engineering named Computational wind engineering. Using FLUENT 5 CFD software, wind effects on tall building was examined. The effect of flow condition around the building was also modeled. k–ε method was used for turbulence model and results are compared with measurements from wind tunnel study. Study results are helpful to understand the effect of development of construction of new towers in city. Because of construction of towers, wind pressure assumed on already constructed building may change. Two modeling method are compared and discussion on results are done[7].
Computational fluid dynamics (CFD) was used to study the ventilation system of health care room. Simulation provide understanding of efficiency, reliability and adequacy of ventilation system. It also provide important suggestions for controlling energy consumption, patients comfort and air quality in room. In case study an actual hospital room was investigated to study the efficiency of ventilation, heating and air-conditioning plant. Considering different events of the patients like coughing or second breathing, three 3D models are prepared and studied. For simulating dispersal of bacteria-carrying droplets, particle tracing and diffusion model was developed [8].

Prof. Mahesh R. Nalamwar, Dr. Dhananjay K. Parbat and Dr. D.P. Singh
http://www.iaeme.com/IJCIET/index.asp 523 [email protected]
Air circulation in room depends on
1. Orientation of inlet window with prevailing wind direction
2. Temperature of inside and outside air[9]
3. Size of inlet and outlet windows[10]
4. Location of inlet and outlet windows[11].
With proper consideration of above parameters, efficient air circulation can be achieved. Energy consumption of electricity can be reduced with proper implementation of windows location in building.
2. WEATHER DATA FOR NAGPUR CITY
Weather Data is sourced for India from Indian Society of Heating, Refrigerating and Air-Conditioning Engineers (ISHRAE)[12]. Standard weather file includes Temperature Data, Humidity Data, Wind Speed, Solar Radiation, Cloud Cover. For simulation of windows location, weather data of wind speed is important. Windrose diagram defines the direction and speed of wind speed from different direction throughout the year. For Nagpur city Average wind speed for summer was found to be 10 km/hr at day time and 4 km/hr at night time[13]. For simulation purpose wind speed of 6 km/hr was considered.
3. METHODOLOGY
Simulation was performed in Autodesk CFD2016[14]. Building model was prepared in Rivet software and imported to CFD software. Twelve different cases are modeled with change in inlet and outlet windows. Following simulation parameters are considered.
Location – Nagpur
Room Size – 4 x 4 m (L/B ratio = 1)
Floor Height – 3m
Windows Size - 1.5 x 1.2
Sill Level - 0.9m
Lintel Level - 2.1 m
Reading observation level - 1.2m
Walls - Brick wall material.
Floor and Roof - Concrete floor and roof.
Boundary Condition - At Inlet window wind, speed of 1.6m/s (6 km/hr)was defined. At outlet window, zero pressure was defined.
Mesh Sizing -Meshing was done with Autosize. As per autosize, 10687 nodes and 39419elements are automatically generated by software.
Solver Settings - In Solution control tab, Intelligent solution control was enabled. In Advection for turbulence air flow, Adv 5 was selected. Turbulence model of k-ε Model was used since the flow of air was with turbulence.
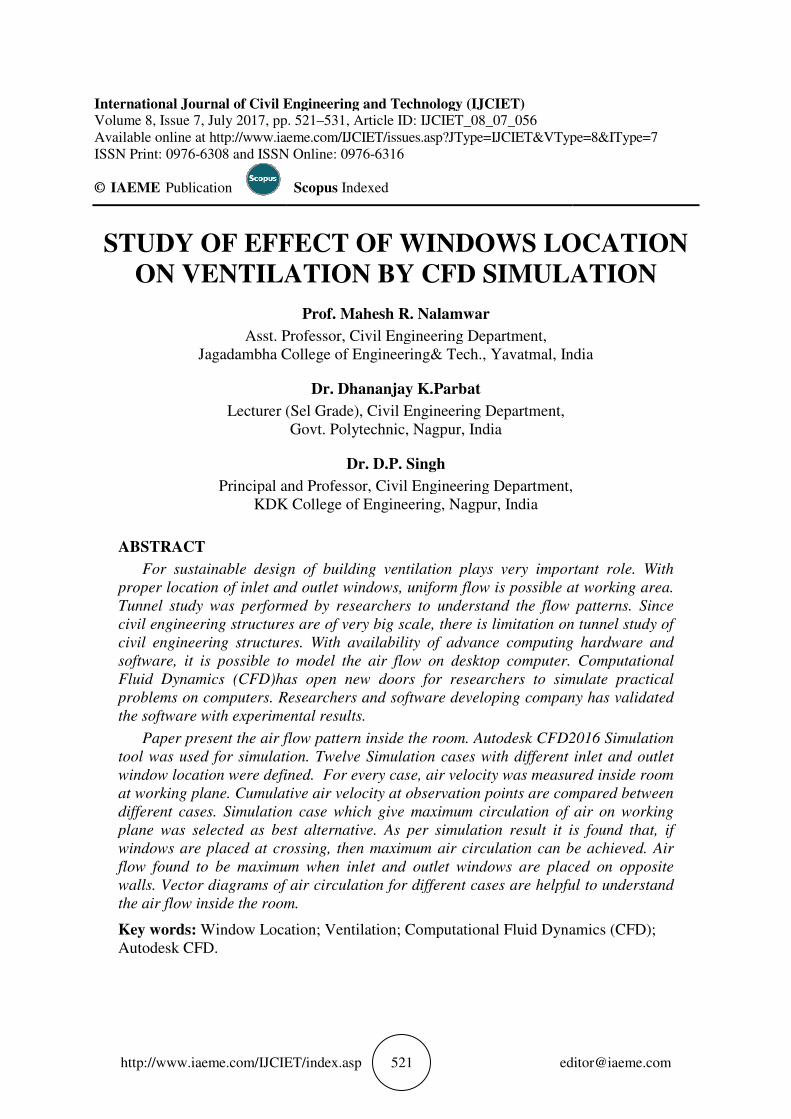
As shown in Fig.1, inlet and outlet windows can be placed at twelve location. In Case 1, inlet window was placed at location 2 and outlet window at location 8. Fig 2 shows the plan of case 1 model in Revit. Simulation was performed for Air circulation inside the room. Effect of windows location on flow of air circulation inside the room was studied.
Study of Effect of Windows Location on Ventilation by CFD Simulation
http://www.iaeme.com/IJCIET/index.asp 524 [email protected]
Figure 1Room Plan indicating windows location.
Figure 2Plan of Case 1.
Twelve cases are prepared to study the effect of windows location on air circulation inside room as shown in Table No.1. In all cases two windows of size 1.5x1.2m are considered. As per building bylaws 20% windows should be provided for ventilation[15]. In all cases, Windows to floor area was set to 22.50%. In every modeling Case, inlet and outlet windows location was changed.
Table 1 Cases Definition Table.
Case No Window Size in m Windows
No's
Window
Area in m2
%
Area
Window
Location
B H Inlet Outlet
1 1.5 1.2 2 3.6 22.50% 2 8 2 1.5 1.2 2 3.6 22.50% 2 9 3 1.5 1.2 2 3.6 22.50% 2 10 4 1.5 1.2 2 3.6 22.50% 2 11 5 1.5 1.2 2 3.6 22.50% 2 12 6 1.5 1.2 2 3.6 22.50% 3 9 7 1.5 1.2 2 3.6 22.50% 3 8 8 1.5 1.2 2 3.6 22.50% 3 7 9 1.5 1.2 2 3.6 22.50% 3 10
10 1.5 1.2 2 3.6 22.50% 3 11 11 1.5 1.2 2 3.6 22.50% 3 5 12 1.5 1.2 2 3.6 22.50% 3 6

Prof. Mahesh R. Nalamwar, Dr. Dhananjay K. Parbat and Dr. D.P. Singh
http://www.iaeme.com/IJCIET/index.asp 525 [email protected]
4. CFD SIMULATION RESULT OUTPUT
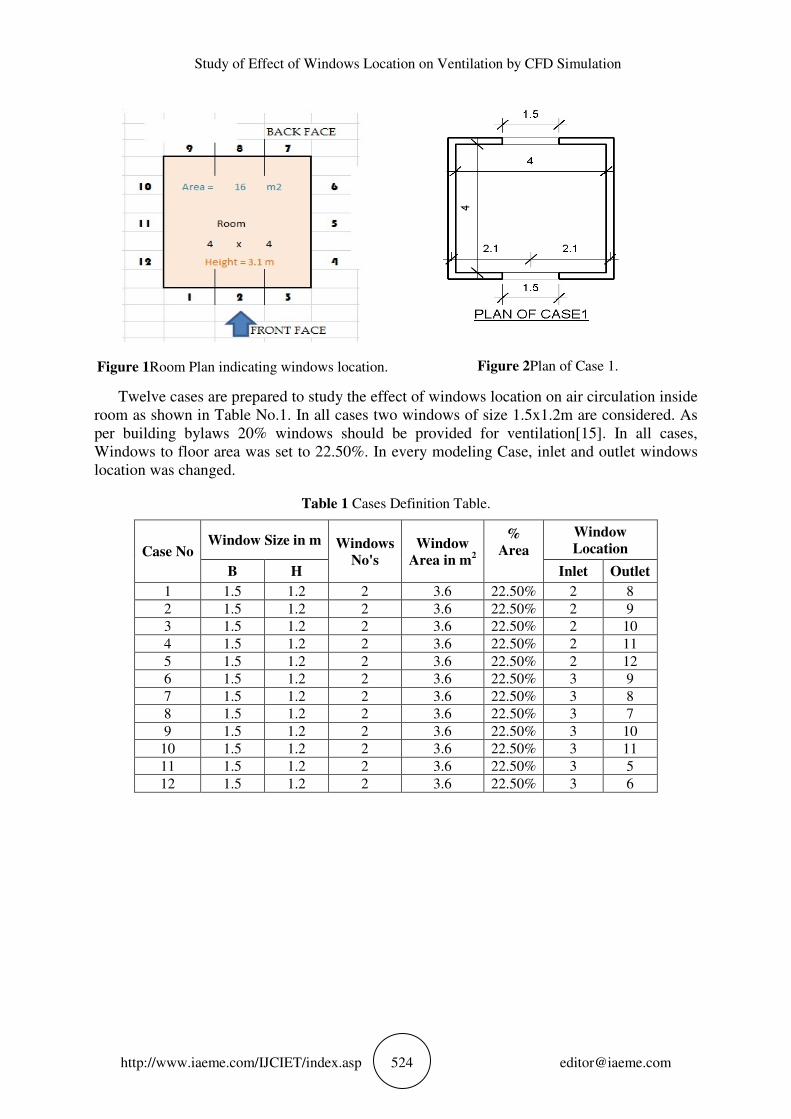
Result plane was set at 1.2m from floor level. Velocity magnitude was studied for all cases and velocity vector was drawn to understand direction of air.
Figure 3Velocity Magnitude Output for Case 1 in 3D.
Output is in the form of Graphical figures and reports.Following are the various graphical output for cases defined above. Left side scale shows the velocity gradient from 0 to 1.6 m/s.
Figure 4Velocity Magnitude Output for Case 1.
Figure 5Velocity Magnitude Output for Case 2.
Figure 6Velocity Magnitude Output for Case 3.
Figure 7Velocity Magnitude Output for Case 4
Figure 8Velocity Magnitude Output for Case 5.
Figure 9Velocity Magnitude Output for Case 6.
Study of Effect of Windows Location on Ventilation by CFD Simulation
http://www.iaeme.com/IJCIET/index.asp 526 [email protected]
Figure 10Velocity Magnitude Output for Case 7.
Figure 11Velocity Magnitude Output for Case 8.
Figure 12Velocity Magnitude Output for Case 9.
Figure 13Velocity Magnitude Output for Case 10.
Figure 14Velocity Magnitude Output for
Case 11.
Figure 15Velocity Magnitude Output for Case 12.

Prof. Mahesh R. Nalamwar, Dr. Dhananjay K. Parbat and Dr. D.P. Singh
http://www.iaeme.com/IJCIET/index.asp 527 [email protected]
Observation were recorded on 16 points which are spaced 1 m center to center in room as shown in drawing below.
Figure 16Observation points location at 1.2m Plane.
Air velocity for every case was recorded on observation point for all twelve cases of models. Velocity was measured in m/s.
Table 2 Air Velocity at observation points in m/s for various cases.
CASE NUMBER
Observati
on Points
Case
One
Case
Two
Case
Three
Case
Four
Case
Five
Case
Six
Case
Seve
n
Case
Eight
Case
Nine
Case
Ten
Case
Eleven
Case
Twelve
Point 11 0.1785 0.135
5 0.1466
0.2733
0.8348
0.3119
0.2393
0.2106
0.3989
0.3562
0.2070 0.2331
Point12 1.5244 1.513
0 1.5118
1.5446
1.4961
0.3840
0.3171
0.3002
0.4991
0.5640
0.3166 0.3452
Point13 1.4816 1.421
2 1.3973
1.3898
1.3479
0.9068
0.8981
0.8900
0.9060
0.9083
0.8404 0.8965
Point14 0.1862 0.262
6 0.2895
0.3040
0.3140
1.5806
1.5957
1.5951
1.5849
1.5814
1.6172 1.5669
Point21 0.1358 0.099
3 0.1926
0.7166
0.6619
0.3531
0.3567
0.3428
0.3379
0.6006
0.2956 0.3723
Point22 1.2775 1.258
9 1.2684
1.3889
1.2975
0.1566
0.1578
0.1696
0.1928
0.1591
0.2489 0.2090
Point23 1.2850 1.082
1 0.9909
0.9356
0.7520
0.8725
0.8503
0.8331
0.8805
0.8670
0.6215 0.8245
Point24 0.1379 0.331
5 0.3990
0.4177
0.4325
1.4852
1.5333
1.5455
1.4772
1.4296
1.6333 1.5178
Point31 0.1252 0.200
4 0.6165
0.7643
0.2477
0.2747
0.3560
0.3506
0.4830
0.8556
0.2876 0.3743
Point32 1.0849 1.138
9 1.1665
1.2321
1.0157
0.2530
0.1175
0.0715
0.3320
0.2958
0.1259 0.0653
Point33 1.1148 0.784
4 0.6568
0.5498
0.3126
0.9172
0.9017
0.8194
0.9422
0.8727
0.4071 0.7683
Point34 0.1247 0.354
5 0.4179
0.4252
0.4223
1.3121
1.4139
1.4709
1.2961
1.1994
1.2738 1.5260
Point41 0.1990 0.813
3 1.0562
0.3327
0.1843
0.8292
0.2889
0.2597
1.0285
0.4769
0.1655 0.2892
Point42 1.0113 1.041
0 0.7266
0.6776
0.4976
0.9185
0.5880
0.3153
0.7624
0.6232
0.1813 0.3886
Point43 1.0481 0.533
6 0.5205
0.4843
0.3870
0.8426
1.2043
0.7842
0.8517
0.7821
0.3488 0.5494
Point44 0.1959 0.301
0 0.3236
0.3149
0.2813
0.7930
0.8991
1.4231
0.7852
0.7345
0.5994 1.1158

Study of Effect of Windows Location on Ventilation by CFD Simulation
http://www.iaeme.com/IJCIET/index.asp 528 [email protected]
5. CFD RESULT DISCUSSION
Following bar graph shows the velocity at a particular point due to various cases.
Figure 17Velocity magnitude on observation points due to various Cases.
Velocity at observation points are added to get the total velocity inside the room at defined plane. Case 9 has the maximum total air velocity. As per observation of fig. 12, uniform distribution of air was observed. Case 9 has inlet window located at 3 and outlet window at 10 location(Fig.1). Simulation output in Fig.3 to 15 are helpful to understand air flow pattern due to variation in inlet and outlet window location.
Figure 18Total Velocity on observation points for various Cases.
Figure 19 Velocity Magnitude Output for Case 9 in 3D.

Prof. Mahesh R. Nalamwar, Dr. Dhananjay K. Parbat and Dr. D.P. Singh
http://www.iaeme.com/IJCIET/index.asp 529 [email protected]
Figure 20 Traces for Case 9 for wind speed of 1.6 m/s.
Volume flow rate defines the intensity of volume flows per second. If volume flow rate is good, then maximum air change per hour can be achieved. As per observation in Fig.21, Volume flow rate is maximum for case 6. Case 6 has inlet window located at 3 and outlet window at 9location(Fig.1). Since inlet and outlet windows are on opposite walls volume flow is more. Volume flow rate is more in Case 1,2, 7 1nd 8.
Figure 21 Volume Flow Rate for various Cases.
6. CONCLUSIONS
As per CFD data analysis it is found that maximum air was circulated well in room when windows are diagonally placed. For case number 9, total air velocity at observation point was found to be maximum i.e. 12.75 m/s. Minimum circulation of air in room was in case 11 , when windows are placed near to each other. To achieve maximum air circulation rate, outlet windows should be placed on opposite wall of inlet window. Simulation output in the form of vector diagrams will be helpful for consultant to understand the air circulation pattern.
Effective air circulation also depends on obstructions inside the room and weather condition. Study can be extended with multiple rooms, more than two windows and inlet air speed.
1 2 3 4 5 6 7 8 9 10 11 12
Volume flow rate 0.31 0.37 0.13 0.14 0.17 0.38 0.31 0.34 0.15 0.10 0.13 0.09
0
0.05
0.1
0.15
0.2
0.25
0.3
0.35
0.4
0.45
Vo
lum
e F
low
Ra
te m
3/s
Case Number
Case vs Volume Flow Rate

Study of Effect of Windows Location on Ventilation by CFD Simulation
http://www.iaeme.com/IJCIET/index.asp 530 [email protected]
REREFENCES
[1] S. B. Thool and S. L. Sinha, “Simulation of Room Airflow using CFD and Validation with Experimental Results,” vol. 6, no. 5, pp. 192–202, 2014.
[2] R. Ramponi and B. Blocken, “CFD simulation of cross-ventilation for a generic isolated building : impact of computational parameters CFD simulation of cross-ventilation for a generic isolated building : impact of computational parameters,” vol. 31, no. 0, pp. 34–48, 2012.
[3] Y. Anand, A. Gupta, S. K. Tyagi, and S. Anand, “RETRACTED_ Computational fluid dynamics, a building simulation tool for achieving sustainable buildings,” vol. 57, pp. 1174–1185, 2016.
[4] Y. Huijuan, Y. Tingfang, X. Rui, and P. Chunhua, “Numerical Simulation of Ventilation for Main Transformer Room of In- door Substations,” pp. 630–639, 2015.
[5] Y. Jiang and Q. Chen, “Study of natural ventilation in buildings by large eddy simulation,” vol. 89, no. 13, pp. 1155–1178, 2001.
[6] E. Rodrigues, A. R. Amaral, A. R. Gaspar, and Á. Gomes, “A Parametric Study On Window-To-Floor Ratio Of Three Window Types,” pp. 14–15, 2015.
[7] S. Swaddiwudhipong And M. S. Khan, “Dynamic Response Of Wind-Excited Building Using CFD,” J. Sound Vib., vol. 253, no. 4, pp. 735–754, 2002.
[8] C. Balocco, “Hospital ventilation simulation for the study of potential exposure to contaminants,” Build. Simul., vol. 4, no. 1, pp. 5–20, Mar. 2011.
[9] S. Kim, P. A. Zadeh, S. Staub-french, T. Froese, and B. Terim, “Assessment of the Impact of Window Size , Position and Orientation on Building Energy Load Using BIM,” Procedia Eng., vol. 145, pp. 1424–1431, 2016.
[10] A. M. Koohsari, R. Fayaz, and B. M. Kari, “The Influence of Window Dimensions and Location on Residential Building Energy Consumption by Integrating Thermal and Lighting Analysis in a Mild and Humid Climate,” MAGNT Res. Rep., vol. 3, no. 4, pp. 187–194, 2015.
[11] M. Z. I. Bangalee, J. J. Miau, S. Y. Lin, and M. Ferdows, “Effects of Lateral Window Position and Wind Direction on Wind-Driven Natural Cross Ventilation of a Building : A Computational Approach,” vol. 2014, 2014.
[12] ENERGY PLUS, “Weather Data For Nagpur | EnergyPlus.” [Online]. Available: https://energyplus.net/weather- location/asia_wmo_region_2/IND//IND_Nagpur.428670_ISHRAE. [Accessed: 03-Feb-2017].
[13] P. K. Nandankar, P. L. Dewangan, and R. V Surpam, CLIMATE OF NAGPUR, 1st ed. Nagpur: Regional Metrological Centre Airport, Nagpur (M.S.), 2011.
[14] “Computational Fluid Dynamics Software | Autodesk CFD.” [Online]. Available: http://www.autodesk.com/products/cfd/overview. [Accessed: 12-May-2014].
[15] Q. Yang, M. Liu, C. Shu, D. Mmereki, U. Hossain, and X. Zhan, “Impact Analysis of Window-Wall Ratio on Heating and Cooling Energy Consumption of Residential Buildings in Hot Summer and Cold Winter Zone in China,” vol. 2015, 2015.
[16] Qasim S. Mahdi and Ali Abdulridha Hussein, Enhancement of Heat Transfer In Shell and Tube Heat Exchanger with Tabulator and Nanofluid. International Journal of Mechanical Engineering and Technology, 7(3), 2016, pp. 125–138.

Prof. Mahesh R. Nalamwar, Dr. Dhananjay K. Parbat and Dr. D.P. Singh
http://www.iaeme.com/IJCIET/index.asp 531 [email protected]
AUTHORS BIOGRAPHY
Mr. Mahesh R. Nalamwar has done his B.E. in civil engineering from Amravati University in 1997 with Gold Medal and M.E. degrees from Shivaji University in 2001. Presently he is working as HOD Civil Engg. Department at Jagadambha College of engineering and technology, Yavatmal, India. He has 10 years of industrial experience and 7 years of teaching experience. His area of specialization is Sustainable building,
Green Structural design and Computational Fluid Dynamics. He has Published 3 research papers in International Journals and attended various conferences. Is a member of Institution of Engineers (IEI).
Dr. Dhananjay K. Parbat holds a B.E. (Civil Engineering) degree from Nagpur University, Post Graduation in Transportation Engineering from SGSITS, Indore (MP), PhD (Civil Engg) from SGB Amravati University. He is Lecturer in Civil Engg, Govt. Polytechnic, Nagpur, Maharashtra., having total teaching experience of 24 years. He supervises PhD scholars at RTM Nagpur and SGB Amravati University. He is associated with
Institution of Engg (India), LM-ISTE, LM-AIFUCTO, LMICI, LMIRC. He has worked as member, Board of studies, SGB Amravati University, Amravati and working as subject expert in designing curriculum for MSBTE, Mumbai He has published 78 technical research papers in reputed international, national journals and conferences. He is a recipient of Maharashtra State Best Teacher Award and ISTE Best Polytechnic Teacher Award.
Dr. D. P. Singh has done his B. E. in Civil Engineering from Nagpur University, Maharashtra, India and M.Tech in Environmental Engineering from VRCE, Maharashtra, India and PhD from Nagpur University. Presently he is working as a Principal at K. D. K. College of Engineering, Nagpur. He has published more than 40 papers in National/ International Conference and journal. He has 32 years of experience of teaching. He was Chairman of PG
Civil Engineering board of RTMNU, Nagpur. He was also a member of BOS Civil Engineering of RTMNU, Nagpur. He is a life member of Institution of Engineers (IEI), Indian Concrete Institute.