study of gas condensate reservoir behaviour using pvt ......in practical reservoir engineering. in...
TRANSCRIPT

Study of Gas Condensate Reservoir Behaviour using PVT Experiment
D.BEHNOUS1, N.ZERAIBI1, D.BELGACEM2
1University of Mhamed Bougara Boumerdes, Faculty of Hydrocarbons and Chemistry,
Indepedence Avenue, Boumerdes 35000, Algeria (Phone: 213 247 95162, Fax: 213 247 95162, Email: [email protected])
1Laboratoire de Génie Physique des Hydrocarbures, U.M.B.B, Boumerdes, Algerie.
2Laboratoire de Mécanique des fluids Théorique et Appliquée, Faculté de Physique, U.S.T.H.B, Alger, Algérie.
Abstract
One of the important activities in reservoir management is to ensure that representative
reservoir fluid samples are obtained by sampling and proper laboratory measurements are
conducted on the samples. Gas-condensate reservoirs are among the most difficult problems
in practical Reservoir Engineering. In case the reservoir is saturated (which is the most
frequent) it is impossible to obtain a representative reservoir fluid sample, because any
production will create a draw down at well bore level, and some condensed liquid will be left
in the formation. Furthermore, behaviour of a gas condensate reservoir is mainly controlled
by fluid properties, and accurate knowledge of these PVT characteristics is required. The
purpose of this study is to highlight experimental PVT data obtained from the standard
experiment performed on a surface sample of a gas condensate. Indeed, the constant volume
depletion (CVD) and the constant composition expansion (CCE) are the major laboratory tests
for gas condensate. The PVT data obtained are based on the analysis of the recombined surface
sample.
Keywords: Fluid sampling, PVT experiment, Gas condensate, CCE/CVD,
1. Introduction
The importance of a good knowledge of the phase behaviour and compositional
properties of reservoir fluids for the development of gas condensate reservoirs and the
subsequent processing of the well stream is widely recognised. Substantial financial investment
is made on the acquisition of reliable samples of a reservoir fluid and on measuring the phase
Scientific Cooperations International Journal of Mechanical and Aerospace Engineering, Vol. 3, Issue 1, December 2017
1

behaviour or PVT properties. Great reliance is placed directly on the resulting data and often
even more on a derived equation of state. Laboratory experiments of hydrocarbons fluids are
performed to investigate many different aspect of phase behaviour, including PVT relation and
compositional analyses in both the single and two-phase states. The most common of these for
phase behaviour studies are constant volume depletion (CVD), constant composition expansion
(CCE) and differential liberation (DL). In this paper, we discuss briefly the methods for
obtaining samples from gas condensate reservoirs and their validation, and then experimental
PVT data performed on a surface sample are presented.
2. Sampling technique and validation
Before field development starts, the primary goal of sampling is to obtain
“representative” sample of the fluid or fluids found in the reservoir at initial conditions. It may
be difficult to obtain a representative sample because of twophase flow effects near the
wellbore. This occurs when a well is produced with a flowing bottomhole pressures below the
saturation pressure of the reservoir fluid(s). Misleading fluid samples may also be obtained if
gas coning or oil occurs.
Several sampling methods can be used to collect reservoir fluids, including:
RFT Sampling
Bottomhole sampling
Separator sampling
Wellhead sampling
The choice of method depends primarily on (1) whether the reservoir fluid is an oil or gas,
and (2) whether the reservoir fluid is saturated (or nearly saturated) at reservoir conditions. The
second condition is determined by whether the well produces single phase fluid into the
wellbore at the flowing bottomhole pressure.
Depending on the reservoir and fluid type, sampling can either take place at sub-
surface, wellhead or surface. For a gas condensate fluid, it is advisable to carry out surface. In
this method of sampling the reservoir fluid is made to flow through a separator, stable flow rate
are essential. Well-test reports are a very useful source of information concerning flow-rate
stability. A separator oil and separator gas are sampled at the same time. This pair of separator
samples is then recombined to the producing GOR to give a representative reservoir fluid
Scientific Cooperations International Journal of Mechanical and Aerospace Engineering, Vol. 3, Issue 1, December 2017
2

composition. This method of sampling is applicable for black oils, volatile oils, gas condensate,
wet gases and dry gases.
If a produced oil is single phase at the wellhead then a sample can be taken upstream to
the choke. Successful wellhead samples should be very accurate if the temperature is above the
wax appearance point (WAP). Usually wellhead samples can only be taken from high-pressure,
deep wells that are highly undersaturated. In general, wellhead (or bottom hole) samples are
preferred for asphaltene studies.
3. Conditioning a Well before Sampling
A well should normally be "conditioned" before sampling, particularly for gas
condensate and saturated oil wells. First, the well is produced long enough to clean up all
chemicals that were used during the well completion. Next, the rate is stepwise decreased until
the flowing bottomhole pressure is larger than the estimated saturation pressure (if possible).
The final flow rate must be large enough to maintain a stable producing GOR and
wellhead pressure, even if the flowing bottomhole pressure is less than the saturation pressure.
In addition, the final flow rate should be maintained long enough to ensure that the producing
GOR is more-or-less constant.
Sample containers are usually shipped by boat to land, and thereafter by air or ground
transport to the PVT laboratory. As requested by the field operator, compositional analysis and
standard PVT experiments are performed on the samples at a PVT laboratory
4. Sample Treatment at the PVT Laboratory
The quality of the PVT study and a possible EOS model developed for the reservoir fluid
depends on the quality of the samples. Hence, it is important to carry out the validation of the
samples before performing the reservoir study. The validation process depends on the type of
sample collected, i.e. whether they are bottom hole, wellhead or separator samples.
When the samples arrive at the PVT laboratory, the samples must be checked for quality
and possible leakage. Several methods can be used to check sample consistency. It is important
to establish which samples should be used for the PVT study, mainly based on these
consistency checks.
Scientific Cooperations International Journal of Mechanical and Aerospace Engineering, Vol. 3, Issue 1, December 2017
3

5. PVT experiments
Two very important experiments carried out for gas condensate fluids are Constant
Composition Expansion (CCE) and Constant Volume Depletion Experiments. In CCE, or the
pressure-volume test, a known amount of gas condensate is loaded into a visual cell above the
initial reservoir pressure. The system pressure is lowered stepwise by incrementally expanding
the cell volume. Gas and condensate volumes are recorded at each pressure step as well as the
observed dew point, The CCE experiment for a gas condensate reports the total relative volume
defined as the volume of the gas or gas-plus-oil mixture divided by the dewpoint
volume. Z-factors are also reported, at the dewpoint pressure and above.
The constant volume depletion (CVD) experiment is designed to provide volumetric
and compositional data for gas condensate (and volatile oil) reservoirs producing by pressure
depletion. The stepwise procedure of a CVD experiment is shown schematically in Figure (1).
The CVD experiment is performed on the same portion of the sample at reservoir temperature.
It consists of a series of pressure expansions and constant pressure displacements to return the
sample at a constant volume at the end of each stage, which was equal to the volume of sample
at dew point pressure. The expelled gas at each pressure stage is collected and its composition,
volume and compressibility (deviation factor) are determined. The condensate volume is also
measured.
For most gas condensate reservoirs producing by depletion, the recoveries and oil
saturations versus pressure from the CVD analysis closely approximate actual field
performance.a If other recovery mechanisms such as water drive and gas cycling are
considered, the basic data required for reservoir engineering are still
taken mainly from a CVD report.
6. Methods and Materials
6.1 The PVT equipment
The PVT equipment used in the laboratory consists essentially of four parts (Fig 1):
a- A DBR type oven
The temperature of the oven is controlled by means of a microprocessor in contact with an RTD sensor.
Maximum temperature service =+ 200 °C
Minimum temperature service =-35°C
Scientific Cooperations International Journal of Mechanical and Aerospace Engineering, Vol. 3, Issue 1, December 2017
4

b- A fully visible PVT-DBR cell
The DBR cell is made of stainless steel to determine the volumetric properties of equilibria (liquid, vapor)
Maximun pressure of service =+ 10.000 psi
Maximum temperature of service =200°C
Total volume =132cm3
C) High pressure DBR volumetric pump
Maximum pressure of service =+ 10.000 psi
Total volume = 500 cm3
Maximum rate = 100cm3 /h
Minimun rate = 1cm3 /h
D) A high-resolution CCD video system
This system makes possible to visualize with a high resolution the total container of the
PVT cell on a color screen; it also makes possible to distinguish the appearance of the phases
studied. It is equipped with a catheter that can measure the reading accuracy of 0.01cm3 .The
equipment is completely computer-controlled, once the sample has been transferred, the
manipulation is summed up in set points, since the pump, the temperature probe and other
components are completely and automatically checked.
6.2 Validation test of the sample
Two (02) gas bottles (20 liters each) and one (01) bottle containing liquid (980cc)
sampled through the 32/64 choke were received. A sampling control test was carried out
systematically on all the bottles as soon as they were received; their opening pressures are as
follows:
Po (Pa, 24°C)= 150 Psig, (liquide)
Po (Pa, 23°C)= 143 Psig, (Gaz)
Po (Pa, 23°C)= 145 Psig, (Gaz)
6.3 Physical recombination of gas and liquid separator
The physical parameters provided by the study of the gas and the liquid separator will
be used to correct the field GCR to obtain the initial fluid. The recombination GCR is calculated
from the field and laboratory data by the following formula:
( . )* *
( . )
d Z fieldGCRrecombinaison GCRfield Fc
d Z laboratory ……. (1)
Scientific Cooperations International Journal of Mechanical and Aerospace Engineering, Vol. 3, Issue 1, December 2017
5
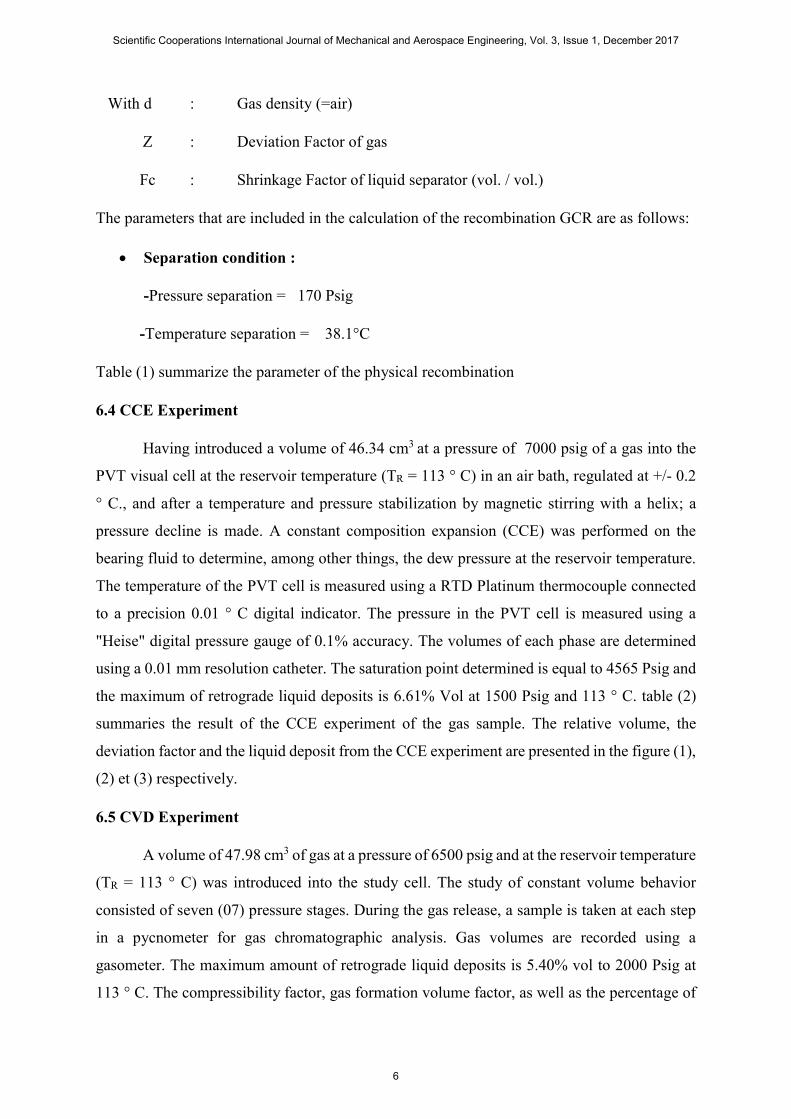
With d : Gas density (=air)
Z : Deviation Factor of gas
Fc : Shrinkage Factor of liquid separator (vol. / vol.)
The parameters that are included in the calculation of the recombination GCR are as follows:
Separation condition :
-Pressure separation = 170 Psig
-Temperature separation = 38.1°C
Table (1) summarize the parameter of the physical recombination
6.4 CCE Experiment
Having introduced a volume of 46.34 cm3 at a pressure of 7000 psig of a gas into the
PVT visual cell at the reservoir temperature (TR = 113 ° C) in an air bath, regulated at +/- 0.2
° C., and after a temperature and pressure stabilization by magnetic stirring with a helix; a
pressure decline is made. A constant composition expansion (CCE) was performed on the
bearing fluid to determine, among other things, the dew pressure at the reservoir temperature.
The temperature of the PVT cell is measured using a RTD Platinum thermocouple connected
to a precision 0.01 ° C digital indicator. The pressure in the PVT cell is measured using a
"Heise" digital pressure gauge of 0.1% accuracy. The volumes of each phase are determined
using a 0.01 mm resolution catheter. The saturation point determined is equal to 4565 Psig and
the maximum of retrograde liquid deposits is 6.61% Vol at 1500 Psig and 113 ° C. table (2)
summaries the result of the CCE experiment of the gas sample. The relative volume, the
deviation factor and the liquid deposit from the CCE experiment are presented in the figure (1),
(2) et (3) respectively.
6.5 CVD Experiment
A volume of 47.98 cm3 of gas at a pressure of 6500 psig and at the reservoir temperature
(TR = 113 ° C) was introduced into the study cell. The study of constant volume behavior
consisted of seven (07) pressure stages. During the gas release, a sample is taken at each step
in a pycnometer for gas chromatographic analysis. Gas volumes are recorded using a
gasometer. The maximum amount of retrograde liquid deposits is 5.40% vol to 2000 Psig at
113 ° C. The compressibility factor, gas formation volume factor, as well as the percentage of
Scientific Cooperations International Journal of Mechanical and Aerospace Engineering, Vol. 3, Issue 1, December 2017
6

the retrograde liquid deposits, are listed in the table (2) and represented respectively in the
figures(4), (5) et (6).
Conclusions
The physical property measurement conducted at the surface are adequate to provide
confident estimate of all traditional fluid properties (PVT) for the reservoir crude under certain
consideration. The experiments data performed on fluid reservoirs in the laboratory is applied
by reservoir engineers for reservoir simulation and also, serve to provide a set of data on which
to base the development of a mathematical model of the fluid. This so-called equation of state
model is then used for all kinds of purposes, eg: separator design, gas processing plant design,
compositional simulations, vertical performcance calcultions etc .
Scientific Cooperations International Journal of Mechanical and Aerospace Engineering, Vol. 3, Issue 1, December 2017
7
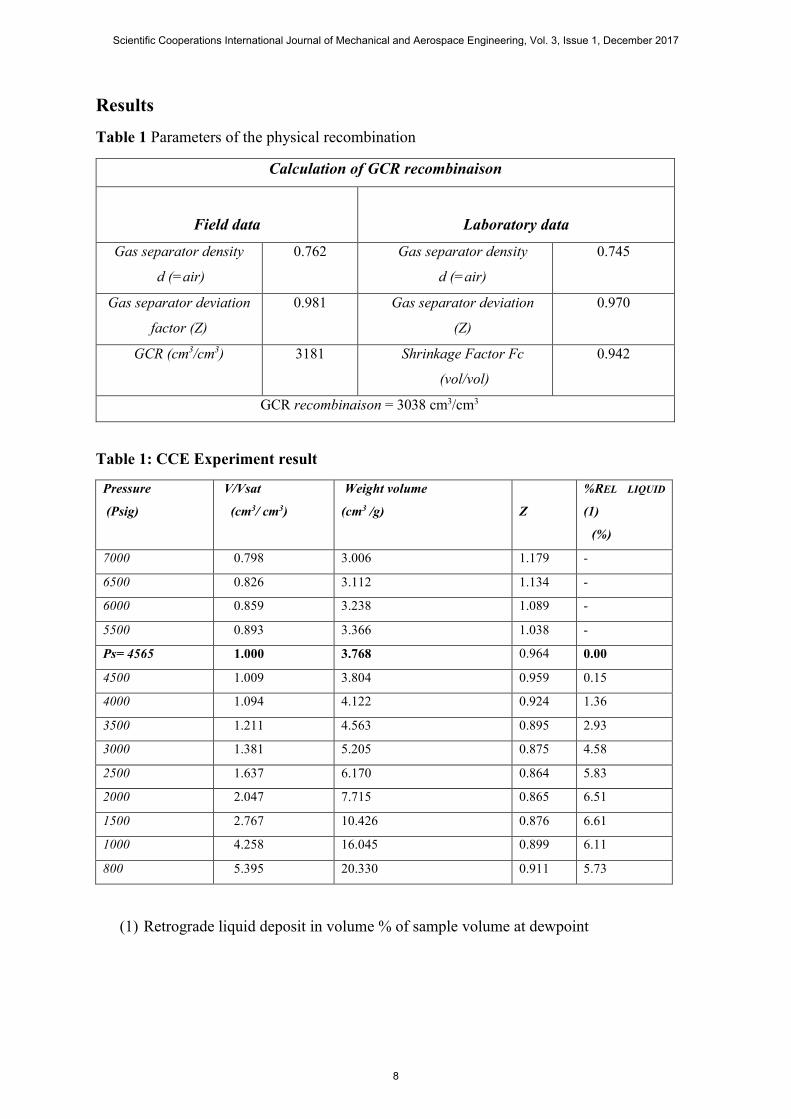
Results
Table 1 Parameters of the physical recombination
Calculation of GCR recombinaison
Field data
Laboratory data
Gas separator density
d (=air)
0.762 Gas separator density
d (=air)
0.745
Gas separator deviation
factor (Z)
0.981 Gas separator deviation
(Z)
0.970
GCR (cm3/cm3) 3181 Shrinkage Factor Fc
(vol/vol)
0.942
GCR recombinaison = 3038 cm3/cm3
Table 1: CCE Experiment result
Pressure
(Psig)
V/Vsat
(cm3/ cm3)
Weight volume
(cm3 /g)
Z
%REL LIQUID
(1)
(%)
7000 0.798 3.006 1.179 -
6500 0.826 3.112 1.134 -
6000 0.859 3.238 1.089 -
5500 0.893 3.366 1.038 -
Ps= 4565 1.000 3.768 0.964 0.00
4500 1.009 3.804 0.959 0.15
4000 1.094 4.122 0.924 1.36
3500 1.211 4.563 0.895 2.93
3000 1.381 5.205 0.875 4.58
2500 1.637 6.170 0.864 5.83
2000 2.047 7.715 0.865 6.51
1500 2.767 10.426 0.876 6.61
1000 4.258 16.045 0.899 6.11
800 5.395 20.330 0.911 5.73
(1) Retrograde liquid deposit in volume % of sample volume at dewpoint
Scientific Cooperations International Journal of Mechanical and Aerospace Engineering, Vol. 3, Issue 1, December 2017
8

Figure 1- CCE Relative Volume
Figure 2 CCE Deviation Factor ‘Z’
Figure 3 Liquid deposit (%)
0.5
1
1.5
2
2.5
3
3.5
4
4.5
5
5.5
500 2000 3500 5000 6500
rela
tiv
e V
olu
me
(vo
l/v
ol)
Pressure (psig)
0.750.8
0.850.9
0.951
1.051.1
1.151.2
500 1500 2500 3500 4500 5500 6500 7500
Dev
iati
on F
acto
r"Z
"
Pressure (psig)
0.000.601.201.802.403.003.604.204.805.406.006.60
500 1000 1500 2000 2500 3000 3500 4000 4500 5000
liq
uid
dep
osit
(%
)
Pressure (Psig)
Scientific Cooperations International Journal of Mechanical and Aerospace Engineering, Vol. 3, Issue 1, December 2017
9
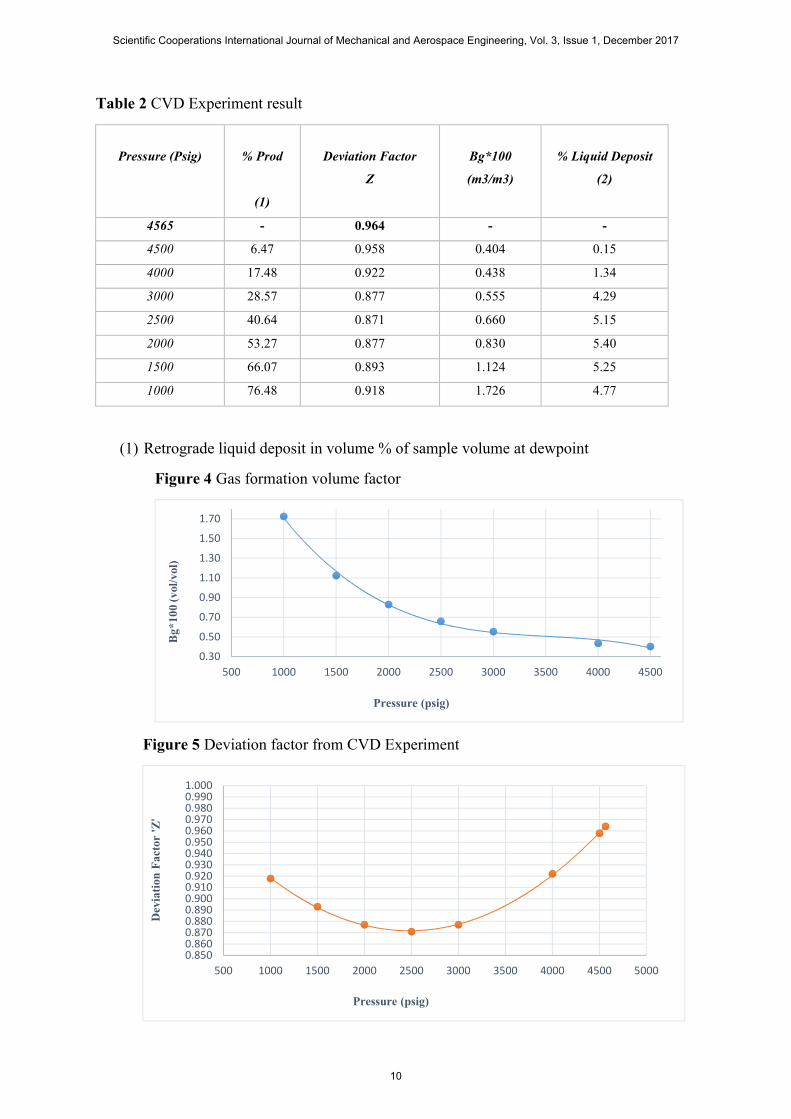
Table 2 CVD Experiment result
Pressure (Psig)
% Prod
(1)
Deviation Factor
Z
Bg*100
(m3/m3)
% Liquid Deposit
(2)
4565 - 0.964 - -
4500 6.47 0.958 0.404 0.15
4000 17.48 0.922 0.438 1.34
3000 28.57 0.877 0.555 4.29
2500 40.64 0.871 0.660 5.15
2000 53.27 0.877 0.830 5.40
1500 66.07 0.893 1.124 5.25
1000 76.48 0.918 1.726 4.77
(1) Retrograde liquid deposit in volume % of sample volume at dewpoint
Figure 4 Gas formation volume factor
Figure 5 Deviation factor from CVD Experiment
0.30
0.50
0.70
0.90
1.10
1.30
1.50
1.70
500 1000 1500 2000 2500 3000 3500 4000 4500
Bg
*10
0 (
vol/
vol)
Pressure (psig)
0.8500.8600.8700.8800.8900.9000.9100.9200.9300.9400.9500.9600.9700.9800.9901.000
500 1000 1500 2000 2500 3000 3500 4000 4500 5000
Dev
iati
on F
acto
r 'Z'
Pressure (psig)
Scientific Cooperations International Journal of Mechanical and Aerospace Engineering, Vol. 3, Issue 1, December 2017
10

Figure 6 - Liquid deposit
(2) Retrograde liquid deposit in volume % of sample volume at dewpoint
Figure 1: Schematic diagram of constant volume depletion
0.0000.5001.0001.5002.0002.5003.0003.5004.0004.5005.0005.500
500 1300 2100 2900 3700 4500
Liq
uid
dep
osit
(%
)
Pressure (psig)
Scientific Cooperations International Journal of Mechanical and Aerospace Engineering, Vol. 3, Issue 1, December 2017
11

Figure 2 PV analysis laboratory
Scientific Cooperations International Journal of Mechanical and Aerospace Engineering, Vol. 3, Issue 1, December 2017
12

Table 3 Molair composition of liquid and gas separator analysed by GC
Constituants
MW (g/mole)
molaire du gaz séparateur et du
Liquide séparateur (%)
molaire Du gaz
séparateur (%)
molaire du liquide
séparateur (%)
N2 28.014 1.67 0.41
CO2 44.010 1.00 0.07
C1 16.041 77.37 2.96
C2 30.070 11.25 2.08
C3 44.097 4.80 3.28
iC4 58.124 0.73 1.32
nC4 58.124 1.46 4.21
iC5 72.151 0.41 3.18
nC5 72.151 0.40 4.41
C6 86.178 0.30 11.77
C7 96.000 0.37 16.20
C8 107.000 0.24 11.15
C9 121.000 0.00 9.74
C10 134.000 0.00 7.02
C11 174.000 0.00 4.81
C12 237.000 0.00 17.38
Total 100.00 100.00
MW (g/mole)
DensitY (=air)
GOR(m3/m3)
Bo(3000psig , 38.1°C) (m3/m3)
21.55
0.743
-
-
109.43
-
10.92
1.061
Scientific Cooperations International Journal of Mechanical and Aerospace Engineering, Vol. 3, Issue 1, December 2017
13

References
[1] Ahmed, T. Hydrocarbon Phase Behaviour. Houston: Gulf Publishing Company, Vol. 7, (1989).
[2] Curtis, H.W, Qivind, F and Tao, Y.: Gas Condensate PVT- What is Really important and Why? IBC conference Optimization of gas condensate fields, London, Jan 1999.
[3] Standing, M.B: Volumetric and Phase Behaviour of oil field Hydrocarbons Systems, eight edition, SPE, Richardson, Texas (1977).
[4] Pedersen K.S. and Christensen L.P.: Phase Behaviour of Petroleum Reservoir Fluids., Taylor and Francis Group, Boca Raton (2007)
[5] Reudelhuber, F.O.: "Separator Sampling of Gas-Condensate Reservoirs," Oil & Gas J. (June 21, 1954) 138-40.
Scientific Cooperations International Journal of Mechanical and Aerospace Engineering, Vol. 3, Issue 1, December 2017
14