study of hazardous substances emergency events and their health effects
DESCRIPTION
Study of Hazardous Substances Emergency Events and their Health Effects. Presented by Deepay Mukerjee September 7, 2005. PART A. Study of Emergency Events. Ten Most Frequent Substances Involved in Events. Ammonia Sulfur Dioxide Nitrogen Oxide Carbon Monoxide - PowerPoint PPT PresentationTRANSCRIPT
Study of Hazardous Substances Emergency Events and their
Health Effects
Presented by Deepay Mukerjee
September 7, 2005
PART A
Study of Emergency Events
Ten Most Frequent Substances Involved in Events
• Ammonia• Sulfur Dioxide• Nitrogen Oxide• Carbon Monoxide• Hydrochloric Acid• Methamphetamine Chemicals• VOC’s• Sulfuric Acid• Nitric Oxide• Sodium Hydroxide
The Next Ten
• Mercury• Chlorine• Nitrogen Oxides, NOS• Benzene• Ethylene Glycol• Paint• Solvent, NOS• Hydrogen Sulfide• Polychlorinated Biphenyls• Super Clean
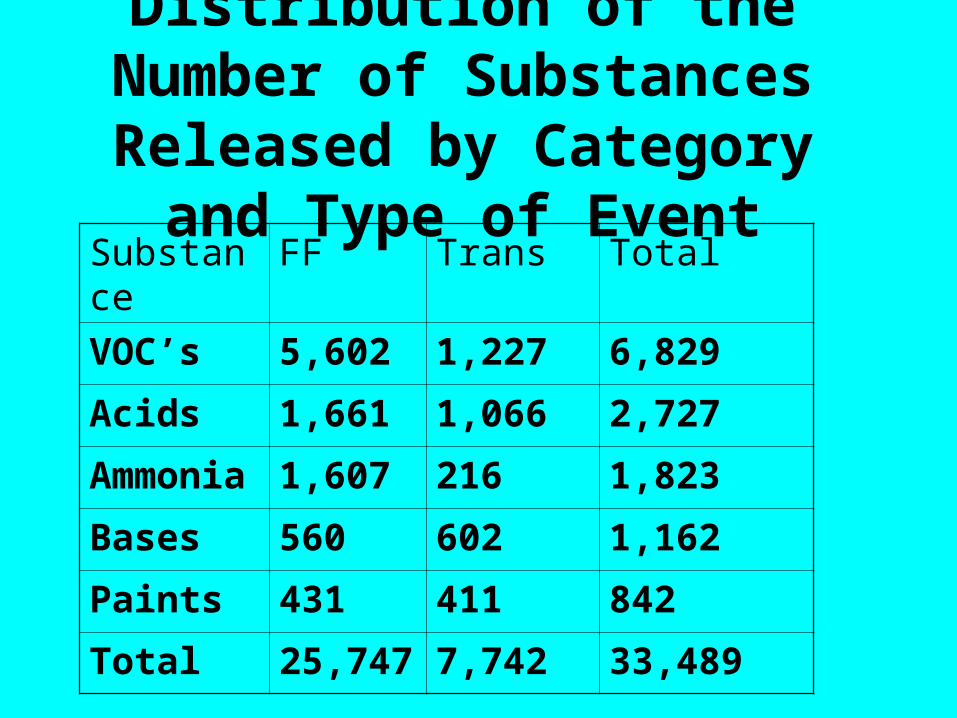
Distribution of the Number of Substances Released by
Category and Type of EventSubstance FF Trans Total
VOC’s 5,602 1,227 6,829
Acids 1,661 1,066 2,727
Ammonia 1,607 216 1,823
Bases 560 602 1,162
Paints 431 411 842
Total 25,747 7,742 33,489
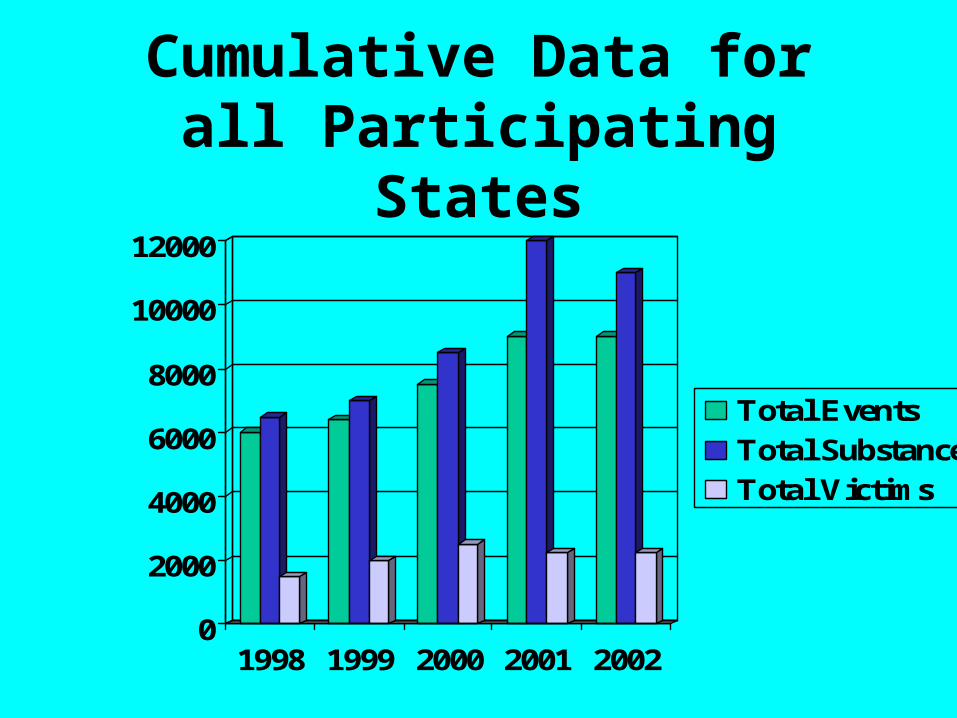
Cumulative Data for all Participating States
0
2000
4000
6000
8000
10000
12000
1998 1999 2000 2001 2002
Total EventsTotal SubstancesTotal Victims
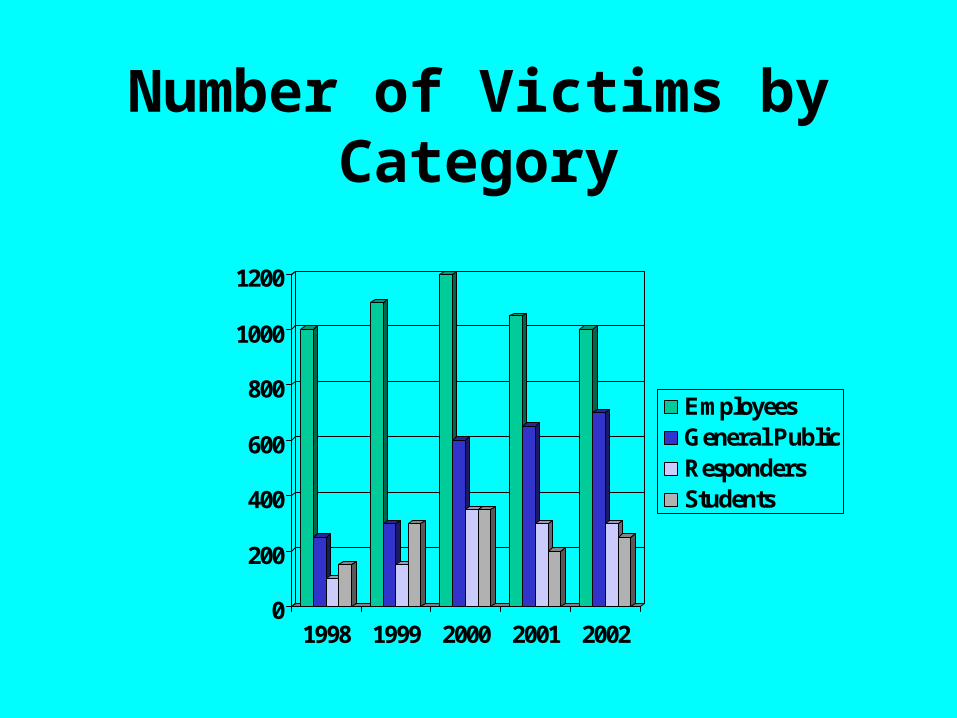
Number of Victims by Category
0
200
400
600
800
1000
1200
1998 1999 2000 2001 2002
EmployeesGeneral PublicRespondersStudents
0
200
400
600
800
1000
1200
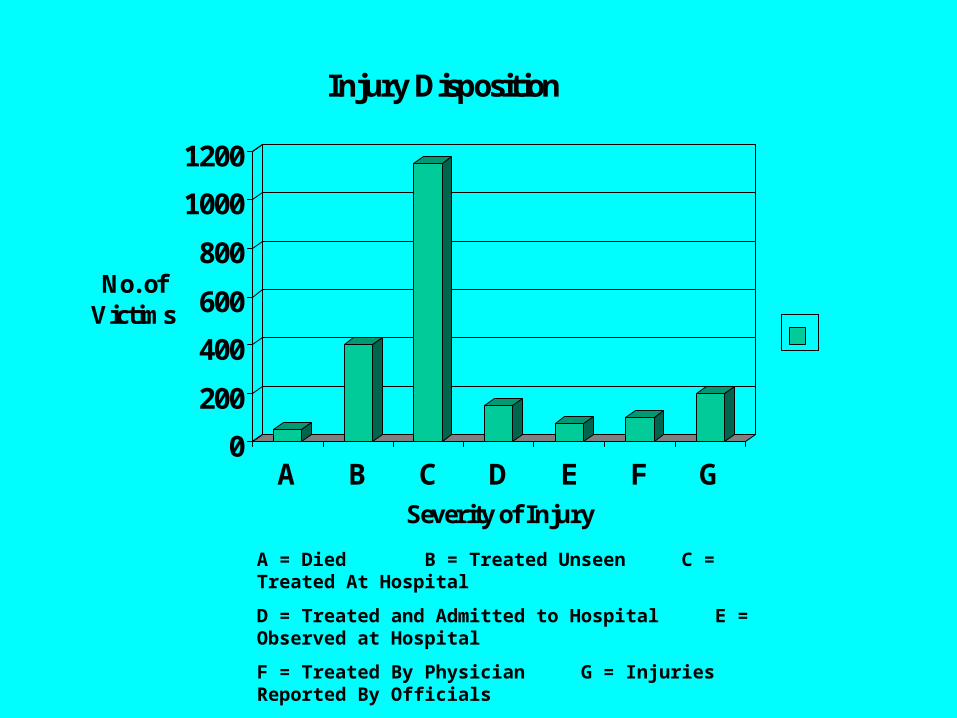
No. of Victims
A B C D E F GSeverity of Injury
Injury Disposition
A = Died B = Treated Unseen C = Treated At Hospital
D = Treated and Admitted to Hospital E = Observed at Hospital
F = Treated By Physician G = Injuries Reported By Officials
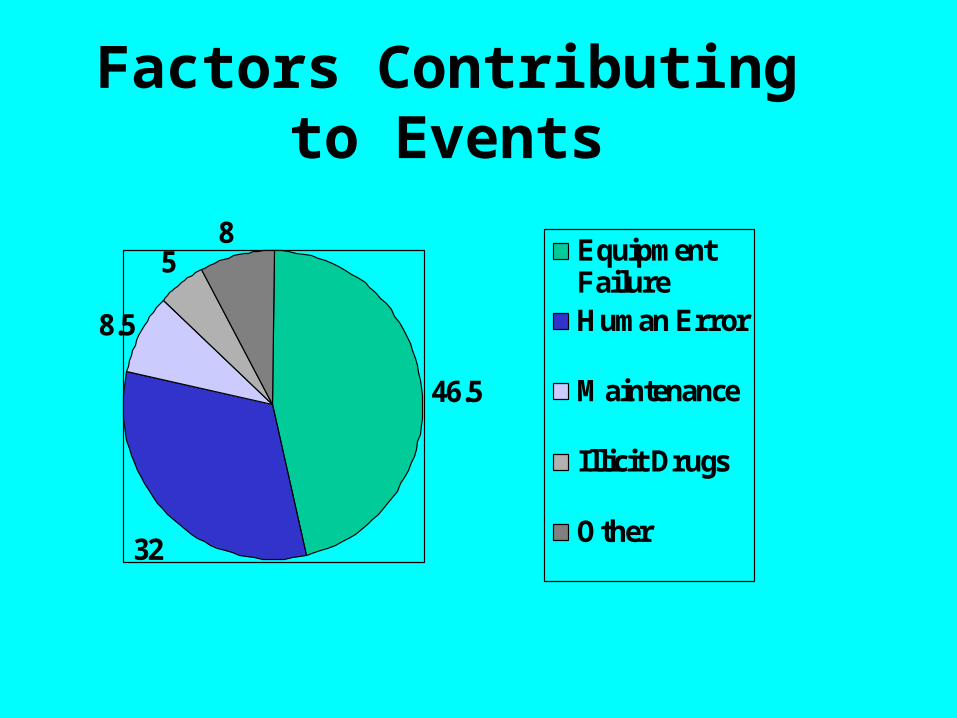
46.5
32
8.5
58
EquipmentFailureHuman Error
Maintenance
Illicit Drugs
Other
Factors Contributing to Events
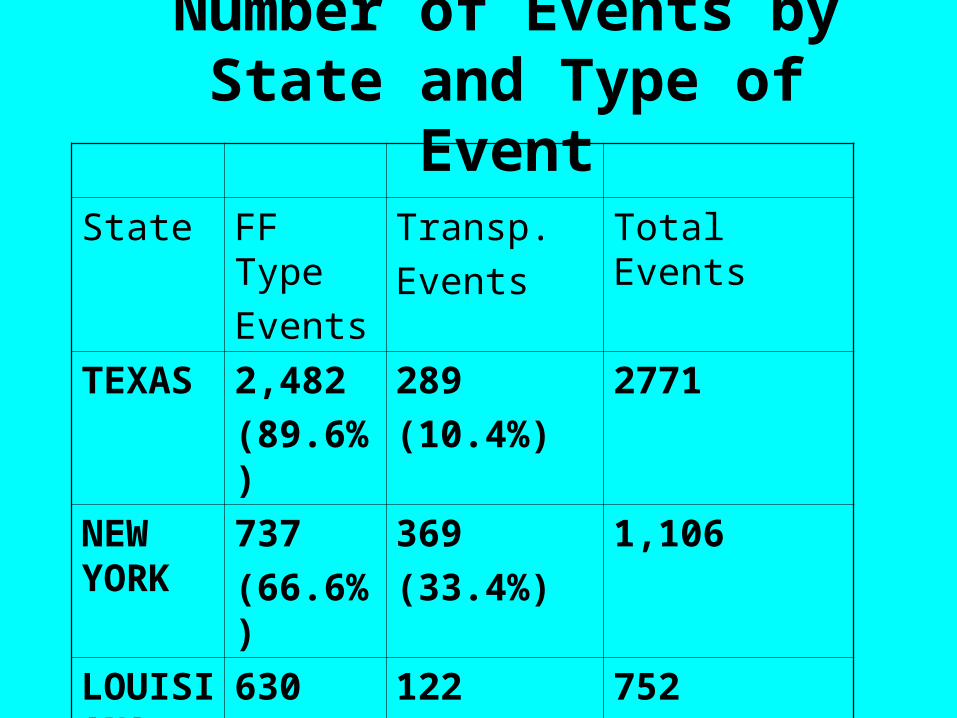
Number of Events by State and Type of Event
State FF Type
Events
Transp.
Events
Total Events
TEXAS 2,482
(89.6%)
289
(10.4%)
2771
NEW YORK
737
(66.6%)
369
(33.4%)
1,106
LOUISIANA
630
(83.8%)
122
(16.2%)
752
TOTAL 6,493 2,520 9,013
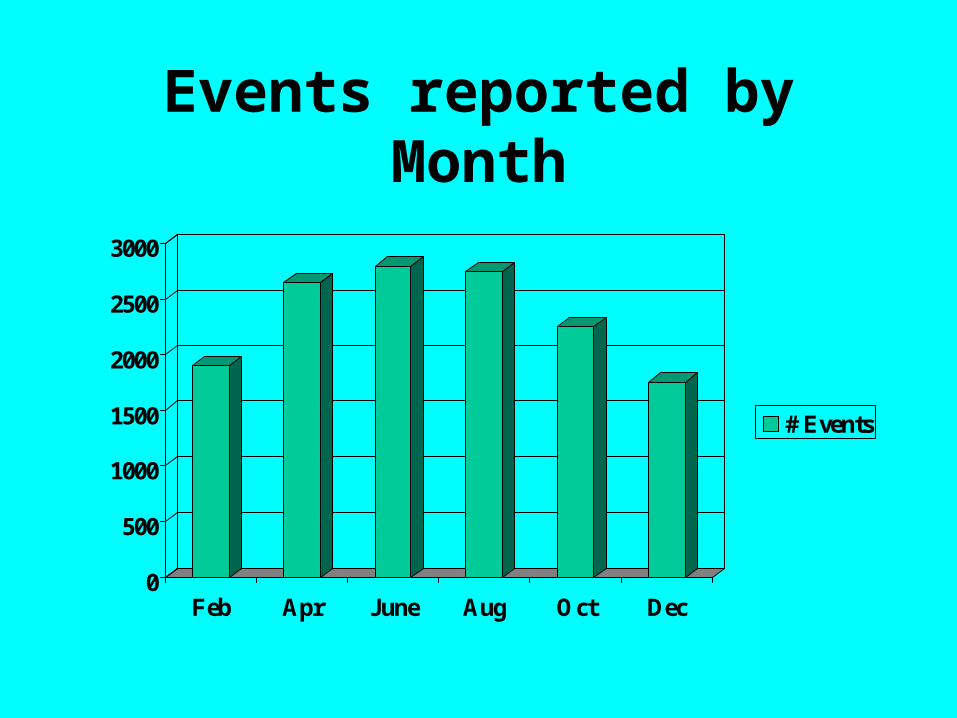
Events reported by Month
0
500
1000
1500
2000
2500
3000
Feb Apr June Aug Oct Dec
# Events
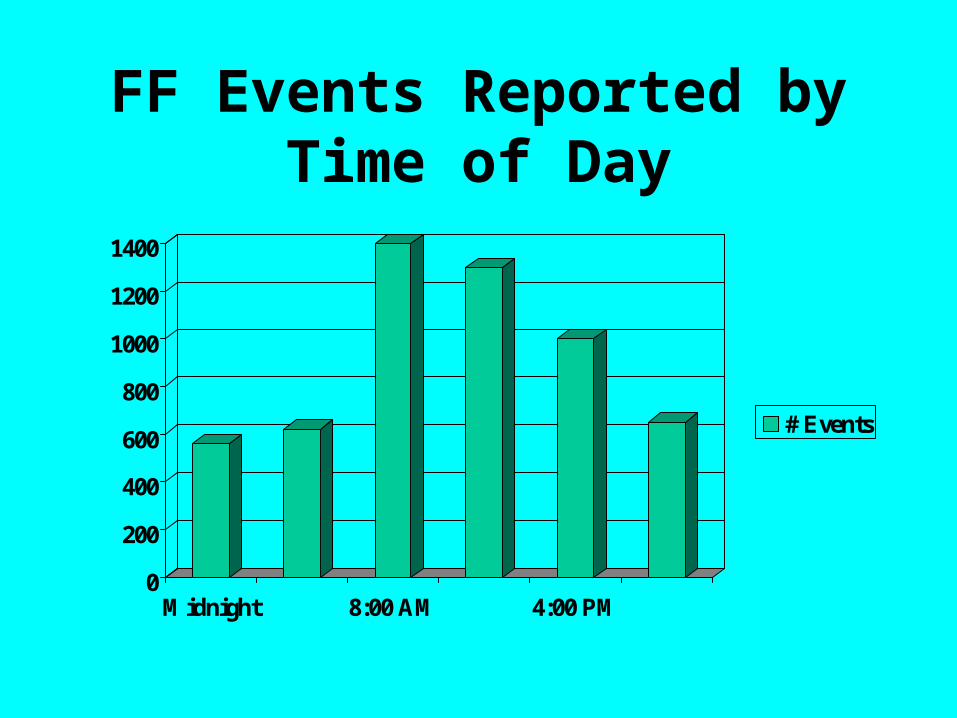
FF Events Reported by Time of Day
0
200
400
600
800
1000
1200
1400
Midnight 8:00 AM 4:00 PM
# Events
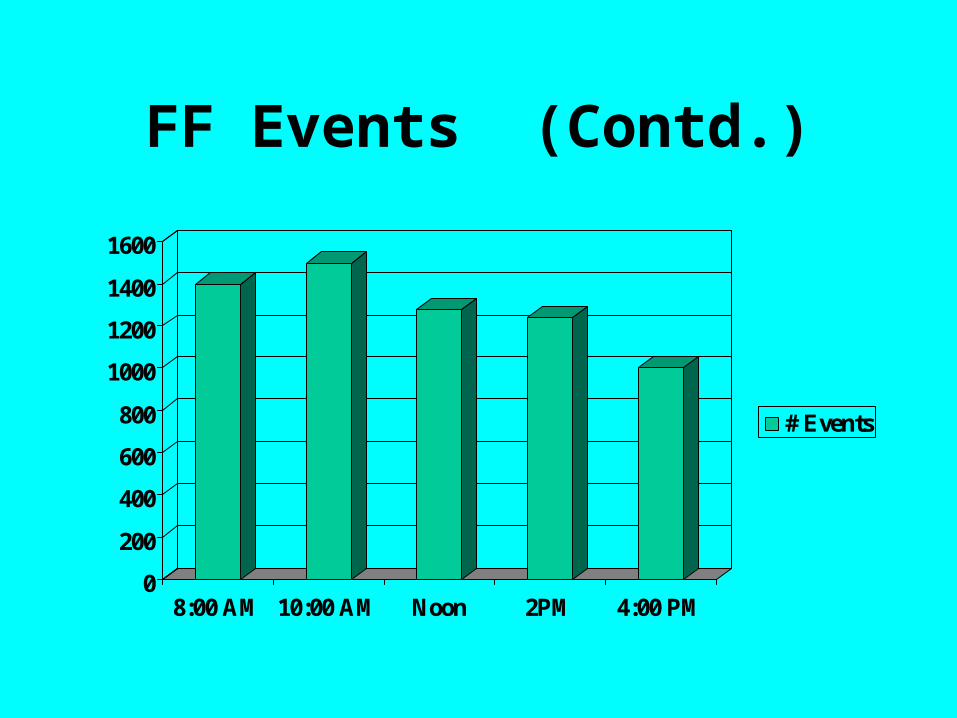
FF Events (Contd.)
0
200
400
600
800
1000
1200
1400
1600
8:00 AM 10:00 AM Noon 2PM 4:00 PM
# Events
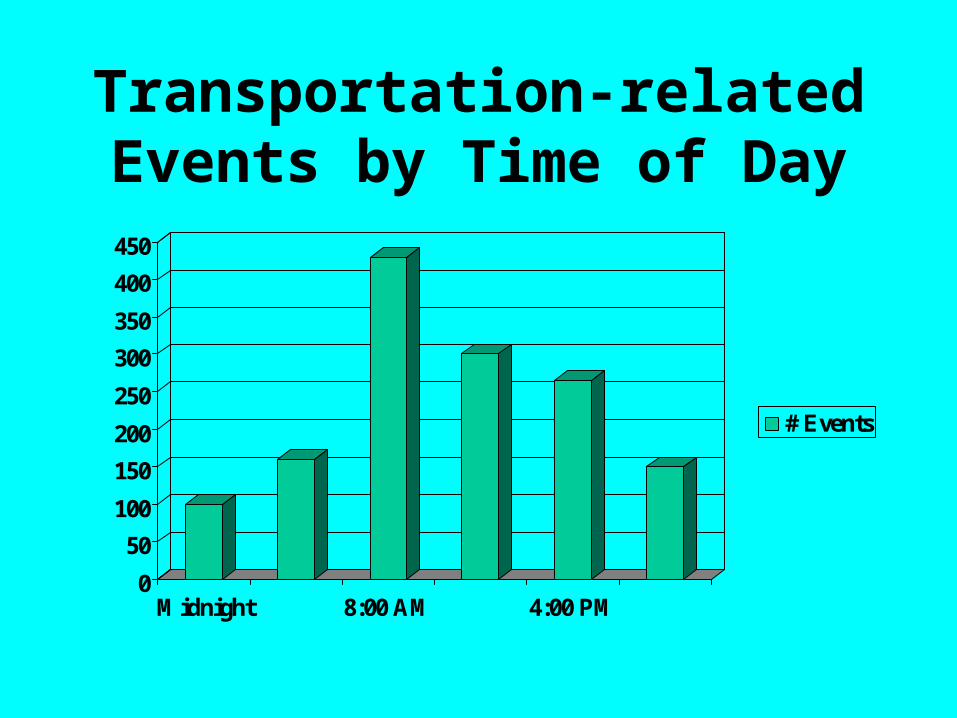
Transportation-related Events by Time of Day
0
50
100
150
200
250
300
350
400
450
Midnight 8:00 AM 4:00 PM
# Events
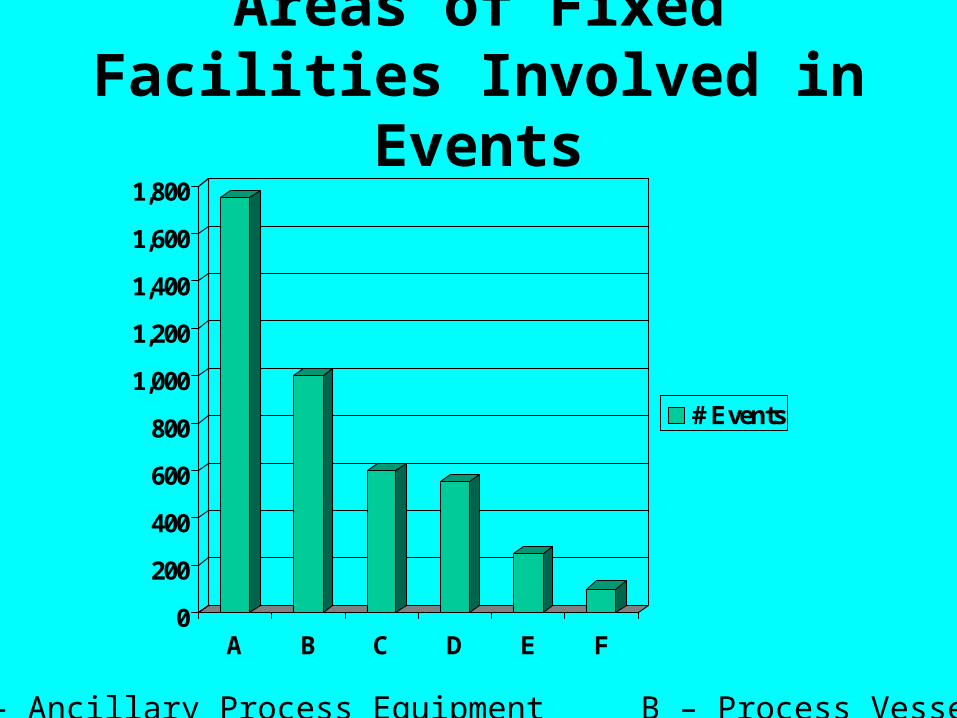
Areas of Fixed Facilities Involved in Events
0
200
400
600
800
1,000
1,200
1,400
1,600
1,800
A B C D E F
# Events
A – Ancillary Process Equipment B – Process Vessel
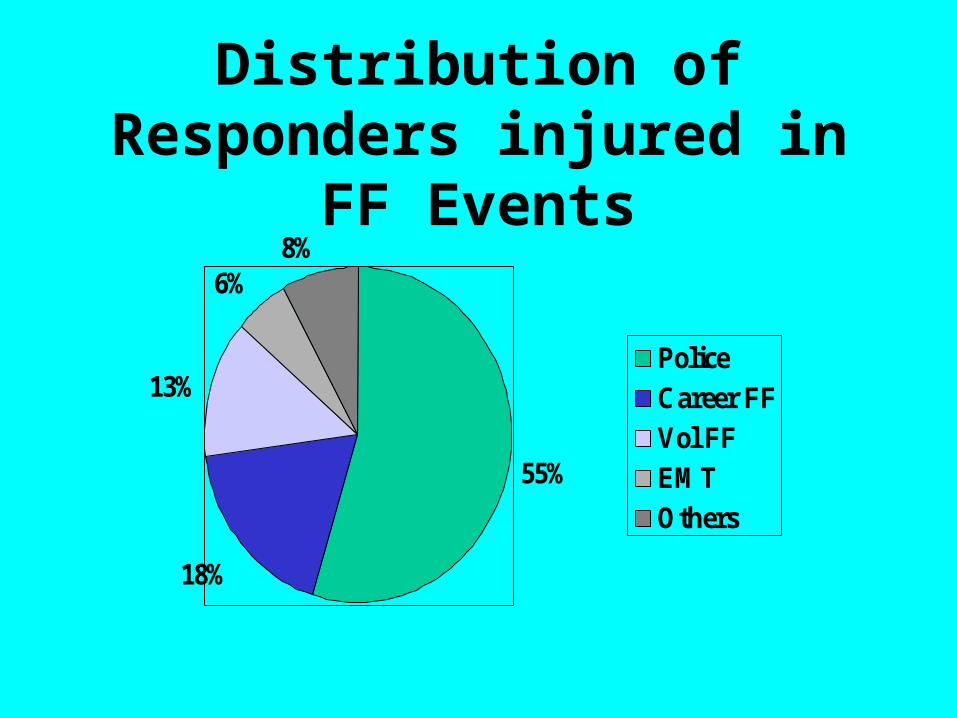
Distribution of Responders injured in FF Events
55%
18%
13%
6%8%
Police
Career FF
Vol FF
EMT
Others
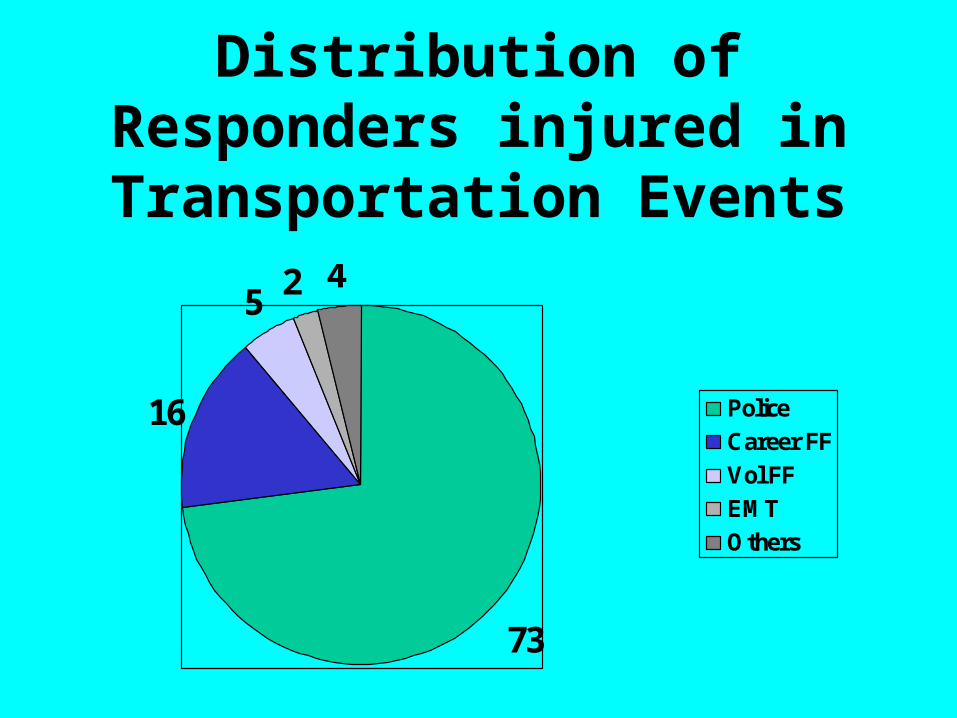
Distribution of Responders injured in Transportation
Events
73
16
52 4
Police
Career FF
Vol FF
EMT
Others
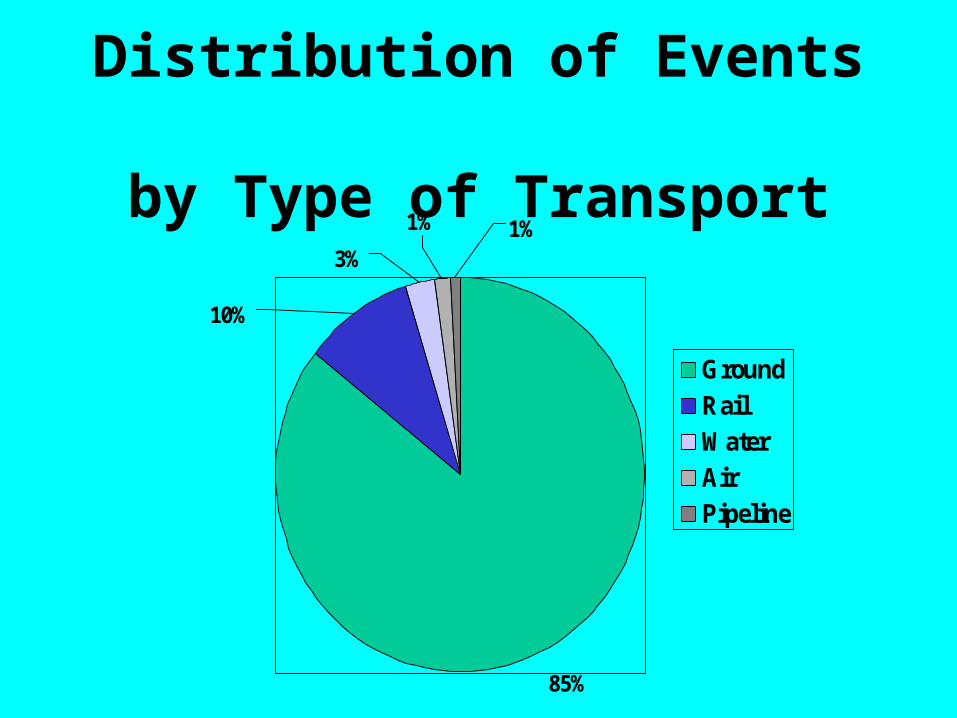
Distribution of Events by Type of Transport
85%
10%
3%1%1%
GroundRailWaterAirPipeline

PART BHealth Study
Phase 1Baseline Assessment
• Monitoring of 19 VOC’s
• Ozone
• Acidic Aerosols
• Metals
• Particles
Phase 2Cross-Sectional Study
• Region wide survey of respiratory and other symptoms among children
• Monitoring of ambient concentrations of selected VOC’s
Phase 3Longitudinal Study
• A four-community survey of daily respiratory symptoms and exposures to acid aerosols, pollens, and selected VOC’s
• A limited study of lung function development, using pulmonary performance measurements
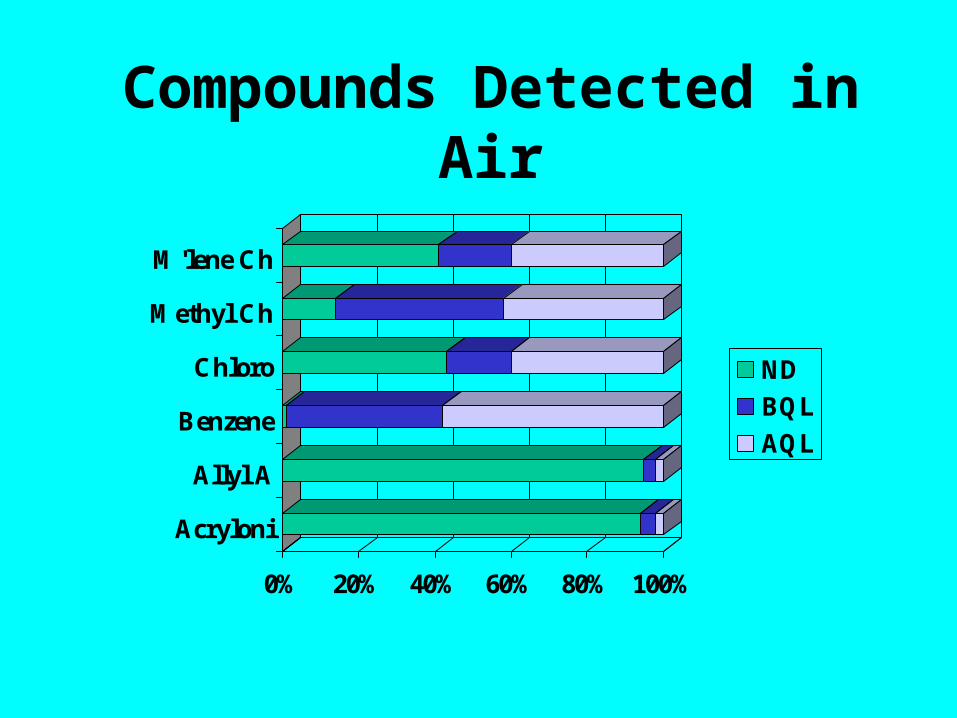
Compounds Detected in Air
0% 20% 40% 60% 80% 100%
Acryloni
Allyl A
Benzene
Chloro
Methyl Ch
M'lene Ch
ND
BQL
AQL
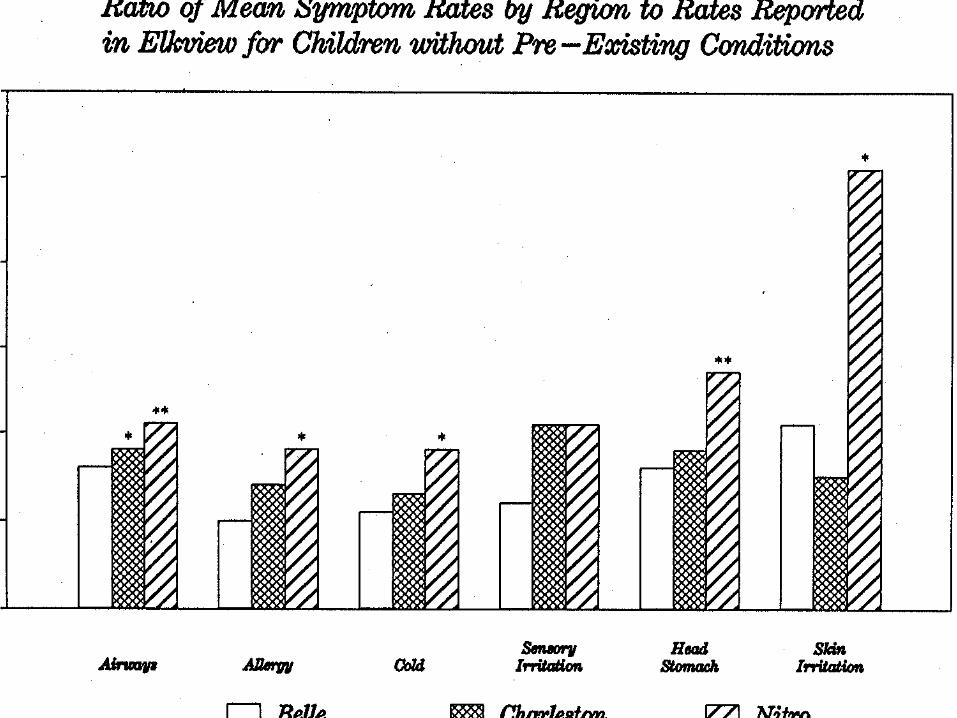
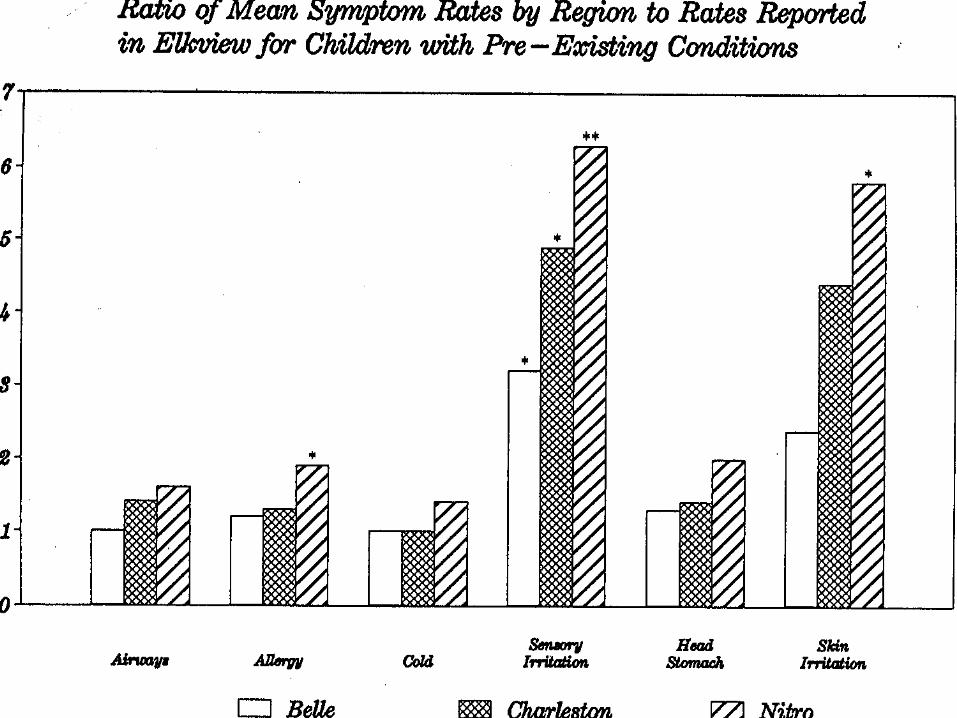
Examine the Relationship between Symptoms of
Irritation of • Eyes
• Nose
• Throat
• Lungs
with Ambient Levels of Chemicals from Industrial Sources in AIR
VOC Exposure Indicator Study
Other Variables affecting the symptoms include :
• Daily pollen counts
• Daily measures of Acid Aerosols
• Daily Ozone pollution
• Daily Temperature
Prevention Outreach Activities(Chemical-Specific)
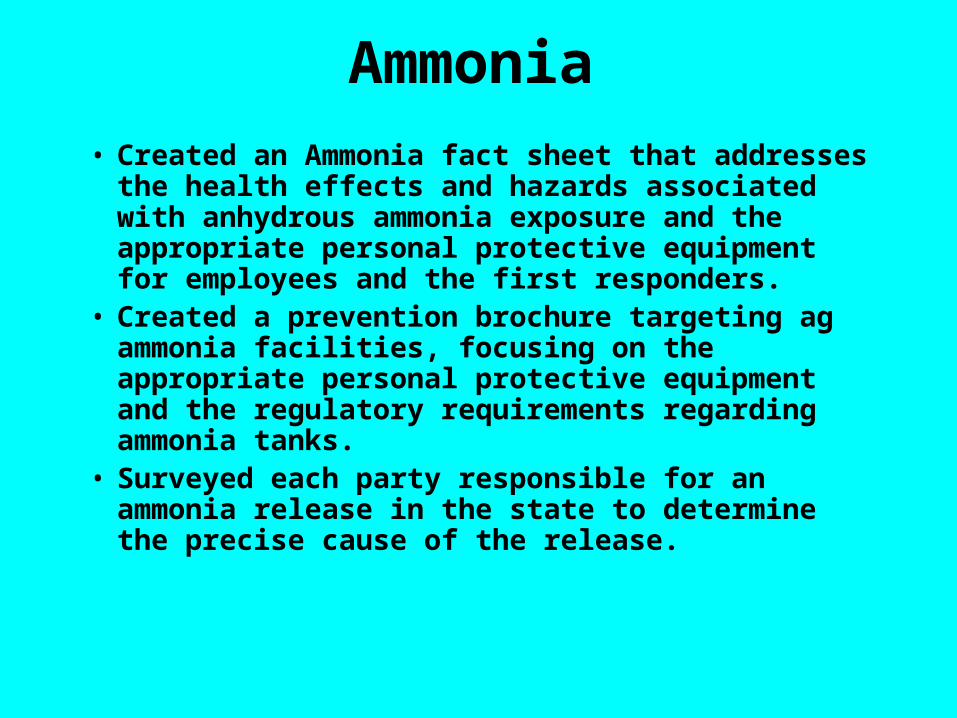
Ammonia
• Created an Ammonia fact sheet that addresses the health effects and hazards associated with anhydrous ammonia exposure and the appropriate personal protective equipment for employees and the first responders.
• Created a prevention brochure targeting ag ammonia facilities, focusing on the appropriate personal protective equipment and the regulatory requirements regarding ammonia tanks.
• Surveyed each party responsible for an ammonia release in the state to determine the precise cause of the release.
Chlorine
• Distributed fact sheets to chlorine producers and businesses that operate swimming pools and spas
• Presented data on chlorine releases to state and local agencies that regulate the chlorine industries
• Presented data on chlorine releases to personnel in public and private schools containing swimming pools.
Mercury
• Created mercury fact sheets to distribute at meetings and presentations and on state health department websites. Also distributed fact sheets to school administrators.
• Provided data on mercury releases to help scientifically support a bill to ban the sale of mercury thermometers in the state.
Summary
• Largest proportion of events occurred in Fixed Facilities.
• The number of reported transportation related events are increasing, primarily due to advanced reporting by DOT’s HMIS.
• Some states have reported increases in events. We feel it is due to expansion of reporting sources.
Summary
• In events involving victims, respiratory symptoms have been most frequently reported.
• Deaths associated with events suggest a need to evaluate danger of exposure to hazmats and circumstances surrounding the events. Examples …..
• Employees continue to be the largest group of victims in emergency events.
Conclusion
• Collaboration • Training and Education• Stronger commitment to Responsible Care• Expanded role of PCC, CDC, ATSDR, DHS,
EPA, DHHS, LEPC, SERC, DOT• Enhanced site security and maintenance• Modernized storage practices• Adequate funding