study of lubricant circulation in hvac systems results... · study of lubricant circulation in hvac...
TRANSCRIPT

R96-5.400.0008-3 DOE/CE/23810-71
STUDY OF LUBRICANT CIRCULATIONIN HVAC SYSTEMS
Volume I - Description of Technical Effort and Results
Final Technical ReportMarch 1995 - April 1996
Frank R. BiancardiH. Harvey Michels
Tobias H. SienelDennis R. Pandy
UNITED TECHNOLOGIES RESEARCH CENTER411 Silver Lane
East Hartford, CT 06108
October 1996
Prepared forThe Air-Conditioning and Refrigeration Technology Institute
UnderARTI MCLR Project Number 665-53100
This program is supported, in part by U.S. Department of Energy (Office of Building Technology grantnumber DE-FG02-91CE23810: Materials Compatibility and Lubrication Research (MCLR) on CFC-Refrigerant Substitutes. Federal funding supporting this program constitutes 93.5% of allowable costs.Funding from non-government sources supporting this program consists of direct cost sharing of 6.43% ofallowable costs, and significant in-kind contributions from the air-conditioning and refrigeration industry.

DISCLAIMER
The U.S. Department of Energy's and the air-conditioning industry's supportfor the Materials Compatibility and Lubricants Research (MCLR) programdoes not constitute an endorsement by the U.S. Department of Energy, nor bythe air-conditioning and refrigeration industry, of the views expressed herein.
NOTICE
This report was prepared on account of work sponsored by the United StatesGovernment. Neither the United States Government, nor the Department ofEnergy, nor the Air-Conditioning and Refrigeration Technology Institute, norany of their employees, nor of any of their contractors, subcontractors, ortheir employees, makes any warranty, expressed or implied, or assumes anylegal liability or responsibility for the accuracy, completeness, or usefulnessof any information, apparatus, product or process disclosed or represents thatits use would not infringe privately-owned rights.
COPYRIGHT NOTICE(for journal publications submissions)
By acceptance of this article, the publisher and/or recipient acknowledgesthe right of the U.S. Government and the Air-Conditioning andRefrigeration Technology Institute, Inc. (ARTI) to retain a non-exclusive,royalty-free license in and to any copyrights covering this paper.
ABSTRACT
The United States heating, ventilation and air-conditioning (HVAC) industry andrefrigeration industry are rapidly and aggressively moving away from the currently usedchlorofluorocarbon (CFC) and hydrochlorofluorocarbon (HCFC) refrigerants to new, non-ozonedepleting hydrofluorocarbon (HFC) refrigerants across a wide range of product lines. Thismassive undertaking requires careful assessment of the performance, operational capabilities,durability, and long-time reliability of HVAC products with these new HFC refrigerants andlubricants. Among the more important considerations in the change toward HFC refrigerants isthe selection of lubricants that provide the same or improved characteristics relative totraditional mineral oils and alkylbenzene lubricants. Two of the more important characteristicsof an acceptable lubricant, in addition to stability, cost and lubricity, are miscibility andsolubility characteristics with the new HFC refrigerants.
In general, the lubricant circulation behavior of new HFC refrigerants with mineral oils(MO), polyolesters (POEs), and alkylbenzenes (AB) has not been well characterized for HVACsystems. Universal guidelines need to be developed for various compressor types,configurations, piping arrangements and other system features.
The purpose of this program was to conduct experimental and analytical efforts todetermine lubricant circulation characteristics of new HFC/POE pairs and HFC/mineral oil pairsin a representative central residential HVAC system and to compare their behavior with thetraditional HCFC-22/mineral oil (refrigerant/lubricant) pair.
A dynamic test facility was designed and built to conduct the experimental efforts. Thisfacility provided a unique capability to visually and physically measure oil circulation rates, on-line, in operating systems. A unique on-line ultraviolet-based measurement device was used toobtain detailed data on the rate and level of lubricant oil circulated within the operating heatpump system.
The experimental and analytical data developed during the program are presented as afunction of vapor velocity, refrigerant/lubricant viscosity, system features and equipment. Bothvisual observations and instrumentation were used to understand "worst case" oil circulationsituations.
As a result of the comprehensive analytical and experimental efforts undertaken during thisprogram, heat pump system operational regimes where poor oil management situations can occurhave been defined and can be explained for an HFC-blend (R-407C) and HCPC-22 with avariety of miscible and immiscible lubricants (POEs and mineral oils). The operating regimeswhere poor oil return (i.e., near zero oil return) occurs can be related to low vapor velocity inselected portions of the systems, usually the vertical vapor lines. These vertical line locations,however, are different for the cooling and heating modes. These minimum flow velocities weredetermined by visual observations of oil return in an operating heat pump, as well as on-line oilconcentration measurement instrumentation. The flow velocity levels predicted by the existingASHRAE guidelines for good oil management were compared with the measured and observedconditions in this test sequence and some good correlations as well as areas for improvementwere found to exist.
i
R96-5.400.0008-3 DOE/CE/23810-71

A surprising result of the program was the relative ease with which good oil return wasobtained, even with an immiscible mineral oil and the R-407C blend. The potential forsignificant cost reductions due to the use of lower cost lubricants such as mineral oils rather thanPOEs should be noted. However, mineral oils, used as lubricants in combination with HFCrefrigerants, must also be proven to provide good lubricity and thermal stability in modern highperformance scroll compressors before their use can be widely adapted for industry. The lowerlimits of refrigerant/lubricant mixture viscosities were not severely tested in the programs,although normal operating regimes of heat pumps were explored. Ten to twenty degree lowertemperatures and perhaps as low as -20°F saturation conditions should be tested to fully exploreviscosity effects on oil management.
This report is presented in two volumes. Volume I contains a complete description of theprogram scope, objective, test results summary, conclusions, description of test facility andrecommendations for future effort. Volume II contains all of the program test data essentially astaken from the laboratory dynamic test facility during the sequence of runs.
ii
R96-5.400.0008-3 DOE/CE/23810-71

ACKNOWLEDGMENTS
During the course of this program, the authors were assisted in several areas. Theseincluded preparation of analytical data and figures by Ms. Judith Addison; calibration and priortesting of the oil concentration measuring device by Mr. Ron Drost and extensive laboratorytesting and data recording by Mr. William Rioux. Our thanks to all of the people for their aid inperforming the work, data analysis and conducting some of the experiments.
During the formulation of the program tasks and interpretation of results andinstrumentation needs and location, the team received substantial direction and assistance fromthe ARTI technical and program subgroup. The individuals are listed below.
ARTI Project Monitoring SubgroupDr. Thomas Leck (DuPont)Dr. Keshav Sanvordenker (Tecumseh)Mr. Sonny Sundaresan (Copeland)Dr. Leonard Van Essen (Lennox)Mr. Glenn Hourahan (ARTI) - Program Manager
Our sincere thanks to all these individuals for their cooperation, suggestions, insights andpatience.
iii
R96-5.400.0008-3 DOE/CE/23810-71

R96-5.400.0008-3 DOE/CE/23810-71
Study of Lubricant Circulation in HVAC Systems
Volume 1 - Description of Technical Efforts and Results
TABLE OF CONTENTS
Page
ABSTRACT ...................................................................................................................... i
ACKNOWLEDGMENTS ............................................................................................. iii
LIST OF TABLES ......................................................................................................... vi
LIST OF FIGURES ...................................................................................................... vii
LIST OF ACRONYMS AND TERMS....................................................................... viii
PROGRAM OUTLINE ................................................................................................. ixProgram Objective . .............................................................................................................................. ix
Program Approach and Scope . ............................................................................................................ ix
INTRODUCTION ...........................................................................................................1TASK 1- GATHER AND REVIEW AVAILABLE DATA .........................................3
Background ........................................................................................................................................... 3Miscible Lubricants ....................................................................................................................... 3Refrigerants and Immiscible Lubricants ........................................................................................ 4Lubricant Particle Mechanism Formulation .................................................................................. 4
Subtask 1A - Oil Management Industry Service Practices and Problems Survey ................................ 5Industry Guidelines ........................................................................................................................ 5ASHRAE Procedure ...................................................................................................................... 5Industry Personnel Interviews . ...................................................................................................... 7
Subtask 1B - Miscibility and Viscosity of Refrigerant/Lubricant Pairs ................................................ 8
TASK 2 - DESIGN, FABRICATE, INSTALL INSTRUMENTATION ANDCONDUCT EXPERIMENTS IN DYNAMIC TEST FACILITY .......................20Introduction ......................................................................................................................................... 20Task 2 - Part 1. Identification of Worst Case Oil Return Situations .................................................... 20
Dynamic Test Facility Design Guidelines ................................................................................... 20Criteria for Design of Test Apparatus .......................................................................................... 21Test Rig Design Considerations and Test Procedure ................................................................... 21
Task 2 - Part 2. Design and Fabrication of Test Apparatus ................................................................. 23Subtask 2A - Design and Fabrication of Test Apparatus ............................................................. 23
Vapor Velocity Simulation . .................................................................................................. 23Configuration and Length ..................................................................................................... 24Manifold Behavior ................................................................................................................ 24
Cooling mode ................................................................................................................ 24Heating mode . ............................................................................................................... 25Viscosity and liquid line flow ........................................................................................ 25
Subtask 2B - Selection and Installment of Instrumentation ......................................................... 25Refrigerant Gas Velocity/Mass Flow Rate . .......................................................................... 25Temperature and Pressure Profiles . ...................................................................................... 25Change in the Compressor Oil Level .................................................................................... 26
iv

R96-5.400.0008-3 DOE/CE/23810-71
Indoor Environmental Chambers (IECs) ............................................................................. 26Pressure and Temperature Data Acquisition ........................................................................ 26Oil Flow Rate and Distribution of Oil in the System ........................................................... 26
Ultraviolet absorption device ........................................................................................ 26Ultrasonic device .......................................................................................................... 28
Oil Circulation Data and Measurement Techniques ............................................................ 28UV Oil Meter Calibration Technique .................................................................................. 28
Subtask 2C - Oil Selection and Property Verification ................................................................ 30Subtask 2D - Test Plan ................................................................................................................ 31
Oil Replacement Procedure ................................................................................................. 32Subtask 2E - Test Sequence and Data Analysis .......................................................................... 32
Test Procedure ..................................................................................................................... 32Oil Return Measurements and Observations ........................................................................ 33Oil Sump Video Monitoring and Display ............................................................................ 33
TASK 3 - DATA COLLECTION, ANALYSIS, RESULTS, REVIEW, ANDFORMULATION OF PROGRAM CONCLUSIONS .........................................43Description of Typical Data ............................................................................................................... 43
Cooling Mode Tests .................................................................... ............................................... 44
Heating Mode Tests .................................................................................................................... 49
Test Results Summary ........................................................................................................................ 55
Data Observations .............................................................................................................................. 56
MAJOR RESULTS AND CONCLUSIONS ...............................................................61Results ................................................................................................................................................ 61
Conclusions ........................................................................................................................................ 62
RECOMMENDATIONS ..............................................................................................64REFERENCES ..............................................................................................................65
Note: Volume II contains all the program test data essentially as taken from the laboratorydynamic test facility during the sequence of runs.
v

vi
LIST OF TABLES
Table Page
1.1 Viscosity-Temperature Characteristics of Lubricants ................................................. 6
1.2 Approximate Limiting Minimum Vapor Velocities for Marginal Oil Return
Representative Refrigerants in Typical 2.5 to 3 Ton Capacity
Heat Pump Split System .............................................................................................. 7
1.3 Refrigerant/Lubricant Miscibility Data ...................................................................... 10
2.1 Dynamic Test Facility Features and Operating Range ............................................... 22
2.2 Comparison of Oil Concentration Measurement Methods ........................................ 27
2.3 Experimental Calibration Data for UV Oil Concentration Meter with R-407C
at Temperatures from 16.5°C to 18.8°C (61.7°F to 64.2°F) ...................................... 30
2.4 Lubricant Physical Properties ..................................................................................... 30
2.5 Original Test Plan ....................................................................................................... 31
3.1 Tests Run with Test Number ...................................................................................... 43
3.2 Indoor Unit Manifold Liquid Levels During Cooling Mode Tests ............................ 44
3.3 Outdoor Unit Manifold Liquid Levels During Heating Mode Tests ......................... 55
3.4 Summary of Oil Return Problems for Refrigerant and Lubricant Combinations ...... 58
3.5 Minimum Velocities Needed for Oil Return Problem ............................................... 59
3.6 Complete Test Matrix Flow Velocity Details ............................................................ 60
R96-5.400.0008-3 DOE/CE/23810-71

vii
R96-5.400.0008-3 DOE/CE/23810-71
LIST OF FIGURESFigure Page
1.1a Heat Pump Layout (Worst Case Cooling Model) ...................................................... 111.1b Heat Pump Layout (Worst Case Heating Model) ...................................................... 111.2 Kinematic Viscosity of R-22/Suniso 3GS Mixtures .................................................. 121.3 Pressure-Temperature Diagram for R-22/Suniso 3GS .............................................. 131.4 Miscibility of R-22 in Suniso 3GS ............................................................................ 141.5 Miscibility of R-407C with Lubricants ...................................................................... 151.6 Kinematic Viscosity of R-407C/Castrol SW32 Mixture ........................................... 161.7 Kinematic Viscosity of R-407C/ICI Emkarate RL32S Mixture ................................ 171.8 Kinematic Viscosity of R-407C/Castrol SW68 Mixture ........................................... 181.9 Kinematic Viscosity of R-407C/ICI Emkarate RL68S Mixture ................................ 192.1 Oil Circulation Program Dynamic Test Facility - Cooling Mode ............................. 342.2 Oil Circulation Program Dynamic Test Facility - Heating Mode ............................. 352.3 Indoor Unit Vapor Manifold (BB) ............................................................................. 362.4 Outdoor Unit Vapor Manifold (AA) .......................................................................... 372.5 Lab Arrangement ....................................................................................................... 382.6 Typical Manifold Flooding Behavior ........................................................................ 392.7 Absorbence vs. Concentration for R407C/Castrol SW32 .......................................... 402.8 Compressor Oil Circulation Measurement with R134a/POE .................................... 412.9 Ultraviolet Oil Concentration Meter Test Results ..................................................... 423.1 Heat Pump R407C - Castrol SW68 Oil Circulation Tests (15 & 16)
Cooling Mode - No Oil Injection - System Temperatures ......................................... 453.2 Heat Pump R407C - Castrol SW68 Oil Circulation Tests (15 & 16)
Cooling Mode - No Oil Injection - System Pressures ............................................... 463.3 Heat Pump R407C - Castrol SW68 Oil Circulation Tests (15 & 16)
Cooling Mode - No Oil Injection - Air Side Temperatures ....................................... 473.4 Heat Pump R407C - Castrol SW68 Oil Circulation Tests (15 & 16)
Cooling Mode - No Oil Injection - Oil Flows ........................................................... 483.5 Heat Pump R407C - Castrol SW68 Oil Circulation Tests (15 & 16)
Heating Mode - No Oil Injection - System Temperatures ......................................... 503.6 Heat Pump R407C - Castrol SW68 Oil Circulation Tests (15 & 16)
Heating Mode - No Oil Injection - System Pressures ................................................ 513.7 Heat Pump R407C - Castrol SW68 Oil Circulation Tests (15 & 16)
Heating Mode - No Oil Injection - Air Side Temperatures ....................................... 523.8 Heat Pump R407C - Castrol SW68 Oil Circulation Tests (15 & 16)
Heating Mode - No Oil Injection - Oil Flows............................................................. 533.9 Heating Mode Manifold Accumulation ..................................................................... 54

R96-5.400.0008-3 DOE/CE/23810-71
LIST OF ACRONYMS AND TERMS
AB alkylbenzeneACRC Air-Conditioning and Refrigeration Center, University of IllinoisAC&R Air-Conditioning and RefrigerationAREP Alternative Refrigerants Evaluation ProgramARI Air-Conditioning and Refrigeration InstituteARTI Air-Conditioning and Refrigeration Technology Institute, Inc.ASHRAE American Society of Heating, Refrigeration and
Air-Conditioning Engineers, Inc.CFC chlorofluorocarboncSt centistokeDOE-A Department of Energy - Standard Cooling Rating Conditionfpm feet per minuteHCFC hydrochlorofluorocarbonHFC hydrofluorocarbonHVAC Heating, Ventilation and Air-ConditioningIEC indoor environmental chamberMCLR Materials Compatibility and Lubricants ResearchMO mineral oilPOE polyolester (lubricant)PTAC package terminal air conditionerSUS Saybolt Universal SecondsUTC United Technologies CorporationUTRC United Technologies Research CenterUV ultravioletWRAC window room air conditioner
viii

ix
PROGRAM OUTLINE
Program Objectives
The overall objectives of this analytical and experimental program were: 1) to determine thefundamental lubricant return parameters for HFC/POE mixtures so as to characterize howdifferent refrigerant/lubricant mixtures affect the return of lubricant to the compressor, and 2) todetermine fundamental lubricant return parameters for HFC/mineral oil mixtures to assessconditions where immiscible systems can provide sufficient lubricant return.
Program Approach and Scope
The overall program approach undertaken to meet this objective was: 1) to identify poor oilreturn scenarios and, therefore, the worst case oil return parameters for conventional residentialHVAC systems using HCFC-22 and mineral oils, in terms of compressor, suction and exhaustline vapor velocity, and refrigerant viscosity requirements, 2) design and instrument a testapparatus that simulates such conditions, as well as those that might be achieved with HFC andPOE mixtures and HFCs and mineral oils, 3) conduct tests with the range of baselinerefrigerants and lubricant mixtures to provide experimental data, and 4) prepare, present andinterpret the test data to provide an expanded understanding of the phenomena required for goodoil circulation in split-system heat pump systems.
To convert this general approach into the program specifics, three major tasks were definedand pursued. These are described briefly below and in greater detail in the report body as Task 1,Task 2, and Task 3.
Task 1 consisted of gathering and reviewing available data. Within Task 1, an improvedunderstanding of the lubricant circulation mechanism in refrigeration and HVAC systems wasdeveloped, along with the industry standard procedures and limitations on vapor velocity,viscosity and miscibility of the refrigerant/lubricant mixture. This included a review of theASHRAE design guidelines, as well as discussions with system designers and manufacturers.Design parameters and features to be used as guidelines to construct a dynamic test facility weredeveloped in this task. As part of this task, we also attempted to identify specific vapor velocityand viscosity limits that were to be tested in the experimental facilities with the various baselineand experimental refrigerant and lubricant mixtures, i.e., HCFC-22, R-407C and POEs andmineral oils. In the second part of this task, we reviewed the available data for refrigerants andlubricants and selected representative POE and mineral oil lubricants that covered the range ofviscosity and miscibility anticipated in HVAC systems.
Task 2 consisted of the instrumentation design, fabrication and installation, and theexperiment conduction in the dynamic test facility. The Task 1 data was used to design and builda dynamic test facility in which both good and poor oil management regimes could beexperimentally explored so that broad on-line visual and instrumentation observations of oilreturn could be simulated. Instrumentation for proper observation and on-line oil measurementswere screened, designed and installed. A series of tests with the various HCFC, HFC and POEand mineral oil combinations were prepared and extensive data gathered.
R96-5.400.0008-3 DOE/CE/23810-71

x
Task 3 consisted of data collection, analysis, results, review and formulation of the programconclusions. More than fifty test runs were actually conducted in the dynamic test facility,reviewed and assessed for consistency. Broad as well as very specific conclusions and resultswere recorded. Much of the data is based on visual observations of poor oil return scenarios.Finally, broad guidelines as to acceptable flow velocities for "good" and "poor" oil managementare provided for use by HVAC industry designers, manufacturers and installers.
R96-5.400.0008-3 DOE/CE/23810-71

R96-5.400.0008-3 DOE/CE/23810-71
INTRODUCTION
Under the provisions of the Montreal Protocol, CFCs and HCFCs, the backbonerefrigerants for the air conditioning and refrigeration industry products for the last five decades,are being phased out or their usage is being capped. Because of their deleterious effect on theglobal ozone layer, this phase out and production capping is starting in 1996.
The HVAC and refrigeration industry leaders are rapidly and aggressively moving awayfrom the currently used CFC and HCFC refrigerants to new, non-ozone depleting HFCrefrigerants across their extensive product lines. This massive undertaking requires carefulassessment of the performance, operational capabilities, durability, and longtime reliability oftheir products. Among the more important considerations in the change towards HFCrefrigerants is the selection of lubricants that provide the same or improved characteristicsrelative to the traditional mineral oils and alkylbenzene lubricants. The new synthetic lubricants,primarily polyolesters (POEs) are being chosen for use with HFCs because of their favorablestability, lubricity and miscibility characteristics. Because the POE lubricants are miscible withthe new HFC refrigerants over a wide range of temperatures, they could provide similarlubricant characteristics to the old, familiar CFC and HCFC systems, which largely used mineraloils. However, each type of HVAC system utilizes different compressor types, configurations,piping arrangements and other features so that universal guidelines are difficult to apply.
Among the new HFC refrigerants that are being evaluated, are a substantial number ofrefrigerant blends as substitutes for HCFC-22 in residential building air conditioning and heatpump applications. Analytical predictions and system tests have indicated that there are certainperformance, capacity, operational advantages and potential size and weight improvements withthe use of HFC refrigerants and blends. However, these blends can introduce significant serviceand operational issues, due to fractionation of the blends. Even in those blends which do notexperience fractionation, a serious concern to the HVAC industry are other potential operationaland reliability issues. These issues can take the form of long-term reliability in typical systeminstallations. One such concern is associated with the oil return characteristics and potentiallydifferent mechanisms that might be observed with new HFC refrigerants and appropriatelubricants such as polyolesters (POEs). The POEs appear to have the correct lubricity andthermal and chemical stability to meet the challenges of today's high performance compressors,but what is largely unknown are the proper oil management techniques to ensure that oil returnto the compressor is achieved and that the compressors, and thus overall system, will functionreliably for at least fifteen years of operation.
A second issue is the potential use of low cost lubricants, such as mineral oils, even thoughthey are immiscible with most HFC refrigerants. Mutual solubilities of the new HFC/POE pairsare very different from those of the CFC/HCFC refrigerant/mineral oil pairs they are intended toreplace. Similarly, interfacial surface tension properties of conventional refrigerant/lubricantpairs show differences when compared with the newer HFC/POE combinations. In actualoperating systems, there are still many unanswered questions about the behavioral differencesbetween the old and new refrigerant/lubricant pairs. Thus, the subject program was aimed atstudies designed to obtain fundamental data to better understand the oil return parameters for thenew versus the old refrigerant/lubricant pairs. The data generated in this study will aid in the
1

assessment of how the differences in the physical properties affect system reliability and oilreturn mechanisms.
Because of the high cost and operational considerations associated with the POEs, thecomponent and system manufacturers are interested in the possibility of using immisciblemixtures of HFCs and mineral oil or alkylbenzene lubricants in air conditioning/heating andrefrigeration systems. A major impediment to this strategy is the uncertainty of the return to thecompressor of the immiscible lubricant which still must have a high enough viscosity toeffectively lubricate the compressor. Therefore, it is imperative that the fluid properties ofimmiscible refrigerant/lubricant mixtures and their impact on the system operation be wellunderstood. The data generated in this study will also help determine whether immisciblerefrigerant/lubricant mixtures might be successfully applied with HFCs.
United Technologies Research Center (UTRC) has recognized these problems and has takenspecific actions to insure that lubricant circulation in systems can be measured and that there aretechniques in place to improve the understanding of adequate lubricant return with miscibleHFC/POEs and possibly immiscible mixtures of HFCs with mineral oils and alkylbenzenelubricants in air-conditioning and refrigeration (AC&R) systems. In particular, UnitedTechnologies Corporation (UTC) has developed and assembled the following backgroundmaterial for application to the present oil circulation study:
1) Detailed computer models have been developed and verified by experimental resultsthat predict the solubilities and fractionation effects of various HFCs mixtures and POElubricants. These models and data were developed in large part under an ARTI-sponsored UTRC program (MCLR Project No. 660-52300) and under corporatesponsorships;
2) A comprehensive model has been developed under ARTI sponsorship, which describesthe concentration of lubricant and HFC blends in typical heat pump systems duringstartup, shutdown, and various modes of operation;
3) Actual oil circulation rate measurements were carried out at Carrier and included aspart of the performance tests and data provided by Carrier under the AlternativeRefrigerants Evaluation Program (AREP) Soft Optimization Program efforts on a splitsystem 5-ton heat pump;
4) Accumulated knowledge and detailed installation information were provided by CarrierResidential personnel based on their installation of hundreds of thousands of heatpumps and air conditioners each year;
5) Several new techniques for measuring, in situ, oil concentration rates with HFCsimmiscible/miscible lubricants were developed and tested at UTRC.
The subject program was aimed at understanding refrigerant/lubricant circulation issues,developing test data and approximate models that can predict operating regimes where good oilmanagement can be assured. A dynamic test facility was constructed and used to examine oilreturn under varying system operating conditions. The development of industry guidelines forsystem reliability in using the new refrigerant blends was a goal of this program. To validate theguidelines, techniques and predictions, this dynamic test facility was used to obtain data tocompare to the analytical predictions.
2
R96-5.400.0008-3 DOE/CE/23810-71
TASK 1 - GATHER AND REVIEW AVAILABLE DATA
The objective of this task was to gain a more thorough understanding of the lubricantcirculation mechanisms in refrigeration systems, with particular emphasis on certain key factors.These factors are the role of refrigerant vapor mass flux, as well as refrigerant/oil miscibility andsolubility and resulting mixture properties such as viscosity and surface tension. Two activitieswere undertaken: 1) a general review of industry practices and design approaches in HVACsystems, especially for split-system residential air conditioners and heat pumps, and 2)development of parameter limits for viscosity, flow velocity and possibly miscibility, to beinvestigated for the refrigerant/lubricant pairs in the dynamic test apparatus to be built and usedto obtain experimental verification of oil management.
In the sections which follow, background information of the industry practices and problemsare provided, followed by a discussion of the specific flow velocity and viscosity parameters tobe evaluated. How the refrigerant/lubricant mixtures to be tested fit within these guidelines and adescription of the specific data is also presented in this section.
Background
In a typical refrigeration system for comfort cooling and heating, such as the heat pumpshown in Fig. 1, the lubricant is typically introduced to the compressor suction port from mistcreated in the sump region and interaction of the refrigerant with the oil return flow from thebearings. The lubricant is necessary for separating and sealing the compression surfaces andvalves of most positive displacement type compressors. Additional lubricant may be directlyintroduced to the compressor, if the suction mist is insufficient. The lubricant is then dischargedwith the hot refrigerant gas and, in low-side compressor, circulated throughout the system, suchas shown in Fig. 1.1a.
Miscible Lubricants
Miscible lubricants dissolve in the condensing refrigerant (in the outdoor section when theheat pump is functioning in the cooling mode) and are readily carried to the expansion valve. Thelubricant separated in the evaporator is returned to the compressor by gravity and drag force fromthe refrigerant gas. The gas velocity necessary for recommended or good oil return (typically1350 to 1500 fpm for up flow) is achieved by sizing return lines for these flow conditions.Therefore, a critical or worst oil return condition is likely to be at the evaporator exit (the indoorsection in the cooling mode), where the vapor refrigerant line is located that feeds into theaccumulator (see Fig. 1.1a). The range of these flow parameters will be discussed in greaterdetail below.
During the heating mode in a heat pump, the worst case oil circulation condition will tend tobe found in the vapor line leaving the compressor that feeds the indoor section, where theevaporator serves as the system condenser. This is shown in Fig. 1.1b. Maximum heightparameters are sometimes used to indicated worst case oil circulation conditions. However, it isnot uncommon for split-system installations to have vertical separations of 30 to 100 feet andstill provide adequate oil circulation. Flow velocity, rather than maximum height, may thereforebe the critical design parameter.
3
R96-5.400.0008-3 DOE/CE/23810-71

Refrigerants and Immiscible Lubricants
Refrigerants and immiscible lubricants will circulate in much the same fashion, except thatrefrigerant and lubricant stratification and therefore pooling, with oil and refrigerant formingdifferent phases, can exist in the liquid regions of the circuit. However, unlike the situation withmiscible refrigerant/oil mixtures, immiscible lubricants could also have a higher effectiveviscosity since minimum (or zero) thinning will occur due to refrigerant dilution of the lubricant.It is well known that even a small percentage (0 to 10%) of refrigerant can substantially reducelubricant viscosity. Therefore, one could postulate poorer oil return during cold evaporatoroperation as a consequence. However, recent experience, as part of the AREP efforts, withHFC-407C and alkylbenzene in a split system heat pump revealed no lubricant return problemsduring a possible worst case scenario that included elevating the outdoor unit 17 feet above theindoor coil (Ref. 1).
Lubricant Particle Mechanism Formulation
From experience and systems results, it is apparent that refrigerant gas dynamic heat(1/2ρV2) and lubricant particle size are keys to lubricant transport in the gas phase regions of asystem. Considering the relatively low velocities that are adequate for lubricant transport,mechanisms for relatively small lubricant particle size generation must be present in both thecompressor and evaporator. The Weber number, or ratio of inertial forces to surface tensionforces, correlates well with particle size generation. High pressure, temperature, and gasvelocity in the compressor generates high inertial forces and, hence, small particles. Since thedrag of the particle is proportional to the diameter squared and the mass is proportional to thediameter cubed, these smaller particles require less dynamic head for transport. In theevaporator, it is the boiling action of the refrigerant that generates inertial forces adequate forsmall (50 µm) diameter particle creation. In addition, surface tension is reduced, due tolubricant miscibility. At very low temperatures and pressures, the lubricant may becomeimmiscible and its viscosity high. This combination can lead to lubricant accumulation in theevaporator and/or suction line and can be a serious problem preventing oil return to thecompressor sump.
In the two-phase and liquid regions, miscible lubricants dissolve into the refrigerant andare readily transported with the bulk flow. Immiscible lubricants may form an emulsion if thesurface tension is low and adequate inertial forces exist. In this case, lubricant circulation maybe satisfactory. However, at low temperatures, the system mass flow is minimum and lubricantviscosity high. This may lead to lubricant accumulation in low velocity regions.
Refrigerant blends, such as R-407C, introduce the additional complication of compositionshift due to potential fractionation in the two phase components. Such composition shifting caninfluence the lubricant solubility and, therefore, miscibility. UTRC has developed (undercontract to ARTI) static and dynamic system models for several HFC blends and lubricantcombinations to estimate these effects. These models have been modified for R-407C andselected POE lubricants to make accurate estimates of lubricant miscibility during systemoperation. The changes in viscosity due to these fractionation effects were not consideredsignificant for the scope of this study. However, a particularly useful feature of the dynamicmodel is the ability to track the lubricant and refrigerant constituents throughout the system, ifsufficient data are available.
4
R96-5.400.0008-3 DOE/CE/23810-71

R96-5.400.0008-3 DOE/CE/23810-71
In order to understand these fundamental lubricant return parameters for HFC/POE andHFC/mineral oil mixtures, as well as baseline state-of-the-art HCFC-22 and mineral oilmixtures, it is critical to obtain physical data on candidate refrigerant/lubricant pairs. In addition,research conducted on lubricant return mechanisms needs to be identified. A brief review of theavailable data is described in Subtask 1A. In addition, the current heat pump systemconfigurations and operating conditions must be known to correctly identify situations whichcould lead to improper or poor lubricant return. System manufacturers, distributors and installersneed to be surveyed for their service practices and problems to adequately understand thesesituations, as is described in Subtask 1A below.
Subtask 1A - Oil Management Industry Service Practices and Problems Survey
Industry Guidelines
Oil management in refrigeration systems is thoroughly discussed in the ASHRAErefrigeration handbook, Ref. 2, as well as numerous other sources. All refrigerant compressorscirculate some amount of oil throughout the system. Oil separators are used where excessive oilcan affect system performance or where poor oil return conditions exist such as in lowtemperature refrigeration systems, and it is essential that oil be guaranteed to return in thesystem.
For split-system heat pumps, which are the focus of this study, separators are seldom used.Rather, the various system components are designed to assure proper oil flow through the systemand return to the compressor oil sump. The literature review indicates that hot compressordischarge gas will transport the fine oil mist in the refrigerant vapor through hot gas risers ifadequate mass flux or line velocity is maintained.
For air-cooled condensers, this minimum velocity must be maintained in condensing tubesfor transporting both liquid refrigerant and oil. Miscible oil is typically specified to minimize oilfouling of the tubes and to assure good transport through the liquid lines. However, immiscibleoil will also likely be transported through the condenser, since temperatures are relatively highand the resultant oil viscosity low. The exception to this will be for flooded areas where the oiland refrigerant can separate and pool. Here, care must be taken to assure flow of both liquids.
More serious problems can be expected in the evaporator, since the refrigerant evaporatesand the liquid phase becomes enriched in oil. Oil viscosities are selected to assure oil transport atminimum anticipated velocities and temperatures. For the case of oil return up suction risers,line diameters are specified to assure that oil flow is maintained under conditions whereminimum vapor velocity levels are achieved. Accumulators, receivers, and driers must also bedesigned to flow the specified oil under worst case circumstances, such as low temperatureconditions in these components.
ASHRAE Procedure
ASHRAE publishes tables of minimum refrigeration capacity for oil entrainment up suctionand hot gas risers. The experimental and theoretical basis for these tables comes from research atCarnegie-Mellon University (Jacobs et al. 1976, Ref. 3). The minimum mass flux, and hencevelocity, was found to be proportional to gas density and line diameter through the followingrelationship:
5

6
Solving the above equation for a typical range of cooling and heating conditions results inthe minimum flow velocities shown in Table 1.2 for HCFC-22 and R-407C, with representativePOE and mineral oil lubricant viscosities.
Typical equivalent minimum flow velocities are indicated for each refrigerant and cover arange from roughly 369 to 416 fpm for HCFC-22 and a range from 385 to 435 fpm for R-407Cin cooling (therefore, in the suction lines to the compressor). In the heating mode, the minimumflow velocities range from about 200 fpm up to almost 260 fpm at representative saturationtemperatures feeding the hot gas risers coming out of the compressor.
R96-5.400.0008-3 DOE/CE/23810-71
Minimum Mass Flux = 0.7225[ρggcD (ρf - ρg)]½
where
ρg = gas density, lb/ft3
gc = 32.2 ft/sec2
D = pipe diameter, ft
ρf = liquid mixture density (oil and refrigerant), lb/ft3
Viscosity is not directly included in the above expression; however, the equation is stated tobe only valid for viscosities lower than 3000 SUS, or about 650 centistokes (cSt). The oils thatwere considered for this study are all generally less viscous than this limiting value (see Table1.1), if minimum temperatures in selected components are maintained and some small refrigerantdilution of the lubricant occurs.
Table 1.1 Viscosity - Temperature Characteristics of Lubricants
Lubricant Type Temperature (°C) Viscosity (cSt)Witco Suniso 1 GS Mineral oil -20. ---
40. 12.0100. ---
Witco Suniso 3GS Mineral oil -20. 4000.040. 33.0
100. 4.5ICI Emkarate RL32S POE -20. 2310.0
40. 32.0100. 5.6
ICI Emkarate RL68S POE -20. 7356.040. 74.1
100. 10.1Castrol SW32 POE -20. 2000.0
40. 31.0100. 5.9
Castrol SW68 POE -20. 10,000.040. 68.0
100. 9.0

Guidelines (Ref. 3) Apply for Maximum Lubricant Viscosity = 650 cSt or 3000 SUS units.
Industry Personnel Interviews
UTRC interviewed personnel at both Carrier Residential Products Group and CarrierCommercial Unitary Group to obtain information on oil circulation problems that their dealers,installers and distributors had experienced and to help develop "worst case" scenarios for typicalsplit-system heat pumps to be evaluated in this program. Problem areas tended to be in the twophase regions where the gas phase velocity was low and the liquid phase was mostly or all oil.These regions are at the entrance to the condenser, exit of the evaporator and in the accumulator.
7
R96-5.400.0008-3 DOE/CE/23810-71
The method by which the velocity was varied in the actual test system was by means of amanifold of 3/4 inch vapor lines, as discussed in Task 2. Based on the typical refrigerant flowrates that can be achieved in representative, available, scroll-compressors for 2.5 to 3.0 toncooling systems, it was then possible to calculate the number of 3/4 in. diameter lines needed toachieve the minimum mass flow calculated from the Ref. 1 or 3 guidelines. The line size of 3/4in. was selected as a compromise between dynamic facility cost and ability to obtain morediscrete flow velocity data. Since the project purpose was attempting to test the guideline limits,as well as uncover worst case and poor oil management scenarios, it was desired to be able to gosomewhat below the guideline minimal limits.
The Table 1.2 data indicate that guideline minimum flow velocities and below could beachieved with three (3) to four (4) lines in cooling at the representative saturation temperaturesfor the two refrigerants; while in the heating mode, only two or three, 3/4 in. lines would reducethe flow below the recommended limits, and the potential for poor oil management or zero oilreturn would be observed.
In addition to the limits shown by the number of 3/4 in. lines to be opened during testing, itwas further decided that worst case oil return scenarios could be explored by reducing thesaturation temperature in heating, i.e., by lowering the evaporator fan coil airflow or byoperating the test system at lower evaporator temperature levels in the cooling mode.
Table 1.2 Approximate Limiting Minimum Vapor Velocities for Marginal Oil ReturnRepresentative Refrigerants in Typical 2.5 to 3 ton Capacity Heat Pump Split System
Data for Pure HCFC-22 and R-407C; Based on Ref. 3 Guidelines
Velocity in Cooling Mode, ft/min Velocity in Heating Mode, ft/minLocation - Suction Inlet
Line to CompressorLocation - Discharge LineCompressor to Indoor Coil
Temperature, °F Temperature, °FRefrigerant
45°F 32°F 120°F 90°FHCFC-22 369 416 200 255No. of 3/4 in. diameter Lines toAchieve Velocity RequirementsMinimum Flow and Lower
3 to 4 3 to 4 1 2
R-407C 385 435 202 256No. of 3/4 in. diameter Lines toAchieve Velocity RequirementsMinimum Flow and Lower
3 to 4 3 to 4 1 2
8
1 This problem is one subject that was studied at UTRC under the ARTI program "Investigation into Fractionationof Refrigerant Blends": (ARTI MCLR Project No. 660-52300).
R96-5.400.0008-3 DOE/CE/23810-71
The equipment manufacturer has control over some of these locations, so system geometry canbe made specific to prevent marginal oil return problems.
Contractor installations tend to be the greater problem. The manufacturer often has a set ofguidelines to ensure proper system installation in long line applications. In fact, installationswhere the height between the outdoor and indoor units was greater than 100 ft were not unheardof. However, long vapor lines may be of incorrect diameter or pitch, which results in liquid oilaccumulating in low vapor velocity regions. Rather than identify a particular set of geometriesthat represent "worst case" oil return, the manufacturer believes that quantifying the velocityrequired for oil transport up vertical lines for various temperature, oil concentration, and liquidviscosity levels would be more useful for industry information and could be used to warn of"worst case" scenario installations and improper installation procedures.
The Table 1.2 data were reviewed by system manufacturer personnel who are concernedwith poor installation practices and oil return issues and were generally accepted to bereasonably sound.
Subtask 1B - Miscibility and Viscosity of Refrigerant/Lubricant Pairs
The objectives of this subtask were to develop the miscibility and viscosity data and toselect the proper set of refrigerant/lubricant pairs to provide the necessary range of data mixtureproperties to draw conclusions on refrigerant/lubricant oil management and circulationparameters.
The primary considerations in choosing a lubricant are its chemical compatibility with therefrigerant type and the required viscosity for the service application. In the case of refrigerantblends, a new problem arises since the individual refrigerant components may exhibit differentsolubilities in the lubricant.1 Different component solubilities may give rise to fractionationeffects in the system which differ from the vapor-liquid equilibrium conditions in the absence ofa lubricant. These differential solubility effects may also result in conditions where limitedrefrigerant/lubricant miscibility is observed. Operation with lubricants that exhibit limitedmiscibility and with lubricants that exhibit high viscosity could potentially adversely impact bothcycle operating parameters and the overall system durability and performance.
The circulation behavior of the refrigerant/lubricant mixture could depend in part on thethermophysical property data of the mixture. An extensive property data base on singlerefrigerant/lubricant mixtures has been developed at UTRC with input from the majorfluorocarbon chemical producers and lubricant formulators. Recently data have become availableon the properties of several refrigerant blend/lubricant mixtures, including the R-410A/POE,R-404A/POE and R-407C/POE systems. The R-410A and R-404A blends both exhibit an uppermiscibility dome (upper consolute temperature condition) in mixtures with many of thecommonly used POEs. With certain POE formulations, this immiscibility results in two liquidphase formation in the condenser, in contrast to formation of two liquid phases in the evaporatorwhere the lower critical solution temperature often is reached. A careful study of the solubility ofR-407C with several POEs indicates that the upper critical solution temperature is
R96-5.400.0008-3 DOE/CE/23810-71
above 60°C for most POE formulations. Thus only low temperature immiscibility was examinedin choosing the refrigerant/lubricant pairs for this study.
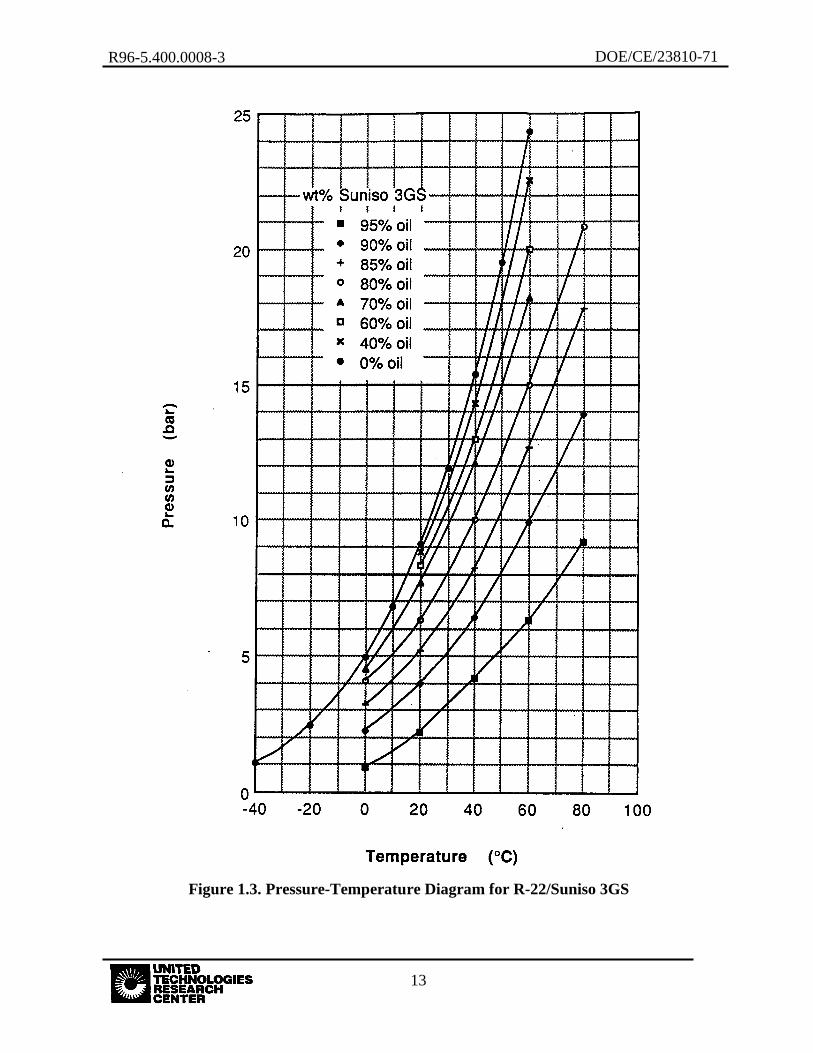
For this program, the baseline for comparison of lubricant circulation was therefrigerant/lubricant pair, R-22/mineral oil, which is widely used in industry. An equallyacceptable combination would be R-22/alkylbenzene since commercial equipment has beensuccessfully operated with both systems. Extensive data on the solubility and viscosity of R-22in either mineral oil or alkylbenzene are available in ASHRAE tabulations or frommanufacturers. Two viscosity grades of mineral oil were selected for study: Suniso grade 3GS(150 SUS), which matches an ISO 32 grade POE in viscosity and Suniso grade 1GS (65 SUS),which mimics the dilution effect of viscosity with a POE ISO 32 grade/refrigerant mixture. Thekinematic viscosity and solubility characteristics of R-22/3GS mixtures are shown in Figs.l.2and 1.3, respectively. The miscibility, data are shown in Fig. 1.4, which indicate a lowerconsolute temperature of ~ -4°C at 20% mass fraction of mineral oil. The Fig. 1.2 viscosity datashould be examined at the typical operating temperatures in Table 1.2 during representativecooling and heating conditions. Furthermore, extreme low temperature operation at 0°F orbelow, representative of refrigeration applications, should be examined before general oilmanagement conclusions are stated for refrigerant/lubricant pairs.
For comparison against the baseline, the R-407C/Suniso 3GS and R-407C/Suniso 1GS pairswere studied to examine the effects of refrigerant/lubricant immiscibility. These HFC/MOsystems should exhibit nearly total immiscibility patterns in the refrigerant rich region, <20%MO. Data are available on the limited miscibility of R-407C in Zerol 150, an ISO 32alkylbenzene lubricant, (Ref. 4), as illustrated in Fig. 1.5. The R-407C/MO systems shouldexhibit a similar miscibility pattern. The miscibility of Emkarate RL68S and RL32S are alsoshown on Fig. 1.5 for comparison.
The circulation behavior of these two baseline refrigerant/lubricant pairs, one partiallymiscible (R-22/MO) and one nearly totally immiscible (R-407C/MO), was then to be comparedwith four R-407C/POE lubricant pairs. Preliminary data, taken at Carrier Corporation, on therefrigerant/lubricant circulation patterns in a split system heat pump suggest that viscosityeffects should be studied using POEs which exhibit significantly different ISO ratings. Several.low viscosity (ISO 32) R-407C/POE mixtures have well characterized thermophysicalproperties. A search for data in the high viscosity region (>ISO 100) was less fruitful, especiallyfor R-407C/POE pairs that have high miscibility. ISO 68 POEs were finally selected sincesolubility data were available with R-407C.
An extensive analysis of several thermophysical property data sources (Refs. 5-12)indicated that the following refrigerant/lubricant pairs would separately test the effects oflubricant viscosity and lubricant miscibility with R-407C:
R-407C/ICI RL32S : low miscibility, low viscosity
R-407C/ICI RL68S : low miscibility, high viscosity
R-407C/Castrol SW32 : high miscibility, low viscosity
R-407C/Castrol SW68 : high miscibility, high viscosity
9
10
R96-5.400.0008-3 DOE/CE/23810-71
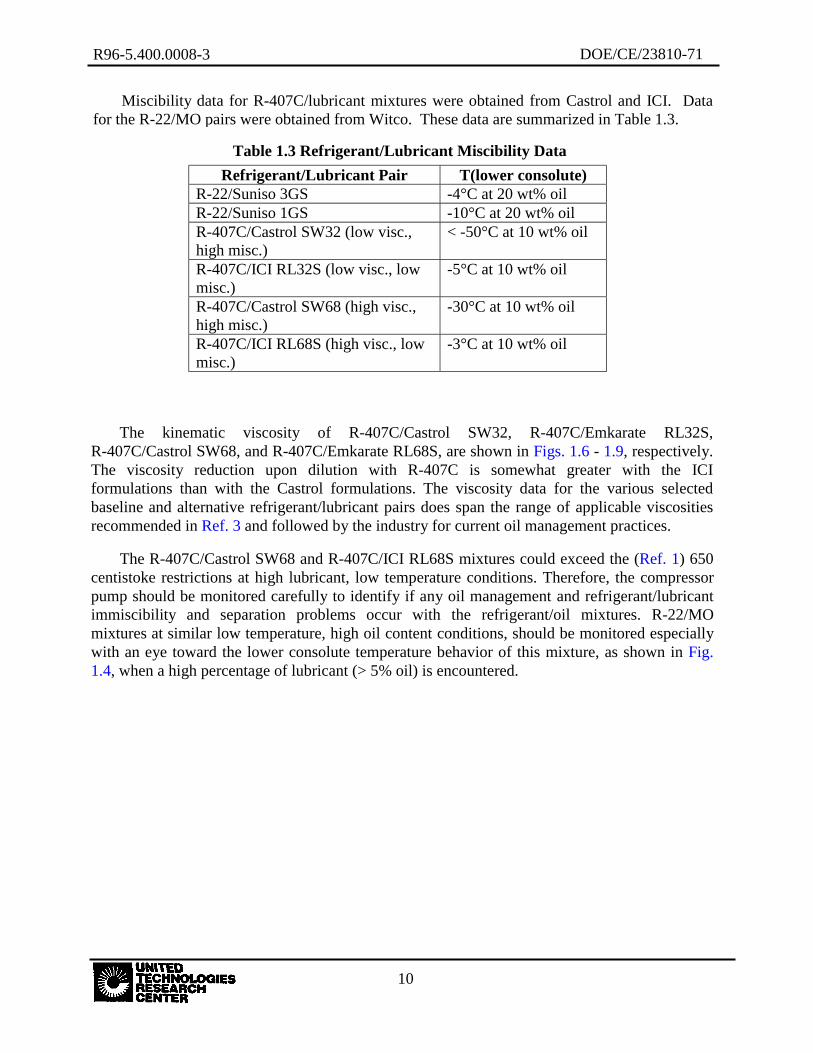
Miscibility data for R-407C/lubricant mixtures were obtained from Castrol and ICI. Datafor the R-22/MO pairs were obtained from Witco. These data are summarized in Table 1.3.
Table 1.3 Refrigerant/Lubricant Miscibility Data
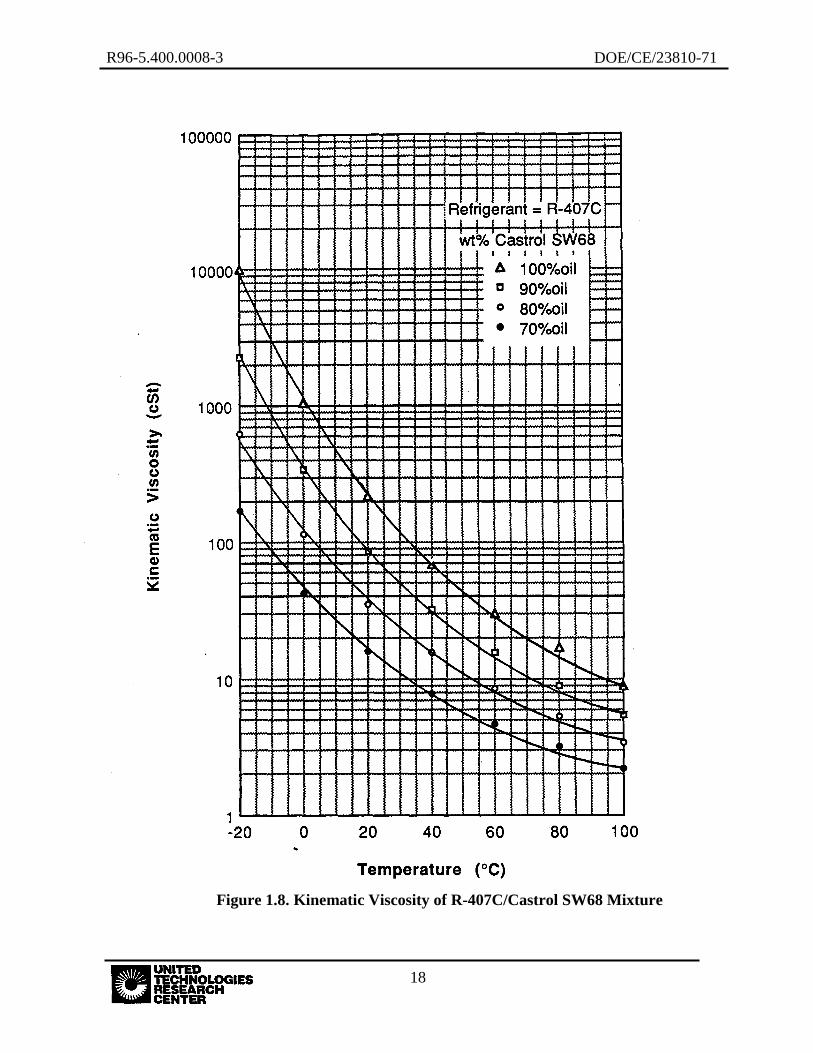
The kinematic viscosity of R-407C/Castrol SW32, R-407C/Emkarate RL32S,R-407C/Castrol SW68, and R-407C/Emkarate RL68S, are shown in Figs. 1.6 - 1.9, respectively.The viscosity reduction upon dilution with R-407C is somewhat greater with the ICIformulations than with the Castrol formulations. The viscosity data for the various selectedbaseline and alternative refrigerant/lubricant pairs does span the range of applicable viscositiesrecommended in Ref. 3 and followed by the industry for current oil management practices.
The R-407C/Castrol SW68 and R-407C/ICI RL68S mixtures could exceed the (Ref. 1) 650centistoke restrictions at high lubricant, low temperature conditions. Therefore, the compressorpump should be monitored carefully to identify if any oil management and refrigerant/lubricantimmiscibility and separation problems occur with the refrigerant/oil mixtures. R-22/MOmixtures at similar low temperature, high oil content conditions, should be monitored especiallywith an eye toward the lower consolute temperature behavior of this mixture, as shown in Fig.1.4, when a high percentage of lubricant (> 5% oil) is encountered.
Refrigerant/Lubricant Pair T(lower consolute)R-22/Suniso 3GS -4°C at 20 wt% oilR-22/Suniso 1GS -10°C at 20 wt% oilR-407C/Castrol SW32 (low visc.,high misc.)
< -50°C at 10 wt% oil
R-407C/ICI RL32S (low visc., lowmisc.)
-5°C at 10 wt% oil
R-407C/Castrol SW68 (high visc.,high misc.)
-30°C at 10 wt% oil
R-407C/ICI RL68S (high visc., lowmisc.)
-3°C at 10 wt% oil

R96-5.400.0008-3 DOE/CE/23810-71
Figure 1.1a. Heat Pump Layout (Worst Case Cooling Model)
Figure 1.1b. Heat Pump Layout (Worst Case Heating Model)
11

12
Figure 1.2. Kinematic Viscosity of R-22/Suniso 3GS Mixtures
R96-5.400.0008-3 DOE/CE/23810-71
R96-5.400.0008-3 DOE/CE/23810-71
Figure 1.3. Pressure-Temperature Diagram for R-22/Suniso 3GS
13

14
Figure 1.4. Miscibility of R-22 in Suniso 3GS
R96-5.400.0008-3 DOE/CE/23810-71

R96-5.400.0008-3 DOE/CE/23810-71
Figure 1.5. Miscibility of R-407C with Lubricants
15

16
Figure 1.6. Kinematic Viscosity of R-407C/Castrol SW32 Mixture
R96-5.400.0008-3 DOE/CE/23810-71

R96-5.400.0008-3 DOE/CE/23810-71
Figure 1.7. Kinematic Viscosity of R-407C/ICI Emkarate RL32S Mixture
17
18
Figure 1.8. Kinematic Viscosity of R-407C/Castrol SW68 Mixture
R96-5.400.0008-3 DOE/CE/23810-71

R96-5.400.0008-3 DOE/CE/23810-71
Figure 1.9. Kinematic Viscosity of R-407C/ICI Emkarate RL68S Mixture
19
20
R96-5.400.0008-3 DOE/CE/23810-71
TASK 2 - DESIGN, FABRICATE, INSTALL INSTRUMENTATION AND CONDUCTEXPERIMENTS IN DYNAMIC TEST FACILITY
Introduction
The overall objective of this task was to utilize the data developed previously in Task 1 and(summarized in Part 1 of this task), wherein the poor oil management situations for split-systemheat pumps could be encountered, and to design a test facility to simulate these worst casescenarios. Furthermore, selection and installation of instrumentation to obtain pressure,temperature, and oil concentration measurements on-line during a wide range of operatingconditions was to be completed in this task, as well as development of a test plan and conductingof tests. This overall task was conducted under Part 1 and Part 2 efforts. Part 2 consisted of fivesubtasks. The efforts undertaken under each part and subtask are described in the followingsections. The range and scope of tests actually conducted are described in the last task of thissection, while the actual test results and program conclusions are presented in the Task 3 section.
Task 2 - Part 1. Identification of Worst Case Oil Return Situations
The central theme of this ARTI oil management and circulation program was to: 1) identifyworst case oil return conditions and design a test apparatus that simulates such conditions, 2)establish experimental baseline performance with R-22/mineral oil, and 3) evaluate R-407C withboth high and low miscible POEs and immiscible mineral oils.
The significance of refrigerant/lubricant vapor flow rate and lubricant miscibility andviscosity was discussed in Task 1. The objective of the dynamic test facility was to provide arange of conditions to determine when and where the worst case oil management or zero oilreturn condition would be encountered. These conditions were then related back to identifyingminimum vapor velocities (in different locations during the heating and cooling modes) andcomparing them to predicted values. To determine the impact of viscosity on oil management, arange of refrigerant/lubricant mixtures was to be tested. These included refrigerant/lubricantmixtures with low, high and immiscible characteristics. The dynamic test apparatus for achievingsuch conditions is described below, along with the factors impacting the dynamic test facilityfeatures.
Dynamic Test Facility Design Guidelines
Oil return up-suction or hot gas risers require that there be sufficient gas momentum toovercome opposing gravity and viscous forces acting on the oil. By definition, oil traps whichviolate these conditions must be avoided. Long lines between condenser and evaporator addpressure drop to a system and result in reduced mass flow and capacity. Line diameters can beincreased to minimize this effect, but minimum velocities must be maintained to insure oilreturn.
Empirical relationships, such as that of Ref. 3, have been developed to calculate minimumvelocity. Knowledge of the compressor flow characteristics allows one to determine a maximumallowable gas line diameter for any specified suction and discharge condition, as was shown inTable 1.2 and described previously. A test apparatus with a minimum velocity vertical test

21
R96-5.400.0008-3 DOE/CE/23810-71
section effectively simulates worst case long lines and vertical riser combinations. Viscosity isnot directly addressed in the empirical relationships, since miscible oils tend to have sufficientlylow values, as described in Subtask 1B and in the data of Figs. 1.2 to 1.8. The viscosity of pureimmiscible oils exceeded recommended values at operating conditions of about 0°F, especiallysince there is little dilution with refrigerant which would reduce the viscosity.
Criteria for Design of Test Apparatus
For a cooling mode operating condition of 40°F/90°F (Tsat in evaporator and Tsat incondenser) and the type of compressor selected for the tests, four wide open 3/4 inch diametersuction lines were determined to create a minimum velocity condition for either R-22 orR-407C, as shown in Table 1.2. Lower evaporator temperatures can be achieved by reducing (orblocking) evaporator fan flow.
For heating mode operating conditions, the available UTRC Test Facility IndoorEnvironmental Chambers (IECs) were limited to achieving a lower saturation temperature rangeof about 0 to 15°F. A 10°F/90°F operating condition (Tsat in ambient outdoor exchanger and Tsat
in indoor exchanger) was determined to cause insufficient velocity in two 3/4 inch hot gas risers.Since the suction line is the factory installation in the outdoor unit during heating operation, itmust be assumed that adequate provisions will be made for oil return. That is, there are nointernal piping connections or configurations that will result in oil trapping or poor oilmanagement conditions introduced by the heat pump system. supplier.
During the test sequence, it is possible that highly immiscible lubrication with high oilviscosity (>650 cSt) may result in oil trapping in the accumulator or suction line. Evaporatortemperatures during blocked fan tests should provide low temperatures, which may cause criticalbehavior in this regard.
In summary, the installation of four 3/4 inch gas lines between indoor and outdoor units,each with appropriate valves at either end, allowed configuring the test loop for a worst case oilmanagement and minimum oil return during either heating or cooling operation. The verticalheight needed only to be sufficient to establish steady state conditions. Even though much higherheights (30 ft or above) were considered as necessary to conduct the tests, the currently available16 ft height should be adequate. (As indicated previously (in Task 1A), some installations withvertical lines of 100 to 150 ft actually have no oil management problem.)
Test Rig Design Considerations and Test Procedure
Given a nominal worst case oil management scenario for R-22, and projected for R-407C,the test plan allowed for evaporator or condenser Tsat variations to confirm a minimumvelocity for the given refrigerant/oil combination being tested. The impact of oil miscibility wasdetermined by establishing maximum viscosity characteristics. Saturation temperature levelswere varied further by adjusting either air temperature or fan flow for the appropriate heatexchanger. The test procedure was as follows:
1) Charge with refrigerant/oil combination.
2) Select oil injection rate (at least two rates can be selected, one normal for thecompressor, the other(s) to be provided by an oil injection procedure).

22
R96-5.400.0008-3 DOE/CE/23810-71
3) Run system to nominal cooling condition (40°F/90°F) with one 3/4 inch suction line.
4) Open two, three, then four suction lines and confirm oil return management (problemencountered or not encountered).
5) Vary evaporator fan flow until compressor oil sump level drops (note critical velocity.and estimate maximum viscosity, also estimate oil return rate, if any, versus injectionrate).
6) Operate each suction line independently to return oil to sump.
7) Switch to heating condition (10°F/90°F) and repeat procedure.
8) Open second hot gas riser, then third, then fourth, until an oil return problem isencountered.
9) Vary condenser fan flow until oil sump level drops (note critical velocity and estimatemaximum viscosity, also estimate oil return rate, if any, versus injection rate).
10) Repeat above at least once for each refrigerant/oil combination.
In summary, the dynamic test facility was designed to evaluate the following parameters andoperating ranges and to have the following measurement and visual capabilities.
Table 2.1 Dynamic Test Facility Features and Operating Range
Cooling Mode Heating Mode350 200(1) - Minimum Vapor Ranges, ft/min
(temperature dependent)650 650(2) - Maximum Lubrication Viscosity cSt (at
least(3) - Achieve Low Temperature IEC Operation 45°F 10°FTsat with Reduced Fan Flow or Blocked (32°F) (0 to 10°F)FanVisual Observations of• Oil Return Mechanism in Vapor Lines Compressor Suction Compressor Discharge• Compressor Oil Sump Level and Change Lines Linesof Level (use of remote TV camera and on- Both Bothline display)On Line Measurement• Liquid/Lubricant Concentration in System, 0% to 5 to 10%• Include Provisions for Metering in Excess Lubricant, if desired• All Pressure, Temperature, Flow Rates, and, as needed. Refrigerant Composition
23
R95-5.400.0008-3 DOE/CE/23810-71
Task 2 - Part 2. Design and Fabrication of Test Apparatus
Subtask 2A - Design and Fabrication of Dynamic Test Apparatus
As previously described, poor oil management and inadequate oil or resupply to thecompressor can be attributed to problems in either or both the liquid or vapor side of the system.Each has its own set of important parameters which affect oil return. On the vapor side, the issueis mostly one of insufficient velocity to carry the oil, as shown in Table 1.2. However, thephysical geometry of the system can also play an important role. Liquid side problems aremainly related to the solubility and miscibility properties of the refrigerant/lubricant mixture,although the layout of the system also has an effect.
Since the physical arrangement of the indoor and outdoor sections of a heat pump and airconditioning system are usually factory designed and not modified on the job side, onlyinstallation specific system parameters could be addressed in this study. It should be recognizedthat component arrangements, i.e., the geometry and slope of the indoor or outdoor exchangersand connecting piping can lead to system oil traps. However, these issues were beyond the scopeof this study to evaluate.
The main area of investigation during the course of this study was the lubrication returnproblem on the vapor side, which was different for either the heating or cooling modes. In orderto do this in a representative system, the vapor velocity needed to be altered without affecting theflowrates throughout the rest of the system. In a real system, the velocity would be reduced byinstalling an oversized vapor line. Often, oversized lines are used to overcome the pressurelosses associated with running long lines. However, in order to alter the velocity in the vaporline, the dynamic test was based on the use of four oversized vapor lines, connected by amanifold at each end. Each line in the manifold system had a diameter of 3/4 inches, while thenormal vapor lines inside of the representative system were 5/8 inches. By opening the manifoldlines one at a time, the total velocity running through the lines could be lowered gradually indiscrete steps and poor oil management and zero oil return scenarios could be demonstrated. Asight glass was installed at each end of both manifolds to enable visual observation of the flowdirectly through each manifold.
Figures 2.1 and 2.2 show the dynamic test apparatus schematic and the location of theindoor and outdoor sections during both cooling mode and heating mode operation (Figs. 2.1 and2.2). An actual 2.5 ton split-system heat pump manufactured by a major supplier was used as thebasis for the dynamic facility.
Vapor Velocity Simulation
Due to the physical layout of the dynamic test system, each of the manifolds wasconstructed somewhat differently, as shown in Figures 2.3 and 2.4. The indoor manifold, BB,shown in Figure 2.3 was relatively simple; four 3/4 inch lines rising from a 3/4 inch manifoldtube with a 5/8 inch line to the indoor unit connecting at the bottom. This manifold was installedin the location shown in Figs. 2.1 and 2.2. The outdoor unit manifold, AA, was much morecomplex, as seen in Figure 2.4. Its location is noted on Figs. 2.1 and 2.2. Four 3/4 inch lines risefrom a 3/4 inch manifold tube with a 5/8 inch line to the outdoor unit also rising from themanifold tube. Shut off valves are located six inches above the manifold tube on each vapor

24
R96-5.400.0008-3 DOE/CE/23810-71
line. In operation, this manifold tended to act as an accumulator, with the additionaldisadvantage of shutting off the flow to one or more of the vapor lines when flooded. Toalleviate this particular problem, an additional connecting manifold was constructed to connecteach of the four 3/4 inch vapor lines, with shut-off valves in the connecting lines between eachof the four vapor lines. This served to equalize the pressure and flow in each of the tubes, andreduced the impact of manifold flooding on the test.
Configuration and Length
The four 3/4 inch vapor lines extended approximately 16 feet vertically from one manifold,then ran another 16 feet horizontally before dropping another 16 feet vertically to rejoin theother manifold (see Figures 2.1 and 2.2). As previously noted, shut off valves were only locatedon one manifold.
Manifold Behavior
Each of the manifolds behaved somewhat differently during operation. In cooling mode,the vapor line between the indoor and outdoor units contained low pressure gas from theevaporator discharge fed to the accumulator inlet. In heating mode, on the other hand, the vaporline contained high pressure gas from the compressor discharge fed to the condenser inlet. Boththe geometry of the manifolds and the operational mode affected the behavior of each manifoldand observations taken in each manifold, as will be described below.
Cooling mode
In cooling mode, the supply manifold was on the indoor side unit, and the return manifoldwas on the outdoor side unit. The vapor return line fed the supply manifold from the bottom,where the vapor flow was distributed to each of the open 3/4 inch vapor lines. As more lineswere opened to flow, the velocity in each line decreased, until the local velocity becameinsufficient to carry oil up the tube. At this point, the oil started to flow back down the tube andeventually collect inside the manifold itself. As the manifold flooded with more and more oil, theoil eventually started to flow back down the supply tube, where the local velocity was sufficientto carry it back to the manifold. Eventually, the flood of oil in the manifold caused one or moreof the vapor lines to be blocked, whereupon the local velocity in the remainder of the vapor tubesbecame sufficient to carry oil up. This floodback of oil through the vapor tubes lasted only aslong as one or more tubes remained blocked, and as soon as the liquid level in the manifolddropped sufficiently to open the blocked tubes, the oil return stopped again, and the manifoldbegan to flood again. This cycle was repeated again and again, and was a key visual indication ofan oil return problem. This manifold flooding behavior is illustrated in Figure 2.6 and isdescribed in detail below in Subtask 2E. On the other side of the vapor lines, the return manifoldfed the flow from all supply lines back through the 5/8 inch vapor return line to the accumulator.Because of the geometry of the outdoor unit manifold, it also acted as an accumulator. In fact, ifthere was any two phase flow from the evaporator, this is where it tended to collect first.

R96-5.400.0008-3 DOE/CE/23810-71
Heating mode
In the heating mode, the supply manifold was on the outdoor side unit, and the returnmanifold was on the indoor side unit. The compressor discharge line fed the outdoor unitmanifold from the top, where the high pressure gas flow was fed to each of the open 3/4 inchvapor lines. Once again, as more valves were opened, the velocity in each decreased, and the oileventually had insufficient velocity to be carried up the vapor lines. At this point, the liquidlevel in the manifold started to rise. The difference in this manifold as compared to the coolingmode supply manifold was that the liquid had no place to drain. Also, when the liquid levelbecame sufficiently high to block one or more vapor tubes, the redistribution manifold wouldredirect the flow from the open tubes to the blocked tubes. The net result was that no fluctuationin oil flow was expected, unlike the fluctuations expected in the cooling mode. However, as inthe cooling mode, manifold flooding was expected to be a key indication of an oil returnproblem.
Viscosity and liquid line flow
The determination of oil return problems caused by liquid flow is extremely difficult tomake, particularly because these problems are mostly due to the physical properties of therefrigerant-lubricant mixture and the actual geometry of the system. When an immisciblecombination is used, the mixture separates into an oil rich liquid phase and a refrigerant richphase. The oil rich phase, because of its higher viscosity, may become trapped in certain parts ofthe system. No attempt was made in this study to create liquid side oil return problems otherthan by the selection of immiscible lubricant-refrigerant pairs.
Subtask 2B - Selection and Installation of Instrumentation
The objective of this subtask was to select the instrumentation technique best suited formaking in situ measurements of oil concentration in the system and to define all of the other keyinstrumentation required to be used in the program. A plan for acquiring, installing andcalibrating the instrumentation was also provided in this task, as well as the instrumentationlocations and measurements.
Data collected for each refrigerant/lubricant pair and condition included the following:
Refrigerant Gas Velocity/Mass Flow Rate
A mass flowmeter (such as a Micromotion Meter) was used to obtain mass flow anddensity, which when combined with pressure and temperature and refrigerant properties wasused to obtain refrigerant gas velocity.
Temperature and Pressure Profiles
Temperatures and pressures were collected throughout the system with K-type or T-typethermocouples and pressure transducers, using a PC-based data acquisition system. Values wereaveraged for an accuracy of (±) 1°F for temperature and (±) 1% accuracy for pressure.
25

26
Change in the Compressor Oil Level
The scroll compressor shell was replaced with a bolted shell containing a sight glass, whichallowed precise determination of oil level in the compressor at all times. Provisions were alsoincluded for metering in additional lubricant, if desired, in the bolted shell.
To determine oil return conditions, a representative 2.5 ton heat pump with a scrollcompressor was instrumented and was run at nominal conditions for heating and cooling. Theindoor and outdoor units of the heat pump were placed into separate Indoor EnvironmentalChambers (IECs), which provided precise temperature, humidity, and airflow conditions forsimulation of various operative conditions. During the course of each test, transient pressure andtemperature data were taken, as well as dynamic indications of oil circulation by a number ofmeans.
Indoor Environmental Chambers (IECs)
The experimental facility included two IECs, a nominal 2.5 ton capacity and a nominal 5ton capacity system. The IECs can provide exact control of supply temperature from 25°F to150°F, relative humidity from ambient to 100%, and airflow up to 3000 cfm. The supply air sideof the indoor unit of the heat pump was connected directly to the 2.5 ton IEC. In contrast, theoutdoor unit was placed in a large chamber which was connected to the 5 ton IEC. This is shownschematically in Figure 2.5. In normal operation, the indoor unit air flowrate is set to 1000 cfmwhile the outdoor unit air flowrate is set to 2000 cfm.
Pressure and Temperature Data Acguisition
Eight thermocouples and six pressure transducers were installed in the system to providean accurate determination of the refrigerant state throughout the cycle. The instrumentation alsoincluded two air-side thermocouples at the entrance and exit of each test section. Type Jthermocouples were selected for their good low temperature response. Figures 2.1 (coolingmode) and 2.2 (heating mode) show the instrumentation locations as installed for system tests.The thermocouple and pressure transducer data were sampled once per second by a dedicated PC(PC2 on Figure 2.5). A Labtech Notebook, a commercially available software package, was usedto display and record the data.
Oil Flow Rate and Distribution of Oil In the System
The various methods for measuring oil concentration in operating HVAC systems werereviewed in detail by UTRC/UTC. A summary of basic features, limitations, and range ofapplicability for six possible techniques together with development status and/or acquisition costand current status is provided in Table 2.2. It is concluded from this review that two availabletechniques, ultraviolet and ultrasonic were viable candidates for use under this program.
Ultraviolet absorption device
Briefly, the ultraviolet absorption meter measures the amount of incident ultraviolet lightabsorbed by the refrigerant/oil mixture. Since the absorption characteristics are dependent on theconstituents, the meter can be calibrated for each mixture of interest. A commercially availablesystem is now operational at UTRC. Tests have been conducted using a 3-ton scroll
R96-5.400.0008-3 DOE/CE/23810-71

R96-5.400.0008-3 DOE/CE/23810-71
compressor installed on a calorimeter test stand operating with a R134a/Mobil 68 refrigerant/oilmixture. The instantaneous on-line results were compared with an independent oil samplingmeasurement technique, as presented in Fig. 2.8. As shown in Fig. 2.8, the two methods are invery good agreement and accordingly, the ultraviolet meter can be used with confidence to makedynamic measurements with other refrigerant/oil mixtures. This calibration information is storedin the unit software for real-time use during system tests.
Table 2.2 Comparison of Oil Concentration Measurement Methods
Notes: unk - unknown, P - possible, Y - yes, N - no* No known commercial system1. Measurement performance based on mfgr's spec.'s. For fluorescence, estimate based
on qualitative measurements at UTRC and component spec.'s.2. (Wt% uncertainty at 1 wt%)/(1 wt%) x 100%.3. Minimum measurable oil concentration.4. "N" in this column indicates blend significantly affects measured property. (In all cases,
blend concentration affects %wt.)5. Cost to produce a system from current state of technology.6. Cost of commercial system or estimated cost of a unit once technology is developed.7. Buoyancy, inertial response limited.8. Uncertainty in blend at measurement point can have large effect on oil concentration
measurement.9. Must be homogeneously mixed.10. Acoustic scattering interferences.11. Optical scattering interferences.12. Must be single phase (e.g., liquid oil and refrigerant)
27

28
Ultrasonic device
The ultrasonic meter is under development at the University of Illinois, Air Conditioningand Refrigeration Center (ACRC) and at Purdue University, both under support from the CarrierCorporation. A schematic diagram of the meter and typical calibration data are presented in theCapabilities Section of this proposal for an R22/alkyl benzene (Lunaria) mixture. This type ofmeter operates by measuring the speed of sound in the refrigerant/oil mixture via transmitter andreceiver transducers. Since the mixture speed of sound is dependent on the oil concentration, thismeter can also be calibrated for each mixture of interest.
Since the traditional ASHRAE standard method for measuring the proportion of lubricant inthe liquid refrigerant (BSR/ASHRAE 41.1-1984R) cannot be conveniently used for the subjectprogram, both the ultraviolet and ultrasonic methods were candidates for use in measuring in situtime dependent oil concentration levels in operating systems. The final choice of the ultravioletmethod was based on both the availability and maturity of the technology.
Oil Circulation Data and Measurement Techniques
Oil circulation was determined by a number of means. A Jasco UV oil concentrationmeter was used to measure the oil concentration in the liquid line. Visual observations of flowthrough the vapor line manifolds provided an indication of good oil return in the vapor line, asdescribed in the previous section. Finally, the oil sump level in the compressor was continuouslymonitored and recorded for an indication of the amount of oil in the system.
UV Oil Meter Calibration Technique
The JASCO ultraviolet oil concentration meter measures oil content by determining theamount of ultraviolet (UV) light that a refrigerant/oil mixtures absorbs. The instrument does thisby monitoring the absorption occurring at a specific uv wavelength at a point in the system. Thedevice uses a spectrometer system to narrow the spectrum of the light source for accuratemeasurements at a single wavelength. Since the absorption characteristics are dependent on theconstituents, the meter can be calibrated for each mixture of interest. It is generally limited to oilconcentrations of about 10% or less by weight because of loss of signal at higher concentrations.In addition, measurement accuracy may be compromised if oils are used having inherently lowuv absorbance levels.
Most oils (POEs, AB, mineral oils) have characteristic absorbance in the ultraviolet regionwhile refrigerants show little absorbance at these same wavelengths. The oil concentration in arefrigerant (vol/vol or wt/vol) is proportional to the absorbance according to Beer's Law whichstates:
A = ε*C*1
where ε is the extinction coefficient of the oil at a given wavelength, C is the vol/vol or wt/volconcentration, and 1 is the optical pathlength of the flow cell. Since the extinction coefficient isunknown for any given oil, calibration is necessary for each type of oil. An oil calibration can beperformed by preparing a series of oil concentrations (wt/wt) in some appropriate solvent andfinding the absorbance of each sample.
R96-5.400.0008-3 DOE/CE/23810-71

29
R96-5.400.0008-3 DOE/CE/23810-71
A more accurate calibration takes into account the compressibility effects of the refrigerantat various pressures and temperatures. Since the refrigerant is compressible, the fractionalvolume of the refrigerant will change relative to the constant volume of oil as the mixturetemperature or pressure changes. This, in turn, means that the vol/vol ratio will change withcompression but the wt/wt concentration of the oil will remain the same. These effects can becompensated for by performing a refrigerant calibration at various temperatures and pressures.Since most refrigerants are vapor at room temperature, and calibration must be performed usingliquid samples, a high pressure vessel is required for this calibration. To avoid this, it is possibleto calculate the P and T correction coefficients using refrigerant properties data as outlined inthe analytical refrigerant calibration section in the JASCO instrumentation. Due to the highdegree of oil concentration measurement accuracy required for the tests and the limited timeavailable for performing the oil/refrigerant mixture calibrations, the analytical refrigerantcalibration method was chosen. Typical results from the calibration are shown in Figure 2.7 forone particular oil/refrigerant mixture of interest in the program (R-407C/Castrol SW32). Theresults show that by calculating approximately four absorbent concentrations, a straight line ofthe log of oil/refrigerant concentration can be determined.
To verify the accuracy of the calibrations performed, tests were conducted using a 3-tonscroll compressor installed on a calorimeter test stand operating with an HFC-134a/Mobil 68refrigerant/oil mixture. The on-line results from the meter were compared with an independentoil injection/measurement technique that used a digital flow meter for monitoring the amount ofoil being injected. The two methods were found to be in very good agreement, as shown inFigure 2.8. Accordingly, the UV meter can be used with confidence for other refrigerant/oilmixtures.
Separate calibrations of the UV meter, both at normal oil conditions and at much higherconcentrations of 2.5 to 5.0%, were also encouraging. These data for HFC and POE are shownin Figure 2.9. The entire range of absorbance concentrations for the five misciblerefrigerant/lubricant mixtures are shown in Table 2.3. The data highlights that the R-407C/POEICI RL325 can be extremely difficult to calibrate because of the extremely low UV absorbancecharacterization (i.e., the oil is extremely clear to UV light).

30
R96-5.400.0008-3 DOE/CE/23810-71
Table 2.3. Experimental Calibration Data for UV Oil Concentration Meter with R-407Cat Temperatures from 16.5°C to 18.8°C (61.7°F to 64.2°F)
Lubricant Concentration, AbsorbanceC (abs)
ICI 0.3869 0.0129SW 32 1.0079 0.0473
2.505 0.12904.8871 0.2640
ICI 0.4182 0.0184SW 68 0.9151 0.0434
3.2187 0.14715.2570 0.2378
ICI 0.4630 0.0016RL 32 0.7187 0.0042
2.2810 0.01894.1793 0.0369
ICI 0.3135 0.0061RL 68 0.7810 0.0161
2.5874 0.06004.2013 0.1007
Other Data
The tests also included a number of other data samples. The flow through the liquid linewas measured by a S025 Micromotion flow meter and recorded every 5 seconds. Bydetermination of the saturated vapor density of the refrigerant charged in the system and thenumber of vapor lines open, the vapor velocity through the vapor lines was calculated. A highlyaccurate scale was used to determine the amount of refrigerant charged into the system. Thescale, an A&D model EP-60KA, has a resolution of 0.005 lbs. The charge weight wasdetermined by weighing the refrigerant cylinder before and after charging.
Subtask 2C - Oil Selection and Property Verification
As discussed under Subtask IA, two mineral oils, Suniso 3GS and Suniso 1GS and four POEformulations, ICI RL32S, ICI RL68S, Castrol SW32 and Castrol SW68, were chosen aslubricants for the circulation tests. The manufacturers specifications for viscosity, total acidnumber (TAN), and water content are summarized in Table 2.4.
Table 2.4 Lubricant Physical Properties
Lubricant Kinematics Viscosity (cSt) TAN (mg KOH/g) Water (ppm)-20°C 40°C Mfg. Spec. Measured Mfg. Spec. Measured
Suniso 1GS --- 12 <0.03 <35Suniso 3GS 4000 33 <0.03 <25ICI Emkarate RL32S 1800 32 <0.02 (0.025) <50 (46)ICI Emkarate RL68S 7356 74 <0.02 (0.028) <50 (39)Castrol SW32 - 32 <0.15 (0.142) <50 (97)Castrol SW68 - 68 <0.15 (0.144) <50 (125)

31
R96-5.400.0008-3 DOE/CE/23810-71
Water content and acid number are verified on an on-going basis for selected samples ofthese lubricants at the Central Engineering Services Group at Carrier in Syracuse, NY sincethese lubricants are used in several Carrier HVAC equipment lines. Data collected to date areshown in parenthesis in Table 2.4. The lubricants tested were close to manufacturer'sspecifications, with the exception that the Castrol POEs measured somewhat higher watercontent. This could be due to the sampling technique; these lubricants are very hygroscopic. ThePOE lubricants were handled under N2 purge to minimize water absorption upon systemcharging.
Subtask 2D - Test Plan
The refrigerant-lubricant pairs selected in the previous task were run in the test systemaccording to the plan developed in this task, shown in Table 2.5. Each refrigerant/oilcombination was tested at two environmental conditions. One corresponded to a typical coolingcondition (DOE-A) in cooling mode operation, and one corresponded to a typical heatingcondition (no lower than 20°F outside air) in heating mode operation. These tests were eachrepeated at least once for verification. In addition, most combinations were also tested withadditional oil injected into the circulating flow to simulate systems with higher nominal oilcirculation rates.
Table 2.5 Original Test PlanTest Refrigerant/Lubricant
CombinationsTest Conditions Run
1) R22/Mineral Oil (3GS), Baseline Cooling Mode, Cooling Mode w/OilInjectionHeating Mode, Heating Mode w/OilInjection
2) R407C/Mineral Oil (3GS), MO1 Cooling Mode, Cooling Mode w/OilInjectionHeating Mode, Heating Mode w/OilInjection
3) R407C/Mineral Oil (1GS), MO2 Cooling Mode, Cooling Mode w/OilInjectionHeating Mode, Heating Mode w/OilInjection
4) R407C/Castrol SW32, POE1 Cooling Mode, Cooling Mode w/OilInjectionHeating Mode, Heating Mode w/OilInjection
5) R407C/Castrol SW68, POE2 Cooling Mode, Cooling Mode w/OilInjectionHeating Mode, Heating Mode w/OilInjection
6) R407C/ICI RL32S, POE3 Cooling Mode, Cooling Mode w/OilInjectionHeating Mode, Heating Mode w/OilInjection
7) R407C/ICI RL68S, POE4 Cooling Mode, Cooling Mode w/OilInjectionHeating Mode, Heating Mode w/OilInjection

32
R96-5.400.0008-3 DOE/CE/23810-71
The baseline refrigerant/oil combination was HCFC-22 and 3GS mineral oil. Thiscombination was then replaced with the baseline blend/oil combination: R407C(R32/R125/R134a with 23/25/52 mass fractions) with mineral oil. The baseline oil was also to bereplaced in series by four different POE oils, as specified in the previous section. Two of the oilshad a lower miscibility and two had a higher miscibility with the HFC blend. Two also hadhigher viscosities (ISO-68), and two were lower in viscosity (ISO-32). This is described infurther detail in Task 1. A total of seven refrigerant/oil combinations were planned to be tested.
Oil Replacement Procedure
When replacing an oil, the following procedure was followed. The compressor sump wasdrained of the old oil, and replaced with the new oil. The old refrigerant charge was recoveredand replaced with a fresh charge. The system was turned on and cycled through heating andcooling mode conditions. The compressor sump was once again drained and replaced with afresh charge of the new oil. The refrigerant charge was recovered and replaced with a freshcharge. The procedure was repeated once more, for a total of three refrigerant and oil changesbefore a new test was run. This ensured that as much of the old oil was removed from the systemas possible, and the contamination potential of the new oil by the old oil was minimized. Allapplicable environmental procedures were followed during the recovery and disposal of the oiland refrigerant charges.
Subtask 2E - Test Sequence and Data Analysis
The experimental apparatus was run with the objective of finding the minimum velocityat which oil return through the vapor line was possible. The data collected during the course ofeach test run was plotted to determine oil circulation trends. Both visual observations in themanifolds and the compressor oil sump level as well as measured data were used to determine oilcirculation problems.
Test Procedure
The same procedure was used for each test run and generally followed the Part 2 (Task 2)guidelines. First, the system was turned on and let warm up to a steady state condition with onevapor line open. The charge in the system was next adjusted to achieve ten degrees of superheatat the compressor inlet. This was done to minimize the amount of liquid refrigerant in the suctionline and accumulator to prevent fractionation of the refrigerant. After the system was again atsteady state, the conditions inside the manifolds were noted on a log and an additional vapor linewas opened. If the test was in heating mode, the valve connecting the two vapor lines in theredistribution manifold was also opened. The system was given at least 15 minutes to stabilizebefore the manifold conditions were again logged and another vapor line was opened. This wasrepeated until all four vapor lines were opened. Then, for some tests, the evaporator temperaturewas additionally lowered by lowering the evaporator airflow in order to lower the vapor densityand thus the vapor velocity. Finally, all vapor lines except one were closed, and the test wasrepeated.
After the test had been run, the data collected was processed and plotted. Since the dataacquisition system did not record when vapor lines were opened and closed, the record of theseevents had to be recorded by hand, and later correlated to the proper data system times. The dataacquisition system recorded data every five seconds. This data was averaged to one minute

33
R96-5.400.0008-3 DOE/CE/23810-71
intervals for plotting. The one exception was the liquid line oil concentration from the UVmeter, which was averaged to 15 second intervals for better resolution. The systemtemperatures, system pressures, and air side temperatures were each plotted on separate graphs.In addition, the liquid line oil concentration from the UV meter was overlaid with the vapor linevelocity on one graph. This graph was used to determine when the velocity was insufficient tocarry the oil. For reasons mentioned in Subtask 2A, poor oil return in cooling mode wasindicated by a fluctuation in the oil concentration. For the heating mode, a drop-off in the oilconcentration was expected to indicate a problem.
Oil Return Measurements and Observations
Along with the UV meter indications, the visual observations made of the vapormanifolds and oil sump also gave indications of oil return problems. During operation, the liquidinside the vapor manifolds was not all at one level. As the flow through the vapor lines decreasedand oil began to collect in the manifolds, it was typically forced to one side by the flow throughthe manifolds. This is shown schematically for the indoor side manifold in Figures 2.6a-d. InFigure 2.6a, one valve is open and oil travels normally through the manifold with little to nonebeing trapped in the manifold. With two valves open, as in Figure 2.6b, the velocity is still notlow enough to cause a problem. Figure 2.6c shows oil starting to accumulate on one side withthree valves open. Note that the oil is accumulating on the side with both vapor lines open,meaning that the local flow inside the tubes became insufficient to carry all the flow up. Thesystem reaches steady state with this type of liquid level, which would correspond to a certainamount of oil being carried from the level in the manifold and a certain amount withoutsufficient velocity, which returns to the manifold. With all four vapor lines open (Figure 2.6d),one side has totally flooded, with the level fluctuating slightly as it alternately blocks and opensthe fourth line, as was explained in Subtask 2A. The same order of events did not occur in all ofthe tests. In some tests, the manifold flooded much more quickly (less open vapor lines needed),and in others additional inducements were needed (such as lowering the evaporator temperature)in order to cause flooding. In general, however, the flooding occurred very dramatically, asbetween Figures 2.6b and 2.6c, where the liquid level jumped rapidly. These liquid level jumpswere very repeatable, and the velocities at which they occurred was recorded.
Oil Sump Video Monitoring and Display
During the course of testing, an on-line monitoring of the compressor sump oil level wasconducted and recorded on video for review and confirmation of oil management issues.

Figure 2.1. Oil Circulation Program Dynamic Test Facility - Cooling Mode

Figure 2.2. Oil Circulation Program Dynamic Test Facility - Heating Mode

36
Figure 2.3. Indoor Unit Vapor Manifold (BB)
R96-5.400.0008-3 DOE/CE/23810-71

R96-5.400.0008-3 DOE/CE/23810-71
Figure 2.4. Outdoor Unit Vapor Manifold (AA)
37

Figure 2.5. Lab Arrangement

Figure 2.6. Typical Manifold Flooding Behavior
39
R96-5.400.0008-3 DOE/CE/23810-71
Figure 2.6d(4 vapor lines open)
Figure 2.6c(3 vapor lines open)
Figure 2.6b(2 vapor lines open)
Figure 2.6a(1 vapor line open)
R96-5.400.0008-3 DOE/CE/23810-71
Figure 2.7. Absorbance vs. Concentration for R407C/Castrol SW32
40

41
Figure 2.8. Compressor Oil Circulation Measurement with R134a/POE
R96-5.400.0008-3 DOE/CE/23810-71

R96-5.400.0008-3 DOE/CE/23810-71
Figure 2.9. Ultraviolet Oil Concentration Meter Test Results
42

R96-5.400.0008-3 DOE/CE/23810-71
TASK 3 - DATA COLLECTION, ANALYSIS, RESULTS, REVIEW, ANDFORMULATION OF PROGRAM CONCLUSIONS
The objective of this task was to collect the data generated in the dynamic test apparatusand to analyze the data to prepare clear results so that understandable conclusions could bedrawn.
This section is organized in the following manner. First, a listing of the tests that wereconducted is provided, then typical data for a few test runs are presented and explained to orientthe reader. Finally, a summary of the test results is provided and described, and key programconclusions are presented.
A representative 2.5 ton heat pump with a scroll compressor modified to allow additionalinjection of oil was used for this study. The system was run at DOE-A (95 F outdoor / 80 Findoor) for the cooling mode tests and at the minimum supply temperature available for theheating mode tests (25 F outdoor / 70 F indoor). A total of 52 tests were run. A summary of thetests numbers is given in Table 3.1.
Table 3.1 Tests Run with Test Number
The UV oil concentration meter was not calibrated for the mixture of R-407C and 3GSmineral oil since the mixture was immiscible. However, the UV meter still generated useful datausing the R22-3GS calibration curve. No calibration data were available for the mixture ofR-407C and 1GS mineral oil, which was again an immiscible mixture. The determination of oilreturn problems for this mixture was made by visual indications only.
Description of Typical Data
For each of these tests, a set of four graphs was generated, describing the systemtemperatures, system pressures, air side temperatures, and oil concentration and vapor velocity.A typical set of cooling mode and heating mode test results are given below. In addition, visualobservations of the oil sump level, oil level in the appropriate manifolds, changes in oilcharacteristics and oil concentration meter stability (when appropriate) were noted. These arenoted in Table 3.2.
43
Refrigerant/Lubricant Actual Chronological Test Run NumberTest Series Cooling Cooling Inj.* Heating Heating Inj.*
1) R22-3GS 1, 2, 35 41, 42 3, 4, 36, 40 37, 38, 392) R407C-3GS 5, 43,44 45 6, 46, 47 48, 493) R407C-1GS 50, 51 † 52 †4) R407C-SW32 7, 8 9, 10 11, 12, 13 145) R407C-SW68 15, 16 17, 18 19, 20, 25, 26 21, 22, 23, 246) R407C-RL32S 27, 28 31, 32,33 29, 30, 34 †* additional oil injected into compressor† no test run

44
Table 3.2 Indoor Unit Manifold Liquid Levels During Cooling Mode Tests
R96-5.400.0008-3 DOE/CE/23810-71
Cooling Mode Tests
Figures 3.1, 3.2, 3.3, and 3.4 show the results of a set of typical cooling mode test runs.In this case, the refrigerant-lubricant mixture is R-407C and Castrol SW68. Figure 3.1 showsthat the compressor inlet and discharge temperatures rise slightly with decreasing velocity, whileFigure 3.2 shows that the system pressures all stay relatively constant over the course of the test.The air side temperatures also stay relatively constant, as shown in Figure 3.3. Refer to Figure2.1 for the location of all instrumentation. The indoor unit exit temperature remains constant atabout 58 F. Figure 3.4 shows the UV oil concentration meter results on left axis, along with thevelocity in the vapor lines on the right axis. This graph shows the effect of decreasing vaporvelocity on the oil concentration in the liquid line. The results demonstrate that oil concentrationfluctuations start to occur with two valves open, and become much worse with three valvesopen. In the cooling mode, these fluctuations are an indication of poor oil return. This is becausethe indoor unit manifold is alternately flooding partly and then entirely, with the drop occurringwhen one or more of the vapor return lines becomes blocked. This was described previously infurther detail in Task 2, Subtask 2A (design of test apparatus), and Subtask 2E (data analysis).What is unknown is the reason for the increase in the average oil concentration as the vaporvelocity is lowered.
Along with the data logged and displayed on the typical four figures for each test run,additional indications of oil return were the visual observations of the liquid level inside thevapor manifolds and the oil level inside the sump. The observed level of the indoor unitmanifold on both sides is shown in Table 3.2. The table indicates that the vapor velocity startedto become insufficient between two and three valves open for both tests. At four valves open, themanifold had flooded completely. On Figure 3.4, the change from two to three valves openresults in a dramatic increase in the level of the oil concentration fluctuations. The oil sump leveldid not change appreciably during the course of the two tests. Figure 3.4 also shows the vaporvelocity corresponding to each valve opening condition. Based on the vapor velocity levelscalculated, these became the numbers to compare to the ASHRAE guidelines.
Test 15Liquid Level Noted
Test 16Liquid Level Note
# of lines open Left side Right side Left side Right side1 ( ) 1/4 1/4 1/4 1/82 ( ) 1/4 1/8 1/4 1/83 ( ) 3/4 1/8 3/4 1/84 ( ) Full 1/8 Full 1/8
- Open vapor line - Closed vapor line

Figure 3.1. Heat Pump R407C - Castrol SW68 Oil Circulation Tests (15 & 16)

Figure 3.2. Heat Pump R407C - Castrol SW68 Oil Circulation Tests (15 & 16)

Figure 3.3. Heat Pump R407C - Castrol SW68 Oil Circulation Tests (15 & 16)
Figure 3.4. Heat Pump R407C - Castrol SW68 Oil Circulation Tests (15 & 16)

R96-5.400.0008-3 DOE/CE/23810-71
Heating Mode Tests
Typical results for a set of heating mode tests are presented in Figures 3.5, 3.6, 3.7, and3.8. Once again, the refrigerant-lubricant mixture is R407C and Castrol SW68. These figuresexhibit time scales that are considerably longer than the cooling mode figures, although theactual tests took about the same amount of time. The tests actually took place between 1.2 and2.4 hours, and 4.1 and 5.1 hours on the figures. The rest of the time was spent in setting the testconditions, such as suction superheat (set by charge), correctly and performing defrost cycles.The charge level in the system was difficult to maintain exactly, because of the dynamics of thesystem.
In the heating mode, hot gas exits the compressor and enters the outdoor unit manifold,where it is divided into the open vapor lines. The gas returns on the indoor side manifold, whereit flows to the condenser. However, since all vapor lines are open on the indoor side (the valvesare actually located on the outdoor unit manifold), the high pressure vapor can and does fill thenon-flowing vapor lines. As the vapor rises, it cools and condenses. If the condensation occursabove the outdoor unit manifold, the liquid will flow down and fill the closed vapor line justabove the shut-off valve. This is illustrated in Figure 3.9. This continual condensation graduallyreduces the amount of circulating charge, increases the suction superheat, and decreases thesubcooling level. When the refrigerant starts to exit the condenser in a two-phase state, the UV-oil concentration meter becomes unreliable. This is because the UV meter works by absorptionof light passing through a homogeneous liquid stream. When bubbles start to appear in the liquidstream, somewhat more light is transmitted through the liquid. The more light that is transmitted,the less oil is theoretically in the liquid sample. This explains the negative oil concentrationreadings shown in Figure 3.8. To minimize the effect of this process, all manifold valves wereopened briefly (to empty them) when opening another manifold line in the testing sequence.
Figure 3.5 shows the system temperatures in the heating mode. As mentioned previously,the tests were actually run between 1.2 and 2.4 hours (test 25), and 4.1 and 5.1 hours (test 26).During these times, it appears that the condenser inlet temperature drops off a number of timesand then returns to a somewhat lower steady state level. The initial drop-off in temperature iscaused by the return of the condensed liquid trapped out in the vapor lines. At about 2.2 hours(during test 25), the evaporator air fan flowrate was reduced (to 250 cfm from 2000 cfm) tosimulate a blocked fan. At 4.9 hours (test 26) the flowrate was again reduced (this time to only1000 cfm). The evaporator temperatures dropped between 10 and 15 degrees on average, whilethe compressor discharge temperature increased by about the same amount. The system pressuresare shown in Figure 3.6. The figure indicates a slight increase in pressure throughout the systemwith more vapor lines open. The pressure also drops slightly throughout the system at thereduced evaporator air flowrate condition. The air side temperatures are presented in Figure 3.7.The outdoor temperature is about 25F, while the indoor temperature is about 70F. Thesetemperatures are representative of all of the heating mode tests. The air side temperatures showlittle signs of being affected by the vapor line velocities, although the reduction in the evaporatorflowrate does drop both the indoor and outdoor air side exiting temperatures. The oilconcentration in the liquid line and the vapor velocities are plotted in Figure 3.8. The figureshows that the oil concentration level remains relatively constant (about 0.5 %) throughout thetest times until the evaporator cfm is lowered. At this point, the oil
49

Figure 3.5. Heat Pump R407C - Castrol SW68 Oil Circulation Tests (15 & 16)

Figure 3.6. Heat Pump R407C - Castrol SW68 Oil Circulation Tests (15 & 16)

Figure 3.7. Heat Pump R407C - Castrol SW68 Oil Circulation Tests (15 & 16)

Figure 3.8. Heat Pump R407C - Castrol SW68 Oil Circulation Tests (15 & 16)
Figure 3.9. Heating Mode Manifold Accumulation
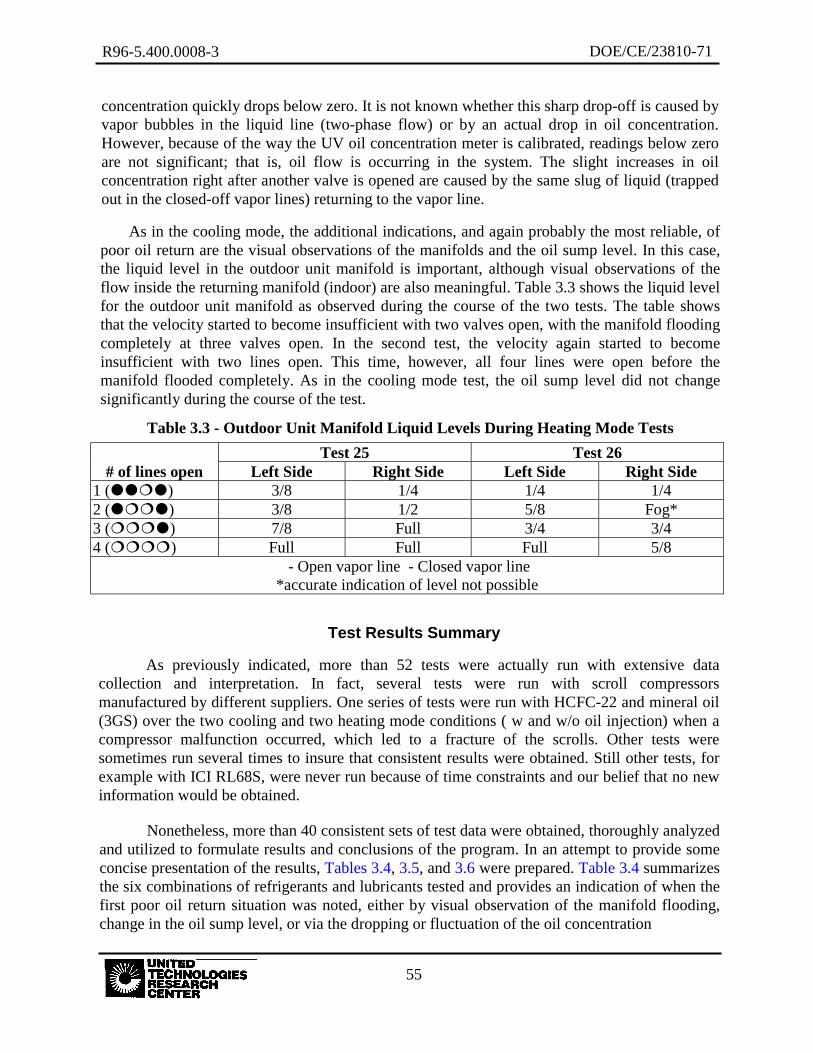
Test Results Summary
As previously indicated, more than 52 tests were actually run with extensive datacollection and interpretation. In fact, several tests were run with scroll compressorsmanufactured by different suppliers. One series of tests were run with HCFC-22 and mineral oil(3GS) over the two cooling and two heating mode conditions ( w and w/o oil injection) when acompressor malfunction occurred, which led to a fracture of the scrolls. Other tests weresometimes run several times to insure that consistent results were obtained. Still other tests, forexample with ICI RL68S, were never run because of time constraints and our belief that no newinformation would be obtained.
Nonetheless, more than 40 consistent sets of test data were obtained, thoroughly analyzedand utilized to formulate results and conclusions of the program. In an attempt to provide someconcise presentation of the results, Tables 3.4, 3.5, and 3.6 were prepared. Table 3.4 summarizesthe six combinations of refrigerants and lubricants tested and provides an indication of when thefirst poor oil return situation was noted, either by visual observation of the manifold flooding,change in the oil sump level, or via the dropping or fluctuation of the oil concentration
concentration quickly drops below zero. It is not known whether this sharp drop-off is caused byvapor bubbles in the liquid line (two-phase flow) or by an actual drop in oil concentration.However, because of the way the UV oil concentration meter is calibrated, readings below zeroare not significant; that is, oil flow is occurring in the system. The slight increases in oilconcentration right after another valve is opened are caused by the same slug of liquid (trappedout in the closed-off vapor lines) returning to the vapor line.
As in the cooling mode, the additional indications, and again probably the most reliable, ofpoor oil return are the visual observations of the manifolds and the oil sump level. In this case,the liquid level in the outdoor unit manifold is important, although visual observations of theflow inside the returning manifold (indoor) are also meaningful. Table 3.3 shows the liquid levelfor the outdoor unit manifold as observed during the course of the two tests. The table showsthat the velocity started to become insufficient with two valves open, with the manifold floodingcompletely at three valves open. In the second test, the velocity again started to becomeinsufficient with two lines open. This time, however, all four lines were open before themanifold flooded completely. As in the cooling mode test, the oil sump level did not changesignificantly during the course of the test.
Table 3.3 - Outdoor Unit Manifold Liquid Levels During Heating Mode Tests
R96-5.400.0008-3 DOE/CE/23810-71
55
Test 25 Test 26# of lines open Left Side Right Side Left Side Right Side
1 ( ) 3/8 1/4 1/4 1/42 ( ) 3/8 1/2 5/8 Fog*3 ( ) 7/8 Full 3/4 3/44 ( ) Full Full Full 5/8
- Open vapor line - Closed vapor line*accurate indication of level not possible

measurement. Table 3.5 contains the calculated gas line velocities that bracket adequate oilreturn, arid for completeness, all the test matrix velocity data and oil circulation information areshown in Table 3.6.
Sometimes air flow reductions across the evaporator coil were needed to produce a pooroil return situation in addition to opening all valves (operation at minimal velocities). In addition,in some instances where oil return was marginal, the interpretation could vary, depending uponthe observer and their daily perspective. For example, estimates of the oil return gathering andother flooding phenomena could lead one researcher to infer poor oil return, while another wouldindicate marginal return. Nevertheless, the data shown in Tables 3.4 and 3.5 shows a goodconsensus among program researchers as to when poor or zero oil return problems wereindicated.
Data Observations
The results in Table 3.4, indicate that with the baseline refrigerant/lubricant pair,HCFC-22 and 3GS mineral oil, poor oil return was observed (by the flooding manifold) whenfour valves were opened and the evaporator fan flow was reduced 50% (bold print in Table 3.4)during cooling mode with no oil injection. At that time both the sump oil level and the UV meterreading were steady. The vapor velocity was calculated to be less than 315 ft/min. Under thesame conditions, but with oil injection, manifold flooding was observed when four valves wereopened and fan flow was at 100%. For this case, a vapor velocity of 330 ft/min. was calculated.During heating and no oil injection, three open valves caused an observed oil circulation problemat a calculated velocity of 108 ft/min. With oil injection during heating conditions, the oil sumplevel was observed to constantly drop for all valve settings, indicating that the system may not bedesigned to accommodate the injected flow rates. This could be attributed to low saturationtemperatures and excessive quantities of oil in the evaporator and accumulator.
By scanning the Table 3.4 results, the various indicators of oil return problems can beseen to be dominated by the visual observation of oil collecting in the manifolds, and only a fewcases due to sump oil level dropping or oil concentration meter reading. In the cooling mode, thisis to be expected, since manifold flooding leads to the closing of one vapor line and thereforehigher velocity and adequate oil return. In the heating mode, the UV meter reading wasconsistently indicating an oil return problem at a lower minimum velocity than the visualmanifold observation and the sump oil level tended to remain constant. It appears likely that oilreturn was achieved in the heating mode after manifold flooding in a similar manor to the coolingtest.
In Table 3.5, the Table 3.4 observations have been converted into flow velocities inft/min., where oil return is good (OK) and poor (Not OK). The velocities calculated using theReference 3 guidelines are indicated as Model. The flow velocities based on visual observations(either oil sump or manifold flooding) and the velocities based on UV meter trends are indicatedas visual and UV meter, respectively. The visual and UV meter velocities were calculated basedon the number of vapor lines that were open (in parenthesis).
56
R96-5.400.0008-3 DOE/CE/23810-71
Based on the Table 3.5 data, a number of general observations can be made. These include:
1) Cooling Mode (no oil injection)
a) All six refrigerant/lubricant combinations would have good oil management ifapproximately the same minimum velocities, approximately 360 to 400 ft/min. aremaintained. The visual observation (usually flooding of the manifold) would show allcombinations have about the same range of flow velocities between good and poor oilmanagement (i.e. from 400 ft/min. down to 340 ft/min.). The data further indicate thatthe immisible refrigerant/lubricant combinations, R-407C with 1GS and 3GS are asviable as HCFC-22 and 3GS or the HFCs with POEs.
b) The model predicted flow velocities are all relatively close to one another (between355 ft/min. and 384 ft/min.).
c) In addition, the UV meter would predict that much higher minimum velocities have tobe maintained to insure good oil return characteristics than those determined fromvisual observation.
2) Cooling Mode (with oil injection)
a) This set of tests generally indicate somewhat higher minimum flow velocities andgenerally higher flow velocity indications with the UV meter.
b) Once again, the model predictions for flow velocity appear to be bracketed by therange of flow velocities between good and poor oil management conditions.
c) Conservative values of good oil management would appear to be similar to that for nooil injection.
3) Heating Mode (no oil injection)
a) The test summary data would indicate close correspondence between the flowvelocities predicted by the visual observations (flooding) and the UV meter. Generallythe values for good oil management are 100 ft/min. or below.
b) The Ref. 3 guidelines predict that flow velocities of 240 ft/min or above should besatisfactory.
4) Heating Mode (with oil injection)
a) The test data would indicate two to three times higher flow velocities with oilinjection based on flooding visualization, while the UV meter values remain at 100ft/min or less.
b) The guideline predictions of flow velocity are now bracketed by the visual results.
57
R96-5.400.0008-3 DOE/CE/23810-71

Table 3.4. Summary of Oil Return Problems for Refrigerant and Lubricant Combinations
Bold face type shows first indicator of oil return
Operating Mode Nominal Oil First Indication of Oil Return ProblemCirculation
Potential Cause of Oil ReturnProblem
Rate (%) from Manifold Oil Sump Level UV Oil Meter Low Vapor Low Saturat.UV Flooding Reading velocity Temp.
R22/ Suniso 3GSCooling .3 1/2 FAN FLOW STEADY STEADY < 315 FT/MIN
Cooling + oil inj. .8 4 OPEN STEADY STEADY 330 FT/MINHeating .3 3 OPEN STEADY STEADY 108 FT/MIN
Heating + oil inj. .8 1 OPEN DROPPING STEADY 5° FR407C/ Suniso 3GSCooling N/A 4 OPEN STEADY STEADY 280 FT/MIN
Cooling + oil inj. N/A 1 OPEN DROPPING STEADY 40° FHeating N/A 3 OPEN STEADY STEADY 79 FT/MIN
Heating + oil inj. N/A 1 OPEN DROPPING STEADY 5° FR407C/ Suniso 1GSCooling N/A 4 OPEN STEADY STEADY 330 FT/MIN
Cooling + oil inj. N/A N/A N/A N/AHeating N/A 3 OPEN STEADY STEADY 82 FT/MIN
Heating + oil inj. N/A N/A N/A N/AR407C/ Castrol SW32Cooling .8 3 OPEN STEADY UNSTEADY 455 FT/MIN
Cooling + oil inj. 3.5 4 OPEN STEADY STEADY 330 FT/MINHeating .8 4 OPEN STEADY STEADY 70 FT/MIN
Heating + oil in'. 6.0 2 OPEN STEADY STEADY 142 FT/MINR407C/ Castrol SW68Cooling .45 3 OPEN STEADY UNSTEADY 445 FT/MIN
Cooling + oil inj. 3.5 4 OPEN DROPPING UNSTEADY 305 FT/MINHeating .5 4 OPEN STEADY STEADY 67 FT/MIN
Heating + oil in'. 3.5 1 OPEN STEADY STEADY 290 FT/MINR407C/ ICI RL32SCooling 3.5 3 OPEN STEADY UNSTEADY 455 FT/MIN
Cooling + of inj. 4.25 4 OPEN STEADY STEADY 330 FT/MINHeating 3.5 3 OPEN STEADY STEADY 95 FT/MIN
Heating + oil inj. N/A N/A N/A N/A

Table 3.5. Minimum Velocities Needed for Oil Return Problem
a Based on ASHRAE guidelines (Ref. 3)*1 - No Accurate Measurement of Velocity Available*2 - Not Calibrated for Refrigerant - Lubricant Combination*3 - No Upper Bound on Velocity Available(n) - Number of Vapor Lines Open
Cooling Cooling Injection Heating Heating InjectionRefrigerant
Oil
OilReturnStatus Visual UV
MeterModela Visual UV
MeterModela Visual UV
MeterModela Visual UV
MeterModela
R22Suniso 3GS
OKNot OK
315(4)
*1315(4)
*1-
355430(3)
320(4)*3
1325(1)-
377158(2)
108(3)108(3)
80(4)-
245312(1)
154(2)105(3)
78(4)-
250
R407CSuniso 3GS
OKNot OK
450(3)
280(4)*2*2
-375
675(2)
435(3)*2*2
-375
130(2)
79(3)*2*2
-234
262(1)
115(2)*2*2
-242
R407CSuniso 1GS
OKNot OK
450(3)
330(4)*2*2
-384
N/AN/A
N/AN/A
N/AN/A
120(2)
82(3)*2*2
-253
N/AN/A
N/AN/A
N/AN/A
R407CCastrol SW32
OKNot OK
455(3)
340(4)685(2)
455(3)-
375445(3)
330(4)655(2)
330(4)-
38894(3)
70(4)70(4)
60(4+)-
267275(1)
142(2)90(3)
70(4)-
237
R407CCastrol SW68
OKNot OK
450(3)
330(4)685(2)
445(3)-
375430(3)
305(4)*3
1370(1)-
37897(3)
67(4)97(3)
50(4+)-
242*3
290(1)95(3)
68(4+)-
245
R407CICI RL32S
OKNot OK
340(4)
*1685(2)
455(3)-
375465(3)
330(4)705(2)
320(4)-
375150(2)
95(3)75(4)
45(4+)-
240N/AN/A
N/AN/A
N/AN/A

Table 3.6. Complete Test Matrix Flow Velocity Details

MAJOR RESULTS AND CONCLUSIONS
Results
A dynamic test facility was designed, constructed, and instrumentation provided tosimulate oil management scenarios and operating conditions that would produce zero oil return(or worst case) situations in ducted-split, residential-size heat pumps. Unique instrumentationand visual observation features were incorporated in the dynamic test facility so that on-line,continuous measurement and monitoring of the oil return behavior was possible in arepresentative installation.
The dynamic facility was designed to evaluate the primary effect of vapor mass flux andthereby, flow velocity, over a range of conditions likely to be experienced in heating and coolingmodes for a heat pump.
Six combinations of refrigerants and lubricant were tested, including a baselinecombination of HCFC-22 and mineral oil, and R-407C with two immiscible mineral oils (1 GSand 3GS) and R-407C with a range of low to medium miscibility lubricants including CastrolSW32, SW68 and ICI Emkarate RL32S. These lubricants represent a range of viscosities to testtheir impact on oil return characteristics.
The flow velocity, under which worst case oil management was noted by visual andmeasurement techniques, corresponds to approximately 100 ft/min in heating (where low oilconcentrations of 0.25 to 0.50% are normal). At higher oil circulation rates, the minimum flowvelocities are as much as twice as high (i.e., 200 ft/min). Minimum flow velocities ranging from350 to 375 ft/min are required in cooling. Based on the results of this study, these should beconsidered minimum velocities that should be maintained for good oil management.Approximate guidelines for good oil management are well above these levels in heating for lowoil concentrations, although they roughly correspond to those indicated in selected ASHRAEliterature. The guidelines (Ref. 3) for cooling mode operation were essentially confirmed. (SeeTable 3.5).
With the miscible lubricants, both HCFC-22 and R-407C have approximately the sameminimum velocity limits. The use of immiscible lubricants with R-407C, such as 1 GS and 3GS,did not indicate any worst case oil return scenarios, based on the test conditions produced in thedynamic test facility.
The dynamic test facility included the capability to inject additional quantities oflubricant beyond that which would normally be produced by normal compressor discharge. Theresults of these oil injection tests provided an indication that excessive lubricant injection couldresult in localized oil pooling and trapping.
61
R96-5.400.0008-3 DOE/CE/23810-71

Conclusions
Experimental data, enhanced by visual observations, indicate that R-407C and POEsexhibit similar oil management behavior to the baseline HCFC-22 and mineral oils. Although theflow velocities at which the poor oil management (or zero oil return) is experienced are slightlydifferent, the flow velocity results indicate consistent behavior.
A surprising and unexpected result of the extensive test program was the indication thatR-407C and either 1GS or 3GS mineral oil exhibited good, if not better, oil return, i.e., theseimmiscible mixtures could operate at lower minimum velocities than for HCFC-22 andcomparable mineral oils or R-407C and the tested POEs.
However, for all of the refrigerants and lubricants tested, extreme operating conditions(low saturation temperatures where lubricant viscosity is extremely high) may not be asthoroughly explored as necessary. For example, in tests with HCFC-22 and mineral oil, extremelow temperature operation (below 0 to 10°F) may have produced high viscosity conditions,produced an oil pooling condition or have resulted in the mixture entering the region of thisrefrigerant/lubricant pair where two liquid phases of high viscosity are produced.
Visual observations of poor oil return situations, such as that seen in vertical vapor linesand manifolds built in the dynamic test facility, probably provide a more consistent and reliableindicator of oil management than the on-line data produced by a UV oil concentration meter. Thevisual observations also included changes and rates of change of the compressor oil sump levelduring the various test sequences. Changes in these levels were rarely the reason for flaggingpoor oil management situations.
The UV oil concentration meter provided an on-line indication of circulating oilconcentration for the R-407C/POE tests, where calibration data were available. The UV meter isnot a reliable measure of oil concentration for immiscible mixtures. Where the UV absorbency ofthe lubricant is extremely low (as for the ICI RL32S lubricant), the meter readings should not beconsidered to be highly accurate, but only provided an approximate indication of oil flow in thesystem.
Although not the subject of this program, opportunities for oil trapping and pooling mayexist in the indoor and outdoor sections of the heat pump. These are manufacturers'responsibilities and designs or configurations which permit oil pooling (i.e., bottom of heatexchangers, in accumulators or system sumps) should, of course, be avoided for overall good oilmanagement practices. Furthermore, the compressor flow characteristics appear to have someimpact on the oil return behavior in heat pump systems and must be considered in the design andtest sequences.
The current industry guidelines developed twenty years ago for CFC and HCFCrefrigerants and mineral oil and alkylbenzene lubricants appear to provide appropriate butconservative guidelines for the minimum mass flux (and hence flow velocity) required for goodoil management practice. The guidelines, while suggesting an upper viscosity limit, do notadequately address all of the parameters that impact good oil management practices.
R96-5.400.0008-3 DOE/CE/23810-71
62

The ability to achieve adequate oil return up hot gas risers at lower than anticipatedvelocities may be due to the existence of very fine (smoke) oil suspension during these operatingconditions. It appears that an oil transport model, based on anticipated oil particle size, may beappropriate for determining hot gas riser minimum velocity, particularly at the low oilcirculation rate that characterizes modern scroll compressors.
63
R96-5.400.0008-3 DOE/CE/23810-71

R96-5.400.0008-3 DOE/CE/23810-71
RECOMMENDATIONS
Although the experimental program determined conditions under which the worst case oilreturn situations were determined for the six lubricant/refrigerant combinations that werestudied, additional tests and analysis are recommended.
1. These tests should attempt to explore the use of additional HFCs, such as R-410A withPOEs, as well as mineral oils to provide a broader set of guidelines for industry use withnew HFCs. Both an upper and lower immiscibility dome have been observed with manyR-410A/POE combinations. The impact on oil return should be studied over a range oftemperatures where both regions of immiscibility are encountered in system operation.
2. A limited series of tests should be carried out to determine the location of the liquidrefrigerant and lubricant during normal operation, shutdown, and startup mode ofoperation. This would require isolating one or more of the major components todetermine the location of key oil traps and pooling locations.
3. Additional tests with another HFC blend such as R-404A, or one of those testedoriginally, should be undertaken at substantially lower evaporator temperature levels,(perhaps at 0 to 10°F or below) than the levels encountered in the current tests, in order toexplore the effect of lubricant viscosity on the oil return correlations in refrigerationcycles and to establish reliable guidelines.
A more comprehensive analytical and experimental program, combined with availableexperimental data on oil circulation, should be undertaken to investigate the oil circulationpatterns in representative HVAC systems. The development of a preliminary model that couldprovide guidelines for a wider variety of HVAC applications, such as package terminal air-conditioners (PTAC), duct-free splits, window room air-conditioners (WRAC), and ductedresidential systems would be especially useful. Such a program would determine both similaritiesand differences in system operation compared with the split system heat pump studied in thepresent program.
64

REFERENCES
1. Ogata, S., Carrier Reliability and Technical Series; "Delchi Hi-wall Split System Heat Pump(Oil Return Testing - AC9000/Lunaria 68)," Oct. 19, 1994.
2. Refrigeration Systems and Applications, ASHRAE Handbook, 1994:2.11-2.16.
3. Jacobs, M. L., F. C. Scheideman, F. C. Kazen, and N. A. Macken, 1976. Oil Transport byRefrigerant Vapor. ASHRAE Transactions 81(2):318-29.
4. H. W. Sibley, Soft Optimization System Test of Refrigerant Blend D3 in a Split SystemHeat Pump (1994).
5. Private data communication to Carrier Corp., DuPont Co. (1994).
6. J. J. Grebner and R. R. Crawford, ASHRAE Trans. 99-1, 380 (1993).
7. S. Corr, F. T. Murphy, B. E. Gilbert and R. W. Yost, ASHRAE Trans. 99-2, 1123 (1993).
8. D. R. Henderson, Solubility, Viscosity and Density of Refrigerant/Lubricant Mixtures, FinalTech. Rept. DOE/CE/23810-34, Spauschus Assoc., April 1994.
9. R. C. Cavestri, Measurement of Viscosity, Density and Gas Solubility of Refrigerant Blendsin Selected Synthetic Lubricants, Tech. Prog. Rep. DOE/CE/23810-20C, ImaginationResources, July 1993.
10. P-T-X Diagram for Castrol Icematic SW68/R134a, private data communication, Castrol,Inc. (1994).
11. W.L. Martz and A. M. Jacobi, Refrigerant-Oil Mixtures and Local Composition Modeling,Technical Report ACRC TR-68, U. of Illinois (1994).
12. P-T-X and Viscosity Data for Icematic SW Lubricants and Various Refrigerants, privatedata communication, Castrol, Inc. (1994).
13. P-T-X and Viscosity Data for Icematic SW Lubricants and Various Refrigerants, privatedata communication, Castrol, Inc. (1994).
65
R96-5.400.0008-3 DOE/CE/23810-71