study of n and c dynamics in aquatic ecosystems dr natacha brion, dr marc elskens, dr steven...
TRANSCRIPT

Study of N and C dynamics in aquatic ecosystems
Dr Natacha Brion, Dr Marc Elskens, Dr Steven Bouillon, Dr Frank Dehairs, DrS Emilie Chevalier, DrS Sandra De Galan, DrS Perrine
Mangion, Dr Willy Baeyens

Why ?
• Living organisms = C, N, H, O, P + trace elements
• Life or dead of all organisms depends on the availability and usefulness of C and N holding material.
• Eg: plant: CO2 and NH4 or NO3 and PO4
• Eg: animal: proteins, sugars, lipids

N and C cycles
NH4 PN
DON
N2NO3
DIC POC
DOC
Subdivised by molecule, size, biodegradability, origin etc…
Detritus
Living
autrotrophe
Heterotrophe
SpeciesSizeEtc..
INCREASING COMPLEXITY

Methodological tool I: Study the natural variations of 13C and
15N in various C and N pools• Considered pools:
– Dissolved inorganic (DIN-DIC)– Dissolved organic (DOC-DON)– Particulate organic (SPOM, living organisms)– Particulate inorganic (carbonates)
• Allows to highlight:– Origin of material– Major transformation pathways– Foodweb chain pathways (who eats who)
• Type of information: – qualitative – quantitative when combined with a modelling approach

Methodological tool II: Perform incubation experiments with
enriched 15N or 13C tracers• Tracers : dissolved inorganic or organic N and C• Incubation: one tracer is added per incubation
bottle or a combination of one N and one C tracer in one bottle
• After incubation: measure the 15N and/or 13C in different N and C pools– DIN – DIC pools– DON – DOC pools– PON – POC pools

• Use an isotopic mass balance model to compute transformation rates
• Type of transformation rates that can be measured:
NH4 PN
DON
N2NO3
DIC POC
DOC
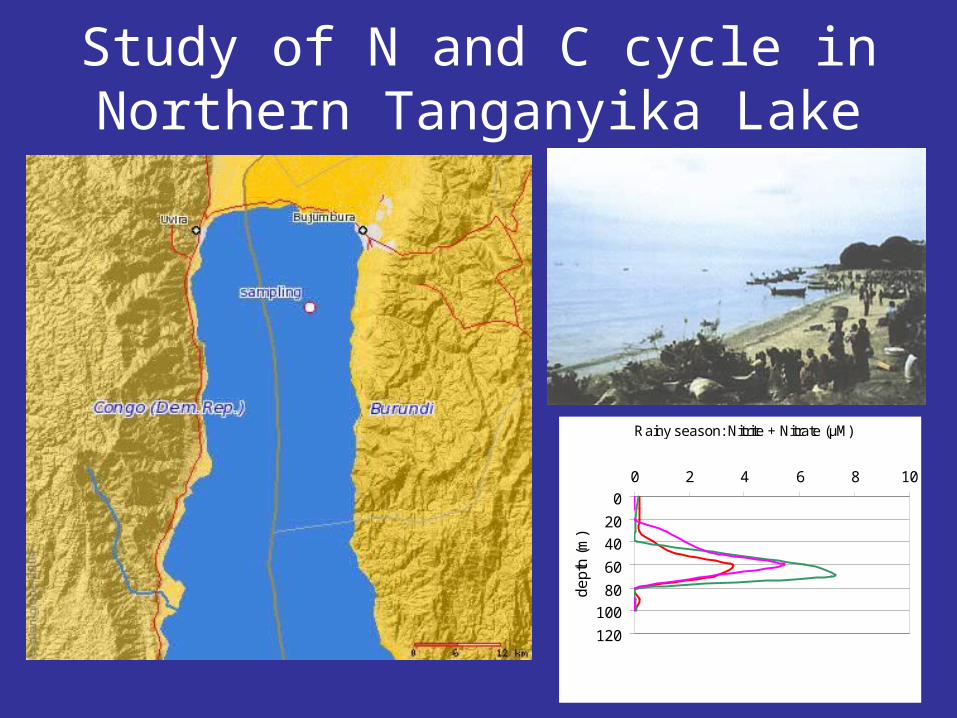
Study of N and C cycle in Northern Tanganyika Lake
Rainy season: Nitrite + Nitrate (µM)
0
20
40
60
80
100
120
0 2 4 6 8 10
de
pth
(m
)
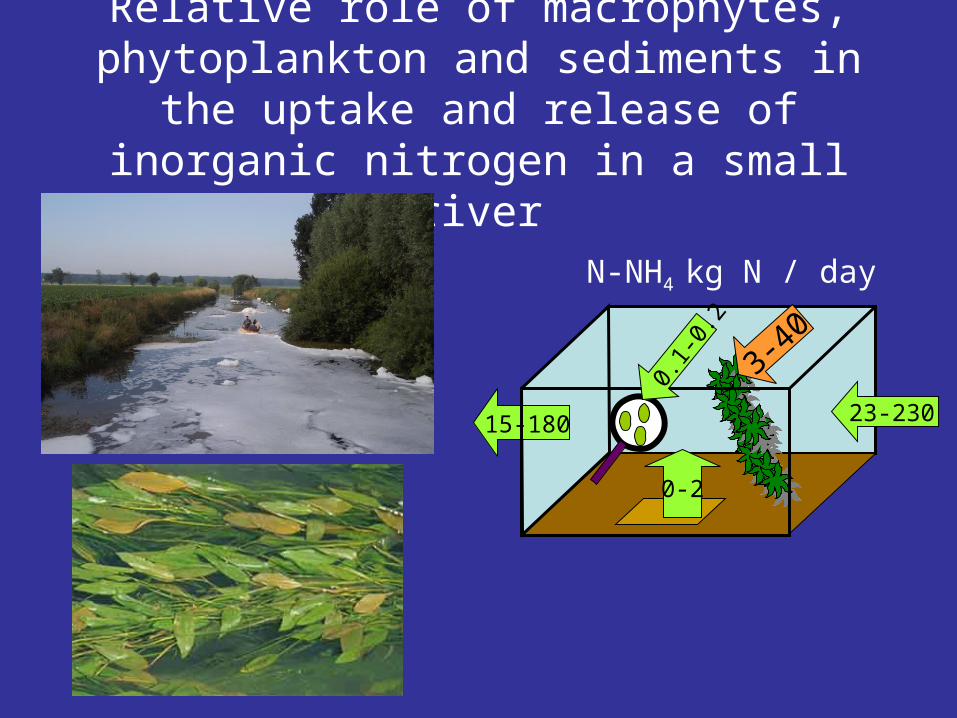
Relative role of macrophytes, phytoplankton and sediments in the uptake and release of
inorganic nitrogen in a small river
23-23015-180
3-40
0.1-
0.2
0-2
N-NH4 kg N / day

N cycling in the Southern Bight of the North Sea
1.00 2.00 3.00 4.00
51.00
52.00
February 2004
1.00 2.00 3.00 4.00
51.00
52.00
M ay 2004
51.00
52.00
0
7
14
21
28
35
O ctober 2004
Nitr
ate
+ N
itrite
µM

N cycling in the Scheldt estuary
0
10
20
30
40
50
60
70
80
Nov-01
Dec-01
Dec-01
Jan-02
Mar-02
Mar-02
Apr-02
May-02
Jun-02
Jul-02
Aug-02
Sep-02
Oct-02
Nov-02
Dec-02
d15
NH
4+ (‰
)

TN/day
N dynamics in the Zenne river in Brussels
Z2 (km 0)
Z4 (km 4.0) Brussels-South WWTP
Paruck sewerMolenbeek sewer
Marly sewerHoofdmoerriool sewer
Haren sewer Woluwe sewer
Z5 (km 13.7)
Z6 (km 17.9)
Z8 (km 19.6)
IN
OUT
SEDWAT
WASTE
1
1
1410
4

The fate of mangrove carbon and nitrogen in different mangrove ecosystems
Studied by looking at natural variations of 15N and 13C in different compartments of the ecosystem

• And…
• N and C cyling oin Southern Ocean
• N and C cycling in Pacific Ocean
• N and C cycling in Atlantic Ocean
• …. And many others