study of seismic effect of different type of rc shear walls in · for soft soils the earthquake...
TRANSCRIPT

Study of Seismic Effect of Different Type of RC Shear Walls inConcrete Frame Structures
Mahdi Hosseini1 , Prof.N.V.Ramana Rao2
Abstract_ Shear walls are a type of structural system that provides lateral resistance to a building or structure. They resist in-plane loads that are applied along its height. The applied load isgenerally transferred to the wall by a diaphragm or collector or drag member.Shear walls are analyzed to resist two types of forces: shear forces and uplift forces. Shear forces are createdthroughout the height of the wall between the top and bottom shear wall connections. Uplift forces exist on shear walls because the horizontal forces are applied to the top of the wall. These upliftforces try to lift up one end of the wall and push the other end down. In some cases, the uplift force is large enough to tip the wall over. Shear walls are analyzed to the provide necessary lateralstrength to resist horizontal forces. Shear walls are strong enough, to transfer these horizontal forces to the next element in the load path below them. The seismic motion that reaches a structure onthe surface of the earth is influenced by local soil conditions. The subsurface soil layers underlying the building foundation may amplify the response of the building to earthquake motions originatingin the bedrock. Three types soil are considered here:Hard soil ,Medium soil,soft soil. In the present work thirty story building with C Shape,Box shape,E Shape,I shape and Plus shape RC Shearwall at the center in Concrete Frame Structure with fixed support conditions under different type of soil for earthquake zone V as per IS 1893 (part 1) : 2002 in India are analyzed using softwareETABS by Dynamic analysis. All the analyses has been carried out as per the Indian Standard code books. This paper aims to Study the behaviour of high rise structure with dual system withDifferent Type of RC Shear Walls (C,Box,E,I and Plus shapes) under different type of soil condition with seismic loading. Estimation of structural response such as; storey displacements, storeymoment ,storey shear, storey drift , Time period and frequency is carried out.In dynamic analysis; Response Spectrum method is used.
Keywords_ Response Spectrum method, Soft ,Medium &Hard Soil, Structural Response , C Shape Shear Wall , Box shape, E Shape, I shape , Plus shape RC Shear wall
1 INTRODUCTION
Shear wall structureThe usefulness of shear walls in framing of buildings has long beenrecognized. Walls situated in advantageous positions in a building can forman efficient lateral-force-resisting system, simultaneously fulfilling otherfunctional requirements. When a permanent and similar subdivision of floorareas in all stories is required as in the case of hotels or apartment buildings,numerous shear walls can be utilized not only for lateral force resistance butalso to carry gravity loads. In such case, the floor by floor repetitive planningallows the walls to be vertically continuous which may serve simultaneouslyas excellent acoustic and fire insulators between the apartments. Shear wallsmay be planar but are often of L-, T-, I-, or E,C,Box shaped section to bettersuit the planning and to increase their flexural stiffness.The positions of shear walls within a building are usually dictated byfunctional requirements. These may or may not suit structural planning. Thepurpose of a building and consequent allocation of floor space may dictaterequired arrangements of walls that can often be readily utilized for lateralforce resistance. Building sites, architectural interests or client’s desire maylead the positions of walls that are undesirable from a structural point of view.However, structural designers are often in the position to advice as to the mostdesirable locations for shear walls in order to optimize seismic resistance. Themajor structural considerations for individual shear walls will be aspects ofsymmetry in stiffness, torsional stability and available overturning capacity ofthe foundations (Paulay and Priestley, 1992).
Earthquake LoadThe seismic weight of building is the sum of seismic weight of all the floors.The seismic weight of each floor is its full dead load plus appropriate amountof imposed load, the latter being that part of the imposed loads that mayreasonably be expected to be attached to the structure at the time ofearthquake shaking. It includes the weight of permanent and movablepartitions, permanent equipment, a part of the live load, etc. While computingthe seismic weight of columns and walls in any storey shall be equallydistributed to the floors above and below the storey. Earthquake forcesexperienced by a building result from ground motions (accelerations) whichare also fluctuating or dynamic in nature, in fact they reverse direction somewhat chaotically. The magnitude of an earthquake force depends on themagnitude of an earthquake, distance from the earthquake source(epicenter),local ground conditions that may amplify ground shaking (or dampen it), theweight(or mass) of the structure, and the type of structural system and itsability to with stand abusive cyclic loading. In theory and practice, the lateralforce that a building experiences from an earthquake increases in directproportion with the acceleration of ground motion at the building site and themass of the building (i.e., a doubling in ground motion acceleration orbuilding mass will double the load).This theory rests on the simplicity andvalidity of Newton’s law of physics: F = m x a, where ‘F’ represents force, ‘m’represents mass or weight, and ‘a’ represents acceleration. For example, as acar accelerates forward, a force is imparted to the driver through the seat topush him forward with the car(this force is equivalent to the weight of thedriver multiplied by the acceleration or rate of change in speed of the car). Asthe brake is applied, the car is decelerated and a force is imparted to the driverby the seat-belt to push him back toward the seat.
1
Ph.D. scholar student in Structural Engineering, Dept. of Civil Engineering, Jawaharlal Nehru Technological University Hyderabad (JNTUH),
Hyderabad, Telengana , India,Email: [email protected]
2
Professor, Dept. of Civil Engineering, Jawaharlal Nehru Technological University Hyderabad (JNTUH), Hyderabad, & Director of National Institute
of Technology Warangal ,Telangana, India,Email: [email protected]
Similarly, as the ground accelerates back and forth during an earthquake itimparts back-and-forth(cyclic) forces to a building through its foundationwhich is forced to move with the ground. One can imagine a very lightstructure such as fabric tent that will be undamaged in almost any earthquakebut it will not survive high wind. The reason is the low mass (weight) of thetent. Therefore, residential buildings generally perform reasonably well inearthquakes but are more vulnerable in high-wind load prone areas.Regardless, the proper amount of bracing is required in both cases.
Importance of seismic design codes
Ground vibration during earthquake cause forces and deformations instructures. Structures need to be designed withstand such forces anddeformations. Seismic codes help to improve the behavior of structures so thatmay withstand the earthquake effect without significant loss of life andproperty. Countries around the world have procedures outlined in seismiccode to help design engineers in the planning, designing, detailing andconstructing of structures.
A) An earthquake resistant has four virtues in it, namely:i) Good Structural Configuration: its size, shape and structural system carryingloads are such that they ensure a direct and smooth flow of inertia forces tothe ground.ii) Lateral Strength: The maximum lateral (horizontal) force that it can resistis such that the damage induced in it does not result in collapse.iii) Adequate Stiffness: Its lateral load resisting system is such that theearthquake – indeed deformations in it do not damage its contents underlow-to- moderate shaking.iv) Good Ductility: Its capacity to undergo large deformations under severeearthquake shaking even after yielding is improved by favorable design anddetailing strategies.B) Indian Seismic Codes Seismic codes are unique to a particular region or country. Theytake into account the local seismology, accepted level of seismic risk,buildings typologies, and materials and methods used in construction.
The Bureau of Indian Standards (BIS) the following Seismic Codes:IS 1893 (PART 1) 2002, Indian Standard Criteria for EarthquakesResistant of Design Structures (5th revision).IS 4326, 1993, Indian Standard Code of practice for EarthquakeResistant Design and Construction of Buildings. (2nd revision).IS 13827, 1993, Indian Standard Guidelines for improving EarthquakeResistant of Earthen buildings.IS 13828, 1993 Indian Standard Guidelines for improving EarthquakeResistant of Low Strength Masonry Buildings.IS 13920, 1993, Indian Standard Code for practice for Ductile Detailingof Reinforced Concrete Structures Subjected to Seismic Forces.
The regulations in these standards do not ensure that structures suffer nodamage during earthquake of all magnitude. But, to the extent possible, theyensure that structures are able to respond to earthquake shaking of moderateintensities without structural damage and of heavy intensities wit out totalcollapse.
Site selection
The seismic motion that reaches a structure on the surface of the earthis influenced by local soil conditions. The subsurface soil layers underlying thebuilding foundation may amplify the response of the building to earthquakemotions originating in the bedrock. For soft soils the earthquake vibrations can be significantly amplifiedand hence the shaking of structures sited on soft soils can be much greater
International Journal of Scientific & Engineering Research, Volume 8, Issue 11, November-2017ISSN 2229-5518 1,046
IJSER © 2017http://www.ijser.org
IJSER

than for structures sited on hard soils. Hence the appropriate soil investigationshould be carried out to establish the allowable bearing capacity and nature ofsoil. The choice of a site for a building from the failure prevention point ofview is mainly concerned with the stability of the ground. The very loosesands or sensitive clays are liable to be destroyed by the earthquake, so muchas to lose their original structure and thereby undergo compaction. Thiswould result in large unequal settlements and damage the building. If theloose cohesion less soils are saturated with water they are likely to lose theirshear resistance altogether during ground shaking. This leads to liquefaction.Although such soils can be compacted, for small buildings the operation maybe too costly and the sites having these soils are better avoided. For large building complexes, such as housing developments, newcolonies, etc. this factor should be thoroughly investigated and the site has tobe selected appropriately. Therefore a site with sufficient bearing capacity andfree from the above defects should be chosen and its drainage conditionimproved so that no water accumulates and saturates the ground especiallyclose to the footing level.
Bearing capacity of foundation soil
Three soil types are considered here:I. Hard- Those soils, which have an allowable bearing capacity of
more than 10t/m2.II. Medium - Those soils, which have an allowable bearing capacity
less than or equal to 10t/m2III. Soft - Those soils, which are liable to large differential settlement
or liquefaction during an earthquake.
Soils must be avoided or compacted to improve them so as to qualify themeither as firm or stiff. The allowable bearing pressure shall be determined inaccordance with IS: 1888-1982 load test (Revision 1992). It is a commonpractice to increase the allowable bearing pressure by one-third, i.e. 33%,
while performing seismic analysis of the materials like massive crystallinebedrock sedimentary rock, dense to very dense soil and heavily over consolidated cohesive soils, such as a stiff to hard clays. For the structure toreact to the motion, it needs to overcome its own inertia, which results in aninteraction between the structure and the soil. The extent to which thestructural response may alter the characteristics of earthquake motionsobserved at the foundation level depends on the relative mass and stiffnessproperties of the soil and the structure. Thus the physical property of thefoundation medium is an important factor in the earthquake response ofstructures supported on it. There are two aspects of building foundationinteraction during earthquakes, which are of primary importance toearthquake engineering. First, the response to earthquake motion of astructure founded on a deformable soil can be significantly different from thatwould occur if the structure is supported on a rigid foundation. Second, themotion recorded at the base of a structure or in the immediate vicinity can bedifferent from that which would have been recorded had there been nobuilding. Observations of the response of the buildings during earthquakeshave shown that the response of typical structures can be markedly influencedby the soil properties if the soils are sufficiently soft. Furthermore, forrelatively rigid structures such as nuclear reactor containment structures,interaction effects can be important, even for relatively firm soils because theimportant parameter apparently is not the stiffness of the soil, but the relativestiffness of the building and its foundation. In terms of the dynamic propertiesof the building foundation system, past studies have shown that theinteraction will, in general, reduce the fundamental frequency of the systemfrom that of the structure on a rigid base, dissipate part of the vibrationalenergy of the building by wave radiation into the foundation medium andmodify the base motion of the structure in comparison to the free- fieldmotion. Although all these effects may be present in some degree for everystructure, the important point is to establish under what conditions the effectsare of practical significance.
Seismic Behavior of RC Shear Wall
International Journal of Scientific & Engineering Research, Volume 8, Issue 11, November-2017ISSN 2229-5518 1,047
IJSER © 2017http://www.ijser.org
IJSER

2 METHODOLOGY
Earthquake motion causes vibration of the structure leading to inertia forces.Thus a structure must be able to safely transmit the horizontal and the verticalinertia forces generated in the super structure through the foundation to theground. Hence, for most of the ordinary structures, earthquake-resistantdesign requires ensuring that the structure has adequate lateral load carryingcapacity. Seismic codes will guide a designer to safely design the structure forits intended purpose.
Quite a few methods are available for the earthquake analysis of buildings;two of them are presented here:
1- Equivalent Static Lateral Force Method (pseudo static method).2- Dynamic analysis.I. Response spectrum method.II. Time history method.
Equivalent lateral Force (Seismic Coefficient) Method
This method of finding lateral forces is also known as the static method or theequivalent static method or the seismic coefficient method. The static methodis the simplest one and it requires less computational effort and is based onformulae given in the code of practice.In all the methods of analyzing a multi storey buildings recommended in thecode, the structure is treated as discrete system having concentrated masses atfloor levels which include the weight of columns and walls in any storeyshould be equally distributed to the floors above and below the storey. Inaddition, the appropriate amount of imposed load at this floor is also lumpedwith it. It is also assumed that the structure flexible and will deflect withrespect to the position of foundation the lumped mass system reduces to thesolution of a system of second order differential equations. These equationsare formed by distribution, of mass and stiffness in a structure, together withits damping characteristics of the ground motion.
Dynamic Analysis
Dynamic analysis shall be performed to obtain the design seismic force, andits distribution in different levels along the height of the building, and in thevarious lateral load resisting element, for the following buildings:
Regular buildings: Those greater than 40m in height in zones IV and V, thosegreater than 90m in height in zone II and III.
Irregular buildings: All framed buildings higher than 12m in zones IV and V,and those greater than 40m in height in zones II and III.The analysis of model for dynamic analysis of buildings with unusualconfiguration should be such that it adequately models the types ofirregularities present in the building configuration. Buildings with planirregularities, as defined in Table 4 of IS code: 1893-2002 cannot be modeledfor dynamic analysis.
Dynamic analysis may be performed either by the TIME HISTORY METHODor by the RESPONSE SPECTRUM METHOD
Time History Method
The usage of this method shall be on an appropriate ground motion and shallbe performed using accepted principles of dynamics. In this method, themathematical model of the building is subjected to accelerations fromearthquake records that represent the expected earthquake at the base of thestructure.
Response Spectrum Method
The word spectrum in engineering conveys the idea that the response ofbuildings having a broad range of periods is summarized in a single graph.This method shall be performed using the design spectrum specified in code
or by a site-specific design spectrum for a structure prepared at a project site.The values of damping for building may be taken as 2 and 5 percent of thecritical, for the purposes of dynamic of steel and reinforce concrete buildings,respectively. For most buildings, inelastic response can be expected to occurduring a major earthquake, implying that an inelastic analysis is more properfor design. However, in spite of the availability of nonlinear inelasticprograms, they are not used in typical design practice because:
1- Their proper use requires knowledge of their inner workings andtheories. design criteria, and
2- Result produced are difficult to interpret and apply to traditional designcriteria , and
3- The necessary computations are expensive.Therefore, analysis in practice typically use linear elastic procedures based
on the response spectrum method. The response spectrum analysis is thepreferred method because it is easier to use.
3 LITERATURE REVIEW
Generally, the building configuration which is conceived by architects andthen accepted by developer or owner may provide a narrow range of optionsfor lateral-load resistant systems that can be utilized by structural engineers.By observing the following fundamental principles relevant to seismicresponses, more suitable structural systems may be adopted (Paulay andPriestley, 1992):
1. To perform well in an earthquake, a building should possess simple andregular configurations. Buildings with articulated plans such as T and Lshapes should be avoided.2. Symmetry in plans should be provided, wherever possible. Lack ofsymmetry in plan may lead to significant torsional response, the reliableprediction of which is often difficult.
3. An integrated foundation system should tie together all vertical structuralelements in both principal directions. Foundation resting on different soilcondition should preferably be avoided.
4. Lateral force resisting systems with significantly different stiffness such asshear walls and frames within one building should be arranged in such a waythat at every level of the building, symmetry in lateral stiffness is not grosslyviolated. Thus, undesirable torsional effects will be minimized.
5. Regularity in elevation should prevail in both the geometry and thevariation of story stiffness.
Prajapati R.J. et al., (2013) carried out study on deflection in high rise buildingsfor different position of shear walls. It was observed that deflection forbuilding with shear walls provided at the corners in both the directions wasdrastically less when compared with other models.
Chandurkar P.P. et al., (2013) conducted a study on seismic analysis of RCCbuilding with and without shear walls. They have selected a ten storiedbuilding located in zone II, zone III, zone IV and zone V. Parameters likeLateral displacement, story drift and total cost required for ground floor werecalculated in both the cases.
Bhat S.M. et al., (2013) carried out study on Eathquake behaviour of buildingswith and without shear walls. Parameters like Lateral displacement, story driftetc were found and compared with the bare frame model.
Sardar S.J. et al., (2013) studied lateral displacement and inter-story drift on asquare symmetric structure with walls at the centre and at the edges, andfound that the presence of shear wall can affect the seismic behaviour of framestructure to large extent, and the shear wall increases the strength and stiffnessof the structure.
International Journal of Scientific & Engineering Research, Volume 8, Issue 11, November-2017ISSN 2229-5518 1,048
IJSER © 2017http://www.ijser.org
IJSER

Sagar K.et al., (2012) carried out linear dynamic analysis on two sixteen storeyhigh buildings.It was concluded that shear walls are one of the most effectivebuilding elements in resisting lateral forces during earthquake. Providingshear walls in proper position minimizes effect and damages due toearthquake and winds.
Kumbhare P.S. et al., (2012) carried out a study on shear wall frame interactionsystems and member forces. It was found that shear wall frame interactionsystems are very effective in resisting lateral forces induced by earthquake.Placing shear wall away from center of gravity resulted in increase in the mostof the members forces. It follows that shear walls should be coinciding withthe centroid of the building.
Rahman A. et al., (2012) studied on drift analysis due to earthquake load ontall structures. In this study regular shaped structures have been considered.Estimation of drift was carried out for rigid frame structure, coupled shearwall structure and wall frame structure.
Anshuman et al., (2011) conducted a research on solution of shear walllocation in multi storey building. An earthquake load was calculated andapplied to a fifteen storied building located in zone IV. It was observed thatthe top deflection was reduced and reached within the permissible deflectionafter providing the shear wall.
Kameshwari B. et al., (2011) analyzed the effect of various configurations ofshear walls on high-rise structure. The drift and inter-storey drift of thestructure in the following configurations of shear wall panels was studied andwas compared with that of bare frame. Diagonal shear wall configuration wasfound to be effective for structures in the earthquake prone areas.
Based on the literature review, the salient objective of the present study have
been identified as
follows:
v behaviour of high rise structure with dual system with DifferentType of RC Shear Walls (C, E,I,Boxand Plus shapes) with seismicloading.
v To examine the effect of different types of soil (Hard, mediumand Soft) on the overall interactive behaviour of the shear wallfoundation soil system.
v The variation of maximum storey shear, storey moment of themodels has been studied.
v The variation of storey drifts of the models has been studiedv The variation of displacement of the models has been studiedv The variation of Time period and frequency has been studied.
4 MODELING OF BUILDING
Details of The Building
A symmetrical building of plan 38.5m X 35.5m located with location in zone V,India is considered. Four bays of length 7.5m& one bays of length 8.5malong X - direction and Four bays of length 7.5m& one bays of length 5.5malong Y - direction are provided. Shear Wall is provided at the center core ofbuilding model.
Structure 1: In this model building with 30 storey is modeled as a (Dual frame
system with shear wall (Plus Shape) at the center of building, The shear wall
acts as vertical cantilever.
Structure 2 : In this model building with 30 storey is modeled as (Dual frame
system with shear wall (Box Shape) at the center of building ,The shear wall
acts as vertical cantilever.
Structure 3 : In this model building with 30 storey is modeled as (Dual frame
system with shear wall (C- Shape ) at the center of building, The shear wall
acts as vertical cantilever.
Structure 4 : In this model building with 30 storey is modeled as (Dual frame
system with shear wall (E- Shape ) at the center of building ,The shear wall
acts as vertical cantilever.
Structure 5 : In this model building with 30 storey is modeled as (Dual frame
system with shear wall (I- Shape) at the center of building, The shear wall acts
as vertical cantilever.
Load Combinations
As per IS 1893 (Part 1): 2002 Clause no. 6.3.1.2, the following load cases have tobe considered for analysis:1.5 (DL + IL)1.2 (DL + IL ± EL)1.5 (DL ± EL)0.9 DL ± 1.5 ELEarthquake load must be considered for +X, -X, +Y and –Y directions.
Table 1 : Details of The Building
Building Parameters Details
Type of frameSpecial RC moment resisting frame fixed
at the baseBuilding plan 38.5m X 35.5m
Number of storeys 30Floor height 3.5 m
Depth of Slab 225 mmSize of beam (300 × 600) mm
Size of column(exterior)
(1250×1250) mm up to story five
Size of column(exterior)
(900×900) mm Above story five
Size of column(interior)
(1250×1250) mm up to story ten
Size of column(interior)
(900×900) mm Above story ten
Spacing betweenframes
7.5-8.5 m along x - direction7.5-5.5 m along y - direction
Live load on floor 4 KN/m2Floor finish 2.5 KN/m2Wall load 25 KN/m
Grade of Concrete M 50 concreteGrade of Steel Fe 500
Thickness of shearwall
450 mm
Seismic zone VDensity of concrete 25 KN/m3
Type of soil
Soft,Medium,HardSoil Type I=Soft Soil
Soil Type II=Medium SoilSoil Type III= Hard Soil
Response spectra As per IS 1893(Part-1):2002Damping of structure 5 percent
Figure 1. Plan of the Structure 1
International Journal of Scientific & Engineering Research, Volume 8, Issue 11, November-2017ISSN 2229-5518 1,049
IJSER © 2017http://www.ijser.org
IJSER

Figure 2. 3D view showing shear wall location for Structure 1
Figure3. Plan of the Structure 2
Figure 4. 3D view showing shear wall location for Structure2
Figure 5. Plan of the Structure 3
Figure 6. 3D view showing shear wall location for Structure 3
International Journal of Scientific & Engineering Research, Volume 8, Issue 11, November-2017ISSN 2229-5518 1,050
IJSER © 2017http://www.ijser.org
IJSER

Figure 7. Plan of the Structure 4
Figure 8. 3D view showing shear wall location for Structure 4
Figure 9. Plan of the Structure 5
Figure 10. 3D view showing shear wall location for Structure 5
International Journal of Scientific & Engineering Research, Volume 8, Issue 11, November-2017ISSN 2229-5518 1,051
IJSER © 2017http://www.ijser.org
IJSER
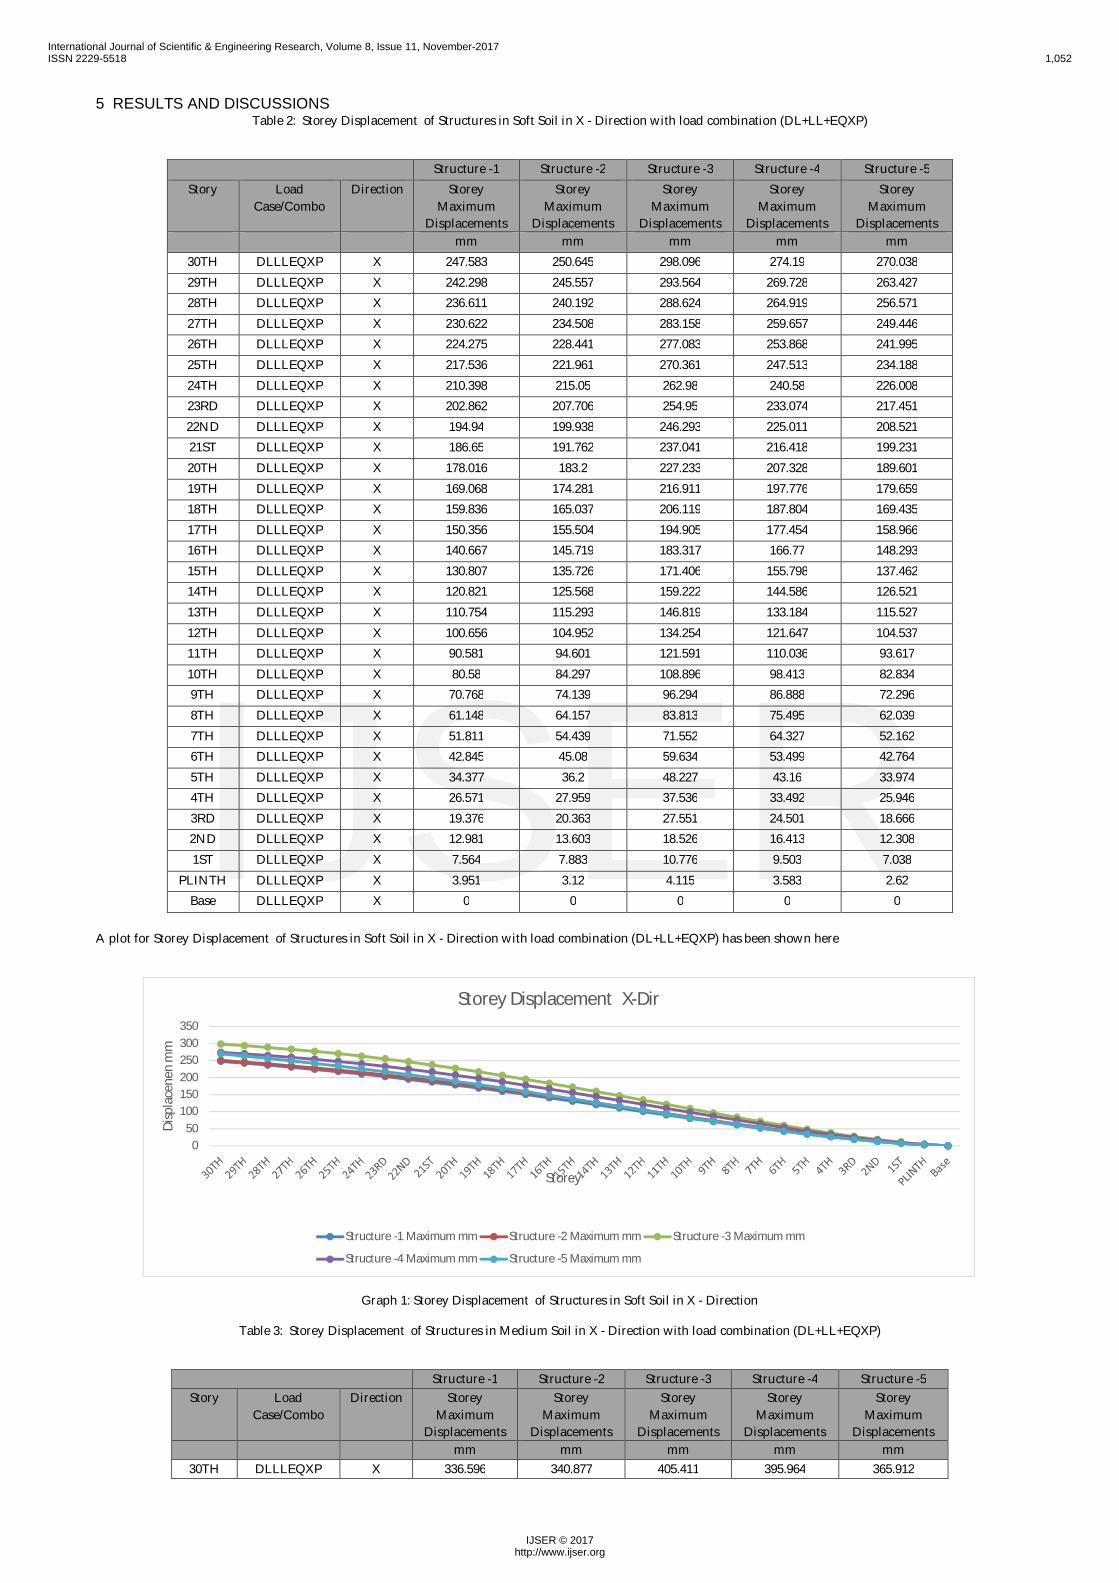
5 RESULTS AND DISCUSSIONSTable 2: Storey Displacement of Structures in Soft Soil in X - Direction with load combination (DL+LL+EQXP)
Structure -1 Structure -2 Structure -3 Structure -4 Structure -5Story Load
Case/ComboDirection Storey
MaximumDisplacements
StoreyMaximum
Displacements
StoreyMaximum
Displacements
StoreyMaximum
Displacements
StoreyMaximum
Displacementsmm mm mm mm mm
30TH DLLLEQXP X 247.583 250.645 298.096 274.19 270.03829TH DLLLEQXP X 242.298 245.557 293.564 269.728 263.42728TH DLLLEQXP X 236.611 240.192 288.624 264.919 256.57127TH DLLLEQXP X 230.622 234.508 283.158 259.657 249.44626TH DLLLEQXP X 224.275 228.441 277.083 253.868 241.99525TH DLLLEQXP X 217.536 221.961 270.361 247.513 234.18824TH DLLLEQXP X 210.398 215.05 262.98 240.58 226.00823RD DLLLEQXP X 202.862 207.706 254.95 233.074 217.45122ND DLLLEQXP X 194.94 199.938 246.293 225.011 208.52121ST DLLLEQXP X 186.65 191.762 237.041 216.418 199.23120TH DLLLEQXP X 178.016 183.2 227.233 207.328 189.60119TH DLLLEQXP X 169.068 174.281 216.911 197.776 179.65918TH DLLLEQXP X 159.836 165.037 206.119 187.804 169.43517TH DLLLEQXP X 150.356 155.504 194.905 177.454 158.96616TH DLLLEQXP X 140.667 145.719 183.317 166.77 148.29315TH DLLLEQXP X 130.807 135.726 171.406 155.798 137.46214TH DLLLEQXP X 120.821 125.568 159.222 144.586 126.52113TH DLLLEQXP X 110.754 115.293 146.819 133.184 115.52712TH DLLLEQXP X 100.656 104.952 134.254 121.647 104.53711TH DLLLEQXP X 90.581 94.601 121.591 110.036 93.61710TH DLLLEQXP X 80.58 84.297 108.896 98.413 82.8349TH DLLLEQXP X 70.768 74.139 96.294 86.888 72.2968TH DLLLEQXP X 61.148 64.157 83.813 75.495 62.0397TH DLLLEQXP X 51.811 54.439 71.552 64.327 52.1626TH DLLLEQXP X 42.845 45.08 59.634 53.499 42.7645TH DLLLEQXP X 34.377 36.2 48.227 43.16 33.9744TH DLLLEQXP X 26.571 27.959 37.536 33.492 25.9463RD DLLLEQXP X 19.376 20.363 27.551 24.501 18.6662ND DLLLEQXP X 12.981 13.603 18.526 16.413 12.3081ST DLLLEQXP X 7.564 7.883 10.776 9.503 7.038
PLINTH DLLLEQXP X 3.951 3.12 4.115 3.583 2.62Base DLLLEQXP X 0 0 0 0 0
A plot for Storey Displacement of Structures in Soft Soil in X - Direction with load combination (DL+LL+EQXP) has been shown here
Graph 1: Storey Displacement of Structures in Soft Soil in X - Direction
Table 3: Storey Displacement of Structures in Medium Soil in X - Direction with load combination (DL+LL+EQXP)
Structure -1 Structure -2 Structure -3 Structure -4 Structure -5Story Load
Case/ComboDirection Storey
MaximumDisplacements
StoreyMaximum
Displacements
StoreyMaximum
Displacements
StoreyMaximum
Displacements
StoreyMaximum
Displacementsmm mm mm mm mm
30TH DLLLEQXP X 336.596 340.877 405.411 395.964 365.912
050
100150200250300350
Disp
lace
nen
mm
Storey
Storey Displacement X-Dir
Structure -1 Maximum mm Structure -2 Maximum mm Structure -3 Maximum mm
Structure -4 Maximum mm Structure -5 Maximum mm
International Journal of Scientific & Engineering Research, Volume 8, Issue 11, November-2017ISSN 2229-5518 1,052
IJSER © 2017http://www.ijser.org
IJSER

29TH DLLLEQXP X 329.414 333.958 399.246 389.515 356.98128TH DLLLEQXP X 321.685 326.662 392.528 382.567 347.71527TH DLLLEQXP X 313.544 318.93 385.095 374.964 338.08326TH DLLLEQXP X 304.917 310.68 376.833 366.6 328.00925TH DLLLEQXP X 295.757 301.867 367.69 357.419 317.4524TH DLLLEQXP X 286.054 292.468 357.652 347.404 306.38323RD DLLLEQXP X 275.81 282.481 346.731 336.561 294.80322ND DLLLEQXP X 265.041 271.916 334.958 324.916 282.71521ST DLLLEQXP X 253.771 260.796 322.376 312.505 270.13720TH DLLLEQXP X 242.034 249.153 309.037 299.376 257.09719TH DLLLEQXP X 229.869 237.023 294.998 285.582 243.63118TH DLLLEQXP X 217.319 224.451 280.322 271.18 229.78117TH DLLLEQXP X 204.431 211.485 265.071 256.233 215.59716TH DLLLEQXP X 191.258 198.178 249.311 240.804 201.13515TH DLLLEQXP X 177.854 184.587 233.112 224.96 186.45614TH DLLLEQXP X 164.277 170.772 216.541 208.769 171.62813TH DLLLEQXP X 150.59 156.798 199.673 192.305 156.72512TH DLLLEQXP X 136.861 142.734 182.585 175.646 141.82611TH DLLLEQXP X 123.163 128.658 165.364 158.879 127.0210TH DLLLEQXP X 109.565 114.644 148.098 142.096 112.3999TH DLLLEQXP X 96.224 100.829 130.96 125.455 98.1098TH DLLLEQXP X 83.144 87.253 113.985 109.005 84.1997TH DLLLEQXP X 70.449 74.037 97.31 92.879 70.8026TH DLLLEQXP X 58.259 61.309 81.103 77.244 58.0535TH DLLLEQXP X 46.744 49.232 65.589 62.316 46.1274TH DLLLEQXP X 36.13 38.025 51.049 48.357 35.2343RD DLLLEQXP X 26.348 27.693 37.469 35.376 25.3532ND DLLLEQXP X 17.651 18.5 25.196 23.697 16.7211ST DLLLEQXP X 10.286 10.72 14.656 13.72 9.563
PLINTH DLLLEQXP X 4.831 4.244 5.596 5.173 3.528Base DLLLEQXP X 0 0 0 0 0
A plot for Storey Displacement of Structures in Medium Soil in X - Direction with load combination (DL+LL+EQXP) has been shown here
Graph 2: Storey Displacement of Structures in Medium Soil in X - Direction
Table 4: Storey Displacement of Structures in Hard Soil in X - Direction with load combination (DL+LL+EQXP)
Structure -1 Structure -2 Structure -3 Structure -4 Structure -5Story Load
Case/ComboDirection Storey
MaximumDisplacements
StoreyMaximum
Displacements
StoreyMaximum
Displacements
StoreyMaximum
Displacements
StoreyMaximum
Displacementsmm mm mm mm mm
30TH DLLLEQXP X 413.247 418.577 497.82 486.221 448.47129TH DLLLEQXP X 404.43 410.08 490.251 478.302 437.5428TH DLLLEQXP X 394.942 401.121 482.001 469.769 426.227TH DLLLEQXP X 384.95 391.628 472.874 460.434 414.4126TH DLLLEQXP X 374.358 381.497 462.729 450.163 402.07625TH DLLLEQXP X 363.114 370.674 451.502 438.89 389.14724TH DLLLEQXP X 351.202 359.133 439.176 426.592 375.59523RD DLLLEQXP X 338.626 346.87 425.766 413.277 361.41122ND DLLLEQXP X 325.405 333.897 411.309 398.977 346.604
050
100150200250300350400450
Disp
lace
men
tmm
Storey
Storey Displacement X-Dir
Structure -1 Maximum mm Structure -2 Maximum mm Structure -3 Maximum mm
Structure -4 Maximum mm Structure -5 Maximum mm
International Journal of Scientific & Engineering Research, Volume 8, Issue 11, November-2017ISSN 2229-5518 1,053
IJSER © 2017http://www.ijser.org
IJSER

21ST DLLLEQXP X 311.57 320.243 395.859 383.737 331.19620TH DLLLEQXP X 297.161 305.945 379.479 367.616 315.21919TH DLLLEQXP X 282.226 291.05 362.241 350.677 298.71818TH DLLLEQXP X 266.818 275.612 344.218 332.994 281.74617TH DLLLEQXP X 250.996 259.691 325.491 314.639 264.36316TH DLLLEQXP X 234.823 243.351 306.14 295.694 246.63815TH DLLLEQXP X 218.366 226.662 286.247 276.237 228.64614TH DLLLEQXP X 201.697 209.698 265.9 256.356 210.4713TH DLLLEQXP X 184.893 192.539 245.187 236.14 192.20112TH DLLLEQXP X 168.037 175.269 224.204 215.683 173.93611TH DLLLEQXP X 151.219 157.984 203.057 195.094 155.78510TH DLLLEQXP X 134.524 140.776 181.856 174.485 137.8589TH DLLLEQXP X 118.145 123.812 160.812 154.051 120.3378TH DLLLEQXP X 102.085 107.141 139.967 133.851 103.2817TH DLLLEQXP X 86.498 90.913 119.491 114.05 86.8536TH DLLLEQXP X 71.531 75.284 99.59 94.851 71.2195TH DLLLEQXP X 57.393 60.454 80.54 76.52 56.5924TH DLLLEQXP X 44.362 46.692 62.685 59.379 43.2313RD DLLLEQXP X 32.351 34.006 46.01 43.439 31.1112ND DLLLEQXP X 21.673 22.717 30.939 29.099 20.5211ST DLLLEQXP X 12.63 13.164 17.997 16.847 11.738
PLINTH DLLLEQXP X 5.241 5.211 6.872 6.352 4.31Base DLLLEQXP X 0 0 0 0 0
A plot for Storey Displacement of Structures in Hard Soil in X - Direction with load combination (DL+LL+EQXP) has been shown here
Graph 3: Storey Displacement of Structures in Hard Soil in X - Direction
Table 5: Storey Displacement of Structures in Soft Soil in Y – Direction with load combination (DL+LL+EQYP)
Structure -1 Structure -2 Structure -3 Structure -4 Structure -5Story Load
Case/ComboDirection Storey
MaximumDisplacements
StoreyMaximum
Displacements
StoreyMaximum
Displacements
StoreyMaximum
Displacements
StoreyMaximum
Displacementsmm mm mm mm mm
30TH DLLLEQYP Y 298.758 254.404 279.679 265.397 271.20129TH DLLLEQYP Y 294.166 247.374 272.75 258.816 264.30728TH DLLLEQYP Y 289.096 240.153 265.529 251.96 257.06427TH DLLLEQYP Y 283.5 232.729 258.018 244.831 249.53226TH DLLLEQYP Y 277.293 225.058 250.168 237.381 241.68125TH DLLLEQYP Y 270.439 217.118 241.953 229.584 233.49124TH DLLLEQYP Y 262.93 208.896 233.359 221.429 224.95523RD DLLLEQYP Y 254.778 200.389 224.387 212.915 216.07822ND DLLLEQYP Y 246.009 191.602 215.045 204.049 206.86921ST DLLLEQYP Y 236.656 182.547 205.347 194.847 197.34620TH DLLLEQYP Y 226.758 173.243 195.317 185.33 187.53219TH DLLLEQYP Y 216.358 163.711 184.983 175.523 177.45418TH DLLLEQYP Y 205.503 153.982 174.377 165.46 167.14717TH DLLLEQYP Y 194.239 144.088 163.538 155.175 156.64516TH DLLLEQYP Y 182.615 134.065 152.507 144.708 145.98815TH DLLLEQYP Y 170.681 123.956 141.332 134.104 135.222
0
100
200
300
400
500
600
Disp
lace
men
tmm
Storey
Storey Displacement X-Dir
Structure -1 Maximum mm Structure -2 Maximum mm Structure -3 Maximum mm
Structure -4 Maximum mm Structure -5 Maximum mm
International Journal of Scientific & Engineering Research, Volume 8, Issue 11, November-2017ISSN 2229-5518 1,054
IJSER © 2017http://www.ijser.org
IJSER

14TH DLLLEQYP Y 158.489 113.805 130.062 123.409 124.39213TH DLLLEQYP Y 146.092 103.66 118.751 112.677 113.54912TH DLLLEQYP Y 133.548 93.575 107.46 101.963 102.74911TH DLLLEQYP Y 120.921 83.607 96.253 91.33 92.05110TH DLLLEQYP Y 108.27 73.813 85.198 80.84 81.5169TH DLLLEQYP Y 95.744 64.283 74.414 70.608 71.2698TH DLLLEQYP Y 83.342 55.052 63.921 60.651 61.3027TH DLLLEQYP Y 71.167 46.203 53.817 51.063 51.7116TH DLLLEQYP Y 59.342 37.817 44.202 41.94 42.5895TH DLLLEQYP Y 48.031 29.992 35.213 33.411 34.0664TH DLLLEQYP Y 37.459 22.857 27.012 25.627 26.2953RD DLLLEQYP Y 27.565 16.416 19.545 18.541 19.1842ND DLLLEQYP Y 18.609 10.81 12.987 12.32 12.8931ST DLLLEQYP Y 10.901 6.174 7.501 7.115 7.562
PLINTH DLLLEQXP Y 2.443 2.271 2.707 2.572 2.858Base DLLLEQXP Y 0 0 0 0 0
A plot for Storey Displacement of Structures in Soft Soil in Y - Direction with load combination (DL+LL+EQYP) has been shown here
Graph 4: Storey Displacement of Structures in Soft Soil in Y - Direction
Table 6: Storey Displacement of Structures in Medium Soil in Y – Direction with load combination (DL+LL+EQYP)
Structure -1 Structure -2 Structure -3 Structure -4 Structure -5Story Load Case/Combo Direction Storey
MaximumDisplacements
StoreyMaximum
Displacements
StoreyMaximum
Displacements
StoreyMaximum
Displacements
StoreyMaximum
Displacementsmm mm mm mm mm
30TH DLLLEQYP Y 407.017 254.404 380.364 383.274 368.98129TH DLLLEQYP Y 400.75 247.374 370.94 373.766 359.59828TH DLLLEQYP Y 393.829 240.153 361.119 363.862 349.74227TH DLLLEQYP Y 386.194 232.729 350.904 353.563 339.49326TH DLLLEQYP Y 377.726 225.058 340.228 342.801 328.80825TH DLLLEQYP Y 368.377 217.118 329.055 331.538 317.66424TH DLLLEQYP Y 358.137 208.896 317.369 319.759 306.0523RD DLLLEQYP Y 347.024 200.389 305.167 307.462 293.9722ND DLLLEQYP Y 335.071 191.602 292.461 294.657 281.4421ST DLLLEQYP Y 322.324 182.547 279.272 281.366 268.48320TH DLLLEQYP Y 308.835 173.243 265.631 267.62 255.1319TH DLLLEQYP Y 294.664 163.711 251.576 253.458 241.41918TH DLLLEQYP Y 279.874 153.982 237.153 238.924 227.39517TH DLLLEQYP Y 264.527 144.088 222.411 224.071 213.10616TH DLLLEQYP Y 248.692 134.065 207.41 208.956 198.60815TH DLLLEQYP Y 232.436 123.956 192.211 193.642 183.9614TH DLLLEQYP Y 215.828 113.805 176.884 178.199 169.22613TH DLLLEQYP Y 198.943 103.66 161.502 162.701 154.47512TH DLLLEQYP Y 181.858 93.575 146.145 147.229 139.78211TH DLLLEQYP Y 164.66 83.607 130.904 131.874 125.22810TH DLLLEQYP Y 147.429 73.813 115.869 116.727 110.8959TH DLLLEQYP Y 130.371 64.283 101.204 101.952 96.9548TH DLLLEQYP Y 113.481 55.052 86.932 87.574 83.3957TH DLLLEQYP Y 96.901 46.203 73.191 73.73 70.347
050
100150200250300350
Disp
lace
men
tmm
Storey
Storey Displacement Y-Dir
Structure -1 Maximum mm Structure -2 Maximum mm Structure -3 Maximum mm
Structure -4 Maximum mm Structure -5 Maximum mm
International Journal of Scientific & Engineering Research, Volume 8, Issue 11, November-2017ISSN 2229-5518 1,055
IJSER © 2017http://www.ijser.org
IJSER

6TH DLLLEQYP Y 80.798 37.817 60.115 60.557 57.9375TH DLLLEQYP Y 65.395 29.992 47.89 48.241 46.3424TH DLLLEQYP Y 50.999 22.857 36.736 37.002 35.773RD DLLLEQYP Y 37.527 16.416 26.581 26.771 26.0972ND DLLLEQYP Y 25.333 10.81 17.663 17.788 17.5391ST DLLLEQYP Y 14.839 6.174 10.201 10.273 10.287
PLINTH DLLLEQXP Y 3.614 2.271 3.682 3.713 3.888Base DLLLEQXP Y 0 0 0 0 0
A plot for Storey Displacement of Structures in Medium Soil in Y - Direction with load combination (DL+LL+EQYP) has been shown here
Graph 5: Storey Displacement of Structures in Medium Soil in Y - Direction
Table 7: Storey Displacement of Structures in Hard Soil in Y – Direction with load combination (DL+LL+EQYP)
Structure -1 Structure -2 Structure -3 Structure -4 Structure -5Story Load Case/Combo Direction Storey
MaximumDisplacements
StoreyMaximum
Displacements
StoreyMaximum
Displacements
StoreyMaximum
Displacements
StoreyMaximum
Displacementsmm mm mm mm mm
30TH DLLLEQYP Y 500.24 424.855 467.064 470.638 453.1829TH DLLLEQYP Y 492.53 413.114 455.492 458.962 441.65528TH DLLLEQYP Y 484.016 401.055 443.433 446.801 429.54827TH DLLLEQYP Y 474.624 388.657 430.89 434.155 416.95926TH DLLLEQYP Y 464.21 375.847 417.781 420.939 403.83525TH DLLLEQYP Y 452.712 362.587 404.061 407.11 390.14624TH DLLLEQYP Y 440.122 348.857 389.71 392.645 375.88123RD DLLLEQYP Y 426.459 334.65 374.727 377.545 361.04422ND DLLLEQYP Y 411.763 319.976 359.124 361.821 345.65421ST DLLLEQYP Y 396.093 304.854 342.929 345.501 329.7420TH DLLLEQYP Y 379.512 289.315 326.179 328.622 313.33919TH DLLLEQYP Y 362.094 273.398 308.921 311.231 296.49918TH DLLLEQYP Y 343.915 257.15 291.209 293.385 279.27517TH DLLLEQYP Y 325.054 240.627 273.108 275.146 261.72616TH DLLLEQYP Y 305.592 223.889 254.687 256.585 243.91915TH DLLLEQYP Y 285.613 207.007 236.024 237.781 225.92914TH DLLLEQYP Y 265.204 190.054 217.203 218.818 207.83313TH DLLLEQYP Y 244.453 173.113 198.314 199.787 189.71612TH DLLLEQYP Y 223.457 156.27 179.458 180.789 171.67111TH DLLLEQYP Y 202.324 139.623 160.743 161.934 153.79610TH DLLLEQYP Y 181.15 123.267 142.281 143.334 136.1949TH DLLLEQYP Y 160.188 107.352 124.272 125.191 119.0728TH DLLLEQYP Y 139.433 91.937 106.748 107.536 102.427TH DLLLEQYP Y 119.061 77.159 89.874 90.536 86.3956TH DLLLEQYP Y 99.273 63.155 73.818 74.361 71.1535TH DLLLEQYP Y 80.347 50.087 58.806 59.237 56.9134TH DLLLEQYP Y 62.659 38.171 45.109 45.436 43.933RD DLLLEQYP Y 46.106 27.414 32.64 32.874 32.0492ND DLLLEQYP Y 31.123 18.053 21.689 21.843 21.5391ST DLLLEQYP Y 18.23 10.311 12.526 12.615 12.633
PLINTH DLLLEQXP Y 4.39 3.792 4.521 4.56 4.774Base DLLLEQXP Y 0 0 0 0 0
050
100150200250300350400450
Disp
lace
men
tmm
Storey
Storey Displacement Y-Dir
Structure -1 Maximum mm Structure -2 Maximum mm Structure -3 Maximum mm
Structure -4 Maximum mm Structure -5 Maximum mm
International Journal of Scientific & Engineering Research, Volume 8, Issue 11, November-2017ISSN 2229-5518 1,056
IJSER © 2017http://www.ijser.org
IJSER

A plot for Storey Displacement of Structures in Hard Soil in Y - Direction with load combination (DL+LL+EQYP) has been shown here
Graph 6: Storey Displacement of Structures in Hard Soil in Y - Direction
Table 8: Storey Drifts of Structures in Soft Soil in X - Direction with load combination (DL+LL+EQXP)Structure -1 Structure -2 Structure -3 Structure -4 Structure -5
Story Elevation Location X-Dir X-Dir X-Dir X-Dir X-Dirm
30TH 111 Top 0.001515 0.001454 0.001295 0.001275 0.00188929TH 107.5 Top 0.001625 0.001533 0.001411 0.001374 0.00195928TH 104 Top 0.001711 0.001624 0.001562 0.001503 0.00203627TH 100.5 Top 0.001814 0.001733 0.001736 0.001654 0.00212926TH 97 Top 0.001925 0.001852 0.001921 0.001816 0.00223125TH 93.5 Top 0.00204 0.001975 0.002109 0.001981 0.00233724TH 90 Top 0.002153 0.002098 0.002294 0.002145 0.00244523RD 86.5 Top 0.002263 0.002219 0.002473 0.002304 0.00255222ND 83 Top 0.002369 0.002336 0.002643 0.002455 0.00265421ST 79.5 Top 0.002467 0.002446 0.002802 0.002597 0.00275120TH 76 Top 0.002557 0.002548 0.002949 0.002729 0.00284119TH 72.5 Top 0.002638 0.002641 0.003083 0.002849 0.00292118TH 69 Top 0.002708 0.002724 0.003204 0.002957 0.00299117TH 65.5 Top 0.002768 0.002796 0.003311 0.003053 0.00304916TH 62 Top 0.002817 0.002855 0.003403 0.003135 0.00309515TH 58.5 Top 0.002853 0.002902 0.003481 0.003203 0.00312614TH 55 Top 0.002876 0.002936 0.003544 0.003258 0.00314113TH 51.5 Top 0.002885 0.002955 0.00359 0.003296 0.0031412TH 48 Top 0.002879 0.002957 0.003618 0.003318 0.0031211TH 44.5 Top 0.002858 0.002944 0.003627 0.003321 0.00308110TH 41 Top 0.002803 0.002902 0.0036 0.003293 0.0030119TH 37.5 Top 0.002749 0.002852 0.003566 0.003255 0.002938TH 34 Top 0.002668 0.002776 0.003503 0.003191 0.0028227TH 30.5 Top 0.002562 0.002674 0.003405 0.003094 0.0026856TH 27 Top 0.00242 0.002537 0.003259 0.002954 0.0025115TH 23.5 Top 0.00223 0.002354 0.003055 0.002762 0.0022944TH 20 Top 0.002056 0.00217 0.002853 0.002569 0.002083RD 16.5 Top 0.001827 0.001931 0.002578 0.002311 0.0018172ND 13 Top 0.001548 0.001634 0.002214 0.001974 0.0015061ST 9.5 Top 0.00122 0.001277 0.001738 0.001539 0.001151
PLINTH 6 Top 0.00056 0.000581 0.000794 0.000698 0.000513Base 0 Top 0 0 0 0 0
A plot for Storey Drifts of Structures in Soft Soil in X - Direction with load combination (DL+LL+EQXP) has been shown here
0
100
200
300
400
500
600
Disp
lace
men
tmm
Storey
Storey Displacement Y-Dir
Structure -1 Maximum mm Structure -2 Maximum mm Structure -3 Maximum mm
Structure -4 Maximum mm Structure -5 Maximum mm
International Journal of Scientific & Engineering Research, Volume 8, Issue 11, November-2017ISSN 2229-5518 1,057
IJSER © 2017http://www.ijser.org
IJSER

Graph 7: Storey Drifts of Structures in Soft Soil in X - Direction
Table 9: Storey Drifts of Structures in Medium Soil in X - Direction with load combination (DL+LL+EQXP)
Structure -1 Structure -2 Structure -3 Structure -4 Structure -5Story Elevation Location X-Dir X-Dir X-Dir X-Dir X-Dir
m30TH 111 Top 0.002059 0.001977 0.001761 0.001843 0.00255229TH 107.5 Top 0.002208 0.002085 0.00192 0.001985 0.00264728TH 104 Top 0.002326 0.002209 0.002124 0.002172 0.00275227TH 100.5 Top 0.002465 0.002357 0.00236 0.00239 0.00287826TH 97 Top 0.002617 0.002518 0.002612 0.002623 0.00301725TH 93.5 Top 0.002772 0.002685 0.002868 0.002861 0.00316224TH 90 Top 0.002927 0.002853 0.00312 0.003098 0.00330923RD 86.5 Top 0.003077 0.003018 0.003364 0.003327 0.00345422ND 83 Top 0.00322 0.003177 0.003595 0.003546 0.00359421ST 79.5 Top 0.003353 0.003327 0.003811 0.003751 0.00372620TH 76 Top 0.003476 0.003466 0.004011 0.003941 0.00384819TH 72.5 Top 0.003586 0.003592 0.004193 0.004115 0.00395718TH 69 Top 0.003682 0.003705 0.004357 0.004271 0.00405317TH 65.5 Top 0.003764 0.003802 0.004503 0.004408 0.00413216TH 62 Top 0.00383 0.003883 0.004628 0.004527 0.00419415TH 58.5 Top 0.003879 0.003947 0.004734 0.004626 0.00423714TH 55 Top 0.003911 0.003993 0.004819 0.004704 0.00425813TH 51.5 Top 0.003923 0.004018 0.004882 0.00476 0.00425712TH 48 Top 0.003914 0.004022 0.00492 0.004791 0.0042311TH 44.5 Top 0.003885 0.004004 0.004933 0.004795 0.00417710TH 41 Top 0.003812 0.003947 0.004897 0.004755 0.0040839TH 37.5 Top 0.003737 0.003879 0.00485 0.0047 0.0039748TH 34 Top 0.003627 0.003776 0.004764 0.004607 0.0038287TH 30.5 Top 0.003483 0.003637 0.004631 0.004467 0.0036436TH 27 Top 0.00329 0.003451 0.004433 0.004265 0.0034075TH 23.5 Top 0.003032 0.003202 0.004154 0.003988 0.0031124TH 20 Top 0.002795 0.002952 0.00388 0.003709 0.0028233RD 16.5 Top 0.002485 0.002627 0.003507 0.003337 0.0024662ND 13 Top 0.002104 0.002223 0.003011 0.002851 0.0020451ST 9.5 Top 0.001656 0.001733 0.00236 0.002218 0.001561
PLINTH 6 Top 0.00076 0.000787 0.001079 0.001006 0.000695Base 0 Top 0 0 0 0 0
A plot for Storey Drifts of Structures in Medium Soil in X - Direction with load combination (DL+LL+EQXP) has been shown here
0
0.0010.002
0.0030.004
Top Top Top Top Top Top Top Top Top Top Top Top Top Top Top Top Top Top Top Top Top Top Top Top Top Top Top Top Top Top Top Top
m 111107.5104100.5 97 93.5 90 86.5 83 79.5 76 72.5 69 65.5 62 58.5 55 51.5 48 44.5 41 37.5 34 30.5 27 23.5 20 16.5 13 9.5 6 0
30TH29TH28TH27TH26TH25TH24TH23RD22ND21ST20TH19TH18TH17TH16TH15TH14TH13TH12TH11TH10TH9TH 8TH 7TH 6TH 5TH 4TH 3RD 2ND 1STPLINTHBase
Drifts X-Dir
Structure -1 X-Dir Structure -2 X-Dir Structure -3 X-Dir Structure -4 X-Dir Structure -5 X-Dir
00.0010.0020.0030.0040.0050.006
Top Top Top Top Top Top Top Top Top Top Top Top Top Top Top Top Top Top Top Top Top Top Top Top Top Top Top Top Top Top Top Top
m 111 107.5 104 100.5 97 93.5 90 86.5 83 79.5 76 72.5 69 65.5 62 58.5 55 51.5 48 44.5 41 37.5 34 30.5 27 23.5 20 16.5 13 9.5 6 0
30TH29TH28TH27TH26TH25TH24TH23RD22ND21ST20TH19TH18TH17TH16TH15TH14TH13TH12TH11TH10TH 9TH 8TH 7TH 6TH 5TH 4TH 3RD 2ND 1STPLINTHBase
Drift
s
Storey
Drifts X-Dir
Structure -1 X-Dir Structure -2 X-Dir Structure -3 X-Dir Structure -4 X-Dir Structure -5 X-Dir
International Journal of Scientific & Engineering Research, Volume 8, Issue 11, November-2017ISSN 2229-5518 1,058
IJSER © 2017http://www.ijser.org
IJSER

Graph 8: Storey Drifts of Structures in Medium Soil in X - Direction
Table 10: Storey Drifts of Structures in Hard Soil in X - Direction with load combination (DL+LL+EQXP)
Structure -1 Structure -2 Structure -3 Structure -4 Structure -5Story Elevation Location X-Dir X-Dir X-Dir X-Dir X-Dir
m30TH 111 Top 0.002527 0.002428 0.002163 0.002263 0.00312329TH 107.5 Top 0.002711 0.00256 0.002357 0.002438 0.0032428TH 104 Top 0.002855 0.002713 0.002608 0.002667 0.00336927TH 100.5 Top 0.003026 0.002894 0.002899 0.002935 0.00352426TH 97 Top 0.003213 0.003092 0.003208 0.003221 0.00369425TH 93.5 Top 0.003403 0.003297 0.003522 0.003514 0.00387224TH 90 Top 0.003593 0.003504 0.003832 0.003804 0.00405223RD 86.5 Top 0.003777 0.003706 0.004131 0.004086 0.00423122ND 83 Top 0.003953 0.003901 0.004414 0.004354 0.00440221ST 79.5 Top 0.004117 0.004085 0.00468 0.004606 0.00456520TH 76 Top 0.004267 0.004256 0.004925 0.00484 0.00471519TH 72.5 Top 0.004402 0.004411 0.005149 0.005053 0.00484918TH 69 Top 0.004521 0.004549 0.005351 0.005244 0.00496717TH 65.5 Top 0.004621 0.004669 0.005529 0.005413 0.00506416TH 62 Top 0.004702 0.004768 0.005684 0.005559 0.00514115TH 58.5 Top 0.004762 0.004847 0.005814 0.00568 0.00519314TH 55 Top 0.004801 0.004903 0.005918 0.005776 0.0052213TH 51.5 Top 0.004816 0.004934 0.005995 0.005845 0.00521912TH 48 Top 0.004805 0.004939 0.006042 0.005883 0.00518611TH 44.5 Top 0.00477 0.004917 0.006057 0.005888 0.00512210TH 41 Top 0.00468 0.004847 0.006013 0.005838 0.0050069TH 37.5 Top 0.004588 0.004763 0.005956 0.005771 0.0048738TH 34 Top 0.004454 0.004637 0.00585 0.005657 0.0046947TH 30.5 Top 0.004276 0.004466 0.005686 0.005485 0.0044676TH 27 Top 0.004039 0.004237 0.005443 0.005237 0.0041795TH 23.5 Top 0.003723 0.003932 0.005101 0.004897 0.0038174TH 20 Top 0.003432 0.003625 0.004764 0.004554 0.0034633RD 16.5 Top 0.003051 0.003225 0.004306 0.004097 0.0030262ND 13 Top 0.002584 0.002729 0.003698 0.0035 0.0025091ST 9.5 Top 0.002031 0.002126 0.002896 0.002721 0.001913
PLINTH 6 Top 0.000932 0.000967 0.001324 0.001235 0.000852Base 0 Top 0 0 0 0 0
A plot for Storey Drifts of Structures in Hard Soil in X - Direction with load combination (DL+LL+EQXP) has been shown here
Graph 9: Storey Drifts of Structures in Hard Soil in X - Direction
Table11: Storey Drifts of Structures in Soft Soil in Y - Direction with load combination (DL+LL+EQYP)Structure -1 Structure -2 Structure -3 Structure -4 Structure -5
Story Elevation Location Y-Dir Y-Dir Y-Dir Y-Dir Y-Dirm
30TH 111 Top 0.001312 0.002009 0.00198 0.00188 0.0019729TH 107.5 Top 0.001449 0.002063 0.002063 0.001959 0.00206928TH 104 Top 0.001599 0.002121 0.002146 0.002037 0.00215227TH 100.5 Top 0.001773 0.002192 0.002243 0.002129 0.00224326TH 97 Top 0.001958 0.002269 0.002347 0.002228 0.0023425TH 93.5 Top 0.002145 0.002349 0.002455 0.00233 0.00243924TH 90 Top 0.002329 0.002431 0.002563 0.002433 0.002536
00.0010.0020.0030.0040.0050.0060.007
Top Top Top Top Top Top Top Top Top Top Top Top Top Top Top Top Top Top Top Top Top Top Top Top Top Top Top Top Top Top Top Top
111 107.5 104 100.5 97 93.5 90 86.5 83 79.5 76 72.5 69 65.5 62 58.5 55 51.5 48 44.5 41 37.5 34 30.5 27 23.5 20 16.5 13 9.5 6 0
30TH29TH28TH27TH26TH25TH24TH23RD22ND21ST20TH19TH18TH17TH16TH15TH14TH13TH12TH11TH10TH 9TH 8TH 7TH 6TH 5TH 4TH 3RD 2ND 1STPLINTHBase
Drifts X-Dir
Structure -1 X-Dir Structure -2 X-Dir Structure -3 X-Dir Structure -4 X-Dir Structure -5 X-Dir
International Journal of Scientific & Engineering Research, Volume 8, Issue 11, November-2017ISSN 2229-5518 1,059
IJSER © 2017http://www.ijser.org
IJSER

23RD 86.5 Top 0.002505 0.002511 0.002669 0.002533 0.00263122ND 83 Top 0.002672 0.002587 0.002771 0.002629 0.00272121ST 79.5 Top 0.002828 0.002659 0.002866 0.002719 0.00280420TH 76 Top 0.002971 0.002723 0.002953 0.002802 0.00287919TH 72.5 Top 0.003102 0.00278 0.00303 0.002875 0.00294518TH 69 Top 0.003218 0.002827 0.003097 0.002939 0.00300117TH 65.5 Top 0.003321 0.002864 0.003152 0.00299 0.00304516TH 62 Top 0.00341 0.002888 0.003193 0.00303 0.00307615TH 58.5 Top 0.003483 0.0029 0.00322 0.003055 0.00309414TH 55 Top 0.003542 0.002898 0.003232 0.003066 0.00309813TH 51.5 Top 0.003584 0.002881 0.003226 0.003061 0.00308612TH 48 Top 0.003608 0.002848 0.003202 0.003038 0.00305711TH 44.5 Top 0.003615 0.002798 0.003159 0.002997 0.0030110TH 41 Top 0.003579 0.002723 0.003081 0.002924 0.0029289TH 37.5 Top 0.003544 0.002637 0.002998 0.002845 0.0028488TH 34 Top 0.003478 0.002528 0.002887 0.002739 0.002747TH 30.5 Top 0.003379 0.002396 0.002747 0.002606 0.0026066TH 27 Top 0.003232 0.002236 0.002568 0.002437 0.0024355TH 23.5 Top 0.003021 0.002039 0.002343 0.002224 0.002224TH 20 Top 0.002827 0.00184 0.002133 0.002024 0.0020323RD 16.5 Top 0.002559 0.001602 0.001874 0.001778 0.0017972ND 13 Top 0.002202 0.001325 0.001568 0.001487 0.0015231ST 9.5 Top 0.001748 0.001011 0.001217 0.001155 0.001213
PLINTH 6 Top 0.00081 0.00045 0.000551 0.000523 0.000564Base 0 Top 0 0 0 0 0
A plot for Storey Drifts of Structures in Soft Soil in Y - Direction with load combination (DL+LL+EQXP) has been shown here
Graph 10: Storey Drifts of Structures in Soft Soil in Y - Direction
Table 12: Storey Drifts of Structures in Medium Soil in Y - Direction with load combination (DL+LL+EQYP)
Structure -1 Structure -2 Structure -3 Structure -4 Structure -5Story Elevation Location Y-Dir Y-Dir Y-Dir Y-Dir Y-Dir
m30TH 111 Top 0.001791 0.002732 0.002693 0.002717 0.00268129TH 107.5 Top 0.001977 0.002806 0.002806 0.00283 0.00281628TH 104 Top 0.002182 0.002885 0.002918 0.002942 0.00292827TH 100.5 Top 0.002419 0.002981 0.00305 0.003075 0.00305326TH 97 Top 0.002671 0.003085 0.003192 0.003218 0.00318425TH 93.5 Top 0.002926 0.003195 0.003339 0.003365 0.00331824TH 90 Top 0.003175 0.003306 0.003486 0.003514 0.00345123RD 86.5 Top 0.003415 0.003414 0.00363 0.003659 0.0035822ND 83 Top 0.003642 0.003518 0.003768 0.003797 0.00370221ST 79.5 Top 0.003854 0.003616 0.003897 0.003927 0.00381520TH 76 Top 0.004049 0.003704 0.004016 0.004046 0.00391719TH 72.5 Top 0.004226 0.003781 0.004121 0.004153 0.00400718TH 69 Top 0.004385 0.003845 0.004212 0.004244 0.00408217TH 65.5 Top 0.004524 0.003894 0.004286 0.004319 0.00414216TH 62 Top 0.004645 0.003928 0.004342 0.004375 0.00418515TH 58.5 Top 0.004745 0.003945 0.004379 0.004412 0.0042114TH 55 Top 0.004824 0.003942 0.004395 0.004428 0.00421513TH 51.5 Top 0.004882 0.003919 0.004387 0.00442 0.00419812TH 48 Top 0.004914 0.003873 0.004355 0.004387 0.00415811TH 44.5 Top 0.004923 0.003806 0.004296 0.004328 0.00409510TH 41 Top 0.004874 0.003703 0.00419 0.004222 0.003983
00.0010.0020.0030.004
Top Top Top Top Top Top Top Top Top Top Top Top Top Top Top Top Top Top Top Top Top Top Top Top Top Top Top Top Top Top Top Top
111 107.5 104 100.5 97 93.5 90 86.5 83 79.5 76 72.5 69 65.5 62 58.5 55 51.5 48 44.5 41 37.5 34 30.5 27 23.5 20 16.5 13 9.5 6 0
30TH29TH28TH27TH26TH25TH24TH23RD22ND21ST20TH19TH18TH17TH16TH15TH14TH13TH12TH11TH10TH 9TH 8TH 7TH 6TH 5TH 4TH 3RD 2ND 1STPLINTHBase
Drift
s
Storey
Storey Drifts Y-Dir
Structure -1 Y-Dir Structure -2 Y-Dir Structure -3 Y-Dir Structure -4 Y-Dir Structure -5 Y-Dir
International Journal of Scientific & Engineering Research, Volume 8, Issue 11, November-2017ISSN 2229-5518 1,060
IJSER © 2017http://www.ijser.org
IJSER

9TH 37.5 Top 0.004826 0.003587 0.004077 0.004108 0.0038748TH 34 Top 0.004737 0.003438 0.003926 0.003955 0.0037287TH 30.5 Top 0.004601 0.003259 0.003736 0.003764 0.0035466TH 27 Top 0.004401 0.00304 0.003493 0.003519 0.0033135TH 23.5 Top 0.004113 0.002773 0.003187 0.003211 0.0030214TH 20 Top 0.003849 0.002503 0.002901 0.002923 0.0027643RD 16.5 Top 0.003484 0.002178 0.002548 0.002567 0.0024452ND 13 Top 0.002998 0.001801 0.002132 0.002147 0.0020721ST 9.5 Top 0.002376 0.001372 0.001652 0.001663 0.001647
PLINTH 6 Top 0.001102 0.00061 0.000749 0.000754 0.000766Base 0 Top 0 0 0 0 0
A plot for Storey Drifts of Structures in Medium Soil in Y - Direction with load combination (DL+LL+EQYP) has been shown here
Graph 11: Storey Drifts of Structures in Medium Soil in Y - Direction
Table 13: Storey Drifts of Structures in Hard Soil in Y - Direction with load combination (DL+LL+EQYP)
Structure -1 Structure -2 Structure -3 Structure -4 Structure -5Story Elevation Location Y-Dir Y-Dir Y-Dir Y-Dir Y-Dir
m30TH 111 Top 0.002203 0.003354 0.003306 0.003336 0.00329329TH 107.5 Top 0.002433 0.003446 0.003446 0.003475 0.00345928TH 104 Top 0.002683 0.003542 0.003584 0.003613 0.00359727TH 100.5 Top 0.002976 0.00366 0.003746 0.003776 0.0037526TH 97 Top 0.003285 0.003789 0.00392 0.003951 0.00391125TH 93.5 Top 0.003597 0.003923 0.0041 0.004133 0.00407624TH 90 Top 0.003904 0.004059 0.004281 0.004314 0.00423923RD 86.5 Top 0.004199 0.004193 0.004458 0.004492 0.00439722ND 83 Top 0.004477 0.00432 0.004627 0.004663 0.00454721ST 79.5 Top 0.004737 0.00444 0.004786 0.004823 0.00468620TH 76 Top 0.004977 0.004548 0.004931 0.004969 0.00481119TH 72.5 Top 0.005194 0.004642 0.00506 0.005099 0.00492118TH 69 Top 0.005389 0.004721 0.005172 0.005211 0.00501417TH 65.5 Top 0.005561 0.004782 0.005263 0.005303 0.00508816TH 62 Top 0.005708 0.004824 0.005332 0.005373 0.0051415TH 58.5 Top 0.005831 0.004844 0.005378 0.005418 0.0051714TH 55 Top 0.005929 0.00484 0.005397 0.005437 0.00517613TH 51.5 Top 0.005999 0.004812 0.005388 0.005428 0.00515612TH 48 Top 0.006038 0.004756 0.005347 0.005387 0.00510711TH 44.5 Top 0.00605 0.004673 0.005275 0.005314 0.00502910TH 41 Top 0.005989 0.004547 0.005145 0.005184 0.0048929TH 37.5 Top 0.00593 0.004404 0.005007 0.005044 0.0047588TH 34 Top 0.005821 0.004222 0.004821 0.004857 0.0045787TH 30.5 Top 0.005654 0.004001 0.004587 0.004621 0.0043556TH 27 Top 0.005407 0.003733 0.004289 0.004321 0.0040695TH 23.5 Top 0.005054 0.003405 0.003913 0.003943 0.003714TH 20 Top 0.004729 0.003073 0.003563 0.003589 0.0033943RD 16.5 Top 0.004281 0.002675 0.003129 0.003152 0.0030032ND 13 Top 0.003684 0.002212 0.002618 0.002637 0.0025451ST 9.5 Top 0.002917 0.001683 0.002026 0.00204 0.00202
PLINTH 6 Top 0.001354 0.000749 0.00092 0.000926 0.00094
00.0010.0020.0030.0040.0050.006
Top Top Top Top Top Top Top Top Top Top Top Top Top Top Top Top Top Top Top Top Top Top Top Top Top Top Top Top Top Top Top Top
111107.5104100.5 97 93.5 90 86.5 83 79.5 76 72.5 69 65.5 62 58.5 55 51.5 48 44.5 41 37.5 34 30.5 27 23.5 20 16.5 13 9.5 6 0
30TH29TH28TH27TH26TH25TH24TH23RD22ND21ST20TH19TH18TH17TH16TH15TH14TH13TH12TH11TH10TH9TH 8TH 7TH 6TH 5TH 4TH 3RD 2ND 1STPLINTHBase
Drift
s
Storey
Storey Drifts Y-Dir
Structure -1 Y-Dir Structure -2 Y-Dir Structure -3 Y-Dir Structure -4 Y-Dir Structure -5 Y-Dir
International Journal of Scientific & Engineering Research, Volume 8, Issue 11, November-2017ISSN 2229-5518 1,061
IJSER © 2017http://www.ijser.org
IJSER

Base 0 Top 0 0 0 0 0
A plot for Storey Drifts of Structures in Hard Soil in Y - Direction with load combination (DL+LL+EQYP) has been shown here
Graph 12: Storey Drifts of Structures in Hard Soil in Y - Direction
Table 14: Storey Moment of Structures in Soft Soil in X - Direction with load combination 1.2(DL+LL+EQXP)
Structure -1 Structure -2 Structure -3 Structure -4 Structure -5Story Elevation Location X-Dir X-Dir X-Dir X-Dir X-Dir
m kN-m kN-m kN-m kN-m kN-m30TH 111 Top 465614.6719 461302.62 461302.62 461302.62 465839.182529TH 107.5 Top 995789.2594 998590.3275 989364.765 993977.5463 998857.233728TH 104 Top 1525964 1535878 1517427 1526652 153187527TH 100.5 Top 2056138 2073166 2045489 2059327 206489326TH 97 Top 2586313 2610453 2573551 2592002 259791125TH 93.5 Top 3116488 3147741 3101613 3124677 313092924TH 90 Top 3646662 3685029 3629675 3657352 366394723RD 86.5 Top 4176837 4222317 4157738 4190027 419696622ND 83 Top 4707011 4759604 4685800 4722702 472998421ST 79.5 Top 5237186 5296892 5213862 5255377 526300220TH 76 Top 5767361 5834180 5741924 5788052 579602019TH 72.5 Top 6297535 6371467 6269986 6320727 632903818TH 69 Top 6827710 6908755 6798048 6853402 686205617TH 65.5 Top 7357884 7446043 7326111 7386077 739507416TH 62 Top 7888059 7983331 7854173 7918752 792809215TH 58.5 Top 8418233 8520618 8382235 8451427 846111014TH 55 Top 8948408 9057906 8910297 8984101 899412813TH 51.5 Top 9478583 9595194 9438359 9516776 952714612TH 48 Top 10008757 10132481 9966421 10049451 1006016411TH 44.5 Top 10538932 10669769 10494483 10582126 1059318210TH 41 Top 11068570 11206520 11022009 11114264 111256639TH 37.5 Top 11609427 11754491 11560754 11657622 116693658TH 34 Top 12150285 12302461 12099499 12200980 122130667TH 30.5 Top 12691142 12850432 12638244 12744338 127567676TH 27 Top 13232000 13398403 13176989 13287696 133004685TH 23.5 Top 13771918 13945434 13714795 13830115 138432294TH 20 Top 14339886 14520515 14280650 14400583 144140413RD 16.5 Top 14907854 15095596 14846506 14971051 149848522ND 13 Top 15475821 15670677 15412361 15541519 155556631ST 9.5 Top 16043789 16245758 15978216 16111987 16126474
PLINTH 6 Top 16264437 16479932 16203165 16341549 16356379Base 0 Top 16445051 16677511 16384929 16531220 16538861
A plot for Storey Moment of Structures in Soft Soil in X - Direction with load combination 1.2(DL+LL+EXP) has been shown here
00.0010.0020.0030.0040.0050.0060.007
Top Top Top Top Top Top Top Top Top Top Top Top Top Top Top Top Top Top Top Top Top Top Top Top Top Top Top Top Top Top Top Top
111107.5 104100.5 97 93.5 90 86.5 83 79.5 76 72.5 69 65.5 62 58.5 55 51.5 48 44.5 41 37.5 34 30.5 27 23.5 20 16.5 13 9.5 6 0
30TH29TH28TH27TH26TH25TH24TH23RD22ND21ST20TH19TH18TH17TH16TH15TH14TH13TH12TH11TH10TH 9TH 8TH 7TH 6TH 5TH 4TH 3RD 2ND 1STPLINTHBase
Drift
s
Storey
Storey Drifts Y-Dir
Structure -1 Y-Dir Structure -2 Y-Dir Structure -3 Y-Dir Structure -4 Y-Dir Structure -5 Y-Dir
International Journal of Scientific & Engineering Research, Volume 8, Issue 11, November-2017ISSN 2229-5518 1,062
IJSER © 2017http://www.ijser.org
IJSER

Graph 13: Storey Moment of Structures in Soft Soil in X – Direction
Table 15: Storey Moment of Structures in Medium Soil in X - Direction with load combination 1.2(DL+LL+EQXP)
Structure -1 Structure -2 Structure -3 Structure -4 Structure -5Story Elevation Location X-Dir X-Dir X-Dir X-Dir X-Dir
m kN-m kN-m kN-m kN-m kN-m30TH 111 Top 465614.6719 461302.62 461302.62 461302.62 465839.182529TH 107.5 Top 995789.2594 998590.3275 989364.765 993977.5463 998857.233728TH 104 Top 1525964 1535878 1517427 1526652 153187527TH 100.5 Top 2056138 2073166 2045489 2059327 206489326TH 97 Top 2586313 2610453 2573551 2592002 259791125TH 93.5 Top 3116488 3147741 3101613 3124677 313092924TH 90 Top 3646662 3685029 3629675 3657352 366394723RD 86.5 Top 4176837 4222317 4157738 4190027 419696622ND 83 Top 4707011 4759604 4685800 4722702 472998421ST 79.5 Top 5237186 5296892 5213862 5255377 526300220TH 76 Top 5767361 5834180 5741924 5788052 579602019TH 72.5 Top 6297535 6371467 6269986 6320727 632903818TH 69 Top 6827710 6908755 6798048 6853402 686205617TH 65.5 Top 7357884 7446043 7326111 7386077 739507416TH 62 Top 7888059 7983331 7854173 7918752 792809215TH 58.5 Top 8418233 8520618 8382235 8451427 846111014TH 55 Top 8948408 9057906 8910297 8984101 899412813TH 51.5 Top 9478583 9595194 9438359 9516776 952714612TH 48 Top 10008757 10132481 9966421 10049451 1006016411TH 44.5 Top 10538932 10669769 10494483 10582126 1059318210TH 41 Top 11068570 11206520 11022009 11114264 111256639TH 37.5 Top 11609427 11754491 11560754 11657622 116693658TH 34 Top 12150285 12302461 12099499 12200980 122130667TH 30.5 Top 12691142 12850432 12638244 12744338 127567676TH 27 Top 13232000 13398403 13176989 13287696 133004685TH 23.5 Top 13771918 13945434 13714795 13830115 138432294TH 20 Top 14339886 14520515 14280650 14400583 144140413RD 16.5 Top 14907854 15095596 14846506 14971051 149848522ND 13 Top 15475821 15670677 15412361 15541519 155556631ST 9.5 Top 16043789 16245758 15978216 16111987 16126474
PLINTH 6 Top 16264437 16479932 16203165 16341549 16356379Base 0 Top 16445051 16677511 16384929 16531220 16538861
A plot for Storey Moment of Structures in Medium Soil in X - Direction with load combination 1.2(DL+LL+EXP) has been shown here
02000000400000060000008000000
1000000012000000140000001600000018000000
Top Top Top Top Top Top Top Top Top Top Top Top Top Top Top Top Top Top Top Top Top Top Top Top Top Top Top Top Top Top Top Top
111107.5104100.5 97 93.5 90 86.5 83 79.5 76 72.5 69 65.5 62 58.5 55 51.5 48 44.5 41 37.5 34 30.5 27 23.5 20 16.5 13 9.5 6 0
30TH29TH28TH27TH26TH25TH24TH23RD22ND21ST20TH19TH18TH17TH16TH15TH14TH13TH12TH11TH10TH9TH 8TH 7TH 6TH 5TH 4TH 3RD 2ND 1STPLINTHBase
Mom
entk
n-m
Storey
Storey Moment X-Dir
Structure -1 X-Dir kN-m Structure -2 X-Dir kN-m Structure -3 X-Dir kN-m Structure -4 X-Dir kN-m Structure -5 X-Dir kN-m
International Journal of Scientific & Engineering Research, Volume 8, Issue 11, November-2017ISSN 2229-5518 1,063
IJSER © 2017http://www.ijser.org
IJSER

Graph 14: Storey Moment of Structures in Medium Soil in X - Direction
Table 16: Storey Moment of Structures in Hard Soil in X - Direction with load combination 1.2(DL+LL+EQXP)
Structure -1 Structure -2 Structure -3 Structure -4 Structure -5Story Elevation Location X-Dir X-Dir X-Dir X-Dir X-Dir
m kN-m kN-m kN-m kN-m kN-m30TH 111 Top 465614.6719 461302.62 461302.62 461302.62 465839.182529TH 107.5 Top 995789.2594 998590.3275 989364.765 993977.5463 998857.233728TH 104 Top 1525964 1535878 1517427 1526652 153187527TH 100.5 Top 2056138 2073166 2045489 2059327 206489326TH 97 Top 2586313 2610453 2573551 2592002 259791125TH 93.5 Top 3116488 3147741 3101613 3124677 313092924TH 90 Top 3646662 3685029 3629675 3657352 366394723RD 86.5 Top 4176837 4222317 4157738 4190027 419696622ND 83 Top 4707011 4759604 4685800 4722702 472998421ST 79.5 Top 5237186 5296892 5213862 5255377 526300220TH 76 Top 5767361 5834180 5741924 5788052 579602019TH 72.5 Top 6297535 6371467 6269986 6320727 632903818TH 69 Top 6827710 6908755 6798048 6853402 686205617TH 65.5 Top 7357884 7446043 7326111 7386077 739507416TH 62 Top 7888059 7983331 7854173 7918752 792809215TH 58.5 Top 8418233 8520618 8382235 8451427 846111014TH 55 Top 8948408 9057906 8910297 8984101 899412813TH 51.5 Top 9478583 9595194 9438359 9516776 952714612TH 48 Top 10008757 10132481 9966421 10049451 1006016411TH 44.5 Top 10538932 10669769 10494483 10582126 1059318210TH 41 Top 11068570 11206520 11022009 11114264 111256639TH 37.5 Top 11609427 11754491 11560754 11657622 116693658TH 34 Top 12150285 12302461 12099499 12200980 122130667TH 30.5 Top 12691142 12850432 12638244 12744338 127567676TH 27 Top 13232000 13398403 13176989 13287696 133004685TH 23.5 Top 13771918 13945434 13714795 13830115 138432294TH 20 Top 14339886 14520515 14280650 14400583 144140413RD 16.5 Top 14907854 15095596 14846506 14971051 149848522ND 13 Top 15475821 15670677 15412361 15541519 155556631ST 9.5 Top 16043789 16245758 15978216 16111987 16126474
PLINTH 6 Top 16264437 16479932 16203165 16341549 16356379Base 0 Top 16445051 16677511 16384929 16531220 16538861
A plot for Storey Moment of Structures in Hard Soil in X - Direction with load combination 1.2(DL+LL+EXP) has been shown here
02000000400000060000008000000
1000000012000000140000001600000018000000
Top Top Top Top Top Top Top Top Top Top Top Top Top Top Top Top Top Top Top Top Top Top Top Top Top Top Top Top Top Top Top Top
111107.5104100.5 97 93.5 90 86.5 83 79.5 76 72.5 69 65.5 62 58.5 55 51.5 48 44.5 41 37.5 34 30.5 27 23.5 20 16.5 13 9.5 6 0
30TH29TH28TH27TH26TH25TH24TH23RD22ND21ST20TH19TH18TH17TH16TH15TH14TH13TH12TH11TH10TH9TH 8TH 7TH 6TH 5TH 4TH 3RD 2ND 1STPLINTHBase
Mom
entk
n-m
Storey
Storey Moment X-Dir
Structure -1 X-Dir kN-m Structure -2 X-Dir kN-m Structure -3 X-Dir kN-m Structure -4 X-Dir kN-m Structure -5 X-Dir kN-m
International Journal of Scientific & Engineering Research, Volume 8, Issue 11, November-2017ISSN 2229-5518 1,064
IJSER © 2017http://www.ijser.org
IJSER

Graph 15: Storey Moment of Structures in Hard Soil in X - Direction
Table 17: Storey Moment of Structures in Soft Soil in Y - Direction with load combination 1.2(DL+LL+EQYP)
Structure -1 Structure -2 Structure -3 Structure -4 Structure -5Story Elevation Location Y-Dir Y-Dir Y-Dir Y-Dir Y-Dir
m kN-m kN-m kN-m kN-m kN-m30TH 111 Top -504851 -500286 -500286 -500286 -50570229TH 107.5 Top -1080107 -1082978 -1072973 -1077976 -108426028TH 104 Top -1655363 -1665671 -1645660 -1655665 -166281727TH 100.5 Top -2230620 -2248363 -2218347 -2233355 -224137526TH 97 Top -2805876 -2831055 -2791034 -2811045 -281993325TH 93.5 Top -3381133 -3413747 -3363722 -3388734 -339849124TH 90 Top -3956389 -3996440 -3936409 -3966424 -397704923RD 86.5 Top -4531645 -4579132 -4509096 -4544114 -455560622ND 83 Top -5106902 -5161824 -5081783 -5121804 -513416421ST 79.5 Top -5682158 -5744517 -5654470 -5699493 -571272220TH 76 Top -6257414 -6327209 -6227157 -6277183 -629128019TH 72.5 Top -6832671 -6909901 -6799844 -6854873 -686983818TH 69 Top -7407927 -7492594 -7372531 -7432562 -744839517TH 65.5 Top -7983184 -8075286 -7945218 -8010252 -802695316TH 62 Top -8558440 -8657978 -8517906 -8587942 -860551115TH 58.5 Top -9133696 -9240670 -9090593 -9165632 -918406914TH 55 Top -9708953 -9823363 -9663280 -9743321 -976262713TH 51.5 Top -10284209 -10406055 -10235967 -10321011 -1034118412TH 48 Top -10859466 -10988747 -10808654 -10898701 -1091974211TH 44.5 Top -11434722 -11571440 -11381341 -11476390 -1149830010TH 41 Top -12009396 -12153550 -11953446 -12053498 -120762769TH 37.5 Top -12596238 -12747828 -12537719 -12642774 -126664198TH 34 Top -13183081 -13342106 -13121992 -13232049 -132565637TH 30.5 Top -13769923 -13936384 -13706265 -13821325 -138467066TH 27 Top -14356765 -14530662 -14290538 -14410600 -144368505TH 23.5 Top -14942589 -15123922 -14873792 -14998857 -150259754TH 20 Top -15558832 -15747601 -15487466 -15617533 -156455203RD 16.5 Top -16175075 -16371280 -16101140 -16236210 -162650642ND 13 Top -16791318 -16994959 -16714814 -16854887 -168846091ST 9.5 Top -17407562 -17618639 -17328488 -17473563 -17504154
PLINTH 6 Top -17646856 -17872602 -17572447 -17722524 -17753983Base 0 Top -17842733 -18086878 -17769570 -17928224 -17951886
A plot for Storey Moment of Structures in Soft Soil in Y - Direction with load combination 1.2(DL+LL+EXP) has been shown here
02000000400000060000008000000
1000000012000000140000001600000018000000
Top Top Top Top Top Top Top Top Top Top Top Top Top Top Top Top Top Top Top Top Top Top Top Top Top Top Top Top Top Top Top Top
111 107.5 104 100.5 97 93.5 90 86.5 83 79.5 76 72.5 69 65.5 62 58.5 55 51.5 48 44.5 41 37.5 34 30.5 27 23.5 20 16.5 13 9.5 6 0
30TH29TH28TH27TH26TH25TH24TH23RD22ND21ST20TH19TH18TH17TH16TH15TH14TH13TH12TH11TH10TH 9TH 8TH 7TH 6TH 5TH 4TH 3RD 2ND 1STPLINTHBase
Mom
entk
n-m
Storey
Storey Moment X-Dir
Structure -1 X-Dir kN-m Structure -2 X-Dir kN-m Structure -3 X-Dir kN-m Structure -4 X-Dir kN-m Structure -5 X-Dir kN-m
International Journal of Scientific & Engineering Research, Volume 8, Issue 11, November-2017ISSN 2229-5518 1,065
IJSER © 2017http://www.ijser.org
IJSER

Graph 16: Storey Moment of Structures in Soft Soil in Y - Direction
Table 18: Storey Moment of Structures in Medium Soil in Y - Direction with load combination 1.2(DL+LL+EQYP)
Structure -1 Structure -2 Structure -3 Structure -4 Structure -5Story Elevation Location Y-Dir Y-Dir Y-Dir Y-Dir Y-Dir
m kN-m kN-m kN-m kN-m kN-m30TH 111 Top -504851 -500286 -500286 -500286 -50570229TH 107.5 Top -1080107 -1082978 -1072973 -1077976 -108426028TH 104 Top -1655363 -1665671 -1645660 -1655665 -166281727TH 100.5 Top -2230620 -2248363 -2218347 -2233355 -224137526TH 97 Top -2805876 -2831055 -2791034 -2811045 -281993325TH 93.5 Top -3381133 -3413747 -3363722 -3388734 -339849124TH 90 Top -3956389 -3996440 -3936409 -3966424 -397704923RD 86.5 Top -4531645 -4579132 -4509096 -4544114 -455560622ND 83 Top -5106902 -5161824 -5081783 -5121804 -513416421ST 79.5 Top -5682158 -5744517 -5654470 -5699493 -571272220TH 76 Top -6257414 -6327209 -6227157 -6277183 -629128019TH 72.5 Top -6832671 -6909901 -6799844 -6854873 -686983818TH 69 Top -7407927 -7492594 -7372531 -7432562 -744839517TH 65.5 Top -7983184 -8075286 -7945218 -8010252 -802695316TH 62 Top -8558440 -8657978 -8517906 -8587942 -860551115TH 58.5 Top -9133696 -9240670 -9090593 -9165632 -918406914TH 55 Top -9708953 -9823363 -9663280 -9743321 -976262713TH 51.5 Top -10284209 -10406055 -10235967 -10321011 -1034118412TH 48 Top -10859466 -10988747 -10808654 -10898701 -1091974211TH 44.5 Top -11434722 -11571440 -11381341 -11476390 -1149830010TH 41 Top -12009396 -12153550 -11953446 -12053498 -120762769TH 37.5 Top -12596238 -12747828 -12537719 -12642774 -126664198TH 34 Top -13183081 -13342106 -13121992 -13232049 -132565637TH 30.5 Top -13769923 -13936384 -13706265 -13821325 -138467066TH 27 Top -14356765 -14530662 -14290538 -14410600 -144368505TH 23.5 Top -14942589 -15123922 -14873792 -14998857 -150259754TH 20 Top -15558832 -15747601 -15487466 -15617533 -156455203RD 16.5 Top -16175075 -16371280 -16101140 -16236210 -162650642ND 13 Top -16791318 -16994959 -16714814 -16854887 -168846091ST 9.5 Top -17407562 -17618639 -17328488 -17473563 -17504154
PLINTH 6 Top -17646856 -17872602 -17572447 -17722524 -17753983Base 0 Top -17842733 -18086878 -17769570 -17928224 -17951886
.
A plot for Storey Moment of Structures in Medium Soil in Y - Direction with load combination 1.2(DL+LL+EXP) has been shown here
-20000000-18000000-16000000-14000000-12000000-10000000
-8000000-6000000-4000000-2000000
0Top Top Top Top Top Top Top Top Top Top Top Top Top Top Top Top Top Top Top Top Top Top Top Top Top Top Top Top Top Top Top Top
111107.5104100.5 97 93.5 90 86.5 83 79.5 76 72.5 69 65.5 62 58.5 55 51.5 48 44.5 41 37.5 34 30.5 27 23.5 20 16.5 13 9.5 6 0
30TH29TH28TH27TH26TH25TH24TH23RD22ND21ST20TH19TH18TH17TH16TH15TH14TH13TH12TH11TH10TH9TH 8TH 7TH 6TH 5TH 4TH 3RD2ND 1STPLINTHBase
Mom
entk
n-m
Storey
Storey Moment Y-Dir
Structure -1 Y-Dir kN-m Structure -2 Y-Dir kN-m Structure -3 Y-Dir kN-m Structure -4 Y-Dir kN-m Structure -5 Y-Dir kN-m
International Journal of Scientific & Engineering Research, Volume 8, Issue 11, November-2017ISSN 2229-5518 1,066
IJSER © 2017http://www.ijser.org
IJSER

Graph 17: Storey Moment of Structures in Medium Soil in Y - Direction
Table 19: Storey Moment of Structures in Hard Soil in Y - Direction with load combination 1.2(DL+LL+EQYP)
Structure -1 Structure -2 Structure -3 Structure -4 Structure -5Story Elevation Location Y-Dir Y-Dir Y-Dir Y-Dir Y-Dir
m kN-m kN-m kN-m kN-m kN-m30TH 111 Top -504851 -500286 -500286 -500286 -50570229TH 107.5 Top -1080107 -1082978 -1072973 -1077976 -108426028TH 104 Top -1655363 -1665671 -1645660 -1655665 -166281727TH 100.5 Top -2230620 -2248363 -2218347 -2233355 -224137526TH 97 Top -2805876 -2831055 -2791034 -2811045 -281993325TH 93.5 Top -3381133 -3413747 -3363722 -3388734 -339849124TH 90 Top -3956389 -3996440 -3936409 -3966424 -397704923RD 86.5 Top -4531645 -4579132 -4509096 -4544114 -455560622ND 83 Top -5106902 -5161824 -5081783 -5121804 -513416421ST 79.5 Top -5682158 -5744517 -5654470 -5699493 -571272220TH 76 Top -6257414 -6327209 -6227157 -6277183 -629128019TH 72.5 Top -6832671 -6909901 -6799844 -6854873 -686983818TH 69 Top -7407927 -7492594 -7372531 -7432562 -744839517TH 65.5 Top -7983184 -8075286 -7945218 -8010252 -802695316TH 62 Top -8558440 -8657978 -8517906 -8587942 -860551115TH 58.5 Top -9133696 -9240670 -9090593 -9165632 -918406914TH 55 Top -9708953 -9823363 -9663280 -9743321 -976262713TH 51.5 Top -10284209 -10406055 -10235967 -10321011 -1034118412TH 48 Top -10859466 -10988747 -10808654 -10898701 -1091974211TH 44.5 Top -11434722 -11571440 -11381341 -11476390 -1149830010TH 41 Top -12009396 -12153550 -11953446 -12053498 -120762769TH 37.5 Top -12596238 -12747828 -12537719 -12642774 -126664198TH 34 Top -13183081 -13342106 -13121992 -13232049 -132565637TH 30.5 Top -13769923 -13936384 -13706265 -13821325 -138467066TH 27 Top -14356765 -14530662 -14290538 -14410600 -144368505TH 23.5 Top -14942589 -15123922 -14873792 -14998857 -150259754TH 20 Top -15558832 -15747601 -15487466 -15617533 -156455203RD 16.5 Top -16175075 -16371280 -16101140 -16236210 -162650642ND 13 Top -16791318 -16994959 -16714814 -16854887 -168846091ST 9.5 Top -17407562 -17618639 -17328488 -17473563 -17504154
PLINTH 6 Top -17646856 -17872602 -17572447 -17722524 -17753983Base 0 Top -17842733 -18086878 -17769570 -17928224 -17951886
A plot for Storey Moment of Structures in Hard Soil in Y - Direction with load combination 1.2(DL+LL+EYP) has been shown here
-20000000-18000000-16000000-14000000-12000000-10000000
-8000000-6000000-4000000-2000000
0Top Top Top Top Top Top Top Top Top Top Top Top Top Top Top Top Top Top Top Top Top Top Top Top Top Top Top Top Top Top Top Top
111 107.5 104 100.5 97 93.5 90 86.5 83 79.5 76 72.5 69 65.5 62 58.5 55 51.5 48 44.5 41 37.5 34 30.5 27 23.5 20 16.5 13 9.5 6 0
30TH29TH28TH27TH26TH25TH24TH23RD22ND21ST20TH19TH18TH17TH16TH15TH14TH13TH12TH11TH10TH 9TH 8TH 7TH 6TH 5TH 4TH 3RD 2ND 1STPLINTHBase
Mom
entk
n-m
Storey
Storey Moment Y-Dir
Structure -1 Y-Dir kN-m Structure -2 Y-Dir kN-m Structure -3 Y-Dir kN-m Structure -4 Y-Dir kN-m Structure -5 Y-Dir kN-m
International Journal of Scientific & Engineering Research, Volume 8, Issue 11, November-2017ISSN 2229-5518 1,067
IJSER © 2017http://www.ijser.org
IJSER

Graph 18: Storey Moment of Structures in Hard Soil in Y - Direction
Table 20: Storey Shear of Structures in Soft Soil in X - Direction with load combination1.2 (DL+LL+EQXP)
Structure -1 Structure -2 Structure -3 Structure -4 Structure -5Story Elevation Location X-Dir X-Dir X-Dir X-Dir X-Dir
m kN kN kN kN kN30TH 111 Top -870.0895 -945.6987 -935.1713 -881.5928 -944.7656
Bottom -870.0895 -945.6987 -935.1713 -881.5928 -944.765629TH 107.5 Top -1752.5342 -1908.8798 -1879.1815 -1780.1594 -1898.1949
Bottom -1752.5342 -1908.8798 -1879.1815 -1780.1594 -1898.194928TH 104 Top -2578.4528 -2810.3632 -2762.7219 -2621.1672 -2790.551
Bottom -2578.4528 -2810.3632 -2762.7219 -2621.1672 -2790.55127TH 100.5 Top -3349.7161 -3652.1908 -3587.794 -3406.5212 -3623.8553
Bottom -3349.7161 -3652.1908 -3587.794 -3406.5212 -3623.855326TH 97 Top -4068.195 -4436.4046 -4356.399 -4138.1264 -4400.1292
Bottom -4068.195 -4436.4046 -4356.399 -4138.1264 -4400.129225TH 93.5 Top -4735.7604 -5165.0467 -5070.5384 -4817.8879 -5121.394
Bottom -4735.7604 -5165.0467 -5070.5384 -4817.8879 -5121.39424TH 90 Top -5354.283 -5840.1591 -5732.2135 -5447.7107 -5789.6711
Bottom -5354.283 -5840.1591 -5732.2135 -5447.7107 -5789.671123RD 86.5 Top -5925.6337 -6463.7837 -6343.4256 -6029.4997 -6406.9817
Bottom -5925.6337 -6463.7837 -6343.4256 -6029.4997 -6406.981722ND 83 Top -6451.6833 -7037.9626 -6906.1762 -6565.1601 -6975.3472
Bottom -6451.6833 -7037.9626 -6906.1762 -6565.1601 -6975.347221ST 79.5 Top -6934.3028 -7564.7378 -7422.4665 -7056.5968 -7496.7889
Bottom -6934.3028 -7564.7378 -7422.4665 -7056.5968 -7496.788920TH 76 Top -7375.3629 -8046.1513 -7894.298 -7505.7148 -7973.3282
Bottom -7375.3629 -8046.1513 -7894.298 -7505.7148 -7973.328219TH 72.5 Top -7776.7344 -8484.245 -8323.6721 -7914.4193 -8406.9864
Bottom -7776.7344 -8484.245 -8323.6721 -7914.4193 -8406.986418TH 69 Top -8140.2883 -8881.061 -8712.59 -8284.6151 -8799.7848
Bottom -8140.2883 -8881.061 -8712.59 -8284.6151 -8799.784817TH 65.5 Top -8467.8952 -9238.6414 -9063.0531 -8618.2073 -9153.7447
Bottom -8467.8952 -9238.6414 -9063.0531 -8618.2073 -9153.744716TH 62 Top -8761.4262 -9559.0281 -9377.0629 -8917.101 -9470.8875
Bottom -8761.4262 -9559.0281 -9377.0629 -8917.101 -9470.887515TH 58.5 Top -9022.752 -9844.263 -9656.6206 -9183.2011 -9753.2346
Bottom -9022.752 -9844.263 -9656.6206 -9183.2011 -9753.234614TH 55 Top -9253.7435 -10096.3883 -9903.7276 -9418.4127 -10002.8072
Bottom -9253.7435 -10096.3883 -9903.7276 -9418.4127 -10002.807213TH 51.5 Top -9456.2715 -10317.4459 -10120.3854 -9624.6408 -10221.6267
Bottom -9456.2715 -10317.4459 -10120.3854 -9624.6408 -10221.626712TH 48 Top -9632.2068 -10509.4779 -10308.5952 -9803.7903 -10411.7144
Bottom -9632.2068 -10509.4779 -10308.5952 -9803.7903 -10411.714411TH 44.5 Top -9783.4203 -10674.5262 -10470.3584 -9957.7665 -10575.0916
Bottom -9783.4203 -10674.5262 -10470.3584 -9957.7665 -10575.091610TH 41 Top -9913.2648 -10816.1126 -10609.1551 -10089.9567 -10715.2584
Bottom -9913.2648 -10816.1126 -10609.1551 -10089.9567 -10715.2584
-20000000-18000000-16000000-14000000-12000000-10000000
-8000000-6000000-4000000-2000000
0Top Top Top Top Top Top Top Top Top Top Top Top Top Top Top Top Top Top Top Top Top Top Top Top Top Top Top Top Top Top Top Top
111107.5104100.5 97 93.5 90 86.5 83 79.5 76 72.5 69 65.5 62 58.5 55 51.5 48 44.5 41 37.5 34 30.5 27 23.5 20 16.5 13 9.5 6 0
30TH29TH28TH27TH26TH25TH24TH23RD22ND21ST20TH19TH18TH17TH16TH15TH14TH13TH12TH11TH10TH9TH 8TH 7TH 6TH 5TH 4TH 3RD 2ND 1STPLINTHBase
mom
entk
n-m
Storey
Storey Moment Y-Dir
Structure -1 Y-Dir kN-m Structure -2 Y-Dir kN-m Structure -3 Y-Dir kN-m Structure -4 Y-Dir kN-m Structure -5 Y-Dir kN-m
International Journal of Scientific & Engineering Research, Volume 8, Issue 11, November-2017ISSN 2229-5518 1,068
IJSER © 2017http://www.ijser.org
IJSER

9TH 37.5 Top -10023.2579 -10935.9262 -10726.634 -10201.9125 -10833.8835Bottom -10023.2579 -10935.9262 -10726.634 -10201.9125 -10833.8835
8TH 34 Top -10113.6771 -11034.4184 -10823.2069 -10293.9453 -10931.3986Bottom -10113.6771 -11034.4184 -10823.2069 -10293.9453 -10931.3986
7TH 30.5 Top -10186.4387 -11113.6765 -10900.9206 -10368.0053 -11009.8705Bottom -10186.4387 -11113.6765 -10900.9206 -10368.0053 -11009.8705
6TH 27 Top -10243.4591 -11175.7879 -10961.8217 -10426.0433 -11071.3658Bottom -10243.4591 -11175.7879 -10961.8217 -10426.0433 -11071.3658
5TH 23.5 Top -10287.9104 -11224.094 -11009.21 -10471.2659 -11119.2042Bottom -10287.9104 -11224.094 -11009.21 -10471.2659 -11119.2042
4TH 20 Top -10321.0818 -11260.0559 -11044.5064 -10504.9963 -11154.8267Bottom -10321.0818 -11260.0559 -11044.5064 -10504.9963 -11154.8267
3RD 16.5 Top -10343.6591 -11284.5324 -11068.5301 -10527.954 -11179.0722Bottom -10343.6591 -11284.5324 -11068.5301 -10527.954 -11179.0722
2ND 13 Top -10357.674 -11299.7264 -11083.4429 -10542.2051 -11194.1227Bottom -10357.674 -11299.7264 -11083.4429 -10542.2051 -11194.1227
1ST 9.5 Top -10365.1583 -11307.8403 -11091.4066 -10549.8156 -11202.1601Bottom -10365.1583 -11307.8403 -11091.4066 -10549.8156 -11202.1601
PLINTH 6 Top -10366.7741 -11309.5557 -11093.0427 -10551.4929 -11203.8264Bottom -10366.7741 -11309.5557 -11093.0427 -10551.4929 -11203.8264
Base 0 Top 0 0 0 0 0Bottom 0 0 0 0 0
A plot for Storey Shear of Structures in Soft Soil in X - Direction with load combination 1.2(DL+LL+EXP) has been shown here
Graph 19: Storey Shear of Structures in Soft Soil in X - Direction
Table 21: Storey Shear of Structures in Medium Soil in X - Direction with load combination1.2 (DL+LL+EQXP)
Structure -1 Structure -2 Structure -3 Structure -4 Structure -5Story Elevation Location X-Dir X-Dir X-Dir X-Dir X-Dir
m kN kN kN kN kN30TH 111 Top -1183.3217 -1286.1502 -1271.8329 -1278.9934 -1284.8813
Bottom -1183.3217 -1286.1502 -1271.8329 -1278.9934 -1284.881329TH 107.5 Top -2383.4465 -2596.0765 -2555.6868 -2575.8833 -2581.545
Bottom -2383.4465 -2596.0765 -2555.6868 -2575.8833 -2581.54528TH 104 Top -3506.6958 -3822.0939 -3757.3018 -3789.6994 -3795.1493
Bottom -3506.6958 -3822.0939 -3757.3018 -3789.6994 -3795.149327TH 100.5 Top -4555.6139 -4966.9795 -4879.3998 -4923.191 -4928.4432
Bottom -4555.6139 -4966.9795 -4879.3998 -4923.191 -4928.443226TH 97 Top -5532.7452 -6033.5103 -5924.7026 -5979.1077 -5984.1757
Bottom -5532.7452 -6033.5103 -5924.7026 -5979.1077 -5984.175725TH 93.5 Top -6440.6341 -7024.4636 -6895.9322 -6960.199 -6965.0959
Bottom -6440.6341 -7024.4636 -6895.9322 -6960.199 -6965.095924TH 90 Top -7281.8248 -7942.6164 -7795.8103 -7869.2143 -7873.9527
Bottom -7281.8248 -7942.6164 -7795.8103 -7869.2143 -7873.952723RD 86.5 Top -8058.8618 -8790.7459 -8627.0588 -8708.9032 -8713.4951
Bottom -8058.8618 -8790.7459 -8627.0588 -8708.9032 -8713.495122ND 83 Top -8774.2894 -9571.6292 -9392.3996 -9482.0151 -9486.4722
Bottom -8774.2894 -9571.6292 -9392.3996 -9482.0151 -9486.472221ST 79.5 Top -9430.6518 -10288.0434 -10094.5545 -10191.2996 -10195.6329
-12000
-10000
-8000
-6000
-4000
-2000
0
Top
Top
Top
Top
Top
Top
Top
Top
Top
Top
Top
Top
Top
Top
Top
Top
Top
Top
Top
Top
Top
Top
Top
Top
Top
Top
Top
Top
Top
Top
Top
Top
111 107.5 104 100.5 97 93.5 90 86.5 83 79.5 76 72.5 69 65.5 62 58.5 55 51.5 48 44.5 41 37.5 34 30.5 27 23.5 20 16.5 13 9.5 6 0
30TH29TH28TH27TH26TH25TH24TH23RD22ND21ST20TH19TH18TH17TH16TH15TH14TH13TH12TH11TH10TH 9TH 8TH 7TH 6TH 5TH 4TH 3RD 2ND 1STPLINTHBase
Shea
rkn
Storey
Storey Shear X-Dir
Structure -1 X-Dir kN Structure -2 X-Dir kN Structure -3 X-Dir kN Structure -4 X-Dir kN Structure -5 X-Dir kN
International Journal of Scientific & Engineering Research, Volume 8, Issue 11, November-2017ISSN 2229-5518 1,069
IJSER © 2017http://www.ijser.org
IJSER

Bottom -9430.6518 -10288.0434 -10094.5545 -10191.2996 -10195.632920TH 76 Top -10030.4935 -10942.7657 -10736.2453 -10839.5061 -10843.7263
Bottom -10030.4935 -10942.7657 -10736.2453 -10839.5061 -10843.726319TH 72.5 Top -10576.3588 -11538.5732 -11320.194 -11429.3841 -11433.5015
Bottom -10576.3588 -11538.5732 -11320.194 -11429.3841 -11433.501518TH 69 Top -11070.792 -12078.243 -11849.1224 -11963.6831 -11967.7073
Bottom -11070.792 -12078.243 -11849.1224 -11963.6831 -11967.707317TH 65.5 Top -11516.3375 -12564.5523 -12325.7522 -12445.1526 -12449.0928
Bottom -11516.3375 -12564.5523 -12325.7522 -12445.1526 -12449.092816TH 62 Top -11915.5397 -13000.2782 -12752.8055 -12876.5421 -12880.4071
Bottom -11915.5397 -13000.2782 -12752.8055 -12876.5421 -12880.407115TH 58.5 Top -12270.9427 -13388.1977 -13133.004 -13260.6011 -13264.399
Bottom -12270.9427 -13388.1977 -13133.004 -13260.6011 -13264.39914TH 55 Top -12585.0911 -13731.0881 -13469.0696 -13600.079 -13603.8178
Bottom -12585.0911 -13731.0881 -13469.0696 -13600.079 -13603.817813TH 51.5 Top -12860.5292 -14031.7265 -13763.7241 -13897.7254 -13901.4123
Bottom -12860.5292 -14031.7265 -13763.7241 -13897.7254 -13901.412312TH 48 Top -13099.8012 -14292.89 -14019.6894 -14156.2898 -14159.9315
Bottom -13099.8012 -14292.89 -14019.6894 -14156.2898 -14159.931511TH 44.5 Top -13305.4516 -14517.3556 -14239.6874 -14378.5216 -14382.1246
Bottom -13305.4516 -14517.3556 -14239.6874 -14378.5216 -14382.124610TH 41 Top -13482.0401 -14709.9131 -14428.4509 -14569.182 -14572.7514
Bottom -13482.0401 -14709.9131 -14428.4509 -14569.182 -14572.75149TH 37.5 Top -13631.6307 -14872.8597 -14588.2223 -14730.541 -14734.0816
Bottom -13631.6307 -14872.8597 -14588.2223 -14730.541 -14734.08168TH 34 Top -13754.6008 -15006.8091 -14719.5615 -14863.1853 -14866.7022
Bottom -13754.6008 -15006.8091 -14719.5615 -14863.1853 -14866.70227TH 30.5 Top -13853.5566 -15114.6 -14825.252 -14969.926 -14973.4239
Bottom -13853.5566 -15114.6 -14825.252 -14969.926 -14973.42396TH 27 Top -13931.1044 -15199.0716 -14908.0775 -15053.5745 -15057.0574
Bottom -13931.1044 -15199.0716 -14908.0775 -15053.5745 -15057.05745TH 23.5 Top -13991.5582 -15264.7678 -14972.5255 -15118.6467 -15122.1177
Bottom -13991.5582 -15264.7678 -14972.5255 -15118.6467 -15122.11774TH 20 Top -14036.6713 -15313.676 -15020.5288 -15167.1024 -15170.5643
Bottom -14036.6713 -15313.676 -15020.5288 -15167.1024 -15170.56433RD 16.5 Top -14067.3763 -15346.9641 -15053.2009 -15200.0825 -15203.5382
Bottom -14067.3763 -15346.9641 -15053.2009 -15200.0825 -15203.53822ND 13 Top -14086.4366 -15367.6278 -15073.4823 -15220.5551 -15224.0069
Bottom -14086.4366 -15367.6278 -15073.4823 -15220.5551 -15224.00691ST 9.5 Top -14096.6153 -15378.6628 -15084.313 -15231.4879 -15234.9377
Bottom -14096.6153 -15378.6628 -15084.313 -15231.4879 -15234.9377PLINTH 6 Top -14098.8127 -15380.9958 -15086.5381 -15233.767 -15237.204
Bottom -14098.8127 -15380.9958 -15086.5381 -15233.767 -15237.204Base 0 Top 0 0 0 0 0
Bottom 0 0 0 0 0A plot for Storey Shear of Structures in Medium Soil in X - Direction with load combination 1.2(DL+LL+EXP) has been shown here
Graph 20: Storey Shear of Structures in Medium Soil in X - Direction
-18000
-16000
-14000
-12000
-10000
-8000
-6000
-4000
-2000
0
Top
Top
Top
Top
Top
Top
Top
Top
Top
Top
Top
Top
Top
Top
Top
Top
Top
Top
Top
Top
Top
Top
Top
Top
Top
Top
Top
Top
Top
Top
Top
Top
111107.5104100.5 97 93.5 90 86.5 83 79.5 76 72.5 69 65.5 62 58.5 55 51.5 48 44.5 41 37.5 34 30.5 27 23.5 20 16.5 13 9.5 6 0
30TH29TH28TH27TH26TH25TH24TH23RD22ND21ST20TH19TH18TH17TH16TH15TH14TH13TH12TH11TH10TH9TH 8TH 7TH 6TH 5TH 4TH 3RD 2ND 1STPLINTHBase
Shea
rkn
Storey
Storey Shear X-Dir
Structure -1 X-Dir kN Structure -2 X-Dir kN Structure -3 X-Dir kN Structure -4 X-Dir kN Structure -5 X-Dir kN
International Journal of Scientific & Engineering Research, Volume 8, Issue 11, November-2017ISSN 2229-5518 1,070
IJSER © 2017http://www.ijser.org
IJSER

Table 22: Storey Shear of Structures in Hard Soil in X - Direction with load combination1.2 (DL+LL+EQXP)
Structure -1 Structure -2 Structure -3 Structure -4 Structure -5Story Elevation Location X-Dir X-Dir X-Dir X-Dir X-Dir
m kN kN kN kN kN30TH 111 Top -1453.0495 -1579.3168 -1561.736 -1570.5287 -1577.7586
Bottom -1453.0495 -1579.3168 -1561.736 -1570.5287 -1577.758629TH 107.5 Top -2926.7321 -3187.8293 -3138.233 -3163.0332 -3169.9854
Bottom -2926.7321 -3187.8293 -3138.233 -3163.0332 -3169.985428TH 104 Top -4306.0161 -4693.3065 -4613.7456 -4653.5279 -4660.2201
Bottom -4306.0161 -4693.3065 -4613.7456 -4653.5279 -4660.220127TH 100.5 Top -5594.0259 -6099.1586 -5991.6159 -6045.3889 -6051.8384
Bottom -5594.0259 -6099.1586 -5991.6159 -6045.3889 -6051.838426TH 97 Top -6793.8857 -7408.7957 -7275.1863 -7341.9925 -7348.2158
Bottom -6793.8857 -7408.7957 -7275.1863 -7341.9925 -7348.215825TH 93.5 Top -7908.7198 -8625.6281 -8467.7991 -8546.7149 -8552.728
Bottom -7908.7198 -8625.6281 -8467.7991 -8546.7149 -8552.72824TH 90 Top -8941.6526 -9753.0657 -9572.7965 -9662.9322 -9668.7507
Bottom -8941.6526 -9753.0657 -9572.7965 -9662.9322 -9668.750723RD 86.5 Top -9895.8083 -10794.5188 -10593.5207 -10694.0208 -10699.6594
Bottom -9895.8083 -10794.5188 -10593.5207 -10694.0208 -10699.659422ND 83 Top -10774.3112 -11753.3976 -11533.3142 -11643.3568 -11648.8298
Bottom -10774.3112 -11753.3976 -11533.3142 -11643.3568 -11648.829821ST 79.5 Top -11580.2857 -12633.1121 -12395.5191 -12514.3164 -12519.6375
Bottom -11580.2857 -12633.1121 -12395.5191 -12514.3164 -12519.637520TH 76 Top -12316.856 -13437.0726 -13183.4777 -13310.2758 -13315.4581
Bottom -12316.856 -13437.0726 -13183.4777 -13310.2758 -13315.458119TH 72.5 Top -12987.1465 -14168.6892 -13900.5323 -14034.6113 -14039.6672
Bottom -12987.1465 -14168.6892 -13900.5323 -14034.6113 -14039.667218TH 69 Top -13594.2814 -14831.372 -14550.0253 -14690.6991 -14695.6406
Bottom -13594.2814 -14831.372 -14550.0253 -14690.6991 -14695.640617TH 65.5 Top -14141.3851 -15428.5311 -15135.2987 -15281.9153 -15286.7537
Bottom -14141.3851 -15428.5311 -15135.2987 -15281.9153 -15286.753716TH 62 Top -14631.5818 -15963.5768 -15659.695 -15811.6362 -15816.3822
Bottom -14631.5818 -15963.5768 -15659.695 -15811.6362 -15816.382215TH 58.5 Top -15067.9959 -16439.9193 -16126.5564 -16283.2381 -16287.9018
Bottom -15067.9959 -16439.9193 -16126.5564 -16283.2381 -16287.901814TH 55 Top -15453.7516 -16860.9685 -16539.2252 -16700.097 -16704.688
Bottom -15453.7516 -16860.9685 -16539.2252 -16700.097 -16704.68813TH 51.5 Top -15791.9733 -17230.1347 -16901.0436 -17065.5893 -17070.1165
Bottom -15791.9733 -17230.1347 -16901.0436 -17065.5893 -17070.116512TH 48 Top -16085.7853 -17550.8281 -17215.354 -17383.0911 -17387.563
Bottom -16085.7853 -17550.8281 -17215.354 -17383.0911 -17387.56311TH 44.5 Top -16338.3119 -17826.4588 -17485.4985 -17655.9787 -17660.403
Bottom -16338.3119 -17826.4588 -17485.4985 -17655.9787 -17660.40310TH 41 Top -16555.1522 -18062.908 -17717.2889 -17890.0985 -17894.4815
Bottom -16555.1522 -18062.908 -17717.2889 -17890.0985 -17894.48159TH 37.5 Top -16738.8406 -18262.9968 -17913.4788 -18088.2378 -18092.5855
Bottom -16738.8406 -18262.9968 -17913.4788 -18088.2378 -18092.58558TH 34 Top -16889.8407 -18427.4788 -18074.7556 -18251.1172 -18255.4357
Bottom -16889.8407 -18427.4788 -18074.7556 -18251.1172 -18255.43577TH 30.5 Top -17011.3526 -18559.8398 -18204.5374 -18382.1886 -18386.4837
Bottom -17011.3526 -18559.8398 -18204.5374 -18382.1886 -18386.48376TH 27 Top -17106.5767 -18663.5658 -18306.2422 -18484.904 -18489.1808
Bottom -17106.5767 -18663.5658 -18306.2422 -18484.904 -18489.18085TH 23.5 Top -17180.8104 -18744.2369 -18385.3806 -18564.8088 -18569.0709
Bottom -17180.8104 -18744.2369 -18385.3806 -18564.8088 -18569.07094TH 20 Top -17236.2066 -18804.2933 -18444.3258 -18624.3095 -18628.5605
Bottom -17236.2066 -18804.2933 -18444.3258 -18624.3095 -18628.56053RD 16.5 Top -17273.9107 -18845.1692 -18484.4453 -18664.8072 -18669.0506
Bottom -17273.9107 -18845.1692 -18484.4453 -18664.8072 -18669.05062ND 13 Top -17297.3156 -18870.543 -18509.3496 -18689.9463 -18694.185
Bottom -17297.3156 -18870.543 -18509.3496 -18689.9463 -18694.1851ST 9.5 Top -17309.8143 -18884.0932 -18522.6491 -18703.3712 -18707.6073
Bottom -17309.8143 -18884.0932 -18522.6491 -18703.3712 -18707.6073
International Journal of Scientific & Engineering Research, Volume 8, Issue 11, November-2017ISSN 2229-5518 1,071
IJSER © 2017http://www.ijser.org
IJSER

PLINTH 6 Top -17312.5127 -18886.9581 -18525.3814 -18706.1697 -18710.3902Bottom -17312.5127 -18886.9581 -18525.3814 -18706.1697 -18710.3902
Base 0 Top 0 0 0 0 0Bottom 0 0 0 0 0
A plot for Storey Shear of Structures in Hard Soil in X - Direction with load combination 1.2(DL+LL+EXP) has been shown here
Graph 21: Storey Shear of Structures in Hard Soil in X - Direction
TABLE 23: Modal Load Participation Ratios
TABLE:Modal LoadParticipation
Ratios
structure 1 Structure1
Structure2
Structure2
Structure3
Structure3
Structure4
Structure4
Structure5
Structure5
Case Item Type Item Static Dynamic Static Dynamic Static Dynamic Static Dynamic Static Dynamic% % % % % % % % % %
Modal Acceleration UX 99.82 86.71 99.99 94.7 99.98 94.59 99.99 94.54 99.97 91.54Modal Acceleration UY 99.79 87.46 99.98 91.46 99.97 91.85 99.97 91.83 99.97 92.51Modal Acceleration UZ 0 0 0 0 0 0 0 0 0 0
A plot for Modal Load Participation Ratios of Structures in Soft Soil , Medium Soil and Hard Soil has been shown here
`
Graph 6: Modal Load Participation Ratios of Structures in Soft Soil , Medium Soil and Hard Soil
Table 23: Modal Periods and Frequencies
Structure -1 Structure -2 Structure -2 Structure -3 Structure -3 Structure -4 Structure -4 Structure -5 Structure -5
Case Mode Period Frequency Period Frequency Period Frequency Period Frequency Period Frequencysec cyc/sec sec cyc/sec sec cyc/sec sec cyc/sec sec cyc/sec
Modal 1 6.298 0.159 5.785 0.173 6.415 0.156 6.375 0.157 6.382 0.157Modal 2 6.248 0.16 5.606 0.178 6.32 0.158 6.21 0.161 5.694 0.176Modal 3 5.545 0.18 4.684 0.213 5.767 0.173 5.792 0.173 5.642 0.177Modal 4 2.062 0.485 1.701 0.588 2.114 0.473 2.102 0.476 2.088 0.479Modal 5 1.952 0.512 1.547 0.646 1.958 0.511 1.901 0.526 1.565 0.639Modal 6 1.603 0.624 1.475 0.678 1.568 0.638 1.575 0.635 1.524 0.656Modal 7 1.191 0.84 0.9 1.112 1.219 0.82 1.212 0.825 1.19 0.84Modal 8 1.027 0.974 0.838 1.193 1.028 0.972 0.983 1.017 0.791 1.264Modal 9 0.803 1.245 0.645 1.551 0.82 1.22 0.815 1.226 0.711 1.406Modal 10 0.782 1.279 0.613 1.632 0.711 1.406 0.714 1.401 0.703 1.423Modal 11 0.645 1.55 0.5 2.002 0.641 1.56 0.604 1.656 0.565 1.769Modal 12 0.581 1.72 0.45 2.222 0.592 1.689 0.589 1.697 0.423 2.363
-20000-18000-16000-14000-12000-10000
-8000-6000-4000-2000
0
Top
Top
Top
Top
Top
Top
Top
Top
Top
Top
Top
Top
Top
Top
Top
Top
Top
Top
Top
Top
Top
Top
Top
Top
Top
Top
Top
Top
Top
Top
Top
Top
111107.5104100.5 97 93.5 90 86.5 83 79.5 76 72.5 69 65.5 62 58.5 55 51.5 48 44.5 41 37.5 34 30.5 27 23.5 20 16.5 13 9.5 6 0
30TH29TH28TH27TH26TH25TH24TH23RD22ND21ST20TH19TH18TH17TH16TH15TH14TH13TH12TH11TH10TH9TH 8TH 7TH 6TH 5TH 4TH 3RD 2ND 1STPLINTHBase
Shea
rkn
Storey
Storey Shear X-Dir
Structure -1 X-Dir kN Structure -2 X-Dir kN Structure -3 X-Dir kN Structure -4 X-Dir kN Structure -5 X-Dir kN
05101520253035404550556065707580859095100105
% % % % % % % % % %
Static Dynamic Static Dynamic Static Dynamic Static Dynamic Static Dynamic
structure -1
Structure -1
Structure -2
Structure -2
Structure -3
Structure -3
Structure -4
Structure -4
Structure -5
Structure -5
%of
Acce
lera
tion
Structures
Modal Load Participation Ratios
Modal Acceleration UX Modal Acceleration UY Modal Acceleration UZ
International Journal of Scientific & Engineering Research, Volume 8, Issue 11, November-2017ISSN 2229-5518 1,072
IJSER © 2017http://www.ijser.org
IJSER

DISCUSSION ON RESULTS
When a structure is subjected to earthquake, it responds by vibrating. Anexample force can be resolved into three mutually perpendicular directions-two horizontal directions (X and Y directions) and the vertical direction (Z).This motion causes the structure to vibrate or shake in all three directions; thepredominant direction of shaking is horizontal. All the structures areprimarily designed for gravity loads-force equal to mass time’s gravity in thevertical direction. Because of the inherent factor used in the designspecifications, most structures tend to be adequately protected against verticalshaking. Vertical acceleration should also be considered in structures withlarge spans those in which stability for design, or for overall stability analysisof structures. The basic intent of design theory for earthquake resistantstructures is that buildings should be able to resist minor earthquakes withoutdamage, resist moderate earthquakes without structural damage but withsome non-structural damage. To avoid collapse during a major earthquake,Members must be ductile enough to absorb and dissipate energy by postelastic deformation. Redundancy in the structural system permitsredistribution of internal forces in the event of the failure of key elements.When the primary element or system yields or fails, the lateral force can beredistributed to a secondary system to prevent progressive failure.
The structural prototype is prepared and lots of data is been collected from theprototype. All the aspects such as safety of structure in shear, moment and instory drift have been collected. So now to check whether to know whether thestructure is safe with established shear walls and all construction of core wallin the center we need to compare the graphical values of structure with theshear wall and a simple rigid frame structure.
Story DriftTherefore, it is very important for the structure to have sufficient strengthagainst vertical loads together with adequate stiffness to resist lateral forces.So lateral forces due to wind or seismic loading must be considered for tallbuilding design along with gravity forces vertical loads. Tall and slenderbuildings are strongly wind sensitive and wind forces are applied to theexposed surfaces of the building, whereas seismic forces are inertial (bodyforces), which result from the distortion of the ground and the inertialresistance of the building. These forces cause horizontal deflection is thepredicted movement of a structure under lateral loads and story drift isdefined as the difference in lateral deflection between two adjacent stories.Lateral deflection and drift have three effects on a structure; the movementcan affect the structural elements (such as beams and columns); themovements can affect non-structural elements (such as the windows andcladding); and the movements can affect adjacent structures. Without properconsideration during the design process, large deflections and drifts can haveadverse effects on structural elements, nonstructural elements, and adjacentstructures. When the initial sizes of the frame members have been selected, anapproximate check on the horizontal drift of the structures can be made. If therigid frame is slender, a contribution to drift caused by the overall bending ofthe frame, resulting from axial deformations of the columns, may besignificant. If the frame has height width ratio less than 4:1, the contribution ofoverall bending to the total drift at the top of the structure is usually less than10% of that due to racking.. Drift problem as the horizontal displacement of alltall buildings is one of the most serious issues in tall building design, relatingto the dynamic characteristics of the building during earthquakes and strongwinds. Drift shall be caused by the accumulated deformations of eachmember, such as a beam, column and shear wall. In this study analysis is donewith different shape of shear walls to observe the effect on the drift (lateraldeflection) of the tall building due to earthquake loading.
Is 1893 Part 1 Codal Provoisions For Storey Drift Limitations
The storey drift in any storey due to the minimum specified design lateralforce, with partial load factor of 1.0, shall not exceed 0.004 times the storeyheight For the purposes of displacement requirements only, it is permissible touse seismic force obtained from the computed fundamental period (T) of thebuilding without the lower bound limit on design seismic force specified indynamic analysis.
The result obtained from the analysis models will be discussed andcompared as follows:
It is observed that
v The time period is 6.298 Sec for structure1 and it is same for differenttype of soil.
v The Frequency is 0.159 cyc/sec for structure1 and it is same fordifferent type of soil.
v The time period is 5.785 Sec for structure2 and it is same for differenttype of soil.
v The Frequency is 0.173 cyc/sec for structure2 and it is same fordifferent type of soil.
v The time period is 6.415 Sec for structure3 and it is same for differenttype of soil.
v The Frequency is 0.156 cyc/sec for structure3 and it is same fordifferent type of soil.
v The time period is 6.375Sec for structure4 and it is same for different
type of soil.
v The Frequency is 0.157 cyc/sec for structure4 and it is same for
different type of soil.
v The time period is 6.382 Sec for structure5 and it is same for differenttype of soil.
v The Frequency is 0.157 cyc/sec for structure5 and it is same fordifferent type of soil.
It is observed that
v The percentage of displacement in X& Y direction is more by 35.94 %for structure 1 in medium soil and 66.90 % of model in hard soilcompared with model in soft soil.
v The percentage of displacement in X& Y direction is more by 36 % forstructure 2 in medium soil and 67 % of model in hard soil comparedwith model in soft soil.
v The percentage of displacement in X& Y direction is more by 36 % forstructure 3 in medium soil and 66.99 % of model in hard soilcompared with model in soft soil.
v The percentage of displacement in X& Y direction is more by 44.5 %
for structure 4 in medium soil and 77.5 % of model in hard soil
compared with model in soft soil.
v The percentage of displacement in X& Y direction is more by 35.77 %for structure 5 in medium soil and 66.5 % of model in hard soilcompared with model in soft soil.
It is observed that
v The maximum storey drift in X-direction occurred at storey 13 th forstructure1 in hard ,medium and soft soil.
v The percentage of storey drift in X- direction for structure1 isdecreased by placing shear wall as shown below :-
v 35.90 % of model in medium soil compared with model in soft soil.v 66.79 % of model in hard soil compared with model in soft soil.
v The maximum storey drift in X-direction occurred at storey 12 th forstructure 2 in hard ,medium and soft soil.
v The percentage of storey drift in X- direction for structure 2 isdecreased by placing shear wall as shown below :-
v 36 % of model in medium soil compared with model in soft soil.v 67 % of model in hard soil compared with model in soft soil.
v The maximum storey drift in X-direction occurred at storey 11 th forstructure 3 in hard ,medium and soft soil.
v The percentage of storey drift in X- direction for structure 3 isdecreased by placing shear wall as shown below :-
v 35.98 % of model in medium soil compared with model in soft soil.v 67.02 % of model in hard soil compared with model in soft soil.
v The maximum storey drift in X-direction occurred at storey 11 th forstructure 4 in hard ,medium and soft soil.
v The percentage of storey drift in X- direction for structure 4 isdecreased by placing shear wall as shown below :-
v 44.5 % of model in medium soil compared with model in soft soil.v 77.4 % of model in hard soil compared with model in soft soil.
v The maximum storey drift in X-direction occurred at storey 14 th forstructure 5 in hard ,medium and soft soil.
v The percentage of storey drift in X- direction for structure 5 isdecreased by placing shear wall as shown below :-
v 35.62 % of model in medium soil compared with model in soft soil.v 66.25 % of model in hard soil compared with model in soft soil.
International Journal of Scientific & Engineering Research, Volume 8, Issue 11, November-2017ISSN 2229-5518 1,073
IJSER © 2017http://www.ijser.org
IJSER

It is observed that
v There is considerable difference in storey shear force in x-direction for all the structures with a type of soils.
v The value of the storey shear force in x-direction for all thestructures decreases with increase in storey level.
v The value of the storey shear force in x-direction for all thestructures in soft soil is more compared with the structure inhard and medium soil.
It is observed that
v There is not difference in a storey moment in x-direction for allthe structures with a different type of soils.
v There is not difference in a storey moment in y-direction for allthe structures with a different type of soils.
6 CONCLUSIONS
In this paper, reinforced concrete shear wall buildings were analyzed with theprocedures laid out in IS codes. Seismic performance of building model isevaluated.From the above results and discussions, following conclusions can be drawn:
v Building with box shape Shear Walls provided at the center coreshowed better performance in terms of maximum storeydisplacements and storey drifts.
v Shear Walls must be coinciding with the centroid of the building forbetter performance. It follows that a centre core Shear wall should beprovided.
v The shear wall and it is position has a significant influenced on thetime period. The time period is not influenced by the type of soil.
v shear is effected marginally by placing of the shear wall, grouping ofshear wall and type of soil. The shear is increased by adding shearwall due to increase the seismic weight of the building.
v Provision of the shear wall, generally results in reducing thedisplacement because the shear wall increases the stiffness of thebuilding. The displacement is influenced by type and location of theshear wall and also by changing soil condition. The betterperformance for all the structures with soft soil because it has lowdisplacement.
v The shear force resisted by the column frame is decreasing by placingthe shear wall and the shear force resisted by the shear wall isincreasing. This can be concluded indirectly by observing themaximum column shear force and moment in both directions.
v As per code, the actual drift is less than permissible drift. The parallelarrangement of shear wall in the center core and outer periphery isgiving very good result in controlling drift in both the direction. Thebetter performance for all the structures with soft soil because it haslow storey drift.
v The moment resisting frame with shear walls are very good in lateralforce such as earthquake and wind force. The shear walls providelateral load distribution by transferring the wind and earthquakeloads to the foundation. And also impact on the lateral stiffness of thesystem and also carries gravity loads.
v It is evident that shear walls which are provided from the foundationto the rooftop, are one of the excellent mean for providing earthquakeresistant to multistory reinforced building with different type of soil.
v The vertical reinforcement that is uniformly distributed in the shearwall shall not be less than the horizontal reinforcement .Thisprovision is particularly for squat walls (i.e. Height-to-width ratio isabout 1.0).However ,for walls whit height-to-width ratio less than 1.0,a major part of the shear force is resisted by the verticalreinforcement. Hence ,adequate vertical reinforcement should beprovided for such walls.
v It is observed that the There is not difference in a storey moment forall the structures with a different type of soils.
v It is evident from the observing result that for combination loads 1.2(DLLLEQX) maximum value of moment at story one .The Moment ismaximum when the shear force is minimum or changes sign.
v Based on the analysis and discussion ,shear wall are very muchsuitable for resisting earthquake induced lateral forces in multistoriedstructural systems when compared to multistoried structural systemswhit out shear walls. They can be made to behave in a ductile mannerby adopting proper detailing techniques.
v For both X and Y directions, the behaviour of the displacement graphis similar for all the structures in Soft Soil , Medium Soil and HardSoil. The order of maximum storey displacement in both thedirections for the models is same.
v As per Indian standard, Criteria for earthquake resistantdesign of structures, IS 1893 (Part 1) : 2002, the story drift inany story due to service load shall not exceed 0.004 times thestory height. The height of the each storey is 3.5 m. So, thedrift limitation as per IS 1893 (part 1) : 2002 is 0.004 X 3.5 m =14 mm. The models show a similar behaviour for storeydrifts as shown in graph.
v According to IS-1893:2002 the number of modes to be used in theanalysis should be such that the total sum of modal masses of allmodes considered is at least 90 percent of the total seismic mass. Herethe maximum mass for structure 2 is 94.7 percent and minimum massfor structure 1 is 86.71 percent.
REFERENCES
[1] Duggal, S.K., “Earthquake Resistant Design of Structures” Oxford University Press,New Delhi 2010
[2] Chopra, A.K., “Dynamics of Structures: Theory and Application to EarthquakeEngineering”, Pearson Education, 4th edition, 2012.
[3] Bureau of Indian Standars, IS 456 : 2000, “Plain and Reinforced Concrete-Code ofpractice”, New Delhi, India.
[4] Bureau of Indian Standards: IS 13920 : 1993, “Ductile detailing of reinforced concretestructures subjected to seismic forces— Code of Practice”, New Delhi, India.
[5] Bureau of Indian Standards: IS 875( part 1) : 1987, “Dead loads on buildings andStructures”, New Delhi, India.
[6] Bureau of Indian Standards: IS 875( part 2 ) : 1987, “Live loads on buildings andStructures”,New Delhi, India.
[7] Bureau of Indian Standards: IS 1893 (part 1) : 2002, “Criteria for earthquake resistantdesign of structures: Part 1 General provisions and buildings”, New Delhi, India.
[8] Berkeley “ETABS Integrated Building Design Software”, Computers and Structure, Inc.,California, USA, February 2003.
[9] Gary R.scarer and Sigmund A.Freeman " Design drifts requirement for long periodstructures " , 1 3 ' World conference on earth quake engineering Vancouver,B.C, Canada,Aug 2004 paper no-3292 .
[10] J.L.Humar and S.Yavari "Design of concrete shear wall buildings for earthquakeinduced torsion". 4'1" structural conference of the Canadian society for civil engineering June-2002.
[11] Mo and Jost ,“the seismic response of multistory reinforced concrete framed shearwalls using a nonlinear model” , Volume 15, Structure Engineering , Issue 3, 1993, Pages 155–166 .
[12] Paulay,T., and Priestley, M.J.N., ‘Seismic design of reinforced concrete and masonrybuildings’, 1992.
[13] Anand, N. , Mightraj, C. and Prince Arulraj, G. “Seismic behaviour of RCC shear wallunder different soil conditions” Indian geotechnical conference, Dec – 2010, pp 119-120.
[14] Anshuman, S., Dipendu Bhunia, Bhavin Ramjiyani,“Solution of shear wall location inmultistory building”, International journal of civil and structural engineering, Vol. 4, Issue 5,pp. 22-32 ,2011.
[15] Chandiwala, A., “Earthquake Analysis of Building Configuration with Different Positionof Shear Wall”, International Journal of Emerging Technology and Advanced EngineeringISSN 2250-2459, ISO 9001:2008 Certified Journal, Volume 2, Issue 12, December 2012
[16].Chandurkar, P.P., Dr. Pajgade, P.S., “Seismic analysis of RCC building with and withoutshear wall”, International Journal of Modern Engineering Research. Vol. 3, Issue 3, pp. 1805-1810, 2013.
[17]. Rahangdale, H., Satone, S.R., “Design and analysis of multi-storied building with effectof shear wall”, International journal of engineering research and application", Vol. 3, Issue 3,pp. 223-232, 2013.
International Journal of Scientific & Engineering Research, Volume 8, Issue 11, November-2017ISSN 2229-5518 1,074
IJSER © 2017http://www.ijser.org
IJSER