study of several complex systems with biomedical...
TRANSCRIPT

BABEŞ-BOLYAI UNIVERSITY FACULTY OF PHYSICS
Abstract of Doctoral Thesis
STUDY OF SEVERAL COMPLEX SYSTEMS WITH BIOMEDICAL AND ECOLOGICAL APPLICATIONS
Iordache Andreea-Maria
Scientific Advisor Prof. Univ. Dr.Onuc Cozar
Cluj-Napoca 2011

2
Content of thesis
Introduction 7 1. EXPERIMENTAL INSTRUMENTATION AND TECHNIQUE 9
1.1 Mass spectrometry 9
1.1.1 Mass spectrometry principles 10
1.1.2 Sample introduction systems 12
1.1.3 Ion sources (ICP and EI) and ionisation techniques 14
1.1.4 Mass analysers 18
1.1.5 Ion detection. Mass spectrometer sensitivity 22
1.1.6 MS data recording and acquisition 23
1.1.7 Ion coupled plasma mass spectrometer (ICP-MS) 24
1.2 Gas chromatography 26
1.2.1 Basics of chromatographic processes 26
1.2.2 Theoretic model of gas chromatography 27
1.2.3 Chromatographic separation 28
1.3 GC-MS coupling 32
2. VALIDATION OF QUANTITATIVE ANALYSIS METHODS 37
2.1 Samples preparation procedures (Sampling) 37
2.1.1 Liquid-liquid extraction of organic compounds (LLE) 37
2.1.2 Solid phase extraction 38
2.1.2.1 Solid phase extraction (SPE) 38
2.1.2.2 Solid phase microextraction (SPME) 40
2.1.2.3 Headspace solid phase microextraction (SH) 41
2.1.3 Ultrasound extraction (USE) 41
2.1.4 Microwave extraction (MWE) 42
2.2 Method validation parameters 43
2.3 Isotopic dilution quantitative analysis of bioactive compounds. Regression curve. Matrix calculation 47
3. ACTIVE PRINCIPLES DETERMINATION IN HERBS 53
3.1 Comparative study of the used extraction methods of active principles in herbs 54
3.2 Characterization of some therapeutic extracts by using GC/MS 60
3.3 Flavonoids analysis from Orthosiphon stamineus Benth by GC/MS 66
3.4 Active principles study from herbs by GC/MS 70
3.5 Characterization of the compounds from volatile oils by GC-MS 78
3.6 Characterization of some biologic active nutrients (volatile compounds, fatty acids, amino acids, therapeutic active compounds) by GC-MS 84
4. HIGH PRECISION ANALYSIS FOR FOOD CONTROL 104
4.1.1 ICP-MS and GC/MS methods in food control 104
4.1.2 Validation of multielement determination method at the trace level (µg/l) from drinking water by ICP-MS technique 107
4.1.3 Development of quantitative analytical methods for determination of trace level metals and pesticides in wines 112

3
4.1.3 Natural juices authentification by GC/MS 119
5. HIGH PRECISION ANALYSIS FOR SOME POLLUTANT AND ALLERGENS DETERMINATION 125
5.1 Comparative extraction methods for determination of trihalomethanes from drinking water Comparative validation of quantitative methods of THMs 125
5.2 Toxic metals determination from suspended particle matter and soils 132
5.3 Study of some allergens in cosmetics 142
6. CONCLUSIONS 151
References 155

4
Keywords
GC-MS, SIM, isotopic dilution, validation, quantitative analysis Active principles, extracts, essential oils, plants, flavonoids ICP-MS, selenium, oligoelements, aminoacids, fatty acids, derivatization Adulteration, sterols Heavy metals, certified reference material, microwave digestion suspended particulate matter, allergens

5
Introduction
Of all spectroscopic techniques, mass spectrometry has undergone a spectacular development, offering, perhaps, the most applicative possibilities in the biomedical and environmental analysis fields [1].
Mass spectrometry (MS) is an investigation technique with wide applications in physics, such as: determination of atomic and molecular masses, of isotopic composition of elements or identification of organic compounds. Apart from these applications, it became one of the most important detection techniques in chromatography, being utilised both for identifying analytes which elute from the chromatographic column and for their quantitative determination. [2].
Mass spectrometry is an appropriate instrument for the study of all substances, as a tiny amount provides more information on the structure and composition of a substance than any other analytical technique. Mass spectrometry can be considered an exceptional technique by its unique ability to identify unknown structures and by the abundance of fields it can be applied on. The invention of gas chromatography for the separation of mixtures and especially the invention of gas chromatography–mass spectrometry (GC-MS), a modern, sensitive and selective technique for qualitative and quantitative analysis has led to a large number of applications in the past decades [3]. The labelling technique of compounds with stable isotopes allowed for the utilisation of isotopic indicators and their analysis required a technique that would be capable to measure small concentrations. The GC-MS technique allows for the analysis of pg/ml concentrations and smaller. Current studies are based on the development and optimisation of analysis methods that are able to either determine the composition of samples (chromatographic/metabolomics fingerprint) or to identify certain “marker” compounds that prove the quality and authenticity of that product. Mass spectrometry (MS) including coupled GC-MS is the most used technique in the evaluation of metabolomics fingerprint [4].
The purpose of this thesis is the development of analytical methods and the optimisation of GC-MS systems (gas chromatograph coupled with mass spectrometer) and ICP-MS (inductively coupled plasma mass spectrometer) to determine active principles in aromatic and medicinal plants, elaborate analysis methods for food control and to determine pollutants and allergens in the environment.
The first chapter contains a detailed description of mass spectrometry and gas chromatography, these being the techniques used in analyses performed in experiments.
Having in view the complexity in the composition of analytes of concern (tens or even hundreds of compounds), chapter 2 describes the extraction methods used in our research and the validation of quantitative analysis methods.
Aromas and odour substances are bioactive compounds which, due to concentrations that are sometimes extremely small, are difficult to be separated and structurally determined, this being an essential step in the application of their characteristic therapeutic effect. Chapter 3 shows applications of GC-MS method in the determination of organic compounds with a bioactive role found in plant extracts (matricaria chamomilla, peppermint, basil, sea buckthorn, rose, melissa, vermouth, bitter, floratonic, Orthosiphon stamineus Benth) that are being used on a therapeutic purpose.
Chapter 4 presents high precision analyses in food control (water and wines) and in the verification of juice authenticity by the use of specific biomarkers in the two techniques mentioned above.
Chapter 5 shows high precision analyses for the determination of pollutants in the environment (toxic metals, THMs) and of allergens studied in cosmetic products or perfumery.
The last chapter is a synthesis of conclusions drawn after experimental results.
6
1. Experimental instrumentation and technique Mass spectrometry
Mass spectrometry is the most sensitive method for structural analysis, being a microanalytical
technique that allows for the measurement of relative molecular masses of the compounds, respectively the highlighting of some atomic and functional species that exist in the analysed compound.
Mass spectrometry is a physical method that allows for the generation of ions, their separation depending on mass-to-charge ratio (m/z) and their registration, resulting in mass spectra of complex molecules [4]. The mass spectre is represented by the registration of the relative abundance of ions according to their mass.
Mass spectrometer is an instrument that produces ions in gaseous stage and then separates them according to values of m/z ratios, between the ion mass and the number of elementary charge on that respective ion. Thus, mass spectrometry is used for quantitative and structural determinations of atoms and molecules. The identification of a molecule in a mass spectre is easier that in other types of spectra, as this one contains both the mass of the molecule and the masses of fragments resulted from the dissociation of that molecule. The abscissa indicates the m/z ratio and the ordonate indicates the relative abundance. Relative abundances are determined by the measurement of their areas. The spectre library is used to identify components by comparison with mass spectra of known compounds. The most important mass spectrotec is NIST - National Institute of Standards and Technology.
The elements of a mass spectrometer are: (1) introduction system, the sample which is to be analysed is being brought to the correct pressure, form and quantity so as to be intoduced into the ion source and ionised with maximum efficiency; (2) the ion source -atoms or neutral molecules are directed practically as a monoenergetic beam into the instrument; (3) the analyser, the “heart of the mass spectrometer” – selects the ions according to the m/z value, by magnetic, electric or electromagnetic deflections, concentrating them at the same time to an exit slot; (4) the detector -a system that transforms ionic current into a photographic image or in an electric current that can be registered.
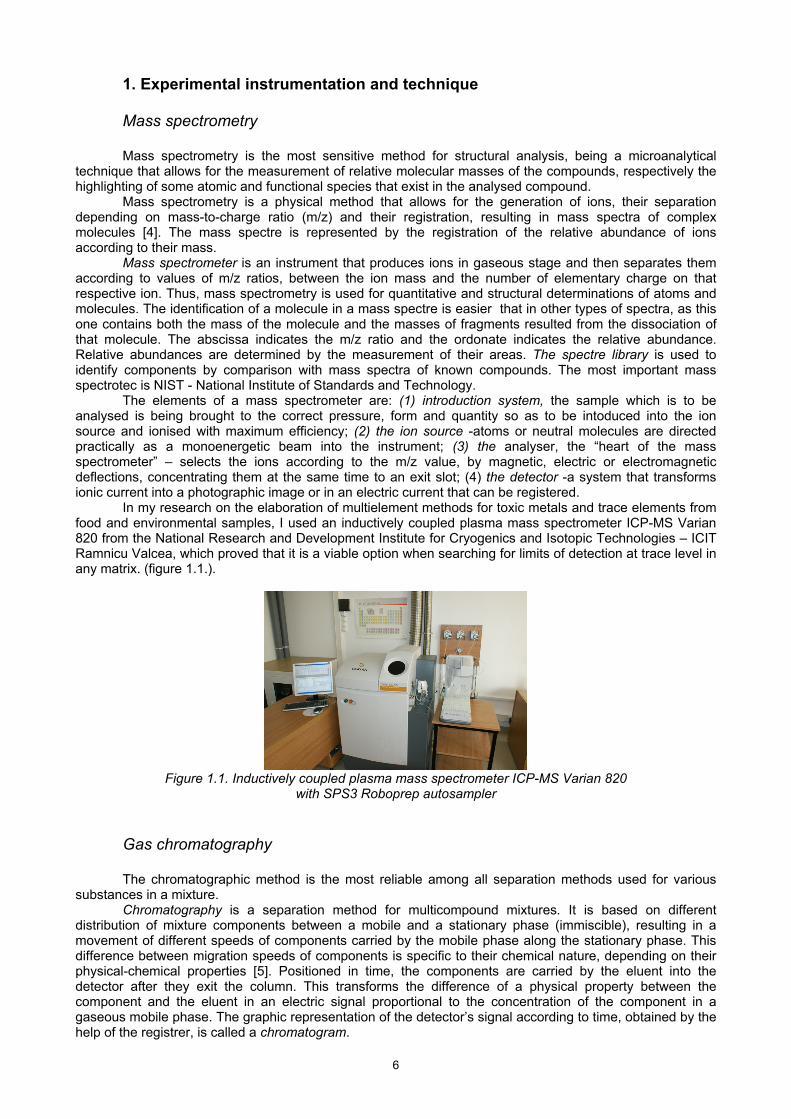
In my research on the elaboration of multielement methods for toxic metals and trace elements from food and environmental samples, I used an inductively coupled plasma mass spectrometer ICP-MS Varian 820 from the National Research and Development Institute for Cryogenics and Isotopic Technologies – ICIT Ramnicu Valcea, which proved that it is a viable option when searching for limits of detection at trace level in any matrix. (figure 1.1.).
Figure 1.1. Inductively coupled plasma mass spectrometer ICP-MS Varian 820
with SPS3 Roboprep autosampler
Gas chromatography
The chromatographic method is the most reliable among all separation methods used for various
substances in a mixture. Chromatography is a separation method for multicompound mixtures. It is based on different
distribution of mixture components between a mobile and a stationary phase (immiscible), resulting in a movement of different speeds of components carried by the mobile phase along the stationary phase. This difference between migration speeds of components is specific to their chemical nature, depending on their physical-chemical properties [5]. Positioned in time, the components are carried by the eluent into the detector after they exit the column. This transforms the difference of a physical property between the component and the eluent in an electric signal proportional to the concentration of the component in a gaseous mobile phase. The graphic representation of the detector’s signal according to time, obtained by the help of the registrer, is called a chromatogram.

7
The technique of combining the gas-chromatography with mass spectrometry (GC-MS) has become extremely useful when studying the composition of bioactive compounds in volatile oils successfully used in treatments, aromatherapy, food industry and cosmetics. The determination of biomolecules of therapeutic interest implies pretentious quantitative and qualitative analyses which pursue determination up to nanogram or picogram level of compounds by GC-MS [6].
GC-MS coupling The technique of combining the gas-chromatography with mass spectrometry (GC-MS) has become
extremely useful when studying the composition of bioactive compounds in volatile oils successfully used in treatments, aromatherapy, food industry and cosmetics. Gas chromatography-mass spectrometry (GC-MS) is an coupled analytical technique used for the following purposes: a. confirmation and identification of volatile and semivolative analytes in a complex mixture; b. determination of molecular mass and/or elementary structure of unknown volatiles/semivolatiles; c. structural determination of unknown volatiles/semivolatiles in a mixture through a spectral matching of spectral interpretation. Quantitative determinations [2] by gas chromatography–mass spectrometry coupling technique can be performed in ways that increase sensitivity up to 1000 times. In the case of selected ion monitoring (SIM) individual masses of ions are continuously selected or, when several ions need to be measured, each of them is detected in a sequence for a period of time [7]. In the SIM working method the sensitivity is increased by approximately 103 times compared to a scanned mass spectre in a given mass range (SCAN). In GC-MS coupling, total ion chromatogram (TIC) represents the abundance of ions according to the retention time. The chromatogram is considered to be a “fingerprint” of the bouquet of different alcoholic drinks, of orange extract (terpenes) or of other fruits, medicinal plants, tea plants or different perfume compositions [4].
In my research I used a Thermo Finnigan GC-MS (DSQ) mass spectrometer coupled with a Trace GC gas chromatograph (figure 1.2.). The RTx-5MS capillary column had a length of 30m, a diameter of 0,25mm and a thickness of the methyl phenyl polysiloxane film of 0,25 μm.
By using the a Trace DSQ Thermo Finnigan coupled with Trace GC system in the Gas-Chromatography and Mass Spectrometry Laboratory of the Biomedical Physics Department in Cluj-Napoca, we performed quantitative and qualitative methods that pursue the determination up to nanogram or picogram level of compounds of therapeutic interest. Bioactive components of plants are of a high variety and very useful for the human health. The bioactive principles of plants are increasingly studied for their therapeutic effects (antiparasitic, antifungic, cytostatic, etc).
Figure 1.2. Trace DSQ ThermoFinnigan coupled with Trace GC- system
equipped with autosampler
Also, GC-MS is adequated to be used for the separation and identification of components with malignant potential (trihalomethanes in drinking water) or allergenic potential in plants used in the food or perfume industry. Gas chromatography coupled with mass spectrometry obtained spectacular results especially in the analysis of organic pollutants in the urban air, by the separation and identification of more than 100 components found in the air. Gas chromatography has solved so far an impressive number of separation cases (more than 20.000). Gas chromatography coupled with mass spectrometry aimed at obtaining new rapid, exact, non-invasive or minimally invasive procedures for the diagnosis of severe diseases, by the use of advanced methods and technologies that allow for the analysis of biomarkers or metabolomic fingerprint. The GC-MS coupling shows the qualities of the two instruments, the ideal separation by gas chromatography and ideal identification by mass spectrometry. By using compounds that are marked with stable isotopes that allow the avoidance of contaminants in samples, the ID-MS and ID-GC-MS are efficient physical techniques for quantitative analysis at high precision trace levels, with numerous interdisciplinary application possibilities.

8
2. Validation of quantitative analysis methods Sampling preparation procedures (sampling) Parameters for method validation The determination of biomolecules of therapeutic interest implies the performance of pretentious
qualitative and quantitative analyses which aim to determine compounds of interest up to nanogram or picogram level. To perform the qualitative and quantitative analysis, two important stages must be met [8]:
a. removing the compound from the matrix with high efficiency; b. bringing the compound to the sensibility level of the chosen analytical method (enriching the
compound of interest) by a proper extraction method and quantitatively determining it by a reliable analysis method. Depending on the nature of samples, different extraction methods will be used. In our research, the preparation methods of samples we used were: liquid-liquid extraction of organic compounds (LLE), solid phase extraction (SPE, SPME, HS), ultrasonic extraction (USE) and microwave extraction (MWE). The analytical methods must be validated (the demonstration of their correctness) by testing validation parameters while using standard samples with known concentrations of the compounds of interest.
Regardless of the quantitative analysis method, it must be validated having in view the following validation parameters:
Linearity - the capacity of an analytical method to allow, in a pre-established environment, for variable testing results, directly proportional with the concentration of the analyte in the sample. Linearity is demonstrated by the increase of calibration curves for analytes in question and the calculation of the related correlation coefficient. The reference value for correlation coefficient is recommended to be 0,997, but smaller values can also be admitted where the deflection of calculated value in relation to the reference value for all calibration points does not exceed 5% of the analyte’s effective value. The equation of the regression line y=ax + b, applied to the results has to have a close-to-zero origin of the “b” ordinate. The slope regression line of the “a” and the “r” regression coefficient are calculated, which, for a good linearity must tend to 1 [4].
The detection limit (LD), the quantitation limit (LQ). The detection limit is represented by the smallest amount of analyte that can be detected by the method taken into consideration. The amount of analyte at the limit of detection must be higher than the error associated to the measurement (ratio signal/noise=2 or 3). The quantitation limit is represented by the smallest amount of analyte that offers exact measurements, with a ratio signal/noise=10 [4].
The accuracy (exactness) represents the convergence degree between the results obtained by analytical method and the values accepted as reference or conventionally true. It is determined by the analysis of a certified reference material or by the analysis of a sample generated as reference material. The exactness estimates the systematic errors. The Eurachem/CITAC Guide [9-11] defines the systematic error as “the difference between the arithmetic mean of the results of a large number of measurements of the same measurand in conditions of repeatability and a true value of the measurand”. For systematic errors, the results are shifting, meaning they are either smaller or higher than they should be. Also, matrixes with a known amount of analyte, standards that can be fully trusted are utilised. The error is the difference between the real value and the measured one. In order to express the error, the relative standard deviation RSD (%) is calculated as follows:
100..
(%)..
realvalue
valuerealvaluemeasuredDSR (2.1)
n
xx
n
ii
1 and a
byx i
i
[4] (2.2)
Where the measured value in the case of n measurements represents x : The precision represents the convergence degree between results obtained by measuring a series
of samples acquired from the same homogenous sample, in the conditions required by the method. The precision and reproductibility characterise the conformity between the results of individual
measurements of those of multiple series of measurements. In other words, the precision is the statistical error. Precision is expressed by the relative standard deviation or by the variation coefficient (C.V.) expressed as %:
MDSDSRVC /100..(%)...%. (2.3)

9
Where S.D. is the standard deviation for n measurements and is given by the relation:
)1(
..
2
nn
xxDS i
, (2.4)
where x is the mean of individual measurements i and is given by the relation (2.2) [4]. M is the calculated mean value (2.2).
Specificity – a characteristic of an analytical method which offers a single result for a single analyte. Selectivity – the capacity of an analytical method to accurately measure an analyte in the presence
of other analytes and possible interferents. For chromatographic processes, it is ensured by a correct determination of the parameters of chromatographic separation and for MS it is ensured by a correct selection of ions, without interferences in the chosen concentration range, in relation to other ions.
Robustness – method stability, as analytical results, at variations of operational parameters. It is checked by a controlled induction of deflections from operational parameters (in a chosen realistic field) and by verifying the effect on results.
The most used methods for calibration and determination of compound concentration are: - calibration curve method (area standardization)
The concentration of the unknown component (X) is calculated by using the peak area, according to the following formula:
100(%)
ii
x
A
AX (2.5)
- internal standard method. By adding the internal standard before and after the extraction, the extraction efficiency, can be tested. The internal standard has to be chosen so as to be well separated from the other sample components [4]. This method consists in adding a reference substance (called standard) of a known CS (% weight) concentration to the mixture that is to be analysed. In this case, the concentration of the I component shall be calculated by the relation:
%100)/
/( S
ss
iii C
fA
fAC (2.6)
- method of standard additions. In this method, in order to determine the Ci concentration of the I component, its Ai area is to be calculated. Then, a known amount of this component with standard CS concentration is added to the sample and the A’i area (consisting in Ai+AS) is determined on the new chromatogram. Concentration Ci is determined from the relation:
Ci/(Ci+CS) = Ai/A’i resulting Ci=CS Ai /(A’i-Ai) (2.7) - method of external standard. The unknown Ci concentration of an i component in the analysed
mixture corresponds to a Ai peak area. Then a sample of the same component is introduced in the chromatograph but of a known CS concentration. The following observation is required: the concentration of the external standard should not be too different from the concentration of the component which is to be determined.
The concentration of the unknown component is calculated by the relation:
Ci =AiCS/AS (2.8)
The use of multiple labelled isotopes of the analyte as internal standards as well as the presence of natural isotopic abundances in the plasma requires the correction of the mass spectre and the extraction of information of interest by the deconvolution of the mass spectre (separation of overlapping information and appropriate correction).
The design matrix was first built from the mole fractions of mass spectre of natural theophylline, tracer and internal standard, and when needed, from the synthetic construction of mass spectre. Solving a set of simultaneous linear equations was necessary, each describing the isotopic contributions of the following form:
jix
jix XAI,
, (2.9)
where Ix represents the relative abundance of the x ion, and Xj is the unknown fractional abundance

10
The relative abundance of contributing ions (Ai) was calculated for two of the most intense ions, forming simultaneous equations in a matrix notation:
XAI (2.10)
The solution of the least squares of X can be obtained by using the pseudoinverse matrix :
IAAAX TT 1)( (2.11)
The Isotope dilution mass spectrometry (ID-MS) method is simple, precise and fast.
3. Determination of active principles of plants
The qualitative and quantitative determination of compounds found in volatile oils is a modern
research subject [12-22]. Volatile oils are successfully used in treatments, aromatherapy, food and cosmetic industry. Essential oils are aromatic volatile substances produced by plants and they can be extracted by different methods. Volatile oils are not unitary compounds, they are mixtures of tens or even hundreds of organic substances (aldehydes, ketones, alcohols, esters etc) also known as terpenes and terpenoids. It has been observed that a volatile oil has several main compounds, out of which only one ensures aroma to the product. The identification of organic compounds in plants is important as the separation and recognition of their chemical structure is the key step in explaining their therapeutic action. Currently, plants are more and more studied for their therapeutic action.
The presence adulterations often leads to the changes of the properties of volatile oils, especially of the therapeutic ones, resulted from a synergetic action of all components. Moreover, volatile oils and different plant extractions are used in food supplements or for medical purposes, therefore it is crucial that the authenticity and quality of that product are ensured, otherwise a possible adulteration can have severe negative effects upon the health of the consumer.
The properties of volatile oils are directly correlated to their composition, both from the quality and from the quantity point of view. The determination of chromatographic fingerprint of volatile oils and the characterisation of compounds in plant extracts have been performed by the GC-MS technique. The determination of biomolecules of therapeutic interest implied pretentious qualitative and quantitative analyses that aim for the determination of compounds of interest up to nanogram or picogram level. The characterisation of active principles of plants from amounts as small as micrograms required efficient procedures from the time, materials and precision point of view.
Each plant is characterised by its aroma, by a taste or smell that is specific only to the species it belongs to. This is due to the existence of a compound or a group of active principles that are found in a higher amount and concentration than all the other components. The separation and identification of the chemical structure is the key step in explaining their therapeutic action. This is why extraction and separation methods and the identification of compounds by the GC-MS coupling are the most important steps in the analysis of chemical composition of plants. Quantitative analysis methods have been validated by studing validation parameters such as: precision, accuracy, detection and quantity limits, extraction efficiency [23-25].
Comparative study of the used extraction methods of active principles in herbs In the last years the number of procedures using extraction of organic compounds from different
matrices has increased [26]. The aim of the present work was a comparison between extraction methods, for qualitative characterization of flavors extracted from herb plants of different sources.
Lichid-lichid extraction (LLE) A mixture of three solvents (S) was prepared: ethyl acetate: hexane: methylen chloride (5:1:1, v/v/v).
The LLE extraction procedure was: 30 µl mixture M in 1 ml solution distilled water: ethanol (1:1, v/v), or 1 ml hydroalcoholic flavour extract), 1 ml distilled water and 0.33ml solvent S, (3:3:1,v/v/v) were mixed 1.5 minutes and then centrifugated 2 minutes. 1µl 3-hepten-2-one, was added to the supernatant and then 1 µl was injected two times by using the autosampler injector.
SPE Extraction (SPE) The solid phase was conditioned with 3ml methanol and 3ml distilled water. After sample application,
washing and drying 10minutes at vacuum, the sample was eluted with 3 x 0.3 ml solvent. The solvent was solvent S in the case of RP-18 cartridges and chloroform-acetone (1:1, v/v), in the case of TSC cartridges. After adding of 1 µl of the external standard to the eluate, 1µl was injected by using the autosampler injector. Each sample was injected twice.
11
Microwave extraction (MWE) The microwave extraction procedure was performed at 2,45 GHz for 4 sec, to a temperature of 60oC,
in a screw cap vessel. 30 µl mixture S was added to 1 ml hydroalcoholic solution, 1 ml distilled water and 0.33 ml solvent S were placed in the microwave funnel and extracted. Then 1µl 3-hepten-2-one (ES), was added to the supernatant and analyzed twice.
Ultrasonic extraction (USE) The ultrasonic extraction procedure was performed 1min, at a temperature of 60oC. The ultrasonic
probe was placed in the vessel containing 30 µl mixture S in 1 ml hydroalcoholic solution, 1 ml distilled water and 0.33ml solvent S. After extraction, 1µl 3-hepten-2-one (ES) was added to the supernatant and analyzed
For our study a Trace DSQ ThermoFinnigan quadrupol mass spectrometer coupled with a Trace GC was used. The GC was equipped with a RTx-5MS capillary column 30mx0.25mm diameter, 0,25µm film thickness, in the temperature program: 50°C for 2 min, then increased to 250°C with a rate of 8°C /min at 310°C, helium flow rate 1ml/min. The GC/MS interface line and the ion source were maintained to 250°C. Electron energy was 70eV and electron emission 100µA.
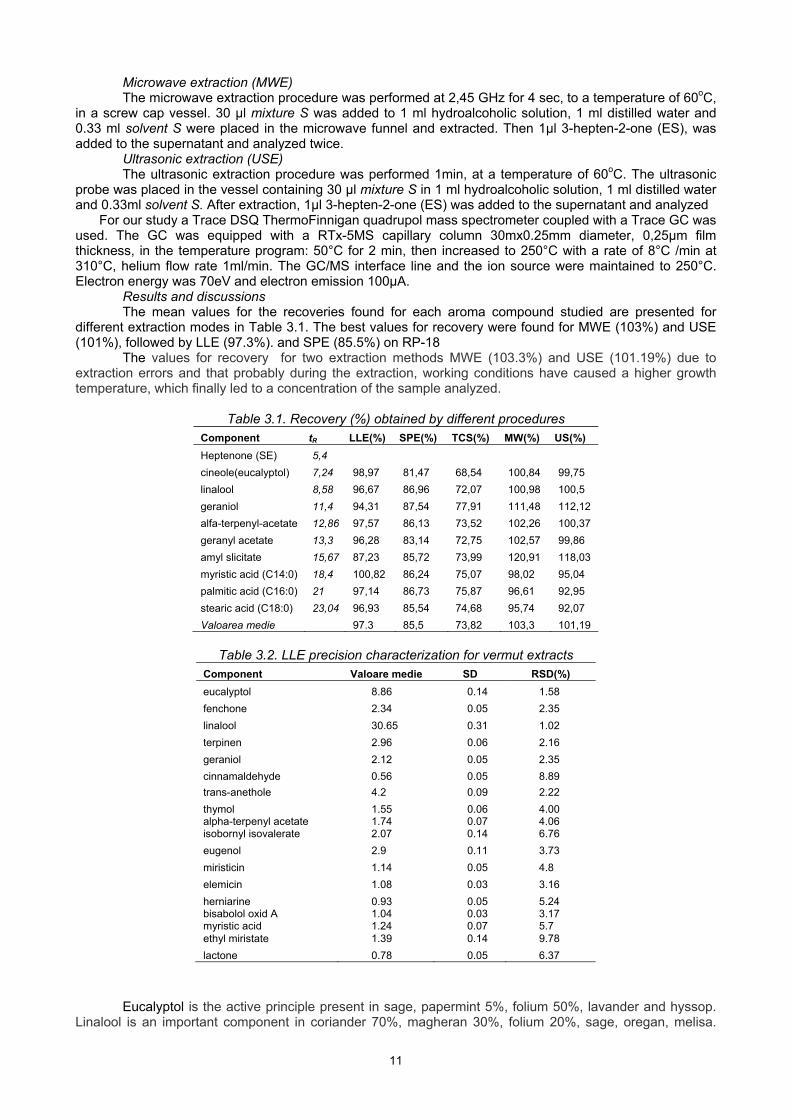
Results and discussions The mean values for the recoveries found for each aroma compound studied are presented for
different extraction modes in Table 3.1. The best values for recovery were found for MWE (103%) and USE (101%), followed by LLE (97.3%). and SPE (85.5%) on RP-18
The values for recovery for two extraction methods MWE (103.3%) and USE (101.19%) due to extraction errors and that probably during the extraction, working conditions have caused a higher growth temperature, which finally led to a concentration of the sample analyzed.
Table 3.1. Recovery (%) obtained by different procedures
Component tR LLE(%) SPE(%) TCS(%) MW(%) US(%)
Heptenone (SE) 5,4
cineole(eucalyptol) 7,24 98,97 81,47 68,54 100,84 99,75
linalool 8,58 96,67 86,96 72,07 100,98 100,5
geraniol 11,4 94,31 87,54 77,91 111,48 112,12
alfa-terpenyl-acetate 12,86 97,57 86,13 73,52 102,26 100,37
geranyl acetate 13,3 96,28 83,14 72,75 102,57 99,86
amyl slicitate 15,67 87,23 85,72 73,99 120,91 118,03
myristic acid (C14:0) 18,4 100,82 86,24 75,07 98,02 95,04
palmitic acid (C16:0) 21 97,14 86,73 75,87 96,61 92,95
stearic acid (C18:0) 23,04 96,93 85,54 74,68 95,74 92,07
Valoarea medie 97.3 85,5 73,82 103,3 101,19
Table 3.2. LLE precision characterization for vermut extracts
Component Valoare medie SD RSD(%)
eucalyptol 8.86 0.14 1.58
fenchone 2.34 0.05 2.35
linalool 30.65 0.31 1.02
terpinen 2.96 0.06 2.16
geraniol 2.12 0.05 2.35
cinnamaldehyde 0.56 0.05 8.89
trans-anethole 4.2 0.09 2.22
thymol 1.55 0.06 4.00 alpha-terpenyl acetate 1.74 0.07 4.06 isobornyl isovalerate 2.07 0.14 6.76
eugenol 2.9 0.11 3.73
miristicin 1.14 0.05 4.8
elemicin 1.08 0.03 3.16
herniarine 0.93 0.05 5.24 bisabolol oxid A 1.04 0.03 3.17 myristic acid 1.24 0.07 5.7 ethyl miristate 1.39 0.14 9.78
lactone 0.78 0.05 6.37
Eucalyptol is the active principle present in sage, papermint 5%, folium 50%, lavander and hyssop. Linalool is an important component in coriander 70%, magheran 30%, folium 20%, sage, oregan, melisa.

12
Geraniol is found in rose oil, coriander 3%, cinamaldehide is found in cinnamon, eugenol in clove, and bisabolol in chamomile. The most numerous and important constituents of essential oils are terpenes and their derivatives such as: geraniol in rose flowers and eucalyptus, linalool in lily, coriander, citral in orange peel, borneol and camphor.
Vermouth and swedish bitters have decongestant action, antiviral, healing, inflammatory and stimulating the circulation and respiration.
Good recovery mean values were obtained by LLE (97%) using an appropriate mixture of solvents comparable with the recoveries of the other extraction methods as SPE (86%), MWE (103%) and USE (101%).The values obtained for the MWE extraction recovery (103%), USE (101%), LLE (97%) and SPE (86%) were comparable.
The characterization of bitter and vermut aroma by microextraction LLE method showed R.S.D. lower than 11%. The comparison of flavours of herbs from different sources showed qualitative and quantitative differences.
Characterization of some terapeutic extract by using GC-MS The methods were applied [27] to characterize “Floratonic”, a “swedish” tincture, used internal or
external, in traditional medicine in our country. It is prepared from some herbs growing in Romania as hydroalcoholic extract which contains 12 plant species: Aloe (folium), Angelica arhangelica (radix), Juniperus communis, Fraxinus excelsior (fructus) Gentiana lutea (radix), Iris palida (radix), Robinia pseudacacia (flos), Polygonum aviculare (herba), Arctium lappa (radix), Laurus nobilis (folium), Abies alba.
“Floratonic" present active principle, offering a simple and effective cure for many diseases. The purpose of quantitative analysis of aroma compounds and active principles, extracts of Floratonic and Angelica archangelica root extract were subjected to two procedures for extraction (LLE and SPE) presented above:
Results and discussions For method validation 20ng/ml or 2μg/g of methyl myristate as internal standard (IS) was added
before extraction. Linearity was studied in the range 0-24ng. The regression curves obtained for the standards gave good correlation coefficients higher than 0.99 for each standard. Precision for LLE extraction gave relative standard deviation (RSD) lower than 6% (n=4) and for SPE, RSD was lower than 3% (n=5). Recovery for LLE was 81% (n=3) and for SPE 92% (n=4).
In Floratonic swedish bitter extract was determined an important component (25%) with anti-inflammatory activity: matairesinol M=358. Lignants can be metabolized in mammals forming pinoresinol, lariciresinol, secoisolariciresinol, matairesinol, hidroximatairesinol, siringaresinol and sesaminul. The Matairesinol and secoisolariciresinol were the first lignants identified in food. Lariciresinol and Pinoresinol are the most recent lignants identified in plants, which have a substantial contribution to nutrition diet. The lignants of the plants and their metabolites have anti-inflammatory properties. The methods presented are suitable for determining trace level organic compounds in hydroalcoholic extracts from plants.
Flavonoids analysis from Orthosiphon stamineus Benth by GC/MS Flavonoids are chemicals with antioxidant properties, someone stimulates blood circulation, some
other with anti-irritation effect, anti-inflammatory or diuretic. Antioxidants are stable molecules with an extra electrons or with the ability to receive additional electrons. They are the body's natural defense system against the harmful effects of free radicals, appearing cell structures and DNA damaging effects of free radicals that seek to capture electrons. Antioxidants donate or receive additional electron to neutralize free radicals and stop the cascade effect of oxidation. Because free radicals are created not only in the environment but also in our body, for health and longevity is essential to have a steady stream of antioxidants provided by a healthy and balanced lifestyle.
Our aim [28] consisted of a comparative study concerning the extraction with different solvents of the compounds from O. stamineus Benth. The extracts were studied by GC-MS without derivatization, because flavonoids are in form of methoxylated flavones.
Results and discussions The dry leaves of Orthosiphon stamineus Benth were obtained from Caesar & Loretz, Germany. This
plant material was used to obtain fifteen different extracts by using fifteen different solvents. The extracts were prepared with: 1.hexane, 2.ethyl ether, 3.chloroform, 4.dichloromethane, 5.benzene, 6.toluene, 7.acetone, 8.methyl ethyl ketone, 9.dioxane, 10.methyl acetate, 11.ethyl acetate, 12.methanol, 13.ethanol, 14.iso-propanol, and 15.n-buthanol.
The separation chromatograms for the different solvent extracts showed very similar flavonoids and sterols, as presented in figure 3.1.

13
R T : 1 4 .6 9 - 2 1 .2 5
1 5 1 6 1 7 1 8 1 9 2 0 2 1
T i m e ( m i n )
0
5
1 0
1 5
2 0
2 5
3 0
3 5
4 0
4 5
5 0
5 5
6 0
6 5
7 0
7 5
8 0
8 5
9 0
9 5
1 0 0
1 0 5
Re
lativ
e A
bu
nd
an
ce
p e n ta m e th o x y f l a v o n e M = 3 7 2
stig
ma
ste
rol
tetr
am
eth
ylsc
ute
llare
in M
=3
42
sito
ste
rol
5 h y 3 ', 4 ', 6 ,7 te t r a m e th o x y f l a v o n eM = 3 5 8
3h
y4',5
,7tr
ime
tho
xyfla
von
e M
=3
28
R T : 1 7 .6 9
R T : 1 9 .0 6R T : 1 7 .8 5
R T : 1 8 .6 4
1 8 .9 2 2 0 .2 7
1 9 .8 7
2 0 .7 41 9 .3 7
1 6 .1 5 1 7 .5 9 2 0 .9 21 7 .2 5
1 6 .6 51 5 .9 61 4 .8 1 1 5 .7 0
1 4 .9 7
N L :1 .9 5 E 7
T IC F : M S o r th o p r o l 1 2m e t2
Figure 3.1. The separation chromatogram of the orthosiphon extract. The important flavonoids
identified from the mass spectra have molecular mass M=328, M=342, M=358 and M=372
Fig. 3.1 presents the separation chromatogram for the important flavonoids determined in the extracts: (a) 3-hydroxy 4',5,7-trimethoxyflavone M=328 (17.7 min); (b) 4',5,6,7-tetramethoxyflavone M=342 (17.86 min); (c) 5-hydroxy, tetramethoxyflavone M=358(18.52 min, 18,65 min); (d) pentamethoxyflavone M=372 (18.65 min and 18.94 min)
The GC-MS proved to be a suitable technique for the characterization of the flavonoid extracts from the herb studied as underivatized compounds.
The comparison among different solvents with regards to flavonoids extraction showed hexane (1) and butanol (15) to be bad choice solvents for these compounds and acetone (7) or aromatic solvents very low extraction solvents. Low extraction was observed also for methyl ethyl ketone (8) and ethyl acetate (11). The alcoholic extracts were the best solvents, especially methanol and isopropanol.
Active principles study from herbs by GC-MS
The aim of the present study [29.30] is to develop a rapid method for the quantitative determination of organic compounds in herbs used as raw materials in cosmetic, pharmaceutical or food industry. The method was used for the comparison between the bioactive compounds found in Matricaria chamomilla, Melissa officinalis, Urtica dioica, Lamium album from different Geographical Regions of Romania. (Petroşani, Cătălina (Cluj), Baia Mare and Vatra Dornei from România, purcharded from market. Control group of control samples were harvested from the Agronomic Institute of Cluj-Napoca.
Results and discussions The linearity of the GC–MS signal was studied in the range of 0-100 lg. The regression curves obtained for the standards gave good correlation coefficients, over 0.995. Relative standard deviations (RSD) were lower than 3%. The average values were obtained from the results of four extraction procedures and two injections of each extract. The recovery for LLE procedure was 97% (n=4) for the standard mixture. The sensitivity was lower than 10µg at a ratio S/N = 10 and the L.D was 10 ng, S/N=10 for each standard. The validation method was tested on a hydroalcoholic herbs extract, kept seven days at the room temperature. The active principles of chamomile extracts are shown in Table 3.3. Matricaria chamomilla shows high quantity of bioactive compounds. Alpha-bisabolol, the important active compounds responsible for anti-inflammatory effect is diminished or oxidized.
Table 3.3. GC-MS identification organic compounds in the extracts of Matricaria chamomilla LLE (chamomile)
Component tR
(min) 1.
µg/g 2.
µg/g 3.
µg/g 4.
µg/g 1. 1,3 butandiol 4.2 85.6 61.9 - 40.9 2. 4-vinyl phenol 11.8 9.2 6.9 - - 3. 2-methoxy-6-vinyl phenol 14.8 178.6 103.1 - - 4. trans-beta-farnesene 15.6 - 68.7 61 - 5. spathulenol M=220 17.6 70.9 74.2 - - 6. alpha-bisabolol oxide B M=238
18.6 160.2 230.9 216.8 55.1
7. alpha-bisabolol M=222 18.9 485.3 - 72.1 312.3 8. bisabolone oxide M=236 19.1 - 233.7 100 - 9. methyl myristate (SI=2mg/g) 19.5 2000 2000 2000 2000 10. herniarin M=178 19.7 893.2 378 48.5 50.5 11. chamazulene M=184 19.7 46 82.5 97.1 49.0
14
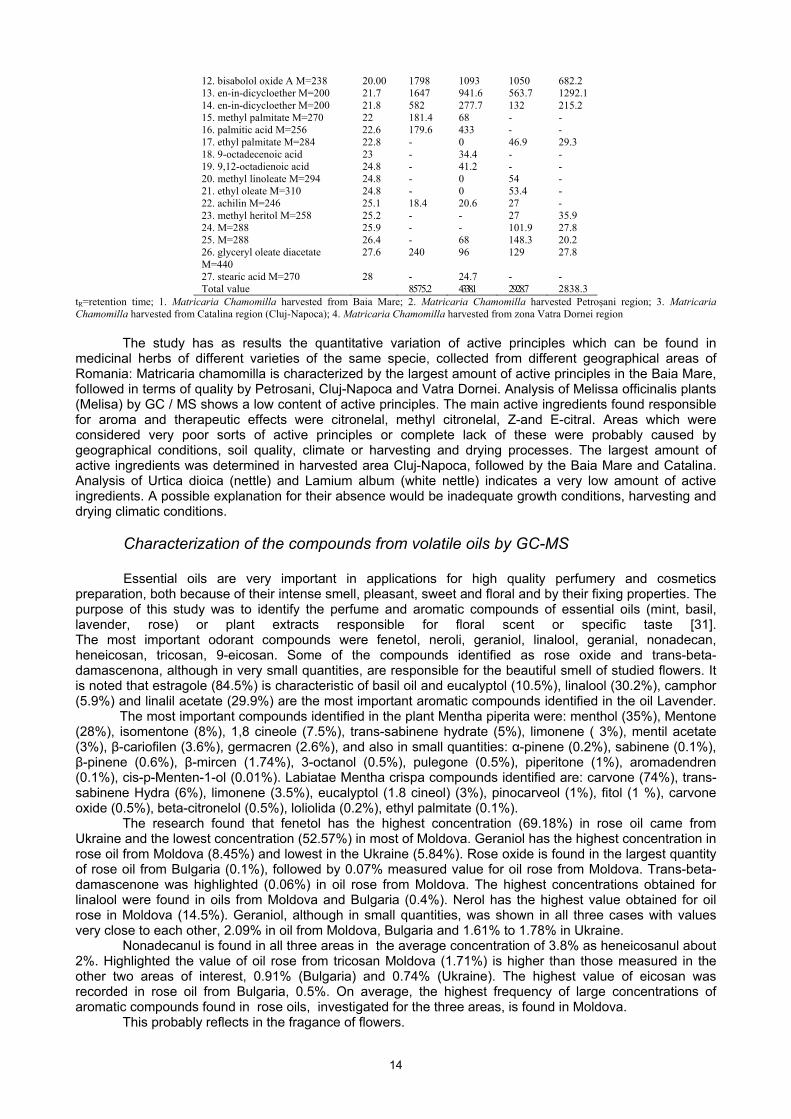
12. bisabolol oxide A M=238 20.00 1798 1093 1050 682.2 13. en-in-dicycloether M=200 21.7 1647 941.6 563.7 1292.1 14. en-in-dicycloether M=200 21.8 582 277.7 132 215.2 15. methyl palmitate M=270 22 181.4 68 - - 16. palmitic acid M=256 22.6 179.6 433 - - 17. ethyl palmitate M=284 22.8 - 0 46.9 29.3 18. 9-octadecenoic acid 23 - 34.4 - - 19. 9,12-octadienoic acid 24.8 - 41.2 - - 20. methyl linoleate M=294 24.8 - 0 54 - 21. ethyl oleate M=310 24.8 - 0 53.4 - 22. achilin M=246 25.1 18.4 20.6 27 - 23. methyl heritol M=258 25.2 - - 27 35.9 24. M=288 25.9 - - 101.9 27.8 25. M=288 26.4 - 68 148.3 20.2 26. glyceryl oleate diacetate M=440
27.6 240 96 129 27.8
27. stearic acid M=270 28 - 24.7 - - Total value 8575.2 4338.1 2928.7 2838.3
tR=retention time; 1. Matricaria Chamomilla harvested from Baia Mare; 2. Matricaria Chamomilla harvested Petroşani region; 3. Matricaria Chamomilla harvested from Catalina region (Cluj-Napoca); 4. Matricaria Chamomilla harvested from zona Vatra Dornei region
The study has as results the quantitative variation of active principles which can be found in
medicinal herbs of different varieties of the same specie, collected from different geographical areas of Romania: Matricaria chamomilla is characterized by the largest amount of active principles in the Baia Mare, followed in terms of quality by Petrosani, Cluj-Napoca and Vatra Dornei. Analysis of Melissa officinalis plants (Melisa) by GC / MS shows a low content of active principles. The main active ingredients found responsible for aroma and therapeutic effects were citronelal, methyl citronelal, Z-and E-citral. Areas which were considered very poor sorts of active principles or complete lack of these were probably caused by geographical conditions, soil quality, climate or harvesting and drying processes. The largest amount of active ingredients was determined in harvested area Cluj-Napoca, followed by the Baia Mare and Catalina. Analysis of Urtica dioica (nettle) and Lamium album (white nettle) indicates a very low amount of active ingredients. A possible explanation for their absence would be inadequate growth conditions, harvesting and drying climatic conditions.
Characterization of the compounds from volatile oils by GC-MS
Essential oils are very important in applications for high quality perfumery and cosmetics preparation, both because of their intense smell, pleasant, sweet and floral and by their fixing properties. The purpose of this study was to identify the perfume and aromatic compounds of essential oils (mint, basil, lavender, rose) or plant extracts responsible for floral scent or specific taste [31]. The most important odorant compounds were fenetol, neroli, geraniol, linalool, geranial, nonadecan, heneicosan, tricosan, 9-eicosan. Some of the compounds identified as rose oxide and trans-beta-damascenona, although in very small quantities, are responsible for the beautiful smell of studied flowers. It is noted that estragole (84.5%) is characteristic of basil oil and eucalyptol (10.5%), linalool (30.2%), camphor (5.9%) and linalil acetate (29.9%) are the most important aromatic compounds identified in the oil Lavender. The most important compounds identified in the plant Mentha piperita were: menthol (35%), Mentone (28%), isomentone (8%), 1,8 cineole (7.5%), trans-sabinene hydrate (5%), limonene ( 3%), mentil acetate (3%), β-cariofilen (3.6%), germacren (2.6%), and also in small quantities: α-pinene (0.2%), sabinene (0.1%), β-pinene (0.6%), β-mircen (1.74%), 3-octanol (0.5%), pulegone (0.5%), piperitone (1%), aromadendren (0.1%), cis-p-Menten-1-ol (0.01%). Labiatae Mentha crispa compounds identified are: carvone (74%), trans-sabinene Hydra (6%), limonene (3.5%), eucalyptol (1.8 cineol) (3%), pinocarveol (1%), fitol (1 %), carvone oxide (0.5%), beta-citronelol (0.5%), loliolida (0.2%), ethyl palmitate (0.1%).
The research found that fenetol has the highest concentration (69.18%) in rose oil came from Ukraine and the lowest concentration (52.57%) in most of Moldova. Geraniol has the highest concentration in rose oil from Moldova (8.45%) and lowest in the Ukraine (5.84%). Rose oxide is found in the largest quantity of rose oil from Bulgaria (0.1%), followed by 0.07% measured value for oil rose from Moldova. Trans-beta-damascenone was highlighted (0.06%) in oil rose from Moldova. The highest concentrations obtained for linalool were found in oils from Moldova and Bulgaria (0.4%). Nerol has the highest value obtained for oil rose in Moldova (14.5%). Geraniol, although in small quantities, was shown in all three cases with values very close to each other, 2.09% in oil from Moldova, Bulgaria and 1.61% to 1.78% in Ukraine.
Nonadecanul is found in all three areas in the average concentration of 3.8% as heneicosanul about 2%. Highlighted the value of oil rose from tricosan Moldova (1.71%) is higher than those measured in the other two areas of interest, 0.91% (Bulgaria) and 0.74% (Ukraine). The highest value of eicosan was recorded in rose oil from Bulgaria, 0.5%. On average, the highest frequency of large concentrations of aromatic compounds found in rose oils, investigated for the three areas, is found in Moldova.
This probably reflects in the fragance of flowers.

15
Identification of organic compounds from plants is important because their separation and chemical structure knowledge is the essential step to explain of their therapeutic action characteristic. As we have seen, each essential oil has several main components, and one is the characteristic compound that gives the flavor and aroma oil.
Characterization of some biologic active nutrients (volatile compounds, fatty acids, amino acids, therapeutic active compounds) by GC-MS
Methods of extraction were developed, chromatographic separation and spectral identification of vegetable oil (sea buckthorn, vegetable oils, nuts, margarine, fish oil) and quantitative analysis of methylated fatty acids (FAME) and other nutrients by GC-MS
The purpose of this study was to implement a sensitive analytical method for identifying fatty acids, vitamins F and E and sterols in sea buckthorn oil, using mass spectrometry coupled with gas chromatography (GC-MS) [32]. The method was applied to test the lipophilic compounds after irradiation of sea buckthorn oil (Hippophae rhamnoides L) at different doses (kGy) with accelerated electrons. Results are also presented by high performance liquid chromatography (HPLC) [33].
Results and discussion
Following analysis we have seen the significant amount of palmitoleic acid (C16:1) in the pulp and linolenic acid (C18:3) in seeds of sea buckthorn, used in the cosmetics industry, in the manufacture of creams, and also significant amount of unsaturated fatty acids (vitamin F) of sea buckthorn oil, walnut oil, olive oil, sunflower oil, margarine. Sea buckthorn oil contains both saturated and unsaturated fatty acids, depending on the source oil content (pulp, seeds and whole fruit), oil extraction techniques and storage conditions. Most abundant saturated acids are palmitic (C16: 0), stearic (C18: 0) and myristic (C14: 0). Some of the most abundant unsaturated acids in sea buckthorn oil are: palmitoleic (C16: 1 (n-7)), oleic (C18: 1 (n-9)), vaccenic (C18: 1 (n-7)), linolenic (C18: 3 (n-3)), -linolenic (C18: 2 (n-6)) and miristoleic (C14: 1 (n-5)). The high palmitoleic acid in sea buckthorn fruit oil makes be very useful in cosmetics for skin protection. Fish oil is distinguished by higher quantity of unsaturated acids.
GC-MS and HPLC measurements have shown significant quantitative changes of antioxidant vitamins E, F and sterols by irradiation (at different doses kGy) with accelerated sea buckthorn oil electrons, but showed no differences in leaf at different doses irradiation kGy with accelerated electrons. Optimizing treatment for decontamination of sea buckthorn oil is needed to avoid losing important nutrients.
Fatty acid composition analysis showed an average 21% monounsaturated fatty acids (MUFA), 24% for saturated fatty acids (SFA) and 53% for polyunsaturated fatty acids (PUFA) (in MUFA, 16:1 acids (between 5 % and 8%) and 18:1 ω9 (from 14% to 21%) form a considerable proportion of total fatty acids. SFA dominant species were 16:0 (range 15% - 30%) and 18:0 (between 6% and 9%). EPA (20:5 ω3) and DHA (22:6 ω3) were predominant PUFA 30%. MUFA high values in plasma of fish show high nutritional qualityfish.
It has also been developed a sensitive analytical method for determining amino acids derived from plasma, milk and plant samples by isotope dilution technique (ID) -GC/MS. Method involves cleansing, extraction technique of ion exchange and analysis by gas chromatography-mass spectrometry (GC/MS). Another study was to evaluate differences in plasma free amino acids and selenium for Se-methionine diet with 0.05 mg / kg, compared with control palsma. Selenium is an antioxidant that protects against free radical damage. It is important to determine the selenium levels into plasma. Most free amino acids were increased in the two varieties of carp: Lausitz (L) and Galician (O). Essential amino acids are: Arg, His, Leu, Ile, Lys, Met, Phe, THR, TRP and Val. Non-essential free amino acids also increased particularly in the Galician fish plasma. The minimum values of plasma selenium showed elevated above the experimental values compared with control values of carp varieties Lausitz (L) and Galician (O) [34-36].
The developed method is precised and very useful in the analysis of amino acids and fatty acids in different biological environments. Using labelled isotopes as internal standard allows accurate determination of amino acids, fatty acids and avoid overlaps of various contaminants. The methods are very useful in controlling the nutrient and food control.
4. High precision analysis for food control
Foods are natural or processed products containing nutrients (organic and mineral) needed by the body to maintain vital activities. Food quality is a right of consumers with direct effects on life and focused on food quality issues is always the focus of their bodies set up to ensure safety and to protect consumer interests, led by most valuable asset of their status health.
Through various methods of analysis it was demonstrated that living matter is composed of a number of elements almost constant in different percentage ratios. Of these 99.9% are elements that make up all living cells (C, A, H, N, P, F, S, Si, Mg, Cl, K, Na and Ca), being called macronutrients. Modern
16
methods revealed the presence of other bioelements in living organisms, but found in small quantities, micronutrients. Some of these elements are absolutely essential (Ca, Fe, Mg, Na, Co, Ni, Cu, Zn, Cr, Mo, Mn, V, Sn, Si, F, I, Se), other possible essential (Al, Ba , Sr, Rb, B, Li, Ge, Ti), tolerable within certain limits or non-essential (Sb, As, Ge, Hg, Cd, Pb, Au, Ag, Bi), their absence may be substituted by the presence of others. Determining the nature of "essential" of an element is particularly difficult, and biological processes dependent on them, particularly as a function of varying complexity. Their use is made in quantities ranging from grams to million (ppm; 10-6) or parts of one billion (ppb; 10-9), hence their name "macro" and "trace elements".
Excess or deficit of metal ions in the body explains many chemical or pathological conditions, while intermediate levels are essential for normal development. In fact, every body needs optimal concentration of a given element over which or below which no longer grows properly. The accumulation of metals from various foods in some organs, in malignant tumors and correlate these data with geographical variations in cancer mortality rate, indicates the important role that could have environmental factor. A daily topic for modern oenology is the presence of metals in wine. Dispersion of chemicals used in viticulture, such as pesticides, leading to environmental contamination and poor practice cellar, are important factors that directly affect the metal content of wines.
Developing appropriate methods for the determination of metals in drinking water and wine was made using inductively coupled plasma mass spectrometry (ICP-MS). This analytical technique is suitable for multilevel quantitative determinations at trace level (µg/l). A multi-solution can be analyzed in a minute, making a large number of samples which can be analyzed in a very short time at low detection limits, reaching parts per trillion level (ppt 10-12).
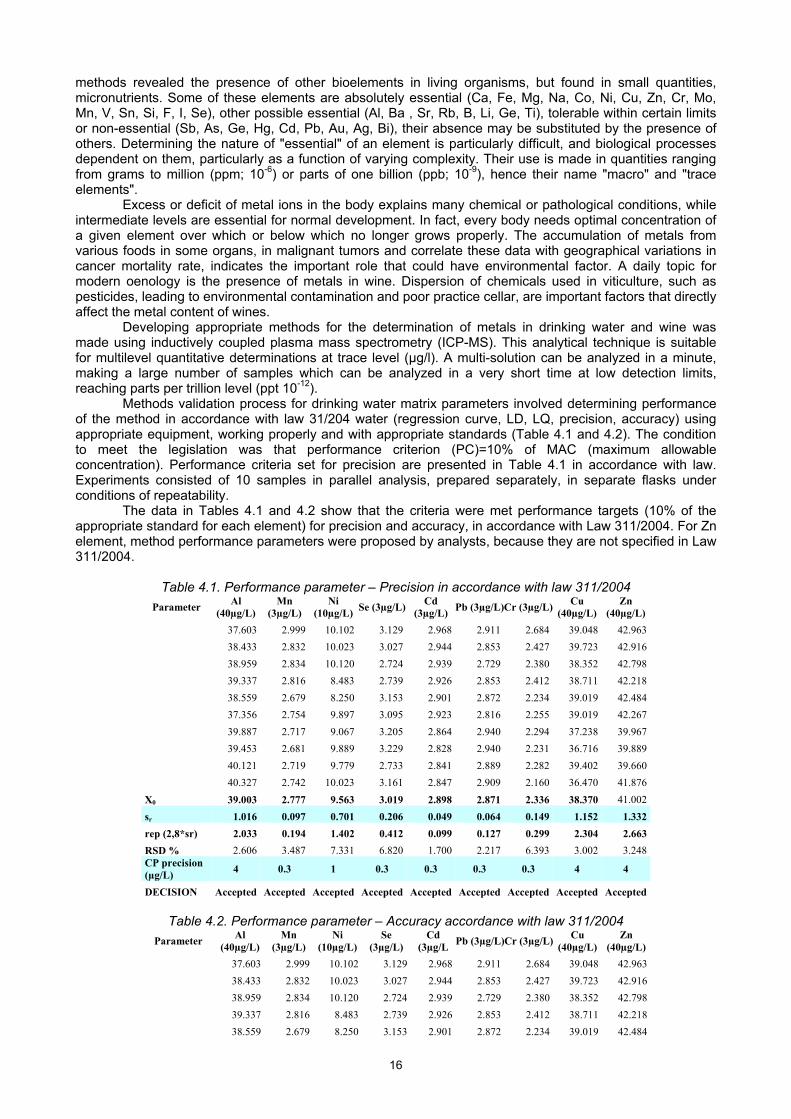
Methods validation process for drinking water matrix parameters involved determining performance of the method in accordance with law 31/204 water (regression curve, LD, LQ, precision, accuracy) using appropriate equipment, working properly and with appropriate standards (Table 4.1 and 4.2). The condition to meet the legislation was that performance criterion (PC)=10% of MAC (maximum allowable concentration). Performance criteria set for precision are presented in Table 4.1 in accordance with law. Experiments consisted of 10 samples in parallel analysis, prepared separately, in separate flasks under conditions of repeatability.
The data in Tables 4.1 and 4.2 show that the criteria were met performance targets (10% of the appropriate standard for each element) for precision and accuracy, in accordance with Law 311/2004. For Zn element, method performance parameters were proposed by analysts, because they are not specified in Law 311/2004.
Table 4.1. Performance parameter – Precision in accordance with law 311/2004
Parameter Al
(40µg/L) Mn
(3µg/L) Ni
(10µg/L)Se (3µg/L)
Cd (3µg/L)
Pb (3µg/L)Cr (3µg/L)Cu
(40µg/L) Zn
(40µg/L)
37.603 2.999 10.102 3.129 2.968 2.911 2.684 39.048 42.963
38.433 2.832 10.023 3.027 2.944 2.853 2.427 39.723 42.916
38.959 2.834 10.120 2.724 2.939 2.729 2.380 38.352 42.798
39.337 2.816 8.483 2.739 2.926 2.853 2.412 38.711 42.218
38.559 2.679 8.250 3.153 2.901 2.872 2.234 39.019 42.484
37.356 2.754 9.897 3.095 2.923 2.816 2.255 39.019 42.267
39.887 2.717 9.067 3.205 2.864 2.940 2.294 37.238 39.967
39.453 2.681 9.889 3.229 2.828 2.940 2.231 36.716 39.889
40.121 2.719 9.779 2.733 2.841 2.889 2.282 39.402 39.660
40.327 2.742 10.023 3.161 2.847 2.909 2.160 36.470 41.876
X0 39.003 2.777 9.563 3.019 2.898 2.871 2.336 38.370 41.002
sr 1.016 0.097 0.701 0.206 0.049 0.064 0.149 1.152 1.332
rep (2,8*sr) 2.033 0.194 1.402 0.412 0.099 0.127 0.299 2.304 2.663
RSD % 2.606 3.487 7.331 6.820 1.700 2.217 6.393 3.002 3.248 CP precision (µg/L)
4 0.3 1 0.3 0.3 0.3 0.3 4 4
DECISION Accepted Accepted Accepted Accepted Accepted Accepted Accepted Accepted Accepted
Table 4.2. Performance parameter – Accuracy accordance with law 311/2004
Parameter Al
(40µg/L) Mn
(3µg/L) Ni
(10µg/L)Se
(3µg/L) Cd
(3µg/L Pb (3µg/L)Cr (3µg/L)
Cu (40µg/L)
Zn (40µg/L)
37.603 2.999 10.102 3.129 2.968 2.911 2.684 39.048 42.963
38.433 2.832 10.023 3.027 2.944 2.853 2.427 39.723 42.916
38.959 2.834 10.120 2.724 2.939 2.729 2.380 38.352 42.798
39.337 2.816 8.483 2.739 2.926 2.853 2.412 38.711 42.218
38.559 2.679 8.250 3.153 2.901 2.872 2.234 39.019 42.484

17
37.356 2.754 9.897 3.095 2.923 2.816 2.255 39.019 42.267
39.887 2.717 9.067 3.205 2.864 2.940 2.294 37.238 39.967
39.453 2.681 9.889 3.229 2.828 2.940 2.231 36.716 39.889
40.121 2.719 9.779 2.733 2.841 2.889 2.282 39.402 39.660
40.327 2.742 10.023 3.161 2.847 2.909 2.160 36.470 41.876
x 39.003 2.777 9.563 3.019 2.898 2.871 2.336 38.370 41.704
Ref value 40.000 3.000 10.000 3.000 3.000 3.000 3.000 40.000 40.000
Accuracy 0.997 0.223 0.437 0.019 0.102 0.129 0.664 1.630 1.704 CPaccuracy ( µg/L)
4 0.3 1 0.3 0.3 0.3 0.3 4 4
DECISION Accepted Accepted Accepted Accepted Accepted Accepted Accepted Accepted Accepted Inductively coupled plasma mass spectrometry is an appropriate analytical technique for multielement quantitative and qualitative determination at trace levels (µg/L), of food samples. The presence of elements like Al, Cr, Mn, Co, Ni, Cu, Zn, Rb, Sr, Ag, Cd, U can influence or change the wine taste and quality of final product. Regarding the method validation, the recovery obtained for extraction was between 80% and 100% for all items recorded in the theoretical limits. It is somewhat similar to concentrations observed in varieties from the same region (Transylvania) and different from other areas of the wine [38]. Maximum allowable concentrations for toxic metals in wines are indicated in the "Decision nr.1134/10.10.2002 Methodological Norms for enforcement of the vineyard and wine into the Common Market Organisation for wine No 244/2002". All wine samples analysed by ICP-MS have contained metals within the maximum limits allowed by law. Another study was based on analysis of a number of 50 samples of wine, different varieties, from the domestic to the foreign-born. To this end, we performed a statistical test to differentiate wines on the variety and region of origin.
Table 4.3. Metals content of some Romanian wines Area Assortment of wine Type of wine Concentration (mg/L)
Al Zn Mn Pb Cu Cd Ni Cr Co Sr Vrancea table wine/2008 dry white 1.61 0.75 1.25 0.09 0.34 0.0015 0.06 0. 21 lod 0.83
Vrancea table wine/2008
semi-dry white
2.84 1.05 0.83 0.11 0.97 0.008 0.08 0.19 lod 1.80
Iasi table wine/2008
semi-dry white
1.66 0.80 1.29 0.04 0.09 0.006 0.06 0.15 lod 0.35
Muntenia Feteasca Regala /2008
dry white 1.89 0.95 1.49 0.08 0.35 0.005 0.08 0.17 lod 0.44
Transilvania Feteasca alba/2005 dry white 3.75 0.32 1.56 0.13 0.22 0.001 0.05 0.3 lod 0.80Transilvania Riesling/2005 dry white 2.70 0.23 1.71 0.1 0.44 0.0011 0.04 0.28 lod 0.54Transilvania
Traminer roz/2005 semi-sweet
white 3.07 0.40 1.72 0.08 0.15 0.0021 0.05 0.19 lod 0.50
Table 4.4. Metal content from wine samples in µg/L
Area Assortment of wine Type of
wine Concentration (μg/L)
Ag Cd Co Ni U
Dob
roge
a
Pinot Gris white 12,1 1.0 1.93 50.9 0.276 Muscat Ottonel white 3.819 4.438 0.972 62.45 0.211
Cardonary white 4.510 7.683 2.964 70.90 0.325 Pinot Noire red 3.099 5.2 2.533 49.534 0.943
Mamaia red 1.889 1.247 2.316 50.53 0.626 Fetească Neagră red 2.247 8.52 0.327 63.036 0.626
Merlot roşu 1.494 4.324 0.122 41.051 0.442 Riesling Italian white 1.249 2.192 2.165 68.973 0.195
Columna white 1.295 1.678 0.204 37.685 0.161 Cabernet Sauvignon white 0.356 3.14 0.13 32.574 0.503
Table 4.5. Metal content from wine samples in mg/L
Area Assortment of
wine Type of
wine Concentratia (mg/L)
Al Cr Mn Cu Zn Rb Sr
Dob
roge
a
Pinot Gris white 2.137 0.226 1.141 0.195 0.667 1.283 0.750 Muscat Ottonel white 2.051 0.262 1.346 0.086 0.561 1.794 0.893
Cardonary white 2.571 0.260 1.211 0.113 0.800 1.810 0.801 Pinot Noire red 3.211 0.219 1.585 0.136 0.316 2.310 1.335
Mamaia red 2.187 0.247 1.480 0.020 0.360 2.178 1.245 Fetească Neagră red 1.921 0.245 1.274 0.095 0.247 0.521 0.643
Merlot red 1.535 0.213 1.200 0.126 0.312 0.845 0.523 Riesling Italian white 2.433 0.294 1.374 0.107 0.430 1.223 0.647
Columna white 2.153 0.224 1.050 0.071 0.414 1.011 0.388 Cabernet Sauvignon white 1.735 0.207 1.483 0.098 0.148 0.378 0.640

18
Ability to distinguish the wines by region of origin based on the analysis of traces of heavy metals (trace) is mainly due to migration of these elements from the soil in the grapes and thus in the final product, the wine. The analysed wine sample will reflect the soil geochemistry of origin, can provide a fingerprint of the wine region of origin, taking into account environmental influences, technological practices, absorption capacity of the plant, which can vary depending on variety vine. It was also intended to implement the analytical method using mass spectrometry coupled with gas chromatography (GC-MS) for analysis of volatile organic compounds, particularly pesticides in wine as an alternative to other analytical techniques, the detection beeing superior to other methods, from order of ppb. Study was applied to determine the efficiency and detection of pesticides in wine like penconazole (1), chlorothalonil (2), folpet (3), propargite (4) and iprodione (5), dimethoate (6), with information that they are used in wine Jidvei resort. Base ions were used for SIM mode by selecting the ions of mass spectra for determination of different pesticide residues (m/z 87) [39].
Our results showed lower values than 100μg/L for pesticides tested, the detection limit beeing of 10μg/L.
Compounds with high toxicity are required to be analyzed at very low concentrations. Analysis of trace level concentrations of pollutants includes ng/kg and lower. It is important that these low concentrations to be measured, because the concentration in the body may be slightly higher than the environment in which it lives.
Other foods that can supplement and provide therapeutic properties are natural juices. Footprint characterize natural juices. Sterols extracted from some fruits: orange, grapefruit, pineapples are: cholesterol, campesterol, ergosterol, beta-stigmasterol, beta-sitostero, isofucosterol and citostadienol. Quantitative composition of sterols in free form or linked, was used to characterize the different varieties of citrus, including grapefruit, orange, Rangpur lime (citrus only contain ergosterol). Free sterols have been reported in strawberry and pineapple. You can also identify volatile compounds. The main volatile compound was limonene, extracted from citrus fruits. If cheaper juice in original juice, some markers were selected. For example to detect the addition of orange juice in grapefruit juice, is used as a marker of a flavonoid, naringin. To detect the addition of apple juice to pear juice, pear-amino acid proline is used as a marker, is in high concentration in the apple.
Our method by GC-MS was used to verify the authenticity of food products using specific biomarkers [40, 41].
The major sterols identified are presented in Table 4.6. The ratio of peaks area per the basic from the mass spectrum can be used to better differentiate between the natural juices and for assessing authenticity.
The most important identifed sterols are cmpesterol, beta-sitosterol and stigmasterol.. Sterols were identified in different citrus fruits, including grape. It is possible to use sterols as indicators of fruit. Chromatographic traces of different fruits vary depending on the concentration of sterols, and there are variations between sterols identified in orange juice, pineapple juice and grapfruit. In the pineapple juice was identified stigmastenone at the retention time of alpha-sitosterol
Table 4.6. Relative intensity of the important ions of the sterols identified in orange juice extract
Tr (min)
Component (identificaţi)
M Pic de bază m/z
Ioni caracteristici m/z(intensitate relativă,%)
11,3 valencene 204 161 91, 93 (65); 105, 107 (60) 133, 204 (50); 147, 189 (37)
14,6 nooklactone 218 147 79, 121 (84); 91, 133 (65) 105,175,203(56)
25,4 campesterol 400 400 315, 382, 367, 289 (50) 145, 213, 255 (30)
25,5 compus C 424 165 424(99), 203, 205 (20) 25.5 ergostanol 402 233 215 (80), 234, 402 (70)
397 (30) 25.7 stigmasterol 412 412 255, 271, 300 (50), 351 (33) 25.7 beta-sitosterol 414 414 329, 396 (50), 303, 381 (40) 26.0 izofucosterol 412 314 281 (34), 229, 299 (26) 26.7 alfa-sitosterol 412 412 27.3 stigmastanol 416 233 416 (70), 215 (65),234, 401 (55) 28.2 stigmast-4-en-3-one 412 124 412 (80), 229 (60), 288, 289 (50) 28.3 citrostadienol 412 285 328 (40), 411, 313 (10), 426 (5)
The method developed for extraction and analysis of significant organic compounds (biomarkers) in natural juices using GC/MS is simple, accurate and fast.
Method GC/MS is useful in checking the authenticity developed natural juices such as orange juice, grep and pineapple. This type of analysis can be used to control the adulteration from food industry (eg the addition of orange juice in juice grep), verifying declared commercial natural juices. The method could also be used in the adulteration control of juice in the food industry.The method presented is very cheap

19
compared to other authentication methods such as isotope ratio mass spectrometry (IRMS) and gas chromatography for chiral enantiomers highlighting used for authentication.
5. High precision analysis for some pollutants and allergens determination Water is one of Europe's key economic resources, its importance is primarily related to the usage as
resource of drinking water, industrial, domestic or agricultural use. Most water treatment plants of the world use chlorine due to its increased effectiveness as disinfecting agent in killing microbes. Unfortunately it was noted that in addition to its advantages, in terms of obtaining drinking water, it presents some disadvantages such as formation of disinfection byproducts from the interaction with natural organic matter (NOM), possessing toxic and carcinogenic properties, such as compounds from the trihalomethanes class (THM). The most common trihalomethanes are: chloroform (CHCl3), bromodichloromethane (CHBrCl2), bromoform (CHBr3) and dibromochloromethane (CHBr2Cl). The accepted maximum concentration is 100 mg/l for total THMs in drinking water according to the USA Environment Protection Agency (USEPA), and from the year 1979, it is below 80 mg/l and should be considered below 40 mg/l.
The comparison of the analytical methods [42]: headspace-GC-MS, headspace-GC-ECD, LLE-GC-MS and purge & trap-GC-MS for quantitative determination of trihalomethanes in drinking water led to the choice of the headspace method of extracting for applications and monitoring, because it is sensitive and simple. Registration and interpretation of mass spectra and pollutants in drinking water led to the establishment of methods of analysis of THMs and of the internal standard. Volatile organic compounds were tested for a suitable internal standard selection. The use of halothane as internal standard allowed the simplification and, at the same time, the increase of precision of the analysis method. After comparing the methods of liquid-liquid extraction (LLE, using as solvent tert-butylether), headspace and purge&trap, the headspace method was chosen to monitor the water, being more simple and ecological, and because there is no need to use solvent extraction.
The development of analytical methods for determining the THMs in drinking water leads to drinking water disinfection optimization that meets both the advantage of the microorganisms destruction from water and the reduced presence of water carcinogenic products, resulting from the reaction of organic compounds with chlorine, ozone or other disinfectant agents. The optimizing of the chlorine or ozone doses will lead to the improvement of the water quality, of the health and life in our country, to the alignment of our country to European legislative requirements by seeking alternative solutions for disinfection of drinking water (coagulation, sedimentation, use of nanomembranes, ultrafiltration, alternative water sources, the removal of THMs precursors from water sources). The highest values were obtained in the warm season, when the amount of organic compounds in water is high.
The HS-GC-MS validation method: standard samples of 20, 40, 60, 80, 100, 200, 300 and 10 μgl-1
THMs and halothane (SI), added to each sample, were extracted and analyzed, determining the regression curves. The precision (40 and 60 μgl-1) gave 14.97-31.95% R.S.D. and 17.93-25.49% RSD respectively, and the accuracy gave 5.07-10.36% RSD for the standard sample of 40 μgl-1 and 6-32% RSD for the standard sample of 60 μgl-1. The LD was 0.1 μgl-1 and the LQ, 1 μgl-1.
There was a very good correlation between the extraction methods: LLE and HS-HS, and the measured values in the distribution system were below 100 μgl-1.
The implemented methods for determining trihalomethanes in water samples using the mass spectrometry technique coupled with gas chromatography proved to be suitable for rapid identification of pollutants.
The studied methods are sensitive, precise and accurate, useful for determining THMs in drinking water at the maximum permissible concentration levels of 100 μgl-1, required by the Romanian and European law. LLE-GC-MS method is faster but it doesn’t allow the concentration of the extract because of the potential loss of analytes by evaporation.
The HS-GC-MS method is advantageous because it doesn’t use solvent in the extraction procedure, it is cheaper, ecological, avoids overlapping with impurities in the solvent (especially for the HS-GC-ECD method).
The PT-GC-MS method is very useful for determining impurities from water through the possibility of increasing their concentration with the increase of the extraction time and of the eluent flow. The HS and PT methods can be automated.
Another important environmental factor is the air, as it is the support where it occurs the fastest transport of pollutants in the environment, so that the air quality monitoring comes first in the monitoring activity. Heavy metals are environmental pollutants and they are nondegradabile, toxic and persistent. The problems associated with heavy metals from the environment have been well documented and studied. Heavy metals are chemical compounds that accumulate in the food chain causing somatic and physiological changes, often irreversible.
With respect to this, a multielemental analysis method, at µg/L trace levels, has been developed, suitable for the control of toxic metals (Cd, Cr, Co, Pb, and Mn) in the environment, from suspended particulate matters, immissions and also a method for optimizing an appropriate extraction procedure for the

20
multi-elemental determination of heavy metals and rare earth traces from soils and sediments, by the ICP-MS technique was developed (Table 5.1).
We also qualitatively determined thirty elements, with different concentrations, ranging from 0.0005 mg/L to 300g/L. Regarding the light metals, the values were obtained in large limits, exceeding even 11 g/kg (Table 5.3).
Table 5.1. The LD and the metal concentrations in suspended particulate matters collected during
August-October 2009 in the industrial area of Valcea county, Oltchim platform (2 samplings/month)
Element
Detection limit LD (ng/m3)
The metal concentrations in suspended particulate matters PM10 fraction (ng/m3) during August – October 2009 (2 samplings/month)
Ni 0.165 3.1437 2.896
4.895 5.341
6.7005 7.352
Cd 0.262 0.1361 0.1288
0.563 0.977
0.7943 1.0237
Cr 1.216 2.2629 2.678
3.788 3.998
8.7413 6.789
Co 0.148 0.3727 0.2556
0.5006 0.6024
0.5399 0.6234
Pb 4.292 18.6997 15.034
27.7076 7.23
4.8879 3.623
Cu 1.655 13.435 12.003
17.4356 18.324
29.4911 30.876
Mn - 19.7501 18.659
15.9634 16.012
25.1578 22.189
To determine the repeatability for metals concentrations, we have used a certified reference
material: Standard Reference Material NCS ZC73006 (SRM NCS ZC 73006). The relative standard deviation has values between 0.4-3.94 mg/kg (Table 5.2). The precision was determined by comparing the measured concentrations with the certified values and was expressed as a percentage of recovery efficiency R (%) [43].
Table 5.2. The concentrations of metals (repeatability)
Replicates Metals [mg/kg]
As V Mn Ni Zn Sr Co Ag Rb Pb Li Cu
1 20.45 103.90 778.15 35.65 75.30 31.10 14.90 1.45 11.80 32.85 36.15 24.40
2 20.35 103.80 790.95 35.50 75.95 31.20 14.85 1.45 11.65 32.80 35.95 24.30
3 20.35 104.65 787.30 36.10 74.50 31.00 14.90 1.35 11.80 33.30 35.70 24.80
4 21.20 103.15 794.70 36.20 75.25 31.65 15.00 1.35 12.10 33.05 36.35 24.30
5 21.20 103.95 793.05 35.45 75.90 30.90 14.90 1.30 12.10 33.55 35.65 24.45
6 20.80 103.50 792.90 35.45 75.45 31.30 15.15 1.35 12.00 33.05 35.80 24.00
7 20.35 103.90 790.70 36.10 75.90 31.30 15.10 1.40 11.90 33.00 35.75 24.50
8 20.85 103.15 799.60 35.60 75.55 31.45 15.30 1.45 11.70 33.30 35.10 24.30
9 20.75 103.95 793.55 35.90 75.15 30.90 15.20 1.45 11.85 32.85 35.70 24.80
10 20.50 104.00 791.80 36.55 75.00 31.40 14.95 1.40 11.75 33.60 35.65 24.60
Average 20.68 103.79 791.27 35.85 75.39 31.22 15.02 1.39 11.86 33.13 35.78 24.44
SD 0.33 0.44 5.58 0.37 0.45 0.24 0.15 0.05 0.158 0.28 0.33 0.24
RSD % 1.61 0.42 0.70 1.05 0.60 0.79 1.02 3.94 1.33 0.87 0.93 1.00

21
Table 5.3. Metals content in soils from different regions: Sălaj, Cluj and Tarniţa
Element Metals concentration [mg/kg]/Soils
1 2 3 4 5 6 7 8 9 10
Region Sălaj Cluj Tulcea
Na 5298.9 5068.7 5003.8 11703.5 8137.0 11231.1 8213.6 1.5 1.5 1.3
Mg 96.1 85.4 111.1 4909.0 4855.3 2453.1 1729.3 0.5 0.5 0.5
Al 10494.8 10542.4 10047.9 12048.9 9942.9 20123.5 21479.5 1.1 1.1 1.09
Si 275547.9 246352.5 281397.0 143985.6 145282.9 199099.9 166766.4 0 0 0
P 242.4 334.5 270.7 483.4 515.8 427.07 380.03 894.4 1046.8 935.6
K 3470.6 3436.6 3126.8 1317.3 1656.8 7767.4 7167.04 0 0 0
Ti 2404.3 2812.8 2556.9 6867.2 6565.8 2716.9 2965.4 1.1 1.1 1.1
V 22.3 33.8 23.2 220.4 189.2 69.1 73.5 57.6 60.0 42.2
Cr 27.6 34.7 19.7 71.7 90.8 47.0 53.7 0 0 0
Mn 294.7 252.4 278.8 769.6 720.4 306.5 377.8 0.7 0.7 0.7
Fe 6067.6 9440.4 7097.8 33578.6 29300.6 16719.9 17237.0 0 0 0
Co 5.3 4.6 4.4 34.6 31.8 11.3 11.7 12.6 12.3 10.1
Ni 9.9 12.4 7.7 42.3 42.9 18.6 24.3 1.6 1.6 26.5
Cu 4.4 5.9 4.08 49.1 40.3 29.8 18.2 2.0 2.0 6.7
Zn 16.6 21.7 17.7 71.9 76.2 49.0 47.3 61.3 100.0 45.3
As 5.3 7.09 5.9 8.2 11.3 8.5 10.7 28.0 35.5 18.2
Sr 24.4 25.8 26.6 30.5 24.2 24.2 21.8 0.6 0.6 0.6
Rb 11.3 8.5 12.9 2.9 2.4 12.9 12.9 15.9 9.7 14.1
Zr 84.9 90.1 71.6 37.06 32.5 53.9 84.6 83.5 78.1 61.4
Mo 0.3 0.3 0.2 0.4 0.5 0.7 0.7 1.4 1.8 0.7
Ag 0.1 0.2 0.1 0.1 0.1 0.2 0.4 0.4 0.4 0.2
Cd 0.07 0.03 0.02 0.3 0.3 0.2 0.1 0.2 0.5 0.1
In 2.8 0.1 0.09 2.7 0.1 2.8 0.3 0.7 0.3 0.3
Sn 0.9 1.5 0.8 1.3 1.9 4.3 4.2 42.4 22.4 4.8
Sb 0.4 0.6 0.5 1.8 1.1 1.8 0.8 0.9 2.4 0.7
Ba 148.4 157.2 144.1 174.7 73.3 213.1 227.2 0.7 0.7 0.7
La 0.2 0.8 0.3 2.7 1.7 3.7 5.8 7.1 6.8 4.9
Ce 10.8 7.5 12.8 16.0 12.4 12.9 18.1 21.5 23.7 18.4
Pr 0.1 0.4 0.1 1.23 0.7 1.3 2.1 2.3 2.4 1.4
W 1.6 1.2 1.05 0.5 1.2 3.08 3.6 1.6 2.5 1.6
Pt 0.03 0.02 0.01 0.01 0.006 0.02 0.02 0.02 0.01 0.01
Au 0.09 0.09 0 0.07 0.1 0.08 0 1.02 0.2 0.6
Hg 0.05 0.1 0.08 0.07 0.1 0.09 0.2 0.4 0.3 0.1
Tl 0.2 0.2 0.2 0.09 0.09 0.6 0.6 0.3 0.4 0.2
Pb 14.4 16.3 14.6 6.7 37.6 27.1 25.02 17.9 36.2 14.1
Bi 0.05 0.09 0.05 0.04 0.2 0.2 0.2 0.1 0.4 0.1
Th 0.6 0.6 0.6 0.2 0.18 1.01 1.8 2.8 3.3 0.9
U 0 0 0 0 0 0 0 1.8 0 1.3
The concentrations were obtained in accordance with the allowed limits for soils, according to the Order 756-1997 for Sb, Ag, Ba, Cd, Mn, Mo, Zn. With regard to toxic metals, for some soils from different areas, the limits are exceeded, being near sensitive alert thresholds (West - Cluj area, South-North -Tulcea area).
Several parameters were considered and evaluated for the methods validation, namely: linearity, detection limit, quantitative determination limit, precision and accuracy.
The extraction efficiency recommended values were obtained for all the microwave extraction methods of the certified reference material. The best extraction method was considered the mixture of three acids (HNO3 + HCl + HF). Several parameters were considered and evaluated for the soils and sediments method validation: the detection limit ranged from (0.0001 - 0.07) mg/kg for the 13 metals studied, good linearity (correlation factor 0.9999 ≥ R ≥ 0996), the results in percentages for recovery are good (80% -110% recovery) for the most of the studied elements. Relative standard deviation ranged between 0.4-3.94 mg / kg. To determine the repeatability for the concentrations of metals, we have used a certified reference material :

22
Standard Reference Material NCS ZC 73006 (SRM NCS ZC73006). The relative standard deviation has values between 0.4-3.94 mg/kg.
The reported results show that the extraction procedure is an essential part in the procedure for measuring metals in soils, sediments, suspended particulate matter and foods.
In the last years, the analysis of the allergenic compounds has become extremely important due to the increasing number of allergic people, associated probably with the increase of pollution and stress. The Scientific Committee on Cosmetics and other non-food products (SCCNFP) of the European Commission recently established a list of 26 substances considered allergenic (Table 5.11). The EU Directive (Directive 2003/15/EC, Official Journal of the European Union, L66/26, 11.3.2003) specifies that for the marketed products (perfumes, cosmetics), any potential allergenic fragrances that are in the product and are under the provisions of labeling (eg. if their concentrations exceed 0.01 wt%), will be placed on the list of ingredients. The analytical method most suitable for precision and accuracy for volatile compounds is the GC-MS technique.
The qualitative and quantitative determination of the allergens present in different oils, fragrances (indoor perfumes, after shave), detergents and soaps, was made using different techniques of extraction and the GC/MS analysis.
The identification and determination of the volatile allergens in 3 types of soap (Rose Pink, Lilac Violet and Onur), Pur liquid detergent, Adidas after shave, commercial car odors and rose oils, using the coupling: gas chromatography-mass spectrometry (GC/MS), were pursued. The method of analysis was the separation by gas chromatography of the extracted compounds from the products listed above, followed by the identification and quantitative determination of these compounds. For the three soaps, headspace extraction method was used.
In Violet Lilac Soap samples, allergenic components were identified, linalool being the allergen which exceeded the accepted maximum amount. In the case of the Pink Rose soap, a greater amount of linalool was determined. However, all the soap allergens identified by us were written on their labels. It was found that commercial products do not always show the presence of allergens on the label, as required by the current legislation.
A comparative study of allergens in perfume odors was made. It was observed that limonene and linalool were in the largest quantities, and for the determined allergens from rose oils from different sources, from Ukraine, Moldova and Bulgaria, it was observed that geraniol was in the largest quantities - a component with a very pleasant smell.
The extraction methods used and the GC/MS analysis method of the allergens contained in cosmetic products are suitable methods for this type of identification. One advantage is the low consumption of solvent for direct injection and for the headspace extraction methods and SPME, the analysis is ecological, there is no solvent consumption. The study found the presence of allergens in cosmetics or perfumes as well as in food. Therefore, the method can be used to test the allergenic volatile components from food, plants, drugs and cosmetics.
The sensitivity of the method was suitable for the determination of allergenic compounds from the analyzed products. The determination of volatile allergens compounds by advanced analysis techniques and the labeling of the products is a topic of great interest to prevent their effects on sensitive subjects.
6. Conclusions The ICP-MS and GC/MS methods are precise and accurate, important in the study of food quality
and pharmaceuticals, and in the control of the environmental pollutants.
The GC-MS coupling meets the special qualities of the two devices, ideal separation by gas chromatography and ideal identification by mass spectrometry.
The ID-MS and ID-GC/MS techniques, using stable isotope labeled compounds, are powerful physical techniques of quantitative analysis at trace levels with high precision, with numerous possibilities of interdisciplinary applications. The using of stable isotope labeled compounds makes possible to avoid contaminants present in samples.
The ICP-MS technique is capable of qualitative and quantitative multi-elemental analysis that can be done quite quickly in comparison with other complementary techniques. Due to its superior sensitivity, ICP-MS method is chosen for most determinations of trace elements.
Selectivity and specificity of the two mass spectrometers give high precision and accuracy analysis. By the high-precision identification of the components to the chromatographic elution time of analyte (analytes), during continuous testing of identity of components analysed, the mass spectrometry method is unique, specific, selective, extremely precious and irreplaceable.

23
Continuous and objective control is necessary by validation of analytical results through both quantitative analysis both to demonstrate that the method is correct and matches the intended purpose, as well as to check whether the analyst has worked correctly.
The ICP-MS and GC-MS methods are useful in the analysis of nutrients (food, beverages, nutritional supplements, vitamins, trace elements).
The determination of biomolecules of therapeutic interest involved conducting pretentious qualitative and quantitative measurement which aimed to determine the compounds of interest at nanograms or picograms levels.
Methods of analysis for the study of the composition of bioactive compounds by mass spectrometry (MS) coupled with gas chromatography (GC-MS) of volatile oils used in food (vermouth, bitter, floratonic, mint, angelica archangelica, chamomile, melisa) and characterization of aroma compounds of essential oils used in treatment (aromatherapy: rose, lavender, basil) were established. Optimal methods for extracting active compounds with therapeutic action were established. Studies to obtain more efficient methods of extraction of organic compounds from a biological matrix are of great importance. For this purpose it was intended that the methods have high extraction efficiency and precision, low consumption of solvents and time. In order to establish the optimum extraction method, liquid-liquid extraction method (LLE) was compared with two different methods on solid phase extraction (SPE on RP-18 silica gel 300 mg of C-18 and tied on 300 mg SPE TCS or "mixed phase"), with microwave extraction method (MWE) and ultrasonic extraction (USE), using a known quantity of a standard mixture of organic compounds. The extraction procedure should not affect the molecular structure of the compounds. Identification of the organic compounds from plants is important because their separation and the knowledge of their chemical structure is essential to explain their typical therapeutic action.
The methods are suitable for trace level determination of aroma compounds in plant extracts. The comparison between the four extraction methods has proved to be useful to characterize bioactive compounds from plants. It was noted that a volatile oil has several main components, one of which is characteristic, basic compound that gives the flavor and aroma to the oil.
Bioactive compounds from different varieties of plants of the same species were comparative analyzed. The observed quantitative and qualitative differences may be due to different varieties, drying procedures, climate, way of storage, etc.. Comparison between different extraction methods has proved useful for characterization of bioactive compounds from medicinal plants.
GC-MS proves to be a useful technique for characterization of flavonoids extracts obtained from plants studied as non-derivative compounds. The comparison of different solvents in terms of the flavonoids showed that hexane and butanol are the most unsuitable solvents for these compounds. It turned out that acetone or aromatic solvents, methyl ethyl ketone and ethyl acetate extraction have a reduced extraction capacity. The best solvents were the alcohols, especially methanol and isopropanol.
Extraction methods, chromatographic separation and spectral identification of vegetable oil (sea buckthorn, olive oil, nuts, margarine, fish oil) and quantitative analysis of methylated fatty acids in fish plasma (FAME) and other nutrients were developed by GC-MS.The developed methods for the analysis of fatty acids from different biological media had a good precision. The high content of palmitoleic acid in sea buckthorn fruit makes the oil to be very useful in skin protective cosmetics. Higher levels of MUFA in plasma of fish show the high nutritional quality of fish. It has also been developed a sensitive analytical method for determining selenium and the amino acids derivatized from plasma, milk and plants samples by isotope dilution (ID) GC-MS technique and ICP-MS. The methods are useful in controlling the nutrients and the food.
The ICP-MS is a multi-element analysis technique suitable for food analysis which allows the control of toxic compounds in food (wine and water) at µg/L levels, providing a high selectivity, sensitivity and extremely low detection limits to other complementary techniques (ICP-AES or AAS). Also for pesticides in wine, control methods have been developed for the extraction and analysis by GC-MS technique, using comparative liquid-liquid extraction (LLE) and solid phase extraction (SPE) techniques.
A method for checking the food authenticity using specific biomarkers was developed by GC-MS. Sterols fingerprint analysis can provide information on adulteration or on the presence of certain fruit juices in the prepared drink.
The implemented methods for determining trihalomethanes in water samples using GC-MS technique proved to be suitable for rapid identification of pollutants. HS-GC-MS method is advantageous

24
because the procedure that uses solvent extraction is cheaper, sustainable, avoids duplication with impurities from solvent (especially for HS-GC-ECD method).
A multi-elemental method of analysis at trace levels µg/L, which is suitable for the control of some toxic metals (Cd, Cr, Co, Pb, and Mn) from the environment, from suspended particulate matter, immissions, was developed.
A method for optimizing an appropriate extraction procedure for multi-elemental determination of heavy metals and rare earth traces from soils and sediments by ICP-MS technique was developed.
The identification and determination of some volatile allergens in 3 types of soap (Pink Rose, Lilac Violet and Onur), Pure liquid detergent, Adidas After Shave, commercial car fresheners and rose oils, using the coupling gas chromatography - mass spectrometry (GC/MS) was pursued. In conclusion, the study found allergens in cosmetics or perfumery and also in food. The determination of volatile allergens by analysis techniques and the labeling of the products is a topic of great interest to prevent their effects on sensitive subjects. It was found that commercial products do not always show the presence of allergens on the label, as required by the mentioned current legislation.
The ICP-MS and GC/MS are powerful physical techniques of quantitative analysis at trace levels with high precision and numerous possibilities of interdisciplinary applications.
Selective references [1] L. Jantschi, Chimie Fizică Analize Chimice şi Instrumentale, Academic Direct, Cluj-Napoca, Cap. 6, 72-
96, 2004 [2] I. Lavagnini, F. Magno, R. Seraglia, P. Traldi, Quantitative application of mass spectrometry, John Wiley
& Ltd.,Cap 2, 37-54, 2006 [3] I. Lavagnini, F. Magno, R. Seraglia, P. Traldi, Quantitative application of mass spectrometry, John Wiley
& Ltd., Cap. 2-3, 37-107, 2006 [4] M. Culea, Spectrometrie de masă. Principii şi aplicaţii, Risoprint, Cluj-Napoca, Cap.1-6, 7-276, 2008 [5] M. McMaster, C. McMaster, GC/MS A practical User’s Guide, Wiley VCH U.S.A, Cap. 1-3, 3-40,1998 [6] H. J. Hubscmann, Handbook of GC/MS. Fundamentals and Applications, Wiley-VCH, Second Completely
Revised and Updated Edition, Cap. 3, 293-415, 2009 [7] M.Culea, E. Culea, Metode fizice de analiza, Risoprint, Cluj-Napoca, Cap. 9, 111-150, 2004 [8] S. Gocan, S. C. Cobzac, Metode moderne de prelucrare a probelor organice, Risoprint, Cluj-Napoca,
Cap. 1-5, 5-48, 2004 [9] P.C. Meier, R. E. Zund, Statistical Methods in Analytical Chemistry, John Wiley & Sons Inc., New York,
94-132, 2000 [10] European Pharmacopoeia 5.0, 1535-1536, 2005 [11] I. Gh. Tanase, A. Pană, G. L. Radu, M. Buleandra, Validarea metodelor analitice. Principii teoretice şi
studii de caz, Printech,Cap. 3, 310-503, 2007 [12] C. Liang, W. Li, B. Xia, Y. Liu X. Yu, Chemistry of Natural Compound, 46, 4, 656-657, 2010 [13] J. Rudback, K. Zohrevand, L. Hagvall, B-A. Persson, U. Nilsson, A.-T. Karlberg, Journal of
Environmental Monitoring, Feb.2011 (for review only) [14] E. Gille, D. Danilă, M. Hanceanu, Romanian Biological Sciences, 4, 3-4, 21-32, 2006 [15] M. D. Sokovic, J. Vukojevic, P. D. Marin, D. D. Brkic, V. Vajs, L. J. K. D. Van Griensven, Molecules, 14,
238-249, 2009 [16] C. Liang, W. Li, B. Xia, Z. Liu, X. Yu, Chemistry of Natural Compounds, 46, 4, 2010 [17] E. Derwich, Y. Benziane, A. Boukir, L. Benaabidate, Chem. Bull. Politehnica Univ. Timisoara, 54, 68, 2,
2009 [18] S. S. Kim, J. S. Baik, T. H. Oh, W. J. Yoon, N. H. Lee, C. G. Hyun, Biosci. Biotechnol. Biochem., 72, 10,
2507-2513, 2008 [19] H. Hafedh, B. Abdallah, S. Meiji, N. Emira, B. Amina, African Journal of Microbiology Research, 4, 11,
1122-112, 2010 [20] J. N. C. Chowdhury, Nandi, M. Uddin, M. Rahman, Bangladesh J. Sci. Ind. Res. , 42, 1, 79-82, 2007 [21] B. J. Seok, S. S. Kim, J.A. Lee, T. H. Oh, J.Y. N H.Lee, C. Gu. Hyun, Journal of Microbiol. Biotechnol.,
18, 1, 74-79, 2008 [22] N. Kalogeropoulos, A. Chiou, A. Mylona, M. Ioannou, N. K. Andrikopoulos, Food Chemistry, 100, 509-
517, 2007 [23] S. Nicoară, M. Culea, N. Palibroda, O. Cozar, Indoor Enviromn., 3 ,83-86, 1994 [24] H. J. Vandenburg, A. A. Clifford, K. D. Bartle, J. Carroll, I. Newton, L. M. Garden, J. R. Dean, C. T.
Costley, Analyst, 122, 101-105, 1997 [25] C. Gherman, M. Culea, C. Onuc, Talanta, 53, 253-262, 2000

25
[26] A. Iordache, M. Culea, O. Cozar, "Chemické listy" Journal, 102, s667-669, 2008 [27] A. Iordache, M. Culea, O. Cozar, Journal of Physics: Conference Series, 182, 1-5, 012027, 2009 [28] C. Mesaros, M. Culea, A. Iordache, O. Cozar, C. Cosma, Bulletin USAMV, Agriculture, 66, 1, 547-548,
2009 [29] A. Iordache, M. Culea, G. Gherman, O. Cozar, Nuclear Instruments and Methods in Physics Research
Section B, 267, 338-342, 2009 [30] A. Iordache, M. Culea, O. Cozar, Processes in isotopes and molecules, PIM-2009, Cluj-Napoca
(JPCS), 26-28 septembrie, 2009 [31] C. Mesaros, M. Culea, A. Iordache, O. Cozar, Bulletin USAMV, Agriculture, 66, 1, 111-117, 2009 [32] A. Iordache, R. Minea, M. Culea, C. Lehene, Chemické listy Journal, 102, s663-664, 2008 [33] C. Mesaroş, A. Iordache, M. Culea, C. Crăciun, O. Cozar, R. Fechete, E Culea, Studia Universitatis
Babeş-Bolyai, Physica, 2, 26-32, 2009 [34] C. Pop, L. Bara, E. Horj, A. Iordache, C. Laslo, M. Culea, Bulletin of USAMV, Agriculture, 67, 2, 373-
377, 2010 [35] A. Iordache, E. Horj, A. Rodica Ani, C. Mesaros, S. Morar, O. Cozar, M. Culea, AIP, 1262,192-197,
2010 [36] A. Iordache, M. Culea, E. Horj, O. Cozar, “Romanian Journal of Physics” (acceptată 2011) [37] A. Iordache, I. Geană, R. Ionete, M. Culea, Progress of Criogenics and Isotopes Separation, 13, 1, 137-
145, 2010 [38] A. Iordache, I. Geana, E. Horj, C. Pop, R. Ionete, Bulletin of USAMV, Cluj-Napoca, Agriculture, 67, 2,
500-510, 2010 [39] A. Iordache, M. Culea, C. Lehene, O. Cozar, Studia Universitatis Babeş-Bolyai, Physica, LIII, 2, 47-56 [40] A. Iordache, M. Culea, O. Cozar, Chemické listy Journal, 102, s665-666, 2008 [41] M. Culea, A. Iordache, O. Cozar, Progress of Cryogenics and Isotopes Separation, 21+22, 27-30, 2008 [42] M. Culea, A. Iordache, O. Cozar, D. Ristoiu, Journal of Environmental Protection and Ecology- JEPE,
10(2), 342-350, 2009 [43] C. Voica, A. Dehelean, A. Iordache, Irina Geana, Romanian Reports in Physics, (acceptată 2012) [44] M. Culea, A. Iordache, O. Cozar, Journal of Environmental Protection and Ecology- JEPE, 11, 2, 523-
528, 2010