study of structural behavior of masonry panels with … · study of structural behavior of masonry...
TRANSCRIPT

Study of structural behavior of masonry panels with
joint reinforcement
Frederico Cabral Fernandes da Cruz Coelho
Extended Abstract
Master’s Degree in Civil Engineering
Supervisor: Prof. António Manuel Candeia de Sousa Gago
July 2016


1
1. Introduction
Nowadays masonry construction at a structural level is increasingly seen as a good option and
starts to be used in Portugal, Europe and in the rest of the world. This fact is related with the
advantages that this type of construction presents, for instance, speed, low costs and constructive
rationality are some of these advantages.
In Portugal and in other high-risk seismic countries the unreinforced masonry construction is
impossible to do, especially for mid-sized buildings, so another alternatives should be explored,
including the reinforced masonry. However, reinforced masonry, which enables the construction
of buildings with several floors in other countries, can only be used in Portugal for small and
medium-sized buildings.
Therefore arises a need to further study the structural behaviour of reinforced masonry solutions.
This need led to the topic of this work, and the scope of which is the study of the structural
behaviour of reinforced masonry. Note that in this work it was also needed to study unreinforced
masonry to study reinforced masonry.
It is also important to say that some investigations have been conducted in this field and these
investigations shows that generally reinforced masonry walls, in comparison with unreinforced
masonry, have a greater resistance to bending and shear stress and shows greater ductility
[1][2][3].
The aim of this work is to study the structural behaviour of reinforced masonry panels with
horizontal reinforcement and deepen the knowledge of these solutions through a series of
experimental tests. In this case, the intention is to show that, when panels are requested by
compressive forces and shearing, the introduction of joint reinforcement is structurally
advantageous in enhancing the wall ductility and wall strength.
Experimental tests performed within this thesis and Robust Brick project are of two types: diagonal
compression and axial/normal compression. These trials were made to evaluate the panels
compressive and shear strength and were conducted on eight wall panels (four to diagonal
compressive tests and four to axial/normal compressive tests). For each type of test, wall
prototypes differ in the type of filled joint and, when used, in the type of reinforcement.

2
2. Experimental campaign
2.1. Materials
2.1.1. Mortar
Regarding the adopted mortar, its composition had the stroke of 1:2:2 (cement : river sand
washed : standard sand) and the cement used was Portland cement of 32,5N . Mortar samples
were tested 28 days after their preparation, and the results of the mortar compression test pieces
are presented on Table 1. Note that the average value for the compressive strength of mortar
specimen is 14.3 KN.
Bending (KN) Compression (KN) Compression (MPa)
0,702 20,37 12,73125
20,53 12,83125
1,416 20,03 12,51875
21,76 13,6
1,321 19,72 12,325
16,58 10,3625
1,44 28,05 17,53125
24,04 15,025
1,315 26,25 16,40625
24,23 15,14375
1,483 27,24 17,025
26,53 16,58125
1,539 26,11 16,31875
28,59 17,86875
1,282 24,33 15,20625
26,7 16,6875
1,398 24,68 15,425
26,28 16,425
1,18 19,74 12,3375
20,21 12,63125
1,275 19,68 12,3
19,71 12,31875
1,073 19,47 12,16875
17,9 11,1875
Table 1 - Results of compression tests on mortar specimens.

3
2.1.2. Masonry units
Regarding masonry units, the adopted masonry material used are thermal bricks of Preceram,
with dimensions 30x19x24. This type of brick generally presents an average resistance to
compression greater than 3 N/mm2. Referring to the same thermal units used on “SeTiverNano”
project [4] they have a higher resistance than 30x20x22 traditional brick resistance.
Bricks Joint 𝐅𝐢.𝐦𝐚𝐱(𝐤𝐍) 𝐟𝐢(𝐌𝐏𝐚) 𝐄 (𝐌𝐏𝐚)
Traditional
(30x22x20) - 78 1220 197
Thermal
(30x19x24)
Discontinuous 170 2512 308
Continuous 248 3675 313
Table 2 - Compressive strength of traditional and thermal masonry blocks [4].
2.1.3. Joint Reinforcement
In this work, and for specimens with continuous and discontinuous joints, two Murfor® galvanized
steel joint reinforcement solutions were used, the RND/Z 5/200 and RND/Z 4/50 respectively.
The quality of the steel used complies with the British Standard BS 4482. This means that the
wire has a tensile strength of at least 550 N/mm2. The shear resistance of the welds is at least
2500 N and both longitudinal wires are intended to ensure a good bond with the mortar [5].
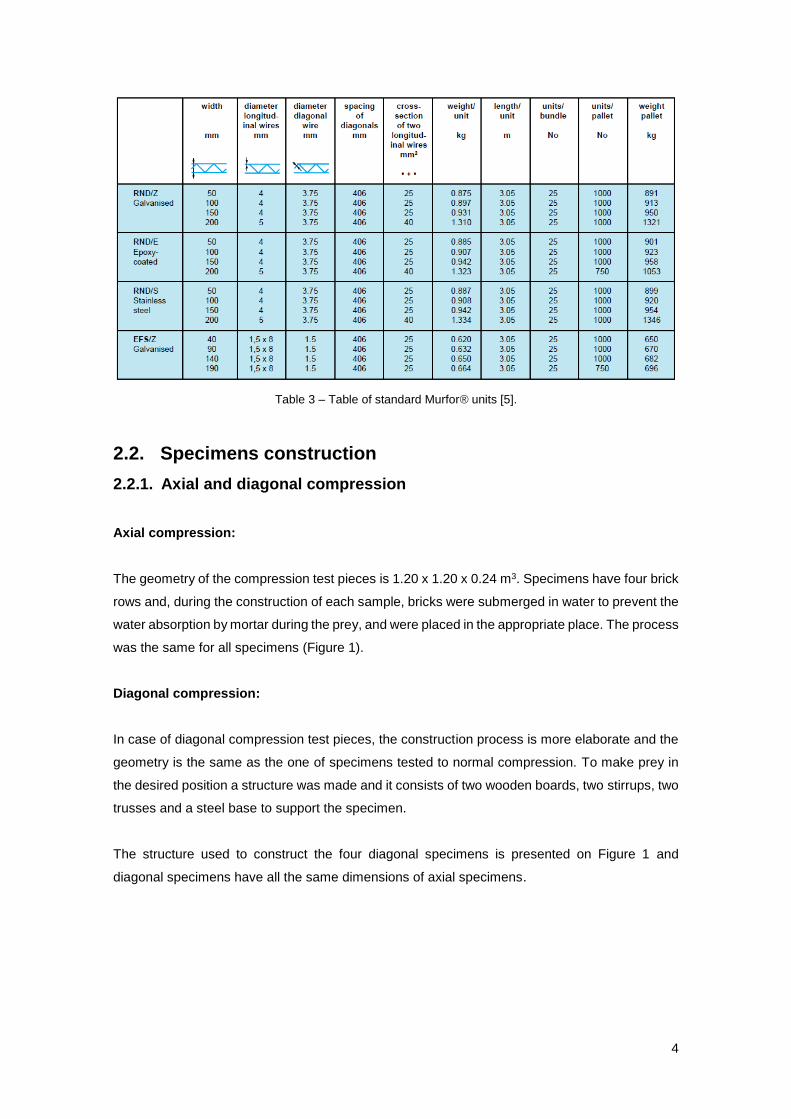
As you can see on the following table, there are several types of Murfor® solutions, i.e.,
reinforcements with various thicknesses and widths. In this case the reinforcements used were
the ones with a thickness of 5mm and 200mm wide (RND/Z 5/200) and other with 4mm thick and
50mm wide (RND/Z 4/50) [5].
In addition, there are three types of standard finishes, which are:
Hot-dipped galvanized wire (…/Z): Have a zinc coat of at least 70 gr/m2, for masonry
exposed to a dry environment;
Epoxy-coated (.../E): Have an epoxy coat of at least 80 microns on galvanized wire, for
masonry exposed to a corrosive environment;
Stainless (…/S): For masonry exposed to an aggressive environment AISI 304;
4
Table 3 – Table of standard Murfor® units [5].
2.2. Specimens construction
2.2.1. Axial and diagonal compression
Axial compression:
The geometry of the compression test pieces is 1.20 x 1.20 x 0.24 m3. Specimens have four brick
rows and, during the construction of each sample, bricks were submerged in water to prevent the
water absorption by mortar during the prey, and were placed in the appropriate place. The process
was the same for all specimens (Figure 1).
Diagonal compression:
In case of diagonal compression test pieces, the construction process is more elaborate and the
geometry is the same as the one of specimens tested to normal compression. To make prey in
the desired position a structure was made and it consists of two wooden boards, two stirrups, two
trusses and a steel base to support the specimen.
The structure used to construct the four diagonal specimens is presented on Figure 1 and
diagonal specimens have all the same dimensions of axial specimens.

5
Figure 1 – Horizontal and diagonal specimens.
2.3. Tests
2.3.1. Compressive tests
The aim of the compressive strength tests was to determine the compressive strength and the
extension associated to the yield stress so as to make a comparative analysis between the
reinforced and non-reinforced specimens, i.e., to verify that if reinforcement increases or not its
compressive strength. The procedure followed in these tests is specified in BS EN 1052-1 (1999)
[6], and as previously stated, the tests were performed on four specimens geometry 1.20 x 1.20
x 0.24 m3.
These compression tests consists on the application of a monotonic and vertical compressive
load until rupture occurs. All axial compressive tests were performed on the same gantry and load
was transmited by an hydraulic jack (of Enerpac brand) with 800KN of load capacity.
The load was measured by a 600KN load cell and was transmitted over a cylindrical rod that was
supported on a metallic beam. This beam is placed on top of the wall and over a plaster
regularized surface.
Until rupture, the load and the vertical deformations/displacements were measured. Vertical
deformations were obtained throughout two readings on one face of the specimen.
Vertical displacements were measured by a TML wire deflectometer with a stroke of 600 mm and
an accuracy of 0.1mm/1x10-6. The location of the measurement samples follows the BS EN 1052-
1 (1999) recommendations, and the average application speed was 1.5mm/min (Figure 2).
6
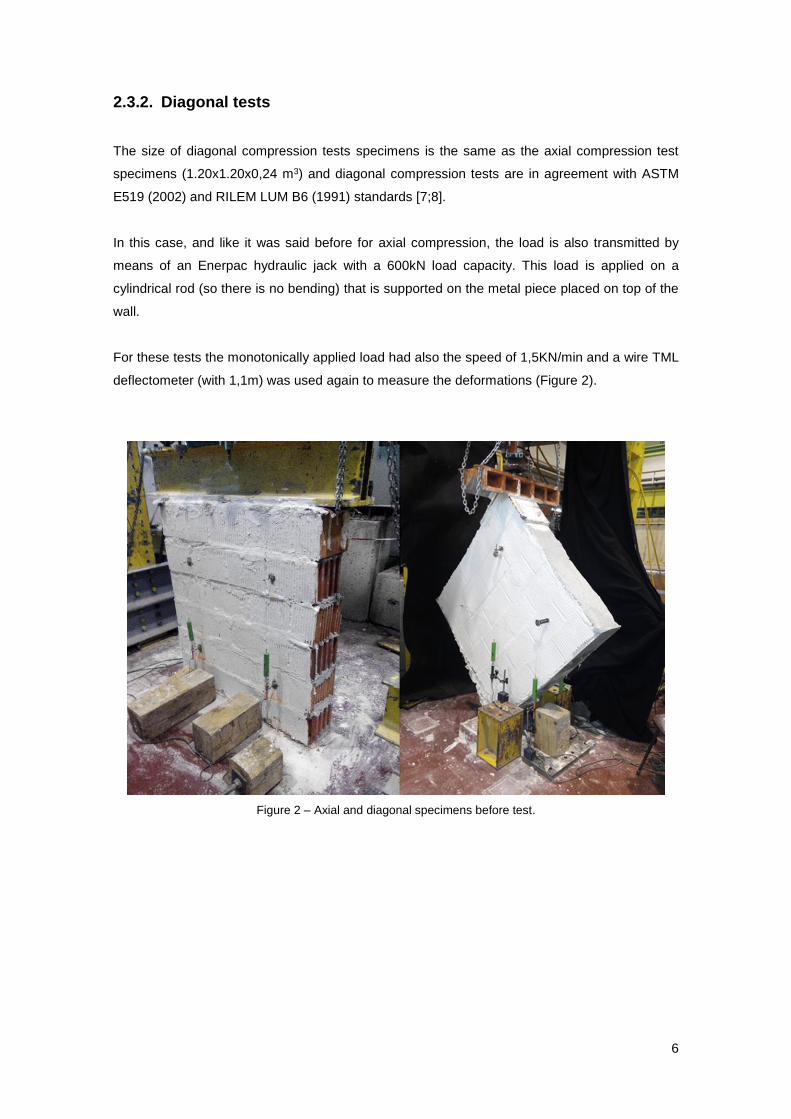
2.3.2. Diagonal tests
The size of diagonal compression tests specimens is the same as the axial compression test
specimens (1.20x1.20x0,24 m3) and diagonal compression tests are in agreement with ASTM
E519 (2002) and RILEM LUM B6 (1991) standards [7;8].
In this case, and like it was said before for axial compression, the load is also transmitted by
means of an Enerpac hydraulic jack with a 600kN load capacity. This load is applied on a
cylindrical rod (so there is no bending) that is supported on the metal piece placed on top of the
wall.
For these tests the monotonically applied load had also the speed of 1,5KN/min and a wire TML
deflectometer (with 1,1m) was used again to measure the deformations (Figure 2).
Figure 2 – Axial and diagonal specimens before test.
7
3. Results and discussion
3.1. Compressive tests
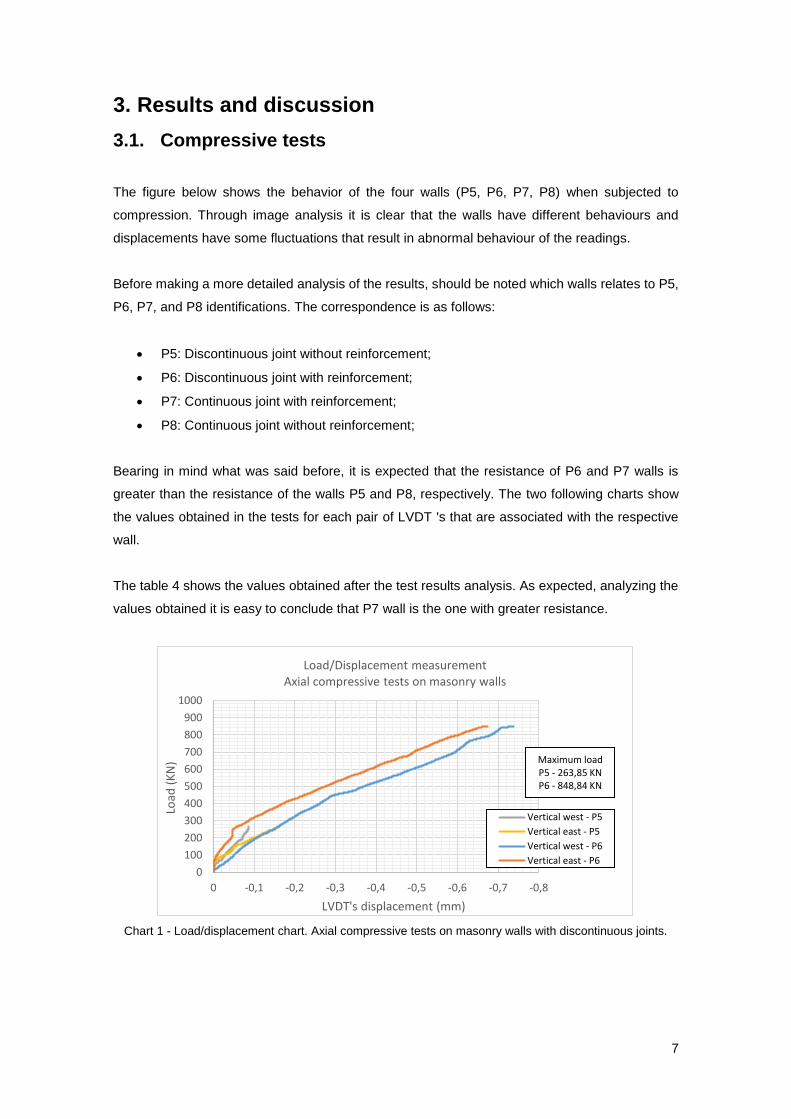
The figure below shows the behavior of the four walls (P5, P6, P7, P8) when subjected to
compression. Through image analysis it is clear that the walls have different behaviours and
displacements have some fluctuations that result in abnormal behaviour of the readings.
Before making a more detailed analysis of the results, should be noted which walls relates to P5,
P6, P7, and P8 identifications. The correspondence is as follows:
P5: Discontinuous joint without reinforcement;
P6: Discontinuous joint with reinforcement;
P7: Continuous joint with reinforcement;
P8: Continuous joint without reinforcement;
Bearing in mind what was said before, it is expected that the resistance of P6 and P7 walls is
greater than the resistance of the walls P5 and P8, respectively. The two following charts show
the values obtained in the tests for each pair of LVDT 's that are associated with the respective
wall.
The table 4 shows the values obtained after the test results analysis. As expected, analyzing the
values obtained it is easy to conclude that P7 wall is the one with greater resistance.
Chart 1 - Load/displacement chart. Axial compressive tests on masonry walls with discontinuous joints.
0
100
200
300
400
500
600
700
800
900
1000
-0,8-0,7-0,6-0,5-0,4-0,3-0,2-0,10
Load
(K
N)
LVDT's displacement (mm)
Load/Displacement measurementAxial compressive tests on masonry walls
Vertical west - P5
Vertical east - P5
Vertical west - P6
Vertical east - P6
Maximum loadP5 - 263,85 KNP6 - 848,84 KN
8
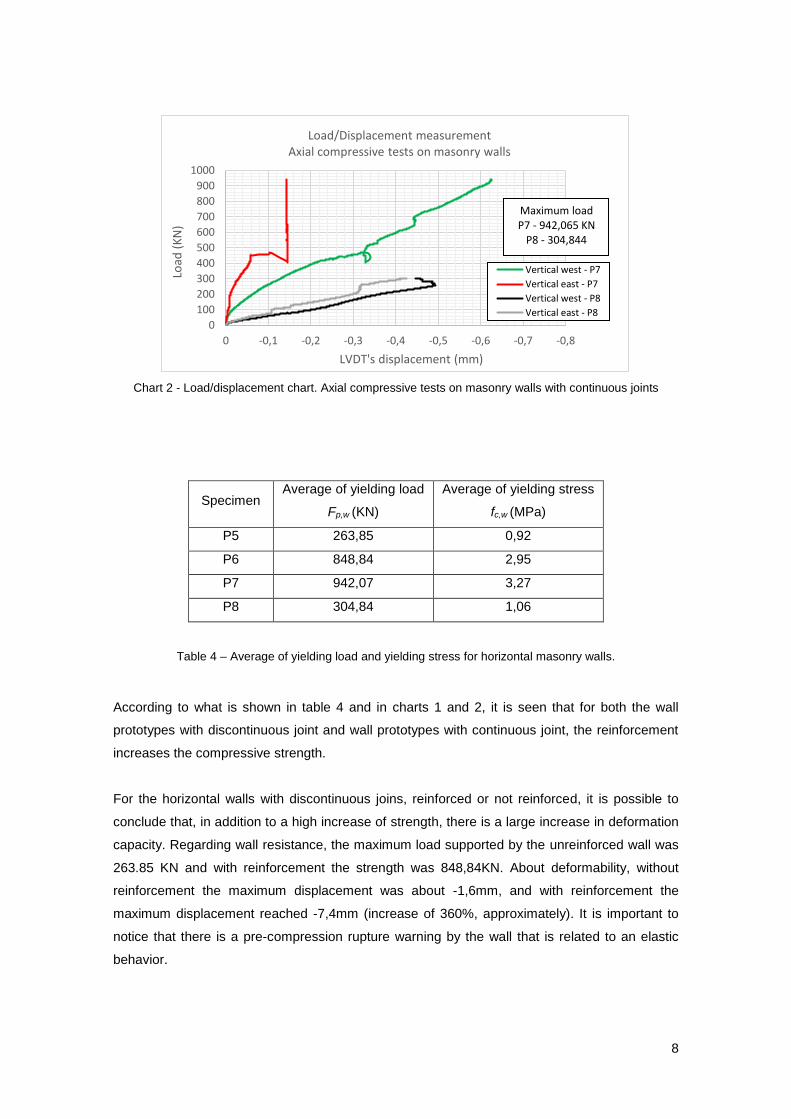
Chart 2 - Load/displacement chart. Axial compressive tests on masonry walls with continuous joints
Specimen Average of yielding load
Fp,w (KN)
Average of yielding stress
fc,w (MPa)
P5 263,85 0,92
P6 848,84 2,95
P7 942,07 3,27
P8 304,84 1,06
Table 4 – Average of yielding load and yielding stress for horizontal masonry walls.
According to what is shown in table 4 and in charts 1 and 2, it is seen that for both the wall
prototypes with discontinuous joint and wall prototypes with continuous joint, the reinforcement
increases the compressive strength.
For the horizontal walls with discontinuous joins, reinforced or not reinforced, it is possible to
conclude that, in addition to a high increase of strength, there is a large increase in deformation
capacity. Regarding wall resistance, the maximum load supported by the unreinforced wall was
263.85 KN and with reinforcement the strength was 848,84KN. About deformability, without
reinforcement the maximum displacement was about -1,6mm, and with reinforcement the
maximum displacement reached -7,4mm (increase of 360%, approximately). It is important to
notice that there is a pre-compression rupture warning by the wall that is related to an elastic
behavior.
0
100
200
300
400
500
600
700
800
900
1000
-0,8-0,7-0,6-0,5-0,4-0,3-0,2-0,10
Load
(K
N)
LVDT's displacement (mm)
Load/Displacement measurementAxial compressive tests on masonry walls
Vertical west - P7
Vertical east - P7
Vertical west - P8
Vertical east - P8
Maximum loadP7 - 942,065 KN
P8 - 304,844

9
Regarding horizontal walls with continuous joint (chart 2), when joint reinforcement is used there
is an increase of wall strength (302,844KN vs 942,065KN) as well as an increase of the wall
deformability. However, this increased deformability is not as significant when compared with the
increase occurred for the walls with discontinuous joint (in this case the increase was around
30%). It is also important to bear in mind that the progress of “vertical east – P7” LVDT curve is
reflects the saturation of the transistor.
Taking into account the implementation cost of each solution, as well the fact that the compressive
strength of the walls with discontinuous and continuous joint does not differ too much, it is possible
to conclude that there is no great gain when two reinforcements are used on discontinuous joints.
Furthermore, and even when evaluating deformability, the difference between the maximum
displacements of the two wall types is 1mm, so, regarding costs, is not justified to use the double
joint reinforcement. On the other hand, when thermal isolation is an aspect to take into account,
it may be appropriate to use two joint reinforcements.
3.2. Diagonal tests
The main objective of the diagonal compression test to determine the rupture strength, related
with the maximum shear strength, the failure mechanisms and load-displacement diagrams.
Before describing the test results it is important to notice which type of walls relates to P1, P2,
P3, and P4 identifications. The correspondence is as follows:
P1: Continuous without reinforcement;
P2: Discontinuous without reinforcement;
P3: Discontinuous with reinforcement;
P4: Continuous with reinforcement.
It is expected that the strength of P1 and P2 walls is lower than the resistance of P3 and P4 walls,
respectively. For the analysis of the following charts, it is possible to perceive that the walls have
relatively similar behavior and the resistance differences are related with the type of wall.
10
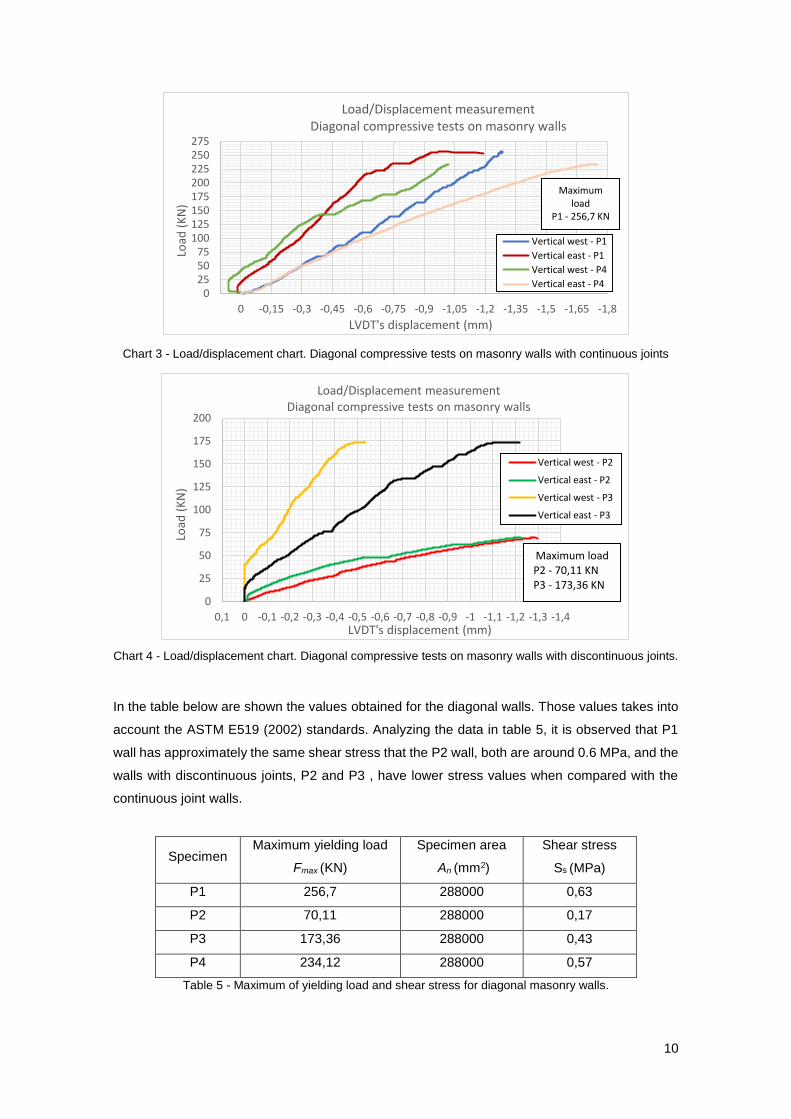
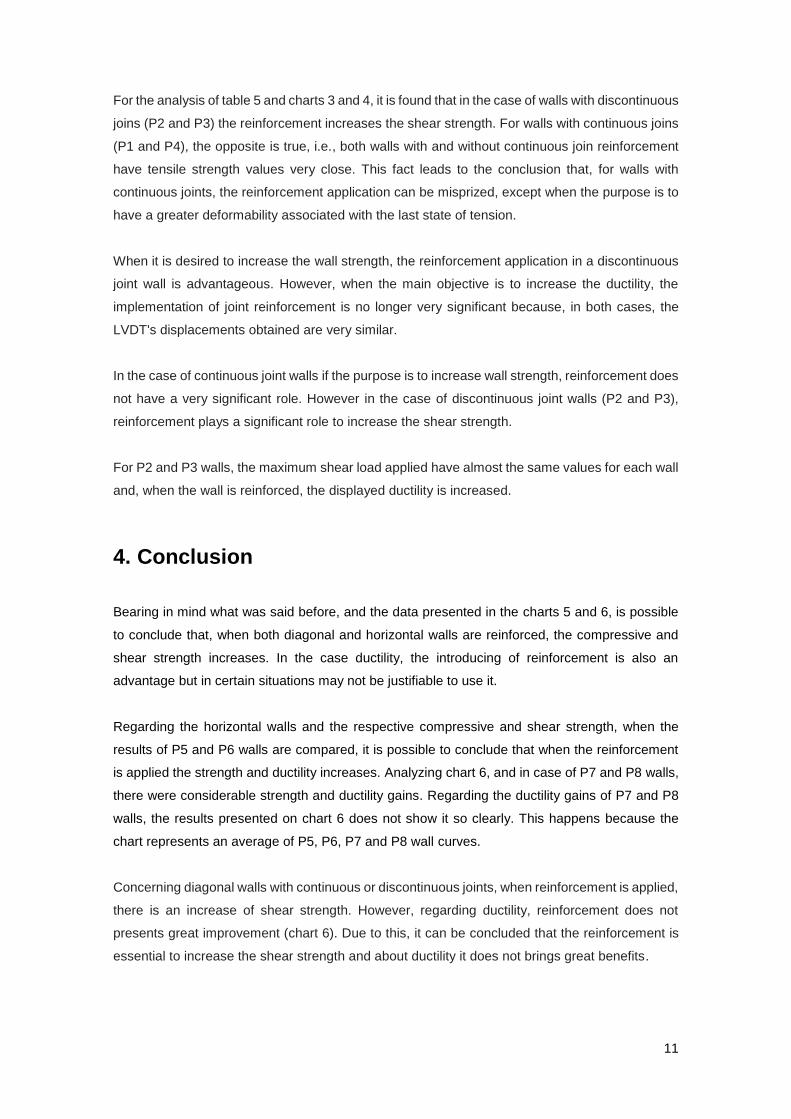
Chart 3 - Load/displacement chart. Diagonal compressive tests on masonry walls with continuous joints
Chart 4 - Load/displacement chart. Diagonal compressive tests on masonry walls with discontinuous joints.
In the table below are shown the values obtained for the diagonal walls. Those values takes into
account the ASTM E519 (2002) standards. Analyzing the data in table 5, it is observed that P1
wall has approximately the same shear stress that the P2 wall, both are around 0.6 MPa, and the
walls with discontinuous joints, P2 and P3 , have lower stress values when compared with the
continuous joint walls.
Specimen Maximum yielding load
Fmax (KN)
Specimen area
An (mm2)
Shear stress
Ss (MPa)
P1 256,7 288000 0,63
P2 70,11 288000 0,17
P3 173,36 288000 0,43
P4 234,12 288000 0,57
Table 5 - Maximum of yielding load and shear stress for diagonal masonry walls.
0255075
100125150175200225250275
-1,8-1,65-1,5-1,35-1,2-1,05-0,9-0,75-0,6-0,45-0,3-0,150
Load
(K
N)
LVDT's displacement (mm)
Load/Displacement measurementDiagonal compressive tests on masonry walls
Vertical west - P1
Vertical east - P1
Vertical west - P4
Vertical east - P4
Maximum load
P1 - 256,7 KN
0
25
50
75
100
125
150
175
200
-1,4-1,3-1,2-1,1-1-0,9-0,8-0,7-0,6-0,5-0,4-0,3-0,2-0,100,1
Load
(K
N)
LVDT's displacement (mm)
Load/Displacement measurementDiagonal compressive tests on masonry walls
Vertical west - P2
Vertical east - P2
Vertical west - P3
Vertical east - P3
Maximum loadP2 - 70,11 KNP3 - 173,36 KN
11
For the analysis of table 5 and charts 3 and 4, it is found that in the case of walls with discontinuous
joins (P2 and P3) the reinforcement increases the shear strength. For walls with continuous joins
(P1 and P4), the opposite is true, i.e., both walls with and without continuous join reinforcement
have tensile strength values very close. This fact leads to the conclusion that, for walls with
continuous joints, the reinforcement application can be misprized, except when the purpose is to
have a greater deformability associated with the last state of tension.
When it is desired to increase the wall strength, the reinforcement application in a discontinuous
joint wall is advantageous. However, when the main objective is to increase the ductility, the
implementation of joint reinforcement is no longer very significant because, in both cases, the
LVDT's displacements obtained are very similar.
In the case of continuous joint walls if the purpose is to increase wall strength, reinforcement does
not have a very significant role. However in the case of discontinuous joint walls (P2 and P3),
reinforcement plays a significant role to increase the shear strength.
For P2 and P3 walls, the maximum shear load applied have almost the same values for each wall
and, when the wall is reinforced, the displayed ductility is increased.
4. Conclusion
Bearing in mind what was said before, and the data presented in the charts 5 and 6, is possible
to conclude that, when both diagonal and horizontal walls are reinforced, the compressive and
shear strength increases. In the case ductility, the introducing of reinforcement is also an
advantage but in certain situations may not be justifiable to use it.
Regarding the horizontal walls and the respective compressive and shear strength, when the
results of P5 and P6 walls are compared, it is possible to conclude that when the reinforcement
is applied the strength and ductility increases. Analyzing chart 6, and in case of P7 and P8 walls,
there were considerable strength and ductility gains. Regarding the ductility gains of P7 and P8
walls, the results presented on chart 6 does not show it so clearly. This happens because the
chart represents an average of P5, P6, P7 and P8 wall curves.
Concerning diagonal walls with continuous or discontinuous joints, when reinforcement is applied,
there is an increase of shear strength. However, regarding ductility, reinforcement does not
presents great improvement (chart 6). Due to this, it can be concluded that the reinforcement is
essential to increase the shear strength and about ductility it does not brings great benefits.

12
For continuous joints, it is important to bear in mind that reinforcement could not be advantageous
because the difference between P1 and P4 walls strength is not meaningful. Due to this, if joint
reinforcement is avoided, it is possible to obtain a more economical solution.
Chart 5 – Load/displacement average measurements of diagonal compressive tests.
Chart 6 - Load/displacement average measurements of horizontal compressive tests.
0
25
50
75
100
125
150
175
200
225
250
275
-1,5-1,3-1,1-0,9-0,7-0,5-0,3-0,1
Load
(K
N)
LVDT's displacements (mm)
Load/Displacement average measurementDiagonal compressive tests on masonry walls
Average - P1
Average - P2
Average - P3
Average - P4
Maximum loadP1 - 256,7 KNP2 - 256,7 KN
P3 - 173,36 KNP4 - 234,12 KN
0
100
200
300
400
500
600
700
800
900
1000
-0,75-0,65-0,55-0,45-0,35-0,25-0,15-0,05
Load
(K
N)
LVDT's displacements (mm)
Load/Displacement average measurementDiagonal compressive tests on masonry walls
Average - P5
Average - P6
Average - P7
Average - P8
Maximum loadP5 - 263,85 KNP6 - 848,84 KN
P7 - 942,065 KNP8 - 304,844

13
With the realization of axial and diagonal compressive tests, it is intended to show that
compressive strength, shear strength and ductility increases when reinforcement is introduced.
In fact there was a strength gain but, sometimes in certain situations previously referred, the
reinforcement cannot be required.
To conclude, due to the fact that each type of wall was tested only once and, in order to validate
more consistently the tests results, more tests with other solutions and materials would be
something interesting to perform in the future. It would also be interesting to study with more detail
the vertical reinforcement influence on shear strength of masonry walls prototypes. Another type
of tests that can also be performed are the triplet tests, which studies in a more detailed way the
influence of the vertical and horizontal joint reinforcement.

14
5. References
[1] – McKenzie, W. M. C., “Design of Structural Masonry", Palgrave, 2001;
[2] – Drysdale, R.G., Hamid, A.A., Baker, R.L., “Masonry Structures Behavior and Design,” 1999;
[3] – Haseltine B., "Design of Masonry Structures", Volume 11, 1983;
[4] – Grilo, I., “Relatório de bolsa - Projecto Se Tiver Nano.”, 2012;
[5] – Bekaert, “Murfor® - Reinforcement for masonry”;
[6] – BS EN 1052-1 (1999). Methods of test for masonry. Determination of compressive strength. British-Adopted European Standard;
[7] – ASTM E519, (2002). Standard Test Method for Diagonal Tension (Shear) in Masonry
Assemblages. American Society for Testing Materials;
[8] – Rilem Lumb 6, (1991) Diagonal Tensile strength. Tests of Small Wall Specimens. TC 73-LUM.