study of the contribution of the upr to tnf- mediated ... · resume tumour necrosis factor (tnf) is...
TRANSCRIPT

1
Study of the contribution of the UPR to TNF-mediated inflammatory response and cell death
induction
Céline PIERARD
Master’s dissertation submitted to obtain the degree of
Master of Science in Biochemistry and Biotechnology
Major Biomedical Biotechnology
Academic year 2015-2016
Promoter: Prof. Dr. Mathieu Bertrand
Scientific supervisor: Dr. Diego Rojas-Rivera
VIB – Inflammation Research Center
Department Biomedical Molecular Biology
Unit Molecular Signaling and Cell Death
Subunit Molecular and Cellular Signaling under Stress

2
Preface
“For the things we have to learn before we can do them, we learn by doing them.”
-Aristotles, The Nicomachean Ethics-
To make any project, guidance and references are essential without which a project is incomplete. I am very much thankful for my promotor Prof. Dr. Mathieu Bertrand who gave me the opportunity and motivation to gain knowledge from my master dissertation. The knowledge acquired during this period will certainly help me a lot in my career.
I am also very thankful to Dr. Diego Rojas Rivera for the help and support he gave me for the duration of my dissertation. He inspired me to perform the best work I could and
represented a valuable input of information to help me in my master dissertation.
I am also obliged by all the people in the lab of Prof. Dr. Peter Vandenabeele, who contributed to this master dissertation by providing a helping hand in times of need.
At last but not least, I am very thankful to my family and friends, who directly or indirectly helped during the duration of my master dissertation.
Thank you.

3
Table of Contents
List of Abbreviations ................................................................................................................... 4
Resume ....................................................................................................................................... 6
1. Introduction ........................................................................................................................ 8
1.1. Inflammation and Tumour Necrosis Factor (TNF) ....................................................... 8
1.1.1. TNFR1 signalling to NF-B .................................................................................... 9
1.1.2. TNFR1 signalling to cell death ............................................................................ 10
1.2. Endoplasmic reticulum stress and the Unfolded Protein Response ......................... 14
1.2.1. Functional role of endoplasmic reticulum (ER) and its relationship to ER stress 14
1.2.2. The unfolded protein response (UPR) ................................................................ 15
1.3. The relationship between ER stress, UPR and inflammation .................................... 18
1.3.1. Pathways that connect UPR to inflammation .................................................... 18
1.3.2. The role of the UPR in PRR-response activation ................................................ 19
2. Aims ................................................................................................................................... 20
3. Results ............................................................................................................................... 22
3.1. The activation of the UPR by TNF .............................................................................. 22
3.1.1. Activation of the IRE1 branch by TNF .............................................................. 22
3.1.2. Activation of the PERK branch by TNF ............................................................... 30
3.2. Contribution of the IRE1 endonuclease activity to the TNF response .................... 32
3.2.1. Gene activation .................................................................................................. 32
3.2.2. Cell death induction ........................................................................................... 36
4. Discussion .......................................................................................................................... 38
5. Materials and Methods ..................................................................................................... 46
References ................................................................................................................................ 49
Addendum ................................................................................................................................ 55
List of Abbreviations
4
List of Abbreviations
A20/TNFAIP3 TNF alpha induced protein 3
ATF6 Activating Transcription Factor 6
BiP/Grp78 Immunoglobulin heavy chain binding protein/glucose related protein 78
Caspase Cysteine-Aspartic Proteases
CHOP Transcription factor C/EBP homologous protein
cIAP cellular inhibitor of apoptosis protein
CYLD Lysine 63 Deubiquitinase (Cylindromatosis)
DAMPs Damage/Danger Associated Molecular Patterns
DUB deubiquitylase
eIF2α eukaryotic initiation factor 2 alpha
ER endoplasmic reticulum
ERAD ER-associated degradation
ERSE ER stress response element
FADD Fas Associated Via Death Domain
GADD34 growth arrest and DNA damage-inducible 34
Grp48/Hsp90 glucose related protein of 94kDa/ Heat shock protein 90
Hac1 homolog of ATF/CREB1
HOIL Heme-Oxidized IRP2 Ubiquitin Ligase
HOIP HOIL-1-interacting protein
IFN interferon
IKK IκB kinase
IL Interleukin
IRE1 inositol-required protein 1
IκBα Inhibitor of nuclear factor-kappa B
JNK c-Jun N-terminal kinase
LUBAC Linear Ubiquitin Chains Assembly Complex
MAPK Mitogen Activated Protein Kinase
MYD88 myeloid differentiation primary response 88
NEMO NF-Kappa-B Essential Modifier
NF-κB Nuclear Factor kappa light-chain-enhancer of activated B cells
NLR NOD-like receptor
NOX8 NADH oxidase 8

List of Abbreviations
5
PAMPs Pathogen Associated Molecular Patterns
PDI Protein Disulphide Isomerase
PERK Protein kinase RNA (PKR)-like ER kinase
PRR Pattern Recognition Receptors
RIDD Regulated Ire1-Dependent Decay
RIG-1 Retinoic acid Inducible Gene
RIPK1 Receptor-interacting serine/threonine-protein kinase 1
S1P Site-1-protease
SHARPIN SHANK Associated RH Domain Interactor
TAB TGF-Beta Activated Kinase 1/MAP3K7 Binding protein 2
TAK1 Transforming Growth Factor-Beta-Activated Kinase 1
TIRAP TIR domain-containing adaptor protein
TLR Toll-like receptor
TNF Tumour Necrosis Factor
TNFR1 Tumour Necrosis Factor Receptor 1
TRADD Tumour Necrosis Factor Receptor type 1- associated DEATH domain protein
TRAF2/5 TNF receptor-associated factor 2/5
UBD Ubiquitin Binding Domain
UPR unfolded protein response
XBP1 X-box binding protein 1

Resume
6
Resume
Tumour Necrosis Factor (TNF) is a pleiotropic cytokine that plays a major role in orchestrating the inflammatory response. The unfolded protein response (UPR), well known for its role in ER homeostasis, is emerging as a new signaling network that contributes to the host inflammatory response. Dysregulation in both pathways has been reported to contribute to the development of various inflammatory diseases such as Alzheimher’s
disease, metabolic diseases, neurodegenerative diseases and cancer. As TNF biologics are the main therapeutics used nowadays, more interest is focused on finding new therapeutic targets such as the UPR. However, the exact physiological mechanisms that activate the UPR (or part of it) and the precise contribution of the different UPR branches to inflammation are currently unclear. Here, were report that TNF specifically activates the endoplasmic reticulum (ER) stress sensor IRE1 and its downstream target, the transcription factor XBP1s without inducting the transcription of classical XBP1s target genes that respond to ER stress,
and activating IRE1-dependent decay (RIDD). Instead, TNF was required for phosphorylation of eIF2. Additionally, TNF-induced IRE1 endonuclease activity was required for the production of anti-inflammatory cytokine IL-10 and for the protection against TNF-induced necroptosis. Our findings preliminary show the potential interconnection between TNF signalling and part of the UPR.

Resume
7
Tumour Necrosis Factor (TNF) is een cytokine die een belangrijk is in de coördinatie van de onstekingsreactie. De “unfolded protein response” is voornamelijk gekend voor het behoud van de ER homeostasis. Nu wordt de reactie als een belangrijk signaalnetwerk in inflammatie voorgesteld. Ontregeling van beide reacties is gekoppeld aan de ontwikkeling van verscheidene inflammatoire ziekten zoals de ziekte van Alzheimer, neurodegenerative ziekten, metabolische ziekten en zelfs kanker. Tegenwoordig zijn therapiën die gericht zijn
tegen TNF de voornaamste medicijne voor de behandeling van chronische onstekingsziekten. Daarom is de interesse in de ontwikkeling van nieuwe therapiën groot en is de UPR een sterke kandidaat. Nochtans is het volledig mechanisme dat de UPR activeert, zowel op cellulaire als moleculair vlak, nog niet helemaal opgeklaard. Hiernaast is de bijdrage van de UPR bij de TNF signaalweg ver van gekend. In deze studie rapporteren we de specifieke activering van het IRE1-XBP1 pad, namens de activering van IRE1 endonuclease activiteit en klieving van XBP1 mRNA , zonder de activering van de klassieke XBP1-doelgenen en inductie van IRE1 -dependent decay (RIDD). Hiernaast, blijkt dat TNF-geïnduceerde IRE1
endonuclease activiteit nodig is voor de productie van IL-10, een cytokine die anti-inflammatorisch werkt. IRE1 endonuclease activiteit beschermt ook tegen de inductie van necroptosis door TNF. De resultaten gegenereerd tijdens deze thesis, geven een vooruitgaande visie op een mogelijke interactie tussen TNF en een deel van het UPR.

Part 1: Introduction
8
1. Introduction
1.1. Inflammation and Tumour Necrosis Factor (TNF)
Inflammation is the first response of the immune system to infection or tissue injury. Although essential for the host defence against these insults, inflammation needs tight
regulation since excessive inflammation results in unnecessary damage that ultimately leads to dysfunction and diseases. An inflammatory response is initiated by the sensing of “stress” signals by members of the innate immune pattern recognition receptors (PRRs) superfamily (Takeuchi & Akira, 2010). These “stress” signals are endogenous intracellular damage/danger associated molecular patterns (DAMPs) exposed or released by dying cells and/or conserved microbial components called pathogen associated molecular patterns (PAMPs) (Chen & Nuñez, 2010). Upon binding to their respective agonists, many PRRs activate signalling
pathways, such as the Mitogen-Activated Protein Kinase (MAPK) and Nuclear Factor-B (NF- B) pathways, which collectively lead to the transcriptional upregulation of genes encoding inflammatory mediators, including pro-inflammatory cytokines, chemokines, type I interferons (IFNs) and anti-microbial peptides. Other PRRs do not activate transcription factors. Instead, they lead to the assembly of large multiprotein complexes, known as the inflammasomes, which regulate the proteolytic maturation of the pro-inflammatory cytokines Interleukin-1β (IL-1) and IL-18. Tumour necrosis factor (TNF), IL- and IL-6 are major pro-inflammatory cytokines that are induced after DAMP/PAMPs sensing. They
orchestrate the inflammatory response by regulating cell death in the inflamed tissue, modification of the vascular endothelial permeability, recruitment of blood cells to the inflamed tissue and production of acute-phase proteins. TNF promotes inflammation by inducing further production of cytokines and chemokines. It also regulates the eventual death of inflammatory cells as well as other cell types. Accordingly, defective TNF signalling is one of the established drivers of chronic inflammatory disorders such as Alzheimer’s disease, psoriasis, cancer and inflammatory bowel disease (IBD), and has therefore been
investigated to become a main pharmacological target in these diseases. Although initially believed to solely exacerbate inflammation by activating the MAPKs and NF-B signalling pathways, which drive the expression of various pro-inflammatory mediators, recent studies have demonstrated that TNF also induces inflammation by inducing of cell death, in the form of apoptosis or necroptosis (Ting and Bertrand, 2016).
TNF signals by binding and activating two cell surface receptors, TNFR1 and TNFR2. TNFR1 is constitutively expressed in most tissues while the expression of TNFR2 is highly regulated
and typically found in cells which are part of the immune system as well as in endothelial cells (Faustman & Davis, 2010). In response to TNF binding, both TNFR1 and TNFR2 can lead to the activation of the NF-B signalling pathways. TNFR1 activates the canonical NF-B pathway while TNFR2 is reported to activate both the canonical and non-canonical NF-B pathways (Wajant et al, 2003). In contrast to TNFR2, TNFR1 also has the ability to signal to cell death. This particularity originates from the fact that the two receptors differ in their intracellular domains. TNFR1 contains a ‘death domain’ that enables recruitment, via
homotypic death domain interactions, of TNFR1-associated death domain protein (TRADD)
and of the serine-threonine kinase receptor-interacting protein kinase 1 (RIPK1). Both
proteins are a crucial component of the TNFR1 signalling complex, and are involved in cell death triggered by TNFR1. TNFR2 lacks the cytoplasmic death domain sequence and thus

Part 1: Introduction
9
recruits TNFR-associated factor 1 (TRAF1) and TRAF2 instead of TRADD/RIPK1 (Hsu et al, 1995; Rothe et al, 1995). Even though TNF binds to both TNFR1 and TNFR2, most of the biological activity is associated with TNFR1 signalling. For this reason, I will focus on TNFR1 signalling
1.1.1. TNFR1 signalling to NF-B
NF-B refers to a group of dimeric transcription factors that are members of the NF-B/Rel family. They play important roles in immunity. A huge number of inflammatory-related genes are transcriptionally activated by NF-B proteins in response to sensing of DAMPs/PAMPs, cytokines, and some kind of physical stress, incl. reactive oxygen species, UV radiation. NF-B also influences the expression of genes that impact cell survival and proliferation. This is an important function of NF-B as it plays a role in regulating the apoptotic machinery triggered by TNF. As a result of the broad functionality of NF-B, its dysregulation has severe consequences that can lead to various diseases such as
autoimmune diseases, cancer, neurodegenerative diseases, cardiovascular diseases, diabetes and many more (Kalliolias & Ivashkiv, 2015). The NF-B signalling pathway has been classified into two different types: canonical and non-canonical pathway. The canonical pathway consists in a signalling cascade that culminates in the activation of IKK, which is in complex with IKK and NEMO, and in the subsequent nuclear translocation of the NF-B heterodimer p50 and p65 (RelA).
In the case of TNF, its binding to TNFR1 triggers the formation of a membrane-bound
complex, known as complex I or TNFR1-SC, which drives the expression of pro-survival and pro-inflammatory molecules via the activation of the canonical NF-B pathway. Within the complex, its components are rapidly conjugated with poly-ubiquitin chains. These ubiquitin chains act as scaffolds for the recruitment and activation of the TAK1-IKK kinase cascade, which subsequently leads to the translocation of the NF-B heterodimer p50/p65 to the nucleus for pro-survival and pro-inflammatory gene expression (Figure 1A). Briefly, TRADD and RIPK1 are independently recruited by the activated TNFR1 via homotypic death domain
(DD) interactions. TRADD recruits TRAF2 and/or TRAF5, which will subsequently attract cIAP1 and cIAP2 to the platform (Vince et al, 2007). Once recruited to the receptor complex, cIAP1/2 poly-ubiquitylate RIPK1 and possibly other components of the complex with K63-, K11- and K48-linked poly-ubiquitin chains (Haas et al, 2009; Qian et al, 2014; Gerlach et al, 2011). These chains allow the recruitment of LUBAC (composed of HOIP, HOIL and SHARPIN)
(Haas et al, 2009). LUBAC is an E3 ligase which upon recruitment adds complexity to the ubiquitin network by conjugating RIPK1, NEMO, TRADD and TNFR1 with M1-linked poly-ubiquitin chains (Draber et al, 2015; Tokunaga et al, 2009). The ubiquitin-binding domain
(UBD) present in TAB2/3, which specifically binds to K63-linked chains, and NEMO, which binds to M1-linked chains, enables the recruitment and activation of the TAB2/3-TAK1 complex and the IKK complex (composed of NEMO and kinases IKK and IKK) to the receptor complex (Dynek et al, 2010; Kanayama et al, 2004; Rahighi et al, 2009; Wu et al, 2006). Finally, TAK1 phosphorylates IKK which then results in the IKK-mediated phosphorylation of IB, marking it for ubiquitylation-dependent proteasomal degradation.
The NF-B heterodimer p50/p65 is released from IB, permitting the translocation of the
dimer to the nucleus where it drives the transcription of pro-inflammatory and pro-survival
genes (Hayden et al, 2006). Active repression of the ubiquitylation-dependent activation of NF-B exists to regulate the TNF response and ensure its transient nature. This regulation is

Part 1: Introduction
10
partially realized by deubiquitylases (DUBs) which remove the ubiquitin network conjugated to the receptor complex I. Both A20 and CYLD have been proposed to repress the NF-B pathway by removing ubiquitin chains (Verhelst et al, 2012; Kovalenko & Chable-bessia, 2003). CYLD has been reporter to remove K63- and M1-linked poly-ubiquitin chains on several components of complex I, while A20 has been proposed to remove K63-linked poly-ubiquitin chains attached to RIPK1 and adding K48-linked chains, thus promoting RIPK1
proteasomal degradation.
Figure 1. Activation of the canonical NF-B pathway by Tumour Necrosis Factor Receptor 1 (TNFR1). Upon
TNF binding, TNFR1 recruits RIPK1 and TRADD independently via homotypic interactions. TRADD recruits TRAF2
and TRAF5 which subsequently attract cIAP1 and cIAP2. These recruited protein poly-ubiquitylates RIPK1 with
K63-, K48- and K11- poly-ubiquitin chains. The ubiquitin chains attract LUBAC (composed of NEMO, HOIL,
HOIP), adding complexity to the ubiquitin network by conjugating RIPK1, NEMO, TRADD and TNFR1 with M1-
linked ubiquitin chains. TAB2/3-TAK1 and IKK complex bind to the ubiquitin chains via their ubiquitin binding
domain (UBD). Finally, TAK1 phosphorylates IKK enabling the IKK-mediated phosphorylation of IB and
marking it for proteasomal degradation. Taken and adapted from Ting and Bertrand, 2016
1.1.2. TNFR1 signalling to cell death
Engagement of TNFR1 by TNF results in the sequential assembly of a membrane bound primary signalling complex, known as TNFR1 complex I, that drives gene activation and of a
secondary cytoplasmic complex (complex II) that drives caspase-8 activation and apoptotic
cell death (Hsu et al, 1996; Micheau & Tschopp, 2003). Nonetheless, most cell types trigger a
robust pro-survival response upon TNFR1 activation, evading TNF-mediated apoptosis. Thus, despite the capacity of TNF to induce apoptotic cell death, this response is only observed

Part 1: Introduction
11
after disruption of some cell death checkpoints. The molecular understanding of how TNF is able to determine which of two divergent cellular responses will be triggered is incomplete, but recent studies have reported the existence of both NF-B-dependent and -independent cell checkpoints (Ting & Bertrand, 2016).
- The late NF-B-dependent cell death checkpoint
The death signals emerging from TNFR1 are counteracted by pro-survival molecules induced by NF-B. When NF-B-dependent transcription is inhibited, the outcome of TNFR1 engagement switches from a pro-survival/pro-inflammatory response to a pro-apoptotic response. This switch follows the internalization of complex I and the assembly of the cytosolic complex IIa that contains TRADD, FADD and procaspase-8 (Figure 2) (Wilson et al, 2009). Caspase-8 is activated upon FADD binding, inducing apoptosis. Importantly, apoptosis has been demonstrated not to depend on RIPK1 kinase activity under these circumstances.
- The early NF-B-independent cell death checkpoint
The early checkpoint in the TNFR1 pathway is, in contrast to the late checkpoint, independent of transcription. Studies demonstrated that RIPK1 ubiquitylation regulates, on top of NF-B activation, another NF-B-independent cell death checkpoint in the TNFR1 pathway. For example, cIAP1/2 and LUBAC depletion sensitized to TNF-mediated death through aberrant complex II formation and apoptosis induction. However, apoptosis observed in the absence of cIAP1/2 or LUBAC was greatly dependent on RIPK1 and its kinase
activity (Bertrand et al, 2008; Peltzer et al, 2014). To discriminate the RIPK1-dependent cytosolic death complex from complex IIa, it was defines as complex IIb (Figure 2). Ubiquitylation of RIPK1 is however not the last step of this checkpoint, Indeed, IKK-mediated phosphorylation of RIPK1 occurs subsequently to cIAP1/2-LUBAC-dependent ubiquitylation and defective phosphorylation also results in RIPK1 kinase dependent apoptosis. TAK1, NEMO and IKK have been shown to regulate this checkpoint without affecting RIPK1 ubiquitylation, independent of their roles in NF-B (Vlantis et al, 2016; Bertrand et al, 2008) Dondelinger et al. 2015). Indeed, the addition of ubiquitin chains precedes the recruitment
of TAK1, NEMO- IKK-IKK. Thus, the initiation of apoptosis by RIPK1 is inhibited by IKK-mediated phosphorylation of RIPK1 and has been shown to be a critical regulator in vitro and in vivo. It is important to note that conditions affecting the inhibition of the early NF-B-independent checkpoint also affect the late checkpoint in varying degrees.

Part 1: Introduction
12
Figure 2. Cell death checkpoints in TNFR1 signalling. When NF-B-dependent transcription is inhibited, the
formation of complex IIa (FADD, TRADD and caspase-8) is enabled. The formation of complex IIb (FADD, RIPK1
and caspase-8) is triggered when the early checkpoint is turned ‘off’, leading to the induction of apoptosis.
Necroptosis can also be induced when caspase-8 is inhibited, triggering the formation of the necrosome (RIPK1
and RIPK3). Recent in vivo studies have demonstrated that disruption of the early checkpoint leads to
inflammation while it is unclear whether disruption of the late checkpoint is sufficient to induced inflammation.
From Ting & Bertrand, 2016
Apart from the induction of RIPK1-dependent apoptosis, the early checkpoint has been
shown to protect cells from necroptosis, a regulated form of necrosis (Murphy et al, 2013). This form of cell death prevails when caspase-8 is inhibited or when activation fails. Necroptosis is induced following TNF binding, which relies on RIPK1 kinase dependent
assembly of the necrosome, a cytosolic death complex composed of RIPK3 and MLKL (Figure 2) (Murphy et al, 2013; Sun et al, 2012). It is unclear whether the formation of the necrosome originates from an inactive complex IIb or whether is forms in parallel.
The physiological function behind the presence of an early NF-B-independent checkpoint is surrounded by speculation. However, the most likely reason is that it functions as a mechanism against infection when the pathogens can somehow disrupt the immune
reaction by inhibiting the late NF-B checkpoint. Furthermore, RIPK1-dependent apoptosis
has been shown to be, contrary to other forms of apoptosis, inflammatory, serving as an
alarm signal for the immune system (Pasparakis & Vandenabeele, 2015; Vlantis et al, 2016;

Part 1: Introduction
13
Yatim et al, 2015). Inflammatory response could be triggered following apoptosis if the apoptotic cells undergoes secondary necrosis, releasing PAMPs. Additionally, loss of barrier function caused by death of epithelial cells can trigger the inflammatory response once microbes have breached the barrier. It is therefore conceivable that TNF-dependent inflammatory diseases (such as IBD, rheumatoic arthritis, psoriasis) may result from disruption in the early checkpoint rather than excessive NF-B activation (Kalliolias &
Ivashkiv, 2015). However, the role of the early checkpoint in these diseases needs to be clarified.
Part 1: Introduction
14
1.2. Endoplasmic reticulum stress and the Unfolded Protein Response
1.2.1. Functional role of endoplasmic reticulum (ER) and its relationship to ER stress
The endoplasmic reticulum (ER) is the first compartment of the secretory pathway, responsible for the synthesis, modification and proper delivery of proteins to their target
sites within the secretory pathway and beyond. All secreted, membrane bound or organelle-specific proteins, have to pass through the ER. The proper folding of proteins in the ER is maintained by an in-built quality control system, ensuring that the proteins are in their functional folded state before exiting the ER. When these newly synthesized polypeptides cannot properly fold within a certain time period, they are targeted for ER-associated degradation (ERAD), which efficiently retro-translocates the polypeptide from the ER into the cytosol for degradation (Smith et al, 2011). The degradation is mediated via an ubiquitin-proteasome system. In its normal state, the proper folding of the polypeptides and proteins
and the prevention for protein aggregation in the ER lumen is ensures by numerous ER-resident chaperones and folding enzymes. The latter assist in the maturation of the proteins by signal-peptide cleavage, glycosylation and disulphide bond formation. The chaperones are involved in the quality control of protein processing in the ER. BiP/Grp78 (immunoglobulin
heavy chain binding protein/glucose regulated protein 78) is the most abundant and best characterized ER-resident chaperone. It is responsible for translocation of nascent polypeptides, facilitation de novo protein folding and assembly and targeting the misfolded
proteins to ERAD machinery (Hendershot, 2004). Other chaperones and cofactors are Grp94/Hsp90 (glucose regulated protein of 94kDa /heat shock protein 90), Erp47 and PDI (protein disulphide isomerase), calnexin and calreticulin, among others (reviewed in Hetz et al. 2011).
Substantial changes in the environment of the cell from its normal state can cause the cell to produce protective responses for survival (Muralidharan & Mandrekar, 2013a). The ER, which is often considered as the factory of the eukaryotic cell, can be disturbed by different
stress stimuli such as nutrient deprivation, hypoxia, or viral infection (Muralidharan & Mandrekar, 2013b). Physiological fluctuations in the demand for protein synthesis and
secretion can also put lots of pressure on the ER machinery. The described stress stimuli can perturb the folding process, leading to the accumulation of misfolded proteins or unfolded proteins termed “ER stress”, which can be toxic for the cell. Consequently, numerous pathophysiological conditions have been associated with ER stress (Szegezdi et al, 2006). The
ER uses this status in protein folding to signal and orchestrate downstream adaptive and apoptotic responses. The adaptive response functionally affects almost every aspect of the
secretory pathway to ensure that the fluctuations in protein-folding requirements are cared for by re-establishing protein homeostasis in a dynamic way. If the ER stress is prolonged, the adaptive response can turn into an apoptotic response.
The existence of homeostatic pathway that overcomes perturbations in protein folding in the ER was first described in a pioneering study in which pharmacological inhibition of folding in mammalian cells led to the transcriptional upregulation of several ER chaperones (Kozutsumi et al, 1988; Hetz, 2012). Nowadays, we know that upon ER stress, a series of
complementary adaptive mechanisms are activated in the cell to cope with protein-folding
alterations, which are together known as the unfolded protein response (UPR).

Part 1: Introduction
15
1.2.2. The unfolded protein response (UPR)
The initial intent of the UPR is to restore the balance between the load of unfolded proteins that enters the ER and the cellular machinery that handles this load (reviewed in Walter & Ron 2011). To accomplish this, the UPR sets three main responses in motion, the first two which are rectifying. The reduction in protein load entering the ER is the first adaptation. It is transient of nature through the lowering of protein synthesis and translocation into the ER.
Second long-term adaptation is initiated by increasing the capacity of the ER to handle unfolded proteins through the transcriptional activation of UPR target genes, including those that function as part of the ER protein-folding machinery. If homeostasis cannot be restored then a third mechanism, cell death is triggered.
Three classes of stress sensors have been identified, each mediating a strict class of the UPR: ATF6 (activating transcription factor 6), PERK (protein kinase RNA (PKR)-like ER kinase) and IRE1 (inositol-required protein-1 alpha). Each ER stress transducer senses the protein
folding status in the ER lumen through their luminal portions and transmits this information across the ER membrane to the cytosol where a series of transcription factors carry the information to the nucleus. Here, I will discuss individual branches of the UPR.
- IRE1 branch
IRE1 is the only ER stress sensor present in all eukaryotes, reflecting the most ancient and most conserved branch of the UPR (Mori, 2009). It was first identified by a screen for
mutations that block the activation of a UPR-inducible reporter in yeast. The identified gene encodes for a type I transmembrane proteins containing a luminal domain and a cytoplasmic portion that contains protein kinase domains (Morl et al, 1993; Cox et al, 1993). After sensing unfolded proteins, IRE1 oligomerizes in the plane of the membrane, allowing trans-autophosphorylation of the juxtaposed kinase domains (Korennykh et al, 2009). Oligomerization of IRE1 proteins can be triggered directly by binding the unfolded proteins to the luminal domains, indirectly through the release of oligomerization-repressing chaperones (such as BiP) or can results from both processes. It is important to note that
contrary to expectations, IRE1 does not signals downstream via phosphorylation. Instead, the only known substrate of IRE1 kinase is IRE1 itself (Papa et al, 2003). Following the trans-phosphorylation of the kinase domains of IRE1, the unusual effector function is activated, causing the precise endonucleolytic cleavage of the only known substrate named Hac1 mRNA (homolog of ATF/CREB1) in yeast or XBP1 mRNA (X-box binding protein 1) in metazoans (Aragón et al, 2009; Yoshida et al, 2001). Thus, IRE1 is a bifunctional enzyme possessing both a protein kinase and a site-specific endoribonuclease that is regulated by its
intrinsic kinase module. IRE1 removes the intron from the precursor Hac1 or XBP1 mRNA, ligating the 5’ and 3’ RNA fragments into a spliced mRNA that encodes an activator of UPR target genes. Although Hac1 mRNA is the only known substrate of IRE1α in yeast, metazoan IRE1 has been reported to rapidly degrade a subset of mRNAs (reviewed in Maurel et al. 2014). This pathway, termed Regulated IRE1-Dependent Decay (RIDD), cleaves specific mRNAs which can consequently lead to a decrease in protein influx into the ER. The substrate specificity has been reported to be dependent on two factors: the location of the
mRNA to the ER membrane and the low stringency consensus sites. However, the
relationship of IRE1 to RIDD- and XBP1-specific modes of activity needs to be investigated.

Part 1: Introduction
16
Figure 3. The unfolded protein response (UPR). Upon binding of unfolded proteins and the release of the
chaperone BiP, IRE1α and PERK are activated by oligomerization and trans-phosphorylation. The endonuclease
domain of IRE1 cleaves XBP1 mRNA in an unconventional splicing reaction to generate the mRNA of the active
form of XBP1, known as XBP1s. Additionally, IRE1 also contributes to RIDD via its endonuclease activity
leading to the degradation of mRNAs recruited to ribosomes at the ER. PERK phosphorylates eIF2, leading to
the inhibition of protein translation. However, some mRNAs containing small upstream open reading frames in
their 5’ UTR escape translation stop. The most prominent is the mRNA encoding ATF4 which in turn triggers the
expression of CHOP, GADD34 and additional factors important for amino acid metabolism and the control of
redox. ATF6 is activated upon release of BiP, which is subsequently translocated to the Golgi where it
undergoes sequential cleavage and removal of its luminal domain. The remaining transactivation domain of
ATF6 translocates to the nucleus where it coordinates the expression of genes encoding molecules involved in
chaperone pathways and lipid biosynthesis. IRE1 (inositol-requiring enzyme 1 alpha), PERK (PKR-like ER
kinase), ATF6 (activating transcription factor 6), XBP1 (X-box binding protein-1), XBP1u (unspliced XBP1), CHOP.
From Janssens et al. 2014
Part 1: Introduction
17
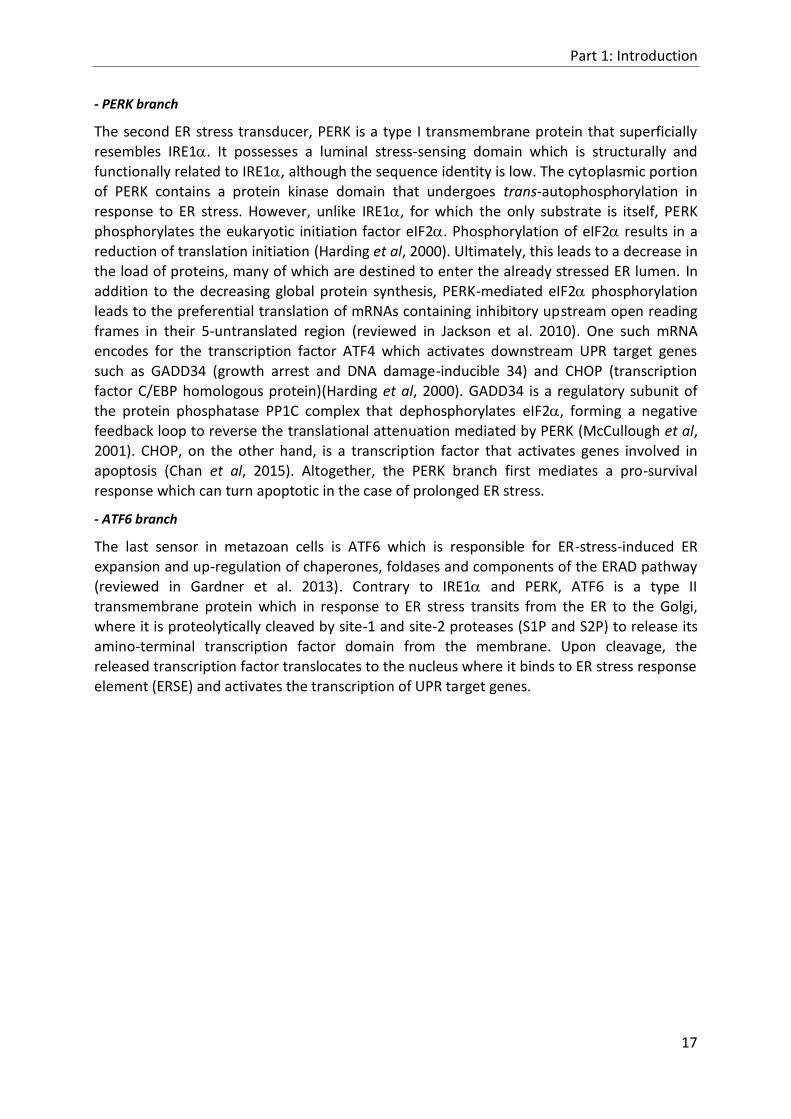
- PERK branch
The second ER stress transducer, PERK is a type I transmembrane protein that superficially resembles IRE1. It possesses a luminal stress-sensing domain which is structurally and functionally related to IRE1, although the sequence identity is low. The cytoplasmic portion of PERK contains a protein kinase domain that undergoes trans-autophosphorylation in response to ER stress. However, unlike IRE1, for which the only substrate is itself, PERK
phosphorylates the eukaryotic initiation factor eIF2. Phosphorylation of eIF2 results in a reduction of translation initiation (Harding et al, 2000). Ultimately, this leads to a decrease in the load of proteins, many of which are destined to enter the already stressed ER lumen. In addition to the decreasing global protein synthesis, PERK-mediated eIF2 phosphorylation leads to the preferential translation of mRNAs containing inhibitory upstream open reading frames in their 5-untranslated region (reviewed in Jackson et al. 2010). One such mRNA encodes for the transcription factor ATF4 which activates downstream UPR target genes
such as GADD34 (growth arrest and DNA damage-inducible 34) and CHOP (transcription factor C/EBP homologous protein)(Harding et al, 2000). GADD34 is a regulatory subunit of the protein phosphatase PP1C complex that dephosphorylates eIF2, forming a negative feedback loop to reverse the translational attenuation mediated by PERK (McCullough et al, 2001). CHOP, on the other hand, is a transcription factor that activates genes involved in apoptosis (Chan et al, 2015). Altogether, the PERK branch first mediates a pro-survival response which can turn apoptotic in the case of prolonged ER stress.
- ATF6 branch
The last sensor in metazoan cells is ATF6 which is responsible for ER-stress-induced ER expansion and up-regulation of chaperones, foldases and components of the ERAD pathway (reviewed in Gardner et al. 2013). Contrary to IRE1 and PERK, ATF6 is a type II transmembrane protein which in response to ER stress transits from the ER to the Golgi, where it is proteolytically cleaved by site-1 and site-2 proteases (S1P and S2P) to release its amino-terminal transcription factor domain from the membrane. Upon cleavage, the
released transcription factor translocates to the nucleus where it binds to ER stress response element (ERSE) and activates the transcription of UPR target genes.

Part 1: Introduction
18
1.3. The relationship between ER stress, UPR and inflammation
The UPR is well known for its role in restoring ER homeostasis upon ER stress. Emerging evidence from different experimental systems indicates that UPR signalling might have fundamental roles in multiple physiological processes beyond the homeostatic control of protein folding (Hetz, 2012). Interestingly, more recent studies have reported links between
UPR, or part of it, with inflammation. The coupling of these responses is now thought to be fundamental in the pathogenesis of inflammatory diseases. Development of therapies for modulating cellular stress and inflammation will be possible from the knowledge gained in this interaction.
1.3.1. Pathways that connect UPR to inflammation
Inflammatory phenotypes are spontaneously induced by defects in protein folding which can
be caused either by environmental factors or genetic defects in individual branches of the UPR. This has been described in models of diseases such as IBD, metabolic diseases or lung respiratory diseases (Hotamisligil, 2010; Osorio et al, 2013). Many different studies have led to the paradigm that dysregulated UPR signalling underlies chronic low-grade inflammation.
The UPR has been reported to intersect at various levels with inflammatory pathways such as the activation of NF-B, JNK and Interferon Regulatory Factor 3 (IRF3) (Hasnain et al, 2012). NF-B is transcription factor that possesses a key role in the onset of inflammation.
Activation of the pathway induces through a series of signalling steps, the induction of numerous inflammatory genes. An increase in ER-protein folding load (for example, following viral infection) has been shown to activate the NF-B pathway (Pahl & Baeuerle, 1995). It might results from ER-stress mediated leakage of calcium into the cytosol as observed following experiments using calcium chelators, which demonstrated a contribution of calcium to the activation of NF-B in response to ER stress (Deniaud et al, 2008). Additionally, activation of the PERK branch halts the overall protein synthesis and increases the ratio of NF-B to IB due to the shorter half-life time of IB, thereby freeing NF-B to
translocate to the nucleus in response to ER stress (Deng et al, 2004). IRE1α has also been reported to activate NF-B pathway through an interaction with TRAF2 in response to ER stress, leading to the recruitment of IKK and the phosphorylation and subsequent degradation of IB (Urano et al, 2000; Hu et al, 2006). The IRE1-TRAF2 complex can also recruit JNK leading to the activation of the JNK and subsequent induction of inflammatory genes. Together, the formation of IRE1-TRAF2 complex seems to be crucial for the activation of NF-B and JNK in response to ER stress. Additional to the role of UPR in the
activation of NF-B pathway, it has become increasingly clear that non-resolving ER-stress-induced apoptosis can be recognized as a pathogenic factor and is present in a number of widespread and devastating diseases, including neurodegenerative diseases, diabetes, atherosclerosis and renal disease. Normally, prolonged activation of IRE1 and CHOP can trigger apoptosis in cells under certain physiologic and pathophysiological conditions (Szegezdi et al, 2006). Apoptosis induction is formally known as non-inflammatory (in contrast to necrosis). However, recent findings have shown that apoptosis could be
inflammatory if proper clearance of the apoptotic cells does not occur (Ting & Bertrand,
2016). In that case, the dying cells undergo secondary necrosis, releasing DAMPs which are
sensed by PRR and thus triggering the inflammatory response. Therefore, ER stress-induced

Part 1: Introduction
19
apoptosis could be viewed as an additional type of cell death that can contribute to the initiation of the inflammatory response.
1.3.2. The role of the UPR in PRR-response activation
Recent studies have demonstrated that some innate immune receptors known as pattern recognition receptors (PRRs) selectively trigger activation of the UPR (or part of it) in
absence of ER stress upon binding of their respective agonists. PRR, including Toll-like receptors (TLRs) and nucleotide-binding oligomerization domain (NOD)-like receptors (NLRs) commonly trigger inflammation after detecting tissue damage or microbial infection. PRRs survey extracellular environment, the nucleus, the cytosol, various endosomes, mitochondria and peroxisomes (Takeuchi & Akira, 2010; Li et al, 2012). Other compartments of the cell are not known to possess receptors which survey their content.
The observation of ER stress response promoting inflammation by producing acute phase
proteins together with data reporting transcriptional induction of XBP1 mRNA precursor following TLR stimulation led to further investigation of the link between ER signalling and innate immunity, more specifically PRR (Zhang et al, 2006). TLRs, more specifically TLR2 and TLR4, are transmembrane proteins which have been reported to mediate XBP1 mRNA splicing upon activation and XBP1s has even been demonstrated to be required for optimal and sustained production of pro-inflammatory cytokines, thereby identifying the IRE1-XBP1 axis as part of the TLR4- and TLR2-mediated inflammatory responses (Martinon et al, 2010). Unexpectedly, TLR stimulation represses ATF6 and PERK signalling but specifically induces
XBP1s-dependent IL-6 mRNA upregulation without triggering a classical ER stress response. Some evidence even suggest that XBP1 mRNA splicing by TLRs is independent of protein misfolding. However, the process seems to be dependent of IRE1 and controlled through a specific signalling branch involving the adaptor proteins myeloid differentiation primary response 88 (MYD88), TIR domain-containing adaptor protein (TIRAP), TRAF6 and NADH oxidase 8 (NOX8). The exact mechanism by which TLR is repressing ATF6 and PERK and activating IRE1 is still not clear and remains to be established. Of note, whether IRE1
activation by TLR also triggers RIDD or contributes to TLR-mediated cell death induction is currently unknown. Other types of PRR have been reported to link inflammation and unfolded protein response. For example, NOD1 and NOD2 which are traditionally viewed as sensors of bacterial peptidoglycan fragments, have been reported to activate an innate immune response during infection with influenza virus, a pathogen that triggers ER stress in
infected host cells (Keestra-Gounder et al, 2016). In fact, evidence showed that the inflammatory response triggered by ER stress in response to viral infection is dependent on the IRE1 kinase activity contrary to the response triggered by bacterial peptidoglycan
fragments. From these published reported, data is pointing to an important role of IRE1 in inflammation. Additional studies have even reported that IRE1 functions as a kind of PRR by binding to a portion of cholera toxin (Cho et al, 2013). It uses RIDD to degrade endogenous mRNA, which subsequently engages the retinoic-acid inducible gene (RIG-1), a cytosolic sensor of RNA viruses, and activates NF-B and interferon pathway.
In conclusion, initially thought to have as primary function to restore ER homeostasis, the
UPR, or specific branches of it, has over the past few years been directly linked to the
inflammatory response either by activating the signalling pathways downstream of some
PRR or by intersecting with various levels of the inflammatory response.

Part 2: Aims
2. Aims
Although crucial for the protection of the human body against various insults, inflammation needs to be tightly regulated to avoid the pathological consequences resulting from an insufficient or chronic inflammatory response. Gaining a better understanding of the molecular mechanisms that regulate inflammation is therefore an important priority with expected beneficial outcome for public health. TNF is a master pro-inflammatory cytokine
that promotes inflammation either directly by promoting gene activation, or indirectly by inducing cell death (Ting & Bertrand, 2016). Engagement of TNFR1 by TNF results in the sequential assembly of a membrane bound primary signalling complex (complex I) that drives gene activation and of a secondary cytoplasmic complex (complex II/necrosome) that mediates cell death, in the form of apoptosis or necroptosis (Ting & Bertrand, 2016). Although amongst the most studied cytokine, our understanding of the molecular mechanisms regulating the TNFR1-mediated inflammatory response is far from complete,
which limits the therapeutic approaches aimed at specifically counteracting the noxious effect of TNF without altering its beneficial outcomes.
The UPR is emerging as a new signalling network that contributes to the host inflammatory response (Muralidharan & Mandrekar, 2013b). Consequently, there is currently a lot of interest in therapeutic manipulation of the UPR, and small molecules inhibitors of IRE1 and PERK have recently been described (Hetz et al, 2013). Nevertheless, the exact physiological mechanisms that activate the UPR (or part of it) and the precise contribution of the different
UPR branches to inflammation are currently unclear. The finding that some, but not all TLRs, can specifically activate the IRE1-XBP1 pathway independently of a general ER stress response (Martinon et al, 2010) has opened the door to a new field of research on the role of physiologically activated UPR (or part of it) downstream of immune and death receptors.
In this study we will investigate the possibility that the UPR, or part of it, contributes to the TNF-mediated inflammatory response (gene activation or cell death induction). The induction of TNF by the UPR has previously been reported (Xue et al, 2005) but the opposite
is unclear. In the light of the existing contribution of the UPR to the inflammatory response downstream of some PRRs, we can indeed imagine that the UPR also contributes to the TNFR1-mediated inflammatory response in accordance with this hypothesis.
The general aim of this project thrives to study whether UPR contributes to the TNF-mediated inflammatory gene activation and cell death induction.
The specific aims of this project include (Figure 4):
(i) To determine whether TNF induces UPR
(ii) To test whether UPR contributes to the TNF-mediated production of
inflammatory cytokines
(iii) To study the contribution of the UPR to TNF-induced death
To address the first two aims, we will combine western blot analysis, reporter assays and real time PCR analysis. For the third aim, cell death will be monitored by fluorimetric assays using the FLUOstar Omega microplate reader.

Part 2: Aims
21
This thesis is part of a project initiated by the Molecular and Cellular signalling under Stress Unit (MCSU), headed by Prof. Dr. Mathieu Bertrand, which focuses on the elucidation of the molecular mechanisms regulating stress-induced cell survival/death, as well as innate immune/inflammatory responses.
Figure 4. Schematic overview of project. The TNF signalling pathway exists of two part, either TNF-induced
inflammatory cytokine production or TNF-induced cell death. This project aims to determine if TNF induces the
UPR and if the UPR contributes to the TNF signalling pathway. TNF-induced cell death can be split in apoptosis
and necroptosis. UPR: unfolded protein response; TNF: tumour necrosis factor

Part 3: Results
22
3. Results
3.1. The activation of the UPR by TNF
The UPR is initiated by three transmembrane proteins: IRE1, PERK and ATF6. The activated UPR functions to restore the ER homeostasis upon ER stress. However, emerging evidence
suggest that the UPR has additional functions beyond the control of ER homeostasis. Recent studies have reported links between the UPR, or part of it, with inflammation (Garg et al, 2012). One main published report on which this study is based, showed that upon LPS binding to TLR4 only IRE1 pathway activation is triggered (Martinon et al., 2010). In this study, we are interested to determine whether TNF activates the UPR, or part of it. Ideally, we would have measured PERK, IRE1 and ATF6 activation to determine UPR activation by TNF. Due to time limitations, we could only monitor the activation of two out of the three
branches (IRE1 and PERK). In the following sections we will first describe the results obtained regarding IRE1α activation after TNF stimulation, which will be followed by the results regarding PERK activation.
3.1.1. Activation of the IRE1 branch by TNF
Upon ER stress, IRE1 is activated through trans-autophosphorylation, leading to the splicing of IRE1 substrate XBP1 mRNA in eukaryotic cells (Yoshida et al, 2001; Han et al, 2009). The
spliced XBP1 (XBP1s) forms a transcription factor which induces the activation of XBP1s target genes, including genes engaged in folding, quality control and ERAD such as ER-degradation-enhancingmannidose-like protein (EDEM), ER-DNA Domain J domain containing protein 4 (ERDJ4) and protein disulphide isomerase (PDI) (Hosokawa et al, 2006; Kanemoto et al, 2005). Additional to the non-traditional splicing of XBP1 mRNA, IRE1 endonuclease activity cleaves specific mRNA through a process known as IRE1-dependent decay (RIDD) (Maurel et al, 2014). Following the different levels in the signalling pathway of IRE1, activation of the IRE1 branch can be monitored through the expression and
activation of downstream components regulated by IRE1. We decided to monitor the activation by measuring phosphorylation levels of IRE1, splicing of XBP1 mRNA and
induction of XBP1s functional protein, induction of XBP1s target genes and activation of RIDD through the mRNA levels of RIDD-targeted genes.
- Activation of IRE1 and XBP1 splicing
IRE1 is an ER transmembrane serine/threonine kinase that is phosphorylation upon ER
stress. Thus, the best way to investigate whether TNF activates the IRE1 branch is to
measure its phosphorylation levels. We stimulated mouse embryonic fibroblasts (MEFs) with murine TNF (mTNF) and analysed activation of IRE1 by monitoring the phosphorylation of IRE1 using immunoblotting analysis. We used tunicamycin (Tm) and lipopolysaccharide (LPS) respectively as non-physiological and physiological positive controls. Tm is an inhibitor of UDP-N-acetylglycosamine-dolichol phosphate N-acetylglucosamine-1-phosphatase transferase (GPT), therefor blocking the initial step of glycoprotein synthesis in the ER (Oslowski & Urano, 2011). Thus, Tm leads to the accumulation of unfolded glycoproteins in
the ER, leading to ER stress. LPS is a large molecule consisting of lipid and polysaccharide
found in the outer membrane of Gram-negative bacteria. It acts as the prototypical endotoxin by binding to CD47/TLR4/MD2 receptor complex and thus promoting

Part 3: Results
23
inflammation via the secretion of pro-inflammatory mediators (Park & Lee, 2013). In previous studies, binding of LPS to TLR4 was shown to specifically trigger the activation of IRE1 pathway (Martinon et al, 2010).
As expected, eight hours of Tm stimulation resulted in phosphorylation of IRE1. This is observed by the slower migration of IRE1α detected with the anti- IRE1 antibody (Figure 5). Of note, the anti-phospho IRE1 antibody did not seem to work because Tm treatment did
not lead to a higher signal. Surprisingly, in contrast to Tm, LPS stimulation (8h) did not lead to phosphorylation of IRE1 (Figure 5), even though LPS has been reported to activate the pathway (Martinon et al. 2010). Murine TNF (mTNF) stimulation was also unable to induce phosphorylation of IRE1α (Figure 5).
Figure 5. Analysis of activation of the IRE1 branch by immunoblot analysis. MEF cells were left untreated (-)
or were stimulated with mTNF (20 ng/mL), LPS (100 ng/mL), Tm (100 ng/mL or 10 μg/mL) for the indicated
times and analysed by immunoblot for XBP1s activation and IRE1 activation. -tubulin is used as a loading
control. (n=1).
Despite the absence of IRE1 phosphorylation following mTNF stimulation, we still
hypothesized that IRE1 could be activated based on the previous data relating to LPS stimulation (Martinon et al. 2010). Thus, additional to the phosphorylation levels of IRE1, we monitored the induction of XBP1s protein using immunoblotting analysis as activated
IRE1 functions as an endonuclease, splicing a 26-base pair intron form the XBP1 mRNA. The spliced XBP1 (XBP1s) mRNA is translated into a stable and active UPR transcription factor
which can be detected by an anti-XBP1s specific antibody (Oslowski & Urano, 2011). As expected, we observed an induction of XBP1s protein following Tm treatment (Figure 5). However, we observed no induction of XBP1s protein following LPS treatment (Figure 5) even though XBP1s protein induction has previously been reported (Martinon et al., 2010). We could also not observe an induction of XBP1s protein following mTNF stimulation (Figure 5). Because LPS is supposedly an activator of the IRE1 branch, we hypothesized that the system, contrary to J774 cells, is not induced in MEF cells. However, previous reports suggest MEF cells induce high levels of TLRs (Kurt-Jones et al, 2004). Therefore, we hypothesized that
the technique used was not sensitive enough for the proper detection of the activation of
the IRE1 branch.

Part 3: Results
24
Thus, we decided to opt for a more sensitive approach and used an IRE1 reporter assay. The gene construct consisted in part of the human XBP1 cDNA followed by an intron and a sequence encoding luciferase under a -actin promoter (Figure 6A) (Iwawaki et al, 2009). In IRE1 inactive conditions, the intron is not spliced at the cleavage sites and the unspliced mRNA is translated into a truncated protein that does not contain the luciferase. Upon IRE1 activation, the intron is spliced, leading to a frame shift. The spliced mRNA is
translated into an XBP1-luciferase fusion protein that can be detected once adding the luciferase substrate. Thus, we only detect luminescence in IRE1 active cells. To test activation of IRE1, we used SH-SY5Y cells constitutively expressing the reporter construct.
Figure 6. TNF induces IRE1 endonuclease activity. (A) Schematic diagram of the ERAI-LUC reporter. The ERAI
gene construct includes one part of the human XBP1 cDNA (410-633 nt). The transcripts from the ERAI-LUC
construct are not spliced under IRE1α-inactive conditions. The unspliced mRNA is translated into a truncated
XBP1 protein. Under IRE1-active conditions, these transcripts are spliced, leading to a frame shift. The spliced
mRNA is translated into an XBP1-luciferase fusion protein. Thus, we detected luminescence only in IRE1-
active cells. SH-S5Y5 cells that stably express ERAI-LUC reporter were exposed to Tm 100 ng/mL (C) or hTNF 20
ng/mL (D) in presence or absence of MKC-3946 (10 µM), an IRE1α endonuclease inhibitor (B). Then, luciferase
activity was measured as was described in Iwawaki et al. 2009. The graphics represent the mean and s.e.m. of 5
independent experiments. The value of untreated cells of each reporter were used to normalize the value of
the treated cells. T-test were performed to determine significant difference (*=p<0.05, **=p<0.01).
Tunicamycin treatment of SH-SY5Y cells enhanced luciferase activity by approximately 3-fold after 6h and 6-fold after 18h (Figure 6C). In the presence of MKC-3946, an IRE1 endonuclease inhibitor (Figure 6B)(Mimura et al, 2012), we observed a reduction in Tm-induced luciferase activity, confirming that the measured luciferase activity resulted from
the endonuclease activity of IRE1. (Figure 6C). Remarkably, hTNF treatment also resulted in a mild but significant increase of reporter activity (Figure 6D). Importantly, we found that the

Part 3: Results
25
luciferase activity was inhibited in presence of the IRE1 endonuclease inhibitor (Figure 6D). These results indicate that hTNF can also activate IRE1 endonuclease activity.
Figure 7. PCR analysis showing Xbp1 mRNA splicing induced by TNF stimulation. (A) A schematic diagram of
the XBP1 gene including an approximate location of the 26-nt intron. The different PCR amplification primers
used for the characterization of the XBP1 mRNA splicing are approximately aligned to the reverse transcripts.
(B-C) MEF cells were exposed to mTNF or hTNF 20 ng/mL for 4, 8, 16 and 24 hours (h) and XBP1 mRNA splicing
was monitored by RT-PCR as described above. PCR fragments corresponding to the xbp1u or xbp1s forms of
Xbp1 mRNA. Tm and LPS were used as positive controls. Actin and Xbp1total mRNA were used as loading
controls. (D) For regular splicing assay, the percentage of Xbp1 mRNA splicing in each time point was calculated
after densitometric analysis of the xbp1u or xbp1s-related PCR. Data represent the average and standard error
of two independent experiments analysed with regular Xbp1 mRNA splicing assay.

Part 3: Results
26
After having found, using the reporter assay, that hTNF stimulation activates IRE1α endonuclease activity in SH-SY5Y cells, we next wanted to determine whether it was also inducing splicing of endogenous Xbp1 mRNA, thus generating spliced Xbp1 (Xbp1s) mRNA which upon translation forms a potent transcriptional activator. To test this possibility, we monitored Xbp1 mRNA splicing by using used 3 different reported sets of primers (Figure 7A). One set of primers, called the conventional XBP1 primers set, amplifies both unspliced
Xbp1 (Xbp1u) and Xbp1s. These primers lead to the simultaneous detection of Xbp1u and Xbp1s and can be employed to determine the percentage of Xbp1 mRNA splicing. Another set of primers amplifies only Xbp1s mRNA. The last set of primers does not make any distinction between Xbp1u and Xbp1s and enables the detection of the total amount of Xbp1 mRNA. We stimulated MEF cells with mTNF for 0, 4, 8, 16 and 24h and used LPS and Tm as positive controls by treating the cells for 8h. We found that treating the cells with both positive controls resulted in splicing of Xbp1 mRNA (Figure 7B), which was more easily detected by the XBP1s specific set of primers than the conventional set in the case of LPS
stimulation (Figure 7B). We found that mTNF treatment also resulted in Xbp1 mRNA splicing, which was detected as early as 4h after mTNF stimulation (Figure 7B). Due to the fact that mTNF binds and activates both TNFR1 and TNFR2 in MEFs, we were interested to know which receptor was implicated in IRE1 activation and Xbp1 mRNA splicing. To do so, we stimulated the cells with hTNF that only activates TNFR1 in mouse cells. We found that hTNF stimulation of MEFs also resulted in splicing of Xbp1 mRNA (Figure 7C), indicating that TNFR1 alone can activate IRE1 and induce Xbp1 mRNA splicing. We hypothesized that the
difference in signal intensity between hTNF and mTNF might be due to fact the TNFR2 could also contribute to the splicing of Xbp1 mRNA. As hTNF only activates TNFR1, it could result in a lower signal intensity. To evaluate this, we used a semi-quantitative method, known as the densitrometric analysis, to measure the intensity of the different signals. Following this method, we observed a peak of Xbp1 mRNA splicing occurring after 4h of stimulation with both mTNF and hTNF (Figure 7D). However, due to the use of different gels, we could not determine whether there was a difference in intensity because each untreated sample had from the start a different signal intensity. Thus for further experiments, semi-quantification
of both mTNF and hTNF signals should be performed on the same agarose gel.
Figure 8. XBP1 mRNA splicing is IRE1 dependent. MEF cells were exposed to 20 ng/ml of mTNF or hTNF for 0,
4, 8, 16 and 24 hours (h), in the presence or absence of MKC-3946 (10µM), an IRE1 endonuclease inhibitor. As
positive controls, we used 100 ng/ml LPS and 1 µg/ml Tm and treated MEF cells with these controls for 8h in
the presence and absence of MKC-3946 (10 µM). XBP1 splicing was monitored with traditional PCR using XBP1
conventional primers. The data represents one experiment.

Part 3: Results
27
Even though we observed an increase in Xbp1 mRNA splicing, we still wanted to be certain this process resulted from IRE1 endonuclease activity. Therefore, we stimulate MEFs with mTNF or hTNF in the presence or absence of MKC-3946. Indeed, the production of Xbp1s after TNF stimulation was IRE1α dependent as demonstrated by the fact that mTNF- and hTNF-induced splicing of Xbp1 mRNA was inhibited in presence of the IRE1 endonuclease inhibitor MKC-3946 (Figure 8). Similar data were obtained following LPS and Tm stimulation.
Together, these results indicated that TNF can activate IRE1 and induce splicing of Xbp1 mRNA.
Figure 9. Transcriptional profile of MEF cells in the presence of mTNF. MEFs were stimulated with mTNF, LPS
or Tm for 8 h (A) or were exposed for 8 and 24h to mTNF (B). mRNA was harvested and analysed by RT-PCR for
the production of Xbp1s and Xbp1total. Data representative of three independent experiment (mean and s.e.m.).
We finally decided to confirm our PCR results by real time PCR (RT-PCR) analysis in order to
have a more quantitative method to determine the fold changes in Xbp1s mRNA levels after
TNF stimulation. We used the 2 sets of primers which were also used for traditional PCR
(Figure 7A). The primers used to detect Xbp1s fold change only amplify spliced Xbp1 mRNA.
For Xbp1total mRNA analysis, we used primers described in figure 7 termed Xbp1total which
amplifies both Xbp1u and Xbp1s. Tm stimulation led to a 10-fold increase in Xbp1s mRNA
after 8 hours (Figure 9A, upper panel). We also observed an increase in fold change for
Xbp1total mRNA following Tm treatment (Figure 9A, lower panel). The increase in Xbp1total
mRNA levels is due to the activation of ATF6 following ER stress induction by Tm. This UPR
sensor induces the transcription of XBP1 mRNA following activation. Contrary to our PCR
results, we did not observe an increase in Xbp1s mRNA following 8h of LPS stimulation
(Figure 9A, upper panel). This is contrary to the reported induction of Xbp1 mRNA splicing
following LPS stimulation in J774 macrophages (Martinon et al. 2010). We also did not
observe a significant increase in Xbp1total mRNA levels following LPS treatment (Figure 9A,
lower panel). This goes in line with previous reports indicating that LPS does not activate the
Part 3: Results
28
ATF6 branch (Martinon et al. 2010). Similarly to LPS treatment, we also did not observe an
increase in Xbp1s and Xbp1total mRNA over a 24h time period after TNF stimulation (Figure
9B). The discrepancy between our PCR and real time PCR results might be explained by the
less efficient amplification obtained with the set of primers used in the real time PCR
analysis, which could be supported by the limited induction obtained with the very potent
inducer Tm.
-Induction of XBP1 target genes
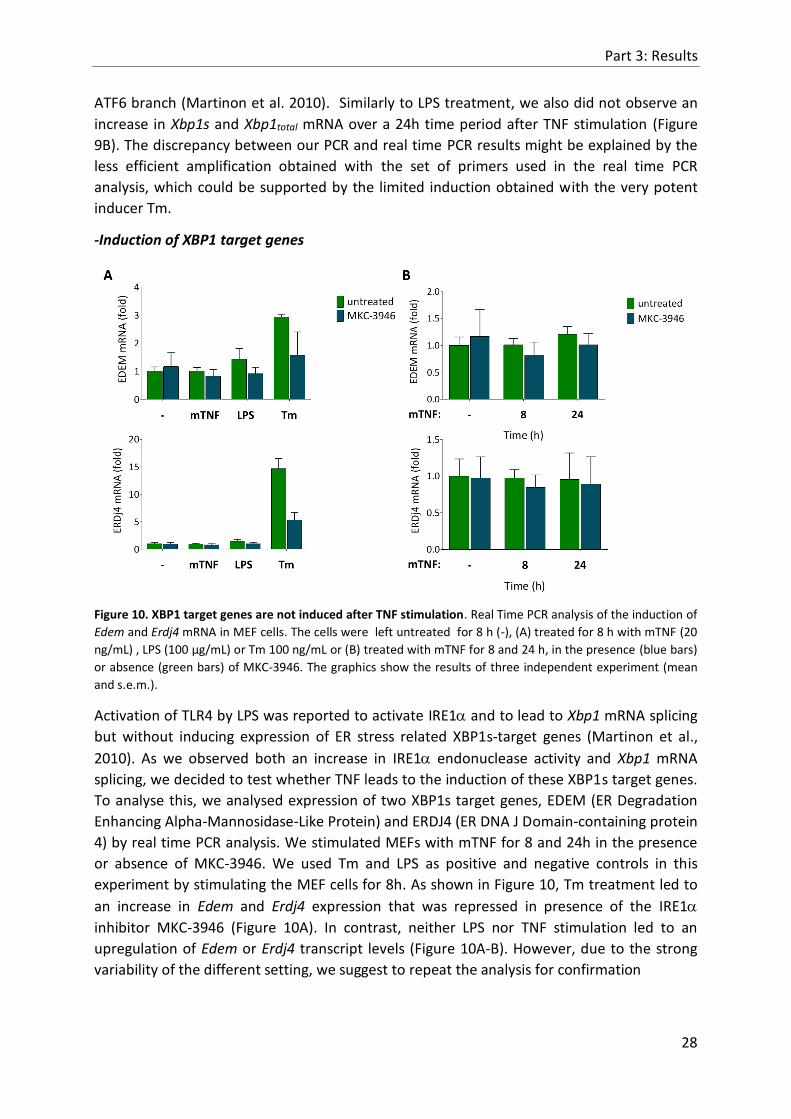
Figure 10. XBP1 target genes are not induced after TNF stimulation. Real Time PCR analysis of the induction of
Edem and Erdj4 mRNA in MEF cells. The cells were left untreated for 8 h (-), (A) treated for 8 h with mTNF (20
ng/mL) , LPS (100 µg/mL) or Tm 100 ng/mL or (B) treated with mTNF for 8 and 24 h, in the presence (blue bars)
or absence (green bars) of MKC-3946. The graphics show the results of three independent experiment (mean
and s.e.m.).
Activation of TLR4 by LPS was reported to activate IRE1 and to lead to Xbp1 mRNA splicing
but without inducing expression of ER stress related XBP1s-target genes (Martinon et al.,
2010). As we observed both an increase in IRE1 endonuclease activity and Xbp1 mRNA
splicing, we decided to test whether TNF leads to the induction of these XBP1s target genes.
To analyse this, we analysed expression of two XBP1s target genes, EDEM (ER Degradation
Enhancing Alpha-Mannosidase-Like Protein) and ERDJ4 (ER DNA J Domain-containing protein
4) by real time PCR analysis. We stimulated MEFs with mTNF for 8 and 24h in the presence
or absence of MKC-3946. We used Tm and LPS as positive and negative controls in this
experiment by stimulating the MEF cells for 8h. As shown in Figure 10, Tm treatment led to
an increase in Edem and Erdj4 expression that was repressed in presence of the IRE1
inhibitor MKC-3946 (Figure 10A). In contrast, neither LPS nor TNF stimulation led to an
upregulation of Edem or Erdj4 transcript levels (Figure 10A-B). However, due to the strong
variability of the different setting, we suggest to repeat the analysis for confirmation

Part 3: Results
29
- IRE1-dependent mRNA decay (RIDD)
Next to the splicing of Xbp1 mRNA, IRE1α also cleaves other mRNAs preceding their degradation, via a process termed regulated IRE1-dependent mRNA decay (RIDD) (Maurel et al, 2014). To test whether TNF and LPS induce RIDD activity, we analysed the abundance of Blocs1 and Sparc mRNA, two genes containing that IRE1 endonuclease target sequences, following mTNF and LPS stimulation. We stimulated MEFs with mTNF for 8 and 24h, and LPS
for 8h in the presence or absence of IRE1 endonuclease inhibitor. Tm treatment (8h) was used as a control.
Figure 11. Real time PCR analysis of the expression of Blocs1 and Sparc in MEF cells left untreated for 8 h (-),
(A) treated for 8 h with mTNF 20 ng/mL , LPS (100 µg/mL) or Tm 100 ng/mL or (B) treated with mTNF for 8 and
24 h, in the presence (blue bars) or absence of MKC-3946 (green bars). The figure shows the mean and s.e.m of
three independent experiment.
As expected, Tm lead to a decrease in Blocs1 and Sparc mRNA levels compared to the untreated conditions, which was partially inhibited in the presence of MKC-3946 (Figure 11A) and thereby demonstrating that the decrease is, at least in part, resulting from IRE1-
dependent mRNA decay. In contrast, following 8 hours of LPS stimulation we observed no significant change in Blocs1 and Sparc mRNA levels (Figure 11A). Similarly, no significant change in Sparc and Blocs1 mRNA levels was shown after 8 and 24 hours of mTNF
stimulation (Figure 11B). However, due to the strong variability of the different mRNA levels following both treatment, no conclusion could be draw. Other experiments should be performed to evaluate LPS or mTNF activation of RIDD activity.

Part 3: Results
30
3.1.2. Activation of the PERK branch by TNF
PERK is another branch of the UPR, apart from IRE1, which is activated upon ER stress. Interestingly, LPS binding to TLR4 has been shown to only activate part of the UPR. It has been shown to activate the IRE1 endonuclease activity and induce Xbp1 mRNA splicing but not induce transcription of XBP1s target genes (Martinon et al. 2010). Additionally to the difference in IRE1 activation, LPS has been demonstrated not to activate the PERK branch
(Martinon et al., 2010). After investigating if TNF led to the activation of IRE1α branch, we wanted to determine whether TNF leads to the activation of the PERK branch.
Similar to IRE1, PERK also undergoes trans-autophosphorylation following ER stress. The phosphorylation levels of PERK can be detected by phosphor-specific PERK antibodies. We stimulated MEFs with mTNF for 0, 4, 8, 16 and 24 h and used Tm and LPS respectively as positive and negative controls. For both controls, we stimulated the MEF cells for 8 h. Tm induced the activation of the PERK branch, as detected by the phosphorylation of PERK
(phosphor ab) (Figure 12). As described previously, LPS did not lead to phosphorylation of PERK (Figure 12). Also, we did not observed PERK phosphorylation following TNF stimulation (Figure 12).
Once activated, PERK phosphorylates eIF2 to reduce the global mRNA translation. This can be measured using anti-phospho-eIF2 specific antibody. Surprisingly, we could not detect phosphorylation of eIF2 following Tm treatment (Figure 12), which could potentially be explained by the fact that we only looked at one time point (8h). In line with previous
reports, phosphorylation of eIF2 was not detected after 8h of LPS treatment (Figure 12). However, we observed that mTNF stimulation led to phosphorylation of eIF2 after 24h (Figure 12).
Additional to inhibition of global protein synthesis, PERK induces the translation of specific mRNA containing an inhibitory open reading frame. CHOP is one of those genes and is involved in the induction of genes related to apoptosis. Tm treatment led to the induction of CHOP protein (Figure 12). LPS and mTNF did not lead to CHOP induction (Figure 12).
Figure 12. No activation of PERK branch by TNF. MEF cells were left untreated (-) or were stimulated with
mTNF (20 ng/mL), LPS (100 ng/mL), Tm (100 ng/mL or 10 μg/mL) for the indicated times and analysed by
immunoblot for eIF2 activation, CHOP induction and PERK activation. β-tubulin is used as a loading control.
(n=1)

Part 3: Results
31
Thus, activation of the PERK branch could not be observed following mTNF and LPS stimulation, which goes in line with previous report that LPS only activates IRE1 branch and not the PERK branch. Surprisingly, 24 hours of TNF stimulation led to the phosphorylation of eIF2. Since PERK phosphorylation and CHOP induction were not detected, phosphorylation of eIF2 following TNF stimulation should occur via activation of another pathway.
To confirm that the PERK branch was not activated following TNF stimulation, we also
analysed induction of Chop mRNA by real time PCR, a technique more sensitive than immunoblotting. In line with the Western blot results, Tm treatment led to a strong induction of Chop, which was not detected following TNF or LPS stimulation (Figure 13B-C).
Following the results regarding the effect of TNF on PERK activation, we observed that TNF does not activate the PERK pathway.
Figure 13. No induction of Chop mRNA expression following mTNF. Real Time PCR analysis of the induction of
Chop mRNA in MEF cells. The cells were left untreated for 8 h (-), (A) treated for 8 h with mTNF (20 ng/mL) ,
LPS (100 µg/mL) or Tm 100 ng/mL or (B) treated with mTNF for 8 and 24 h. The graphics are representative for
three independent experiments (mean and s.e.m)

Part 3: Results
32
3.2. Contribution of the IRE1 endonuclease activity to the TNF response
Previous reports have reported that TLR-activated XBP1s is required for optimal and sustained production of pro-inflammatory cytokines in macrophages. We already showed in preceding results that TNF, as LPS, activates the IRE1-XBP1 pathway without activating the PERK pathway in MEFs cells. As we obtained similar results regarding the activation of
IRE1-XBP1 pathway after TNF or LPS stimulation, we decided to investigate whether IRE1-XBP1 pathway could also contribute to the TNF response. The TNF response consists of the direct promotion of gene activation or the indirect induction of cell death. Here, we will show the results obtained so far regarding the possible contribution of the IRE1-XBP1 pathway to the TNFR1 response.
3.2.1. Gene activation
As our previous results showed that TNF stimulation can activate IRE1endonuclease
activity and splicing of Xbp1 mRNA, we decided to test the effect of IRE1endonuclease activity on the TNF-induced gene activation. Gene activation following TNF stimulation leads to the activation of NF-B, p38 and JNK pathway, inducing the transcription of inflammatory
mediators such as IL-6, IL-1 and TNF. Thus, we decided to measure the activation and expression levels of the downstream components of the TNFR1 response.
Figure 14. IRE1 activity is not required for TNFR1 response. SH-SY5Y cells were stimulated with hTNF (20
ng/mL) for 5, 15, 30, 60 and 90 min in the presence of DMSO or MKC-3946. Cell extracts were analysed with
immunoblot for RIPK1, phosphor-IB, IB, phospho-p38, p38 and phospho-JNK. Data are representative of
one experiment
We first evaluated the effect of MKC-3946, an IRE1 endonuclease inhibitor, on the activation of the MAPK and canonical NF-B pathways by immunoblot analysis (Figure 14). The activation of the canonical NF-B pathway can be measured by the phosphorylation of IB followed by its subsequent degradation. MAPK activation can be measured by the different phosphorylation levels of p38. We stimulated SH-SY5Y cells with hTNF for 5, 15, 30, 60 and 90 min in the presence of DMSO or MKC-3946. As shown in Figure 14 MKC-3946 treatment had no effect on IB and p38 phosphorylation following stimulation of SH-SYH5
cells with hTNF (Figure 14).

Part 3: Results
33
Additional to immunoblot technique, we next used a reporter assay to determine the effect of IRE1endonuclease inhibition on the NFB-dependent transcriptional response induced by TNF. The reporter system is only active once p65/p50 dimers bind to the NF-B transcription factor responsive elements, leading to transcription of the luciferase gene (Figure 15A). hTNF treatment of SH-SYH5 cell alone, led to an increase in the reporter activity by approximately 4-fold after 6 and 18 h (Figure 15B). The presence of the IRE1
inhibitor did not significantly affect the luminescence induced by hTNF stimulation (Figure 15B). Thus, IRE1 endonuclease inhibition has no effect on the activation of downstream components of TNFR1 response
Figure 15. IRE1 activity is not required for TNFR1 signalling to NF-B activation. (A) Schematic diagram of
NF-B GFP Luc Reporter System. The gene construct includes a minimal cytomegalovirus (mCMV) promotor in
conjugation with four copies of the NF-B consensus transcriptional response elements. Upon activation of the
NF-B pathway, the p65/p50(or p52) dimers bind to the NF-B consensus transcriptional response elements
leading to the activation of CMV promotor and transcription of the luciferase gene. Thus, we detected
luminescence only in NF-B active cells. (B) S5HY cells that stably express NF-B GFP Luc reporter were treated
with MKC-3946 (white bars) or were exposed to hTNF (20 ng/mL) in the presence (light blue bars) or absence
(dark blue bars) of MKC-3946 (10 µM). Then, luciferase activity was measured as described before. The
graphics represent the mean and SEM of 5 independent experiments. The value of untreated cells of each
reporter were used to normalize the value of treated cells. T-test was used to determine significant difference
(*=p<0.05; **=p<0.01). Note: The specifically designed reporter system allows monitoring of the NF-B
pathway by detection of GFP fluorescence as well as luciferase for quantitative transcription activation reporter
assays.

Part 3: Results
34
Next to the activation of the different pathways following hTNF binding, we decided to
investigate if IRE1-XBP1 pathway had an effect on the induction of pro-inflammatory
cytokines. XBP1s has been reported to contribute to the inflammatory response induced by
LPS (Martinon et al., 2010). It was shown to be required for full induction of IL-6 and TNF
following LPS stimulation by binding to IL-6 and TNF promoters. Due to the possibility that
TNF-induced XBP1s binds to the promotor regions of specific cytokines, it is possible that
IRE1inhibition had no effect on the NF-B reporter assay because the construct does not
contain the sequences allowing XBP1s binding. We therefore next tested the effect of
IRE1inhibition on endogenous TNF-induced gene activation by qPCR. We stimulated MEF
cells with mTNF for 4, 8, 16 and 24h in the presence or absence of IRE1 endonuclease
inhibitor, MKC-3946. We used LPS (at 8h) as a physiological positive control. We analysed
expression of the mRNA of Il-6, A20 and Il-10.
Figure 16 MEF cells were left untreated (-) or were stimulated with mTNF for 0, 4, 8, 16 and 24h in the
presence (blue bars) and absence of MKC-3946 (green bars). LPS (8h) was used as a positive control. The
induction of A20, Il-6 and Il-10 mRNA was analysed by Real Time PCR. The graphic for A20 and Il-6 represent
three independent experiments with mean and s.e.m.. The graphic of Il-10 represents one experiment (mean
and s.e.m. of technical replicates)

Part 3: Results
35
IL-6 is a pro-inflammatory cytokine that is reportedly an XBP1s-target gene after LPS stimulation (Martinon et al. 2010). Contrary to the published study, we did not observe a decrease of Il-6 mRNA production in the presence of MKC-3946 following LPS stimulation (Figure 16A). This might be due to the use of other cells compared to the indicated study. Similarly, MKC-3946 had no effect on TNF-induced Il-6 mRNA induction (Figure 16A). A20 is an NF-B target gene, forming a negative feedback loop in various signalling pathways. We
found that inhibition of IRE1 by MKC-3946 had not consistent effect on the induction of A20 mRNA following LPS or TNF treatment (Figure 16B). Surprisingly, we found that induction of Il-10 mRNA, an anti-inflammatory cytokine, following 8h of LPS and TNF stimulation was repressed in the presence of the IRE1 endonuclease inhibitor (Figure 16C). Unfortunately, this experiment has only been performed once and repeats are required to confirm the effect.

Part 3: Results
36
3.2.2. Cell death induction
As part of our investigation regarding the potential role of IRE1-XBP1 pathway in the TNF response, we investigated whether IRE1 endonuclease activity has an effect on the TNF-induced cell death. TNF mediates cell death by the formation of cytoplasmic complexes which result either in apoptosis or necroptosis. Apoptosis is characterized by caspase (cysteine aspartate-dependent proteases) activation among others and is rapidly cleared by
neighbouring phagocytes, thus repressing the initiation of an inflammatory response. Necroptosis or regulated necrosis is, contrary to apoptosis, mostly regarded as inflammatory, as it exacerbates the inflammatory response by exposing DAMPs which are recognized by PRR. However, recent studies have suggested that apoptosis could also lead to inflammation by undergoing secondary necrosis in absence of phagocytic cells in vitro (Ting & Bertrand, 2016). Additionally, significant barrier function after massive apoptotic cell death could also contribute to inflammation once microbes enter the organism through the
damaged barrier.
Figure 17. IRE1 endonuclease inhibition sensitizes to TNF-induced necroptosis. We stimulated MEF cells with
SYTOX Green 2.5 M to detect cell death. Cells were treated with Triton X-100 to determine 100% cell
permeabilization. (A) We stimulated MEF cells in with TNF (0.1 ng/mL) and Tak inhibitor (iTAK 10 M) in the
presence of MKC-3946 (10 µM) or Nec-1. (10 M) (B) We stimulated MEF cells TNF (1 ng/mL) in the presence of
zVAD (50 µM) or zVAD (50 µM) + MKC-3946 (10 µM). As control, we stimulated cells only with IRE1α inhibitor,
MKC-3946 (10 µM). The graphs represent the mean and s.e.m. of three independent experiments.
As both types of cell death are induced following TNF binding, we decided to study whether both or one of the types were influenced following IRE1 endonuclease inhibition. To detect cell death, we used a plate-based fluorometric assay to monitor cell membrane
permeablization indicated by an increase in intensity of a cell-impermeable dye (SYTOX
Green) after plasma membrane permeabilization (Grootjans et al, 2016). SYTOX Green is a
cell-impermeable dye that selectively binds to double-stranded DNA after plasma membrane rupture (Jones & Singer, 2001). To calculate the cell death percentage following treatment,

Part 3: Results
37
we used Triton X-100 to obtain the maximal SYTOX Green intensity, corresponding to 100% cell membrane permeabilization (100% cell death).
We stimulated MEF cells with TNF and TAK-1 inhibitor (iTAK) to induce apoptosis. TAK-1 is involved in the control of RIP1-dependent apoptosis triggered by TNFR1 complex II. Inhibition of TAK-1 by iTAK in combination with TNF leads to the induction of RIP1-dependent apoptosis (Wang et al, 2015). As expected, we observed a strong increase in cell
death following iTAK and TNF stimulation of the cells (Figure 17A). Inhibition of IRE1 endonuclease activity by MKC-3946 had no effect on cell death (Figure 17A). To ensure that the cell death detected by the assay was RIP1-dependent, we stimulated cells with necrostatin (Nec-1), an inhibitor of RIP1 kinase (Degterev et al, 2008). As expected, Nec-1 protected the cells against iTAK-induced cell death. However, due to the strong induction of cell death after 8 hours following iTAK and TNF stimulation, we might not have been able to detect the effect of IRE1α inhibition on cell death.
TNF-induced necroptosis, contrary to apoptosis, is a regulated caspase-independent cell death mechanism. Thus, we induced a shift from apoptosis to necroptosis by using a pan-caspase inhibitor known as zVAD-FMK in combination with TNF. Following treatment, we observed an increase in cell death percentage (Figure 17B). In the presence of IRE1α inhibitor, we observed a sensitization to cell death following zVAD-FMK and TNF treatment. To determine whether IRE1α inhibition alone could induced cell death, we treated MEF cells with MKC-3946 alone. Following this treatment, we observed no induction of cell death.
Thus, IRE1 has an effect on TNF-induced necroptosis but not on TNF-induced apoptosis.

Part 4: Discussion
38
4. Discussion
Tumour Necrosis Factor (TNF) is a cell signalling protein (cytokine) that plays an important role in the coordination of the inflammatory response. Subsequently, dysregulation of the TNF signalling pathway can result in pathogenesis and lead to the development of various
inflammatory diseases, including inflammatory bowel disease (IBD), rheumatoid arthritis, psoriasis and sepsis (Kalliolias & Ivashkiv, 2015). Uncovering the mechanisms regulating TNF signalling at a cellular and molecular level is therefore a crucial factor which could benefit the public health. For a long time, it has been assumed that TNF solely functions as a driver of inflammation via MAPK- and NF-κB-mediated induction of pro-inflammatory mediators (Wajant et al, 2003). More recent data however indicate that TNF-induced apoptosis or necroptosis could promote inflammation (Ting & Bertrand, 2016). The unfolded protein response (UPR), which is primarily known for its role in ER homeostasis, emerges as a new
signalling network that contributes to the host inflammatory response. Stemming from this possible link between the UPR and inflammation, a lot of interest has been focussed on finding therapeutics targeting the UPR. Small molecules, for example, inhibiting IRE1 and PERK have recently been described (Hetz et al, 2013) Despite the increasing interest, the exact physiological mechanisms that activate the UPR (or part of it) and the precise contribution of the different UPR branches to inflammation have yet to be uncovered. The finding that some, but not all TLRs, can specifically activate the IRE1-XBP1 pathway
independently of a general ER stress response (Martinon et al, 2010) has opened the door to a new field of research on the role of physiologically activated UPR (or part of it) downstream of immune and death receptors. In this study, we decided to investigate whether TNF also activates the UPR and whether the UPR contributes to the inflammatory responses generated by TNF, namely via gene activation or cell death induction.
Similarly as previously reported for LPS, our results have demonstrated that TNF can activate the IRE1-XBP1 branch but not the PERK arm of the UPR. We have indirectly shown that TNF
activates the endonuclease activity of IRE1 using a reporter cell line which reports the splicing of a recombinant protein existing of a part of the XBP1 gene and a luciferase gene. Additionally, we have shown in MEF cells that activation of TNFR1 is sufficient to induce XBP1 mRNA splicing. We could indirectly demonstrate that XBP1 mRNA splicing induced by TNF was IRE1α dependent using an IRE1 endonuclease inhibitor known as MKC-3946 in
MEF cells. However, we could not directly prove that IRE1 was activated in MEF cells due to problems with immunoblotting detection. When performing immunoblotting, we did not observe an increase in protein levels of XBP1s after LPS stimulation even though previous
studies detected phosphorylation of IRE1 and induction of XBP1s protein (Martinon et al, 2010). This could be due to the fact that the endogenous expression levels of these proteins are too low when treating MEF cells with a physiological positive control such as LPS. Consequently, MEF cells, contrary to J774 cells, could need a higher concentration of LPS to trigger phosphorylation of IRE1α and induction of XBP1s protein. Alternatively, a higher concentration of proteins could be used in further experiments to detect IRE1-XBP1
pathway activation at the protein level. Due to the lack of direct evidence regarding the
activation of IRE1 it would be interesting to repeat the immunodetection to determine if
indeed IRE1 is activated by TNF. Additionally, demonstrating XBP1 mRNA splicing in SH-
Part 4: Discussion
39
SY5Y cells would be interesting because we could demonstrate IRE1 endonuclease activity in the human reporter cell line but we did not investigate the splicing of XBP1 mRNA.
As mentioned previously, we could demonstrate that TNF was sufficient for XBP1 mRNA splicing using semi-quantitative PCR. The fact that the splicing of XBP1 mRNA was less probing when stimulating the mouse cells with hTNF (an agonist of TNFR1) than with mTNF, which activates both TNFR1 and TNFR2 (Brouckaert et al, 1992), indicate that TNFR2 could
still contribute to the maturation of XBP1 mRNA. Alternatively, this could just reflect the difference in the biological activity of both recombinant proteins (Ameloot et al, 2002). To test these different hypothesis, further examination of the two receptors should be performed using genetic methods. A possibility is to use siRNA directed against TNFR1 or TNFR2 to test the different contribution in the splicing of XBP1 mRNA. Alternatively, mutants for TNFR1 or TNFR2 could also be used to test their contribution.
To strengthen our argument regarding IRE1-XBP1 activation by TNF, we performed real-
time qPCR on samples extracted from TNF-stimulated MEF cells. However, we encountered problems. We could not observe increase in the levels of XBP1 mRNA after LPS and TNF stimulation. Oddly, when using the same primers for traditional PCR we observed an increase in XBP1 mRNA levels which could be quantified by densitometric detection. However, we could not observe the same increase when performing real-time PCR. This could be due to poor primer design, making the used primers inefficient with real-time PCR. Incorrect primer concentration could also have consequences on the detection.
As expected from previous studies (Martinon et al, 2010) describing TLR2 and TLR4-mediated activation of IRE1-XBP1 pathway to be different than during ER stress, we observed that TNF stimulation triggered activation of IRE1 endonuclease activity and splicing of XBP1 mRNA in the absence of induction of the ER stress XBP1-target genes EDEM and ERDJ4. EDEM was shown to play a critical role in the ERAD pathway by facilitating degradation of ERAD substrates (Hosokawa et al, 2006). ERDj4 is localized to the ER and displays Hsp40-like ATPase augmenting activity for the Hsp70 family chaperon family
(Kanemoto et al, 2005). Both genes are normally induced following ER stress but were not induced following LPS and TNF stimulation, indicating that IRE1-XBP1 activation occurred in a non-traditional and specific manner. However, as we were only restricted to the analysis of two different XBP1 target genes, we cannot completely rule out the induction of other XBP1s target genes that are also induced during ER stress. A possible candidate to determine
whether TNF induces XBP1s target genes, is protein disulphide isomerase (PDI) (Martinon et al, 2010). It would also be interesting to determine whether TNF in combination with Tm represses the transcription of XBP1 target genes, including EDEM, ERDj4 and PDI, as was
previously reported for LPS (Martinon et al, 2010). This would further demonstrate that TNF signalling blocks the classical IRE1α-XBP1 pathway.
Next to its role in XBP1 mRNA splicing, IRE1 endonuclease activity also degrades other mRNAs in a process called IRE1-dependent decay (RIDD) (Maurel et al, 2014). The differential substrate preference has been reported to be translated into cell fate determination as activation of XBP1 splicing by IRE1 promotes cell survival while RIDD
activation leads to cell death in vivo. Additionally, IRE1RIDD-RIGI pathway has been linked
to inflammation in the presence of viral RNA (Cho et al, 2013). Therefore, we were
interested to determine whether TNF signalling response could trigger RIDD activity. Blocs1 and Sparc are both RIDD-targets whose mRNA levels are reduced under ER stress conditions
Part 4: Discussion
40
induced by non-physiologic inducers such as Tm. Using real-time qPCR, we sought to determine whether TNF stimulation led to an increase in RIDD activity by analysing the mRNA levels of these two genes in the presence or absence of an IRE1 endonuclease inhibitor termed MKC-3946. Due to the high variability between the three independent experiments, we could not draw any conclusion regarding the involvement of TNF and LPS in RIDD activation. This experiment should thus be repeated. However, we could observe an
increase in mRNA levels following MKC-3946 treatment in combination with Tm. MKC-3946 has not been tested yet if it could inhibit RIDD activity (Ghosh et al, 2014). This study could at least indicate that indeed, MKC-3946 inhibits RIDD activity in vitro.
Apart from the TNF induction of IRE1 endonuclease activity and XBP1 mRNA splicing, we demonstrated that TNF does not trigger the PERK branch (or part of it) by using immunoblotting and qPCR. Interestingly, even though PERK phosphorylation and CHOP induction was not detected by immunoblotting, we could observe phosphorylation of eIF2
by TNF. Previous reports have indicated that other kinases phosphorylate eIF2 (Wek et al, 2006). TNF could directly or indirectly activate such kinase leading to the phosphorylation of eIF2. This could be interesting as phosphorylation of eIF2 leads to global translation inhibition which reported to lead to the activation stress-related transcription factors such as NF-B by lowering the steady-state levels of regulatory proteins such as IB (inhibitor of NF-B) (Deng et al, 2004). Thus the increase of phosphorylation of eIF2 by TNF could contribute to the initiation or maintenance of the inflammatory response. This could be tested using a selective inhibitor of cellular complexes that phosphorylate eIF2(Oslowski &
Urano, 2011). Additionally, genetically modifying the phospho-binding part of IRE1 could also be used to determine the role of IRE1kinase activity. Of note, LPS could also lead to the phosphorylation of eIF2 as this was not tested in the previous report (Martinon et al, 2010). It would be interesting to determine if LPS also leads to the phosphorylation of eIF2.
Based on all the data collected regarding the activation of the UPR by TNF, we can conclude that TNF activates a part of the IRE1-XBP1 pathway and a part of the PERK pathway. Further experiments on the role of TNF on the activation of the ATF6 branch need to be
performed to finalize the role of TNF to the UPR. The activation of ATF6 by TNF could be investigated using by immunoblotting analysis using an anti-ATF6 specific antibody (Oslowski & Urano, 2011). Additionally, measuring mRNA expression levels of genes induced following ATF6 activation could be an alternative method to detect ATF6 activation. The complete review of the activation of the UPR following TNF stimulation would be interesting as the ER
response is complex and cooperative by nature.
Having established that TNF signalling specifically activated the IRE1-XBP1 branch, we next
evaluated its contribution to TNF-mediated gene activation and cell death induction. TNF-mediated gene activation results from the activation of the MAPK-p38 and NF-B pathway which induce the transcription of inflammatory cytokines (Wajant et al, 2003). Our findings indicate that IRE1 endonuclease activity is not required for TNF-mediated activation of the p38-MAPK and NF-B pathways. The notion that IRE1-XBP1s was not required for TNF to signal to NF-B was further shown using the NF-B reporter assay. However, as previous
report showed that XBP1s induced by LPS binds to IL-6 and TNF promotors and that it was
required for the full induction of IL-6 and TNF following LPS stimulation (Martinon et al,
2010), we were interested to determine whether TNF is required for the induction of these cytokines. This could be argued on the base that IRE1inhibition had no effect on the NF-B

Part 4: Discussion
41
reporter assay because the construct does not contain the sequences allowing XBP1s binding. We used real-time qPCR to evaluate the role of I IRE1 endonuclease activity in TNF-mediated induction of IL-6, IL-10 and A20. While IL-6 is a pro-inflammatory cytokine, IL-10 is an anti-inflammatory cytokine which inhibits the induction of pro-inflammatory cytokines (Couper et al, 2008). A20 is another NF-B target gene that act as a negative feedback loop by repressing NF-B activation (Verhelst et al, 2012). Contrary to the previous
report regarding LPS stimulation in J774, we observed no effect of IRE1 endonuclease inhibition when performed in MEF cells. This could explain why we did not observe a significant change on TNF-induced IL-6 production following IRE1 inhibition. It could be that the promotor region of IL-6 in MEF cells does not contain the XBP1s-binding domain. To determine if this indeed the case, it would be interesting to perform an in silico experiment on MEF cells following LPS stimulation. Additionally, it would be interesting to determine whether IRE1α endonuclease activity has an effect on the TNF-induced production of IL-6 in J774 cells. TNF-and LPS- induced production of A20 was also not impacted by the inhibition
of IRE1α. Interestingly, IRE1 inhibition has been hinted as a potential regulator that enhances the production of anti-inflammatory cytokine IL-10. As we only performed the real-time qPCR for IL-10 once, it would be interesting to confirm whether TNF-mediated IL-10 upregulation is indeed dependent on IRE1 endonuclease activity, as altered levels of IL-10 has been shown to be linked to inflammatory diseases such as psoriasis, Grave’s diseases, rheumatoid arthritis (Li & He, 2004). However, contrary to the previous study on which this study is based, we inhibited IRE1 endonuclease activity and thus the effects on the
production of the different cytokines could result from both the inhibition of XBP1 mRNA splicing and the inhibition of RIDD activity. Therefore, to conclude whether these effects result solely on the binding of XBP1s to the promotor region, new experiments should be performed using knock-out mutants for the XBP1 gene. Additionally, siRNA or shRNA targeted against XBP1 could also be used to test whether the absence of XBP1s leads to an effect on the production of the different cytokines.
TNF-induced cell death in the other aspect investigated in regard to the role of IRE1
endonuclease activity in the TNF response. Our findings have shown that IRE1 inhibition sensitizes MEF cells to TNF-induced necroptosis but not TNF-induced apoptosis. This is interesting, as necroptosis is characterized by the release of DAMPs leading to the initiation of the inflammatory response (Takeuchi & Akira, 2010). IRE1 endonuclease could protect the cells against the inflammatory response by preventing the disruption of the cell death checkpoints. Interestingly, the exact mechanism behind the switch from TNF-mediated
apoptosis and necroptosis is still not clear (Ting & Bertrand, 2016). The fact that IRE1 endonuclease inhibition sensitizes to TNF-mediated necroptosis and not apoptosis could
indicate IRE1has a potential role in the switch between the two types of cell death. Therefore, it would be interesting to see at which level the IRE1 could contribute to the regulation of different checkpoints. The protective nature of IRE1 against inflammation is further strengthen by the observation that IRE1 is needed for the production of IL-10, a known anti-inflammatory cytokine. The fact that eIF2 phosphorylation was observed after TNF stimulation, followed by the data regarding the involvement of IRE1 in the TNF
response, could indicate TNF signalling pathway and the UPR are interconnected and allow
the “fine tuning” of the inflammatory response.

Part 4: Discussion
42
We would also like to note that the inhibition of IRE1endonuclease activity was only performed using one type of inhibitor, termed MKC-3946. This inhibitor has been reported to inhibit XBP1 mRNA splicing and to induce cytotoxicity in MM cells (Ghosh et al, 2014). As it could be that effects observed following MKC-3946 treatment in MEF cells result from the induction of this cytotoxicity, it would be interesting to use other types of inhibitors which have not been reported to induce such toxicity. As MKC-3946, STF-083010 is IRE1
endonuclease inhibitor that does not affect IRE1 phosphorylation (Papandreou et al, 2011). Additional to the use of another type of IRE1 endonuclease inhibitor, it would be interesting to use an inhibitor which has been reported to inhibit both the endonuclease and kinase activity. It could help determine whether IRE1endonuclease activity is only necessary to “fine tuning” the inflammatory response or if the IRE1kinase activity is necessary as well. An example is compound 3, an inhibitor which has been reported to inhibit endonuclease and kinase activity (Wang et al, 2012). Apart from the chemical approach, it would also be interesting to determine the role of IRE1endonuclease and
kinase activity by using a genetic approach.
In conclusion, the data obtained during this master thesis indicate that TNF can activate parts of the UPR (IRE1-XBP1 pathway and eIF2α). The results regarding the contribution of the UPR to the TNF-mediated inflammatory response are too preliminary to draw clear conclusions, but it at least opens exciting perspectives for future work.

Part 4: Discussion
43
Tumour Necrosis Factor (TNF) is een belangrijke cytokine dat een belangrijke rol speelt in the coordinatie van de onstekingsreactie. Ontregeling van de TNF signaalweg kan daarom leiden tot de ontwikkeling van verschillende chronische onstekingsziektes. Een paar voorbeelden zijn inflammatoire darmziekten, psoriassis en sepsis (Bradley, 2008). Doordat TNF cruciaal is in inflammatie, is de interesse in het opklaren van de onderliggende mechanism, zowel op cellulair als moleculair vlak, sterk toegenomen. Dit zou namelijk leiden tot de ontwikkeling
van therapeutische doelwitten die gebruikt worden om bepaalde chronische ziektes te stoppen of af te remmen. Vroeger werd er verondersteld dat TNF enkel tot inflammation kon bijdragen door het induceren van pro-inflammatorische molecules via het activeren van de NF-B en MAPK pad (Wajant et al, 2003). Nu blijkt dat TNF ook tot inflammatie kan bijdragen door inductie van apoptosis of necroptosis (Ting & Bertrand, 2016). De “unfolded protein response” (of UPR) is een pad dat voornamelijk bekend staat voor zijn rol in de homeostasis van het endoplasmatisch reticulum . Tegenwoordig wordt de UPR als een nieuw signaalnetwork voorgeschoteld die zou bijdragen tot onsteking. Het onderling verband
tussen de UPR en inflammatie wordt vandaag de dag nog meer uitgezocht om mogelijke therapiën te ontwikkelen. Maar ontdanks het sterke interesse is het volledig mechanism dat leidt tot de activatie van de UPR (of delen ervan) en hun rol in inflammatie nog steeds niet helemaal opgeklaard. De ontdekking dat het IRE1-XBP1 pad specifiek kan geactiveerd worden door TLR’en, in afwezigheid van een algemene ER stress respons (Martinon et al, 2010) heeft tot een sterke uitbreiding geleid op het vlak van UPR en inflammatie. In deze thesis hebben we besloten om de mogelijke activatie van de UPR door TNF te onderzoeken.
Hiernaast hebben we ook de bijdrage van de UPR in de onstekingsreactie gegenereerd door TNF bestudeerd.
Onze resultaten hebben aangetoond dat TNF leidt tot de activatie van een deel van de UPR. We hebben aangetoond dat TNF leidt tot de activatie van het IRE1-XBP1 pad en het PERK pad. Het eerste werd bewezen na gebruik van een reporter cellijn die de activering van de endonuclease activiteit van IRE1aangeeft. Hiernaast hebben we door gebruik van semi-kwantitatieve PCR, ook aangetoond dat XBP1 mRNA wordt geklieved na toediening van TNF
en dat de klieving van dit mRNA afhankelijk is van IRE1. De keuze voor deze methode lag aan het verschil in gevoeligheid. Eerst werd een poging tot rechtstreekse detectie van IRE1 endonuclease activatie geprobeerd door gebruik te maken van proteinen analyse, maar deze methode werd geteigerd door technische problemen. Fosforylatie van IRE1 in MEF cellen na LPS stimulatie werd niet gedetecteerd ook al werd die alvoorens bewezen in J774 cellen (Martinon et al, 2010). De problemen die werden aangetroffen in MEF cellen bij het gebruik
van proteinen analyze kunnen aan het lage endogene niveau van de eiwitten liggen. Dus om rechstreeks bewijs te generen zou dit experiment moeten herhaald worden met verschillende
concentraties of in verschillende cellen zoals J774 cellen. Naast de problemen aangetroffen met immunoblotting, werden er ook problemen gevonden bij het gebruik van qPCR. Ook al is qPCR normaalsgezien een heel gevoelige methode, hebben we geen gelijkaardig klieving van XBP1 mRNA na TNF toediening dan wanneer we PCR gebruikte, ook al werden dezelde primers gebruikt. Door het gebrek aan significante inductie van XBP1s na LPS stimulatie, werd er verondersteld dat de gebruikte primers niet geschikt zijn voor qPCR.
Omdat we verschillende types TNF tot beschikking hadden, die elk agonisten zijn voor
verschillende TNF receptoren in MEF cellen (Brouckaert et al, 1992), hebben we getest of er
een verschil was in bijdrage tussen de verschillende receptoren. Klieving van XBP1 mRNA na

Part 4: Discussion
44
stimulatie met hTNF, een TNFR1 agonist, in MEF cellen lag lager dan na mTNF stimulatie. Doordat mTNF zowel bindt aan TNFR1 en TNFR2, kunnen we veronderstellen dat TNFR2 tot een extra bijdrage leidt in verband met XBP1 mRNA klieving. Natuurlijk kan dit verschil ook aan een differentiële biologische activiteit liggen (Ameloot et al, 2002). Daarom zouden extra proeven moeten worden uitgevoerd om de bijdrage van TNFR1 en TNFR2 te testen.
Nadat we de klieving van XBP1 mRNA en de activering van IRE1 konden bewijzen, waren we
geinteresseerd in de bijdrage van TNF om XBP1-doelgenen te induceren. We hebben twee genen genaamd EDEM en ERDJ4 gebruikt die gekend staan als genen die een belangrijke rol stelen in het ERAD pad en die geinduceerd worden na traditionele ER stress (Lai et al, 2012; Hosokawa et al, 2006). Het gebrek aan inductie van XBP1-doelgenen na LPS toediening werd voorgaans al aangegeven en in deze studie hebben we dit fenomeen ook waargesteld. Hiernaast, hebben we hetzelfde fenomeen na TNF stimulatie ook gedetecteerd. IRE1 heeft naast de klieving van XBP1 mRNA, nog een bijkomende functie. Een proces genaamd “IRE1-
dependent decay” (RIDD) is een mechanism dat specifieke mRNA klieft voordat ze afgebroken worden (Maurel et al, 2014). Het leidt volgens verschillende studies tot de bepaling van het noodlot van een cel en zou in vivo leiden tot celdood. Sparc en Blocs zijn twee mRNAs die na LPS en TNF toediening niet worden afgebroken. Door de sterke variabiliteit binnen de stalen, suggereren we dat de proeven moeten vervat worden om een beduidende conclusie te kunnen trekken.
De andere tak van de UPR die bestudeerd werd was PERK. Het is een pad die na activering
leidt tot inhibitie van proteinsynthese met als doel, vermindering van ER stress. Dit wordt bereikt door fosforylatie van PERK en eIF2Voorgaande studie heeft aangetoond dat LPS niet tot activering van PERK leidt in J774 cellen (Martinon et al, 2010) en dit werd nogmaals aangetoond in MEF cellen. TNF leidde ook niet tot PERK activering nadat er geen PERK fosforylatie en CHOP inductie werd gedetecteerd. Het was wel opmerkelijk dat TNF stimulatie leidde tot fosforylatie van eIF2, ook al werd die niet geobserveerd in het geval van LPS. Het zou dus kunnen dat TNF andere kinasen, verschillend van PERK, activeert. Om de hele UPR te bestuderen moet de ATF6 tak nog bestudeerd worden.
Nadat de bijdrage van TNF in de activering van het IRE1-XBP1 pad werd vastgesteld, waren we geïnteresseerd in de bijdrage van het IRE1-XBP1 pad tot de TNF signaalweg. Het onderzoek werd opgesplitst in twee delen: onderzoek naar de bijdrage in TNF-gen activatie en TNF-geïnduceerde celdood. Gen activatie is het gevolg van activering van de MAPK en NF-
B paden door TNF (Wajant et al, 2003). Deze paden leiden tot de inductie van inflammatoire cytokines zoals IL-6, IL-1 en TNF. Voorgaande studies hebben aangetoond dat XBP1s, dat geinduceerd werd door LPS, bindt aan de promotor van IL-6 en TNF en dat deze binding
noodzakelijk is voor aanhoudende productie van deze cytokines (Martinon et al, 2010). Dit leidde tot onze interesse in het onderzoek naar een gelijkaardige functie voor TNF in de productie van cytokines. We hebben kunnen aantonen dat IRE1 endonuclease activiteit geen invloed heeft op de activering van de MAPK en NF-B paden door gebruik te maken van proteïnen analyse en een reporter cellijn (in het geval van NF-B). Ook al konden we geen invloed van IRE1 endonuclease vinden in verband met de activering van de verschillende
paden, konden we niet uitsluiten dat TNF toch een effect had op de productie van cytokines.
Deze veronderstelling was gebaseerd op het feit dat de reporter cellijn de nodige sekwentie
voor XBP1s binding niet bevatte, waardoor er geen effect zichtbaar was. We hebben qPCR gebruikt als techniek om de invloed van IRE1 endonuclease activiteit op cytokine productie
Part 4: Discussion
45
te meten. Als cytokines, hebben we IL-6, IL-10 en A20 opgemeten. Na LPS stimulatie in MEF cellen, kregen we resultaten die in tegenstrijd waren met voorgaande rapportering tot betrekking met IL-6 (Martinon et al, 2010). We konden geen invloed detecteren van IRE1 endonuclease activiteit op de productie van IL-6. Dit kan liggen aan het feit dat in tegenstelling tot J774 cellen, MEF cellen geen XBP1-bindingsekwentie bevat in de promotor regio van IL-6. A20, een NF-B doelgen, ondervond ook geen effect op mRNA productie na
inhibitie van IRE1 endonuclease. Opmerlijke was dat IL-10 mRNA productie helemaal werd stilgelegd na inhibitie van IRE1 endonuclease. Spijtig genoeg werd dit experiment maar eenmalig uitgevoerd waardoor verdere proeven nodig zijn om een eenduidend besluit te kunnen trekken. Toch is dit hoopvol, omdat ontregeling van IL-10 productie kenmerkelijk is voor verschillende chronische ontstekingsziektes zoals psoriasis, Grave’s disease en rheumatische arthritis (Li & He, 2004; Hasnain et al, 2013).
Naast TNF-geïnduceerde gen activering, hebben we ons ook toegespitst op de invloed van
IRE1 endonuclease activiteit op de inductie van apoptosis en necroptosis door TNF. Onze resultaten suggereren dat IRE1 endonuclease bijdraagt tot de regulering van necroptosis inductie. Geen invloed werd vastgesteld in verband met de inductie van apoptosis. Doordat de productie van IL-10 en de inductie van necroptosis zou worden beïnvloed door IRE1 endonuclease activiteit, suggereert dat IRE1 endonuclease de onstekingsreactie kan afremmen. Hiernaast heeft de fosforylatie van eIF2die kan leiden to de inductie van het NF-B pad aangewezen dat de UPR en inflammatie op een of andere manier gelinkt zijn.
We zouden hierbij wel willen melden dat alle experimenten werden uitgevoerd met eenzelfde type inhibitor voor IRE1 endonuclease activiteit en dat we methoden zouden gebruikten om de bijdrage van IRE1 endonuclease activiteit in inflammatie concreet te kunnen bevestigen.
Uit de data gegenereerde tijdens deze master thesis, werden er aanwijzigen geleverd naar de invloed van TNF op de activering van de UPR (of delen ervan) en op de rol van IRE1 endonuclease activiteit op de inflammatie. Toch zijn de resultaten te buitensporig om enige definitieve conclusies te kunnen trekken. Ook al zullen er dus extra proeven moeten
uitgevoerd worden, blijkt de toekomst op dit vlak veelbelovend.

Part 5: Materials and Methods
46
5. Materials and Methods Cell cultures and cell lines
SH-SY5Y-XBP1-Luc rep clone beta 6 and SH-SY5Y-NFB rep GFP luc High cells were provided by Mathieu Bertrand (Flemish Institute of Biotechnology). SH-SY5Y-XBP1-Luc rep clone beta 6 and SH-SY5Y-NFB rep GFP luc High cells were maintained in Dulbecco’s Modified Eagle
minimum essential medium (DMEM) containing 15% fetal bovine serum (FBS), L-Glutamine (L-Gln), P/S and Non Essential Amino Acids (NEAA) (2ml/500ml). Transfection of the different constructs was performed by Dr. Miguel Aguileta. To maintain the cells stably transfected with the reporter construct, cells were selected with 1mg/ml neomycin.
The RIP1 WT MEF cells were maintained in Dulbecco’s Modified Eagle minimum essential medium (DMEM) containing 5% bovine fetal serum, L-glutamine. For the subsequent experiments, the indicated cells were seeded in 6-well plates, grown to semi-to full
confluence and treated with the following components: mTNF, hTNF (both in house), LPS (Invivogen), Tm (sigmaaldrich) and MKC-3946 (biocentury) at the indicated concentrations.
Measurement of luciferase activity
The reporter construct has been described (Iwawaki et al., 2009). For analysis of the luciferase activity, 2.5 x 10⁵ of the indicated cells SH-SY5Y-XBP1-Luc rep clone beta 6 that stably express the reporter construct (ERAI-Luc reporter), and SH-SY5Y-NFκB rep GFP luc High cells that stably express the reporter construct (NF-B GFP Luc Reporter System) were
seeded in 96-well plates, grown to semi-confluence and used for subsequent experiments. The treatment used in this study was as follows: hTNF (20 ng/mL), Tm (100 ng/mL), and MKC (10µM).
After the cells that stably expressed each of the indicated luciferase constructs were treated with the indicated reagents, the cells were lysated using 75 microliters of prewarmed Steady Glo Luciferase Assay System (E2510, Promega) (containing Steady Glo buffer and Steady Glo substrate) per well. The 96 well plates were incubated for 5 minutes at room temperature
protected from light on a plate shaker. Luminescence was measured with Benchmark Microplate Reader. The luminescence measurements were integrated over 5s per well. Luciferase levels were normalized by dividing to luciferase activity at 18 and 6 h by luciferase activity at time zero. Five independent experiments were carried out with similar results.
RNA extraction, RT-PCR
For PCR, 105 MEF cells were seeded two days before in 6-well plates. The cells were stimulated with 20 ng/mL mTNF or hTNF over 4, 8, 16 and 24h with or without MKC-3946
(10 µM), an IRE1α endoribonuclease inhibitor. Total RNA extraction was prepared by TRIzol (Invitrogen) or RNeasy Mini Kit purification columns (Qiagen) and cDNA was synthesized IScript cDNA synthesis Kit (BioRAD).
We separated the PCR product by electrophoresis on an UltraPure Agarose (Invitrogen) gel with the following percentage: 1.5% for actine and XBP1 PST1 PCR products, 2% for XBP1total and XBP1s PCR products, and 2.5% for XBP1 conventional splicing PCR products.
The products were visualized by ethidium bromide staining and exposing gel to UV light.

Part 5: Materials and Methods
47
Real Time PCR
Real Time PCR was performed using Roche Lightcycler 480 SensiFast Sybr No-ROX kit (Bioline). The relative amount of mRNA was calculated by comparative threshold cycle method with β-actin, TBP and Rlp13A as controls. Primer sequences (see Table 1)
Immunoblot analysis
For immunoblotting, 105 MEF cells were seeded two days before in 6-well plates. The cells were stimulated with 20 ng/mL mTNFα over 4, 8, 16 and 24h. As controls, MEF cells were stimulated for 8h with 100 ng/mL LPS, 100 ng/mL Tm and 10 µg/mL Tm. Cells were washed with ice-cold PBS before lysis in 1x Laemmli Buffer. Total cells extracts were diluted to a total concentration of 2 mg/ml and 30 µl of 5x Laemmli buffer was added to the lysates. Total cell extracts were separated by SDS-PAGE and transferred to nitrocellulose membrane. The following antibodies were used for immunoblot analysis: anti-XBP1s (Poly6195, Biolegend),
antibody for phosphorylated PERK (16F8, Cell Signaling Technology), antibody for total PERK (C33E10, Cell Signaling Technology), antibody for phosphorylated IRE1 (PA1-16927, Thermo Scientific), antibody for total IRE1(H190, Santa Cruz Biotechnology), antibody for CHOP (L63F7, Cell Signaling Technology), antibody for phosphorylated eIF2 (Cell Signaling Technology), antibody for eIF2 (Cell Signaling Technology), antibody for -tubulin (abcam), antibody for Hsp90 (AC88 ,abcam)
Analysis of Cell death
MEFs were seeded a day before at 105 cells per well in triplicates in a 96-well plate. The next day, cells were pre-treated with the indicated compounds for 30min and then stimulated with hTNF (0.1 or 1 ng/mL) in the presence of 2.5 µM SytoxGreen (Invitrogen). SytoxGreen intensity was measured at intervals of 1hr using a Fluostar Omega fluorescence plate reader, with an excitation filter of 485 nm (SytoxGreen) or 360 nm (Ac-DEVD-MCA), emission filter of 520nm (SytoxGreen) or 460nm (Ac-DEVD-MCA), gains set at 1,100,20 flashes per well and orbital averaging with a diameter of 3mm. Percentage of cell death was calculated as (induced fluorescence –background fluorescence)/(max fluorescence – background
fluorescence )*100. The maximal fluorescence is obtained by full permeabilization of the cells using Triton X-100 at a final concentration of 0.05%.
Statistical analysis
The significance of differences between treatment groups were identified with a t-test. P-values of less than 0.05 were considered statistically significant.

Part 5: Materials and Methods
48
Table 1 Real Time primers used for mRNA quantification
Target Sequences
Mouse XBP1 conventional splicing
Forward 5’- ACACGCTTGGGAATGGACAC-3’, and reverse 5’- CATGGGAAGATGTTCTGGG-3’
Mouse XBP1 total Forward 5’- ACATCTTCCCATGGACTCTG-3’ and reverse 5’-TAGGTCCTTCTGGGTAGACC-3’
Mouse XBP1 PST1 Forward 5’-AAACAGACTAGCAGCGCAGACTGC-3’ and reverse 5’-GGATCTCTAAAACTAGAGGCTTGGTG-3’
Mouse XBP1s Forward 5’-TGCTGAGTCCGCAGCAGGTG-3’ and reverse 5’-GACTAGCAGACTCTGGGGAAG-3’
Mouse Actine Forward 5’- CTCAGGAGGAGCAATGATCTTGAT-3’ and reverse 5’- TACCACCATGTACCCAGGCA-3’
Mouse EDEM1 Forward 5’- TTCCCTCCTGGTGGAATTTG-3’ and reverse 5’-
AGGCCACTCTGCTTTCCAAC-3’
Mouse ERBJ4 Forward 5’- GACAGTCCTGCAGTCCTTGCT-3’ and reverse 5’- TTACCAATGGCAAAGGACAAA-3’
Mouse Sec61a1 Forward 5’- CTATTTCCAGGGCTTCCGAGT-3’ and reverse 5’- AGGTGTTGTACTGGCCTCGGT-3’
Mouse Scara3 Forward 5’-TGACAGGGATGTACTGTGTGT-3’ and reverse 5’-TGCAAAGATAGGTTCTTCTGGC-3’
Mouse Bloc1s1 Forward 5’-TCCCGCCTGCTCAAAGAAC-3’ and reverse 5’-GAGGTGATCCACCAACGCTT-3’
Mouse Col6a1 Forward 5’-CTGCTGCTACAAGCCTGCT-3’ and reverse 5’-CCCCATAAGGTTTCAGCCTCA-3’
Mouse Rlp19 Forward 5’- CTGATCAAGGATGGGCTGAT-3’ and reverse 5’- GCCGCTATGTACAGACACGA-‘
Mouse CHOP Forward 5’- TGGAGAGCGAGGGCTTTG-3’ and reverse 5’-
GTCCCTAGCTTGGCTGACAGA-3’
Mouse BiP Forward 5’- TCATCGGACGCACTTGGAA-3’ and reverse 5’-
CAACCACCTTGAATGGCAAGA-3’
Mouse ATF3 Forward 5’- GAGGATTTTGCTAACCTGACACC-3’ and reverse 5’- TTGACGGTAACTGACTCCAGC-3’
Mouse TBP Forward 5’-TCTACCGTGAATCTTGGCTGTAAA-3’ and reverse 5’-TTCTCATGATGACTGCAGCAAA-3’
Mouse Rlp13A Forward 5’-CCTGCTGCTCTCAAGGTTGTT-3’ and reverse 5’-
TGGTTGTCACTGCCTGGTACTT-3’

References
49
References
Ameloot P, Takahashi N, Everaerdt B, Hostens J, Eugster H-P, Fiers W & Brouckaert P (2002) Bioavailability of recombinant tumor necrosis factor determines its lethality in mice. Eur. J. Immunol. 32: 2759–2765 Available at: http://doi.wiley.com/10.1002/1521-4141%282002010%2932%3A10%3C2759%3A%3AAID-IMMU2759%3E3.0.CO%3B2-L [Accessed August 8, 2016]
Aragón T, van Anken E, Pincus D, Serafimova IM, Korennykh A V, Rubio CA & Walter P (2009) Messenger RNA targeting to endoplasmic reticulum stress signalling sites. Nature 457: 736–40 Available at: http://dx.doi.org/10.1038/nature07641
Bertrand MJM, Milutinovic S, Dickson KM, Ho WC, Boudreault A, Durkin J, Gillard JW, Jaquith JB, Morris SJ & Barker PA (2008) cIAP1 and cIAP2 Facilitate Cancer Cell Survival by Functioning as E3 Ligases that Promote RIP1 Ubiquitination. Mol. Cell 30: 689–700
Bradley JR (2008) TNF-mediated inflammatory disease. J. Pathol. 214: 149–160
Brouckaert P, Libert C, Everaerdt B & Fiers W (1992) Selective species specificity of tumor necrosis factor for toxicity in the mouse. Lymphokine Cytokine Res. 11: 193–6 Available at: http://www.ncbi.nlm.nih.gov/pubmed/1420597 [Accessed August 8, 2016]
Chan JY, Luzuriaga J, Maxwell EL, West PK, Bensellam M & Laybutt DR (2015) The balance between adaptive and apoptotic unfolded protein responses regulates β-cell death under ER stress conditions through XBP1, CHOP and JNK. Mol. Cell. Endocrinol.
Chen GY & Nuñez G (2010) Sterile inflammation: sensing and reacting to damage. Nat. Rev. Immunol. 10: 826–37 Available at: http://www.pubmedcentral.nih.gov/articlerender.fcgi?artid=3114424&tool=pmcentrez&rendertype=abstract
Cho JA, Lee AH, Platzer B, Cross BCS, Gardner BM, De Luca H, Luong P, Harding HP, Glimcher LH, Walter P, Fiebiger E, Ron D, Kagan JC & Lencer WI (2013) The unfolded protein response element IRE1?? senses bacterial proteins invading the ER to activate RIG-I and innate immune signaling. Cell Host Microbe 13: 558–569
Couper K, Blount D & Riley E (2008) IL-10: the master regulator of immunity to infection. J. Immunol. 180: 5771–5777
Cox JS, Shamu CE & Walter P (1993) Transcriptional induction of genes encoding endoplasmic reticulum resident proteins requires a transmembrane protein kinase. Cell 73: 1197–1206
Degterev A, Hitomi J, Germscheid M, Ch’en IL, Korkina O, Teng X, Abbott D, Cuny GD, Yuan C, Wagner G, Hedrick SM, Gerber SA, Lugovskoy A & Yuan J (2008) Identification of RIP1 kinase as a specific cellular target of necrostatins. Nat. Chem. Biol. 4: 313–21 Available at: http://www.ncbi.nlm.nih.gov/pubmed/18408713
Deng J, Lu PD, Zhang Y, Scheuner D, Kaufman RJ, Sonenberg N, Harding HP & Ron D (2004) Translational repression mediates activation of nuclear factor kappa B by phosphorylated translation initiation factor 2. Mol. Cell. Biol. 24: 10161–8 Available at: http://www.pubmedcentral.nih.gov/articlerender.fcgi?artid=529034&tool=pmcentrez&rendertype=abstract
Deniaud a, Sharaf el dein O, Maillier E, Poncet D, Kroemer G, Lemaire C & Brenner C (2008) Endoplasmic reticulum stress induces calcium-dependent permeability transition, mitochondrial outer membrane permeabilization and apoptosis. Oncogene 27: 285–299
Draber P, Kupka S, Reichert M, Draberova H, Lafont E, de Miguel D, Spilgies L, Surinova S, Taraborrelli L, Hartwig T, Rieser E, Martino L, Rittinger K & Walczak H (2015) LUBAC-Recruited CYLD and A20 Regulate Gene Activation and Cell Death by Exerting Opposing Effects on Linear Ubiquitin in Signaling Complexes. Cell Rep. 13: 2258–72 Available at: http://linkinghub.elsevier.com/retrieve/pii/S2211124715013091\nhttp://www.ncbi.nlm.nih.gov/pubmed

References
50
/26670046
Dynek JN, Goncharov T, Dueber EC, Fedorova A V, Izrael-Tomasevic A, Phu L, Helgason E, Fairbrother WJ, Deshayes K, Kirkpatrick DS & Vucic D (2010) c-IAP1 and UbcH5 promote K11-linked polyubiquitination of RIP1 in TNF signalling. EMBO J. 29: 4198–4209 Available at: http://www.pubmedcentral.nih.gov/articlerender.fcgi?artid=3018797&tool=pmcentrez&rendertype=abstract
Faustman D & Davis M (2010) TNF receptor 2 pathway: drug target for autoimmune diseases. Nat. Rev. Drug Discov. 9: 482–493 Available at: http://dx.doi.org/10.1038/nrd3030
Gardner BM, Pincus D, Gotthardt K, Gallagher CM & Walter P (2013) Endoplasmic reticulum stress sensing in the unfolded protein response. Cold Spring Harb. Perspect. Biol. 5:
Garg AD, Kaczmarek A, Krysko O, Vandenabeele P, Krysko D V & Agostinis P (2012) ER stress-induced inflammation: does it aid or impede disease progression? Trends Mol. Med. 18: 589–98 Available at: http://www.sciencedirect.com/science/article/pii/S1471491412001190 [Accessed November 30, 2015]
Gerlach B, Cordier SM, Schmukle AC, Emmerich CH, Rieser E, Haas TL, Webb AI, Rickard JA, Anderton H, Wong WW-L, Nachbur U, Gangoda L, Warnken U, Purcell AW, Silke J & Walczak H (2011) Linear ubiquitination prevents inflammation and regulates immune signalling. Nature 471: 591–6 Available at: http://www.nature.com/doifinder/10.1038/nature09816\nhttp://www.ncbi.nlm.nih.gov/pubmed/21455173
Ghosh R, Wang L, Wang ES, Perera BGK, Igbaria A, Morita S, Prado K, Thamsen M, Caswell D, Macias H, Weiberth KF, Gliedt MJ, Alavi M V., Hari SB, Mitra AK, Bhhatarai B, Sch??rer SC, Snapp EL, Gould DB, German MS, et al (2014) Allosteric inhibition of the IRE1?? RNase preserves cell viability and function during endoplasmic reticulum stress. Cell 158: 534–548
Grootjans S, Hassannia B, Delrue I, Goossens V, Wiernicki B, Dondelinger Y, Bertrand MJM, Krysko D V, Vuylsteke M, Vandenabeele P & Vanden Berghe T (2016) A real-time fluorometric method for the simultaneous detection of cell death type and rate. Nat. Protoc. 11: 1444–1454 Available at: http://www.nature.com/doifinder/10.1038/nprot.2016.085
Haas TL, Emmerich CH, Gerlach B, Schmukle AC, Cordier SM, Rieser E, Feltham R, Vince J, Warnken U, Wenger T, Koschny R, Komander D, Silke J & Walczak H (2009) Recruitment of the Linear Ubiquitin Chain Assembly Complex Stabilizes the TNF-R1 Signaling Complex and Is Required for TNF-Mediated Gene Induction. Mol. Cell 36: 831–844
Han D, Lerner AG, Vande Walle L, Upton JP, Xu W, Hagen A, Backes BJ, Oakes SA & Papa FR (2009) IRE1?? Kinase Activation Modes Control Alternate Endoribonuclease Outputs to Determine Divergent Cell Fates. Cell 138: 562–575
Harding HP, Zhang Y, Bertolotti a, Zeng H & Ron D (2000) Perk is essential for translational regulation and cell survival during the unfolded protein response. Mol. Cell 5: 897–904
Hasnain SZ, Lourie R, Das I, Chen AC-H & McGuckin MA (2012) The interplay between endoplasmic reticulum stress and inflammation. Immunol. Cell Biol. 90: 260–270 Available at: http://dx.doi.org/10.1038/icb.2011.112
Hasnain SZ, Tauro S, Das I, Tong H, Chen AH, Jeffery PL, McDonald V, Florin TH & McGuckin MA (2013) IL-10 promotes production of intestinal mucus by suppressing protein misfolding and endoplasmic reticulum stress in goblet cells. Gastroenterology 144:
Hayden MS, West AP & Ghosh S (2006) NF-kappaB and the immune response. Oncogene 25: 6758–80 Available at: http://dx.doi.org/10.1038/sj.onc.1209943 [Accessed March 16, 2015]
Hendershot LM (2004) The ER function BiP is a master regulator of ER function. Mt. Sinai J. Med. 71: 289–97 Available at: http://www.ncbi.nlm.nih.gov/pubmed/15543429
Hetz C (2012) The unfolded protein response: controlling cell fate decisions under ER stress and beyond. Nat. Rev. Mol. Cell Biol. 13: 89–102 Available at: http://dx.doi.org/10.1038/nrm3270
Hetz C, Chevet E & Harding HP (2013) Targeting the unfolded protein response in disease. Nat. Rev. Drug Discov. 12: 703–19 Available at: http://dx.doi.org/10.1038/nrd3976 [Accessed June 10, 2015]

References
51
Hetz C, Martinon F, Rodriguez D & Glimcher LH (2011) The Unfolded Protein Response: Integrating Stress Signals Through the Stress Sensor IRE1 . Physiol. Rev. 91: 1219–1243
Hosokawa N, Wada I, Natsuka Y & Nagata K (2006) EDEM accelerates ERAD by preventing aberrant dimer formation of misfolded α1-antitrypsin. Genes to Cells 11: 465–476
Hotamisligil GS (2010) Endoplasmic Reticulum Stress and the Inflammatory Basis of Metabolic Disease. Cell 140: 900–917
Hsu H, Shu HB, Pan MG & Goeddel D V. (1996) TRADD-TRAF2 and TRADD-FADD interactions define two distinct TNF receptor 1 signal transduction pathways. Cell 84: 299–308
Hsu H, Xiong J & Goeddel D V. (1995) The TNF receptor 1-associated protein TRADD signals cell death and NF-??B activation. Cell 81: 495–504
Hu P, Han Z, Couvillon AD, Kaufman RJ & Exton JH (2006) Autocrine tumor necrosis factor alpha links endoplasmic reticulum stress to the membrane death receptor pathway through IRE1alpha-mediated NF-kappaB activation and down-regulation of TRAF2 expression. Mol. Cell. Biol. 26: 3071–84 Available at: http://mcb.asm.org/content/26/8/3071.long [Accessed May 23, 2016]
Iwawaki T, Akai R, Yamanaka S & Kohno K (2009) Function of IRE1 alpha in the placenta is essential for placental development and embryonic viability. Proc. Natl. Acad. Sci. 106: 16657–16662 Available at: http://www.pnas.org/cgi/doi/10.1073/pnas.0903775106 [Accessed August 2, 2016]
Jackson RJ, Hellen CUT & Pestova T V (2010) The mechanism of eukaryotic translation initiation and principles of its regulation. Nat. Rev. Mol. Cell Biol. 11: 113–127 Available at: http://dx.doi.org/10.1038/nrm2838
Jones LJ & Singer VL (2001) Fluorescence microplate-based assay for tumor necrosis factor activity using SYTOX Green stain. Anal. Biochem. 293: 8–15
Kalliolias GD & Ivashkiv LB (2015) TNF biology, pathogenic mechanisms and emerging therapeutic strategies. Nat. Rev. Rheumatol. 12: 49–62 Available at: http://www.nature.com/doifinder/10.1038/nrrheum.2015.169
Kanayama A, Seth RB, Sun L, Ea CK, Hong M, Shaito A, Chiu YH, Deng L & Chen ZJ (2004) TAB2 and TAB3 activate the NF-??B pathway through binding to polyubiquitin chains. Mol. Cell 15: 535–548
Kanemoto S, Kondo S, Ogata M, Murakami T, Urano F & Imaizumi K (2005) XBP1 activates the transcription of its target genes via an ACGT core sequence under ER stress. Biochem. Biophys. Res. Commun. 331: 1146–1153
Keestra-Gounder AM, Byndloss MX, Seyffert N, Young BM, Chávez-Arroyo A, Tsai AY, Cevallos SA, Winter MG, Pham OH, Tiffany CR, de Jong MF, Kerrinnes T, Ravindran R, Luciw PA, McSorley SJ, Bäumler AJ & Tsolis RM (2016) NOD1 and NOD2 signalling links ER stress with inflammation. Nature: 1–15 Available at: http://www.nature.com/doifinder/10.1038/nature17631
Korennykh A V, Egea PF, Korostelev AA, Finer-Moore J, Zhang C, Shokat KM, Stroud RM & Walter P (2009) The unfolded protein response signals through high-order assembly of Ire1. Nature 457: 687–93 Available at: http://www.pubmedcentral.nih.gov/articlerender.fcgi?artid=2846394&tool=pmcentrez&rendertype=abstract
Kovalenko A & Chable-bessia C (2003) The tumour suppressor CYLD negatively regulates NF- k B signalling by deubiquitination. Nature 424: 801–805 Available at: http://www.ncbi.nlm.nih.gov/pubmed/12917691
Kozutsumi Y, Segal M, Normington K, Gething MJ & Sambrook J (1988) The presence of malfolded proteins in the endoplasmic reticulum signals the induction of glucose-regulated proteins. Nature 332: 462–464
Kurt-Jones EA, Sandor F, Ortiz Y, Bowen GN, Counter SL, Wang TC & Finberg RW (2004) Use of murine embryonic fibroblasts to define Toll-like receptor activation and specificity. J. Endotoxin Res. 10: 419–24 Available at: http://www.ncbi.nlm.nih.gov/pubmed/15588425 [Accessed August 8, 2016]
Lai CW, Otero JH, Hendershot LM & Snapp E (2012) ERdj4 protein is a soluble endoplasmic reticulum (ER) DnaJ family protein that interacts with ER-associated degradation machinery. J. Biol. Chem. 287: 7969–78 Available at: http://www.ncbi.nlm.nih.gov/pubmed/22267725 [Accessed August 2, 2016]
Li MC & He SH (2004) IL-10 and its related cytokines for treatment of inflammatory bowel disease. World J. Gastroenterol. 10: 620–625
References
52
Li T, Diner B a., Chen J & Cristea IM (2012) Acetylation modulates cellular distribution and DNA sensing ability of interferon-inducible protein IFI16. Proc. Natl. Acad. Sci. 109: 10558–10563
Martinon F, Chen X, Lee A-H & Glimcher LH (2010) TLR activation of the transcription factor XBP1 regulates innate immune responses in macrophages. Nat. Immunol. 11: 411–8 Available at: http://dx.doi.org/10.1038/ni.1857 [Accessed November 18, 2015]
Maurel M, Chevet E, Tavernier J & Gerlo S (2014) Getting RIDD of RNA: IRE1 in cell fate regulation. Trends Biochem. Sci. 39: 245–254
McCullough KD, Martindale JL, Klotz LO, Aw TY & Holbrook NJ (2001) Gadd153 sensitizes cells to endoplasmic reticulum stress by down-regulating Bcl2 and perturbing the cellular redox state. Mol. Cell. Biol. 21: 1249–59 Available at: http://mcb.asm.org/content/21/4/1249.long [Accessed April 28, 2016]
Micheau O & Tschopp J (2003) Induction of TNF receptor I-mediated apoptosis via two sequential signaling complexes. Cell 114: 181–190
Mimura N, Fulciniti M, Gorgun G, Tai Y-T, Cirstea D, Santo L, Hu Y, Fabre C, Minami J, Ohguchi H, Kiziltepe T, Ikeda H, Kawano Y, French M, Blumenthal M, Tam V, Kertesz NL, Malyankar UM, Hokenson M, Pham T, et al (2012) Blockade of XBP1 splicing by inhibition of IRE1α is a promising therapeutic option in multiple myeloma. Blood 119: 5772–81 Available at: http://www.ncbi.nlm.nih.gov/pubmed/22538852 [Accessed August 2, 2016]
Mori K (2009) Signalling pathways in the unfolded protein response: Development from yeast to mammals. J. Biochem. 146: 743–750
Morl K, Ma W, Gething M-J & Sambrook J (1993) A transmembrane protein with a cdc2+CDC28-related kinase activity is required for signaling from the ER to the nucleus. Cell 74: 743–756 Available at: http://www.sciencedirect.com/science/article/pii/009286749390521Q
Muralidharan S & Mandrekar P (2013a) Cellular stress response and innate immune signaling: integrating pathways in host defense and inflammation. J Leukoc Biol 94: 1167–1184 Available at: http://www.ncbi.nlm.nih.gov/pubmed/23990626
Muralidharan S & Mandrekar P (2013b) Cellular stress response and innate immune signaling: integrating pathways in host defense and inflammation. J. Leukoc. Biol. 94: 1167–84 Available at: http://www.pubmedcentral.nih.gov/articlerender.fcgi?artid=3828604&tool=pmcentrez&rendertype=abstract [Accessed November 18, 2015]
Murphy JM, Czabotar PE, Hildebrand JM, Lucet IS, Zhang JG, Alvarez-Diaz S, Lewis R, Lalaoui N, Metcalf D, Webb AI, Young SN, Varghese LN, Tannahill GM, Hatchell EC, Majewski IJ, Okamoto T, Dobson RCJ, Hilton DJ, Babon JJ, Nicola NA, et al (2013) The pseudokinase MLKL mediates necroptosis via a molecular switch mechanism. Immunity 39: 443–453
Oslowski CM & Urano F (2011) Measuring ER stress and the unfolded protein response using mammalian tissue culture system. Methods Enzymol. 490: 71–92 Available at: http://www.pubmedcentral.nih.gov/articlerender.fcgi?artid=3701721&tool=pmcentrez&rendertype=abstract [Accessed October 8, 2014]
Osorio F, Lambrecht B & Janssens S (2013) The UPR and lung disease. Semin. Immunopathol. 35: 293–306
Pahl HL & Baeuerle PA (1995) Expression of influenza virus hemagglutinin activates transcription factor NF-kappa B. J. Virol. 69: 1480–4 Available at: http://www.pubmedcentral.nih.gov/articlerender.fcgi?artid=188737&tool=pmcentrez&rendertype=abstract [Accessed December 2, 2015]
Papa FR, Zhang C, Shokat K & Walter P (2003) Bypassing a Kinase Activity with an ATP-Competitive Drug. Science (80-. ). 302: 1533–1537 Available at: http://www.sciencemag.org/cgi/content/abstract/302/5650/1533\nhttp://www.sciencemag.org/cgi/reprint/302/5650/1533.pdf
Papandreou I, Denko NC, Olson M, Melckebeke H Van, Lust S, Tam A, Solow-cordero DE, Bouley DM, Offner F, Niwa M & Koong AC (2011) Brief report Identification of an Ire1alpha endonuclease specific inhibitor with cytotoxic activity against human multiple myeloma. 117: 1311–1314
Park BS & Lee J-O (2013) Recognition of lipopolysaccharide pattern by TLR4 complexes. Exp. Mol. Med. 45: e66

References
53
Available at: http://dx.doi.org/10.1038/emm.2013.97 [Accessed December 10, 2015]
Pasparakis M & Vandenabeele P (2015) Necroptosis and its role in inflammation. Nature 517: 311–320 Available at: http://www.ncbi.nlm.nih.gov/pubmed/25592536
Peltzer N, Rieser E, Taraborrelli L, Draber P, Darding M, Pernaute B, Shimizu Y, Sarr A, Draberova H, Montinaro A, Martinez-Barbera J, Silke J, Rodriguez TA & Walczak H (2014) HOIP deficiency causes embryonic lethality by aberrant TNFR1-mediated endothelial cell death. Cell Rep. 9: 153–165
Qian C, Liu J & Cao X (2014) Innate signaling in the inflammatory immune disorders. Cytokine Growth Factor Rev. 25: 731–8 Available at: http://www.sciencedirect.com/science/article/pii/S1359610114000574 [Accessed November 30, 2015]
Rahighi S, Ikeda F, Kawasaki M, Akutsu M, Suzuki N, Kato R, Kensche T, Uejima T, Bloor S, Komander D, Randow F, Wakatsuki S & Dikic I (2009) Specific Recognition of Linear Ubiquitin Chains by NEMO Is Important for NF-κB Activation. Cell 136: 1098–1109
Rothe M, Sarma V, Dixit VM & Goeddel D V (1995) TRAF2-mediated activation of NF-kappa B by TNF receptor 2 and CD40. Science 269: 1424–1427
Smith MH, Ploegh HL & Weissman JS (2011) Road to ruin: targeting proteins for degradation in the endoplasmic reticulum. Science 334: 1086–90 Available at: http://www.pubmedcentral.nih.gov/articlerender.fcgi?artid=3864754&tool=pmcentrez&rendertype=abstract
Sun L, Wang H, Wang Z, He S, Chen S, Liao D, Wang L, Yan J, Liu W, Lei X & Wang X (2012) Mixed lineage kinase domain-like protein mediates necrosis signaling downstream of RIP3 kinase. Cell 148: 213–227
Szegezdi E, Logue SE, Gorman AM & Samali A (2006) Mediators of endoplasmic reticulum stress-induced apoptosis. EMBO Rep. 7: 880–5 Available at: http://www.pubmedcentral.nih.gov/articlerender.fcgi?artid=1559676&tool=pmcentrez&rendertype=abstract
Takeuchi O & Akira S (2010) Pattern Recognition Receptors and Inflammation. Cell 140: 805–820
Ting AT & Bertrand MJM (2016) More to Life than NF-κB in TNFR1 Signaling. Trends Immunol. 37: 535–545
Tokunaga F, Sakata S, Saeki Y, Satomi Y, Kirisako T, Kamei K, Nakagawa T, Kato M, Murata S, Yamaoka S, Yamamoto M, Akira S, Takao T, Tanaka K & Iwai K (2009) Involvement of linear polyubiquitylation of NEMO in NF-kappaB activation. Nat. Cell Biol. 11: 123–32 Available at: http://www.ncbi.nlm.nih.gov/pubmed/19136968
Urano F, Wang X, Bertolotti a, Zhang Y, Chung P, Harding HP & Ron D (2000) Coupling of stress in the ER to activation of JNK protein kinases by transmembrane protein kinase IRE1. Science 287: 664–666
Verhelst K, Carpentier I, Kreike M, Meloni L, Verstrepen L, Kensche T, Dikic I & Beyaert R (2012) A20 inhibits LUBAC-mediated NF-κB activation by binding linear polyubiquitin chains via its zinc finger 7. EMBO J. 31: 3845–55 Available at: http://emboj.embopress.org/content/31/19/3845.abstract
Vince JE, Wong WWL, Khan N, Feltham R, Chau D, Ahmed AU, Benetatos CA, Chunduru SK, Condon SM, McKinlay M, Brink R, Leverkus M, Tergaonkar V, Schneider P, Callus BA, Koentgen F, Vaux DL & Silke J (2007) IAP Antagonists Target cIAP1 to Induce TNF??-Dependent Apoptosis. Cell 131: 682–693
Vlantis K, Wullaert A, Polykratis A, Kondylis V, Dannappel M, Schwarzer R, Welz P, Corona T, Walczak H, Weih F, Klein U, Kelliher M & Pasparakis M (2016) NEMO Prevents RIP Kinase 1-Mediated Epithelial Cell Death and Chronic Intestinal Inflammation by NF-κB-Dependent and -Independent Functions. Immunity 44: 553–567
Wajant H, Pfizenmaier K & Scheurich P (2003) Tumor necrosis factor signaling. Cell Death Differ 10: 45–65 Available at: http://dx.doi.org/10.1038/sj.cdd.4401189
Walter P & Ron D (2011) The unfolded protein response: from stress pathway to homeostatic regulation. Science 334: 1081–6 Available at: http://classic.sciencemag.org/content/334/6059/1081.full
Wang J-S, Wu D, Huang D-Y, Lin W-W, Chen Z, Bhoj V, Seth R, Mihaly S, Ninomiya-Tsuji J, Morioka S, Sato S, Sanjo H, Tsujimura T, Ninomiya-Tsuji J, Yamamoto M, Kawai T, Takeuchi O, Akira S, Shim J, Xiao C, et al (2015) TAK1 inhibition-induced RIP1-dependent apoptosis in murine macrophages relies on constitutive

References
54
TNF-α signaling and ROS production. J. Biomed. Sci. 22: 76 Available at: http://www.jbiomedsci.com/content/22/1/76 [Accessed August 2, 2016]
Wang L, Perera BGK, Hari SB, Bhhatarai B, Backes BJ, Seeliger MA, Schürer SC, Oakes SA, Papa FR & Maly DJ (2012) Divergent allosteric control of the IRE1α endoribonuclease using kinase inhibitors. Nat. Chem. Biol. 8: 982–9 Available at: http://www.pubmedcentral.nih.gov/articlerender.fcgi?artid=3508346&tool=pmcentrez&rendertype=abstract
Wek RC, Jiang H-Y & Anthony TG (2006) Coping with stress: eIF2 kinases and translational control. Biochem. Soc. Trans. 34: 7–11
Willems E, Leyns L & Vandesompele J (2008) Standardization of real-time PCR gene expression data from independent biological replicates. Anal. Biochem. 379: 127–129
Wilson NS, Dixit V & Ashkenazi A (2009) Death receptor signal transducers: nodes of coordination in immune signaling networks. Nat. Immunol. 10: 348–55 Available at: http://www.ncbi.nlm.nih.gov/pubmed/19295631
Wu C-J, Conze DB, Li T, Srinivasula SM & Ashwell JD (2006) Sensing of Lys 63-linked polyubiquitination by NEMO is a key event in NF-kappaB activation [corrected]. Nat. Cell Biol. 8: 398–406
Xue X, Piao JH, Nakajima A, Sakon-Komazawa S, Kojima Y, Mori K, Yagita H, Okumura K, Harding H & Nakano H (2005) Tumor necrosis factor ?? (TNF??) induces the unfolded protein response (UPR) in a reactive oxygen species (ROS)-dependent fashion, and the UPR counteracts ROS accumulation by TNF?? J. Biol. Chem. 280: 33917–33925
Yatim N, Jusforgues-Saklani H, Orozco S, Schulz O, Barreira da Silva R, Reis e Sousa C, Green DR, Oberst A & Albert ML (2015) RIPK1 and NF- B signaling in dying cells determines cross-priming of CD8+ T cells. Science (80-. ). 350: 328–34 Available at: http://www.ncbi.nlm.nih.gov/pubmed/26405229
Yoshida H, Matsui T, Yamamoto A, Okada T & Mori K (2001) XBP1 mRNA is induced by ATF6 and spliced by IRE1 in response to ER stress to produce a highly active transcription factor. Cell 107: 881–891
Zhang K, Shen X, Wu J, Sakaki K, Saunders T, Rutkowski DT, Back SH & Kaufman RJ (2006) Endoplasmic reticulum stress activates cleavage of CREBH to induce a systemic inflammatory response. Cell 124: 587–599

Addendum
55
Addendum
A. Start up - SH-SY5 XBP1 beta 6 luciferase cells
Material
1 ampoule (1ml) = 1 Fk (25cm²) SH-SY5 XBP1 beta6 luc
o 10% DMSO
o 15% Serum
Medium
o DMEM
o 15% FCS
o P/S
o L-Gln
o NEAA
o Neomycin (1mg/ml)
25 cm² plate (with filter)
Procedure
Rewarm the growth medium
Thaw the cells in warm water bath (fast)
Spin the cells
Dilute the cells
o Put a bit of medium on cells and pipet up and down
o Add to 9 ml medium in centrifuge tubes
o Repeat several times until all cells are rediluted
Centrifuge the cells at 1000 rpm for 4 minutes
Remove the medium (leave a little for resuspension)
Add 5ml medium to the cells
Put cells in 25cm² plate
Check the cells for 80% confluency the next day
Split the cells and refreeze a part of the cells the next day
Remark:
The cells grow 1/3-1/4 over the week and 1/3 over the weekend

Addendum
56
B. Luciferase assay
Materials and equipment
Equipment o 2 x transparent 96 well plates (normal wells)
o Benchmark microplate Reader (Bio-Rad Laboratories, Nazareth, Belgium)
Cells o SH-SY5Y-XBP1 Luc beta 6 o SH-SY5Y- NFkB Luc High
Reagents:
o LPS (50 µg/mL)
o mTNF (1 mg/mL) o Tm (10 mg/mL) o MKC (10 mM)
Medium
o DMEM
o 15% FCS
o P/S
o L-Gln
o NEAA
o Neomycin (1mg/ml)
Steady-Glo Luciferase Assay System (Promega # E2510)
Experimental procedure
Day 0
1) Seed 2 x 96 well plates with SH-SY5Y XBP1 cells and SH-SY5Y according to scheme (10 000 cells/80 µl per well ). Cells are transfected in triplicates for each condition:
P.S.: One plate for 18 h treatment and one plate for 6 h treatment.

Addendum
57
Schematic representation of seeding of NF-kB and IRE1Αluciferase reporter cell lines, respectively termed, SH-
SY5Y-NFkB Luc High and SH-SY5Y XBP1 Luc beta 6. The different colours represent the treatments described on
the left side of the image.
2) Incubate the 2 x 96-well plate for 2 days until plate reaches semi-confluence
Day 2
3) Stimulate the cell by adding 75 µL containing stimulant/well following the schematic representation The different stimuli used the following final concentration for 18h and 6h:
LPS (100 ng/mL)
hTNF (20 ng/mL) MKC (10 µM) Tm ( 100 µg/mL)
Day 3
4) At the end of the stimulation, add 75 µL of Steady-Glo Luciferase Assay System (Promega # E2510) pre-warmed at room temperature
5) Incubate for approximately 5 min at room termperature on plate shaker protected
from light 6) Read on luminometer at … nm

Addendum
58
normalization of the measurements:
7) Calculate the average value for all the non-treated controls from all experiments ( 𝑋0
) 8) Normalize the value of different treatments using following equation
( 𝑋𝑇′ = 𝑋𝑇 𝑋0
⁄ ) 9) Calculate the average value and SEM for the treatments from all experiments
𝑋𝑇
′ = ∑ 𝑋𝑇′
𝑛
𝑖=0
𝑛⁄
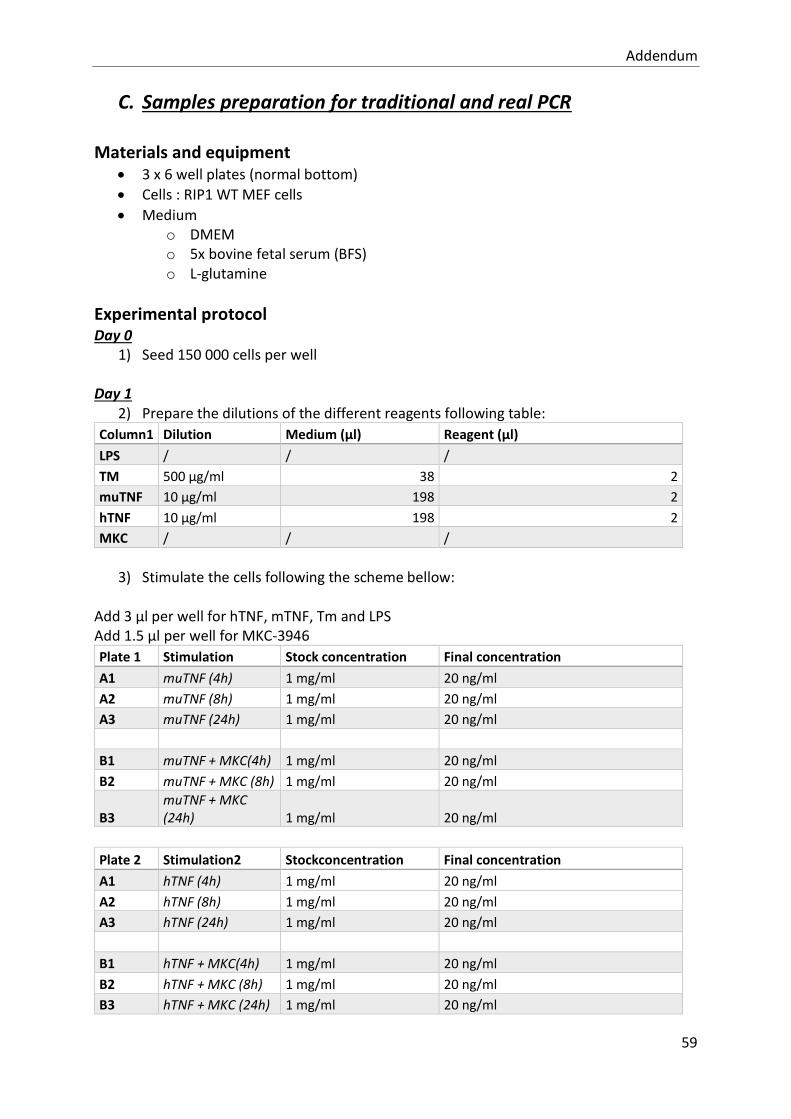
Addendum
59
C. Samples preparation for traditional and real PCR
Materials and equipment 3 x 6 well plates (normal bottom)
Cells : RIP1 WT MEF cells
Medium o DMEM o 5x bovine fetal serum (BFS) o L-glutamine
Experimental protocol Day 0
1) Seed 150 000 cells per well
Day 1 2) Prepare the dilutions of the different reagents following table:
Column1 Dilution Medium (µl) Reagent (µl)
LPS / / /
TM 500 µg/ml 38 2
muTNF 10 µg/ml 198 2
hTNF 10 µg/ml 198 2
MKC / / /
3) Stimulate the cells following the scheme bellow:
Add 3 µl per well for hTNF, mTNF, Tm and LPS Add 1.5 µl per well for MKC-3946
Plate 1 Stimulation Stock concentration Final concentration
A1 muTNF (4h) 1 mg/ml 20 ng/ml
A2 muTNF (8h) 1 mg/ml 20 ng/ml
A3 muTNF (24h) 1 mg/ml 20 ng/ml
B1 muTNF + MKC(4h) 1 mg/ml 20 ng/ml
B2 muTNF + MKC (8h) 1 mg/ml 20 ng/ml
B3 muTNF + MKC (24h) 1 mg/ml 20 ng/ml
Plate 2 Stimulation2 Stockconcentration Final concentration
A1 hTNF (4h) 1 mg/ml 20 ng/ml
A2 hTNF (8h) 1 mg/ml 20 ng/ml
A3 hTNF (24h) 1 mg/ml 20 ng/ml
B1 hTNF + MKC(4h) 1 mg/ml 20 ng/ml
B2 hTNF + MKC (8h) 1 mg/ml 20 ng/ml
B3 hTNF + MKC (24h) 1 mg/ml 20 ng/ml
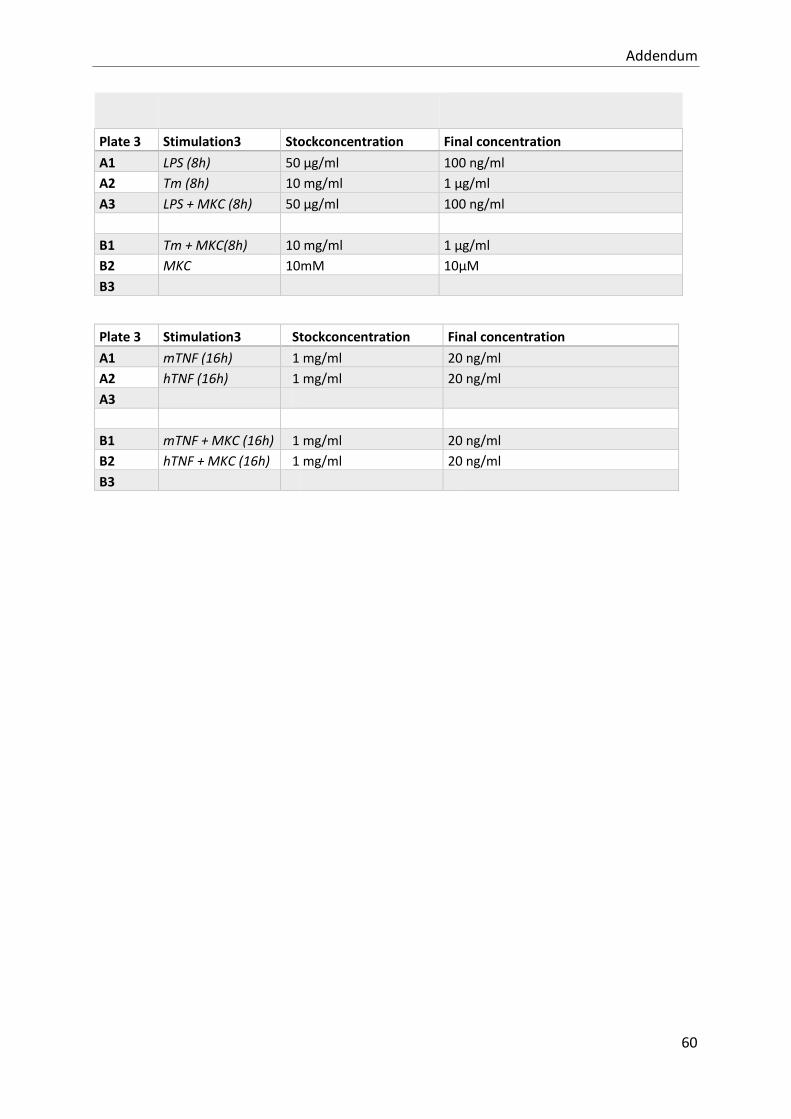
Addendum
60
Plate 3 Stimulation3 Stockconcentration Final concentration
A1 LPS (8h) 50 µg/ml 100 ng/ml
A2 Tm (8h) 10 mg/ml 1 µg/ml
A3 LPS + MKC (8h) 50 µg/ml 100 ng/ml
B1 Tm + MKC(8h) 10 mg/ml 1 µg/ml
B2 MKC 10mM 10µM
B3
Plate 3 Stimulation3 Stockconcentration Final concentration
A1 mTNF (16h) 1 mg/ml 20 ng/ml
A2 hTNF (16h) 1 mg/ml 20 ng/ml
A3
B1 mTNF + MKC (16h) 1 mg/ml 20 ng/ml
B2 hTNF + MKC (16h) 1 mg/ml 20 ng/ml
B3

Addendum
61
D. RNA extraction using RNeasy Plus Mini Kit (Method 1)
A. Lysation of cells
1. Dilute β-mercaptoethanol 1/100 in RLT Plus buffer (for direct lysis)
(Dish diameter <6 cm: 350 µl, 6-10cm: use 600 µl) 2. Aspirate medium, wash with PBS and aspirate again (alternatively, detach the cells by
adding EDTA/trypsin, then centrifuge at 2000 rpm for 5 min. Remove EDTA/trypsin with a pipet as complete as possible)
3. Add the RLT Plus buffer with β-ME (work on ice from now on) 4. Use a rubber policeman to collect the lysate (if not using EDTA/trypsin) 5. Proceed to B. or store at -70° or -20°
B. RNA purification
1. Thaw the frozen lysates
Note: frozen lysates should be incubated at 37° (water bath), until all salts are dissolved, but avoid prolonged
Incubation. If insoluble material is visible, centrifuge at 3000-5000x g for 5 min and
work with the supernatant.
2. (On Ice) Homogenize the lysate by passing it 5-10x through a 23 gauge needle and syringe
(This reduces the viscosity of the cell lysate and shears high-MW gDNA and other components. Incomplete homogenization results in inefficient RNA-binding)
3. Double label the RNeasy spin columns
Add 1 volume (usually 350 µL, sometimes 600 µL) of 70% ethanol to the flow-through, and mix well by pipetting (now go immediately to step 5).
Note: When purifying RNA from certain cell lines, precipitates may be visible after
addition of ethanol. This does not affect the procedure.
4. Transfer up to 700 µL of the sample, including any precipitate that may have formed, to an RNeasy spin column placed in a 2 ml collection tube (supplied). Close the lid gently, and centrifuge for 15 s at >or= 10.000 rpm.
*Reuse the collection tube in step 5.
If the sample volume exceeds 700 µL, centrifuge successive aliquots in the same
RNeasy spin column. Discard the flow-through after each centrifugation.
5. Discard the flow-through.
Add 700 µL RW1 buffer to the RNeasy spin column. Close gently and centrifuge for 15 s at >or= 10.000 rpm to wash the spin column membrane. *Reuse the collection tube in step 6.

Addendum
62
Note: After centrifugation, carefully remove the RNeasy spin column from the
collection tube so that the column does not contact the flow-through. Be sure to
empty the collection tube completely.
6. Discard the flow-through.
Add 500 µL RPE Buffer to the RNeasy spin column. Close gently and centrifuge for 15
s at >or= 10.000 rpm to wash the spin column membrane. *Reuse the collection tube in step 7.
Note: Buffer RPE is supplied as a concentrate. Ensure that ethanol is added to Buffer
RPE before use (see “Important points before starting”).
7. Discard the flow-through.
Add 500 µL RPE buffer to the RNeasy spin column. Close the lid gently, and
centrifuge for 2 min at >or= 10.000 rpm to wash the spin column membrane. *Meanwhile write the new 1,5 ml epps (supplied) The long centrifugation dries the spin column membrane, ensuring that no ethanol is
carried over during RNA elution. Residual ethanol may interfere with downstream reactions. Note: After centrifugation, carefully remove the RNeasy spin column from the
collection tube so that the column does not contact the flow-through. Otherwise,
carryover of ethanol will occur. µ
8. Place the RNeasy spin column in the new 1.5 ml collection tubes.
Let the membrane dry out for a few minutes longer, to evaporate the remaining ethanol
9. Add 20 µL RNase-free water directly (in the middle, look where you pipet) onto the spin column membrane. Close the lid gently, and centrifuge for 1 min at >or= 10,000 rpm to elute the RNA.
10. Repeat step 9. (especially when the expected RNA yield is more than 30 µg)
You’ll have ±40 µl of RNA

Addendum
63
E. RNA extraction using Trizol (Method 2)
Aim and background information: by Brigitta Brinkman
Phenol chloroform-based RNA extraction method for unrestricted amounts of cells and tissue.
Materials and equipment:
4°C bench top centrifuge
Tissue greinder (for tissue) or bead beater
Rnase free plasticware
Trizol (15596-026 Gibco BRL/Invitrogen )
RNase free Chloroform
RNase free chloroform/isoamyl alcohol
RNase free Isopropanol
RNase free 70% ethanol
RNase free (DEPC treated) water
Experimental procedure:
Work in the chemical hood since Trizol is toxic! Always wear gloves during this procedure. Work RNAse-free.
Sample preparation
1) For tissue samples: - Add Trizol reagent directly to the (frozen) tissue. - Homogenise sample with the polytron or other technique (bead beater)
Remove any particulate material from inside the homogeniser between samples.
Clean the homogeniser in 0,1% SDS (v/v) and wash extensively in H2O between samples.
NOTE : for fatty, fibrous or muscular tissue it may be difficult to homogenise the entire tissue sample.
2) For cells grown in flasks or plates:
There are two methods:
a. The Trizol can be added directly to the flask/plate and the cells can then be scraped off using a cell scraper.
Procedure:
remove medium from adherent cells in flask/ plate. put Trizol directly in the flask ( 1 ml / T75 and 2 ml / T150) scrape cells off with cell scraper
b. Cells can be trypsinised before adding Trizol.
Procedure:

Addendum
64
trypsinize cells, wash and spin down cell pellet add Trizol to the pellet and resuspend the cells After homogenisation samples can be stored for up to 1 month at -
70°C.
RNA extraction
1) Allow samples to stand for 5 minutes at room temperature. The following protocol is for 1 ml of lysed cell mixture in a 1.5 ml eppendorf tube. Optional if there are big pieces/fat left in the suspension, centrifuge at 12000g
for 10 minutes at 4°C, to allow particulate material to pellet and fatty material to overlay the phenol. Remove the red organic phase and place in a new tube.
2) Add 200 μl of chloroform per ml of Trizol reagent. Shake vigorously (don’t vortex) and incubate at room temperature for 3 minutes.
3) Centrifuge at 14000g for 25 minutes at 4°C 4) Remove the aqueous (top) phase, being careful not to take any interface material
(DNA and protein). Place aqueous phase in a fresh 1.5 mL eppendorf tube. Optional, if any interface was transferred, add an equal volume of
chloroform/isoamyl alcohol, mix phases again and centrifuge at 12000g for 10 minutes at 4°C. Remove the upper aqueous phase and place in a new tube.
5) Add 500 μl of isopropanol per ml of initial Trizol reagent and mix. (NOTE: this mix can stay at –20°C O/N.)
6) Centrifuge at 14000g for 10 minutes at 4°C 7) Remove aqueous phase 8) Wash the pellet with 1 ml of RNAse-free 70% ethanol. 9) Centrifuge at 14000g for 5 minutes at 4°C 10) Dry the pellet for approx 2-5 minutes on the bench until EtOH is gone (do not
overdry as it will be impossible to resuspend the RNA). 11) Resuspend the RNA in RNAse-free H2O or TE (pH 8), 30 μl depending on the size of
the pellet. 12) Check quantity of RNA using the nanodrop, check quality of RNA on the Agilent
2100 bioanalyser or on a 1% agarose gel

Addendum
65
F. cDNA production Use the iScript cDNA synthesis Kit
Use 500 ng RNA/reaction
Prepare mastermix (in RNA-free eppendorfs)
a. 4 µL / sample 5x iScript reaction mix
b. 1 µL / sample iScript Reverse Transcriptase
Add 500 ng RNA into RNAse-free PCR-eppendorfs, add RNAse-free H2O until a total volume of 15 µL
Add 5 µL mastermix / sample
Run PCR program
c. 5 min at 25°C d. 30 min at 42°C e. 5 min at 85°C f. Hold at 4°C (optional)
G. Traditional PCR
RNA isolation
See separate protocol
cDNA production
See separate protocol
GoTag®DNA Polymerase Protocol
Use the GoTag® PCR Core System I (Promega)
Prepare mastermix (in RNA-free eppendorfs) o 12.5 µL / sample GoTag o 0.25 µL/ sample Primer Mix
o 11.25 µL/ sample nuclease-free H2O Add 24 mastermix/ sample Add 1 µL cDNA into RNAse-free PCR eppendorfs to final volume of 25 µL
Run PCR program
o 94°C for 2 min
For 31 cycles
o 94°C for 30 s o 58°C for 45 s o 72°C for 45 s
o 72°C for 5 min o Hold at 12°C (optional)

Addendum
66
Agarosegelelectrophoresis
Reagents:
50x TAE buffer (dilute to 1x TAE buffer in ddH2O) o 2 M of Tris base (242 g) o 5,11% (v/v) of glacial acetic acid (51,1 ml)
o 100 ml of 0.5 M EDTA pH 8.0
o Fill till 1l with ddH20
6x Loadingsbuffer o 0,25 % Broomphenolblue (0,125 g / 50 ml) o 0,25 % Xylene cyanol (0,125 g / 50 ml) o 60 % Glycerol (30 ml / 50 ml) o Fill to 50 ml with ddH2O
UltraPure Agarose (Invitrogen)
Experimental Procedure:
Dilute x g of UltraPure Agarose in 1x TAE buffer to obtain needed percentage of composition of agarosegel
Place geltray in the holder
Place the comb in the holder Cook agarose mix in microwave until it powder is completely dissolved Pour the gel into the geltray, removing eventual bubbles
Remove the comb after solidification
Mix the PCR samples with 5 µL of 6x loadingbuffer Place the gel in electrophoresischamber filled with 1x TAE buffer Load PCR samples (15-20 µL for 15 slots) Add DNA ladder (3 µL) Set the desired voltage. Stop electrophoresis once the colourmarker reaches the
bottom of the gel. Put the gel, after electrophoresis, in an ethidiumbromide solution (concentration? )
for 30 min Wash the gel with water Shine UV-licht on the gel and take a picture
Remove all contaminated material and clean detection equipment.
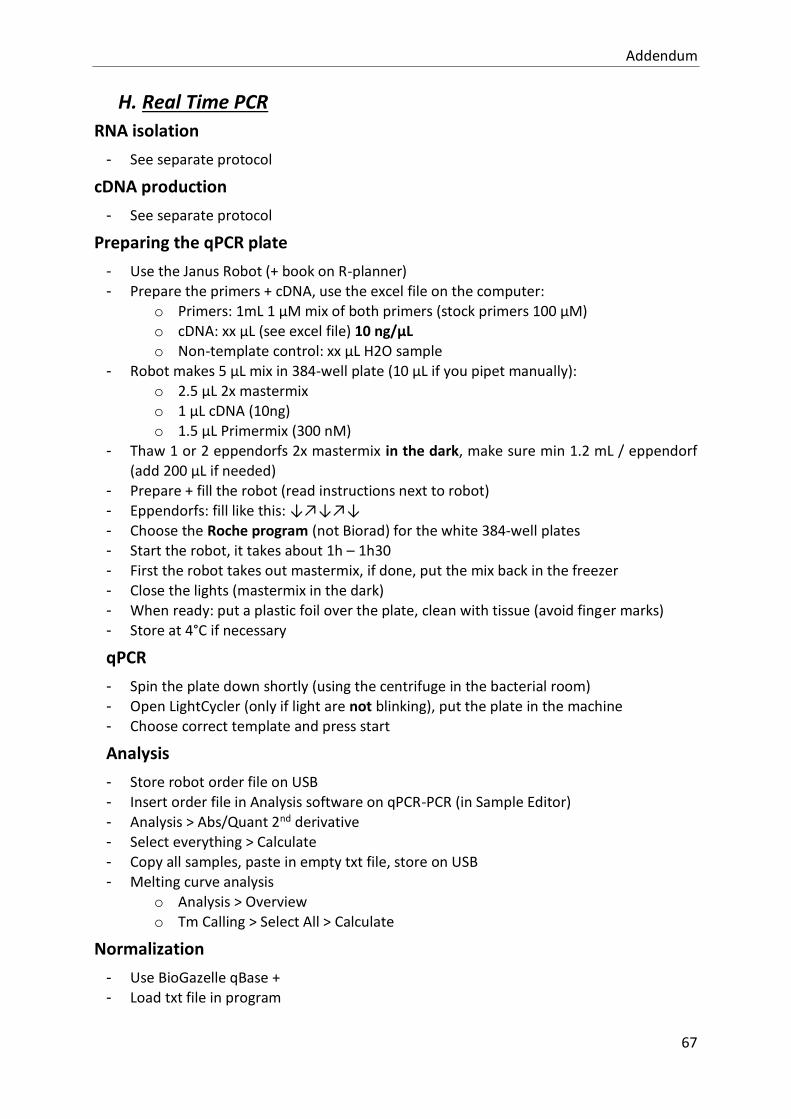
Addendum
67
H. Real Time PCR
RNA isolation
- See separate protocol
cDNA production
- See separate protocol
Preparing the qPCR plate
- Use the Janus Robot (+ book on R-planner) - Prepare the primers + cDNA, use the excel file on the computer:
o Primers: 1mL 1 µM mix of both primers (stock primers 100 µM) o cDNA: xx µL (see excel file) 10 ng/µL o Non-template control: xx µL H2O sample
- Robot makes 5 µL mix in 384-well plate (10 µL if you pipet manually): o 2.5 µL 2x mastermix o 1 µL cDNA (10ng) o 1.5 µL Primermix (300 nM)
- Thaw 1 or 2 eppendorfs 2x mastermix in the dark, make sure min 1.2 mL / eppendorf (add 200 µL if needed)
- Prepare + fill the robot (read instructions next to robot) - Eppendorfs: fill like this: ↓↗↓↗↓
- Choose the Roche program (not Biorad) for the white 384-well plates - Start the robot, it takes about 1h – 1h30 - First the robot takes out mastermix, if done, put the mix back in the freezer - Close the lights (mastermix in the dark) - When ready: put a plastic foil over the plate, clean with tissue (avoid finger marks) - Store at 4°C if necessary
qPCR
- Spin the plate down shortly (using the centrifuge in the bacterial room) - Open LightCycler (only if light are not blinking), put the plate in the machine - Choose correct template and press start
Analysis
- Store robot order file on USB
- Insert order file in Analysis software on qPCR-PCR (in Sample Editor)
- Analysis > Abs/Quant 2nd derivative - Select everything > Calculate - Copy all samples, paste in empty txt file, store on USB - Melting curve analysis
o Analysis > Overview o Tm Calling > Select All > Calculate
Normalization
- Use BioGazelle qBase +
- Load txt file in program
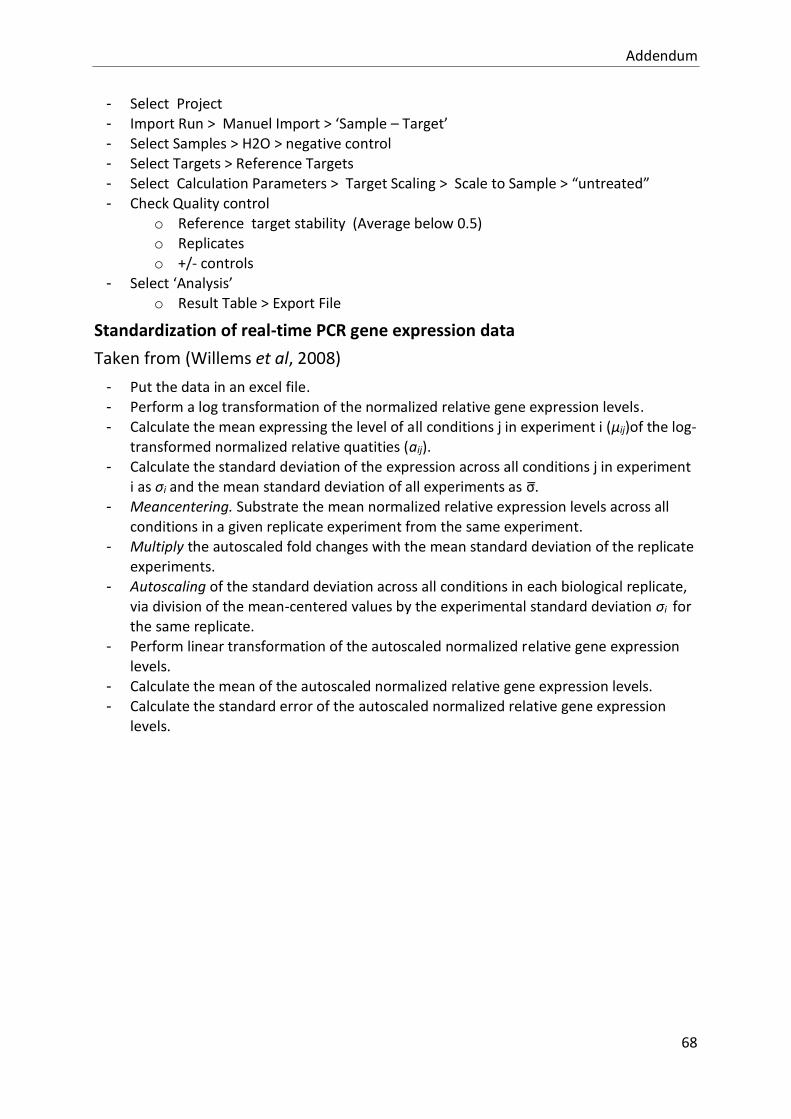
Addendum
68
- Select Project - Import Run > Manuel Import > ‘Sample – Target’ - Select Samples > H2O > negative control - Select Targets > Reference Targets - Select Calculation Parameters > Target Scaling > Scale to Sample > “untreated” - Check Quality control
o Reference target stability (Average below 0.5) o Replicates o +/- controls
- Select ‘Analysis’ o Result Table > Export File
Standardization of real-time PCR gene expression data
Taken from (Willems et al, 2008)
- Put the data in an excel file. - Perform a log transformation of the normalized relative gene expression levels. - Calculate the mean expressing the level of all conditions j in experiment i (µij)of the log-
transformed normalized relative quatities (aij). - Calculate the standard deviation of the expression across all conditions j in experiment
i as σi and the mean standard deviation of all experiments as σ. - Meancentering. Substrate the mean normalized relative expression levels across all
conditions in a given replicate experiment from the same experiment. - Multiply the autoscaled fold changes with the mean standard deviation of the replicate
experiments. - Autoscaling of the standard deviation across all conditions in each biological replicate,
via division of the mean-centered values by the experimental standard deviation σi for the same replicate.
- Perform linear transformation of the autoscaled normalized relative gene expression
levels. - Calculate the mean of the autoscaled normalized relative gene expression levels. - Calculate the standard error of the autoscaled normalized relative gene expression
levels.

Addendum
69
I. Protein analysis
Materials
- Blotting machine o TE70X SEMI-DRY BLOTTER; Brand: Hoefer Scientific
- Power supply - Whatman® 3 MM paper - PVDF or nitrocellulose membrane - Autoradiography films + filmcassette
- primary and/or secondary antibody - ECL
- 5% Milk (store at 4°C):
o 10 g milk powder o Dissolve in 200 ml 1x TBST
- 4 x Separation buffer (dilute to 1x) o 1,5 M Tris
o 0,4% SDS o Adjust with HCl to pH 8,8
- 4x Stacking buffer (dilute to 1x)
o 0,5 M Tris o 0,2% SDS o Adjust to pH 6.8 with HCl
- 5 x Laemmli buffer o 250 mM Tris-HCl (take 12,5 ml from a 1M Tris-HCl stock pH 6.8) o 10% (w/v) SDS (5 g / 50 ml) o 0,5% Bromophenol blue (0,25 g / 50 ml) o 50% glycerol (25 ml) o Fill to 40 ml with ddH2O
distribute into 5 10 ml falcons, so 8 ml / falcon. Store at -20°C
o 20% beta mercapto ethanol (2 ml / 10 ml falcon) - 12x Transfer buffer
o 0.5M glycine (36 g/l) o 0.6 M Tris base (72,5 g/l) o 0.5% (w/v) SDS (5 g/l) o Fill till 1L with ddH2O
- 1x Transferbuffer o 80 ml 12x transferbuffer o Fill till 800 ml with ddH2O o Add 200 ml Methanol
- 10xTBS o 0.2M Tris base (24.2 g/l) o 1.37M NaCl (80 g/l) o Adjust pH till 7,6 with HCl

Addendum
70
o Fill till 1 L with ddH2O - 1xTBST
o Add 1 ml of 50% TWEEN-20 per liter of 1xTBS - Ponceau (500 mL)
o 0,05% poncau-s = 0,25 g o 3% trichloroacetic acid = 15 g o Fill to 500 ml with ddH2O
- 70 % ethanol - TEMED - APS - Isopropanol - Bis-acrylamide
Experimental procedure
Sample preparation.
Step 1: Seed 100 000 MEF RIP1 WT MEF cells/well
Step 2: Incubate cells until semi-confluence
Step 3: Stimulate cells following schematic representation
Plate 1 Stimulation Stock concentration Final concentration
A1 mTNF (4h) 1 mg/ml 20 ng/ml
A2 mTNF (8h) 1 mg/ml 20 ng/ml
A3 mTNF (24h) 1 mg/ml 20 ng/ml
B1 LPS (8h) 50 µg/ml 100 ng/ml
B2 Tm (8h) 10 mg/ml 10 µg/ml
B3 Tm (8h) 10 mg/ml 100 ng/ml
Plate 2 Stimulation2 Stockconcentration Final concentration
A1 Untreated
A2 mTNF (16h) 1 mg/ml 20 ng/ml
A3
B1
B2
B3
Step 4: Wash cells with PBS (1ml)
Step 5: Add 1x Laemmli lysis buffer (100µl)
Step 6: Collect the lysate in 1.5ml Eppendorf by circling around to get everything (viscosity due to DNA present)
Step 7: Boil the samples at 95°C for 5 min
Step 8: Vortex the samples

Addendum
71
Step 9: Measure protein concentration using Nanodrop at 260/280 nm
Step 10: Redilute samples to 2mg/mL in 5x Laemmli buffer (total volume: 150 µL)
Step 11: Boil the samples at 95°C for 5 min
Step 12: Vortex the samples
Step 13: Freeze
Gel electrophoresis
Step 1: Wash the plates with 70% ethanol (the sides that face each other)
Step 2: Put plates in setting machine
Step 3: Add water to check for leakage
Step 4: Remove water and dry plates using paper towel (between plates)
Step 5: Make separating and running gel in fumehood.
(TEMED & APS)* 1.5
Step 6: Put 4.8 ml separating gel per plate
Step 7: Add 150µl of isopropanol to flatten the separating gel
Step 8: Let the gel solidify
Step 9: Add the spacer gel and put the wells in (by pushing from the right side to avoid bubbles)
Add additional spacer gel to remedy any loss
!!! Before loading, remove all bubbles by suction machine
Step 10: Load the gel with 5µl ladder and x µl lysate and add running buffer
Step 11: Run the gels for 1h30 at 120V
Semi-dry Blotting
Step 1: Soak 6x Whatmann paper and the membrane in transferbuffer.
Step 2: Remove stacking gel and bottom of gel
Step 3: Place gel between Whatmann paper and membrane (8.5 cm x 6.5 cm)
!!! Roll pipet over layer between each layer to remove any air bubbles
Step 4: Add some transfer buffer to make it wet
Step 5: Blot 75mA per gel for 1h30
Blocking
Step 1: Wash blotting membrane with water (do not fold the membrane)
Addendum
72
Step 2: Leave membrane for 5min in Ponceau solution
Step 3: Remove Ponceau solution and add water (no directly on the membrane)
Step 4: Wash with 3x 10 min TBST
Step 5: Put membrane in blocking buffer (facing up not each other) for 1h at RT
Detection
Step 1: Add 1st Ab (diluted in 5% milk TBST) and leave overnight at 4°C
Step 2: Recollect 1st Ab
Step 3: Wash membrane 3x 10 min with TBST
Step 4: Add 2nd Ab (diluted in 5% milk TBST) for 1h at RT
Step 5: Wash membrane 3x 10 min with TBST
Step 6: Detect with ECL reagents:
- Use 200 µl solA and 200 µl solB for 1 blot - incubate 1 min and - remove excessive ECL with tissue. - Place between 2 plastic sheets in autoradiography cassette - Take cassette + films to darkroom. Start with a 1 min exposure.

Addendum
73
J. Cell Death analysis
Taken from Grootjans et al. 2016
Materials and Equipment
- Triton X-100 - Inhibitors and stimuli
o MKC-3946 o zVAD-FMK o iTAK
- SYTOX Green - Medium
o DMEM o 5% BFS o L-glutamine
- Sterile 96-well plate (flat bottom) - Cells - FLUOstar Omega - Software for microplate reader
Experimental procedure
Detection of cell death in treated cells
1) Cell seeding. One day before the start of the experiment, seed cells in 150 µl of medium of a 96-well plate. Adjust cell number depending on growth of used cells or if pretreatment for 24h is required to reach 20,000 cells on the day of measurement. Medium should contain serum and other additives as required by the cell line of interest.
2) Incubate the plate in a humidified 37°C for 16-24h (with CO2 control if required by
medium used)
3) Stimulation and kinetics measurement.
Prepare a master plate for stimulation in such a way that all fluorescent probes, inhibitors and stimuli can be added
4) Incubate the experimental plate for 30 min in a humidified 37°C with CO2 control to
allow the inhibitors to enter the cells (longer preincubation may be required depending on the inhibitor used)
5) After incubation with inhibitors for 30 min, add 10 µl of stimulus and negative or positive control per well of experimental plate, and then place the plate in the fluorescence microplate reader
Addendum
74
6) Start the previously established fluorescence microplate reader program. Ensure that the temperature control, CO2 control, filters and corresponding gain settings are correct and functioning. For kinetic experiments, we recommend the use of interval timing that results in 10-15 time points.
7) At the end of the assay, add 10 µL of 0.9% (vol/vol) Triton X-100 stock to each well, to obtain a final concentration of 0.05% (vol/vol) Triton X-100 in each well.
8) Incubate the cells for 2h at 37°C.
9) Start the previously established fluorescence microplate reader program to obtain
the maximal SYTOX Green signal in each well.
Data analysis
10) Calculate the average of technical replicates for each experiment-treatment-time combination.
11) Subtract the background fluorescence values that correspond to the lowest signal for a cell line of the plate (only for SYTOX Green measurements)
12) Perform repeated-measurement analysis on the background-subtracted values, using
REML approach. To perform repeated-measurement analysis, first set the times of measurement at (in) equal intervals.
13) Model the covariance. The REML framework provides a flexible framework in which you can compare one correlation model with another using the Aikake Information
Coefficient. Often, autoregressive correlation structure of order 1 was selected as the best model fit.
14) Assess the significance of treatment changes over time (main effects) and treatment difference changes over time (interaction effects) by an F-test
15) Recalculate treatment effects as proportions of the maximum Triton X-100 value and
plot these rations of cell death on a percentage scale