study of the electric vehicle implementation on the smart grid
TRANSCRIPT
STUDY OF THE ELECTRIC VEHICLE IMPLEMENTATION ON THE SMART GRID
Electric engineering final year projectStudent: Joan Aymerich CalderéProfessor: Santiago Bogarra RodríguezJune 2014
1

Contents
1 SMART GRID CONCEPTS AND HISTORICAL BACKGROUND..................8 1.1 EARLY TIMES.........................................................................................8 1.2 SMART GRID DEFINITION, US VISION.................................................9 1.3 SMART GRID DEFINITION, EU VISION...............................................10 1.4 SMART GRID DEFINITION, IEA VISION..............................................11 1.5 COMPARISON......................................................................................12
2 MAIN PLAYERS............................................................................................13 2.1 UTILITY COMPANIES............................................................................13
2.1.1 TRANSMISSION............................................................................13 2.1.2 DISTRIBUTION..............................................................................16
2.2 THE OIL COMPANIES...........................................................................18 2.3 CAR MAKERS.......................................................................................19 2.4 BATTERY MAKERS..............................................................................19 2.5 ADMINISTRATIONS..............................................................................20 2.6 CUSTOMERS.........................................................................................23
2.6.1 USAGE PATTERNS.......................................................................23 2.6.2 DRIVERS ATTITUDE VS THE EV..................................................26
3 ENERGY BALANCE AND VEHICLE AVAILABILITY....................................28 3.1 ANALYSIS CRITERIA............................................................................29 3.2 BASIC DATA..........................................................................................30
3.2.1 EV PENETRATION FORECAST FOR YEAR 2030........................30 3.2.1.1 CALCULATED EV PENETRATION FORECAST FOR YEAR 2030......................................................................................................31 3.2.1.2 EU REPORTED EV PENETRATION FORECAST FOR YEAR 2030......................................................................................................35 3.2.1.3 CONCLUSIONS......................................................................36
3.2.2 EV ENERGY DEMAND..................................................................36 3.2.2.1 THERMAL CAR EFFICIENCY DATA SOURCE......................37 3.2.2.2 EV EFFICIENCY.....................................................................39 3.2.2.3 CONCLUSION .......................................................................44
3.3 IMPACT OF THE EV ON THE EXISTING ELECTRICAL INFRASTRUCTURES....................................................................................44
3.3.1 LOCAL SCALING, APARTMENTS BUILDING CASE...................45 3.3.1.1 LV DESIGN LOAD AND TOLERANCE...................................45 3.3.1.2 EV RELATED LOAD...............................................................47 3.3.1.3 CONCLUSION........................................................................54
3.3.2 REGIONAL CASE, BARCELONA'S METROPOLITAN AREA......55 3.3.2.1 ELECTRIC POWER TRANSPORT CAPABILITY...................57 3.3.2.2 GENERATION CAPACITY......................................................58 3.3.2.3 POWER DEMAND..................................................................58 3.3.2.4 CONCLUSION .......................................................................61
3.3.3 SPANISH CONTINENTAL SCALE.................................................61 3.3.3.1 CONTINENTAL TRANSPORT CAPABILITY..........................62 3.3.3.2 CONTINENTAL POWER DEMAND........................................62 3.3.3.3 EV POWER DEMAND............................................................62 3.3.3.4 CONCLUSION........................................................................63
3.4 ENERGY BALANCE CONCLUSIONS...................................................63 3.5 VEHICLE AVAILABILITY CONCLUSIONS............................................64
2

4 COUNTERMEASURE REQUIREMENTS......................................................64 4.1 ITEMS TO FIX........................................................................................65
4.1.1 LV SYSTEM CONGESTION...........................................................65 4.1.2 VEHICLE AVAILABILITY COEFFICIENT.......................................66 4.1.3 POWER GRID RENEWABLES INTEGRATION.............................67
4.2 ADMINISTRATION CONCERNS...........................................................68 5 COUNTERMEASURE PROPOSAL..............................................................68
5.1 CONTROL STRATEGY..........................................................................69 5.1.1 CASES DEFINITION......................................................................73 5.1.2 FLOW CONTROL STRUCTURE....................................................90 5.1.3 ENERGY BALANCE......................................................................91
5.1.3.1 ENERGY AVAILABILITY........................................................92 5.1.3.2 ENERGY DEMAND.................................................................93 5.1.3.3 CONCLUSIONS......................................................................94
5.2 INERTIA BATTERY DEFINITION...........................................................94 5.2.1 BATTERY TYPE AND ARRANGEMENT........................................95 5.2.2 DEMAND PROFILE........................................................................96 5.2.3 INERTIA BATTERY SIZING.........................................................100 5.2.4 INERTIA BATTERY CHARGING SYSTEM..................................103
5.3 ECONOMIC VALUATION....................................................................104 5.3.1 COUNTERMEASURE INVESTMENT..........................................105 5.3.2 ECONOMIC PERFORMANCE.....................................................107 5.3.3 PAY-BACK VALUATION...............................................................108
5.4 FUNCTION VALUATION......................................................................109 5.5 ENVIRONMENTAL IMPACT................................................................110 5.6 COUNTERMEASURE PLANNING.......................................................111
3
List of abbreviations
BC Battery ChargerBFEF Building Feeder Energy FlowBMA Barcelona's Metropolitan AreaCB Cars BatteriesC/I Cars/Inhabitant ratioCU Coefficient of UseDG Distributed GenerationDOE Department Of Energy (US)DOD Depth Of Discharge DSO Distribution System OperatorEDSO European Distribution System OperatorsENTSO European Network of Transmission System OperatorsES Electric SubstationESEF Electric Substation Energy FlowEU European UnionEV Electric VehicleFC Flow Control GDP Gross Domestic Product HV High VoltageHVEF High Voltage line Energy FlowHVAC Heating, Ventilating and Air ConditioningIB Inertia BatteryIEA International Energy AgencyIFCS Intelligent Flight Control SystemJRC Joint Research CenterLHV Lower Heating ValueLV Low VoltageMV Medium VoltageMVEF Medium Voltage line Energy FlowM2M Machine To MachineNPV Net Present ValuePHEV Plug-in Hybrid Electric VehicleREE Red Eléctrica de EspañaSAR Sistema de Ayuda a la Reposición del ServicioSEACON Sistema Experto de Análisis de ContingenciasSG Smart GridSOC State Of ChrageTC Transformation CentreTCEF Transformation Centre Energy FlowTCO Total Cost of OwnershipTSO Transmission System OperatorUS United StatesV2G Vehicle To GridVAC Vehicle Availability Coefficient
4
List of tables
Tab. 1, Number of interviews by country [25] pag. 23Tab. 2, EV customer predicted market share and penetration pag. 33Tab. 3, EV penetration evolution pag. 35Tab. 4, future EV penetration in Spain pag. 36Tab. 5, Market share by powertrain [35] pag. 38Tab. 6, Fuel consumption [36] pag. 38Tab. 7, LHV by fuel [37] pag. 39Tab. 8, Engines thermal efficiency [38] pag. 39Tab. 9, Engine and drive efficiency pag. 42Tab. 10, Spanish DSO available transformer power rates pag. 47Tab. 11, Batteries charge power demand by hour pag. 52Tab. 12, Batteries charge power simplified pag. 53Tab. 13, BMA lines capacity pag. 58Tab. 14, Population within the REE defined area pag. 59Tab. 15, Power balance on Barcelona's area pag. 61Tab. 16, Spanish continental area power balance pag. 63Tab. 17, Simplified control table for the FC system pag. 70Tab. 18, Batteries type comparison pag. 95Tab. 19, Batteries charge power demand by hour pag. 98Tab. 20, Batteries charge power simplified pag. 98Tab. 21, Countermeasure required investment pag.106Tab. 22, €/Km cost of runing on thermal engine cars pag.107Tab. 23, Electric energy yearly expenses pag.108Tab. 24, Electric power tax yearly expenses pag.108Tab. 25, Pay-Back evaluation, original countermeasure pag.109Tab. 26, Pay-Back evaluation, improved countermeasure pag.109
5
List of figures
Fig. 1 Israeli F15 fighter pag. 8Fig. 2 Combustion engines efficiency evolution and future trends [21] pag. 21Fig. 3 Hourly total power consumed by engines of EV on travel [24] pag. 24Fig. 4 Hourly vehicles use in per-unit scale [26] pag. 25Fig. 5 Familiarity with the electric car [25] pag. 26Fig. 6 Probability of buying an EV [25] pag. 27Fig. 7 EV quality function deployment evaluation [25] pag. 27Fig. 8 EV penetration expectations in the next 10 years [25] pag. 28Fig. 9 EV energy flow and losses pag. 40Fig.10 Efficiency map of a given engine+driver set [39] pag. 41Fig.11 Efficiency map, surfaces vs efficiencies calculation pag. 41Fig.12 Battery usable energy [40] pag. 43Fig.13 EV energy flow and calculated losses pag. 44Fig.14 Hourly graph of cars running over the total amount of cars pag. 49Fig.15 Hourly distribution of cars leaving and returning to the parking pag. 50Fig.16 Car by car charging power hourly distribution pag. 52Fig.17 Charging power demand pag. 53Fig.18 Residential (“Residencial”) hourly power demand [45] pag. 54Fig.19 EV charging load impact on the LV system, 21% EV pag. 54Fig. 20 BMA and REE maps matching [48]&[47] pag. 56Fig. 21 Lines identification pag. 57Fig. 22 Population related electrical power demand [45] pag. 59Fig. 23 Valley charging strategy [45] pag. 66Fig. 24 Inertia battery concept pag. 69Fig. 25 Elements and energy flow identification pag. 74Fig. 26 Flow Control system structure pag. 90Fig. 27 Maximum energy in kWh pag. 92Fig. 28 EV batteries energy sources pag. 94Fig. 29 Hourly distribution of cars leaving and returning to the parking pag. 96Fig. 30 Charging power hourly distribution pag. 97Fig. 31 CB charging power split pag. 99Fig. 32 CB charging power from the IB pag.100Fig. 33 Energy flow trough the FC elements and the IB pag.101Fig. 34 IB single module voltage/charge vs temperature plots pag.101Fig. 35 IB to CB current flow profile pag.102Fig. 36 Lithium-ion battery prices trend pag.104Fig. 37 Electric energy consumption vs tariff periods, winter pag.106Fig. 38 Spanish electricity generation mix pag.107Fig. 39 Countermeasure development timeline pag.110Fig. 40 Countermeasure development timeline pag.111
6
SummarySince some years ago the electric vehicle popularity, and so the pluggable hybrid,
notably increased although it's not a brand new development. To understand it,
together with the oil prices rise, another factors are to be considered like the CO2
emissions reduction or the fossil fuels dependence.
This work is devoted to the study of the electric vehicle integration on the Smart Grid
exploring the synergies and the challenges of it. Geographically the study illustrates
the Spanish case using as a main data inputs the International Energy Agency
forecasts for western Europe together with some highly valuable European Union
studies, especially those issued by the JRC.
On a first step an electric vehicle market penetration investigation shows that, on
year 2030, a 21% of the cars running trough the Spanish roads will be electrically
powered. The impact of such a presence of electric vehicles could be assumed,
disregarding power grid meshing requirements, by the Spanish electric generation
pool and transport infrastructures even if no improvement on them takes place on the
next 15 years. The bottleneck will then be found on the low voltage distribution
systems and their associated medium voltage lines, that will not be able to hold the
electric vehicle deployment forecast unless their capacities are increased or the
users car availability is impaired. A solution must be found to this fix this issue that
should also explore all the possible synergies with the rest of the electrical system.
As a result two countermeasures arise preserving as much as possible the cars
availability to their owners. One is to size up all the low voltage and related medium
voltage systems to accommodate bigger power flows solving the main problem but
doing nothing to integrate the steadily increasing renewal energy that should be
consumed when is produced or stored on expensive, environmentally harmful,
hydropower pumping stations. The other countermeasure, the main outcome of the
next pages, derives from the functionalities of the Smart Grid and is in fact a
reviewed version of the, yet popular, Vehicle To Grid (V2G) strategy. Its about to add
an inertia battery emulating the inertia tanks in central sanitary water production
facilities. Such a kind of proposal is possible because the grid-wide information share
and distributed control that lies on the Smart Grid concept. The countermeasure will
allow not only a 21% presence of the electric vehicle but even a 100% with almost no
cost for the owners, will greatly help the renewables integration as offers a big energy
storage capacity on valley hours without compromising the electric vehicles batteries
life and also could prevent outages acting as a grid energy supplier in some cases.
7
1 SMART GRID CONCEPTS AND HISTORICAL BACKGROUND
A short but clarifying definitions adopted by the United States (US), the European
Union (EU) and the International Energy Agency (IEA) together with a
background review is to be shown trough the next points.
Out of this pages there are another countries as Japan, China or India, who is
facing a very strong need of adding smartness to his electric power infrastructure,
that also do have special programs to drive the transition to the Smart Grid (SG).
Only a matter of time and space, not relevance, justifies that they do not appear
in this study.
1.1 EARLY TIMES
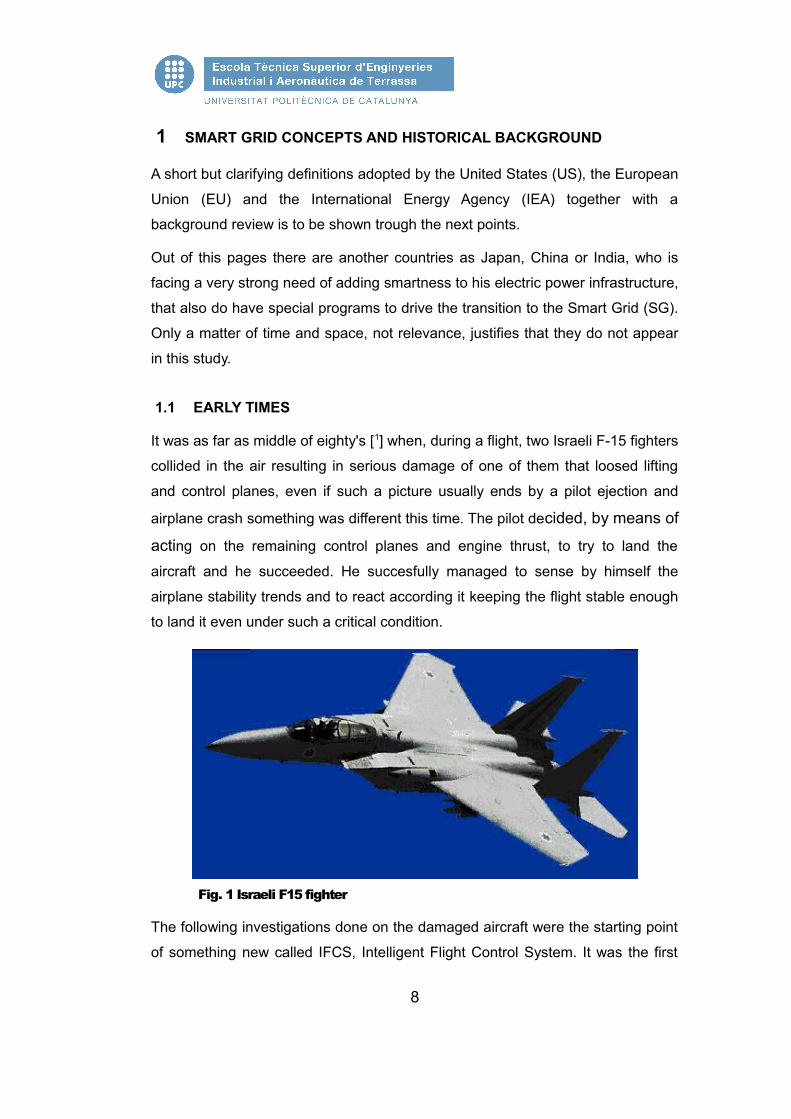
It was as far as middle of eighty's [1] when, during a flight, two Israeli F-15 fighters
collided in the air resulting in serious damage of one of them that loosed lifting
and control planes, even if such a picture usually ends by a pilot ejection and
airplane crash something was different this time. The pilot decided, by means of
acting on the remaining control planes and engine thrust, to try to land the
aircraft and he succeeded. He succesfully managed to sense by himself the
airplane stability trends and to react according it keeping the flight stable enough
to land it even under such a critical condition.
Fig. 1 Israeli F15 fighter
The following investigations done on the damaged aircraft were the starting point
of something new called IFCS, Intelligent Flight Control System. It was the first
8
step to a self-healing system designed at the time to provide pilots with additional
control functionalities based on adding more intelligence to the flight controls in
order to help them to wave predictable and unpredictable difficulties and/or
damages.
Today's Smart Grid (SG) definitions are depicting it, among other capabilities, as
a self-healing system able to automatically, without or with very little human
intervention, react and recover the grid functionalities after a failure keeping the
service quality and trying to avoid outages as much as possible.
1.2 SMART GRID DEFINITION, US VISION
Since the SG concept and first technology deployment of it were born in the US
their definitions and concerns have a special relevance.
According to an US Department Of Energy [2] document, the SG is to meet the
following requirements, literally,
Intelligent – capable of sensing system overloads and re-routing power to prevent or minimize a potential outage; of working autonomously when conditions require resolution faster than humans can respond…and cooperatively in aligning the goals of utilities, consumers and regulators.
Efficient – capable of meeting increased consumer demand without adding infrastructure.
Accommodating – accepting energy from virtually any fuel source including solar and wind as easily and transparently as coal and natural gas; capable of integrating any and all better ideas and technologies – energy storage technologies, for example – as they are market-proven and ready to come online.
Motivating – enabling real-time communication between the consumer and utility so consumers can tailor their energy consumption based on individual preferences, like price and/or environmental concerns
Opportunistic – creating new opportunities and markets by means of its ability to capitalize on plug-and-play innovation wherever and whenever appropriate.
9

Quality-focused – capable of delivering the power quality necessary – free of sags, spikes, disturbances and interruptions – to power our increasingly digital economy and the data centers, computers and electronics necessary to make it run.
Resilient – increasingly resistant to attack and natural disasters as it becomes more decentralized and reinforced with Smart Grid security protocols.
“Green” – slowing the advance of global climate change and offering a genuine path toward significant environmental improvement.
Moreover, focusing to the Electric Vehicle (EV), the same document states next
lines,
Preparation for the future:
A smarter grid is also a necessity for plugging in the next generation of automotive vehicles – including plug-in hybrid electric vehicles (PHEVs) – to provide services supporting grid operation. Such ancillary services hold the potential for storing power and selling it back to the grid when the grid requires it.
Thus looking at the EV full possibilities, as a load and as a storage element,
when it comes to integrate it on the power grid. Complete studies on it were
already carried on in the US ranging from hardware devices [3] to overall grid
impact [4].
1.3 SMART GRID DEFINITION, EU VISION
In the EU the SG description was charged to the EU Commission Task Force for Smart Grids. Below there's an abstract of the EU main requirements [5],
A smart grid employs innovative products and services together with intelligent monitoring, control, communication, and self-healing technologies in order to:[...]A. Enabling the network to integrate users with new requirements [...]
1. Facilitate connections at all voltages/locations for all existing and future devices with SG solutions through the availability of technical data
10
and additional grid information to:[…]- Facilitate connection of new load types, particularly EV;[…]
B. Enhancing efficiency in day-to-day grid operation […]C. Ensuring network security, system control and quality of supply […]D. Better planning of future network investment
17. Better models of DG, storage, flexible loads (including EV), and the ancillary services provided by them for an improvement of infrastructure planning. […]E. Improving market functioning and customer service […]F. Enabling and encouraging stronger and more direct involvement of consumers intheir energy usage and management
1.4 SMART GRID DEFINITION, IEA VISION
The IEA vision is of paramount relevance as it could lead a world-wide
standardization of the SG, being a basis where many countries could refer to.
Literally the IEA [6] defines the SG as follows,
The smart grid is a generic concept of modernising power grids, including activation of demand based on instantaneous, two-way, interactive information and communication technologies. Features of a smart grid include grid monitoring and management, advanced maintenance, advanced metering infrastructure, demand response, renewables integration, EV integration, and V2G. As electric infrastructures age worldwide, there is increasing interest in smart grid technologies that:
- self-heal*- motivate and include the consumer in energy decisions- resists attack- provide power quality (PQ) for 21st century needs- accommodate all generation and storage options- enable markets- optimise assets and operate efficiently.
11
*(IEA note) self-healing refers to an engineering design that enables the
problematic elements of a system to be isolated and, ideally, restored to normal operations with little or no human intervention. The modern, self-healing grid will perform continuous, online self-assessments and initiate corrective responses.
1.5 COMPARISON
First of all a rough inspection tells that the main functionalities are very similar
from definition to definition and an educated guess suggest that the earlier US
one inspired the others. There's a common agreement about,
-Self-healing systems able to keep the customer service even under
unpredictable events.
-Attack-resistant systems, cyber-security concerns.
-Efficiency in terms of energy savings and operation expenses.
-Integration of all technologies on the SG, including renewables, storage
and EV.
-Power quality, an optimal electric energy delivery to the customers.
-Demand management, involving and encouraging the customers into the
grid management.
Only some differences arise when it's about to consider the business
opportunities that can derive from the SG introduction. In case of the US version
it must be a clear economic profit delivered from the new opportunities that the
SG is going to promote, in the other two such a profit will not be immediate and
could be found in savings on infrastructure investments reducing them and
having an efficient planning of the new ones and also savings in the maintenance
and service areas.
From the EV side, the target of this study, similar interest can be seen on his full
deployment as a SG load and storage agent in every case. Unfortunately this first
statement, in case of the EU, suddenly jeopardizes when all of these concepts
have to move to actual, real, funded R&D programs [7] and standardization rules
12
[8]. In both cases the use of EV batteries as a massive storage system, the so
called Vehicle to Grid (V2G) functionality, is not going to be considered by now in
the EU and thus delayed for decades because it could compromise the life of
them.
2 MAIN PLAYERS
The process of the EV progressive integration on the future SG will not be easy
but time linked as not a significant amount of EV could be deployed without a SG
and, at the same time, probably no real SG could exist without EV. Following
there's a review of the main players that are going to be involved on it and where
are they today regarding the huge task coming ahead: the utility companies, the
oil companies, the car makers, the battery makers, the administrations and the
customers.
2.1 UTILITY COMPANIES
The electrical delivery infrastructure is divided in two main areas, transmission
and distribution. In each one different companies are ruling the services under
the Spanish country regulations, some of them transposing EU directives.
Following both are going to be evaluated as a power grid operators under the six
common concepts found trough the three SG definitions and exposed on point
1.5. In case of transmission lines the published daily load profiles could be in help
when determining infrastructure capacity in front of the new-coming EV's.
2.1.1 TRANSMISSION
In Spain the high voltage, mainly 400 and 220 kV, transmission service from the
big generation to large consumption areas is under a single, 90% public shared
[9], company named Red Eléctrica de España (REE), the Spanish Transmission
System Operator (TSO). Additional references to the Spanish regulations, many
of them transposing EU directives, could not be avoided as the electrical sector is
a strongly regulated one.
Additionally the ENTSO platform proposals as the “ENTSO-E Draft Load
Frequency Control & Reserves Network Code” have to be taken into account by
REE as far as they will be working papers for future EU plans and directives.
13

Regarding the agreed SG definition and the EV, despite some R&D programs
that will be roughly described, today's REE smartness could be described as
follows,
-Self-healing.
As far as could be known is not yet implemented but REE started,
as earlier as beginning of ninety's [10] [11], introducing Artificial Intelligence Expert
Systems to its control centre [12]. The so called SEACON and SAR systems were
developed by REE and Iberdrola in order to help engineers of central control to
take decisions when there's an incident on the grid. Their basic functionality is, by
thriving on a data base containing the grid description and a set of pre-evaluated
faults/symptoms/corrections on overloads, faults and over-voltages, to give to the
operators the chance to react against a fault in a matter of few minutes and also
to correct situations that may deploy to a fault in a preventing way.
In any case the system, as far as can be known from the available
information, behind the pure protection devices, is not ready to take and apply
decisions by himself and it can hardly provide information if an unforeseen fault,
out of pre-calculation tables, takes place.
-Attack-resistant systems, cyber-security concerns.
According to the REE their control systems are based on their own
communications grid and thus not connected to the Internet. On the other hand
only processed data is available on their web site thus a high security level
against cyber-attacks could be expected from REE.
-Efficiency in terms of energy savings and operation expenses.
In Spain there's not any legal requirement regarding total energy
loses in a transmission/distribution line or ancillary equipment. Only equipment
thermal limit is to be considered both for continuous and short-circuit cases.
More on efficiency is that REE, and all the other TSO in EU,
operates transmission lines at a 400 kV max. voltage except some pilot facilities.
This is a limiting factor to reduce joule losses and thus to improve efficiency. In
the US 765 kV lines are already in service with thousands of miles of circuits.
14

-Integration of all technologies on the SG, including renewables, storage
and EV.
The Spanish transmission infrastructure development, in terms of
new circuits , transformer capacity, meshing improvement and ancillary systems,
is to follow a five years plans stated by law after evaluation of technical proposals
made by the most relevant public and private agents involved on it.
The global economic meltdown, driving a industrial consumption
attenuation, the progressive connection of more Distributed Generation (DG)
coming from renewables, the EV penetration forecasts and changes on
residential consumption profiles forced the Spanish government to stop the
previous plan, from may 2008 [13], and start evaluating a new one that now is
under study.
Regarding the EV, REE has a R&D program, called “Verde”,
focused in 100 EV connection, no more information is available about it but due
to the limited amount of units also a limited result can be expected from it in
terms of statistically representative data.
-Power quality, an optimal electric energy delivery to the customers.
The Spanish government is asking for a minimum quality on the
electric power supply, measured by three coefficients: not delivered energy due
to outages, average outage time and total power availability.
-Demand management, involving and encouraging the customers into the
grid management.
Till now REE follows a Spanish law [14] that allows them to cut
energy supply to a big customers that agree to do so when needed. To
encourage big consumers to join this option there's a special contract that gives
discounts on the energy price every time that their supply is reduced. Since REE
is not working directly with the small, residential low dimension industry, they
couldn't go further in this direction.
Finally, In this sense, REE has also some R&D programs focused
on demand management by aggregating electric demand in valley hours.
15
2.1.2 DISTRIBUTION
The Spanish distribution network is owned and managed by different companies.
We'll concentrate on Endesa-Enel, the biggest distribution company among them,
and try to expose their concerns regarding the SG requirements as we did with
REE.
As previously stated for REE, also distribution companies operate under a very
closer control from the Spanish government and the laws promoted by him and
by the EU. In this case distribution companies are associated to the EDSO group
instead of the transmission ENTSO and there's a constant technical and
regulation discussion between them related to the fact that they operate around
the common frontier of high to medium voltage. In the present situation the
ENTSO association proposes the future rules for the electric grid development
and operation while the EDSO responds with their objections [15]
-Self-healing.
Endesa owns expert systems as those of REE aiming to help the
control engineers when its to take a decision against a grid disturbance or fault.
Even if its a first step on Artificial Intelligence no self-healing technology is
existing as far as can be stated from their public information.
-Attack-resistant systems, cyber-security concerns.
According to the Endesa a wide M2M IP addressing grid has been
deployed between the control centres and the grid elements. As the IP
technology relays on the internet addressing protocol there's a potential
weakness against cyber-attacks. -Efficiency in terms of energy savings and operation expenses.
As already pointed for REE in Spain there's not any legal
requirement regarding total energy loses in a transmission/distribution line or
ancillary equipment. Only equipment thermal limit is to be considered both for
continuous and short-circuit cases.
-Integration of all technologies on the SG, including renewables, storage
and EV.
Regarding this point a project named ZEM2All [16] is to simulate a
16
real penetration of the EV in the Spanish city of Malaga including fast charging
stations and V2G technology over a 200 fleet of EV on a limited area of the
mentioned city. Endesa, together with Mitsubishi, Hitachi and the Spanish
government is going to study trough this project usage patterns, low voltage (LV)
congestion problems, smart metering applications and others. Even if this have to
be seen as a very positive activity and will deliver a highly valuable information
there are some matters, as usage patterns, that may need a much more larger
and statistically controlled measurements if they are to be representative.
-Power quality, an optimal electric energy delivery to the customers.
In Spain, specially for household users and after some long outages
and over-voltage related damages, the government forced the distribution
companies to immediately compensate any damage. Such a policy should tend
to improve the service quality.
On the other hand small industry service, both medium and low
voltage, is also improving but at a different speed and some uncertainties about it
still exist. When it comes to asses the electric supply continuity to some critical
facilities many customers still rely on emergency generators.
-Demand management, involving and encouraging the customers into the
grid management.
The first step on the way of involving customers in reducing energy
consumption and being more efficient when doing it is to let them to know and
understand how many energy are they consuming on a given time at easy.
As a part of the company Enel, Endesa share the knowledge
coming from the largest smart metering initiative in the world. In Italy Enel [17]
deployed 32 million smart meters that users can read and check trough the
internet by using personal computers or smart phones and where they can
change their contract or cut the energy supply trough a remote operated switch. A
stunning experience of a real Demand-side Management that will give an insight
to the rest and that is being deployed in Spain with already more than 3 million of
such a smart meters installed heading to a total of 13 million in 2015 [18].
17
2.2 THE OIL COMPANIES
As today main players in terms of transportation energy suppliers it's important to
know how they are facing the coming future and which plans are already on the
way taking into account their very strong technical and financial muscle. To do so
it will be useful to concentrate in two of the biggest ones that are not only
extracting oil but also selling refined fuel to the final car owner, Exxon-Mobil and
British Petroleum (BP).
In case on BP his technology head, Mr. David Eyton [19], said,
“For example, everybody would like to have batteries that are more cost-effective and smaller, because then electric cars would be viable and renewable power could be stored more cost effectively. Therefore, there’s a vast amount of effort going into nanotechnology for batteries. It’s a long way off from being solved, but it is a potentially disruptive technology for our industry, so we keep a very close eye on it.”
From this words its clear that BP is or will be involved in one of the critical points
of the EV technology, the nano-batteries, that will make it a substitute of actual
thermal engine cars and also a new energy storage agent. It's a fact that
batteries and the future fast charging stations will be linked to the present fuel
stations, they rule the market today and will try to do so in the future by migrating
from fuel pipes to electric wires.
In case of Exxon-Mobil they, as a founding sponsor of the Global Climate and
Energy Project (GCEP) at the Stanford University, concentrated their
investigations in, among others,
-Fuel-cells driven by H2 or natural gas for EV.
-Increasing the capacity of Li-ion batteries for hybrid and EV.
Thus the same target seen at BP. As today market leaders on automotive fuel
distribution, they are making efforts to stay there in the future looking in this case
for a wider range of technology to achieve it, batteries but also fuel-cells.
All of these companies, still today strongly linked to the fossil fuels market, will
play a major role in the future of electric mobility and will try to lead the future
services (fast charging stations, battery replacement stations, hydrogen/methane
18
filling stations) needed to make the EV a real option.
2.3 CAR MAKERS
Their implication in the EV introduction into the SG relays mainly on two main
technical items,
-Related to the car warranties. Their concern could be the batteries life
span in case of V2G usage. As the V2G strategy means more charge/discharge
cycles per year, even if some of them are only partial, the estimated life of the
batteries will be affected and thus some warranty problems may arise from it.
-Related to the charging equipment. Till now a vast majority of the
commercially available EV incorporate an onboard battery charger being the
dominant trend together with DC connectors for fast DC charging on electro-
charging stations. In the future, if a V2G strategy is to be followed, they do need
to consider using a bidirectional systems or give to an external charger a battery
access. Global standardization is of paramount importance but today there are
three different connection and charging standards, the US one, the EU one and
the Japanese one.
Even if the previous technical issues, together with others like HVAC systems
tailored for the EV energy availability, are all of them of paramount importance,
the marketing policies and strategies that the car makers decide to start will be
probably one of the greatest contributions that can be done to the EV
penetration.
Additionally, as one of the main items to clear is the EV average usage patterns,
it will be desirable that they enrol, even with the present petrol/diesel/hybrid cars,
into a wide market research to unveil such a very valuable and extensive
information. Its a real key point to successfully integrate the EV into the SG.
2.4 BATTERY MAKERS
As a basic element named to replace the fuel tank the batteries will be on the
edge of the EV introduction on the SG as they will be the heart of a new
consumption/storage element in to the grid . Their ability to withstand more and
more cycles and to store more and more energy per kilogram are going to be
19

critical for the EV future.
It has been a long journey since the early lead-acid batteries where used to
power-up the GM EV1. Since then the last decade electronic portable devices
like laptops or cellular phones pushed to the market new generations of lithium
batteries that can offer five times more energy density halving the weight of the
lead-acid ones at the same time. The origin of this new batteries, the electronic
industry, and the more and more sophisticated technology linked mainly to the
nano structures development, make the difference and a set of new battery
companies showed into the market with high-tech revolutionary products. The
future for the traditional battery makers is thus not clear unless they are a part of
big companies that could buy technology from outside or develop it by
themselves in a very fast way.
Looking at the new players, almost all of them from the US, they are offering very
competitive, commercially available, products with an impressive 16.000 cycles
life span as the AltairNano 24v 60Ah modules or with and an energy density
over 130 Wh/kg as the A123 systems AMP20M1HD-A modules.
2.5 ADMINISTRATIONS
Public authorities in Spain, despite some special promotion programs like Movele
that accounts for 590 M€ in direct subsidies for the EV introduction, do follow the
EU regulations and directives transposing them in to the Spanish law corps.
Next lines will show the most relevant directives, regulations and reports issued
by the EU, by the Joint Research Center (JRC) and by the European Platform
Smartgrids related to the EV and its implementation into the SG.
-”Regulation 443/2009 of 23 April 2009” [20], European Parliament.
Intended to be applied to the passenger cars sets a maximum of 95 gCO2/km as
full production range average emissions level for car manufacturers from 2020
onwards. Considering that today's, 2012 data, best in class is Fiat with an
average consumption of 119,8 gCO2/km (all-brands average for the same period
is more than 132 gCO2/km) and expecting a small improvement in terms of
combustion engines efficiency within' the next 6 years, hybrid and EV are to be
widely introduced by every car maker that plans to sell in Europe something more
20
than small cars. On point 3.2.1.1.4 there's a detailed argumentation regarding
such a forecast.
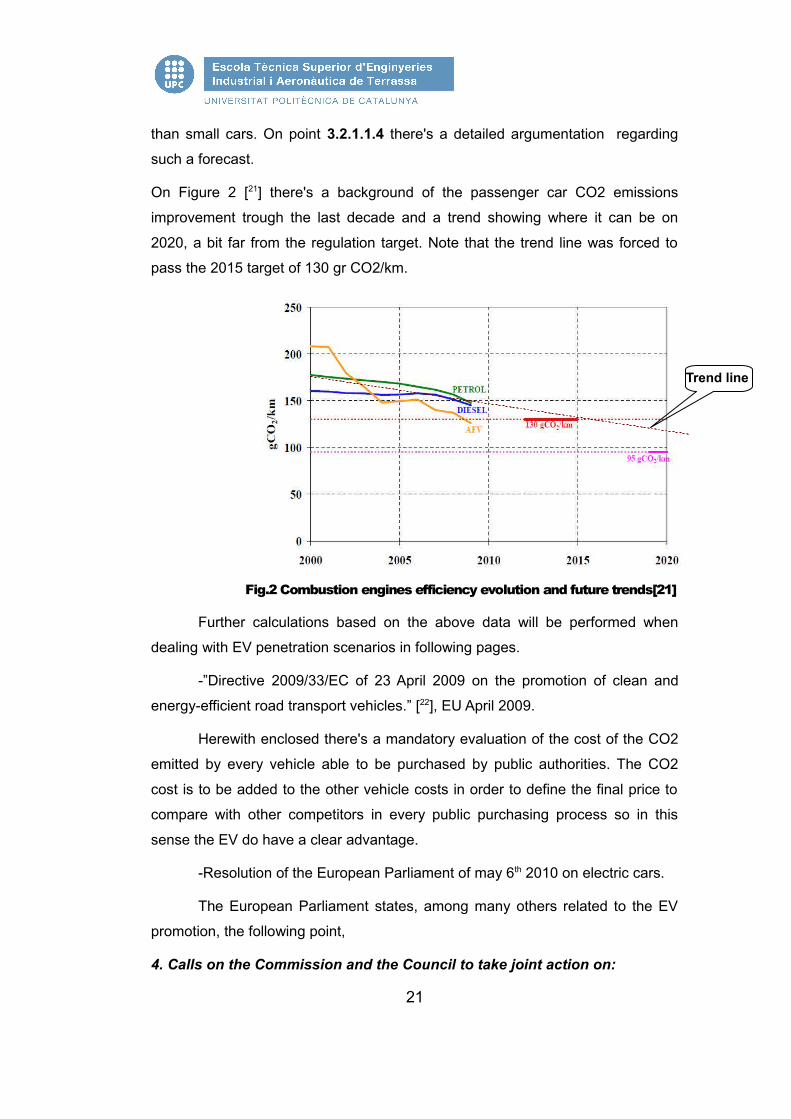
On Figure 2 [21] there's a background of the passenger car CO2 emissions
improvement trough the last decade and a trend showing where it can be on
2020, a bit far from the regulation target. Note that the trend line was forced to
pass the 2015 target of 130 gr CO2/km.
Fig.2 Combustion engines efficiency evolution and future trends[21]
Further calculations based on the above data will be performed when
dealing with EV penetration scenarios in following pages.
-”Directive 2009/33/EC of 23 April 2009 on the promotion of clean and
energy-efficient road transport vehicles.” [22], EU April 2009.
Herewith enclosed there's a mandatory evaluation of the cost of the CO2
emitted by every vehicle able to be purchased by public authorities. The CO2
cost is to be added to the other vehicle costs in order to define the final price to
compare with other competitors in every public purchasing process so in this
sense the EV do have a clear advantage.
-Resolution of the European Parliament of may 6th 2010 on electric cars.
The European Parliament states, among many others related to the EV
promotion, the following point,
4. Calls on the Commission and the Council to take joint action on:
21
Trend line

[...]
(iii) improvement of electric networks by introducing smart grids, and the introduction of sustainable generation capacity with low carbon intensity, particularly through renewable energy sources,
-”SmartGrids SRA 2035 Strategic Research Agenda” [7], European
Platform Smartgrids, 2012
This document describes which are the EU official research priorities
regarding the SG development toward year 2035. Among them, and regarding
the EV integration into the SG its written that,
The second driver is the introduction of electric vehicles. The electric
vehicle constitutes a very elastic load because it remains connected long
time to the grid and the battery of electric vehicles as load could be very
easily managed. The electric vehicle is an attractive application in order to
introduce demand response in the residential level.
Although bidirectional energy flows from the grid to the EV are in principle
already possible (V2G, Vehicle to Grid), it is foreseen that before 2020 the
batteries of electric vehicles will only be connected as a load, i.e. controlled
charging. However, by 2035 some V2G services, i.e. injecting battery power
into the grid, will appear.
Thus not considering, as already exposed on point 1.5, the EV as a mass storage
facility to smooth the demand curves and store renewable energy when produced
with no demand.
-”Driving and parking patterns of European car drivers, a mobility
survey.”[23] EU JRC, 2012.
A comprehensive full study aimed to identify and explore the european
driving and parking patterns in order to provide valuable data for the future EV
and biofuel vehicles future implementation.
-”Projections for Electric Vehicle Load Profiles in Europe Based on Travel
Survey Data”[24]. EU JRC, 2012.
22
An exhaustive report focused on the car usage patterns and their
translation to electric energy demand when some of them became by Evs.
-”Attitude of European car drivers towards electric vehicles: a survey”[25].
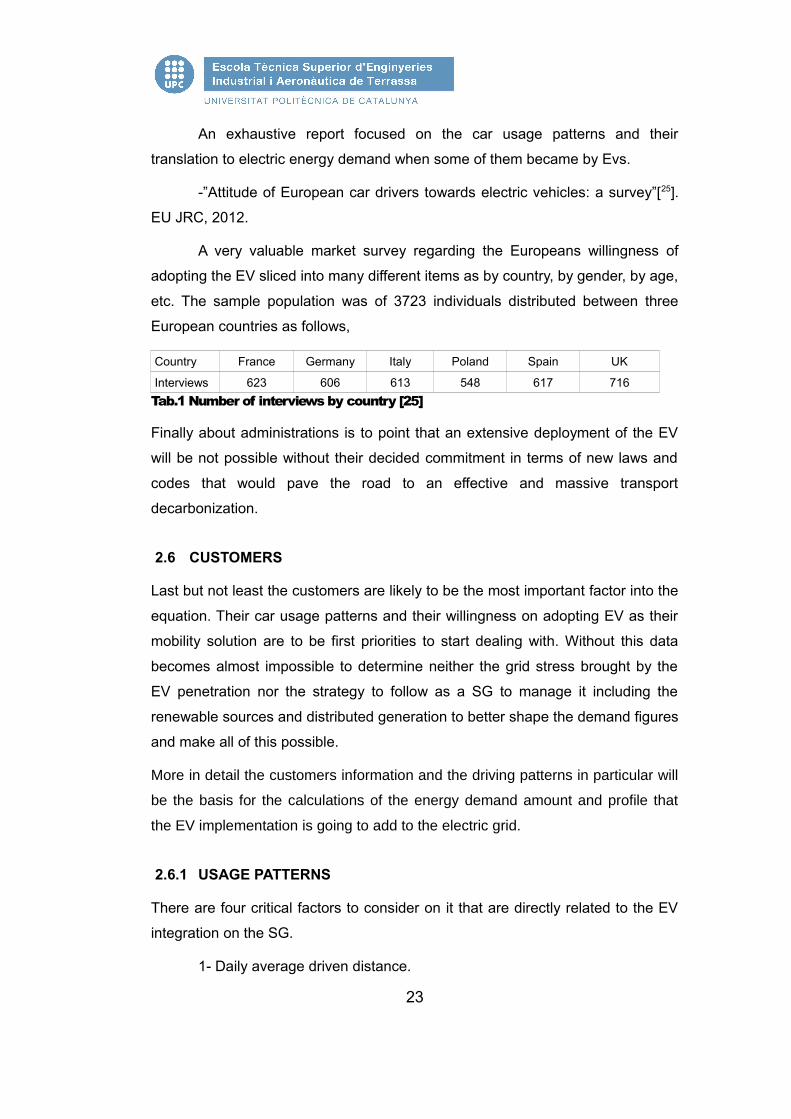
EU JRC, 2012.
A very valuable market survey regarding the Europeans willingness of
adopting the EV sliced into many different items as by country, by gender, by age,
etc. The sample population was of 3723 individuals distributed between three
European countries as follows,
Country France Germany Italy Poland Spain UK
Interviews 623 606 613 548 617 716Tab.1 Number of interviews by country [25]
Finally about administrations is to point that an extensive deployment of the EV
will be not possible without their decided commitment in terms of new laws and
codes that would pave the road to an effective and massive transport
decarbonization.
2.6 CUSTOMERS
Last but not least the customers are likely to be the most important factor into the
equation. Their car usage patterns and their willingness on adopting EV as their
mobility solution are to be first priorities to start dealing with. Without this data
becomes almost impossible to determine neither the grid stress brought by the
EV penetration nor the strategy to follow as a SG to manage it including the
renewable sources and distributed generation to better shape the demand figures
and make all of this possible.
More in detail the customers information and the driving patterns in particular will
be the basis for the calculations of the energy demand amount and profile that
the EV implementation is going to add to the electric grid.
2.6.1 USAGE PATTERNS
There are four critical factors to consider on it that are directly related to the EV
integration on the SG.
1- Daily average driven distance.
23
2- Parking time. How many time to charge the battery.
3- Parking place. Where can be charged the EV battery.
4- Hour-by-hour car usage.
Regarding all of this data many information is already available trough EU
reports,
-Points 1, 2 and 3 are fully deployed on the already mentioned report
“Driving and parking patterns of European car drivers, a mobility survey” [23].
-Point 4 graphs can be found on the already mentioned report
“Projections for Electric Vehicle Load Profiles in Europe Based on Travel Survey
Data” from JRC, a huge and fundamental approach to the European driving
patterns done over a extensive sample of Europeans of different countries. There
some very interesting data is included as the following sample of a hour-by-hour
driving pattern,
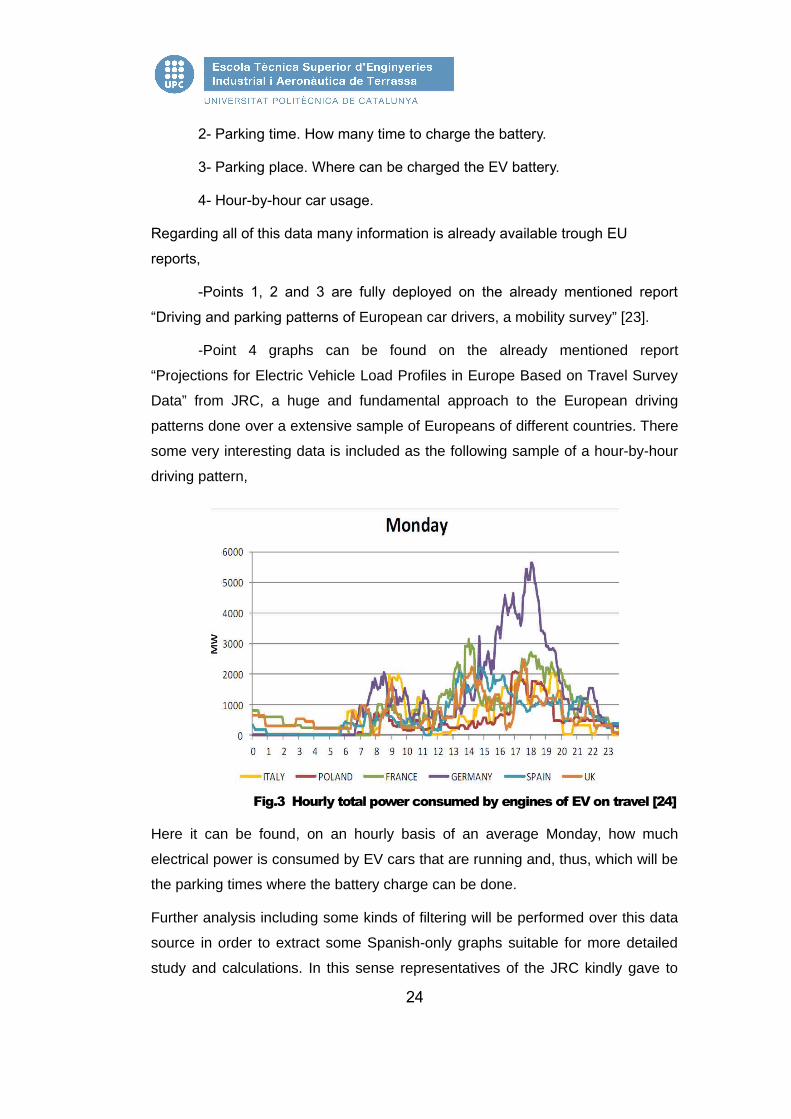
Fig.3 Hourly total power consumed by engines of EV on travel [24]
Here it can be found, on an hourly basis of an average Monday, how much
electrical power is consumed by EV cars that are running and, thus, which will be
the parking times where the battery charge can be done.
Further analysis including some kinds of filtering will be performed over this data
source in order to extract some Spanish-only graphs suitable for more detailed
study and calculations. In this sense representatives of the JRC kindly gave to
24
the author the fully databases that allowed such a investigations and, by doing
this, made this job possible.
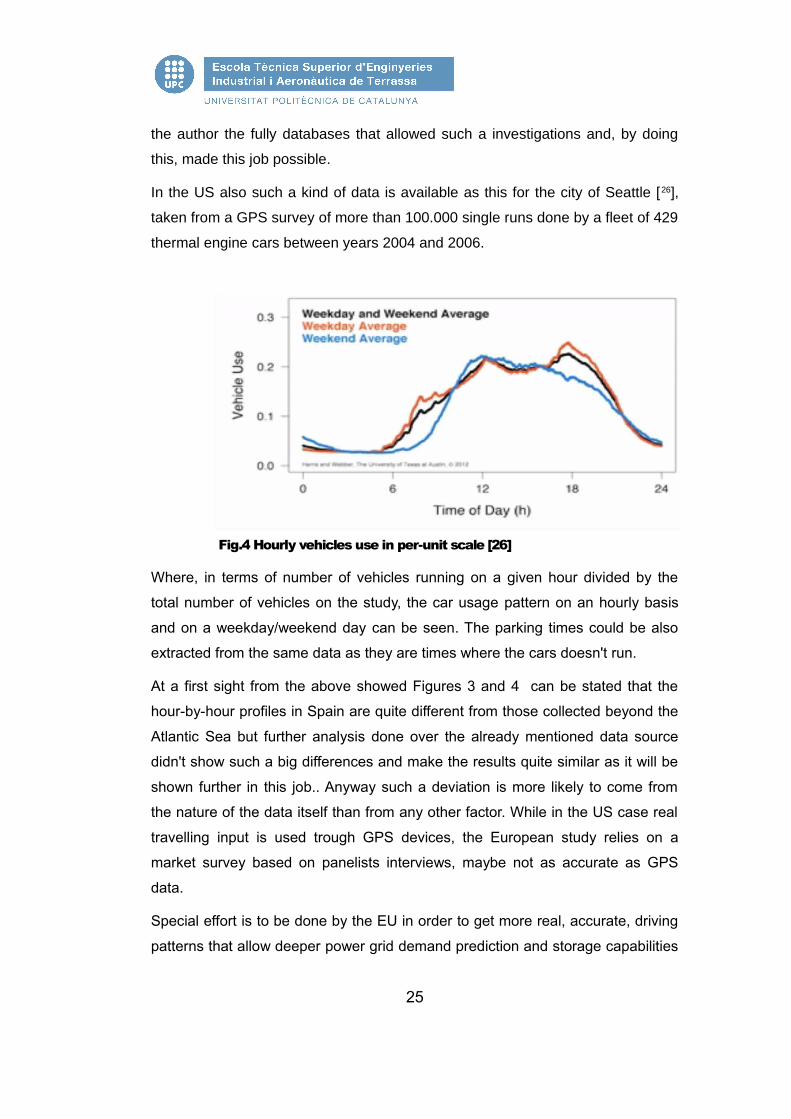
In the US also such a kind of data is available as this for the city of Seattle [26],
taken from a GPS survey of more than 100.000 single runs done by a fleet of 429
thermal engine cars between years 2004 and 2006.
Fig.4 Hourly vehicles use in per-unit scale [26]
Where, in terms of number of vehicles running on a given hour divided by the
total number of vehicles on the study, the car usage pattern on an hourly basis
and on a weekday/weekend day can be seen. The parking times could be also
extracted from the same data as they are times where the cars doesn't run.
At a first sight from the above showed Figures 3 and 4 can be stated that the
hour-by-hour profiles in Spain are quite different from those collected beyond the
Atlantic Sea but further analysis done over the already mentioned data source
didn't show such a big differences and make the results quite similar as it will be
shown further in this job.. Anyway such a deviation is more likely to come from
the nature of the data itself than from any other factor. While in the US case real
travelling input is used trough GPS devices, the European study relies on a
market survey based on panelists interviews, maybe not as accurate as GPS
data.
Special effort is to be done by the EU in order to get more real, accurate, driving
patterns that allow deeper power grid demand prediction and storage capabilities
25

to effectively plan the EV arrival and integration into the European countries
power grids.
2.6.2 DRIVERS ATTITUDE VS THE EV
This is a must when forecasting the future degree of penetration of the EV in to
the European car market. The EU, as said on point 2.5 and trough the JRC,
already issued a market survey report on it, the so called “Attitude of European
car drivers towards electric vehicles: a survey.” [25] from 2012.
Within this document important customer trends are unveiled together with a
clear picture of today's EV knowledge among the EU citizens. The following
aspects are taken into account,
-Familiarity with the EV. Quite low among the countries on the report, a
little big more than 50% and closer to 60% in case of Spain.
Fig.5 Familiarity with the electric car [25]
-Probability of buying an EV. The study presents two options. The first
one, whose results are shown below, consists in the probability that, if a new car
is to be purchased by the panelist today, it could be an EV. The result is
surprisingly high taken into account the previous result of low awareness about
EV. The second one considers that the EV available at the purchasing time has
some technical and cost improvements, with this the purchasing probability
increased a 20% so we can conclude that customers do consider that EV is not
yet ready for massive introduction into the market.
26

Fig.6 Probability of buying an EV [25]
Where 26% of the total Spanish sample shows a 70% probability of buying an EV
in the next 10 years if its performance is at least the present one.
-Quality Function Deployment on EV. Here customers evaluate which
areas on the EV should be improved regarding the present condition of it. The
results can be seen below and from it becomes clear that the main worries are
those related to the charge, thus the possibility of running out of battery which is
the EV nightmare, and the cost, being the power-speed of residual interest.
Fig.7 EV quality function deployment evaluation [25]
-EV penetration expectations. Here the European customers showed a
highly optimistic criteria, with an average forecast of more that 26% market share
for the EV in the next 10 years.
27

Fig.8 EV penetration expectations in the next 10 years [25]
Where a real optimistic position is with the 25% of the Spanish sample pointing
more than 40% of EV penetration.
After all of this points and the related data there are two main conclusions that
must be considered regarding the target of this study.
1- The customers average likelihood of being an EV owner is higher that
expected in some studies regarding the EV future market share. Among today's
available forecasts [27] the most optimistic one is waving a 12% market share for
pure EV [28].
2- Beyond the average data, and despite the deep economic recession in
their countries, the southern Europe customers are more inclined to adopt the EV
than the northern ones. It must be carefully considered as this pages are devoted
to the Spanish case.
3 ENERGY BALANCE AND VEHICLE AVAILABILITY
A significant introduction of the EV in a 15 years horizon will be a big defy to deal
with in many ways, among them the electrical energy transport and distribution
infrastructure could be critical. Next titles will focus on how the EV needs will
affect to the total energy demand and compare it with today's power grids
capabilities in order to unveil where the weak points will be and the strategies or
28
countermeasures that can be applied to overcome them.
Another important point regarding a key players, the final users, will be the
vehicle availability due to the batteries charging times and it must be seriouslyta
ken into account when evaluating the new power demand as shorter charging
times give higher power needs.
Next points will introduce the criteria that will drive this study, the basic data to
start from, and the resulting energy balance focused on three main ranges,
continental, regional and local.
3.1 ANALYSIS CRITERIA
Two main items will be taken into account as a priorities trough this study,
-Regarding the VAC coeffcient
One of the most significant achievements of the engineering progress is mobility.
This freedom of travelling from one part to the other brought to the human
civilisation the desired availability of task force, knowledge and freedom where it
was needed and at the time that it was needed.
The author of this study considers then the mobility as a capability of paramount
importance and will focuse his work in keeping it as closer as possible to the one
provided provided by the thermal engines the passenger cars. No other
restrictions on the use of the EV are going to be accepted but some waiting time
to reload the batteries that should be minimized to assure as much as possible
the maximum vehicle availability. In order to evaluate it the vehicle availability
coefficient (VAC) will be described showing in percent the daily vehicle availability
regardless maintenances and inspections, in particular the VAC of thermal engine
cars will be considered 100% as refuelling only takes a few minutes. The formula
to calculate the VAC will be,
VAC=(24−Charging time)/ 24
Exp. 1
As an example, 8 hours of charging time will mean a VAC of 66%, quite poor as
the car owner could not use his vehicle with his whole operating range during one
third of the day.
29
-Regarding the power and energy demand.
The energy efficiency will be the main concern trough this study together with the
need of exploring solutions and proposals that could exhibit a high degree of
synergy between the different stakeholders involved into the process of transport
electrification.
In addition, as many of the terrestrial public transportation is already electrically
driven as for the train, subway and city railways in Spain, no any further
contribution to the demand calculations will be considered due to the remaining,
thermal powered, bus lines.
3.2 BASIC DATA
The basic input data to proceed with the energy balance evaluation will be
integrated by two main parameters,
-EV penetration forecast for year 2030. A forecast will be performed to
conclude with the total amount of EV running on the Spanish roads on year 2030
beside this an EU report regarding this data will be discussed and compared.
-EV energy demand. The other basic input, together with the EV market
penetration is the amount of energy that those newcomers will demand from the
power supply infrastructures. To perform such a calculation an elementary value
of energy drained from the electric company to run a single kilometre will be the
target to find.
3.2.1 EV PENETRATION FORECAST FOR YEAR 2030
Next titles will deploy two different ways of predicting the EV penetration on the
Spanish passenger car fleet for year 2030.
The first one is achieved by calculations done over a range of complementary
official data as demography or car per inhabitant (C/I) ratio in Spain The second
will go right to an existing study whose results, intended for the whole EU, will be
translated to the Spanish case.
30

3.2.1.1 CALCULATED EV PENETRATION FORECAST FOR YEAR 2030
Following the EV penetration on the next 16 years will be calculated based on the
information introduced on chapter 2. There are four many inputs to define it,
-Total amount of passenger cars forecast. Today's Spanish passenger car
fleet, estimated on more than 22 million of vehicles [29] could be used as a
starting calculation point together with Spanish demographic data. Correlation
between both sources is to be established.
-Administration activity. From today's already enforced regulations a
calculation basis is to be exposed to show which will be the minimal EV
penetration.
-Customer perceptions. Paying attention on market surveys a trend can
be identified and used as a complementary information.
-Practical limitations. That could arise from the impossibility of settling on
time the required equipments and infrastructures. This would happen if not
enough resources are committed today to perform a evaluation of what's coming
and to prepare the countermeasure program that will help to wave it. In this
sense this study tries to be in help on identifying future issues and planning
actions against it.
3.2.1.1.1 TOTAL AMOUNT OF PASSENGER CAR FORECAST
As previously stated the Spanish passenger car fleet on 2012 accounts for a little
bit more than 22 million units according to the Spanish national car makers
association, ANFAC [29]. Additionally when it comes to forecast how the future
fleet volume will be more information is to be compiled, in detail demographic
data forecast and the cars/inhabitant ratio will be needed.
-Demographic data. According to the Eurostat “Demography report 2010”
[30] the Spanish population in 2030 will be of 52.661.000 inhabitants.
-Cars/inhabitant ratio. Regarding this point it will be assumed that Spain's
today ratio [31] of 0,48 Cars/Inhabitant (C/I) will steadily increase till the
European's today average of 0,54 [31] in 2030. No further evolution on today's
European average of 0,54 C/I ratio will be considered for the coming years as the
31
EU automotive markets are quite mature and public transportation is to be
promoted more and more.
As a result of the above data the total amount of cars in Spain on 2030 could be
estimated on 28.436.940 passenger cars.
3.2.1.1.2 ADMINISTRATION ACTIVITY
On point 2.5 the European ”Regulation 443/2009 of 23 April 2009” [20] was
described showing that in 2020, a new CO2 limit of 95 grams of CO2/km for
passenger cars will be in force. As a sign of the EU authorities determination a
law redefinition was asked by the car industry in order to increase this limits but
the finally issued code didn't change it.
As a result of such a new law, together with the thermal engines efficiency trend
shown on Fig.2, EV will be a must on the car makers product portfolios if they are
to follow the new regulation. In this sense, as early as 2020, they will face the
following situation.
-Maximum CO2 emission level, 95 g CO2 /km.
-Maximum attainable technological level by using thermal engines, 120 g
CO2 /km average. Although even today some cars are exhibiting much more
lower levels each brand whole product range average trend is what should be
taken into account for this study purposes.
3.2.1.1.3 CUSTOMER PERCEPTIONS
According to the Spanish customer willingness data that is shown in previous
Figures 6 and 8 the following analysis can be done,
-Following the willingness of buying an EV 50% is the average to be
considered to predict future EV sales. If it's so then every year 50% of the total
amount of purchased cars should be EV's. The truth is that, in year 2013, the EV
sales hardly reached the 685 units on the whole Spanish country over a total of
772.703 new cars registrations on the same period. Which is far away from the
336.350 units of EV and PHEV predicted by the panel. Such a very big difference
could relay on the lack of charging facilities, the poor EV product range, the high
prices and the maybe two much high acceptance of the EV when fulfilling the
32
patterns that suddenly declines when it comes to go to the car shop and pay for
it.
-Following the customer perception and according to Figure 8 a 32% of
EV penetration is to be expected by year 2022. This data should be taken
carefully as the panelists could not have enough information when answering this
question and it must be better considered as a simple guess more than an
educated oppinion.
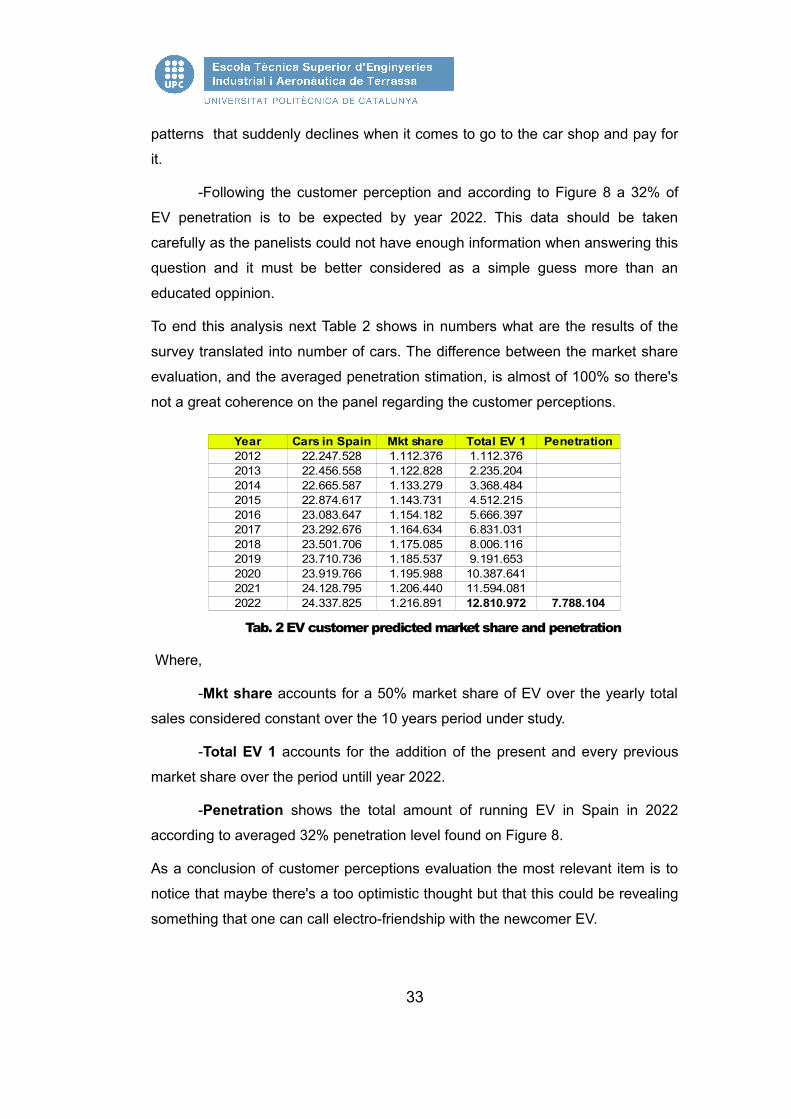
To end this analysis next Table 2 shows in numbers what are the results of the
survey translated into number of cars. The difference between the market share
evaluation, and the averaged penetration stimation, is almost of 100% so there's
not a great coherence on the panel regarding the customer perceptions.
Tab. 2 EV customer predicted market share and penetration
Where,
-Mkt share accounts for a 50% market share of EV over the yearly total
sales considered constant over the 10 years period under study.
-Total EV 1 accounts for the addition of the present and every previous
market share over the period untill year 2022.
-Penetration shows the total amount of running EV in Spain in 2022
according to averaged 32% penetration level found on Figure 8.
As a conclusion of customer perceptions evaluation the most relevant item is to
notice that maybe there's a too optimistic thought but that this could be revealing
something that one can call electro-friendship with the newcomer EV.
33
Year Cars in Spain Mkt share Total EV 1 Penetration2012 22.247.528 1.112.376 1.112.3762013 22.456.558 1.122.828 2.235.2042014 22.665.587 1.133.279 3.368.4842015 22.874.617 1.143.731 4.512.2152016 23.083.647 1.154.182 5.666.3972017 23.292.676 1.164.634 6.831.0312018 23.501.706 1.175.085 8.006.1162019 23.710.736 1.185.537 9.191.6532020 23.919.766 1.195.988 10.387.6412021 24.128.795 1.206.440 11.594.0812022 24.337.825 1.216.891 12.810.972 7.788.104
3.2.1.1.4 RESULTS
Using the previous data coming from the demography and the emission
regulations some calculations could be made in order to forecast the future
amount of EV in Spain. The customer perceptions will be used as a filter in case
of abnormal results.
At the point 2.5 a technical dilemma between the EU regulation and the thermal
engines efficiency arises. The solutions to cope with this could be resumed into
three main options,
1-Running cars on biofuel.
For this study purposes no significant biofuel usage will be considered on
passenger cars as biofuel availability is compromised with crop usage of the
available land and due to the difficulty for the car makers to asses in front of the
authorities whether a given car will run on biofuel or fossil fuel when justifying
their CO2 level.
2-Use of hydrogen driven fuel-cells or engines.
No significant deployment of H2 cars is taking place comparing with the latest
developments and actual commercial proposals seen in fully electrical and hybrid
automotive powertrains. The H2 supply and storage stills being a dangerous and
unsolved item today.
3-The EV/PHEV.
Finally, as the only remaining way to pass the coming regulation, EV and PHEV
are to be deployed as a significant part of every manufacturer product range in
order to dilute the average CO2 emissions. To calculate their share first we do
need to know how many cars will be sold on 2020. To do so there's from one side
the average age of the Spanish passenger car fleet that is, and will be for this job
purposes,10 years [29], and from the other side the total amount of cars on 2020
forecast, that is of 23.919.765 units based on the evolution of the C/I ratio as
pointed on 3.2.1.1.1 and population data [32]. Taking into account this data a total
2.391.977 car sales can be expected on 2020 that will split into thermal and
electrical driven ones.
From the previous data the Expression 2 is proposed to determine wich part of
34

the passenger car sales on 2020 will be thermally driven and wich one will be
electrically driven.
Exp. 2
Where X is the amount of EV, accounting for 0 g CO2 /km, that should be part of
the total passenger car sales in order to full fill the regulation. Once calculated we
do have X=0'21, that means, 21% of total sales of EV should be electrical ones
and this is 497.531 EV sold in Spain in 2020.
Next is to to move from 2020 to 2030 considering that previous sales are
negligible. To do so it will be assumed that, even if a improvement on CO2
emission level could be expected over a period of 10 years, it will not be
considered. The reason for such a statical approach is that any further efficiency
improvements on engine emissions will came together with new legal limits in
that manner that both effects are auto-cancelling each other. Indeed it can be
considered that future efforts on automotive R&D programs will concentrate on
EV and all the surrounding items that must be improved from today's state of the
art as high energy density batteries, ultra efficient air conditioning equipment,
energy recovery systems and many others that are on the stack.
As a result of the previous considerations, and assuming a constant 21%
participation of EV on yearly car sales, a table can be constructed as the
following.
Tab. 3 EV penetration evolution
35
2391977 ·120 ·(1−X )+2391977 ·0 · X=2391977·95
C/I ratio2020 0,5064 23.919.766 497.5312021 0,5097 24.352.208 506.5262022 0,513 24.788.231 515.5952023 0,5163 25.227.836 524.7392024 0,5196 25.671.022 533.9572025 0,5229 26.117.789 543.2502026 0,5262 26.568.138 552.6172027 0,5295 27.022.067 562.0592028 0,5328 27.479.578 571.5752029 0,5361 27.940.670 581.1662030 0,54 28.436.940 591.488
5.980.504
Year Total Passenger Cars Annual EVs sold
TOTAL EV on 2030

Where the result of 5.980.504 EV's in 2030 is lower than the pessimistic forecast
of the previous customer predictions and thus probably more realistic.
3.2.1.2 EU REPORTED EV PENETRATION FORECAST FOR YEAR 2030
Some investigations already exist forecasting the future EV penetration [27].
According to an EU commissioned study [33] based mainly on the Total Cost of
Ownership (TCO) influenc there are three scenarios describing the EV presence
in Europe in year 2030. The mentioned scenarios, already translated to the
Spanish case, can be found on the following Table 4.
Scenarios year 2030 Total amount of EV in SpainOptimistic 7739830
Realistic 4281690
Pessimistic 1665101 Tab. 4 Future EV penetration in Spain
Where the previously calculated result of 5.980.504 EV in 2030 is right between
the Optimistic and the Realistic scenarios. Furthermore this study comes from
April 2011, three years before, and some key points that at the time where
uncertainties today are more clearly defined, especially those related to batteries
life and capacity.
3.2.1.3 CONCLUSIONS
As already mentioned there's a quite big coincidence between the two ways of
predicting the total amount of EV than will be running on the Spanish roads on
year 2030.
According to the shown data the biggest value is to be used in the following
areas of this study because it's within the acceptance level for the customers
panel and also because the EU study was performed, as already said, under
some uncertainties that no longer exist allowing then to be a little more optimistic.
As a conclusion a total amount of 5.980.504 EV on 2030, 21% of the total
passenger cars in Spain, will be one of the calculation basis to be used from now
on in this study.
36
3.2.2 EV ENERGY DEMAND
Since the total amount of EV is already estimated next comes the energy and
power demands that such a fleet will require. To proceed on the way to unveil this
information some steps are to be done, in detail,
-Single EV, averaged, energy demand according to today's available data
regarding user patterns, thermal engines efficiency, thermal engines fuel
consumption and related electric and electronic equipment efficiency.
-Local scaling from a single vehicle to a community, apartments building
case, aggregate.
-Regional scaling from single vehicle to a given geographical area.
-National scaling from single vehicle to the whole Spanish continental
area, V2G potential.
The main target of this chapter is to find a value of energy that an averaged EV
will need to cope with his owner mobility needs. To achieve it will be interesting to
move from actual thermal engine passenger cars wide available information to
the future EV since the already stated analysis criteria in point 4.1 is that people
mobility performance must not change.
As soon as the thermal car value of kWh/km will be available the next step will be
to calculate how much energy does it means when trying to do the same job by
electric means. In both cases the correlation point will be the engine driving shaft,
the crankshaft for the thermal case or the electric motor axis for the EV. In both
cases the gearbox looses needed to adapt the vehicle speed to the engine speed
will be assumed as the same.
3.2.2.1 THERMAL CAR EFFICIENCY DATA SOURCE
The starting data, coming from the ANFAC [34], shows an average fuel
consumption of 5,33 l/100km on the cars sold in Spain on 2012. Together with
this data but in a different document [35] the market segmentation on 2012 by fuel
type can be found as showed in next Table 5.
37
Fuel type Market Share
Gasoline 31,30%
Diesel 67,20%
Hybrid/EV 1,50% Tab. 5 Market share by powertrain [35]
Then every 100 km run is, in average, made of,
-5,33x0,313= 1,667 litters of gasoline
-5,33x0,672= 3,582 litters of diesel
Next step up into the calculation three is to consider that the given consumption
data is a result of calculations made with makers consumption data taken in
laboratory tests. However in real conditions, where the driver often faces many
situations like traffic jumps or simply doesn't master very well the so-called
efficient-conduction technique, the consumption is quite higher.
As a very popular topic, several specialized motor revues offer in a regular basis
data regarding the consumption level differences between makers data and
actual data. One of them is the well known “Autopista” [36] , part of a very
important German motor press group, that offers, extracted from a study done
over 800 passenger car models, the following results,
Fuel type Difference
Gasoline 17,00%
Diesel 22,00% Tab. 6 Fuel consumption [36]
Then, applying the above differences to the makers official consumption on every
100 km,
− Gasoline → 1,667x1,17=1,95 litters
− Diesel → 3,582x1,22=4,37 litters
Which means that the public, ideal, laboratory made, average of 5,33 litters every
hundred kilometres moves to a higher 6,32 litters in the real world.
Following the process, and considering that the kWh/km value is the target, now
is time to move from litters of gasoline/diesel to energy. In this sense the lower
heating values (LHV) of each fuel are to be considered as no condensation is
38
allowed on the exhaust mufflers to prevent their corrosion and damage. As a
official data [37] for the above mentioned LHV the following Table 7 will be
accepted,
Fuel LHV (kWh/L)
Gasoline 8,45
Diesel 8,32 Tab. 7 LHV by fuel [37]
So, in terms of total energy available from the fuel at the engine incoming pump
every 100 km the value will be,
Exp. 3
Unfortunately internal combustion engines still have a quite poor efficiency and
only a small part of the incoming energy could be expected at the engine
crankshaft in order to be used. Focused on it there's a paper of the Japan Society
of Mechanical Engineers [38] showing the following average engines efficiency
depending on the fuel type,
Fuel Thermal efficiencyGasoline 0,36
Diesel 0,45 Tab. 8 Engines thermal efficiency [38]
Applying the above data to the Exp. 3 the available energy can be calculated.
Exp. 4
Which gives the target value of 0,223 kWh energy used to run an averaged
conventional thermal engine passenger car over 1 km distance. As an average of
58 km daily run, that will be recalculated on point 3.3.1.2.2.1, is showed by the
JRC data [23], a daily amount of 12,93 kWh should be expected on the driving
shaft, and the same for the EV.
3.2.2.2 EV EFFICIENCY
This title aims to evaluate the EV total efficiency from the AC power supply on the
39
Te=8,45·1,95+8,32· 4,37=52,84 kWh/100km
Te=8,45·1,95 ·0,36+8,32 ·4,37 ·0,45=22,29kWh /100km

charging spot to the final energy available at the electric engine axis when
running. To do so the EV main components as batteries, chargers, engines and
electronic drivers have to be screened by using reliable data. Additionally, even if
this case is not about dealing with present technology as we do with thermal cars
but future, no further improvements from today state of the art will be estimated
except those coming from future regulations.
According to the previous target, following investigations will deal with an energy
flow as shown below in Fig. 9.
Fig.9 EV energy flow and losses
On a bottom to top analysis it must start from the Gearbox incoming shaft by
using the value of 0,223 kWh/Km calculated at the previous point, and end at the
AC main supply. Step by step calculations could be made as follows.
-Engine&drive.
It is intended to account for the losses generated by the electrical engine and
those of his electronic drive. It's a quite complex matter to study as both elements
are coupled and working together in very complex fashion. Moreover the amount
of available data about electrical engines and electronic drivers alone is very
small and difficult to use as a calculation basis.
To reach the target in this case a combined engine and driver efficiency maps are
the best data source. In this sense the following Fig.10 shows graph with testing
data of a given pair of automotive engine and driver by UQM [39].
40
Speed (rpm)
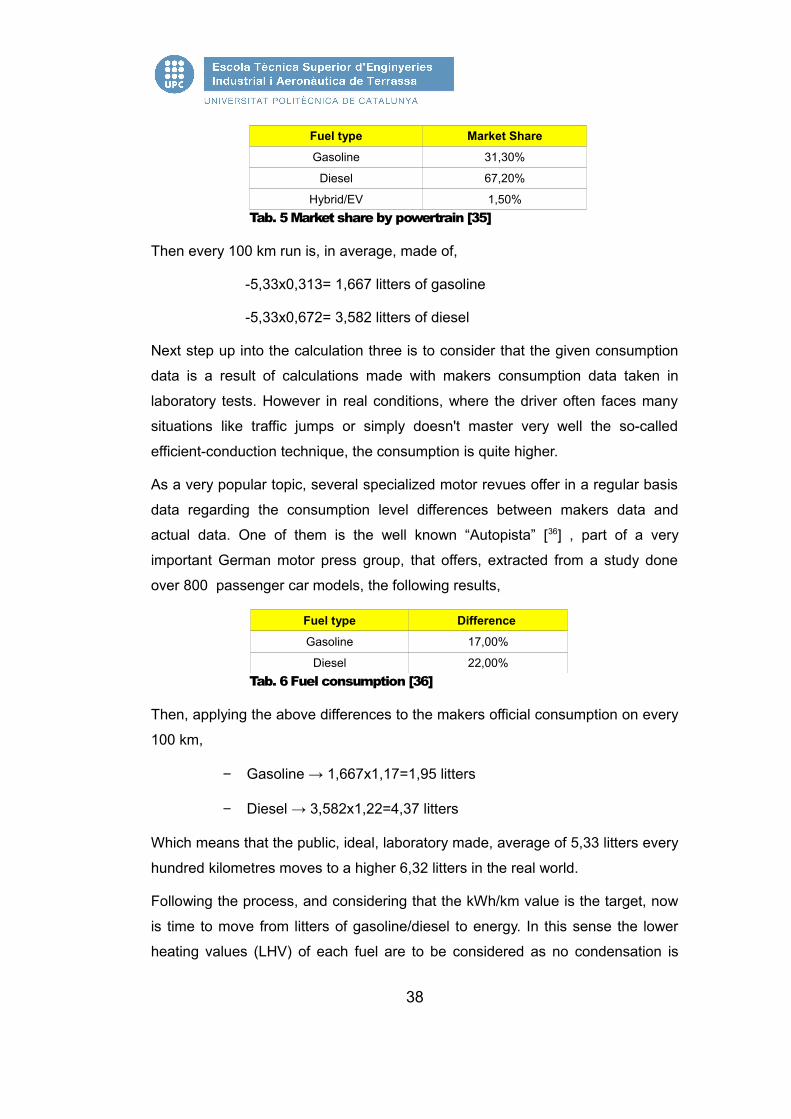
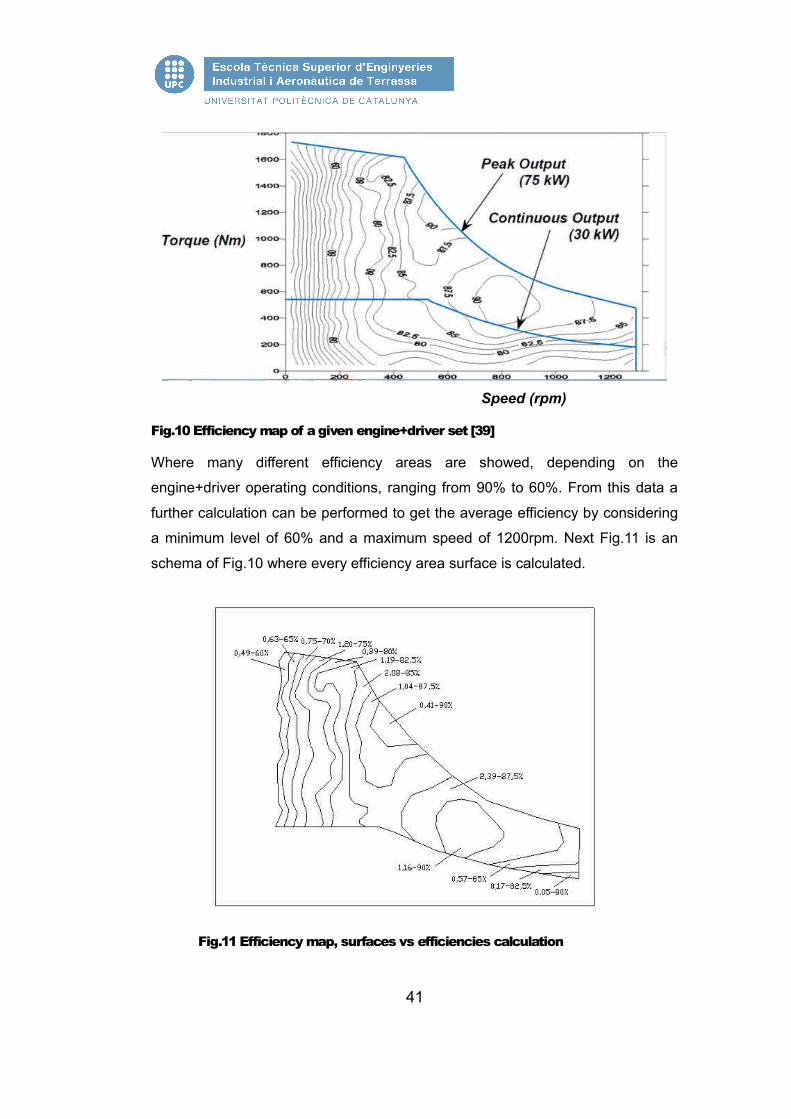
Fig.10 Efficiency map of a given engine+driver set [39]
Where many different efficiency areas are showed, depending on the
engine+driver operating conditions, ranging from 90% to 60%. From this data a
further calculation can be performed to get the average efficiency by considering
a minimum level of 60% and a maximum speed of 1200rpm. Next Fig.11 is an
schema of Fig.10 where every efficiency area surface is calculated.
Fig.11 Efficiency map, surfaces vs efficiencies calculation
41
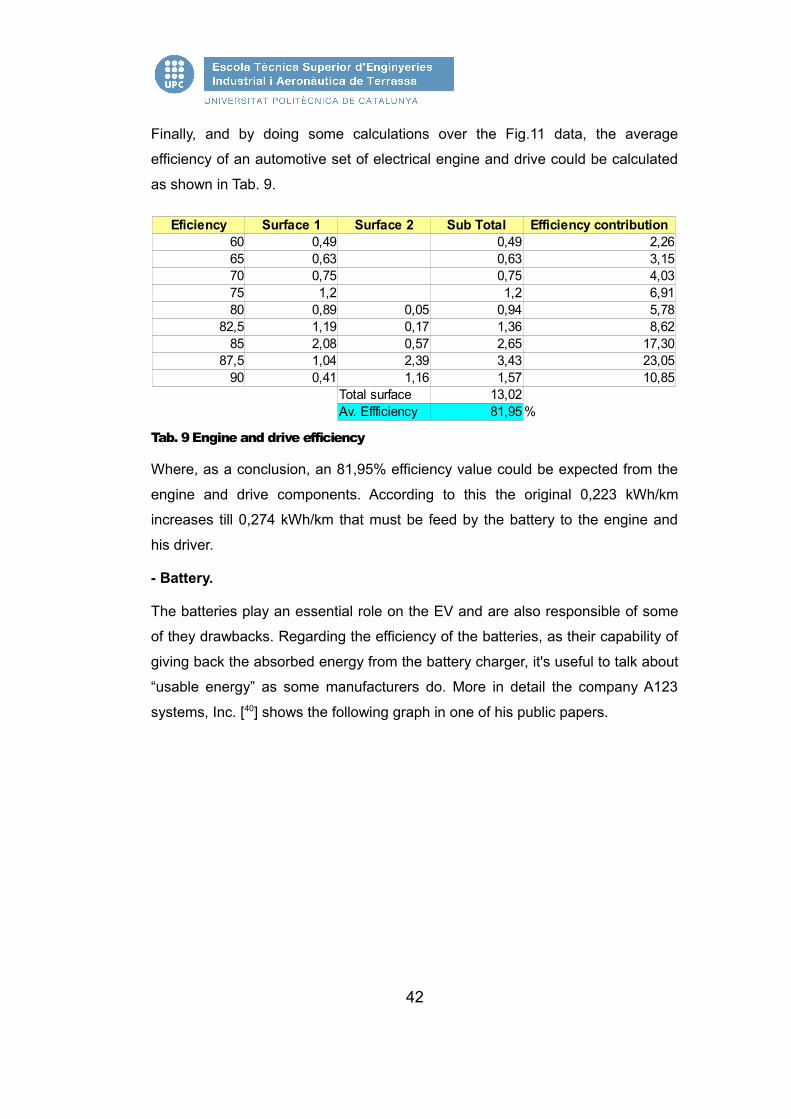
Finally, and by doing some calculations over the Fig.11 data, the average
efficiency of an automotive set of electrical engine and drive could be calculated
as shown in Tab. 9.
Tab. 9 Engine and drive efficiency
Where, as a conclusion, an 81,95% efficiency value could be expected from the
engine and drive components. According to this the original 0,223 kWh/km
increases till 0,274 kWh/km that must be feed by the battery to the engine and
his driver.
- Battery.
The batteries play an essential role on the EV and are also responsible of some
of they drawbacks. Regarding the efficiency of the batteries, as their capability of
giving back the absorbed energy from the battery charger, it's useful to talk about
“usable energy” as some manufacturers do. More in detail the company A123
systems, Inc. [40] shows the following graph in one of his public papers.
42
Eficiency Surface 1 Surface 2 Sub Total Efficiency contribution60 0,49 0,49 2,2665 0,63 0,63 3,1570 0,75 0,75 4,0375 1,2 1,2 6,9180 0,89 0,05 0,94 5,78
82,5 1,19 0,17 1,36 8,6285 2,08 0,57 2,65 17,30
87,5 1,04 2,39 3,43 23,0590 0,41 1,16 1,57 10,85
Total surface 13,02Av. Effficiency 81,95 %

Fig.12 Battery usable energy [40]
Regarding this figure its easy to realize that only 500 Wh of the total 700 Wh are
usable and, thus, 200 Wh can be considered as losses. In the real world it's
mandatory for the batteries life that the user tries to never reach the full discharge
of the battery so, only 100 Wh of the unused 200Wh could be considered as real
losses, it is an 85% of the total energy.
Furthermore the above battery efficiency calculation matches with another source
[41] where also an 85% could be found as a result of some tests and calculations.
By considering this 85% the previous 0,274 kWh/km now scale up to a higher
0,32 kWh/km at the output of the battery charger.
- Battery charger.
It's the last element on the losses chain and today's battery chargers efficiency
roughly moves between 80 and 85%. Moreover, regarding this devices there's a
new regulation that entered into force in year 2014 [42] asking the
makers/vendors, in the US California, to offer at least a minimum 89% efficiency
on their products. This will be the minimum efficiency that is going to be
considered for this study and now, after applying it, the 0,32 kWh flowing from the
battery charger grow to a new 0,36 kWh drawn from the AC main supply for every
Kilometre of run.
43
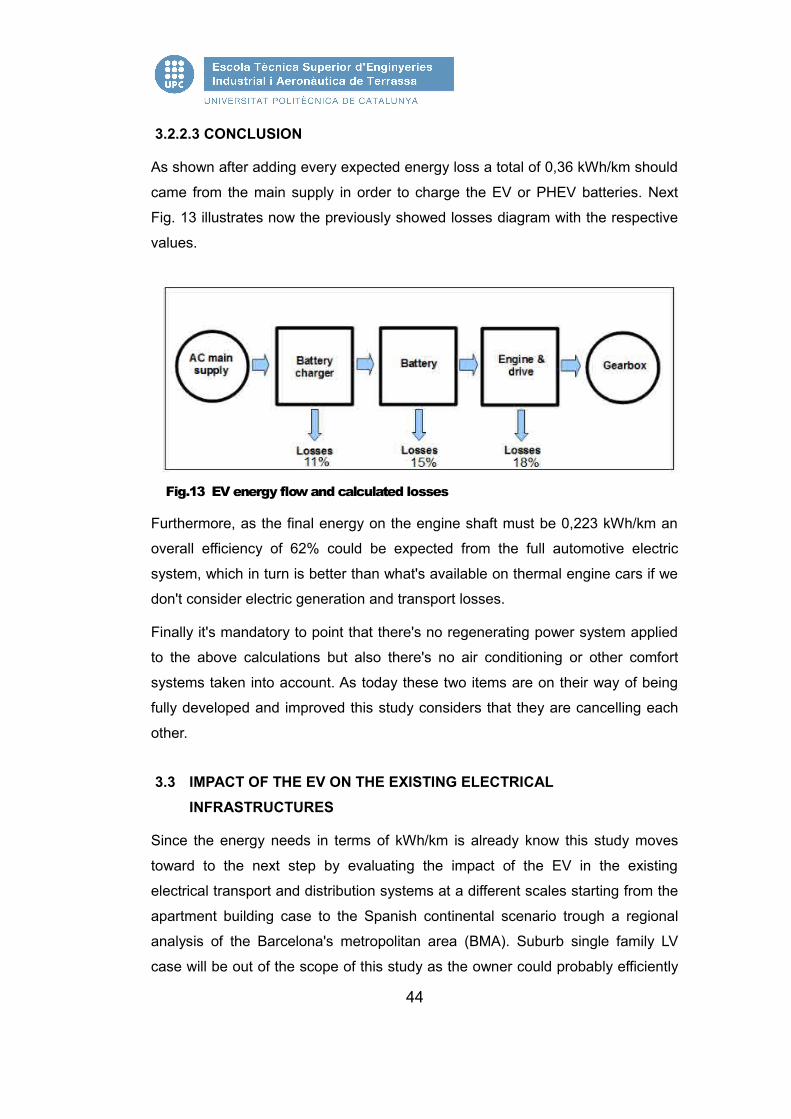
3.2.2.3 CONCLUSION
As shown after adding every expected energy loss a total of 0,36 kWh/km should
came from the main supply in order to charge the EV or PHEV batteries. Next
Fig. 13 illustrates now the previously showed losses diagram with the respective
values.
Fig.13 EV energy flow and calculated losses
Furthermore, as the final energy on the engine shaft must be 0,223 kWh/km an
overall efficiency of 62% could be expected from the full automotive electric
system, which in turn is better than what's available on thermal engine cars if we
don't consider electric generation and transport losses.
Finally it's mandatory to point that there's no regenerating power system applied
to the above calculations but also there's no air conditioning or other comfort
systems taken into account. As today these two items are on their way of being
fully developed and improved this study considers that they are cancelling each
other.
3.3 IMPACT OF THE EV ON THE EXISTING ELECTRICAL INFRASTRUCTURES
Since the energy needs in terms of kWh/km is already know this study moves
toward to the next step by evaluating the impact of the EV in the existing
electrical transport and distribution systems at a different scales starting from the
apartment building case to the Spanish continental scenario trough a regional
analysis of the Barcelona's metropolitan area (BMA). Suburb single family LV
case will be out of the scope of this study as the owner could probably efficiently
44

manage himself his own house energy demand.
3.3.1 LOCAL SCALING, APARTMENTS BUILDING CASE
As a starting point for this case it must be stated that Spain is the European
country where more people do actually live in flats, 65,4% of the Spanish
population are doing so according to Eurostat data for 2011 [43].
When dealing with the addition of a new load to a pre-existing electrical energy
supply system there are a few questions that must answered,
-Which load is the system designed for.
-How big is the new load.
-Is the result acceptable or a system upgrade is needed.
The concerned infrastructures that should be taken into account when trying to
give answers to the previous questions are the MV/LV transformers, their
ancillary MV/LV systems, the LV feeders and the metering devices. Regarding
the MV lines we'll apply to them the same conclusions as the LV systems
because its a item that could not be generally studied or modeled as every MV
line is a singular case and could have free room or not depending on how many
consumptions are connected to it.
The final target will be to avoid as much as possible that the EV introduction
could result in changing all of the above mentioned devices due to the huge
monetary cost and the environmental impact that it would mean.
Following points are to deploy and study the above three items and to state some
conclusions that should be able to be applied to any apartment building in Spain
and thus will look mainly not only to averaged values but to those that statistically
could be expected. To perform this calculations a 50 flats apartment building is
going to be considered as a pilot.
3.3.1.1 LV DESIGN LOAD AND TOLERANCE
Next calculations will show which will be the design load for an standard 50 flats
building and will check if there's some allowance to introduce the EV on the
existing LV infrastructures without replacing transformers and so on.
45
3.3.1.1.1 LV DESIGN LOAD
In Spain the electrical regulation to define the design load for an apartments
building [44] sets which are the coefficients of use (CU) depending on how many
flats are to be connected. In the case of more than 21 flats the following
expression to calculate it,
Exp. 5
Where,
n= number of flats
Giving a CU= 29,8, less than the existing 50 flats, that 5,75 times, brings a total
simultaneous power related to the apartments of 171,5 kW. Additional power is to
be considered as the one for the elevators, if there are any, the common areas
lighting and parking ventilation and lighting A total of 10 kW for the elevator, 9kW
for a 900m2, one level, parking for 50 cars with no ventilation and 5kW for
common areas lighting, added to the previous 171'5 kW, results on a 195'5 kW
design load for the 50 flat building.
Finally, as the transformers are kVA rated, considering a power factor of 0'8,
244'4 kVA are the target.
3.3.1.1.2 DESIGN TOLERANCE
Every facility or system uses to be designed to fulfil a given demand and that's
what engineers take into account when dealing with it so any increase of demand
without increasing capacity couldn't be accepted without violating some design
safety margins. Such a rule works also for the electric connection systems
between the MV lines and the final consumer LV lines but some uncertainties can
arise when talking about transformers capacity mainly because the way that their
power rates are chosen.
According to the Spanish electrical infrastructures regulation the main LV supply
companies, the Spanish Distribution System Operators (DSO), deserve some
rights to stablish technical rules as long as they are country's law compliant. In
this case they could stablish the available transformer power for the MV to LV
stations, more in detail and focusing on the three main operators next Table 10
46
CU=15,3+(n−21).0 ,5
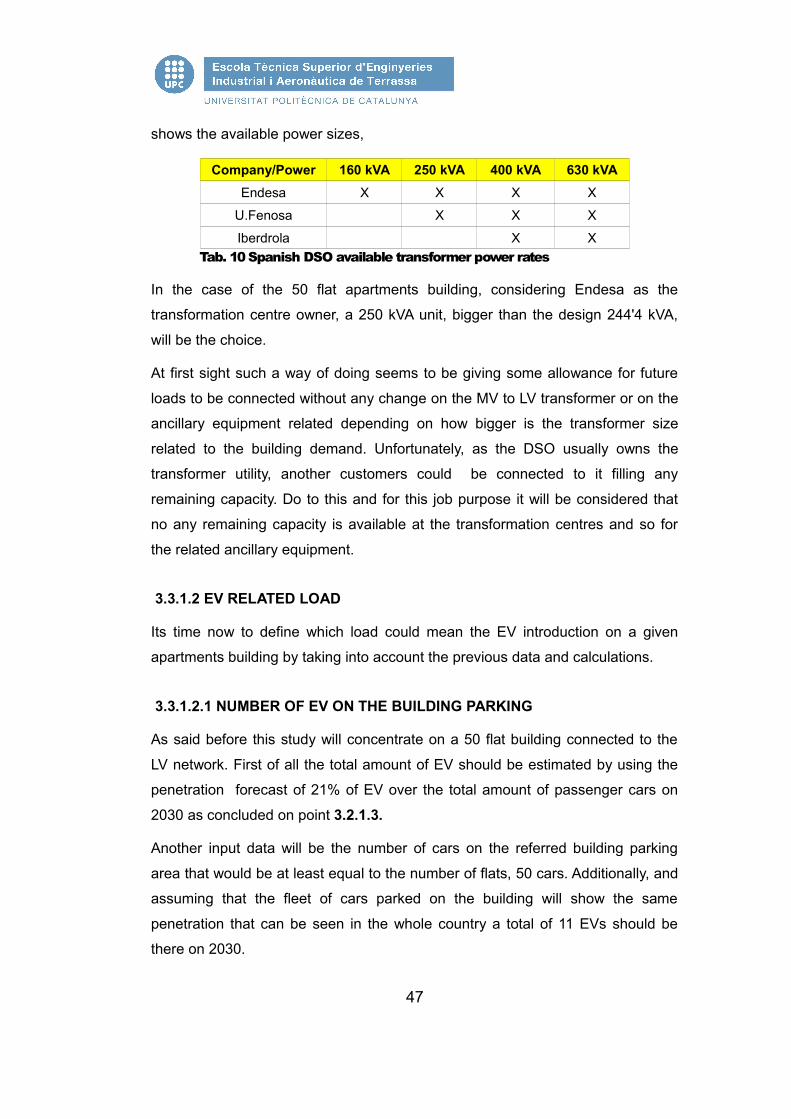
shows the available power sizes,
Company/Power 160 kVA 250 kVA 400 kVA 630 kVAEndesa X X X X
U.Fenosa X X X
Iberdrola X X Tab. 10 Spanish DSO available transformer power rates
In the case of the 50 flat apartments building, considering Endesa as the
transformation centre owner, a 250 kVA unit, bigger than the design 244'4 kVA,
will be the choice.
At first sight such a way of doing seems to be giving some allowance for future
loads to be connected without any change on the MV to LV transformer or on the
ancillary equipment related depending on how bigger is the transformer size
related to the building demand. Unfortunately, as the DSO usually owns the
transformer utility, another customers could be connected to it filling any
remaining capacity. Do to this and for this job purpose it will be considered that
no any remaining capacity is available at the transformation centres and so for
the related ancillary equipment.
3.3.1.2 EV RELATED LOAD
Its time now to define which load could mean the EV introduction on a given
apartments building by taking into account the previous data and calculations.
3.3.1.2.1 NUMBER OF EV ON THE BUILDING PARKING
As said before this study will concentrate on a 50 flat building connected to the
LV network. First of all the total amount of EV should be estimated by using the
penetration forecast of 21% of EV over the total amount of passenger cars on
2030 as concluded on point 3.2.1.3.
Another input data will be the number of cars on the referred building parking
area that would be at least equal to the number of flats, 50 cars. Additionally, and
assuming that the fleet of cars parked on the building will show the same
penetration that can be seen in the whole country a total of 11 EVs should be
there on 2030.
47
3.3.1.2.2 POWER DEMAND AND PROFILE
As the total amount of cars is already stated this data is going to be translated on
how much energy demand it means and when this energy, and the related power,
will be needed.
As a input for this calculations the study data on which the JRC report
”Projections for Electric Vehicle Load Profiles in Europe Based on Travel Survey
Data” [24] is based and the energy calculations done on point 3.2.2 will be the
main sources.
3.3.1.2.2.1 CAR USAGE PATTERNS
Three main parameters are to be unveiled by thriving on the above mentioned
study [24], how many cars over the total of 50 are moving repeatedly from one
day to another, how long are they journeys and when they are parked to reload
their batteries assuming that charging out of the residential parking will be
avoided as much as possible in order to save money.
-Total amount of EV to be charged every day.
According to the available data [24] a total of 55% of the total amount of vehicles
in Spain get out to the sthreets and roads on a typical week day and from these
a 93% are the same vehicles from one day to another. In our case this data
means that a total of 28 cars do leave their parking place and return to it every
week day and, according to the EV penetration, it means that 6 of them over a
total of 11 are to be charged every day.
-Daily distance covered by the moving EV.
Based on the same study [24] data source the first easy result to calculate is the
average of all the distances reported by the panelists. Doing so the result over
5529 runs shows an average of 29 km per run, which means 58 km taking into
account the way back home.
As a result of this calculations the total amount of energy on a given day to
charge the EV batteries could be easily obtained by multiplying the run distance,
58 km, by the number of cars running, 6, and the calculated 0'36 kWh/km. The
result is a total of 125,3 kWh to be drawn from the LV system every day or 20,9
48
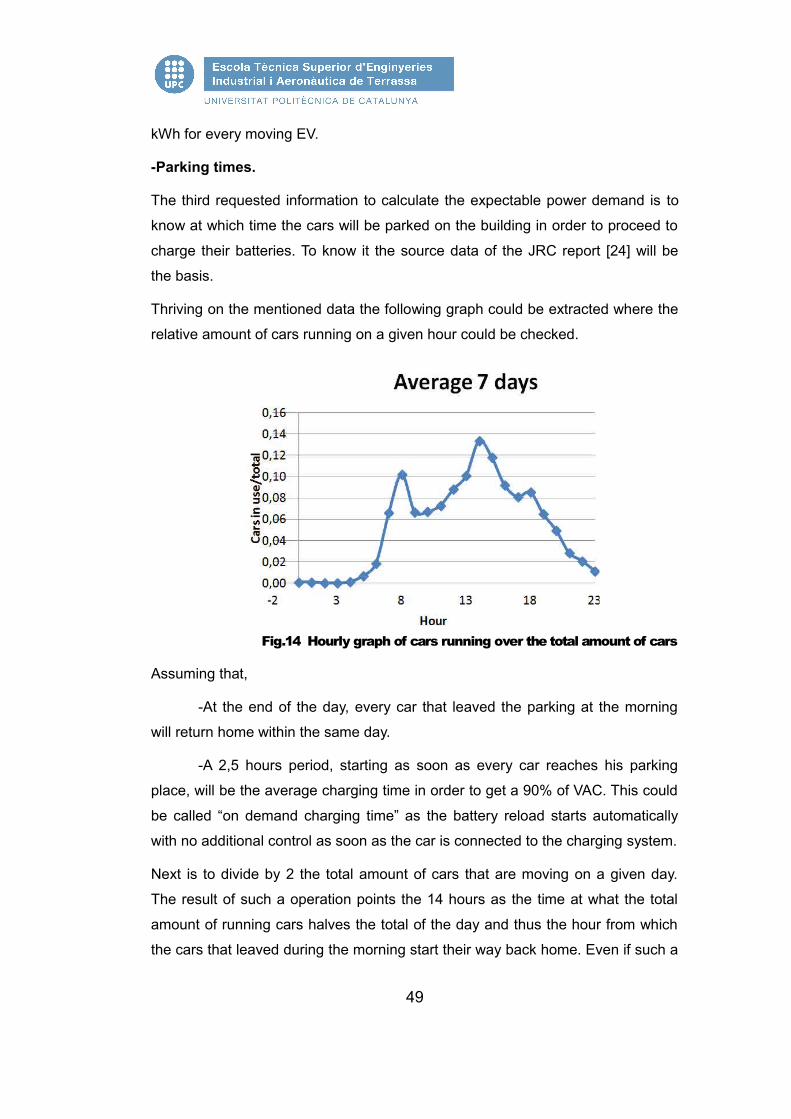
kWh for every moving EV.
-Parking times.
The third requested information to calculate the expectable power demand is to
know at which time the cars will be parked on the building in order to proceed to
charge their batteries. To know it the source data of the JRC report [24] will be
the basis.
Thriving on the mentioned data the following graph could be extracted where the
relative amount of cars running on a given hour could be checked.
Fig.14 Hourly graph of cars running over the total amount of cars
Assuming that,
-At the end of the day, every car that leaved the parking at the morning
will return home within the same day.
-A 2,5 hours period, starting as soon as every car reaches his parking
place, will be the average charging time in order to get a 90% of VAC. This could
be called “on demand charging time” as the battery reload starts automatically
with no additional control as soon as the car is connected to the charging system.
Next is to divide by 2 the total amount of cars that are moving on a given day.
The result of such a operation points the 14 hours as the time at what the total
amount of running cars halves the total of the day and thus the hour from which
the cars that leaved during the morning start their way back home. Even if such a
49
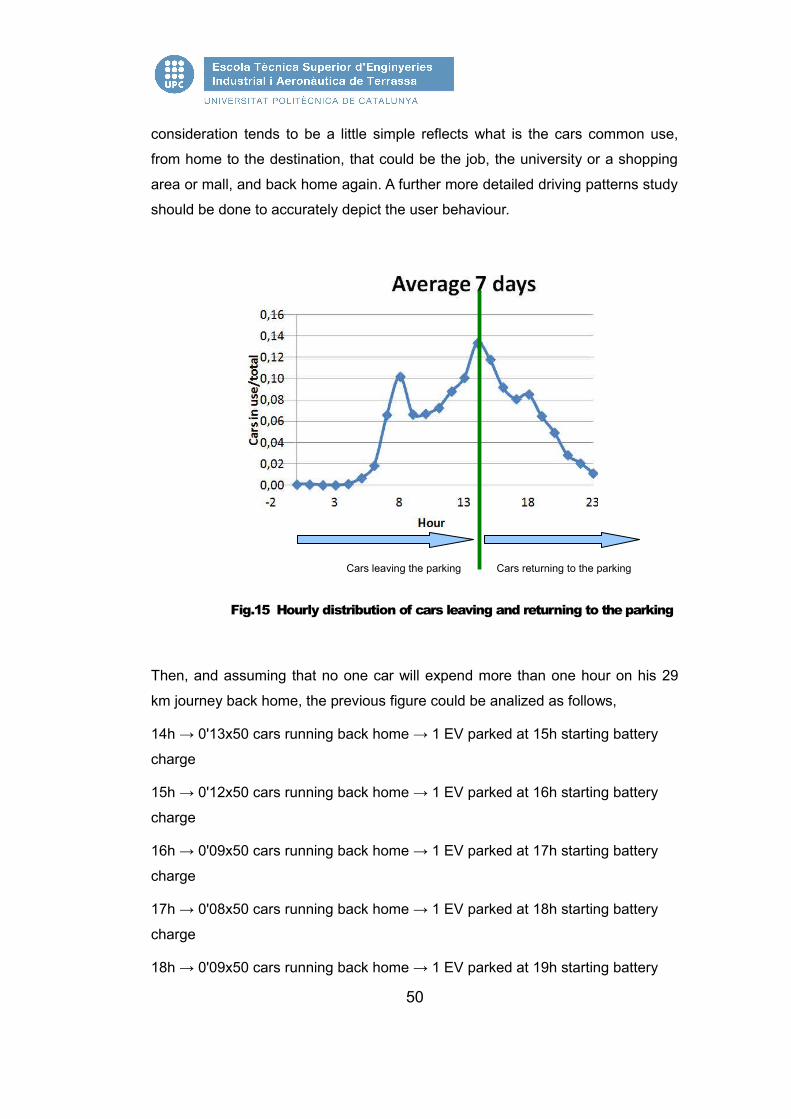
consideration tends to be a little simple reflects what is the cars common use,
from home to the destination, that could be the job, the university or a shopping
area or mall, and back home again. A further more detailed driving patterns study
should be done to accurately depict the user behaviour.
Fig.15 Hourly distribution of cars leaving and returning to the parking
Then, and assuming that no one car will expend more than one hour on his 29
km journey back home, the previous figure could be analized as follows,
14h → 0'13x50 cars running back home → 1 EV parked at 15h starting battery
charge
15h → 0'12x50 cars running back home → 1 EV parked at 16h starting battery
charge
16h → 0'09x50 cars running back home → 1 EV parked at 17h starting battery
charge
17h → 0'08x50 cars running back home → 1 EV parked at 18h starting battery
charge
18h → 0'09x50 cars running back home → 1 EV parked at 19h starting battery
50
Cars leaving the parking Cars returning to the parking

charge
19h → 0,065x50 cars running back home → 1 EV parked at 20h starting battery
charge
At 20h we do have 0'05x50 cars running back home, that means 2'5 cars and it,
by the 0'21 EV penetration, gives 0'52 EV which is at the limit between 1 (bigger
than 0'5) or 0 (smaller than 0'5) cars. It will be assumed as 0 because the total
amount of EV running on a given day was calculated previously as 6. Anyway the
calculations made are showing a quite good convergence giving confidence on
the results even tough that the data source has not been taken in order to do this
study.
3.3.1.2.2.2 EV POWER DEMAND WITH ON DEMAND CHARGING
As the available charging times are already available and assuming that the
charging happens immediately after each car arrival to his parking place next is
to calculate much power is needed to do so.
As assumed on chapter 3.3.1.2.2 a 90% of VAC will be the target. To achieve it a
2'5 hours long continuous charge is to take place which in turn will draw a
continuous 8,4 kW from the LV system.
Next Figure 16 shows how the charging periods will be arranged as the EV arrive
to the building parking.
51
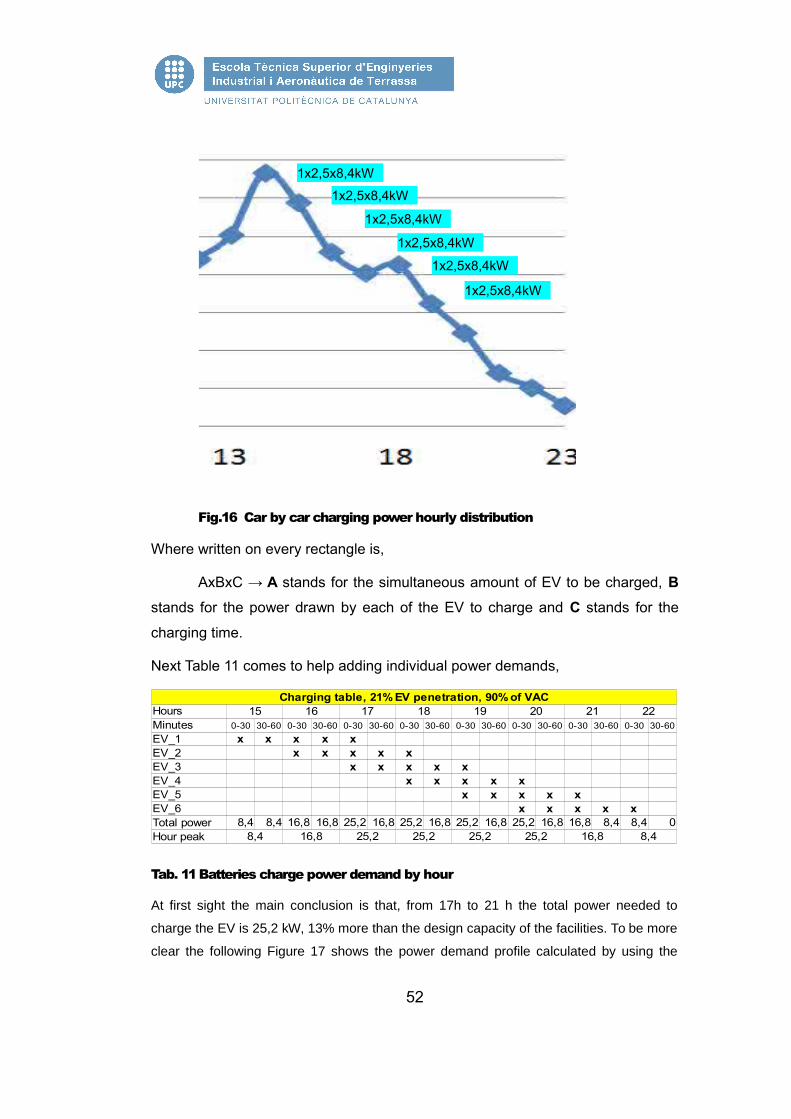
Fig.16 Car by car charging power hourly distribution
Where written on every rectangle is,
AxBxC → A stands for the simultaneous amount of EV to be charged, B stands for the power drawn by each of the EV to charge and C stands for the
charging time.
Next Table 11 comes to help adding individual power demands,
Tab. 11 Batteries charge power demand by hour
At first sight the main conclusion is that, from 17h to 21 h the total power needed to
charge the EV is 25,2 kW, 13% more than the design capacity of the facilities. To be more
clear the following Figure 17 shows the power demand profile calculated by using the
52
1x2,5x8,35kW
1x2,5x8,4kW
1x2,5x8,4kW
1x2,5x8,4kW
1x2,5x8,4kW
1x2,5x8,4kW
1x2,5x8,4kW
15 16 17 18 19 20 21 22Minutes 0-30 30-60 0-30 30-60 0-30 30-60 0-30 30-60 0-30 30-60 0-30 30-60 0-30 30-60 0-30 30-60EV_1EV_2EV_3EV_4EV_5EV_6
8,4 8,4 16,8 16,8 25,2 16,8 25,2 16,8 25,2 16,8 25,2 16,8 16,8 8,4 8,4 08,4 16,8 25,2 25,2 25,2 25,2 16,8 8,4
Charging table, 21% EV penetration, 90% of VACHours
x x x x xx x x x x
x x x x xx x x x x
x x x x xx x x x x
Total powerHour peak
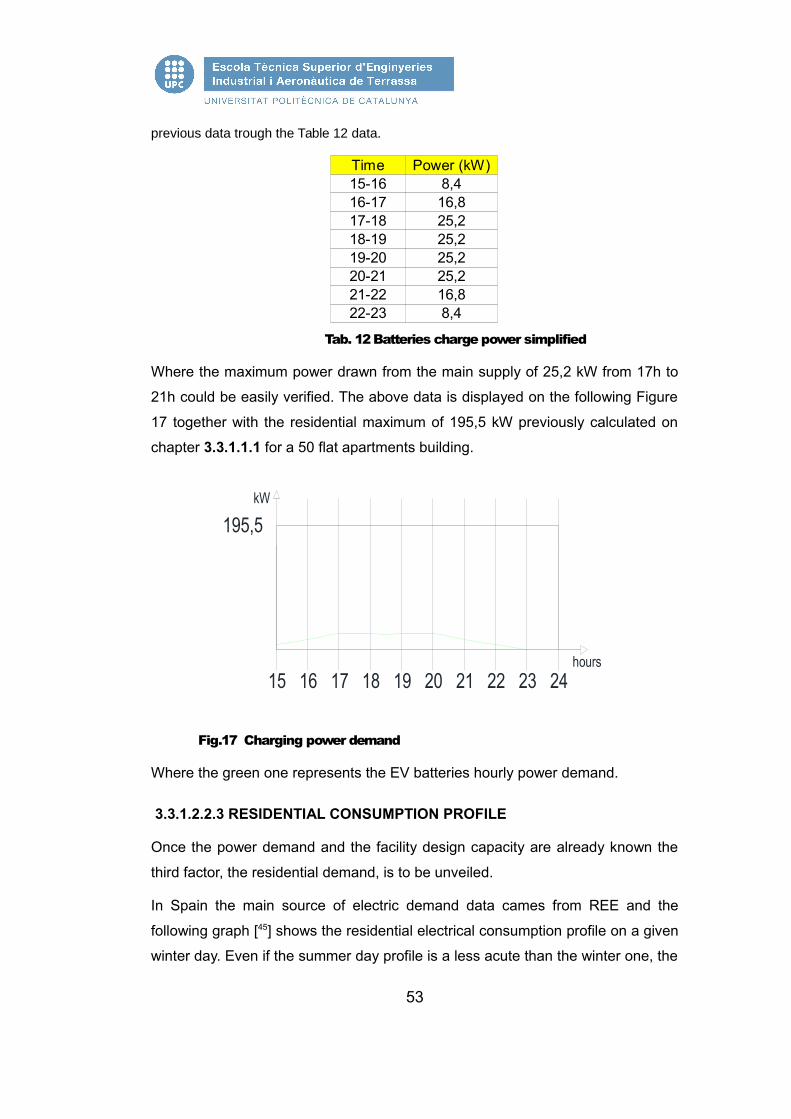
previous data trough the Table 12 data.
Tab. 12 Batteries charge power simplified
Where the maximum power drawn from the main supply of 25,2 kW from 17h to
21h could be easily verified. The above data is displayed on the following Figure
17 together with the residential maximum of 195,5 kW previously calculated on
chapter 3.3.1.1.1 for a 50 flat apartments building.
Fig.17 Charging power demand
Where the green one represents the EV batteries hourly power demand.
3.3.1.2.2.3 RESIDENTIAL CONSUMPTION PROFILE
Once the power demand and the facility design capacity are already known the
third factor, the residential demand, is to be unveiled.
In Spain the main source of electric demand data cames from REE and the
following graph [45] shows the residential electrical consumption profile on a given
winter day. Even if the summer day profile is a less acute than the winter one, the
53
Time Power (kW)15-16 8,416-17 16,817-18 25,218-19 25,219-20 25,220-21 25,221-22 16,822-23 8,4
15 16 17 18 19 20 21 22 23 24hours
195,5kW
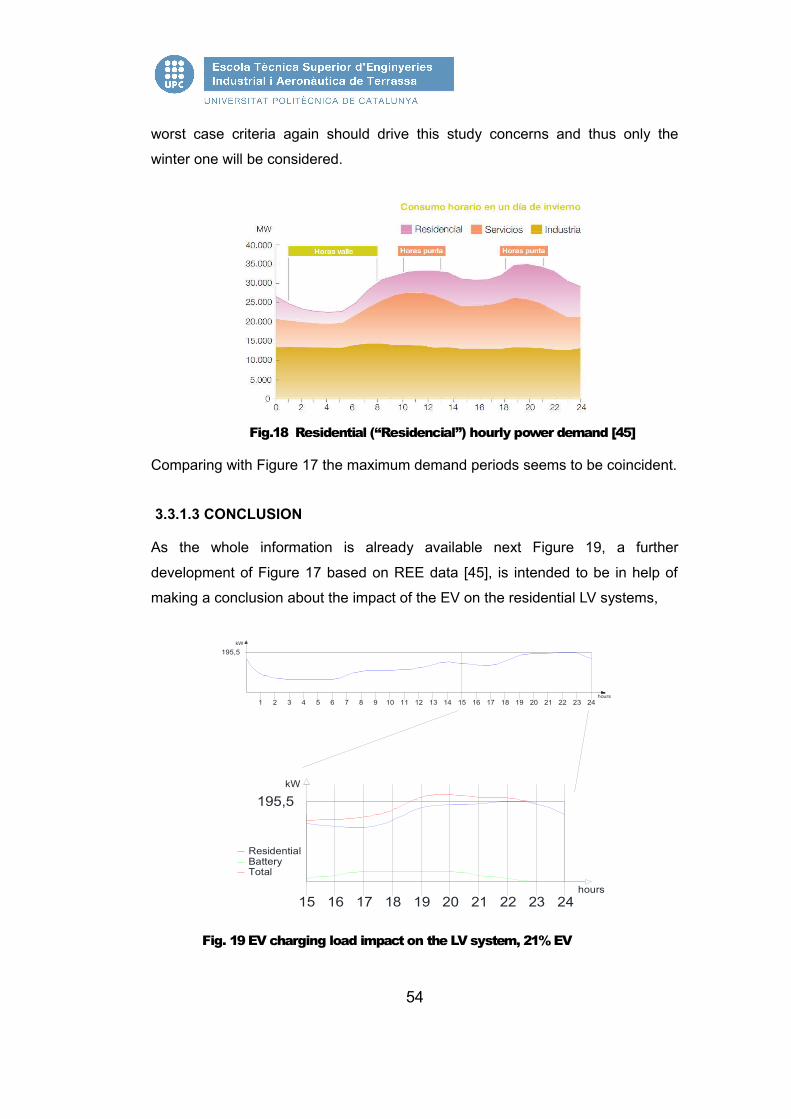
worst case criteria again should drive this study concerns and thus only the
winter one will be considered.
Fig.18 Residential (“Residencial”) hourly power demand [45]
Comparing with Figure 17 the maximum demand periods seems to be coincident.
3.3.1.3 CONCLUSION
As the whole information is already available next Figure 19, a further
development of Figure 17 based on REE data [45], is intended to be in help of
making a conclusion about the impact of the EV on the residential LV systems,
Fig. 19 EV charging load impact on the LV system, 21% EV
54
1 2 3 4 5 6 7 8 9 10 11 12 13 14 15 16 17 18 19 20 21 22 23 24
195,5kW
hours
ResidentialBatteryTotal
15 16 17 18 19 20 21 22 23 24hours
195,5kW
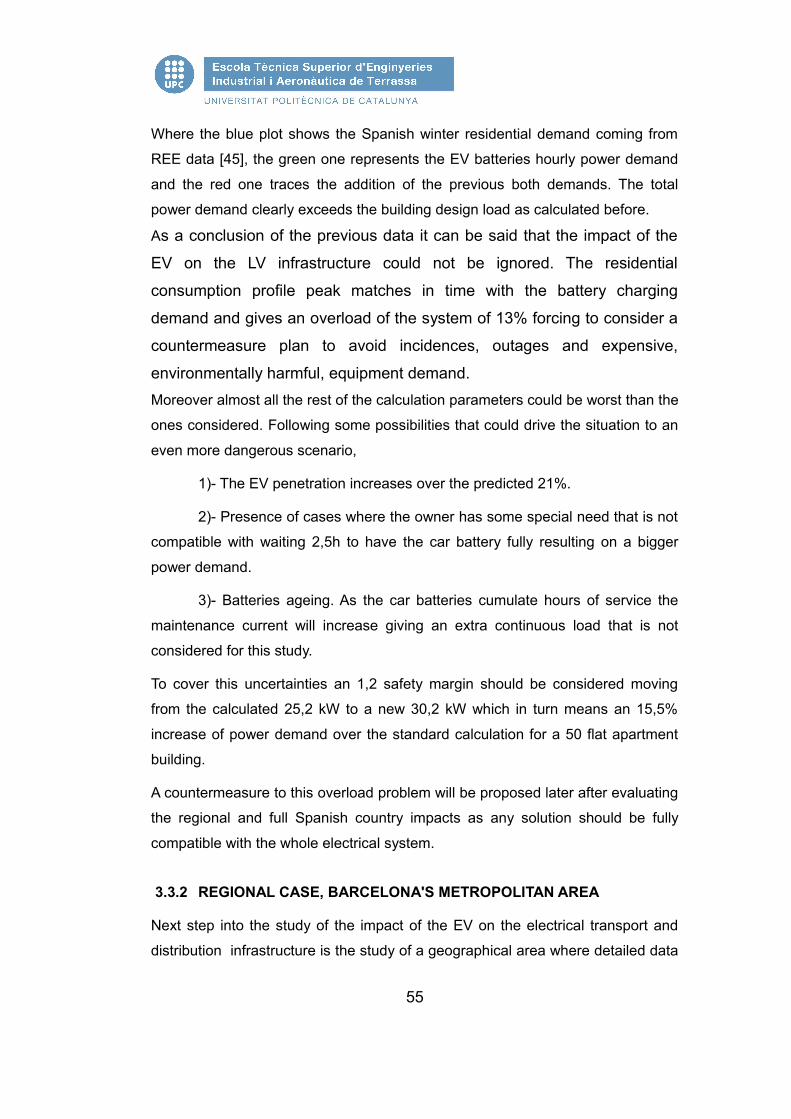
Where the blue plot shows the Spanish winter residential demand coming from
REE data [45], the green one represents the EV batteries hourly power demand
and the red one traces the addition of the previous both demands. The total
power demand clearly exceeds the building design load as calculated before.
As a conclusion of the previous data it can be said that the impact of the
EV on the LV infrastructure could not be ignored. The residential
consumption profile peak matches in time with the battery charging
demand and gives an overload of the system of 13% forcing to consider a
countermeasure plan to avoid incidences, outages and expensive,
environmentally harmful, equipment demand. Moreover almost all the rest of the calculation parameters could be worst than the
ones considered. Following some possibilities that could drive the situation to an
even more dangerous scenario,
1)- The EV penetration increases over the predicted 21%.
2)- Presence of cases where the owner has some special need that is not
compatible with waiting 2,5h to have the car battery fully resulting on a bigger
power demand.
3)- Batteries ageing. As the car batteries cumulate hours of service the
maintenance current will increase giving an extra continuous load that is not
considered for this study.
To cover this uncertainties an 1,2 safety margin should be considered moving
from the calculated 25,2 kW to a new 30,2 kW which in turn means an 15,5%
increase of power demand over the standard calculation for a 50 flat apartment
building.
A countermeasure to this overload problem will be proposed later after evaluating
the regional and full Spanish country impacts as any solution should be fully
compatible with the whole electrical system.
3.3.2 REGIONAL CASE, BARCELONA'S METROPOLITAN AREA
Next step into the study of the impact of the EV on the electrical transport and
distribution infrastructure is the study of a geographical area where detailed data
55
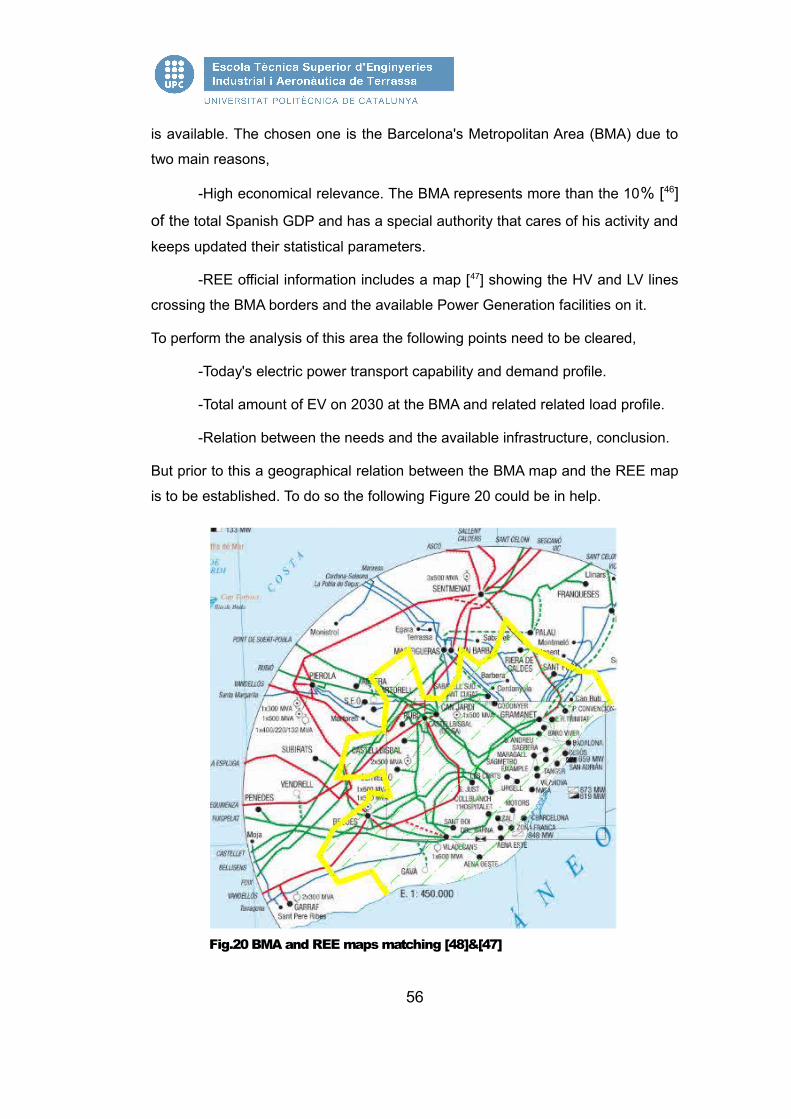
is available. The chosen one is the Barcelona's Metropolitan Area (BMA) due to
two main reasons,
-High economical relevance. The BMA represents more than the 10% [46]
of the total Spanish GDP and has a special authority that cares of his activity and
keeps updated their statistical parameters.
-REE official information includes a map [47] showing the HV and LV lines
crossing the BMA borders and the available Power Generation facilities on it.
To perform the analysis of this area the following points need to be cleared,
-Today's electric power transport capability and demand profile.
-Total amount of EV on 2030 at the BMA and related related load profile.
-Relation between the needs and the available infrastructure, conclusion.
But prior to this a geographical relation between the BMA map and the REE map
is to be established. To do so the following Figure 20 could be in help.
Fig.20 BMA and REE maps matching [48]&[47]
56
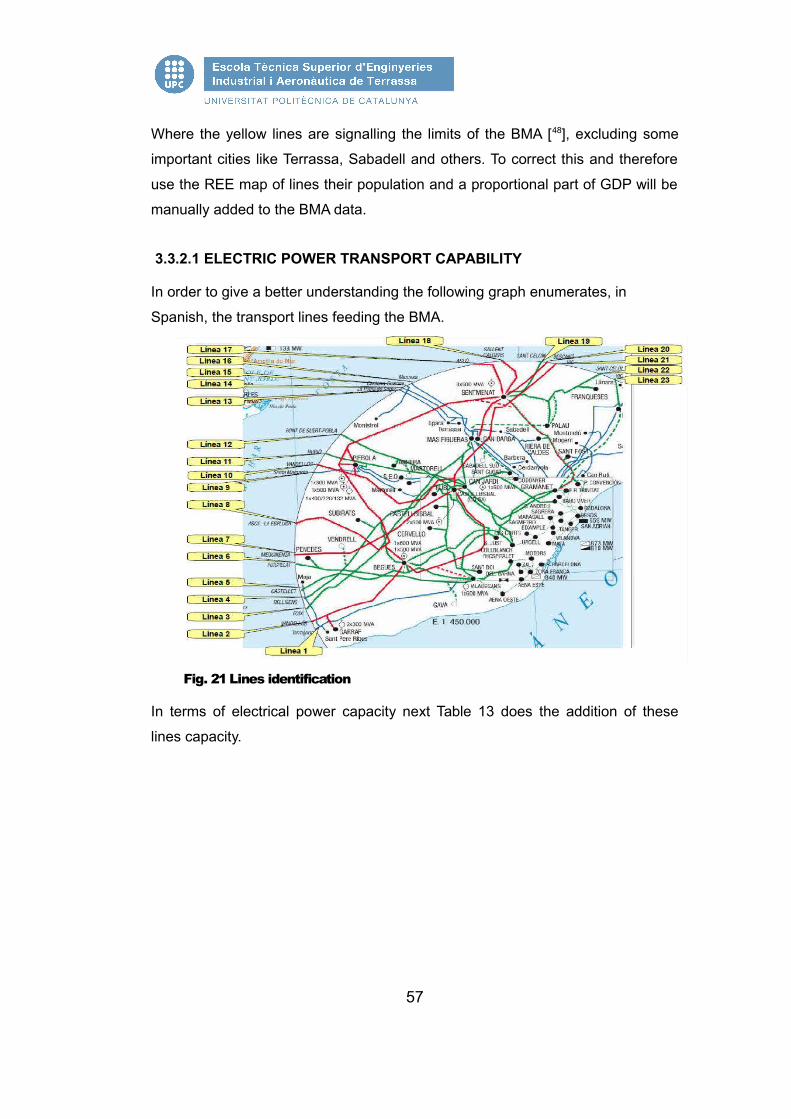
Where the yellow lines are signalling the limits of the BMA [48], excluding some
important cities like Terrassa, Sabadell and others. To correct this and therefore
use the REE map of lines their population and a proportional part of GDP will be
manually added to the BMA data.
3.3.2.1 ELECTRIC POWER TRANSPORT CAPABILITY
In order to give a better understanding the following graph enumerates, in
Spanish, the transport lines feeding the BMA.
Fig. 21 Lines identification
In terms of electrical power capacity next Table 13 does the addition of these
lines capacity.
57
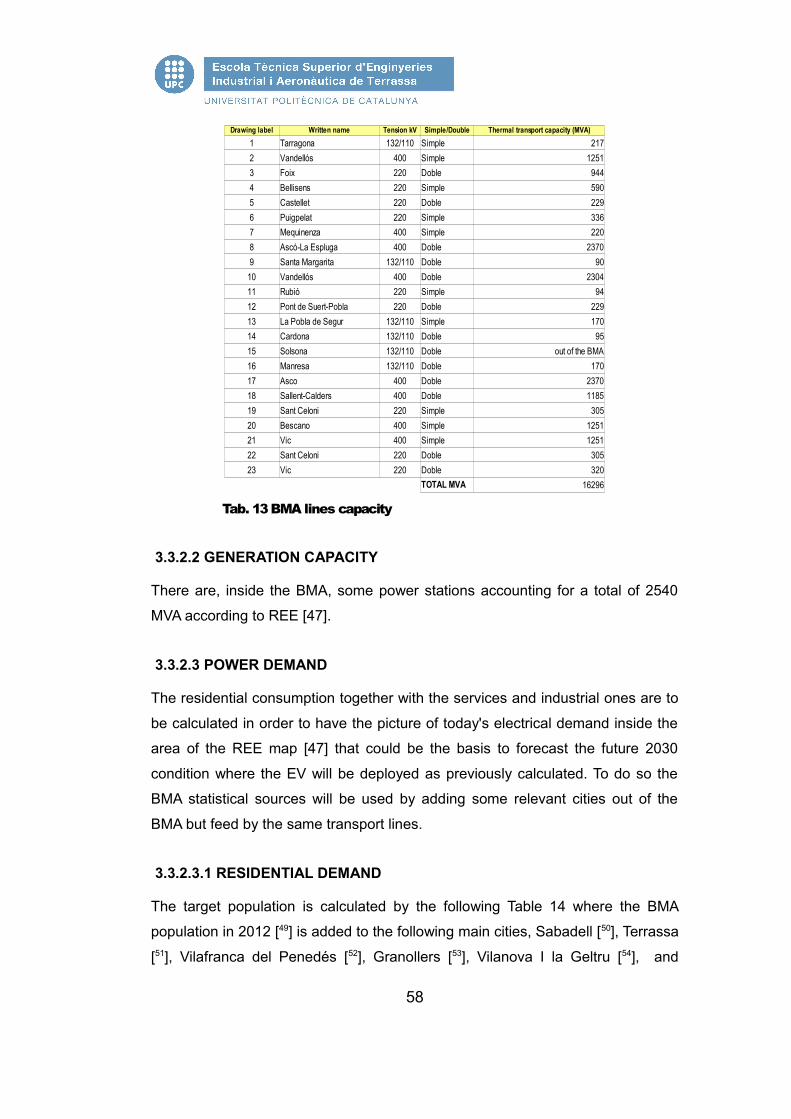
Tab. 13 BMA lines capacity
3.3.2.2 GENERATION CAPACITY
There are, inside the BMA, some power stations accounting for a total of 2540
MVA according to REE [47].
3.3.2.3 POWER DEMAND
The residential consumption together with the services and industrial ones are to
be calculated in order to have the picture of today's electrical demand inside the
area of the REE map [47] that could be the basis to forecast the future 2030
condition where the EV will be deployed as previously calculated. To do so the
BMA statistical sources will be used by adding some relevant cities out of the
BMA but feed by the same transport lines.
3.3.2.3.1 RESIDENTIAL DEMAND
The target population is calculated by the following Table 14 where the BMA
population in 2012 [49] is added to the following main cities, Sabadell [50], Terrassa
[51], Vilafranca del Penedés [52], Granollers [53], Vilanova I la Geltru [54], and
58
Drawing label Written name Tension kV Simple/Double Thermal transport capacity (MVA)1 Tarragona 132/110 Simple 2172 Vandellós 400 Simple 12513 Foix 220 Doble 9444 Bellisens 220 Simple 5905 Castellet 220 Doble 2296 Puigpelat 220 Simple 3367 Mequinenza 400 Simple 2208 Ascó-La Espluga 400 Doble 23709 Santa Margarita 132/110 Doble 90
10 Vandellós 400 Doble 230411 Rubió 220 Simple 9412 Pont de Suert-Pobla 220 Doble 22913 La Pobla de Segur 132/110 Simple 17014 Cardona 132/110 Doble 9515 Solsona 132/110 Doble out of the BMA16 Manresa 132/110 Doble 17017 Asco 400 Doble 237018 Sallent-Calders 400 Doble 118519 Sant Celoni 220 Simple 30520 Bescano 400 Simple 125121 Vic 400 Simple 125122 Sant Celoni 220 Doble 30523 Vic 220 Doble 320
TOTAL MVA 16296
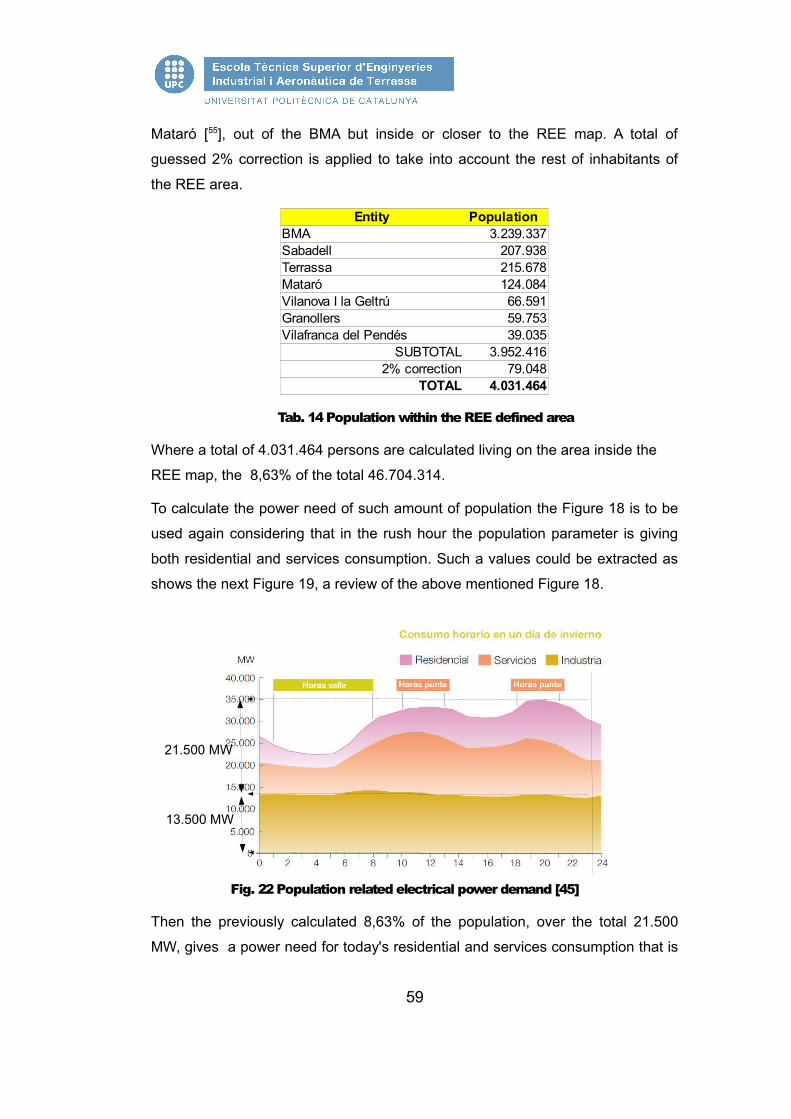
Mataró [55], out of the BMA but inside or closer to the REE map. A total of
guessed 2% correction is applied to take into account the rest of inhabitants of
the REE area.
Tab. 14 Population within the REE defined area
Where a total of 4.031.464 persons are calculated living on the area inside the
REE map, the 8,63% of the total 46.704.314.
To calculate the power need of such amount of population the Figure 18 is to be
used again considering that in the rush hour the population parameter is giving
both residential and services consumption. Such a values could be extracted as
shows the next Figure 19, a review of the above mentioned Figure 18.
Fig. 22 Population related electrical power demand [45]
Then the previously calculated 8,63% of the population, over the total 21.500
MW, gives a power need for today's residential and services consumption that is
59
Entity Population BMA 3.239.337Sabadell 207.938Terrassa 215.678Mataró 124.084Vilanova I la Geltrú 66.591Granollers 59.753Vilafranca del Pendés 39.035
SUBTOTAL 3.952.4162% correction 79.048
TOTAL 4.031.464
21.500 MW
13.500 MW

1.855 MW . This value, multiplied by population ratio in Spain between 2030 and
today, gives a total of 2.091 MW. Accepting 0,8 as an average power factor in can
be converted to a total of 2.614 MVA in terms of population apparent electrical
power needs.
3.3.2.3.2 INDUSTRIAL DEMAND
By using the same Figure 21 [45] and considering that the BMA itself generates
10% [46] of the total Spanish GDP the industrial demand could be considered,
after adding the additional cities GDP's as being 12,4% of 13.500 MW, that is,
1.674 MW in 2012.
Next is to move from 2012 to 2030 and to do so the PIB growth average from
1998 to 2012 shows a 2,03% in year to year increasement which, in turn, moves
the above industrial power demand from 1.674 MW in 2012 to 1.707 MW in 2030.
Finally, again by using 0'8 as a power factor, the industrial demand will account
for 2135 MVA in 2030.
3.3.2.3.3 EV DEMAND
Next is to estimate which power demand will be introduced by the forecast EV
penetration on year 2030. To do so a first question on how many cars will be on
the REE map area [47] on year 2030 can get his answer by looking back to the
point 3.2.1.1.1 where the cars/inhabitant ratio of 0,54 is stated and the total
Spanish population of 52.661.000 individuals in 2030 is presented. By using this
data and considering that, in year 2030, the REE map area stills represent the
8,63% of the total Spanish population, a total of 2.454.108 cars can be expected
inside the referred area.
Now, by applying the 21% penetration level saw in point 3.2.1.1.4, the total
amount of EV will be of 515.363 units that, multiplied by 0,55 as described in
point 3.3.1.2.2.1, gives a total of 283.450 EV moving every day thus to be daily
charged. At the end, and assuming a constant 8hrs 4,86 kW to charge every EV
as calculated on point 3.3.1.2.2, the required power for the EV is 1.378 MW or
1.722 MVA inside the REE map area [47].
60
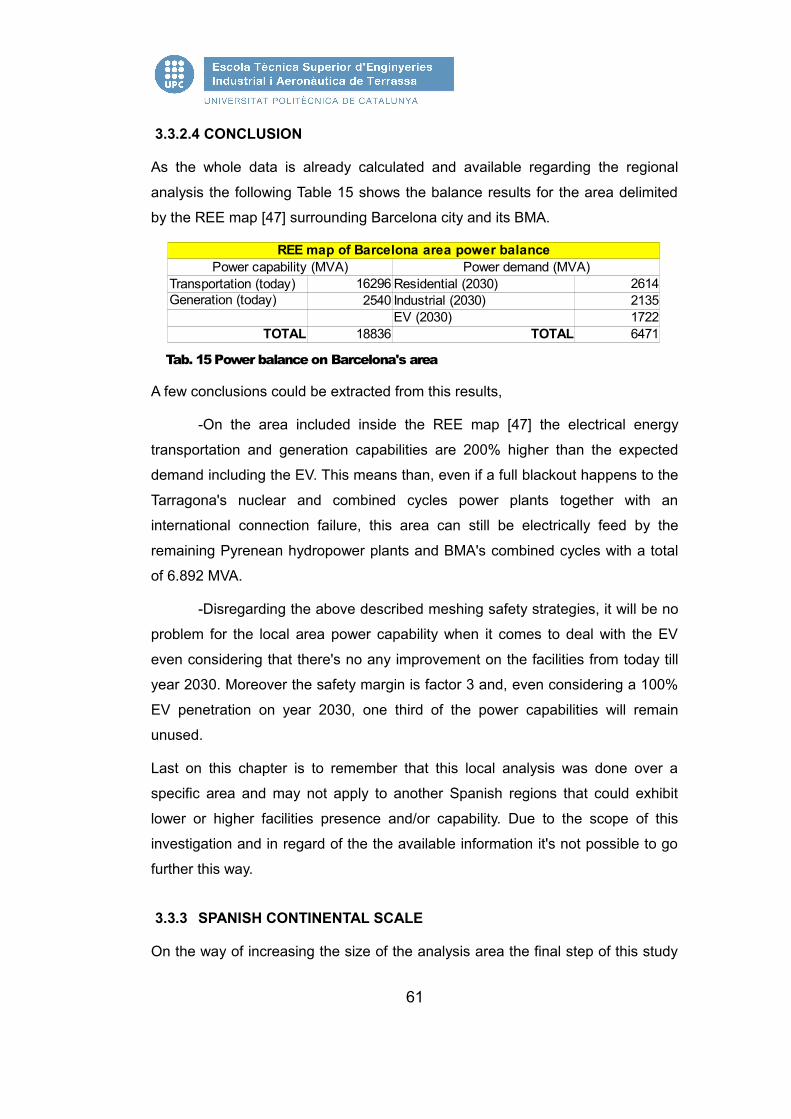
3.3.2.4 CONCLUSION
As the whole data is already calculated and available regarding the regional
analysis the following Table 15 shows the balance results for the area delimited
by the REE map [47] surrounding Barcelona city and its BMA.
Tab. 15 Power balance on Barcelona's area
A few conclusions could be extracted from this results,
-On the area included inside the REE map [47] the electrical energy
transportation and generation capabilities are 200% higher than the expected
demand including the EV. This means than, even if a full blackout happens to the
Tarragona's nuclear and combined cycles power plants together with an
international connection failure, this area can still be electrically feed by the
remaining Pyrenean hydropower plants and BMA's combined cycles with a total
of 6.892 MVA.
-Disregarding the above described meshing safety strategies, it will be no
problem for the local area power capability when it comes to deal with the EV
even considering that there's no any improvement on the facilities from today till
year 2030. Moreover the safety margin is factor 3 and, even considering a 100%
EV penetration on year 2030, one third of the power capabilities will remain
unused.
Last on this chapter is to remember that this local analysis was done over a
specific area and may not apply to another Spanish regions that could exhibit
lower or higher facilities presence and/or capability. Due to the scope of this
investigation and in regard of the the available information it's not possible to go
further this way.
3.3.3 SPANISH CONTINENTAL SCALE
On the way of increasing the size of the analysis area the final step of this study
61
16296 26142540 Industrial (2030) 2135
EV (2030) 1722TOTAL 18836 TOTAL 6471
REE map of Barcelona area power balancePower capability (MVA) Power demand (MVA)
Transportation (today) Residential (2030)Generation (today)
will be the whole Spanish continental area. To evaluate it REE data is available
showing from one side the total electric generation capability and from the other
the total power demand profile on a given day at a given hour. Such data will be
combined with the EV penetration forecast, for the whole country but the islands
this time, and its related power demand.
3.3.3.1 CONTINENTAL TRANSPORT CAPABILITY
Regarding the REE continental available data [56] only the generation capability is
on their site so an assumption is to be done considering that the transport
infrastructure will be at least capable of driving the whole production power to the
different consumption areas and customers.
According to REE a total of simultaneous 127.851 MVA could be generated by
the Spanish continental electric system. No international connection contributions
will be considered for this study purposes but, as a huge continental community,
the European Union could have interesting synergies between their countries in
the electric power distribution.
3.3.3.2 CONTINENTAL POWER DEMAND
On year 2013 the peak of demand was reached from 20 to 21hrs on February
27th with 49.953 MVA [56]. Assuming that such a peak is fully population
dependant then, considering that the population ratio between the year 2030
forecast and the 2012 available data is 1'13, the expectable power peak on year
2030 should be of 56.324 MVA.
3.3.3.3 EV POWER DEMAND
To calculate it a first continental population estimation on 2030 should be stated.
In Spain the continental population accounts for the 93% of the country's total
population [57]. According to this a total of 48.974.730 Spaniards will be in the
Spanish continental area on year 2030. Using the already calculated on point
3.2.2.1.4 C/I ratio of 0,54 and the 21% of EV penetration from point 3.2.1.1.4 a
total of 5.553.734 EVs could be expected in the Spanish continental area on year
2030.
62

Applying the 3.3.1.2.2.1 calculation result that shows 55% of the cars moving
every day there will be 3.054.554 EVs to be charged on a given day and, as long
as the 4,86 kW calculated on point 3.3.1.2.2 are to be used to charge everyone
of them, a total of 18.556 MVA will be needed if they all charge at the same time.
3.3.3.4 CONCLUSION
Next Table 16 comes to sumarize the results from the above calculations.
Tab. 16 Spanish continental area power balance
From Table 16 the following conclusions could be stated,
-Considering the calculated penetration of the EV the Spanish continental
electrical system will be able, even without any improvement from today's
condition and disregarding meshing criteria that could not be established trough
this investigation, to hold the new load that their introduction could represent.
-Even in the case of a massive introduction of the EV into the Spanish
market, and disregarding again any system improvements from today to 2030
and also meshing requirements, the Spanish electrical power system can almost
cope with the deal. In such a case, with 100% of EV penetration, only a 17% of
power generation growth will be enough to cope with the demand.
3.4 ENERGY BALANCE CONCLUSIONS
After the evaluation done over the three chosen sizes of the transport and
distribution infrastructures, local, regional and continental, this study unveils that
the challenge arises on the low voltage, local size, systems, that will be the ones
most likely demanding countermeasures to allow the EV deployment.
On the other hand the regional and continental Spanish infrastructures studied
proved to be, generally speaking and by using the available data, oversized
enough to cope with the estimated EV penetration and even more without any
kind of improvement from today to year 2030.
63
Spanish continental areaPower capability (MVA) Power demand (MVA)
Generation (today) 127851 Consumption (2030, peak) 56324EV (2030) 18556
TOTAL 127851 TOTAL 74880

Next and last in this investigation will be a countermeasure proposal and study to
make possible the EV introduction as a desirable improvement to the Spanish
low carbon mobility mix and taking into account that whatever this
countermeasure will be must came in help of the main issue, the EV introduction,
but also must be synchronized with the rest of the Spanish electrical power
system. In this sense it will be desirable that such a countermeasure contributes
to solve some of the main issues today as the flattering of the demand curve and
the effective injection of the renewable sources to the grid when generated.
3.5 VEHICLE AVAILABILITY CONCLUSIONS
As a conclusion for the vehicle availability criteria till now the only strategy
applied was to sep-up a charging time of 8 hours starting as soon as the cars are
parled on their places. With such a strategy the vehicle availability is only of 66%
and seems difficult to be improved with no additional countermeasures as the LV
systems are already overloaded and will not allow any faster charge but instead
of this appear to be asking for a longer times.
4 COUNTERMEASURE REQUIREMENTS
Prior to propose any countermeasure a deeper analysis of what was written at
the previous 3.4 and 3.5 conclusions points is to be done. The target will be to
get a reliable picture of what is the real problem and what are the immediate
solutions for it by using the up-to-date available strategies and technologies.
Together with the above study a very important stakeholder implication is to be
considered, the regulator. It's on the administration hands to force or at least to
easy the massive EV deployment and the proposal must take into account the
way that they should or could act.
Finally another constraints should be taken into account or at least numbered.
Following a few of them,
-Cost. Very expensive solutions should not be considered.
-Physical space. As in some cases the countermeasure should be applied
to already existing buildings with almost no free room for big facilities special care
should be taken with this parameter.
64

-Safety. Whatever the proposed countermeasure will be it must be 100%
safe for the building inhabitants following all the existing regulations in this sense.
-Technology maturity. The countermeasure should rather use existing
technology than a new one that could take many years to develop, not so much
time is available.
-Technology upgrade. It must be easy for the technological elements
included on the countermeasure to be upgraded. Single device integrated
solutions should be avoided in order to be able to upgrade the system element by
element as new and convenient improvements reach the market.
Next points will deploy the previous items more in detail and one by one. After
deeply considering all the previous points, countermeasure proposal and analysis
could eventually take place showing which advantages does it will have over the
standard solutions.
4.1 ITEMS TO FIX
This point will summarize and describe in detail the different issues to cope with
and the standard, today available, solutions that can help solving it evaluating
their suitability in each case. A review of the criteria exposed on point 3.1 could
be in help understanding what follows this lines.
4.1.1 LV SYSTEM CONGESTION
A countermeasure to fix the LV system congestion due to the EV is a must item
as today's infrastructure could not handle the power demand growth that its
batteries charging process would request. To do so today's available standard
solutions could be summarized at the following two,
a- Change all the LV systems upgrading transformers, cells,
feeders and many of the related ancillary equipment. This will work for sure but
will also have an enormous economical and ecological impact related to the
dismantling, installing, recycling and disposal processes of many equipment and
toxic materials as oils, resins, etc. No any proposal in this sense can be seen on
the available papers and technical documents related to the EV introduction as
probably everyone agrees that his big and painful impacts are not allowable.
65
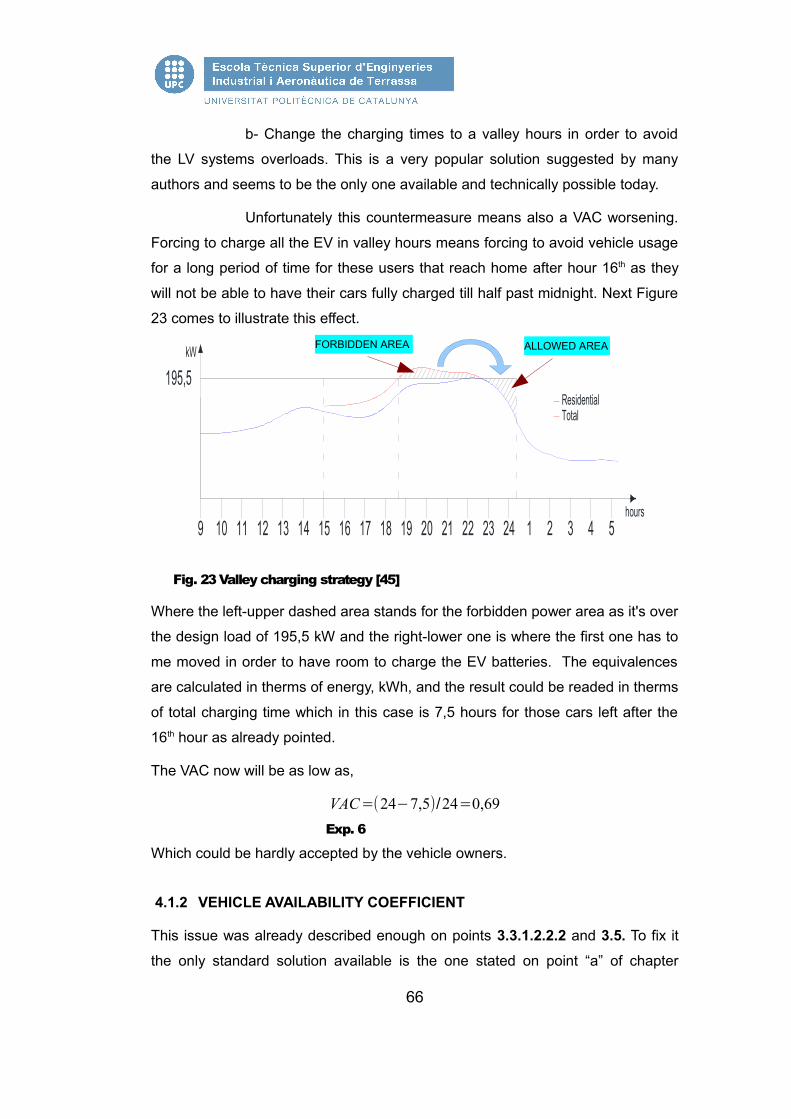
b- Change the charging times to a valley hours in order to avoid
the LV systems overloads. This is a very popular solution suggested by many
authors and seems to be the only one available and technically possible today.
Unfortunately this countermeasure means also a VAC worsening.
Forcing to charge all the EV in valley hours means forcing to avoid vehicle usage
for a long period of time for these users that reach home after hour 16th as they
will not be able to have their cars fully charged till half past midnight. Next Figure
23 comes to illustrate this effect.
Fig. 23 Valley charging strategy [45]
Where the left-upper dashed area stands for the forbidden power area as it's over
the design load of 195,5 kW and the right-lower one is where the first one has to
me moved in order to have room to charge the EV batteries. The equivalences
are calculated in therms of energy, kWh, and the result could be readed in therms
of total charging time which in this case is 7,5 hours for those cars left after the
16th hour as already pointed.
The VAC now will be as low as,
VAC=(24−7,5)/24=0,69 Exp. 6
Which could be hardly accepted by the vehicle owners.
4.1.2 VEHICLE AVAILABILITY COEFFICIENT
This issue was already described enough on points 3.3.1.2.2.2 and 3.5. To fix it
the only standard solution available is the one stated on point “a” of chapter
66
kW
hours1 2 3 4 59 10 11 12 13 14 15 16 17 18 19 20 21 22 23 24
195,5ResidentialTotal
ALLOWED AREAFORBIDDEN AREA
4.1.1. Unless another dedicated countermeasure takes place no other way than
increasing the LV system power capability could effectively deal with it and
improve the VAC by shortening the batteries charging times.
4.1.3 POWER GRID RENEWABLES INTEGRATION
It's well known that the main technical concern on the renewable energy injection
to the power gird is that the power generation, specially from wind turbines, and
the power demand could not happen at the same time.
To fix this the Spanish DSO are deploying Pumping Storage Hydropower stations
in order to be able to store the unwanted energy in peak production hours or
days and to draw it back to the power grid on peak demand periods. Such a
technology could cope with the deal and store the unwanted energy on a given
time but not without some drawbacks,
-Regulation. The regulation of the pump/trubine groups stills today a main
item for the equipment manufacturers to adjust in order to make the power
station response as fast as possible to effectively interact with the power grid
needs.
-Environmental impact due to the quite huge infrastructure elements as
the water vessel, the pipes, the inlet and inlet water ports, the power lines to
connect the station to the power grid, etc.
-Operating cost due to the high complexity of the facilities and
maintenance requirements.
-Distance between the generation, the pumping storage and the
consumption spots. The vessels should no be far from water resources and
elevations or mountains and could be far from windy areas, specially future
offshore farms, and consumption centres.
Another approaches to absorb and inject energy to the power grid when needed
are inertia flywheels, compressed air, hydrogen production and, finally, batteries
storage at big facilities. All of them are today in their beginnings as a massive
scale solution and can't compete with the previously presented Pumping Storage
facilities.
67
4.2 ADMINISTRATION CONCERNS
Till now the calculations done where based on the EV penetration forecast
among another important informations. Based on this the total amount of EVs
moving on a given day was calculated and so was the energy and power needs.
From the administration point of view the usual way to go in this cases is to issue
a national code that, for the EV charging systems, will force the present and
future building owners to ad it to the existing facilities allowing a safe and reliable
EV deployment. Keeping in mind that the cost must be reasonable the
administration, when issuing the code, could not stablish a forecast on EV market
penetration and should consider a 100% market share of EV, otherwise the risk
of forcing the owners to build-up underestimated overflowed facilities will be quite
big.
Something similar was done in Spain 8 years ago when the CTE Edification
Technical Code (CTE) [58] was issued forcing all the new apartment buildings to
have thermal solar energy on their roofs and also the existing ones if they plan to
undergo some important refurbishment. In this case, to make possible the EV
deployment, not only the new buildings but also the existing ones, e.g. as some
percent of their inhabitants ask for it, should be forced to prepare to charge the
EV.
5 COUNTERMEASURE PROPOSAL
After the previous chapter 4 evaluation its time to make a countermeasure
proposal.
First to tell that the author of this study finds clear similarities between the EV
batteries charging problem and the one already existing on the centralized
sanitary water supply in an apartments building. The big thermal power demand i
on peak periods in order to produce enough hot water uses to be solved in two
ways,
1st - By providing enough thermal power by using huge boilers that will
also provide a huge gas consumption.
2Nd – By producing the sanitary water at a much slower rate by using
smaller, more efficient, boilers than the previous ones and storing it on an inertia
68
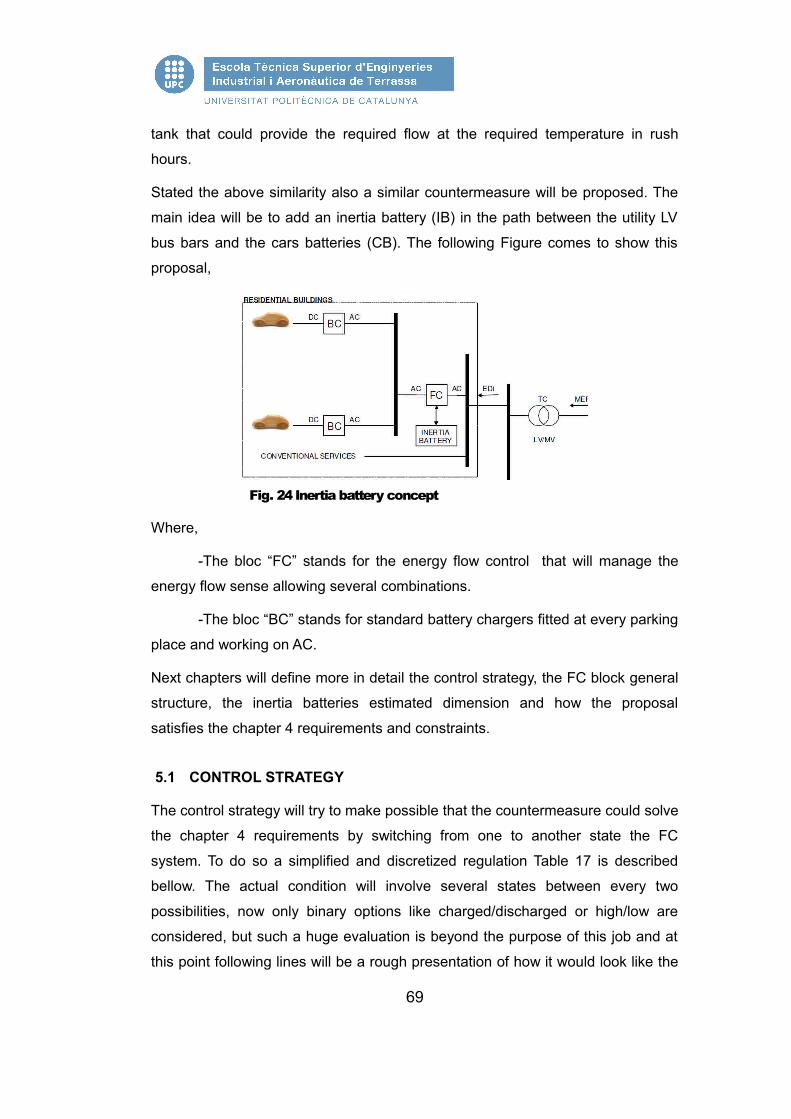
tank that could provide the required flow at the required temperature in rush
hours.
Stated the above similarity also a similar countermeasure will be proposed. The
main idea will be to add an inertia battery (IB) in the path between the utility LV
bus bars and the cars batteries (CB). The following Figure comes to show this
proposal,
Fig. 24 Inertia battery concept
Where,
-The bloc “FC” stands for the energy flow control that will manage the
energy flow sense allowing several combinations.
-The bloc “BC” stands for standard battery chargers fitted at every parking
place and working on AC.
Next chapters will define more in detail the control strategy, the FC block general
structure, the inertia batteries estimated dimension and how the proposal
satisfies the chapter 4 requirements and constraints.
5.1 CONTROL STRATEGY
The control strategy will try to make possible that the countermeasure could solve
the chapter 4 requirements by switching from one to another state the FC
system. To do so a simplified and discretized regulation Table 17 is described
bellow. The actual condition will involve several states between every two
possibilities, now only binary options like charged/discharged or high/low are
considered, but such a huge evaluation is beyond the purpose of this job and at
this point following lines will be a rough presentation of how it would look like the
69

regulation of the FC system.
Tab. 17 Simplified control table for the FC system
Where the different possible states are,
-State 1. Energy flows from the LV bus bars to the IB and the CB.
-State 2. Energy flows from the LV bus bars to the CB.
-State 3. Energy flows from the LV bus bars and the IB to the CB.
Probably the most common state almost don't appear at the regulation table as it
is strongly discretized. This state will take place when there's some room on the
70
Inertia battery Car batteries LV system Renewals production NationaL consumption FC system state Cases
CHARGED
CHARGED
SATURATEDHIGH HIGH State 4 1
LOW State 5 2
LOW HIGH State 4 3LOW State 4 4
FREE ROOMHIGH HIGH State 5 5
LOW State 5 6
LOW HIGH State 5 7LOW State 5 8
DISCHARGED
SATURATEDHIGH HIGH State 6/State 7 9
LOW State 6 10
LOW HIGH State 6/State 7 11LOW State 6 12
FREE ROOMHIGH HIGH State 3/State 7 13
LOW State 2 14
LOW HIGH State 3/State 7 15LOW State 2 16
DISCHARGED
CHARGED
SATURATEDHIGH HIGH State 5 17
LOW State 5 18
LOW HIGH State 5 19LOW State 5 20
FREE ROOMHIGH HIGH State 8/ State 5 21
LOW State 8 22
LOW HIGH State 8/ State 5 23LOW State 8 24
DISCHARGED
SATURATEDHIGH HIGH State 5 25
LOW State 5 26
LOW HIGH State 5 27LOW State 5 28
FREE ROOMHIGH HIGH State 1/State 9 29
LOW State 1 30
LOW HIGH State 1/State 9 31LOW State 1 32
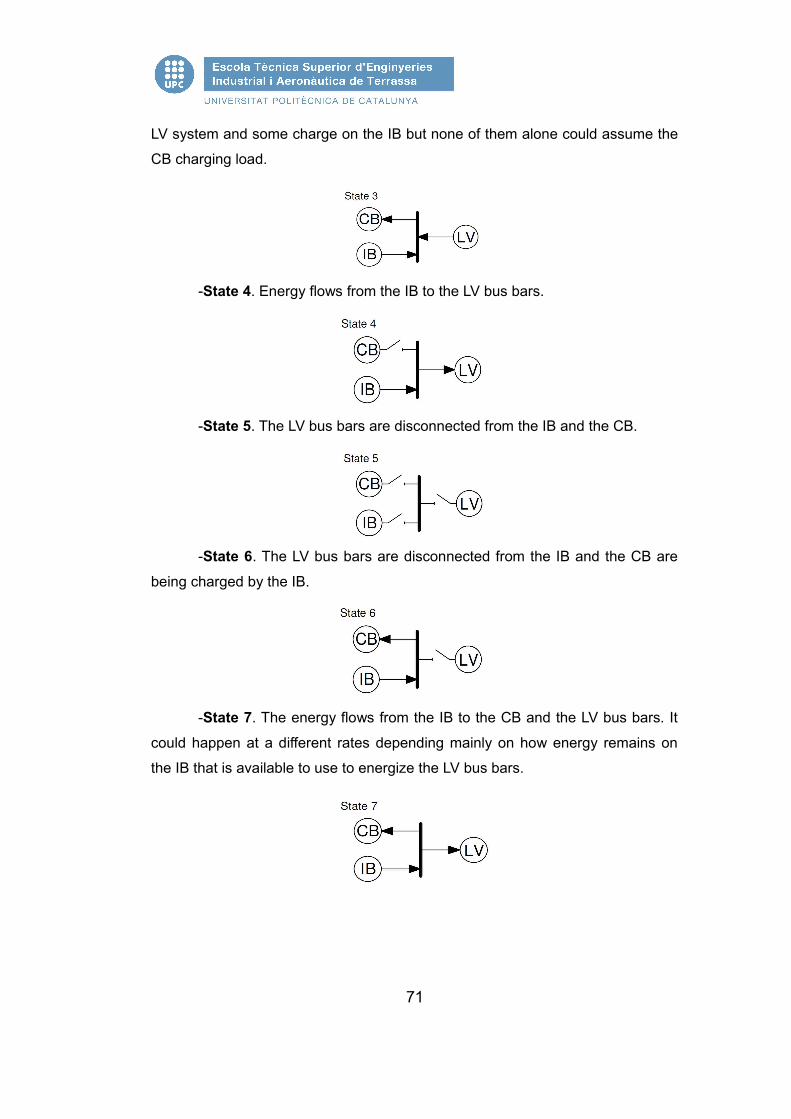
LV system and some charge on the IB but none of them alone could assume the
CB charging load.
-State 4. Energy flows from the IB to the LV bus bars.
-State 5. The LV bus bars are disconnected from the IB and the CB.
-State 6. The LV bus bars are disconnected from the IB and the CB are
being charged by the IB.
-State 7. The energy flows from the IB to the CB and the LV bus bars. It
could happen at a different rates depending mainly on how energy remains on
the IB that is available to use to energize the LV bus bars.
71
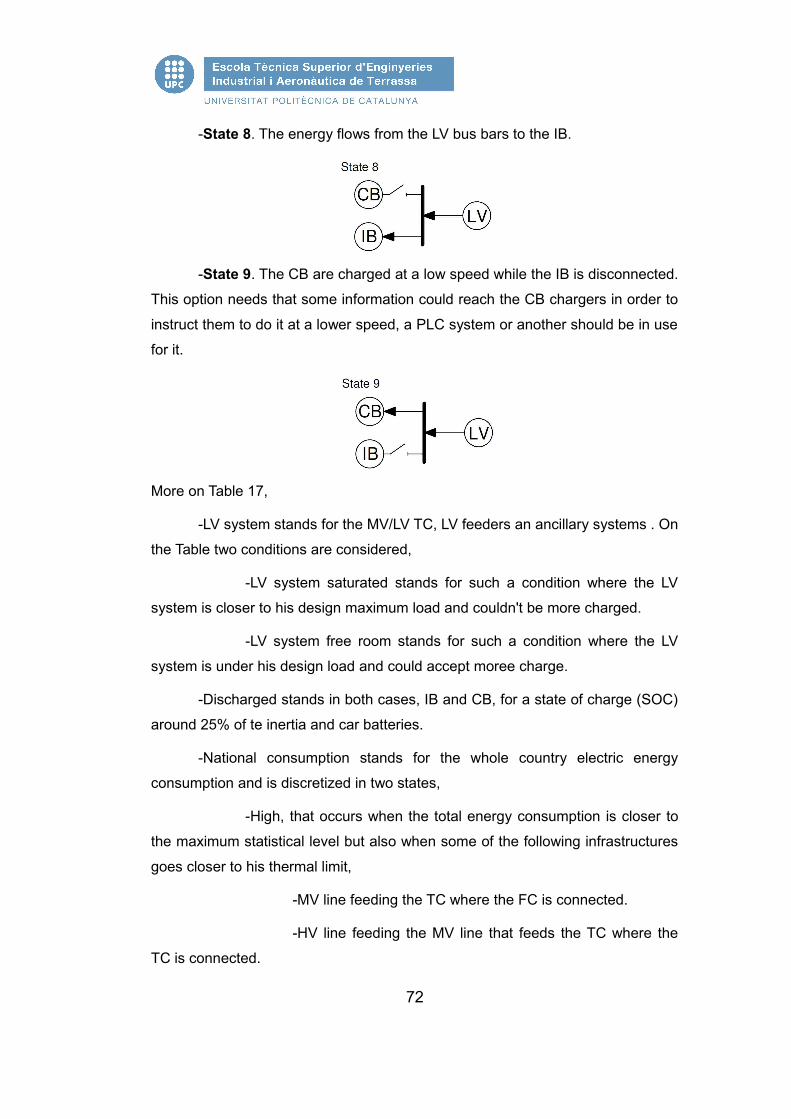
-State 8. The energy flows from the LV bus bars to the IB.
-State 9. The CB are charged at a low speed while the IB is disconnected.
This option needs that some information could reach the CB chargers in order to
instruct them to do it at a lower speed, a PLC system or another should be in use
for it.
More on Table 17,
-LV system stands for the MV/LV TC, LV feeders an ancillary systems . On
the Table two conditions are considered,
-LV system saturated stands for such a condition where the LV
system is closer to his design maximum load and couldn't be more charged.
-LV system free room stands for such a condition where the LV
system is under his design load and could accept moree charge.
-Discharged stands in both cases, IB and CB, for a state of charge (SOC)
around 25% of te inertia and car batteries.
-National consumption stands for the whole country electric energy
consumption and is discretized in two states,
-High, that occurs when the total energy consumption is closer to
the maximum statistical level but also when some of the following infrastructures
goes closer to his thermal limit,
-MV line feeding the TC where the FC is connected.
-HV line feeding the MV line that feeds the TC where the
TC is connected.
72
-ES receiving and issuing respectively HV and MV lines
that sequentially feed the TC where the FC is connected from the power station.
-Low, that occurs when there's a small national demand and none
of the electrical infrastructures defined above is closer to their thermal limit.
Furthermore an additional condition must be considered, not included into the
Table 17 on a specific column for simplicity, that stands for the cases of overload
of any line, MV or HV, above the MV/LV transformers that could be relieved by
energizing the grid from the IB. It tries to cover emergency situations as
unexpected overloads or partial failures that will mean energy deviations from
one line to another to avoid outages.
According to the regulation table next chapters will develop in detail every case
and will show how it can help to solve the main items to fix in order to make
possible the EV charging and to fulfil as mush as possible the chapter 4 requirements.
5.1.1 CASES DEFINITION
Next a case by case description of the 32 different situations included on Table
17 will be presented. Nevertheless its important to say again that this part of the
study deals with a simplified model where the infinite combinations between two
binary states are not taken into account.
Some priorities must be defined before starting with the case by case analysis
and decision making. The general priorities and their prevalence will be,
1st -Keep the houses electrical service quality and continuity by energizing
the grid when there's a possible outage due to an overload. This information
should be provided to the FC by the TSO or by the DSO.
2nd -Keep the CB SOC as big as possible to make the VAC as high as
possible.
3rd -Keep the IB SOC as big as possible and, at the same time, help the
grid to store renewals production when their production is high and the national
consumption is low when possible. Some additional information from the TSO or
the DSO should be provided to the FC in order to make it possible.
73

4th -Try to reduce the power grid load in their LV/MV/HV stages to improve
overall transport and distribution energy efficiency by energyzing the grid from the
IBs.
5th -Try to minimize the charge/discharge cycles on the IB to improve his
life span.
Next Figure 24 comes to help understanding the following descriptions.
Fig. 25 Elements and energy flow identification
Where,
-CB1...CBn stand for the cars batteries, identified before as CB.
-BC1...BCn stand for the battery chargers, feed on AC power, and with an
additional control to slow down the charging speed when needed.
-FC stands for the Flow Control system than should make possible what's
defined on Table 17.
-IB stands for the already described inertia battery intended to couple the
CB energy demand with the LV system load profile without generating overloads
and to help the LV/MV/HV power grid in cases of high thermal loads or
74

emergency.
-BFEF stands for the building feeder energy flow that, in Table 17, is
included on the LV System column and discretized into two single states,
saturated or free room.
-TC stands for a LV TC feeding energy to many buildings and
consumptions trough a local LV grid.
-TCEF stands for the TC energy flow that, in Table 17, is included into the
“LV System” column and discretized into two single states, saturated or free
room.
-MVEF stands for a MV line energy flow that, in Table 17, is included into
the “National consumption” column and discretized into two states, high or low. A
third state not included on Table 17 will be the emergency state where the line is
closer to his thermal limit.
-ES stands for an electric substation that feeds MV lines from HV.
-ESEF stands for an electric substation energy flow that, in Table 17, is
included on the “National consumption” column and discretized into two states,
high or low. A third flow level not included on Table 17 will be the emergency one
where the line is closer to his thermal limit, this should be considered in some
cases that will be described further on this chapter.
-HVEF stands for a HV line energy flow that, in Table 17, is included into
the “National consumption” column and discretized into two states, high or low. A
third state not included on Table 17 will be the emergency state where the line is
closer to his thermal limit.
Since the previous informations are already presented now is time to go with a
deep analysis of the 32 cases of the Table 17.
-Case 1. The situation can be summarized as follows,
– The local LV system is saturated because the BFEF or the
TCEF or both are closer to their maximum thermal limits.
– The National consumption is high due to the high Spanish
nationwide consumption or due to the high level of the MVEF
75
or the ESEF or the HVEF that are feeding the MV/LV TC.
– The IB is full and there's no need of energy to charge the CB
that are exhibiting also a 100% SOC.
– The renewals energy production is high.
After evaluating the priorities list in this case the first one that be satisfied
will be the 4th and thus some energy stored on the IB should be returned
to the power grid, is the State 4 that appears on Table 17.
-Case 2. The situation could be summarized as follows,
– The local LV system is saturated because the BFEF or the
TCEF or both are closer to their maximum thermal limits.
– The National consumption is low due to the low Spanish
nationwide consumption and due to the low level of the MVEF
and the ESEF and the HVEF that are feeding the MV/LV TC.
– The IB is full and there's no need of energy to charge the CB
that are exhibiting also a 100% SOC.
– The renewals energy production is high.
After evaluating the priorities list in this case the first one to be satisfied
will be the 3rd as the renewals production is high and the National
consumption is low but due to the LV system saturation and the IB and
CB SOC no more energy could be assumed by the system. As a result
the next to be satisfied will be the 4th and thus some energy stored on the
IB should be returned to the power grid, is the State 4 that appears on
Table 17.
-Case 3. The situation could be summarized as follows,
– The local LV system is saturated because the BFEF or the
TCEF or both are closer to their maximum thermal limits.
– The National consumption is high due to the high Spanish
nationwide consumption or due to the high level of the MVEF
or the ESEF or the HVEF that are feeding the MV/LV TC.
76
– The IB is full and there's no need of energy to charge the CB
that are exhibiting also a 100% SOC.
– The renewals energy production is low.
After evaluating the priorities list in this case the first one to be satisfied
will be the 4th and thus some energy stored on the IB should be returned
to the power grid, is the State 4 that appears on Table 17.
-Case 4. The situation could be summarized as follows,
– The local LV system is saturated because the BFEF or the
TCEF or both are closer to their maximum thermal capacities.
– The National consumption is low due to the low Spanish
nationwide consumption and due to the low level of the MVEF
and the ESEF and the HVEF that are feeding the MV/LV TC.
– The IB is full and there's no need of energy to charge the CB
that are exhibiting also a 100% SOC.
– The renewals energy production is low.
After evaluating the priorities list in this case the first one to be satisfied
will be the 4th and thus some energy stored on the IB should be returned
to the power grid, is the State 4 that appears on Table 17.
-Case 5. The situation could be summarized as follows,
– The local LV system has free room to transport energy
because the BFEF and the TCEF are far from their maximum
thermal limits.
– The National consumption is high due to the high Spanish
nationwide consumption or due to the high level of the MVEF
or the ESEF or the HVEF that are feeding the MV/LV TC.
– The IB is full and there's no need of energy to charge the CB
that are exhibiting also a 100% SOC.
– The renewals energy production is high.
After evaluating the priorities list in this case the first one to be satisfied
77
will be the 4th and thus some energy stored on the IB should be returned
to the power grid, is the State 4 that appears on Table 17.
-Case 6. The situation could be summarized as follows,
– The local LV system has free room to transport energy
because the BFEF and the TCEF are far from their maximum
thermal limits.
– The National consumption is low due to the low Spanish
nationwide consumption and due to the low level of the MVEF
and the ESEF and the HVEF that are feeding the MV/LV TC.
– The IB is full and there's no need of energy to charge the CB
that are exhibiting also a 100% SOC.
– The renewals energy production is high.
After evaluating the priorities list in this case no one could be satisfied by
the FC and thus the EV charging system has to be disconnected from the
grid, is the State 5 that appears on Table 17.
-Case 7. The situation could be summarized as follows,
– The local LV system has free room to transport energy
because the BFEF and the TCEF are far from their maximum
thermal limits.
– The National consumption is high due to the high Spanish
nationwide consumption or due to the high level of the MVEF
or the ESEF or the HVEF that are feeding the MV/LV TC.
– The IB is full and there's no need of energy to charge the CB
that are exhibiting also a 100% SOC.
– The renewals energy production is low.
After evaluating the priorities list in this case the first one to be satisfied
will be the 4th and thus the EV charging system has to be disconnected
from the grid, is the State 4 that appears on Table 17.
78

-Case 8. The situation could be summarized as follows,
– The local LV system has free room to transport energy
because the BFEF and the TCEF are far from their maximum
thermal limits.
– The National consumption is low due to the low Spanish
nationwide consumption and due to the low level of the MVEF
and the ESEF and the HVEF that are feeding the MV/LV TC.
– The IB is full and there's no need of energy to charge the CB
that are exhibiting also a 100% SOC.
– The renewals energy production is low.
After evaluating the priorities list in this case no one could be satisfied by
the FC and thus the EV charging system has to be disconnected from the
grid, is the State 5 that appears on Table 17
-Case 9. The situation could be summarized as follows,
– The local LV system is saturated because the BFEF or the
TCEF or both are closer to their maximum thermal limits.
– The National consumption is high due to the high Spanish
nationwide consumption or due to the high level of the MVEF
or the ESEF or the HVEF that are feeding the MV/LV TC.
– The IB is full but the CB need to be charged.
– The renewals energy production is high.
After evaluating the priorities list in this case the first one that could be
satisfied will be the 2nd and thus the EV charging system must charge the
CB by using the IB stored energy, is the State 6 that appears on Table 17.
Moreover in this case the shift from the State 6 to the State 7, where the
priority for the IB is to energize the power grid while charging the CB as a
secondary target, should be performed if the TSO or the DSO send an
emergency signal to do so.
79

-Case 10. The situation could be summarized as follows,
– The local LV system is saturated because the BFEF or the
TCEF or both are closer to their maximum thermal limits.
– The National consumption is low due to the low Spanish
nationwide consumption and due to the low level of the MVEF
and the ESEF and the HVEF that are feeding the MV/LV TC.
– The IB is full but the CB need to be charged.
– The renewals energy production is high.
After evaluating the priorities list in this case the first one that could be
satisfied will be the 2nd and thus the EV charging system must charge the
CB by using the IB stored energy, is the State 6 that appears on Table 17.
-Case 11. The situation could be summarized as follows,
– The local LV system is saturated because the BFEF or the
TCEF or both are closer to their maximum thermal limits.
– The National consumption is high due to the high Spanish
nationwide consumption or due to the high level of the MVEF
or the ESEF or the HVEF that are feeding the MV/LV TC.
– The IB is full but the CB need to be charged.
– The renewals energy production is low.
After evaluating the priorities list in this case the first one that could be
satisfied will be the 2nd and thus the EV charging system must charge the
CB by using the IB stored energy, is the State 6 that appears on Table 17.
Moreover in this case the shift from the State 6 to the State 7, where the
priority for the IB is to energize the power grid while charging the CB as a
secondary target, should be performed if the TSO or the DSO send an
emergency signal to do so.
-Case 12. The situation could be summarized as follows,
– The local LV system is saturated because the BFEF or the
80

TCEF or both are closer to their maximum thermal limits.
– The National consumption is low due to the low Spanish
nationwide consumption and due to the low level of the MVEF
and the ESEF and the HVEF that are feeding the MV/LV TC.
– The IB is full but the CB need to be charged.
– The renewals energy production is low.
After evaluating the priorities list in this case the first one that could be
satisfied will be the 2nd and thus the EV charging system must charge the
CB by using the IB stored energy, is the State 6 that appears on Table 17.
-Case 13. The situation could be summarized as follows,
– The local LV system has free room to transport energy
because the BFEF and the TCEF are far from their maximum
thermal limits.
– The National consumption is high due to the high Spanish
nationwide consumption or due to the high level of the MVEF
or the ESEF or the HVEF that are feeding the MV/LV TC.
– The IB is full but the CB need to be charged.
– The renewals energy production is high.
After evaluating the priorities list in this case the first one that could be
satisfied will be the 2nd and thus the EV charging system must charge the
CB by using the IB stored energy and the LV system, is the State 3 that
appears on Table 17. Moreover in this case the shift from the State 3 to
the State 7, where the priority for the IB is to energize the power grid
while charging the CB as a secondary target, should be performed if the
TSO or the DSO send an emergency signal to do so.
-Case 14. The situation could be summarized as follows,
– The local LV system has free room to transport energy
because the BFEF and the TCEF are far from their maximum
thermal limits.
81

– The National consumption is low due to the low Spanish
nationwide consumption and due to the low level of the MVEF
and the ESEF and the HVEF that are feeding the MV/LV TC
– The IB is full but the CB need to be charged.
– The renewals energy production is high.
After evaluating the priorities list in this case the first one that could be
satisfied will be the 2nd and thus the EV charging system must charge the
CB by using the IB stored energy and the LV system, is the State 3 that
appears on Table 17.
-Case 15. The situation could be summarized as follows,
– The local LV system has free room to transport energy
because the BFEF and the TCEF are far from their maximum
thermal limits.
– The National consumption is high due to the high Spanish
nationwide consumption or due to the high level of the MVEF
or the ESEF or the HVEF that are feeding the MV/LV TC.
– The IB is full but the CB need to be charged.
– The renewals energy production is low.
After evaluating the priorities list in this case the first one that could be
satisfied will be the 2nd and thus the EV charging system must charge the
CB by using the IB stored energy and the LV system, is the State 3 that
appears on Table 17. Moreover in this case the shift from the State 3 to
the State 7, where the priority for the IB is to energize the power grid
while charging the CB as a secondary target, should be performed if the
TSO or the DSO send an emergency signal to do so.
-Case 16. The situation could be summarized as follows,
– The local LV system has free room to transport energy
because the BFEF and the TCEF are far from their maximum
thermal limits.
– The National consumption is low due to the low Spanish
82
nationwide consumption and due to the low level of the MVEF
and the ESEF and the HVEF that are feeding the MV/LV TC
– The IB is full but the CB need to be charged.
– The renewals energy production is low.
After evaluating the priorities list in this case the first one that could be
satisfied will be the 2nd and thus the EV charging system must charge the
CB by using the IB stored energy and the LV system, is the State 3 that
appears on Table 17.
-Case 17. The situation could be summarized as follows,
– The local LV system is saturated because the BFEF or the
TCEF or both are closer to their maximum thermal limits.
– The National consumption is high due to the high Spanish
nationwide consumption or due to the high level of the MVEF
or the ESEF or the HVEF that are feeding the MV/LV TC.
– The CB are charged but the IB is discharged.
– The renewals energy production is high.
After evaluating the priorities list in this case no one could be satisfied by
the FC and thus the EV charging system has to be disconnected from the
grid, is the State 5 that appears on Table 17.
-Case 18. The situation could be summarized as follows,
– The local LV system is saturated because the BFEF or the
TCEF or both are closer to their maximum thermal limits.
– The National consumption is low due to the low Spanish
nationwide consumption and due to the low level of the MVEF
and the ESEF and the HVEF that are feeding the MV/LV TC.
– The CB are charged but the IB is discharged.
– The renewals energy production is high.
After evaluating the priorities list in this case no one could be satisfied by
the FC and thus the EV charging system has to be disconnected from the
83
grid, is the State 5 that appears on Table 17.
-Case 19. The situation could be summarized as follows,
– The local LV system is saturated because the BFEF or the
TCEF or both are closer to their maximum thermal limits.
– The National consumption is high due to the high Spanish
nationwide consumption or due to the high level of the MVEF
or the ESEF or the HVEF that are feeding the MV/LV TC.
– The CB are charged but the IB is discharged.
– The renewals energy production is low.
After evaluating the priorities list in this case no one could be satisfied by
the FC and thus the EV charging system has to be disconnected from the
grid, is the State 5 that appears on Table 17.
-Case 20. The situation could be summarized as follows,
– The local LV system is saturated because the BFEF or the
TCEF or both are closer to their maximum thermal limits.
– The National consumption is low due to the low Spanish
nationwide consumption and due to the low level of the MVEF
and the ESEF and the HVEF that are feeding the MV/LV TC.
– The CB are charged but the IB is discharged.
– The renewals energy production is low.
After evaluating the priorities list in this case no one could be satisfied by
the FC and thus the EV charging system has to be disconnected from the
grid, is the State 5 that appears on Table 17.
-Case 21. The situation could be summarized as follows,
– The local LV system has free room to transport energy
because the BFEF and the TCEF are far from their maximum
thermal limits.
– The National consumption is high due to the high Spanish
nationwide consumption or due to the high level of the MVEF
84

or the ESEF or the HVEF that are feeding the MV/LV TC.
– The CB are charged but the IB is discharged.
– The renewals energy production is high.
After evaluating the priorities list in this case the first to satisfy is the 3rd
one so the FC should switch to the State 8 that appears on Table 17.
Moreover, as the National consumption is high, an emergency signal of
overload risk from the DSO or the TSO is more likely to arrive changing
the FC to the State 5.
-Case 22. The situation could be summarized as follows,
– The local LV system has free room to transport energy
because the BFEF and the TCEF are far from their maximum
thermal limits.
– The National consumption is low due to the low Spanish
nationwide consumption and due to the low level of the MVEF
and the ESEF and the HVEF that are feeding the MV/LV TC.
– The CB are charged but the IB is discharged.
– The renewals energy production is high.
After evaluating the priorities list in this case the first to satisfy is the 3rd
one so the FC should switch to the State 8 that appears on Table 17.
-Case 23. The situation could be summarized as follows,
– The local LV system has free room to transport energy
because the BFEF and the TCEF are far from their maximum
thermal limits.
– The National consumption is high due to the high Spanish
nationwide consumption or due to the high level of the MVEF
or the ESEF or the HVEF that are feeding the MV/LV TC.
– The CB are charged but the IB is discharged.
– The renewals energy production is low.
After evaluating the priorities list in this case the first to satisfy is the 3 rd
85

one so the FC should switch to the State 8 that appears on Table 17.
Moreover, as the National consumption is high, an emergency signal of
overload risk from the DSO or the TSO is more likely to arrive changing
the FC to the State 5.
-Case 24. The situation could be summarized as follows,
– The local LV system has free room to transport energy
because the BFEF and the TCEF are far from their maximum
thermal limits.
– The National consumption is low due to the low Spanish
nationwide consumption and due to the low level of the MVEF
and the ESEF and the HVEF that are feeding the MV/LV TC.
– The CB are charged but the IB is discharged.
– The renewals energy production is low.
After evaluating the priorities list in this case the first to satisfy is the 3rd
one so the FC should switch to the State 8 that appears on Table 17.
-Case 25. The situation could be summarized as follows,
– The local LV system is saturated because the BFEF or the
TCEF or both are closer to their maximum thermal limits.
– The National consumption is high due to the high Spanish
nationwide consumption or due to the high level of the MVEF
or the ESEF or the HVEF that are feeding the MV/LV TC.
– The CB and the IB are both discharged.
– The renewals energy production is high.
After evaluating the priorities list in this case no one could be satisfied by
the FC and thus the EV charging system has to be disconnected from the
grid, is the State 5 that appears on Table 17.
-Case 26. The situation could be summarized as follows,
– The local LV system is saturated because the BFEF or the
TCEF or both are closer to their maximum thermal limits.
86
– The National consumption is low due to the low Spanish
nationwide consumption and due to the low level of the MVEF
and the ESEF and the HVEF that are feeding the MV/LV TC.
– The CB and the IB are both discharged.
– The renewals energy production is high.
After evaluating the priorities list in this case no one could be satisfied by
the FC and thus the EV charging system has to be disconnected from the
grid, is the State 5 that appears on Table 17.
-Case 27. The situation could be summarized as follows,
– The local LV system is saturated because the BFEF or the
TCEF or both are closer to their maximum thermal limits.
– The National consumption is high due to the high Spanish
nationwide consumption or due to the high level of the MVEF
or the ESEF or the HVEF that are feeding the MV/LV TC.
– The CB are charged but the IB is discharged.
– The renewals energy production is low.
After evaluating the priorities list in this case no one could be satisfied by
the FC and thus the EV charging system has to be disconnected from the
grid, is the State 5 that appears on Table 17.
-Case 28. The situation could be summarized as follows,
– The local LV system is saturated because the BFEF or the
TCEF or both are closer to their maximum thermal limits.
– The National consumption is low due to the low Spanish
nationwide consumption and due to the low level of the MVEF
and the ESEF and the HVEF that are feeding the MV/LV TC.
– The CB and the IB are both discharged.
– The renewals energy production is low.
After evaluating the priorities list in this case no one could be satisfied by
the FC and thus the EV charging system has to be disconnected from the
87

grid, is the State 5 that appears on Table 17.
-Case 29. The situation could be summarized as follows,
– The local LV system has free room to transport energy
because the BFEF and the TCEF are far from their maximum
thermal limits.
– The National consumption is high due to the high Spanish
nationwide consumption or due to the high level of the MVEF
or the ESEF or the HVEF that are feeding the MV/LV TC.
– The CB and the IB are both discharged.
– The renewals energy production is high.
After evaluating the priorities list in this case the first to satisfy is the 2nd
one followed by the 3rd so the FC should switch to the State 1 that
appears on Table 17 where the IB and the CB are charged by the LV
system. Moreover, as the National consumption is high, an emergency
signal of overload risk from the DSO or the TSO is more likely to occur
changing the FC to the State 9 where the IB is disconnected and the CB
could be charged at a low rate. Finally, in case of a persisting overload,
FC must switch to State 5.
-Case 30. The situation could be summarized as follows,
– The local LV system has free room to transport energy
because the BFEF and the TCEF are far from their maximum
thermal limits.
– The National consumption is low due to the low Spanish
nationwide consumption and due to the low level of the MVEF
and the ESEF and the HVEF that are feeding the MV/LV TC.
– The CB and the IB are both discharged.
– The renewals energy production is high.
After evaluating the priorities list in this case the first to satisfy is the 2nd
and after the 3rd one so the FC should switch to the State 1 that appears
on Table 17.
88

-Case 31. The situation could be summarized as follows,
– The local LV system has free room to transport energy
because the BFEF and the TCEF are far from their maximum
thermal limits.
– The National consumption is high due to the high Spanish
nationwide consumption or due to the high level of the MVEF
or the ESEF or the HVEF that are feeding the MV/LV TC.
– The CB and the IB are both discharged.
– The renewals energy production is low.
After evaluating the priorities list in this case the first to satisfy is the 2nd
one followed by the 3rd so the FC should switch to the State 1 that
appears on Table 17 where the IB and the CB are charged by the LV
system. Moreover, as the National consumption is high, an emergency
signal of overload risk from the DSO or the TSO is more likely to occur
changing the FC to the State 9 where the IB is disconnected and the CB
could be charged at a low rate. Finally, in case of a persisting overload,
FC must switch to State 5.
-Case 32. The situation could be summarized as follows,
– The local LV system has free room to transport energy
because the BFEF and the TCEF are far from their maximum
thermal limits.
– The National consumption is low due to the low Spanish
nationwide consumption and due to the low level of the MVEF
and the ESEF and the HVEF that are feeding the MV/LV TC.
– The CB and the IB are both discharged.
– The renewals energy production is low.
After evaluating the priorities list in this case the first to satisfy is the 2nd
and after the 3rd one so the FC should switch to the State 1 that appears
on Table 17.
89
5.1.2 FLOW CONTROL STRUCTURE
To achieve the previous regulation proposal a key component of the system is
the FC system that makes the energy flow in a convenient manner to reach the
regulation targets defined on Table 17. Next Figure 25 shows a proposal of the
main elements that could integrate the FC system as a detail of what was shown
on Figure 24.
Fig. 26 Flow Control system structure
Where,
-CB_i stands for the car batteries and their battery chargers.
-cl stands for an unidirectional data line or bus intended to send control
orders to the existing solid state relays.
-dl stands for an unidirectional data line or bus intended to bring
90

information between the regulator and the linked element. Case by case,
-The LV system tells the FC when it's saturated and thus
unavailable to charge the batteries, nor the IB neither the CB.
-The ammeters are intended to provide feedback to the regulator
about the real energy flow.
-The TSO or the DSO bring to the regulator information regarding
the renewals production, the national consumption, the desired power factor and
the risk of overload on any of the MV/HV elements that can be found upstream
his FC.
- xl stands for a bidirectional data line or bus dedicated to convey both
information and control orders. In this sense,
-The Battery Charger brings information to the regulator about the
SOC of the IB. At the same time the regulator tells the Battery Charger how much
power is left to be used charging the IB before getting the LV systems
overloaded.
-The Inverter tells the regulator about how much energy still
remains on the IB. The regulator tells the Inverter about how much energy, active
and reactive, should be make available to the system on a given time regarding
the CB charging state, the LV saturation, the National consumption and power
factor.
-The CB_i tells to the regulator their SOC. The regulator tells the
CB_i about the maximum charging speed on a given time to avoid LV saturation
or to help the MV/HV upstream grids to overcome a coming or actual overload.
Finally, even if the Table 17 regulation could be achieved by bringing to the
existing elements the requested orders and setpoints, solid state relays are
implemented to achieve a low operating risk trough redundancy.
5.1.3 ENERGY BALANCE
Following all the previous informations an energy balance should be performed in
order to check the applicability of the proposed countermeasure and to start
sizing the IB. This must be done by keeping some requirements,
91
-The VAC should be improved by the use of an IB. As already defined on
chapter 3.3.1.2.2 a 90% availability will be this study target. Probably it stills
being a poor rate comparing with the almost 100% VAC of the thermal engine
cars but means 2,5 hrs of charging time and notably improves the maximum 75%
availability if the EV batteries charging overload is going to be solved simply by
shifting the charging times to valley hours as already seen on chapter 4.1.1.
-The LV overload should be always avoided.
-Even if until now we considered an EV 21% market share on 2030, the
EV penetration will be assumed as 100% for this calculations purposes as stated
on point 4.2 . The though is that this would be the real situation and the
administration, when it comes to issue a EV charging facility code, will be more
likely to refer to a 100% EV deployment than to a partial, temporal, 21% one.
5.1.3.1 ENERGY AVAILABILITY
The total available energy on a residential building must be calculated in order to
determine whether the countermeasure is possible or not. To do so the following
Figure 27 shows graphically how much energy could be drawn from the main
supply without trespassing the LV system maximum load on the study case of a
50 flat building.
Fig. 27 Maximum energy in kWh
Where the dashed area represents the total amount of energy, in therms of kWh,
that could be ontained from the LV system by using the remaining available
power over the blue plot that represents the residential electric consumption
according REE [45].
92
1721 kWh
5 6 7 8 9 10 11 12 13 14 15 16 17 18 19 20 21 22 23 24hours
1 2 3 4
195,5kW
Residential power demandLV system maximum power
Since the gross amount of energy is already known, and according to the FC
description on chapter 5.1.2, some efficiency coefficients must be applied in order
to take into account the elements included on it.
Considering what was calculated on chapter 3.2.2.2 we should apply the
following efficiencies,
-IB charger. The energy to be stored at the IB should run his way trough
the charger and thus a 89% of the incoming kWh could be expected arriving to
the battery.
-Battery. Not the whole energy stored into the battery will be recovered at
the discherge process. A new 85% is to apply to get the useable energy.
-Inverter. The energy that we could recover from the battery has to pay a
last tribute on his way to the CB charger. In this case a 96% efficiency, coming
from the serious developments done over the photovoltaic energy systems, will
tax the flow.
For this study purposes the chosen solid state relays will be considered as a
ideal switches.
Then, by applying the previous coefficients the original 1721 kWh shrink to a
thinner 1249 kWh available at the CB chargers if the whole energy flow has to
follow the IB cycle.
5.1.3.2 ENERGY DEMAND
According with what was calculated on chapter 3.3.1.2.2.1 and defined on
chapter 3.3.1.3 the following can be stated,
-On a 50 flats apartments building a total of 27,5 cars is moving every day
leaving and returning to the parking after a run of 58 km.
-The energy need on every EV charger is 0,36 kWh/km which, applying a
1,2 safety coefficient, moves to a higher 0,432 kWh/km.
Considering that now we are assuming that a 100% of the parked cars are
electrically driven, so all of them are EV, the total amount of energy needed on a
given day is 689 kWh.
93

5.1.3.3 CONCLUSIONS
As a pure mathematical conclusion the energy availability is enough to fulfil the
need of it and, according to this finding, its possible to feed the EV without
improving the LV system power capability just by adding an IB and the FC
regulator.
Nevertheless the situation could be improved even more recalling that Table 17
regulation forces to charge only trough the IB at the times where the building
consumption is near to his maximum design load using as much as possible the
direct charge from the LV system when possible. In this sense 250 kWh can be
obtained from the LV system from 15 to 24 hours what in turn means that the rest
of the previously calculated 689 kWh, 439 kWh, must be driven to the EV battery
chargers by the IB. To do so, after applying the efficiencies chain seen before,
604 kWh will flow from the LV system to the IB on the valley hours to store the
desired amount of energy.
Next Figure 28 comes to show it graphically assuming that the valley hours are
from 0 to 8 thus giving a constant charging power of 101kW to get the requested
538 kWh on the IB that later will be used to charge the CB.
Fig.28 EV batteries energy sources.
Where the red plot still have some gap regarding the LV design maximum power
and the time window allowing even bigger loads.
5.2 INERTIA BATTERY DEFINITION
Next points will try to define the most critical element of the whole
countermeasure proposal, the battery. Its type, size and arrangement will be
94
101
IB charge power demandTotal power demand without the CB charging process
LV system maximum power
1 2 3 4 5 6 7 8 9 10 11 12 13 14 15 16 17 18 19 20 21 22 23 24
kW
hours
Residential power demand
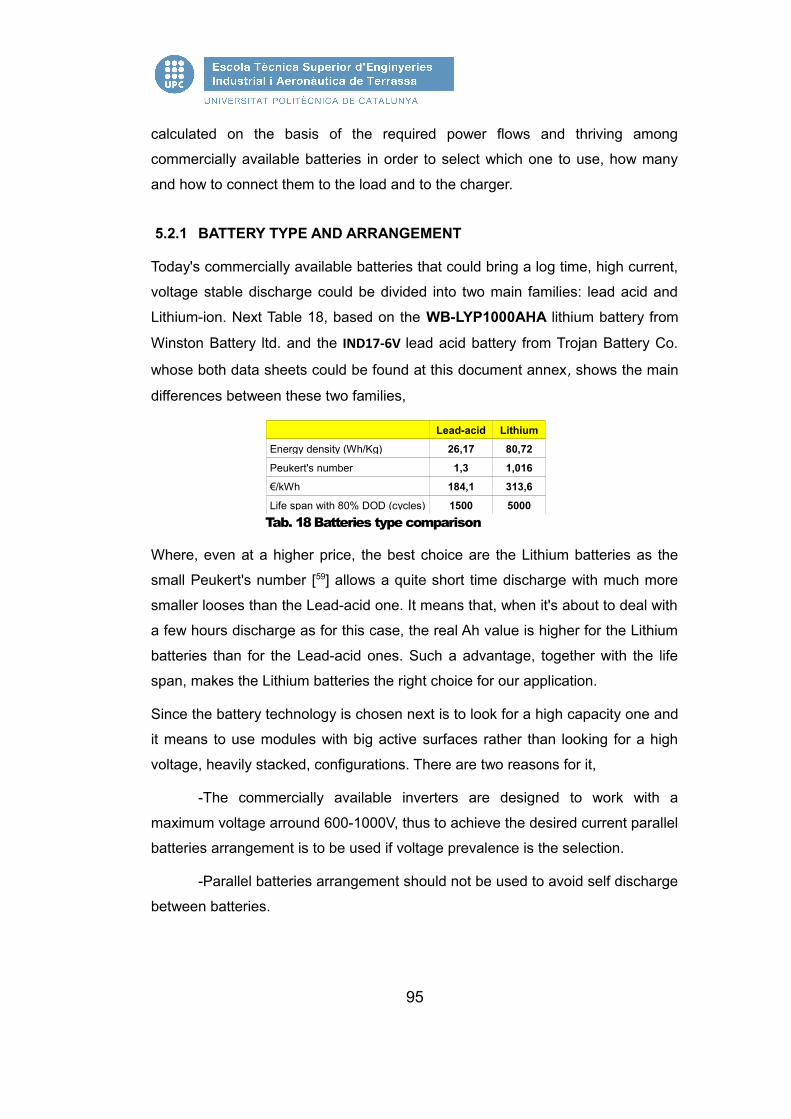
calculated on the basis of the required power flows and thriving among
commercially available batteries in order to select which one to use, how many
and how to connect them to the load and to the charger.
5.2.1 BATTERY TYPE AND ARRANGEMENT
Today's commercially available batteries that could bring a log time, high current,
voltage stable discharge could be divided into two main families: lead acid and
Lithium-ion. Next Table 18, based on the WB-LYP1000AHA lithium battery from
Winston Battery ltd. and the IND17-6V lead acid battery from Trojan Battery Co.
whose both data sheets could be found at this document annex, shows the main
differences between these two families,
Lead-acid Lithium
Energy density (Wh/Kg) 26,17 80,72
Peukert's number 1,3 1,016
€/kWh 184,1 313,6
Life span with 80% DOD (cycles) 1500 5000 Tab. 18 Batteries type comparison
Where, even at a higher price, the best choice are the Lithium batteries as the
small Peukert's number [59] allows a quite short time discharge with much more
smaller looses than the Lead-acid one. It means that, when it's about to deal with
a few hours discharge as for this case, the real Ah value is higher for the Lithium
batteries than for the Lead-acid ones. Such a advantage, together with the life
span, makes the Lithium batteries the right choice for our application.
Since the battery technology is chosen next is to look for a high capacity one and
it means to use modules with big active surfaces rather than looking for a high
voltage, heavily stacked, configurations. There are two reasons for it,
-The commercially available inverters are designed to work with a
maximum voltage arround 600-1000V, thus to achieve the desired current parallel
batteries arrangement is to be used if voltage prevalence is the selection.
-Parallel batteries arrangement should not be used to avoid self discharge
between batteries.
95

5.2.2 DEMAND PROFILE
Before setting up the size and the arrangements a demand profile will be
calculated by using power flow values, voltages and currents
As a first step the demand profile related to the EV should be estimated. Its about
to do same already done on chapters 3.3.1.2.2.1 and 3.3.1.2.2.2 but this time
considering that 100% of the cars are EV ones and that we do charge them on a
2,5 hours period to achieve the desired 90% VAC. Next Figure 28 reproduces the
previous Figure 15 for a better understanding and convenience.
Fig.29 Hourly distribution of cars leaving and returning to the parking
Then, and assuming that no one car will expend more than one hour on his 29
km journey back home, the previous figure analysis could be as follows,
14h → 0'13x50 cars running back home → 6 EV parked at 15h starting battery
charge
15h → 0'12x50 cars running back home → 6 EV parked at 16h starting battery
charge
16h → 0'09x50 cars running back home → 4 EV parked at 17h starting battery
charge
96
Cars leaving the parking Cars returning to the parking
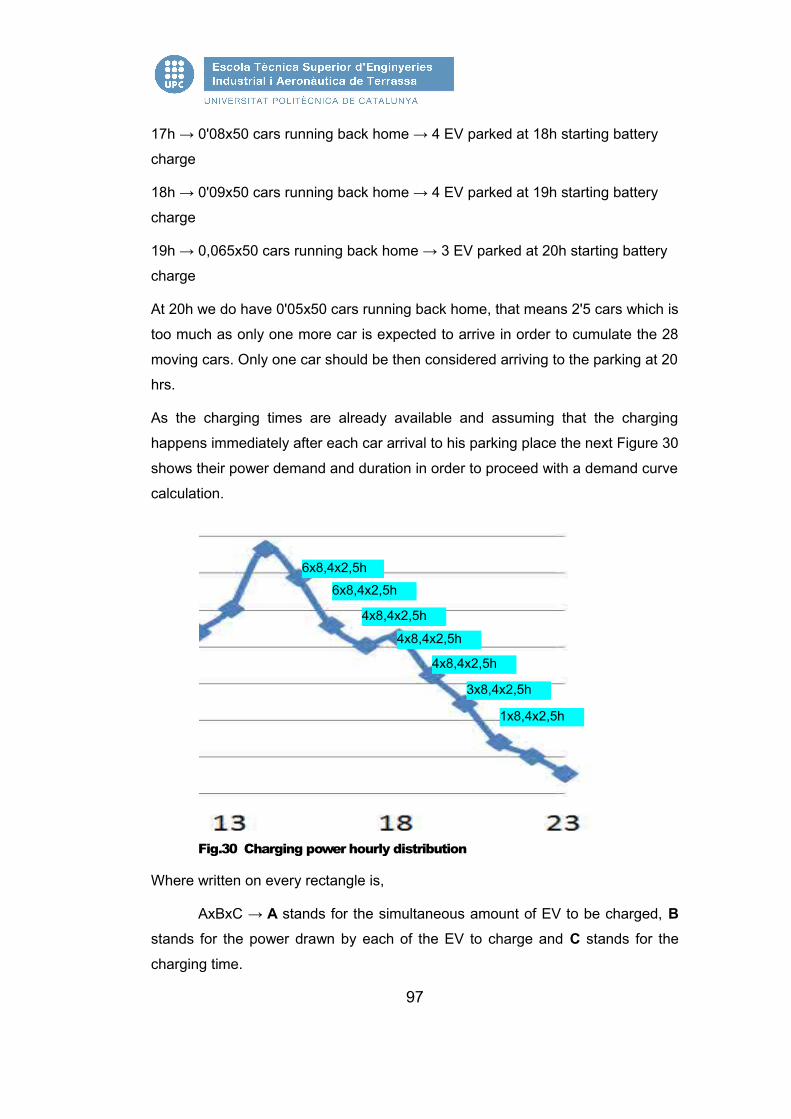
17h → 0'08x50 cars running back home → 4 EV parked at 18h starting battery
charge
18h → 0'09x50 cars running back home → 4 EV parked at 19h starting battery
charge
19h → 0,065x50 cars running back home → 3 EV parked at 20h starting battery
charge
At 20h we do have 0'05x50 cars running back home, that means 2'5 cars which is
too much as only one more car is expected to arrive in order to cumulate the 28
moving cars. Only one car should be then considered arriving to the parking at 20
hrs.
As the charging times are already available and assuming that the charging
happens immediately after each car arrival to his parking place the next Figure 30
shows their power demand and duration in order to proceed with a demand curve
calculation.
Fig.30 Charging power hourly distribution
Where written on every rectangle is,
AxBxC → A stands for the simultaneous amount of EV to be charged, B stands for the power drawn by each of the EV to charge and C stands for the
charging time.
97
6x8,4x2,5h
4x8,4x2,5h
6x8,4x2,5h
4x8,4x2,5h
4x8,4x2,5h
1x8,4x2,5h
3x8,4x2,5h
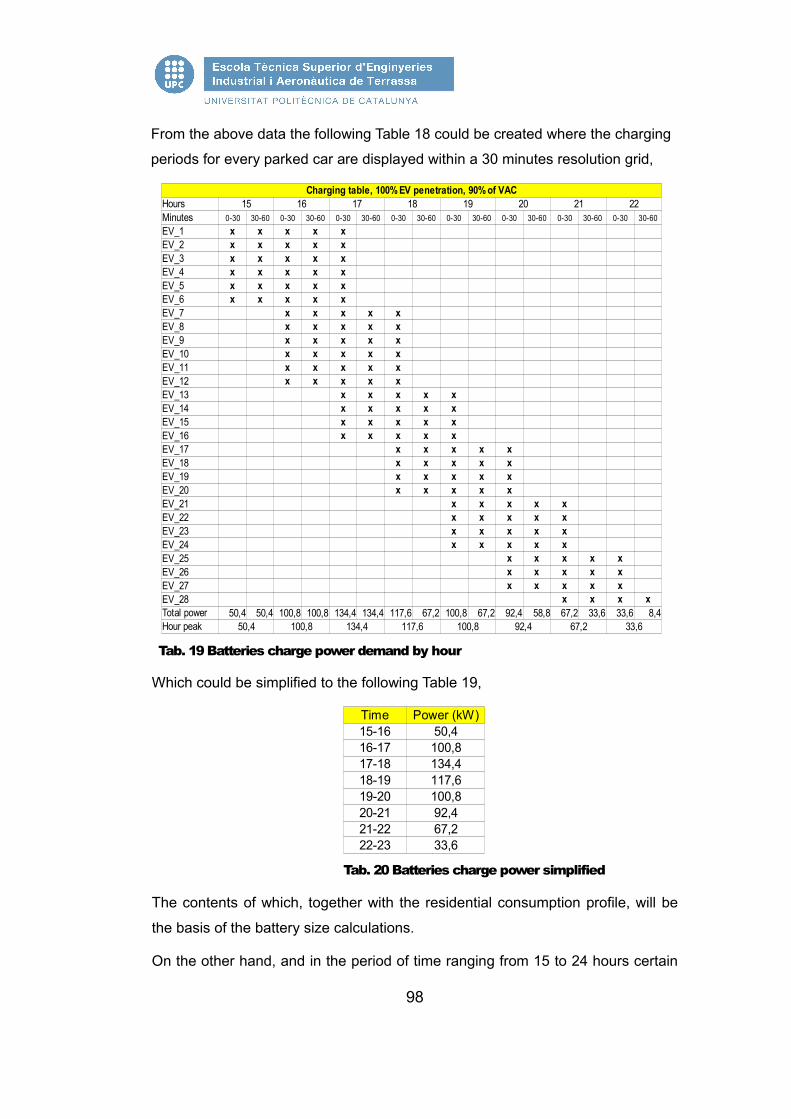
From the above data the following Table 18 could be created where the charging
periods for every parked car are displayed within a 30 minutes resolution grid,
Tab. 19 Batteries charge power demand by hour
Which could be simplified to the following Table 19,
Tab. 20 Batteries charge power simplified
The contents of which, together with the residential consumption profile, will be
the basis of the battery size calculations.
On the other hand, and in the period of time ranging from 15 to 24 hours certain
98
15 16 17 18 19 20 21 22Minutes 0-30 30-60 0-30 30-60 0-30 30-60 0-30 30-60 0-30 30-60 0-30 30-60 0-30 30-60 0-30 30-60EV_1EV_2EV_3EV_4EV_5EV_6EV_7EV_8EV_9EV_10EV_11EV_12EV_13EV_14EV_15EV_16EV_17EV_18EV_19EV_20EV_21EV_22EV_23EV_24EV_25EV_26EV_27EV_28
50,4 50,4 100,8 100,8 134,4 134,4 117,6 67,2 100,8 67,2 92,4 58,8 67,2 33,6 33,6 8,450,4 100,8 134,4 117,6 100,8 92,4 67,2 33,6
Charging table, 100% EV penetration, 90% of VACHours
x x x x xx x x x xx x x x xx x x x xx x x x xx x x x x
x x x x xx x x x xx x x x xx x x x xx x x x xx x x x x
x x x x xx x x x xx x x x xx x x x x
x x x x xx x x x xx x x x xx x x x x
x x x x xx x x x xx x x x xx x x x x
x x x x xx x x x xx x x x x
x x x xTotal powerHour peak
Time Power (kW)15-16 50,416-17 100,817-18 134,418-19 117,619-20 100,820-21 92,421-22 67,222-23 33,6
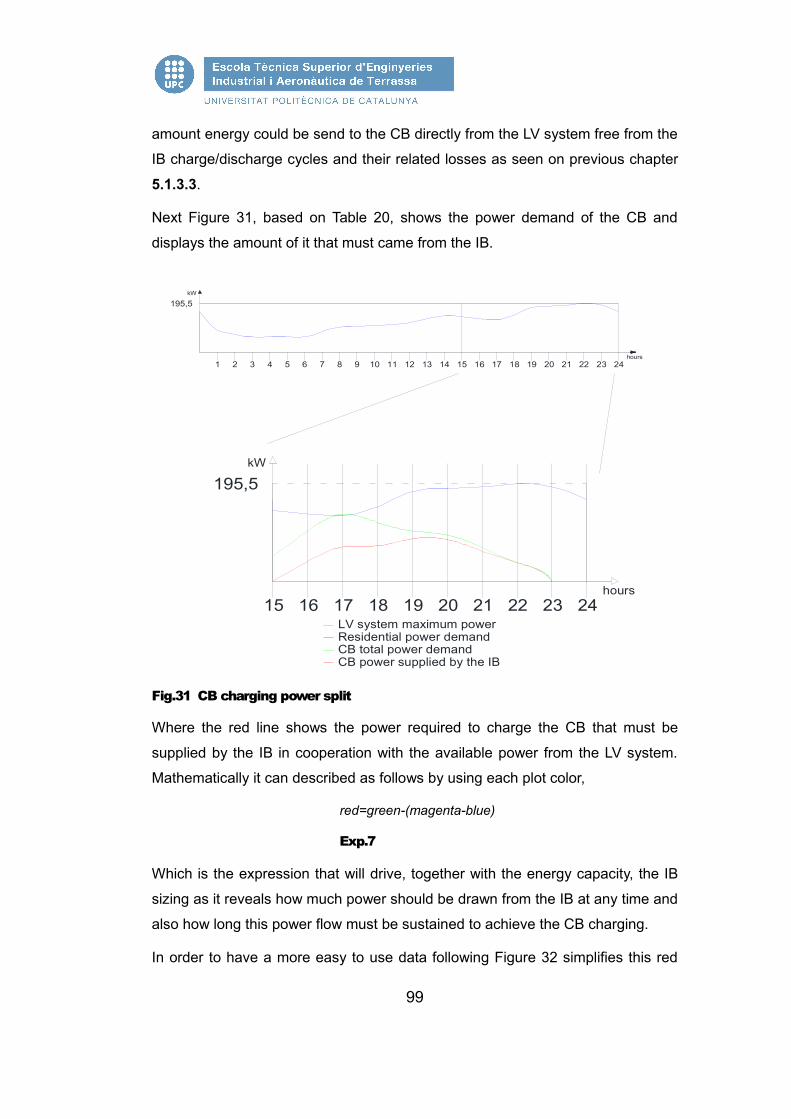
amount energy could be send to the CB directly from the LV system free from the
IB charge/discharge cycles and their related losses as seen on previous chapter
5.1.3.3.
Next Figure 31, based on Table 20, shows the power demand of the CB and
displays the amount of it that must came from the IB.
Fig.31 CB charging power split
Where the red line shows the power required to charge the CB that must be
supplied by the IB in cooperation with the available power from the LV system.
Mathematically it can described as follows by using each plot color,
red=green-(magenta-blue)
Exp.7
Which is the expression that will drive, together with the energy capacity, the IB
sizing as it reveals how much power should be drawn from the IB at any time and
also how long this power flow must be sustained to achieve the CB charging.
In order to have a more easy to use data following Figure 32 simplifies this red
99
1 2 3 4 5 6 7 8 9 10 11 12 13 14 15 16 17 18 19 20 21 22 23 24
195,5kW
hours
15 16 17 18 19 20 21 22 23 24hours
195,5kW
Residential power demandCB total power demandCB power supplied by the IB
LV system maximum power
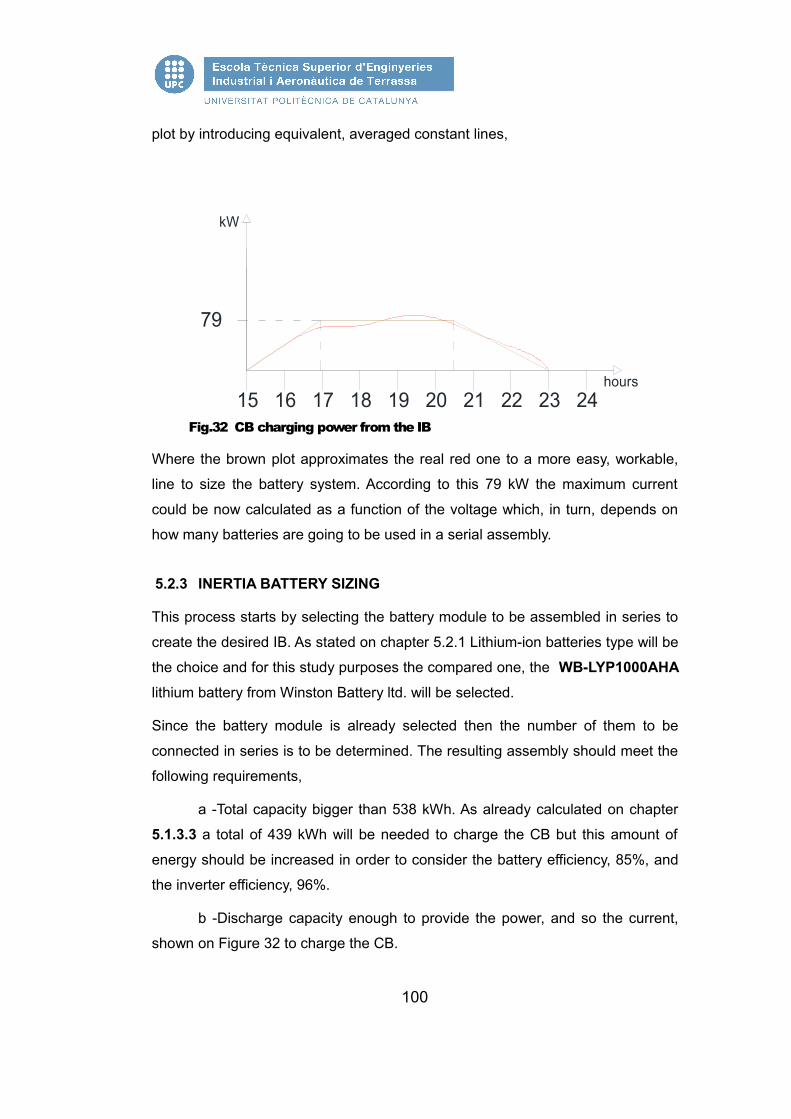
plot by introducing equivalent, averaged constant lines,
Fig.32 CB charging power from the IB
Where the brown plot approximates the real red one to a more easy, workable,
line to size the battery system. According to this 79 kW the maximum current
could be now calculated as a function of the voltage which, in turn, depends on
how many batteries are going to be used in a serial assembly.
5.2.3 INERTIA BATTERY SIZING
This process starts by selecting the battery module to be assembled in series to
create the desired IB. As stated on chapter 5.2.1 Lithium-ion batteries type will be
the choice and for this study purposes the compared one, the WB-LYP1000AHA lithium battery from Winston Battery ltd. will be selected.
Since the battery module is already selected then the number of them to be
connected in series is to be determined. The resulting assembly should meet the
following requirements,
a -Total capacity bigger than 538 kWh. As already calculated on chapter
5.1.3.3 a total of 439 kWh will be needed to charge the CB but this amount of
energy should be increased in order to consider the battery efficiency, 85%, and
the inverter efficiency, 96%.
b -Discharge capacity enough to provide the power, and so the current,
shown on Figure 32 to charge the CB.
100
15 16 17 18 19 20 21 22 23 24hours
79
kW
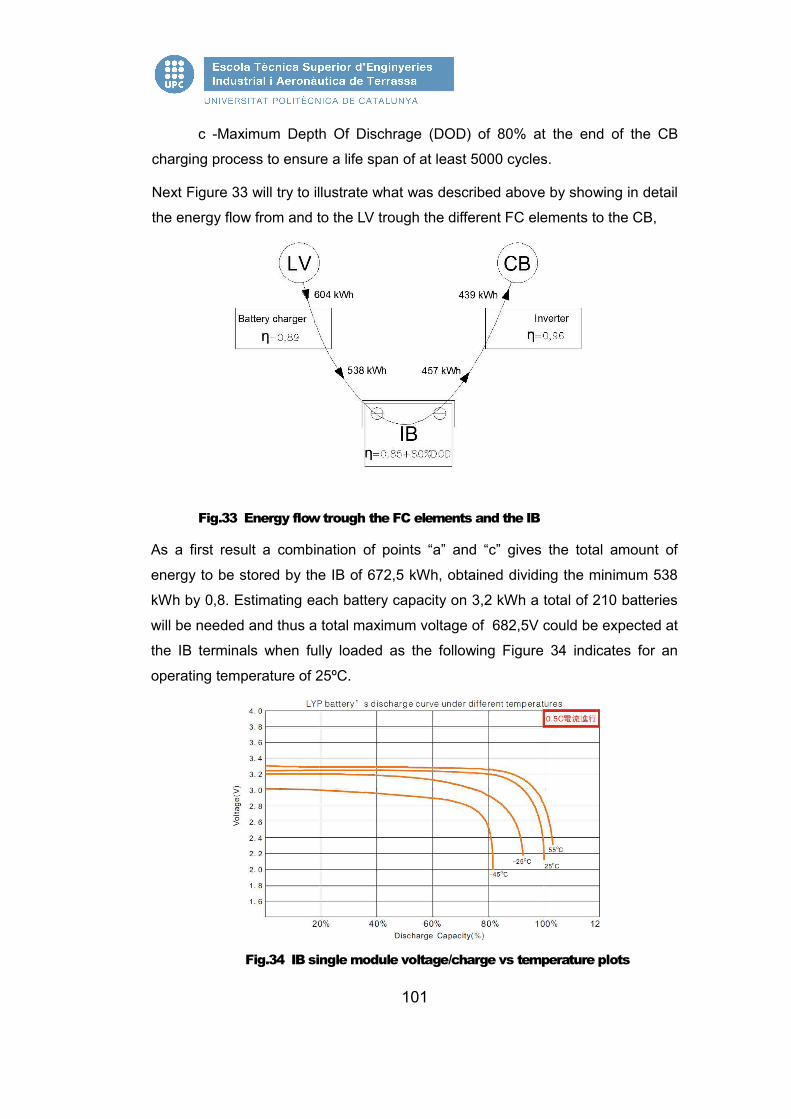
c -Maximum Depth Of Dischrage (DOD) of 80% at the end of the CB
charging process to ensure a life span of at least 5000 cycles.
Next Figure 33 will try to illustrate what was described above by showing in detail
the energy flow from and to the LV trough the different FC elements to the CB,
Fig.33 Energy flow trough the FC elements and the IB
As a first result a combination of points “a” and “c” gives the total amount of
energy to be stored by the IB of 672,5 kWh, obtained dividing the minimum 538
kWh by 0,8. Estimating each battery capacity on 3,2 kWh a total of 210 batteries
will be needed and thus a total maximum voltage of 682,5V could be expected at
the IB terminals when fully loaded as the following Figure 34 indicates for an
operating temperature of 25ºC.
Fig.34 IB single module voltage/charge vs temperature plots
101

Where 3,25V can be seen at battery full state and 3,2V with an 80% DOD. An
average could be extracted from these two values that gives a 3,225V during the
discharge process between the 0 and the 80% DOD. Applying it to our IB
assembly the averaged total voltage along the discharge process will be 677,5V
Now as the voltage and the required power, Figure 32, are known, the current
could be calculated resulting in a maximum of 117A. More in detail and derived
from Figure 32 next Figure 35 comes to show the current demand profile,
Fig.35 IB to CB current flow profile
Where the IB discharge is divided in three periods. Next is to confirm the time
duration of each discharge period according to the chosen battery, the calculated
current and the Peukert's coefficient.
-Period A. The current ramps up from zero to his maximum value in two
hours so an average constant current of 58,5A will be considered. According to
this current the Peukert's law gives to us the following,
t=Ah∗I−k=1000∗58,5−1,016=16hours
Here 16 hours are eight times bigger than the required 2 hours what
makes the desired discharge of Period A possible.
-Period B. The maximum current of 117A remains stable for a 3,5h hours
long period. In this case, in order to go with the Peukert's expression, it must be
considered that the battery already flowed out 117 Ah on Period A so Period B
will start from 883 Ah . The result this time is,
t=Ah∗I−k=883∗117−1,016=7hours
Here 7 hours are two times bigger than the required 3,5 hours what
102
15 16 17 18 19 20 21 22 23 24hours
117
A
58,5
periodA
periodB
periodC
Current drawn from the IB
makes the desired discharge of Period B possible.
-Period C. The current ramps down from his maximum value to zero in
two hours. so an average constant current of 58,5A will be considered. In this
case as in the previous one, in order to go with the Peukert's expression, it must
be considered that the battery already flowed out 117 Ah on Period A and 409,5
Ah on Period B so, in Period C will start from 473,5 Ah . The result this time is,
t=Ah∗I−k=473,5∗58,5−1,016=7,6hours
Here 7,6 hours are three times bigger than the required 2,5 hours what
makes the desired discharge of Period C possible.
As a main result of what was done in this chapter the IB should be composed of
a single serial arrangement of 210 units of the WB-LYP1000AHA Lithium battery
from Winston Battery ltd. As a secondary target the Inverter can now be selected
as it must fulfil two main items, maximum power bigger than 79 kW and
maximum voltage bigger than 682,5V. With these parameters a suitable inverter
could be the SIRIO K80, from AROS-SOLAR, that exhibits a maximum power of
88 kW and a maximum voltage of 800V, his brochure could be found on the
annex of this document.
5.2.4 INERTIA BATTERY CHARGING SYSTEM
To charge the 210 modules a 48V/150A automatic charger designed for Lithium
batteries will be the choice. It's the GWL/Power Charger 48V/150A from
GWL/Powergroup Technology Solutions whose data sheet could be found
on the annex of this study.
According to the nominal voltage of the charger a total of 14 chargers
feeding each one a section of 15 batteries must be installed. The structure
of the resulting system will be as shown in next Figure 36.
103

Fig. 36. Battery chargers arrangement
Where the battery chargers distribution could be verified. On the figure a switch “SW” is
placed between each set of 15 batteries in order to avoid short-circuits as all the battery
chargers work from the same AC source so, when a IB charge process starts, these
switchs open and isolate the battery series. This switch is considered as an ideal one with
no losses for this study purposes.
To finish describing the battery charger it must be said that his efficiency, 80%, has been
artificially increased to the 89% to follow what was written on chapter 3.2.2.2.
5.3 ECONOMIC VALUATION
Essentially the described countermeasure and their components valuation will be
the one that usually applies when it is about to deal with an investment on a
production item by using the pay-back method. In this sense the main elements
to consider will be,
-The countermeasure investment, including installation and
104
Battery charger #2
Battery charger #1
Battery charger #14
SW
SW
Battery #17 Battery #30
Battery #197Battery #196 Battery #210
Inverter
Inverter
Battery #1 Battery #2 Battery #15
Battery #16
commissioning.
-The economic performance, intended as the difference between the the
fuel savings and the electric expenses.
On this economic study no loan interests will be considered as the administration
probably would enable a soft-credit line giving a interest rate equal to the inflation
ratio in order to make it possible. More on this the administration will benefit from
the EV in many other ways as the healthcare system savings on lung and
another pollution related diseases.
5.3.1 COUNTERMEASURE INVESTMENT
At this point almost all the countermeasure components are already described
within the previous chapters and now its time to give to them their price.
Regarding this process the following assumptions should be stated,
-The CB chargers and metering devices are included on the EV's. On the
parking site only a 240V connection is existing. Signals from the CB charger to
the FC regulator could be drived trough the power line itself.
-The metering device of the FC system should behalf to the DSO and his
price is not included on the budget.
-The wiring and civil works are estimated ones to avoid considering a
particular parking layout which could not be essential for this study purposes.
-The labour is considered as only 15% of the total cost because this is not
a labour intensive project but equipment intensive due to the cost of the different
elements.
-The Lithium batteries price is assumed to be reduced in the following 15
years. It's because the scale economy, technology evolution and increased
demand that could not be priced today using the traditional net present value
(NPV), it's not a mature product. In this sense there's a study [60] from 2009 that
shows the following Figure 37 where a Lithium-ion batteries cost trend is
presented divided in three main scenarios,
105
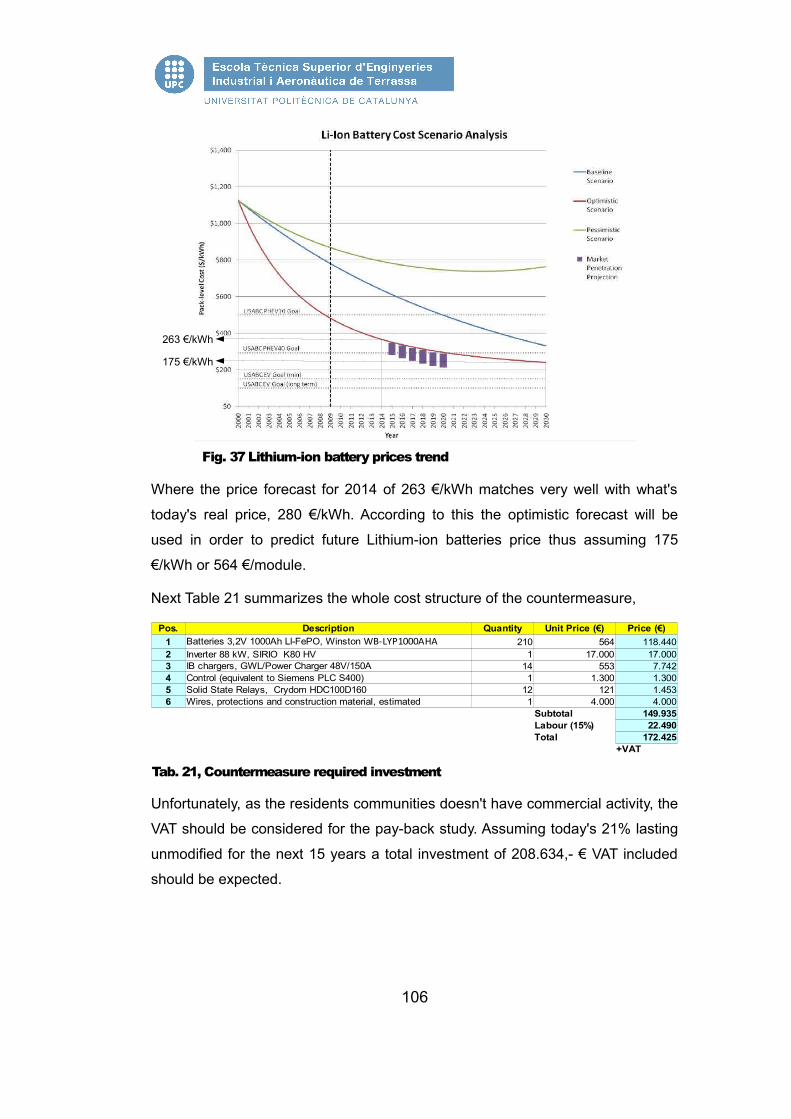
Fig. 37 Lithium-ion battery prices trend
Where the price forecast for 2014 of 263 €/kWh matches very well with what's
today's real price, 280 €/kWh. According to this the optimistic forecast will be
used in order to predict future Lithium-ion batteries price thus assuming 175
€/kWh or 564 €/module.
Next Table 21 summarizes the whole cost structure of the countermeasure,
Tab. 21, Countermeasure required investment
Unfortunately, as the residents communities doesn't have commercial activity, the
VAT should be considered for the pay-back study. Assuming today's 21% lasting
unmodified for the next 15 years a total investment of 208.634,- € VAT included
should be expected.
106
263 €/kWh
175 €/kWh
Pos.1 210 564 118.4402 1 17.000 17.0003 14 553 7.7424 1 1.300 1.3005 12 121 1.4536 1 4.000 4.000
149.93522.490
Total 172.425+VAT
Description Quantity Unit Price (€) Price (€)Batteries 3,2V 1000Ah LI-FePO, Winston WB-LYP1000AHA Inverter 88 kW, SIRIO K80 HVIB chargers, GWL/Power Charger 48V/150A Control (equivalent to Siemens PLC S400)Solid State Relays, Crydom HDC100D160Wires, protections and construction material, estimated
SubtotalLabour (15%)
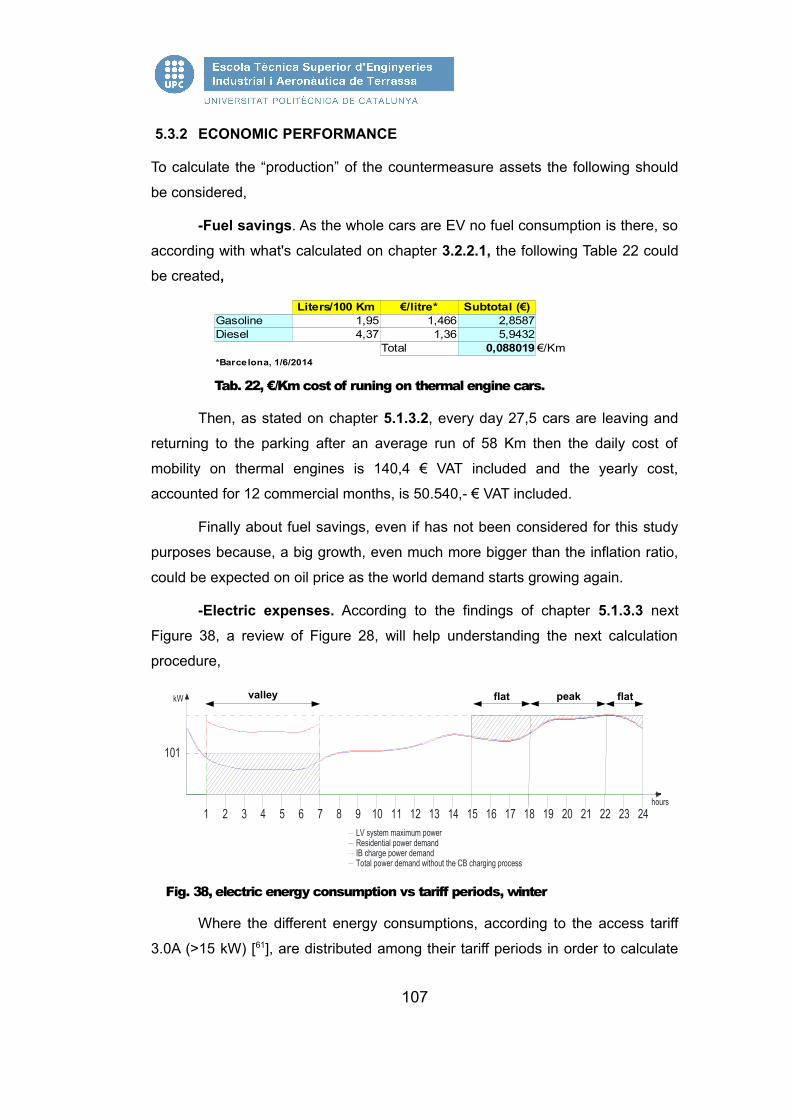
5.3.2 ECONOMIC PERFORMANCE
To calculate the “production” of the countermeasure assets the following should
be considered,
-Fuel savings. As the whole cars are EV no fuel consumption is there, so
according with what's calculated on chapter 3.2.2.1, the following Table 22 could
be created,
Tab. 22, €/Km cost of runing on thermal engine cars.
Then, as stated on chapter 5.1.3.2, every day 27,5 cars are leaving and
returning to the parking after an average run of 58 Km then the daily cost of
mobility on thermal engines is 140,4 € VAT included and the yearly cost,
accounted for 12 commercial months, is 50.540,- € VAT included.
Finally about fuel savings, even if has not been considered for this study
purposes because, a big growth, even much more bigger than the inflation ratio,
could be expected on oil price as the world demand starts growing again.
-Electric expenses. According to the findings of chapter 5.1.3.3 next
Figure 38, a review of Figure 28, will help understanding the next calculation
procedure,
Fig. 38, electric energy consumption vs tariff periods, winter
Where the different energy consumptions, according to the access tariff
3.0A (>15 kW) [61], are distributed among their tariff periods in order to calculate
107
101
IB charge power demandTotal power demand without the CB charging process
LV system maximum power
1 2 3 4 5 6 7 8 9 10 11 12 13 14 15 16 17 18 19 20 21 22 23 24
kW
hours
Residential power demand
Liters/100 Km €/litre* Subtotal (€)Gasoline 1,95 1,466 2,8587Diesel 4,37 1,36 5,9432
Total 0,088019 €/Km*Barcelona, 1/6/2014
valley peak flatflat
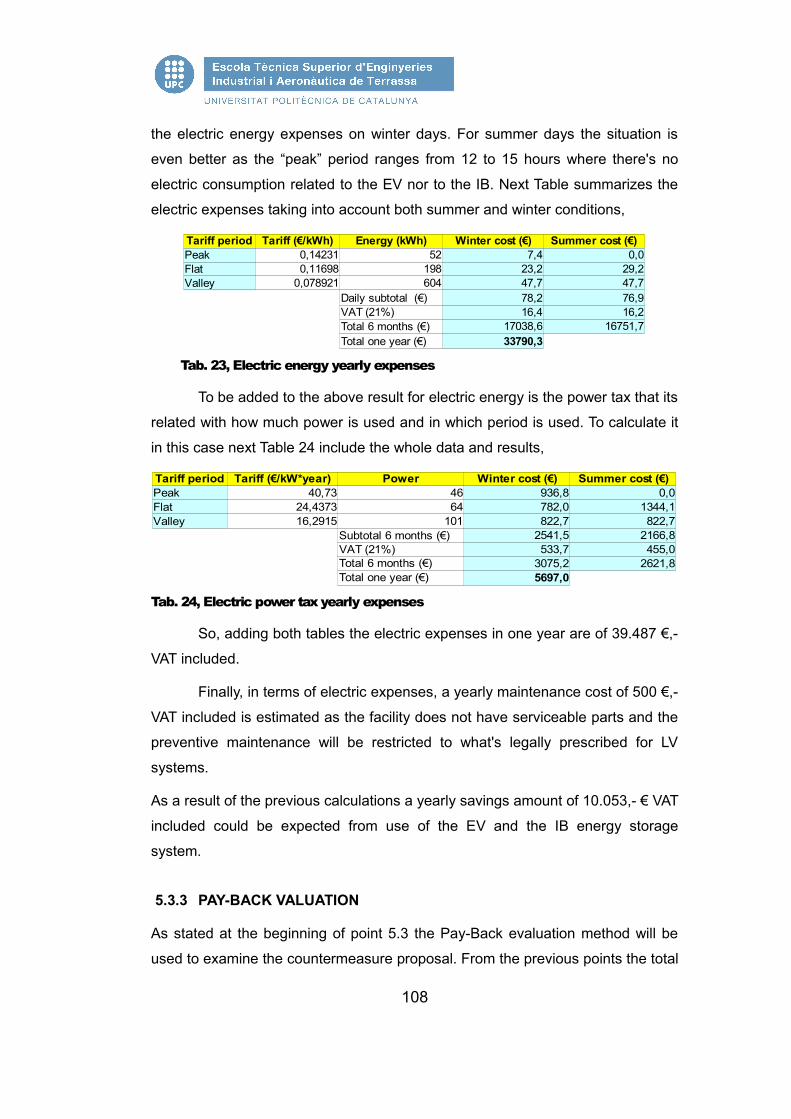
the electric energy expenses on winter days. For summer days the situation is
even better as the “peak” period ranges from 12 to 15 hours where there's no
electric consumption related to the EV nor to the IB. Next Table summarizes the
electric expenses taking into account both summer and winter conditions,
Tab. 23, Electric energy yearly expenses
To be added to the above result for electric energy is the power tax that its
related with how much power is used and in which period is used. To calculate it
in this case next Table 24 include the whole data and results,
Tab. 24, Electric power tax yearly expenses
So, adding both tables the electric expenses in one year are of 39.487 €,-
VAT included.
Finally, in terms of electric expenses, a yearly maintenance cost of 500 €,-
VAT included is estimated as the facility does not have serviceable parts and the
preventive maintenance will be restricted to what's legally prescribed for LV
systems.
As a result of the previous calculations a yearly savings amount of 10.053,- € VAT
included could be expected from use of the EV and the IB energy storage
system.
5.3.3 PAY-BACK VALUATION
As stated at the beginning of point 5.3 the Pay-Back evaluation method will be
used to examine the countermeasure proposal. From the previous points the total
108
0,14231 52 7,4 0,00,11698 198 23,2 29,2
0,078921 604 47,7 47,778,2 76,9
VAT (21%) 16,4 16,217038,6 16751,733790,3
Tariff period Tariff (€/kWh) Energy (kWh) Winter cost (€) Summer cost (€)PeakFlatValley
Daily subtotal (€)
Total 6 months (€)Total one year (€)
40,73 46 936,8 0,024,4373 64 782,0 1344,116,2915 101 822,7 822,7
2541,5 2166,8VAT (21%) 533,7 455,0
3075,2 2621,85697,0
Tariff period Tariff (€/kW*year) Power Winter cost (€) Summer cost (€)PeakFlatValley
Subtotal 6 months (€)
Total 6 months (€)Total one year (€)

investement and the yearly savings are already known and the required
evaluation could be done as next Table 25 shows,
Tab. 25, Pay-Back evaluation, original countermeasure
Where a period of almost 21 years is to be considered as a Pay-Back of the investment.
As the battery life span in 5000 cycles and considering one charge-discharge cycle per
day a 13,7 years will be the expectable life battery. The result is that the residents should
pay together, within the first 13,7 years, a yearly amount of 5175 €,- VAT included, which
in turn means adding 103 €/year to the pre-existing averaged fuel consumption.
If the above result is to be improved one attempt could be to increase a little the IB
capacity in order to completely avoid any EV related energy or power demand on “peak”
hours and to reduce the “flat” ones. To do so the easiest way is to add 30 modules to the
existing IB assembly in a new series of 16 batteries, with an extra charger, and to
increase the previous series size from 15 units to a 16. No other changes will be needed
as the Inverter maximum voltage is 800V, bigger than the new 780V series voltage In
economic terms the total cost will be increased in 24.313,-€ VAT included but the savings
will be also increased leaving the following result of Table 26.
Tab. 26, Pay-Back evaluation, improved countermeasure
Where now the difference is just of 1,9 years which in turns means that every resident
should pay 41 €/year more than the expectable expense on Gasoline or Diesel to get
their electric charging facility.
5.4 FUNCTION VALUATION
On point 4.1 the items to be fixed by the countermeasure where described and
now, with the countermeasure technically defined, is time to check for these
functionalities that are,
109
Pay-Back evaluationFacility cost (€) 208.635Yearly savings (€) 10.053Pay-Back (years) 20,8
Pay-Back evaluationFacility cost (€) 232.949Yearly savings (€) 14.976Pay-Back (years) 15,6
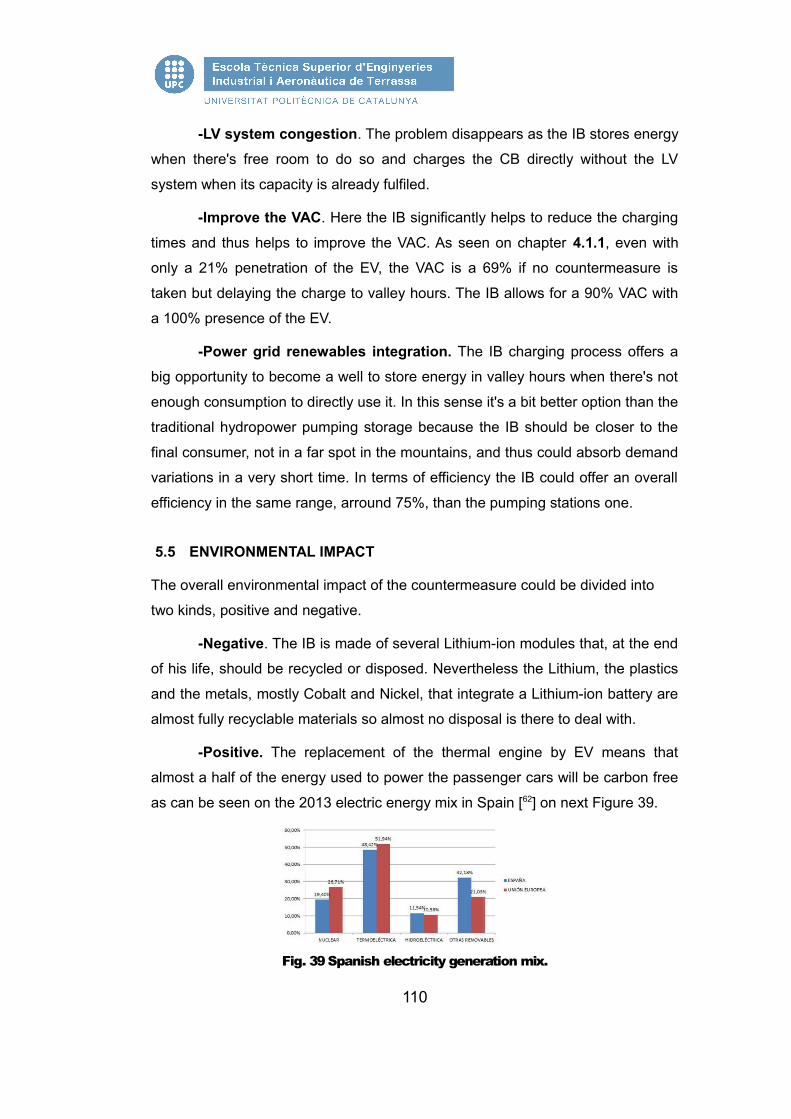
-LV system congestion. The problem disappears as the IB stores energy
when there's free room to do so and charges the CB directly without the LV
system when its capacity is already fulfiled.
-Improve the VAC. Here the IB significantly helps to reduce the charging
times and thus helps to improve the VAC. As seen on chapter 4.1.1, even with
only a 21% penetration of the EV, the VAC is a 69% if no countermeasure is
taken but delaying the charge to valley hours. The IB allows for a 90% VAC with
a 100% presence of the EV.
-Power grid renewables integration. The IB charging process offers a
big opportunity to become a well to store energy in valley hours when there's not
enough consumption to directly use it. In this sense it's a bit better option than the
traditional hydropower pumping storage because the IB should be closer to the
final consumer, not in a far spot in the mountains, and thus could absorb demand
variations in a very short time. In terms of efficiency the IB could offer an overall
efficiency in the same range, arround 75%, than the pumping stations one.
5.5 ENVIRONMENTAL IMPACT
The overall environmental impact of the countermeasure could be divided into
two kinds, positive and negative.
-Negative. The IB is made of several Lithium-ion modules that, at the end
of his life, should be recycled or disposed. Nevertheless the Lithium, the plastics
and the metals, mostly Cobalt and Nickel, that integrate a Lithium-ion battery are
almost fully recyclable materials so almost no disposal is there to deal with.
-Positive. The replacement of the thermal engine by EV means that
almost a half of the energy used to power the passenger cars will be carbon free
as can be seen on the 2013 electric energy mix in Spain [62] on next Figure 39.
Fig. 39 Spanish electricity generation mix.
110

Assuming thermal generation and transport electric efficiencies similar to those of the
cars engines the total CO2 emissions related to the passenger cars could be reduced
roughly around a 35%.
Especial mention should be posted when talking about the air quality in cities or nearby
high traffic density highways, where the expected improvement will be very high and
where only residential heating will remain as a source of combustion pollutants after a
100% introduction of the EV.
More on it this project, on the exploitation phase,
– The related facilities are all of them included inside of existing buildings so
they don't have any direct impact in any natural environment.
– There's are no any material flow inside/outside of the system son there's no
any natural resources need or pollutant emissions.
– There are no acoustic emissions.
– There are some thermal emissions related to the efficiency of the
equipments. These account for a total of 165 kWh/day and are equivalent to
those of a single flat air conditioning equipment.
5.6 COUNTERMEASURE PLANNING
If this study countermeasure is to be applied there are some important phases to cover
from today to a future where a real system able to deploy the whole required
functionalities is existing . As a guide next Figure 40 shows what will be the steps to walk
forward.
Fig. 40 Countermeasure development timeline
Where the phase durations are estimated from the experience of the author in complex
projects development and assuming enough founding with distinct, closely related teams
as software engineers, electronic engineers, electric engineers and so on. In any case it
111

could be defined a bit more in detail with a WBS that is out of this study purposes.
Nevertheless what comes clear from it is that the challenge ahead is not small so time
and resources should be dedicated to it if some achievement is to be reached.
112
1 “Toward a smart grid”, S.Massoud Amin, Bruce Wollenberg, IEEE power &
energy magazine, September/October 2005.
2 “The Smart Grid: An Introduction”, US Department Of Energy, 2008.
3 ”Design and Simulation of V2G Bidirectional Inverter and DC-DC Converter”,
Allan Agatep and Mason Ung, California Polytechnic State University, fall/winter
2011.
4 “Transportation Electrification in New York State”, Nyserda, June 2011.
5 “EU Commission Task Force for Smart Grids, Expert Group 1:Functionalities of
smart grids and smart meters”, European Commission, december 2010.
6 “Modelling Load Shifting Using Electric Vehicles in a Smart Grid Environment”,
© OECD/IEA 2010.
7 ”SmartGrids SRA 2035 Strategic Research Agenda”, European Platform
SmartGrids, March 2012.
8 “Standarisation mandate to CEN, CENELEC and ETSI concerning the
charging of electric vehicles”, European Comission, June 2010.
9 “Informe de gobierno corporativo 2012”, Red Eléctrica de España, April 2013.
10 “An expert system for contingency analysis in transmission networks”, ©
1990 IEEE
11 “Final implementation of SEACON: new scope and new open system
platform.”, IEEE Transactions on Power Systems, Vol. 13, No. 3, August 1998.
12 ”CECOEL, Centro de control eléctrico”, REE, 2013.
13 “Desarrollo de las redes de transporte”, Ministerio de Industria, Turismo y
Comercio, may 2008.
14 Order ITC/2370/2007, July 26.
15 ”Comments to ENTSO-E Draft Load Frequency Control & Reserves Network
Code”, ENDSO, April 2013.
16 “El ministro Soria acompaña a S.A.R. el Príncipe en el acto de inauguración
del proyecto de movilidad eléctrica "Zem2All", Ministerio de Industria, Turismo y
Comercio, Gobierno de España, April 2013.
17 http://www.enel.com/enGB/innovation/project_technology/zero_emission_life/
smart_networks/smart_meters.aspx, on September 2013
18 http://www.endesasmartgrids.com/index.php/en/smart-homes/smart-metering,
on September 2013
19 http://www.bp.com/en/global/corporate/press/bp-magazine/issue-one-

2012/tech talk.html , BP Magazine, issue 1 2012, tech talk.
20 ”REGULATION (EC) No 443/2009 OF THE EUROPEAN PARLIAMENT AND
OF THE COUNCIL”, European Parliament, April 2009.
21 ”Monitoring the CO2 emissions from new passenger cars in the EU: data for
2009”, European Commission, November 2010.
22 “Directive 2009/33/EC of 23 April 2009 on the promotion of clean and energy-
efficient road transport vehicles.”, EU April 2009.
23 ”Driving and parking patterns of European car drivers, a mobility survey.”, EU
JRC, 2012.
24 ”Projections for Electric Vehicle Load Profiles in Europe Based on Travel
Survey Data”. EU JRC, 2012.
25 ”Attitude of European car drivers towards electric vehicles: a survey”. EU
JRC, 2012.
26 “A temporal assessment of vehicle use patterns and their impact on the
provision of vehicle-to-grid services.”, Chioke B Harris and Michael E Webber,
University of Texas at Austin, September 2012.
27 “Paving the way to electrified road transport”. EU JRC, 2013.
28 “Powering autos in 2020”. Boston Consulting Group, July 2011.
29 “Parque de vehículos”. ANFAC, July 2013.
30 “Demography report 2010”, Eurostat, 2010.
31 “Transport. General and regional statistics”, Eurostat, 2010.
32 http://www.ine.es/jaxi/tabla.do , Instituto Nacional de Estadística.
33 “Impacts of electric vehicles-Summary report”, EC by ICF, April 2011.
34“Memoria annual 2012”, ANFAC, 2013.
35“Nota de prensa”, ANFAC, November 4th 2013.
36 http://www.autopista.es/noticias-motor/articulo/consumo-real-coches-
49700.htm
37“Biomass Data Book”, US DOE, 2011.
38“Thermal efficiency of engines”, Japan Society of Mechanical Engineers, 2008.
39 “Integrated Electric Traction System (INTETS)”, UQM, 2003.
40 “Nanophosphate® Basics: An Overview...”, A123 Systems, Inc., 2012.
41 “Analysis of the key factors affecting the energy efficiency of batteries in
electric vehicle ”, Harbin Institute of Technology,2010.
42 “2012 APPLIANCE EFFICIENCY REGULATIONS”, California Energy
Comission, 2012.
43 http://epp.eurostat.ec.europa.eu/statistics_explained/index.php/Housing_cond
itions
44 “Reglamento Electrotécnico de Baja Tensión, RD 842/2002”, Spanish Ministry
of Industry, 2002.
45 “Guia de consumo inteligente”, REE, November 2010.
46 http://www.amb.cat/s/web/area-metropolitana/dades-
estadistiques/economia.html
47 “Sector 17:Aragón, Cataluña, Comunidad Valenciana y ampliación
Barcelona”, REE, 2013.
48 http://www.amb.cat/web/area-metropolitana/coneixer-l-area-
metropolitana/localitzacio-i-usos-del-sol
49h ttp://www.amb.cat/s/web/area-metropolitana/coneixer-l-area-
metropolitana/poblacio.html
50 http://www.idescat.cat/emex/?id=081878
51 http://www.idescat.cat/emex/?id=082798
52 http://www.idescat.cat/emex/?id=083054
53 http://www.idescat.cat/emex/?id=080961
54 http://www.idescat.cat/emex/?id=083073
55 http://www.idescat.cat/emex/?id=081213
56 “Avance informe sistema eléctrico 2013”, REE, 2013.
57 “Anuario estadístico de España 2012, demografía”, INE.
58 Codigo Tècnico de la Edificación, RD 314/2006, Mars 2006.
59 “A comparative study Lithium-ion batteries”; Oswal, Paul & Zhao, University of
South California, 2010.
60 “AN EVALUATION OF CURRENT AND FUTURE COSTS FOR LITHIUM-ION
BATTERIES FOR USE IN ELECTRIFIED VEHICLE POWERTRAINS”;
Anderson, Duke University.
61 “Orden IET/107/2014”, Spanish Ministry of Industry, January 2014.
62 http://www.invertia.com/noticias/mapa-energetico-europa-espana-renovable-
nuclear-2858660.htm

ANNEXDATASHEETS AND BROCHURES


for Renewable Energy / Hybrid Systems / Backup Power Applications
IND
17-6V_TRJN_ D
S_0214
IND17-6V DATA SHEET
INDUSTRIAL LINE
Page 1 of 2
MODEL: IND17-6V
DIMENSIONS: inches (mm)
BATTERY: Flooded/wet lead-acid battery
COLOR: Maroon (case/cover)
MATERIAL: Polypropylene (internal cell container) Polyethylene (outer container)
CAPACITY AMP-HOURS (AH)Cutoff Voltage 5-Hr 10-Hr 20-Hr 48-Hr 72-Hr 100-Hr 240-Hr
1.75 vpc 727 820 925 1085 1156 1202 1205
1.80 vpc 655 771 888 1057 1128 1172 1175
1.85 vpc 594 700 816 945 1029 1104 1106
1.90 vpc 434 561 680 790 874 981 983
PRODUCT SPECIFICATIONS
BCIGROUP
SIZETYPE
CAPACITY A Amp-Hours (AH) ENERGY(kWh)
VOLTAGE TERMINAL Type D
DIMENSIONS B Inches (mm) WEIGHT lbs. (kg)5-Hr
Rate10-Hr Rate
20-Hr Rate
48-Hr Rate
72-Hr Rate
100-Hr Rate
240-Hr Rate
100-Hr Rate Length Width Height C
INDUSTRIAL LINE - DEEP-CYCLE FLOODED BATTERIESN/A IND17-6V 727 820 925 1085 1156 1202 1205 7.21 6 VOLT 14 27.21 (691) 10.38 (264) 23.73 (603) 415 (188)
Made in the USA
Now Available With
CHARGING INSTRUCTIONSCHARGER VOLTAGE SETTINGS (AT 77°F/25°C)
Voltage per cell
Absorption charge 2.35-2.45
Float charge 2.20
Equalize charge 2.58
Do not install or charge batteries in a sealed or non-ventilated compartment. Constant under or overcharging will damage the battery and shorten its life as with any battery.
CHARGING TEMPERATURE COMPENSATIONTo the Voltage Reading -- Subtract 0.005 volt per cell (VPC) for every 1°C above 25°C or add 0.005 volt per cell for every 1°C below 25°C.
EXPECTED LIFE VS. TEMPERATUREChemical reactions internal to the battery are driven by voltage and temperature. The higher the battery temperature, the faster chemical reactions will occur. While higher temperatures can provide improved discharge performance the increased rate of chemical reactions will result in a corresponding loss of battery life. As a rule of thumb, for every 10°C increase in temperature the reaction rate doubles. Thus, a month of operation at 35°C is equivalent in battery life to two months at 25°C. Heat is an enemy of all lead acid batteries, FLA, GEL, and AGM alike and even small increases in temperature will have a major influence on battery life.
OPERATIONAL DATAOperating Temperature Specific Gravity
-4°F to 113°F (-20°C to +45°C). At temperatures below 32°F (0°C) maintain a state of charge greater than 70%.
The specific gravity at 100% state-of-charge is 1.260
SMART CARBON™
Deep-cycle batteries used in off-grid and unstable grid applications are heavily cycled at partial state of charge (PSOC). Operating at PSOC on a regular basis can quickly diminish the overall life of a battery, which results in frequent and costly battery replacements.
To address the impact of PSOC on deep-cycle batteries in renewable energy (RE), inverter backup and telecom applications, Trojan Battery has now included Smart Carbon™ as a standard feature in its Industrial and Premium flooded battery lines.
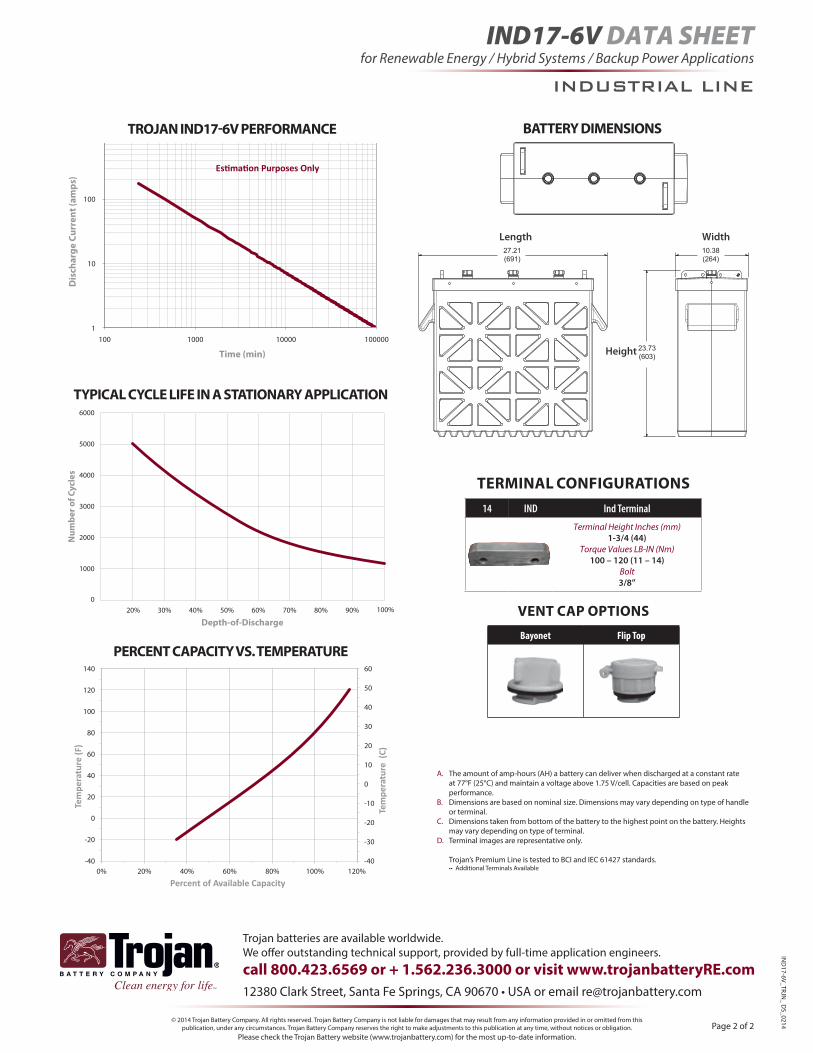
for Renewable Energy / Hybrid Systems / Backup Power Applications
IND
17-6V_TRJN_ D
S_0214
IND17-6V DATA SHEET
INDUSTRIAL LINE
Page 2 of 2
call 800.423.6569 or + 1.562.236.3000 or visit www.trojanbatteryRE.com12380 Clark Street, Santa Fe Springs, CA 90670 • USA or email [email protected]
Trojan batteries are available worldwide.We offer outstanding technical support, provided by full-time application engineers.
© 2014 Trojan Battery Company. All rights reserved. Trojan Battery Company is not liable for damages that may result from any information provided in or omitted from this publication, under any circumstances. Trojan Battery Company reserves the right to make adjustments to this publication at any time, without notices or obligation.
Please check the Trojan Battery website (www.trojanbattery.com) for the most up-to-date information.
27.21(691)
23.73(603)
10.38(264)
Length Width
Height
BATTERY DIMENSIONS TROJAN IND17-6V PERFORMANCE
1
10
100
1000
100 1000 10000 100000
Dis
char
ge C
urre
nt (a
mps
)
Time (min)
Estimation Purposes Only
PERCENT CAPACITY VS. TEMPERATURE
60%40%20%0% 80% 100% 120%
140
120
100
80
60
40
20
-20
-40
50
60
40
30
20
10
-10
-20
-30
-40
0
0
TYPICAL CYCLE LIFE IN A STATIONARY APPLICATION
20% 30%
Depth-of-Discharge40% 50% 60% 70% 80% 90% 100%
Num
ber o
f Cyc
les
0
3000
6000
5000
2000
1000
4000
14 IND Ind Terminal
Terminal Height Inches (mm)1-3/4 (44)
Torque Values LB-IN (Nm)100 – 120 (11 – 14)
Bolt3/8”
TERMINAL CONFIGURATIONS
VENT CAP OPTIONS
Bayonet Flip Top
A. The amount of amp-hours (AH) a battery can deliver when discharged at a constant rate at 77°F (25°C) and maintain a voltage above 1.75 V/cell. Capacities are based on peak performance.
B. Dimensions are based on nominal size. Dimensions may vary depending on type of handle or terminal.
C. Dimensions taken from bottom of the battery to the highest point on the battery. Heights may vary depending on type of terminal.
D. Terminal images are representative only.
Trojan’s Premium Line is tested to BCI and IEC 61427 standards. •• Additional Terminals Available
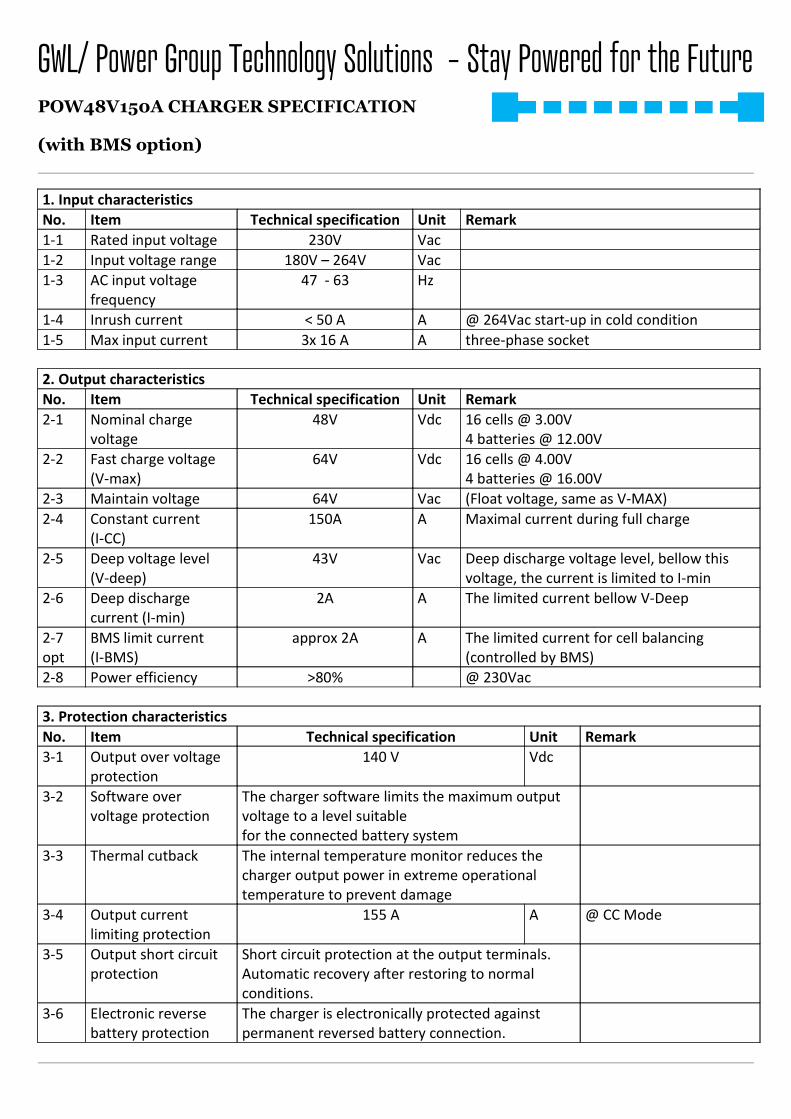
GWL/ Power Group Technology Solutions – Stay Powered for the FuturePOW48V150A CHARGER SPECIFICATION
(with BMS option)
1. Input characteristics
No. Item Technical specification Unit Remark
1-1 Rated input voltage 230V Vac
1-2 Input voltage range 180V – 264V Vac
1-3 AC input voltage
frequency
47 - 63 Hz
1-4 Inrush current < 50 A A @ 264Vac start-up in cold condition
1-5 Max input current 3x 16 A A three-phase socket
2. Output characteristics
No. Item Technical specification Unit Remark
2-1 Nominal charge
voltage
48V Vdc 16 cells @ 3.00V
4 batteries @ 12.00V
2-2 Fast charge voltage
(V-max)
64V Vdc 16 cells @ 4.00V
4 batteries @ 16.00V
2-3 Maintain voltage 64V Vac (Float voltage, same as V-MAX)
2-4 Constant current
(I-CC)
150A A Maximal current during full charge
2-5 Deep voltage level
(V-deep)
43V Vac Deep discharge voltage level, bellow this
voltage, the current is limited to I-min
2-6 Deep discharge
current (I-min)
2A A The limited current bellow V-Deep
2-7
opt
BMS limit current
(I-BMS)
approx 2A A The limited current for cell balancing
(controlled by BMS)
2-8 Power efficiency >80% @ 230Vac
3. Protection characteristics
No. Item Technical specification Unit Remark
3-1 Output over voltage
protection
140 V Vdc
3-2 Software over
voltage protection
The charger software limits the maximum output
voltage to a level suitable
for the connected battery system
3-3 Thermal cutback The internal temperature monitor reduces the
charger output power in extreme operational
temperature to prevent damage
3-4 Output current
limiting protection
155 A A @ CC Mode
3-5 Output short circuit
protection
Short circuit protection at the output terminals.
Automatic recovery after restoring to normal
conditions.
3-6 Electronic reverse
battery protection
The charger is electronically protected against
permanent reversed battery connection.

4. Charge indicator (LED)
No. Item Technical specification Unit Remark
4-1 Deep charging LED flashing (slow)
4-2 Fast charging LED flashing (fast)
4-3 Complete charge LED on
4-4 Voltage indicator LED display V Not calibrated measuring,
indication only4-5 Current indicator LED display A
5. Safety & EMC (CE Conformity Requirements)
No. Item Technical specification Unit Remark
5-1 Electric strength test
input – output
1500 V / 10 mA /1 minute Vac No breakdown
5-2 Isolation resistance > 10 MOhm @ 500 Vdc MOhm Input – ground (GND)
5-3 Isolation resistance > 10 MOhm @ 500 Vdc MOhm Output – ground (GND)
5-4 Leakage current < 3.5 mA A Vin = 264Vac, 50-60 Hz
5-5 Safety EU standards for
small electrical appliances
CE MARK
5-6 EMC – RE Class B EN55014
5-7 EMC – CE Class B EN55014
5-8 EMC – air discharge Level 3 EN61000-4-2 (dis. B)
5-9 EMC – contact discharge Level 3 EN61000-4-2 (dis. B)
5-10 EMC – RS Level 3 EN61000-4-6 (dis. A)
5-11 EMC – CS Level 3 EN61000-4-3 (dis. A)
5-10 EMC – EFT Level 3 EN61000-4-4 (dis. B)
5-10 EMC – Surge Level 3 EN61000-4-5 (dis. A)
1 kV, 2 kV (dis. B)
6. Environmental test requirements
No. Item Technical specification Unit Remark
6-1 High ambient operating
temperature
+40 °C deg C continuous operation
6-2 Low ambient operating
temperature
-10 °C deg C continuous operation
6-3 Highest storage
temperature
+70 °C deg C allow 2 hours to recover
to normal temperature
6-4 Lowest storage
temperature
-40 °C deg C allow 2 hours to recover
to normal temperature
6-5 Drop shock 40 g peak EN60068-2-32:1993

7. Charging curve (current A – red, voltage V - blue)
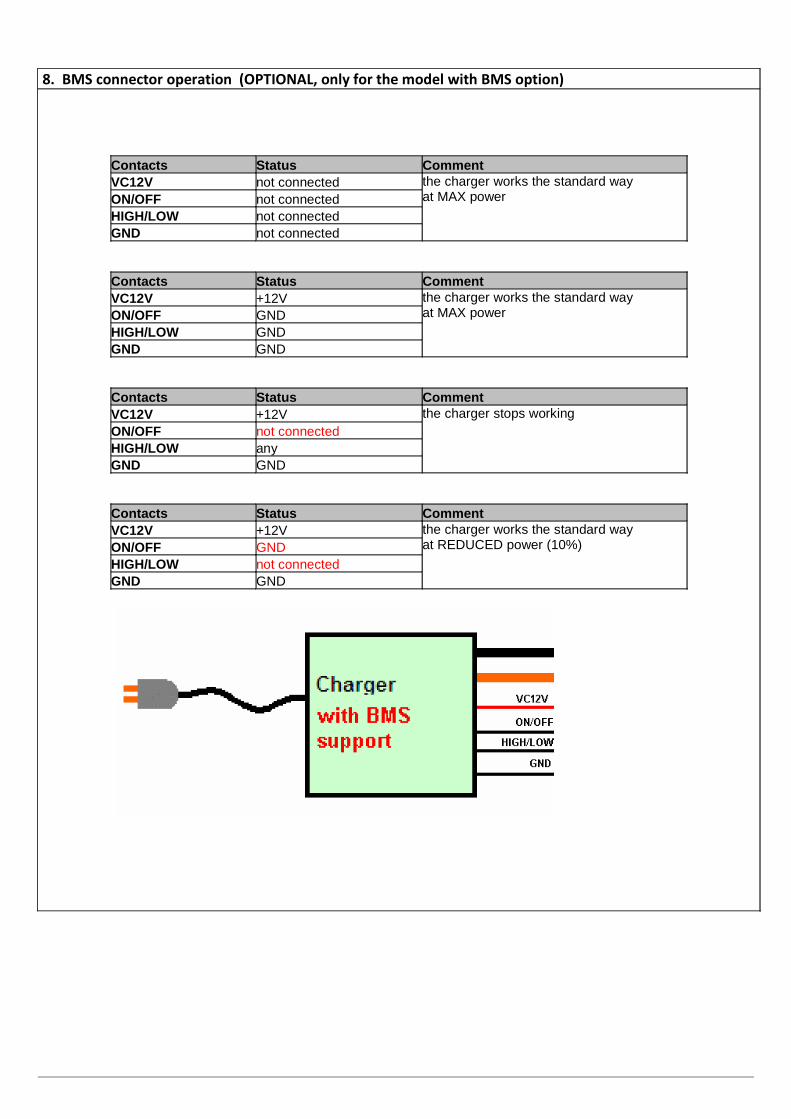
8. BMS connector operation (OPTIONAL, only for the model with BMS option)
Contacts Status CommentVC12V not connected the charger works the standard way
at MAX powerON/OFF not connectedHIGH/LOW not connectedGND not connected
Contacts Status CommentVC12V +12V the charger works the standard way
at MAX powerON/OFF GNDHIGH/LOW GNDGND GND
Contacts Status CommentVC12V +12V the charger stops workingON/OFF not connectedHIGH/LOW any GND GND
Contacts Status CommentVC12V +12V the charger works the standard way
at REDUCED power (10%)ON/OFF GNDHIGH/LOW not connectedGND GND

9. Product photos A
(The delivered product may differ from the image)
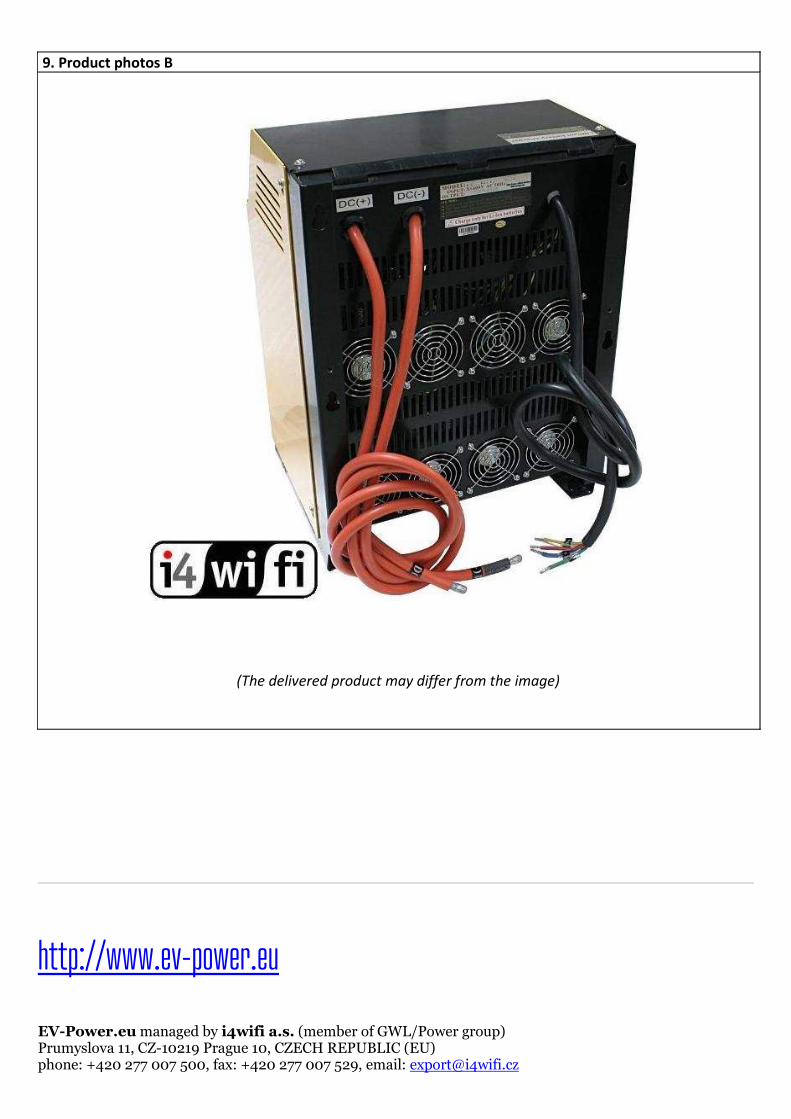
9. Product photos B
(The delivered product may differ from the image)
http://www.ev-power.eu EV-Power.eu managed by i4wifi a.s. (member of GWL/Power group) Prumyslova 11, CZ-10219 Prague 10, CZECH REPUBLIC (EU) phone: +420 277 007 500, fax: +420 277 007 529, email: [email protected]
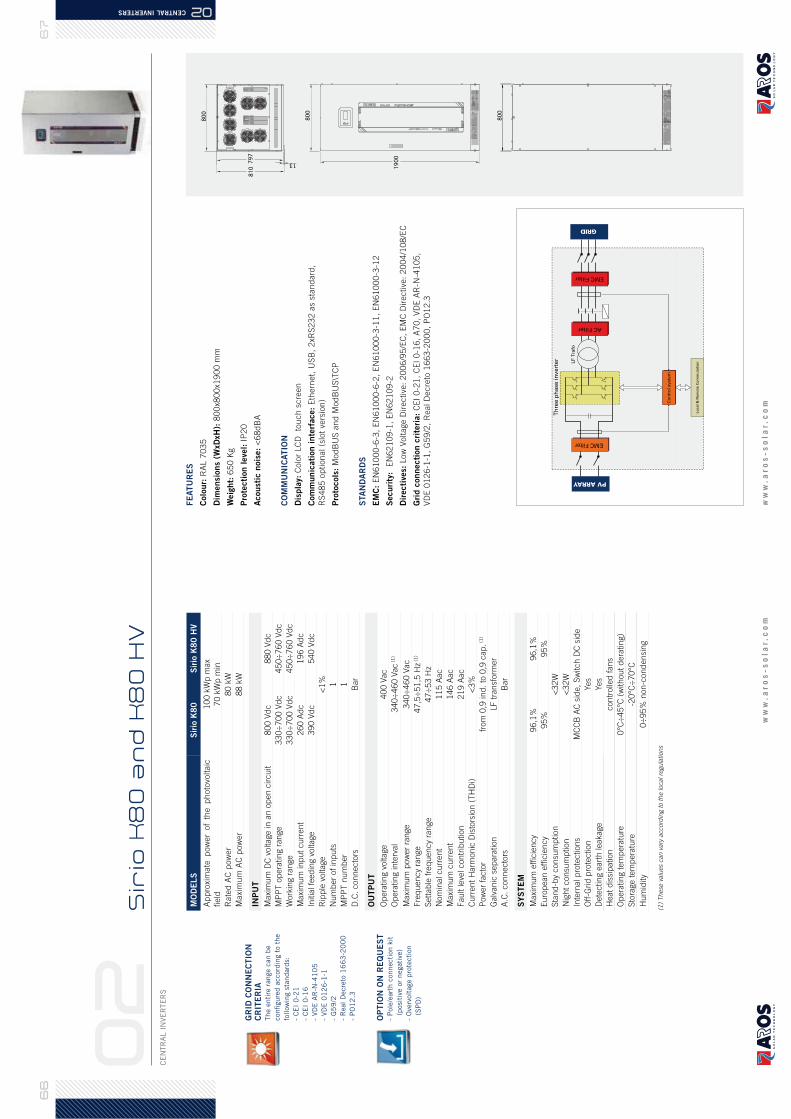
www.aros-solar.com
CE
NTR
AL I
NVE
RTE
RS
www.aros-solar.com
CENTRAL INVERTERS
GRID
FE
ATU
RE
S
Colo
ur:
RA
L 7
03
5
Dim
ensi
ons
(WxD
xH):
80
0x8
00
x1
90
0 m
m
Weig
ht:
65
0 K
g
Pro
tecti
on l
eve
l: I
P2
0
Acoust
ic n
ois
e:
<6
8d
BA
CO
MM
UN
ICATIO
N
Dis
pla
y: C
olo
r LC
D
tou
ch
scre
en
Com
munic
ati
on i
nte
rface:
Eth
ern
et,
US
B,
2xR
S2
32
as s
tan
dard
,
RS
48
5 o
ption
al (s
lot
vers
ion
)
Pro
tocols
: M
od
BU
S a
nd
Mod
BU
S\T
CP
STA
ND
AR
DS
EM
C:
EN
61
00
0-6
-3,
EN
61
00
0-6
-2,
EN
61
00
0-3
-11
, E
N6
10
00
-3-1
2
Securi
ty:
EN
62
10
9-1
, E
N6
21
09
-2
Dir
ecti
ves:
Low
Voltage D
irective:
20
06
/95
/EC
, E
MC
Dir
ective:
20
04
/10
8/E
C
Gri
d c
onnecti
on c
rite
ria:
CE
I 0
-21
, C
EI
0-1
6,
A7
0,
VD
E A
R-N
-41
05
,
VD
E 0
12
6-1
-1,
G5
9/2
, R
eal D
ecre
to 1
66
3-2
00
0,
PO
12
.3
MO
DE
LS
Sir
io K
80
Sir
io K
80
HV
Ap
pro
xim
ate
p
ow
er
of
the p
hoto
voltaic
field
10
0 k
Wp
max
70
kW
p m
in
Rate
d A
C p
ow
er
80
kW
Maxim
um
AC
pow
er
88
kW
INP
UT
Maxi
mu
m D
C v
oltage in
an
op
en
circu
it8
00
Vd
c8
80
Vd
c
MP
PT
op
era
tin
g r
an
ge
33
0÷
70
0 V
dc
45
0÷
76
0 V
dc
Work
ing r
an
ge
33
0÷
70
0 V
dc
45
0÷
76
0 V
dc
Maxi
mu
m in
pu
t cu
rren
t2
60
Ad
c1
96
Ad
c
Initia
l fe
ed
ing v
oltage
39
0 V
dc
54
0 V
dc
Rip
ple
voltage
<1
%
Nu
mb
er
of
inp
uts
1
MP
PT
nu
mb
er
1
D.C
. con
necto
rsB
ar
OU
TP
UT
Op
era
tin
g v
oltage
40
0 V
ac
Op
era
tin
g in
terv
al
34
0÷
46
0 V
ac
(1)
Maxi
mu
m p
ow
er
ran
ge
34
0÷
46
0 V
ac
Fre
qu
en
cy
ran
ge
47
,5÷
51
,5 H
z (1)
Sett
ab
le f
req
uen
cy
ran
ge
47
÷5
3 H
z
Nom
inal cu
rren
t1
15
Aac
Maxi
mu
m c
urr
en
t1
46
Aac
Fau
lt leve
l con
trib
ution
21
9 A
ac
Cu
rren
t H
arm
on
ic D
isto
rsio
n (
TH
Di)
<3
%
Pow
er
facto
rfr
om
0,9
in
d.
to 0
,9 c
ap
. (1)
Galv
an
ic s
ep
ara
tion
LF
tra
nsf
orm
er
A.C
. con
necto
rsB
ar
SYS
TE
M
Maxi
mu
m e
fficie
ncy
96
,1%
96
,1%
Eu
rop
ean
effi
cie
ncy
95
%9
5%
Sta
nd
-by
con
sum
ption
<3
2W
Nig
ht
con
sum
ption
<3
2W
Inte
rnal p
rote
ction
sM
CC
B A
C s
ide,
Sw
itch
DC
sid
e
Off
-Grid
pro
tection
Yes
Dete
ctin
g e
art
h leakage
Yes
Heat
dis
sip
ation
con
trolle
d f
an
s
Op
era
tin
g t
em
pera
ture
0°C
÷4
5°C
(w
ith
ou
t d
era
tin
g)
Sto
rage t
em
pera
ture
-20
°C÷
70
°C
Hu
mid
ity
0÷
95
% n
on
-con
den
sin
g
1900
800
800
800
797
13
810
GR
ID C
ON
NE
CTIO
N
CR
ITE
RIA
The e
nti
re r
ange c
an b
e
configure
d a
ccord
ing t
o t
he
follow
ing s
tandard
s:
- C
EI
0-2
1
- C
EI
0-1
6
- VD
E A
R-N
-41
05
- VD
E 0
12
6-1
-1
- G
59
/2
- R
eal
Decre
to 1
66
3-2
00
0
- P
O1
2.3
OP
TIO
N O
N R
EQ
UE
ST
- P
ole
/eart
h c
onnecti
on k
it
(posi
tive
or
negati
ve)
- O
verv
olt
age p
rote
cti
on
(SP
D)
(1)
These
valu
es
can v
ary
accord
ing to the local re
gula
tions