study of the exhaust gases from different fuel based ... · pdf filestudy of the exhaust gases...
TRANSCRIPT

Control of Urban Pollution Series: CUPS/ / 2010-11
Study of the Exhaust Gases from different fuel
based vehicles for Carbonyls and Methane
Emissions
Central Pollution Control Board
(Ministry of Environment & Forests) Website: cpcb.nic.in; email: [email protected]
(November, 2010)
CVS
CVS –Constant Volume Sampler

Control of Urban Pollution Series: CUPS/ / 20010-11
Study of the Exhaust Gases from different fuel
based vehicles for Carbonyls and Methane
Emissions
Central Pollution Control Board (Ministry of Environment & Forests)
Website: cpcb.nic.in; email: [email protected] (November, 2010)

FOREWORD
Air Pollution is caused by a number of pollutants emanated from various sources. Under
sound air pollution control strategy the detailed analysis and assessment of all the
pollutants having detrimental effects on human health and environment is required.
Modern Research and Development (R&D) initiatives lead to addition of new air pollutants
which require standards formulation for their regulatory control.
Vehicular emissions are one of the predominant sources of carbonyls in the ambient air.
Recently Carbonyls consisting of aldehydes and ketones have been identified as precursors
of severe secondary pollutants and themselves also are harmful, thus needs detailed study.
The Central Pollution Control Board has undertaken a project on, Assessment and
characterization of aldehyde, ketone and methane emissions in vehicle exhaust using
different fuels with the help of International Centre of Automotive Technology (ICAT)
Manesar.
The project envisaged evaluation and characterization of aldehydes, ketones and methane
emissions from different vehicle category exhausts using different fuels.
The assistance extended by ICAT Scientists for conducting the study is gratefully
acknowledged. Thankful acknowledgement for Ms. Meetu Puri JSA, Sh. R. C. Saxena Scientist
‘D’ and Dr. R. S. Mahwar Scientist ‘E’ for preparing the document under the supervision of
Sh. J. S. Kamyotra Member Secretary.
I hope, that this document will be useful to the Regulatory Authorities, Policy makers and all
the concerned for controlling vehicular emissions.
November, 2010 (S. P. Gautam)

CONTENTS
1. INTRODUCTION10
1.1 ________________________________________________________________ Preamble
1.2 ______________________________________________________ Objective of the work
1.3 _________________________________________________________ Scope of the work
2. LITERATURE REVIEW
2.1. _________________________________ Formation and release of carbonyls and methane
2.1.1 ___________________________________________________________ Overall Process
2.2 __________________________________________ Process chemistry release/mechanism
2.2.1 _______________________________________________ Aldehyde and Ketoneformation
2.2.2 _________________________________________________________ Methane formation 2.2.3 Carbonyl emission
2.2.4 Methane emission
2.3 Properties of Aldehydes, Ketones and Methane
2.4 Health effects of Aldehydes
3. METHODOLOGY
3.1 ____________________________________________________________ Vehicle selection
3.2. ______________________________________________________________ Vehicle Testing
3.2.1 ______________________________ Inertia Setting For Different Categories of Vehicles
3.3 ___________________________________________ Test procedure and equipment details
3.3.1. __________________________________________________________ Test Conditions
3.3.1.1 _______________________________________________ Mass emission Calculations
3.3.2 __________________________________________ Exhaust methane gas measurement: 3.3.2.1 _____________________________________________ Measuring system (FID 4000): 3.3.2.2 ___________________________________________________ Method of Operation: 3.3.3. ______________________________ High-performance liquid chromatography analysis
3.3.3.1 _____________________________________________________ Theory of operation
3.3.3.2 Quality Control of HPLC analysis
4. RESULTS
4.1 _______________________________________ Carbonyl emission (2W,3W,4W,LCV &HCV)
4.1.1 ______________________________________________________________ Two wheelers
4.1.2 ___________________________________________________________ Three wheelers
4.1.3 _______________________________________________ Four wheeler passenger cars
4.1.4 _____________________________ Light Commercial Vehicle (LCV): (Tested on engines) 4.1.5 ___________________________ Heavy Commercial Vehicles (HCV): (Tested on engines)
4.2 _______________________________________ Methane emission (2W,3W,4W,LCV &HCV)
4.3 __________________________________ Formaldehyde emission (2W,3W,4W,LCV &HCV)
5. DISCUSSIONS
5.1 __________________________________________________________ Carbonyl emissions
5.1.1 ____________________________________________________________ Two wheelers
5.1.2 ____________________________________________________________ Three wheeler 5.1.3 _________________________________________________ Four wheeler passenger car 5.1.4 ______________________________________________ Light commercial vehicle (LCV)

5.1.5 _____________________________________________ Heavy commercial Vehicle (HCV)
5.2. __________________________________________________________ Methane Emissions
6. CONCLUSION
7. RECOMMENDATIONS
GLOSSARY
REFERENCES
LIST OF ANNEXURES
ANNEXURE I: HEALTH EFFECTS OF ALDEHYDES AND KETONES
ANNEXURE II: VEHICLE TEST MATRIX
ANNEXURE III: FUEL SPECIFICATIONS
ANNEXURE IV: SUMMARY OF CARBONYL COMPOUND EMISSIONS
AND METHANE EMISSION RESULTS
ANNEXURE V: TEST PROCEDURE
ANNEXURE VI: AUTOMOTIVE SOURCE SAMPLES BY HIGH
PERFORMANCE LIQUID CHROMATOGRAPHY AIR RESOURCE BOARD
(SOP MLD 104)
ANNEXURE: VII (EQUIPMENT SPECIFICATION)
ANNEXURE VIII TEST VEHICLE SPECIFICATION

LIST OF FIGURES
Figure 2.1 In-cylinder burned gas and unburned gas formation
Figure 2.2 Chemical Formulae for Aldehydes and Ketones Figure 3.1 Schematic Test Cell Layout Figure 3.2 Flow diagram of FID 4000 LCG measurement system
Figure 3.3 Schematic representation of an HPLC unit Figure 4.1 Carbonyl emissions from BS II Petrol fueled Two wheeler (µg/km) Figure 4.2 Carbonyl emissions from BS III Petrol fueled Two wheeler (µg/km) Figure 4.3 Carbonyl emissions from BS III Petrol + E5 fueled Two wheeler (µg/km) Figure 4.4 Comparison of Total carbonyl compound emissions using various
Figure 4.5 Carbonyl emissions from BS II Diesel fueled three wheeler (µg/km) Figure 4.6 Carbonyl emissions from BS III Diesel fueled three wheeler (µg/km) Figure 4.7 Carbonyl emissions from CNG fueled three wheeler (µg/km) Figure 4.8 Carbonyl emissions from BS III Diesel+B10 fueled Three wheeler (µg/km) Figure 4.9 Carbonyl emissions from BS II Petrol fueled Three wheeler (µg/km) Figure 4.10 Carbonyl emissions from BS III Petrol fueled three wheeler (µg/km) Figure 4.11 Carbonyl emissions from BS III Petrol+E5 fueled three wheeler (µg/km) Figure 4.12 Carbonyl emissions from LPG fueled three wheeler (µg/km) Figure 4.13 Comparison of Average total carbonyl compound emissions using various fuels in three
wheeler category
Figure 4.14 Carbonyl emissions from BS II Petrol fueled in four wheeler passenger cars (µg/km)39
Figure 4.15 Carbonyl emissions from BS III Petrol fueled in four wheeler passenger cars (µg/km) Figure 4.16 Carbonyl emissions from BS III Petrol+ E5 fueled in four wheeler passenger cars (µg/km) Figure 4.17 Carbonyl emissions from Compressed Natural Gas fueled in four wheeler passenger cars
(µg/km) Figure 4.18 Carbonyl emissions from LPG fueled in four wheeler passenger cars (µg/km) Figure 4.19 Carbonyl emissions from BS II Diesel fueled in four wheeler passenger cars (µg/km) .............. Figure 4.20 Carbonyl emissions from BS III Diesel fueled four wheeler passenger cars (µg/km) Figure 4.21 Carbonyl emissions from BS III Diesel +B10 fueled four wheeler passenger cars (µg/km) Figure 4.22 Comparison of Average total carbonyl compound emissions using various fuels in four
wheeler passenger car category
Figure 4.23 Carbonyl emissions from BS II Diesel fueled LCV (mg/kW.hr) Figure 4.24 Carbonyl emissions from BS III Diesel fueled LCV (mg/kW.hr) Figure 4.25 Carbonyl emissions from BS III Diesel +B10 fueled LCV (mg/kW.hr) Figure 4.26 Carbonyl emissions from CNG fueled LCV (mg/kW.hr) Figure 4.27 Comparison of total carbonyl compound using various fuels in LCV category
Figure 4.28 Carbonyl emissions from BS II Diesel fueled in HCV (mg/kW.hr) Figure 4.29 Carbonyl emissions from BS III Diesel fueled in HCV (mg/kW.hr) Figure 4.30 Carbonyl emissions from BS III Diesel +B10 fueled in HCV (mg/kW.hr) Figure 4.31 Carbonyl emissions from Compressed Natural Gas fueled in HCV (mg/kW.hr) Figure 4.32 Comparison of total carbonyl compound emissions using various fuels in HCV
Figure 4.33 Comparison of methane emissions using various fuels in two wheeler category
Figure 4.34 Comparison of Average methane emissions using various fuels in three wheeler category
Figure 4.35 Comparison of Average methane emissions using various fuels in four wheeler category
Figure 4.36 Comparison of Average methane emissions using various fuels in LCVs
Figure 4.37 Comparison of methane emissions using various fuels in HCVs
Figure 4.38 Comparison of formaldehyde emission from various fuels in two wheeler
Figure 4.39 Comparison of formaldehyde emission from various fuels in three wheeler
Figure 4.40 Comparison of formaldehyde emission from various fuels in four wheeler Figure 4.41 Comparison of formaldehyde emission from various fuels in LCVs
Figure 4.42 Comparison of formaldehyde emission from various fuels in HCVs

LIST OF TABLES
Table 2.1 Recommended emission factors for on highway vehicles
Table 2.2 Physiochemical properties of carbonyl compounds Table 3.1 Vehicle category test cycles
Table 3.2 Measuring pollutants from vehicle category
Table 3.3 Description of FID 4000 LCG equipment Table 3.4 Regression coefficient of different carbonyl components
Table 3.5 Minimum detection limit of various components
Table 4.1 Results of Carbonyl emissions from two wheeler vehicle Category
Table 6.1 comparison of best & worse fuel with carbonyl emission in different types of vehicles
Table 6.2 Comparison of best & worse fuel with methane emission for different types of vehicles
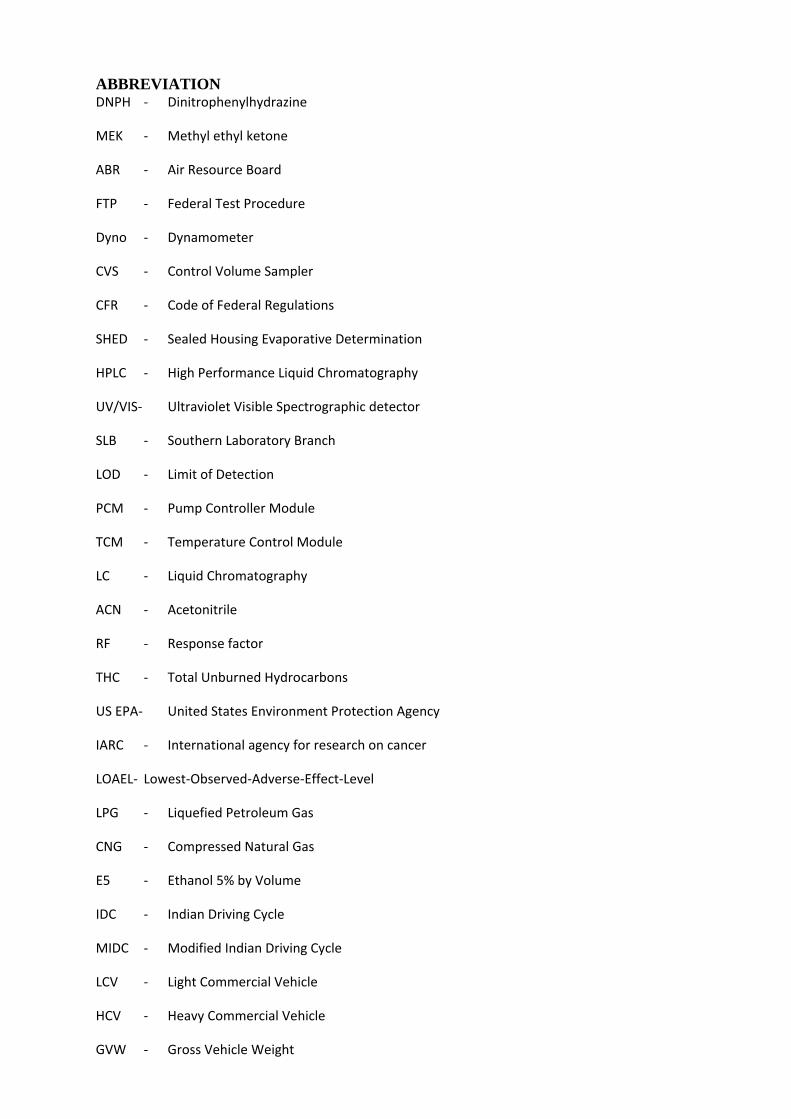
ABBREVIATION DNPH - Dinitrophenylhydrazine
MEK - Methyl ethyl ketone
ABR - Air Resource Board
FTP - Federal Test Procedure
Dyno - Dynamometer
CVS - Control Volume Sampler
CFR - Code of Federal Regulations
SHED - Sealed Housing Evaporative Determination
HPLC - High Performance Liquid Chromatography
UV/VIS- Ultraviolet Visible Spectrographic detector
SLB - Southern Laboratory Branch
LOD - Limit of Detection
PCM - Pump Controller Module
TCM - Temperature Control Module
LC - Liquid Chromatography
ACN - Acetonitrile
RF - Response factor
THC - Total Unburned Hydrocarbons
US EPA- United States Environment Protection Agency
IARC - International agency for research on cancer
LOAEL- Lowest-Observed-Adverse-Effect-Level
LPG - Liquefied Petroleum Gas
CNG - Compressed Natural Gas
E5 - Ethanol 5% by Volume
IDC - Indian Driving Cycle
MIDC - Modified Indian Driving Cycle
LCV - Light Commercial Vehicle
HCV - Heavy Commercial Vehicle
GVW - Gross Vehicle Weight

PC - Passenger Car
DT - Dilution Tunnel
CFO - Constant Flow Orifice
LCG - Low Cold Gas Chromatograph
RSD - Relative Standard Deviation
AU - Astronomical Unit
HPLC - High Performance Liquid Chromatography
EPA - Environmental Protection Agency
CARB - California Air Resource Board
FIA - Flame Ionization Analyzer
MEK - Methyl Ethyl Ketone
1. INTRODUCTION
1.1 Preamble
The rapid and seemingly unending increase in vehicle population, limited road space and
carrying capacity and emissions from different intersectorial activities and
study/investigation/monitoring of the Urban Ambient Air Quality is not limited to few
parameters such as NOx, SO2, CO etc… The study of hazardous air pollutants such as
ozone, volatile organic compounds (VOCs), Ketones and aldehydes have acquired new
dimensions for obvious reasons, which include their adverse effects on human health,
vegetation (ex: crops) and materials. The findings of source apportionment studies
conducted by CPCB have revealed that the release of PM10 from the transport sector is
20.5% in Delhi and as high as 48.3% in Chennai. The other major sources of PM10
emissions in Indian urban environment are garbage burning, road dust, DG sets,
construction activities etc.
The CPCB has also carried out a study of the urban air quality in Kolkata for source
identification and estimation of ozone, carbonyls, NOx and VOC emissions. The study
details and its findings which have been published by CPCB in its document Control of
Urban Pollution Series CUPS/72/2010-11, include cigarette smoke as one of the source of
VOC emissions in urban ambient air. The keeping of the Ambient Air Quality from the
point of sustainability not only requires ensuring of a sustainable growth of the vehicle
population and sustainable siting of developmental activities but also the sustainability of
the use of fuels for various purposes including as automotive fuel. The sustainability of
automotive fuels includes the type, affects and acceptability of the HAPs that are released
from different fuel based vehicles. The CPCB therefore has undertaken a project to study
the exhaust gases from different fuel based vehicles for Carbonyls and Methane emissions.
The selection of the target carbonyl compound was based on the documented research in
regard to the type of such compounds formed in the combustion of different automotive
fuels. The report gives details of the studies conducted including the type of test fuel,
vehicle selected, the methodology, the findings and the recommendations.
1.2 Objective of the work
To characterize Aldehydes, Ketones and Methane Emissions from different category
vehicle exhaust using variance in fuels by conducting exhaust mass emission tests and
HPLC analysis
1.3 Scope of the work
Collection of Aldehydes and Ketones of the exhaust gas collected in cartridges during
mass emission tests on various category vehicles & fuels
Determination of the amount of Aldehyde and Ketone present in the cartridges by
High Performance Liquid Chromatographic (HPLC) analysis.
Measurement of methane emissions during bag collection in ―mg/km‖ on various
vehicles using various fuels.

2. LITERATURE REVIEW
2.1. Formation and release of carbonyls and methane
2.1.1 Overall Process
Aldehydes and Ketones are characterized by the presence of carbonyl groups. In order to
study the oxidation of hydrocarbons, the complex engine system is divided into two parts:
(a) the combustion chamber and (b) the exhaust system. Inside the cylinder a fraction of
hydrocarbons is oxidized during the expansion and exhaust process and the products are
carbon dioxide, carbon monoxide and ―hydrocarbons containing oxygen‖ like Aldehydes,
Ketones, Ethers and Alcohols etc. The general mechanism for the formation of
Hydrocarbon (HC) is that fuel or fuel-air mixture escapes the primary combustion process
to the exhaust system. This fuel (containing HC) then survives the expansion processes and
passes through the exhaust system without oxidation and end up in the atmosphere as HC
emissions. With the use of catalysts or a thermal reactor in the exhaust system, substantial
reductions in HC emission levels can be achieved. The exhaust system temperature might
be sufficient for partial oxidation, but not high enough for complete combustion. Cylinder-
left-out gases are subjected to oxidation in the exhaust manifold. The engine parameters
that influence on oxidation process are speed, spark timing, mixing composition,
compression ratio, air / fuel ratio, load and heat losses (J.B.Heywood, 1988).
Factors which influence the engine conditions on hydrocarbon emissions are as follows:
(a) Fuel/Air Ratio:HC emission increases rapidly as the fuel and air mixture becomes
fuel rich (Slone et al (1989), Quader et al (1989), Grimm et al (1988). For example, the
hydrocarbon mass emitted under rich condition (Φ =1.15) was twice that of lean condition
(Φ =0.90). The relative abundance of methane and acetylene increased during fuel-rich
operation.
The presence of excess oxygen or excess hydrocarbons during combustion has a significant
effect on the relative concentration of the various oxygenated hydrocarbon species emitted.
As the availability of oxygen increases, the emission of hydrocarbon partial oxidizing
products increases.
(b) Temperature: The combustion rate of hydrocarbons increases rapidly with
temperature. Fundamental studies using combustion bombs and spectroscopic measurement

of excited species in flames have shown that the combustion rate of hydrocarbons increases
rapidly with temperature (Slone et al., 1989). In general, olefins produce higher flame
temperatures than aromatics and both are higher than paraffin’s (Quader et al., 1989). Spark
retardation leads to reduced peak temperature but increased temperature late in the cycle
and in the exhaust. NOx decreases because of the lower peak temperature while HCs
decrease because of the increased burn-up resulting from higher late cycle and exhaust
temperature. An increase in engine speed usually results in increased combustion chamber
temperature and increased catalyst temperature depending upon the thermal heat transfer
properties of the particular engine and exhaust system.
Fuel parameters that influence hydrocarbon emissions are as follows:
(a) Fuel Molecular weight: The studies of single cylinder engines revealed that the total
engine-out emission is increased as the average molecular weight of the fuel increased.
(b) Fuel Volatility: The change in the distillation temperature can change the engine
exhaust gas. In some of the fuels, the decrease in HC emissions (approximately 23%) due to
change in there distillation temperature from 360ºC to 138 oC. The higher HC emissions
observed using a higher T90 fuel were probably because of the combined effects of the
increased absorption of the heavier hydrocarbons ion oils films, on metal surfaces and in
cylinder deposits (Siegl et al .1992, Kaiser et al., 1991).
(c) Paraffin content in fuel: When simple paraffin’s are substituted for olefins in the fuel,
the atmospheric reactivity of exhaust pipe emissions decreases and the non-methane
hydrocarbon increases.
(d) Aromatic content in fuel: A decrease in aromatics and olefins and replacement by
paraffins will result in an increased production of molecular hydrogen during combustion.
The H/C ratio of fuel aromatics and olefins are lower than those of the normal and iso-
paraffins. The decrease in aromatics and/or olefins helps in reduced HC emissions,
assuming all other important variables remain constant.
(e) Oxygenated compound in fuel: The addition of oxygenated fuel components has the
effect of leaning –out the air/fuel ratio, which results in reduced HC and CO emissions.
Presently, only NOx (Oxides of Nitrogen), CO (Carbon Monoxide), THC (Total Unburned
Hydrocarbons) particulates and visible smoke are those emissions which are legislated for
the respective type of fueled vehicles. In addition to ongoing regulated parameters, the
impact of increasing traffic density on the environment and public health demands need the
limits for Aldehydes, Ketones and Methane emissions. A study on these parameters in

vehicle/ engine exhaust provides inputs for emission regulations thereby providing scope
for reducing pollution levels and consequently improving public health in the country.
Formaldehyde and Acetaldehyde are the most common non methane Carbonyl compounds
found in vehicular exhaust.
(i) Formaldehyde is formed due to incomplete combustion of both gasoline and diesel
fuel and accounts for 1 to 4% of Total Organic Gas (TOG) emissions, depending on
control technology and fuel consumption.
(ii) Vehicle emissions do not only contribute primary formaldehyde but also responsible
formaldehyde formed from photo oxidation of the VOC.
(iii) Acetaldehyde is a saturated aldehyde found in vehicle exhaust due to incomplete
combustion of fuel.
(iv) Acetaldehyde constitute 0.4 to 1 % of exhaust total organic Gas (TOG), depending on
control technology and fuel composition.
(v) Mobile sources contribute to both primary and secondary emissions of acetaldehyde.
(vi) Aldehydes get involved in chemical reaction in the atmosphere, generating other
compounds, some of which leads to photochemical smog formation that mostly
produces oxidizing gases, especially ozone gas.
(vii) Oxidizing gases formed due to chemical reaction in atmosphere also damage
materials like rubber.
2.2 Process chemistry Release/Mechanism.
2. 2.1 Aldehyde and Ketone formation
Aldehydes and ketones found in exhaust gases are formed in the engine and exhaust system.
In the basic aldehyde formation reactions, the important carriers of the chain reaction in the
combustion of hydrocarbons are the alkyl radicals (R), which are formed by cleavages of C-C
or C-H bonds of hydrocarbons. At high temperatures, dehydrogenation by oxygen and
presence of other combustion related radicals influence the cleavages processes.
Regarding the higher aldehydes, the general mechanism is based on the formation of the alkyl
radicals (RO2.)
R+O2 = RO2. ----------------------------------------------- (1)
This alkyl radical is the precursor for the further reactions, including intra-molecular
hydrogen abstractions and decomposition. Finally leading to the following aldehyde
formation reactions:
RCH2OO. RC
. HOOH RCHO+
.OH ------------------------ (2)

RCH2O+O2 RCHO+HO2. --------------------------------------------------- (3)
RCH=CH2+.O RCHO ------------------------------------------------------ (4)
An ambient temperature range in an engine exhaust system of 300-2000 K, the temperature
has the large effect on the aldehyde formation.
Aldehydes are formed by oxidation during the combustion and by oxidation of unburnt
hydrocarbons. Sources of unburnt hydrocarbons are given below (J.B.Haywood, 1988).
Flame quenching
Flame quenching at the cool combustion chamber walls, which results in a thin layer of
unburned fuel/air mixture close to the wall after flame passage.
Crevices mechanism
Crevices in the combustion chamber wall which are too narrow for flame to enter leads to the
fuel/air mixture escaping from the primary combustion processes.
Absorption and desorption of fuel vapor in the oil layer and deposits
The oil layer present on the combustion chamber wall and deposits formed on the combustion
chamber absorb fuel vapor during intake and compression processes, and this fuel is desorbed
during the expansion and exhaust processes.
Gas-phase quenching
It has been created when the engine is operating under extreme conditions of equivalence
ratio and spark timing.
Leakage of unburnt mixture through the valve
Valve leakage can occur which leads to a small fraction of fuel/air mixture escaping the
primary combustion processes.
Unevaporated liquid fuel in the cylinder
For liquid fuels, an important process which could contribute to hydrocarbon emissions is
the liquid fuel within the cylinder which fails to evaporate and mix with sufficient air to burn
before the end of combustion, particularly during the engine starting and warm-up process.

Figure 2.1 In-cylinder burned gas and unburned gas formation
The ketone formation also starts from the alkyl-peroxy radicals RO2 (Miller et al, 1990).The
ketone reaction equation as follows:
RR’CHOO. RR’C
.OOH RR’CO+
.OH --------------------------------- (5)
2.2.2 Methane Formation
Methane is emitted from light duty vehicles due to the incomplete combustion of fuel from
the engine and the incomplete oxidation of engine-out methane in current catalytic after
treatment systems. It is important to recognize, that current vehicles produce and emit
substantially less methane than their older counterparts.
2.2.3 Carbonyl Emission
The selective carbonyl and methane emission literature study has been done on the engines
using various fuels. The literature given below is the resources which have been used many
times in the study of carbonyl emission on engines using various fuels. Very less studies are
being available in the public domain.
Gasoline fueled engines
Numerous studies have been conducted on gasoline fueled engine for analyzing carbonyl
emissions.
Yao et al. (2008) suggested that reduction in aromatic content in Gasoline increases aldehyde
emission. Karl-Erik Egebäck et al (2005) said that, the emissions of aldehydes (especially
acetaldehyde and formaldehyde) from vehicles running on ethanol/gasoline blends are
expected to increase. Wigg et al, (1973) reported that increasing the aromatic content in fuel
reduces formaldehyde emissions from the exhaust. Oberdorfer et al, (1967) denoted that, in
gasoline the presence of different groups like (Aromatics, Naphthene, Paraffin, Olefins) have
different effect of carbonyl emissions (aldehyde & ketone). The increasing order of carbonyl
emission based on the groups is given below:
Aromatic < Naphthene < Paraffin < Olefin

Diesel fueled engines
Wagner et.al, 1996 described that, the higher cetane number fuel (BS III diesel) emits higher
carbonyl emissions than lower cetane number fuel (BS II diesel). The other important
property like higher sulfur content in BS II Diesel also one of the parameter to emit lower
aldehyde emissions (Yung-chen yao et.al, 2008). Yacoub et al. (1996) mentioned that
aldehyde emissions increase as the cetane number of the fuel is increased (lower fuel density
and aromatic content). Weidmann et al. (1988) investigated that the emissions of aldehyde
from diesel engine were slightly lower for lower cetane number and higher for higher cetane
number.
Natural gas engines
Natural gas largely consists of methane and ethane. The use of natural gas as a fuel in engines
is reviewed by Meeks Jr et al. (1992) and reported that, a reaction between a single methane
and oxygen molecule can directly produce formaldehyde as a stable intermediate combustion
product. Quenching the formaldehyde molecule before it can be acted upon by oxygen can
leave formaldehyde in the exhaust. Similarly, acetaldehyde and acrolein are stable
compounds that can be produced from partial combustion of ethane. Weaver et al (1989)
described that, the carburetor-based technology vehicle gave high non-regulated
hydrocarbons levels, with ethane (732mg/km), acetaldehyde (150mg/km).
Liquefied Petroleum Gas (LPG)
The vehicles run by LPG gives less formaldehyde than normal gasoline engine (Anonymous,
2000). Emissions of aldehydes from LPG vehicles nearly always generates lower than
diesel’s and often lower than petrol’s (Anonymous, 2009).
Ethanol blended gasoline engines
The main effects of ethanol blending were increased acetaldehyde emissions (30-44 times for
pure ethanol), reduced emissions of all other carbonyls except formaldehyde and acrolein
(which showed a more complex relation to the ethanol content), reduced carbon monoxide
(CO) and nitrogen oxide (NO) emissions, and increased hydrocarbon (HC) and nitrogen
dioxide (NO2) emissions (R Magnusson, 2002).
As ethanol has lower heating value, high octane number and lower energy content than
gasoline there is a significant increase in aldehydes and formaldehyde emissions from ethanol
added gasoline (Magnusson Roger et al, 2002).
Biodiesel blended diesel engine
C. He et al., 2009 experimental results indicate that biodiesel-fueled engine almost has triple
carbonyls emissions of diesel-fueled engine. Biodiesel, as an alternative fuel, has lower
specific reactivity (SR) caused by carbonyls compared with diesel. When fueled with
biodiesel, carbonyl compounds make more contribution to total hydrocarbon emission.
Correa S M et al, 2008 experimental work stated that, the seven carbonyl emissions
(formaldehyde, acetaldehyde, acrolein, acetone, propionaldehyde, butyraldehyde, and
benzaldehyde) were evaluated by a heavy-duty diesel engine fueled with pure diesel (D) and
biodiesel blends (v/v) of 2% (B2), 5% (B5), 10% (B10), and 20% (B20). Using average
values for the heavy duty engines, benzaldehyde showed a reduction on the emission (−3.4%
for B2, −5.3% for B5, −5.7% for B10, and −6.9% for B20) and all other carbonyls showed a
significant increase: 2.6, 7.3, 17.6, and 35.5% for formaldehyde; 1.4, 2.5, 5.4, and 15.8% for

acetaldehyde; 2.1, 5.4, 11.1, and 22.0% for acrolein+acetone; 0.8, 2.7, 4.6, and 10.0% for
propionaldehyde; 3.3, 7.8, 16.0, and 26.0% for butyraldehyde.
2.2.4 Methane emission:
Increases in ethanol percentage in gasoline enhances the methane emission in the exhaust
may be due to increase in octane number of the gasoline which has the probability of
knocking (Anonymous, 2008). Due to the incomplete combustion inside the engine and the
incomplete oxidation of methane at exhaust develop higher methane emission (RE Hayes,
2004). The recommended emission factors for highway vehicles are given in table 2.1.
Table 2.1 Recommended emission factors for on highway vehicles
Vehicle type/ Control Technology CH4
(g/mi)
CH4
(g/km)
Gasoline Passenger Cars:
Low Emission Vehicles 0.013 0.008
EPA Tier 1 a 0.02 0.012
EPA Tier 0 a 0.066 0.041
Oxidation Catalysts 0.133 0.083
Non-Catalyst 0.162 0.101
Uncontrolled 0.171 0.106
Diesel Passenger Cars:
Advanced 0.001 0.001
Moderate 0.001 0.001
Uncontrolled 0.001 0.001
Diesel Light Duty Trucks:
Advanced 0.001 0.001
Moderate 0.001 0.001
Uncontrolled 0.002 0.001

Diesel Heavy Duty Vehicles:
Advanced 0.004 0.002
Moderate 0.004 0.002
Uncontrolled 0.004 0.002
Motorcycles:
Non Catalysts Control 0.067 0.042
Uncontrolled 0.09 0.056
(The categories ―EPA Tier 0‖ and ―EPA Tier 1‖ were substituted for the early three-way catalyst and advanced three-way
catalyst categories, respectively, as defined in the Revised 1996 IPCC Guidelines)
Advanced: EGR and modern electronic control of the fuel injection system are designated as advanced control technologies.
Moderate: Improved injection timing technology and combustion system design for light- and heavy-duty diesel vehicles
(generally in place in model years 1983 to 1995) are considered moderate control technologies.
Uncontrolled: Not controlled over the combustion properties
Note: Light and Heavy duty vehicles were tested on Heavy duty Chassis Dynamometer.
(Source: Anonymous, 2004, Update of Methane and Nitrous Oxide Emission Factors for On Highway Vehicles, Assessment
and Standards Division Office of Transportation and -Air Quality, U.S. Environmental Protection Agency.)
2.3 Properties of Aldehydes, Ketones and Methane:
Aldehydes and ketones are partially oxygenated organic compounds containing carbonyl
group. An Aldehyde functional group consists of a carbon atom bonded to a hydrogen atom
and double-bonded to an oxygen atom (O=CH-). Whereas a ketone functional group contains
a carbonyl group (C=O) bonded to two other carbon atoms in the form shown below
Aldehyde Ketone
Formaldehyde Acetaldehyde Propionaldehyde Methane

Benzaldehyde Acetone Crotonaldehyde
Figure 2.2 Chemical Formulae for Aldehydes and Ketones
The word aldehyde seems to have arisen from alcohol dehydrogenated. The physiochemical
properties of the most common aldehyde and ketones found in engine exhaust emissions are
given in Table 2.2.
Table 2.2 Physiochemical properties of carbonyl compounds
Number IUPAC
name
Synonym C
No.
Formula Molecular
Weight
Density Melting
Point
Boiling
point
Aldehyde kg/mol kg/m3 ºC ºC
1 Methanal Formalydehyde 1 HCHO 30.03 815 -92 -21
2 Ethanal Acetaldehyde 2 CH3CHO 44.05 778 -123 20
3 Propanal Propionaldehyde 3 CH3CH2CHO 58.08 797 -81 48
4 Butanal n-Butylraldehyde 4 CH3(CH2)2CHCHO 72.11 803 -97 75
5 Pentanal n-Valeraldehyde 5 CH3(CH2)3CHO 86.13 808 -91 103
6 Hexanal n-
capronaldehyde
6 CH3(CH2)4CHO 100.16 814 -56 128
7 Propenal Acrolein 3 CH2CHCHO 56.07 841 -86 53
8 Trans-2-
Butenal
Crotonaldehyde 4 CH3CHCHCHO 70.09 852 -74 102
9 2Methyl
2propenal
Methacrolein 4 CH2CCH3CHO 70.09 843 -81 68
10 Benzenenec
arbonal
Benzaldehyde 7 C2H5CHO 106.13 1046 -26 179

11 3Benzenene
carbonal
m-Tolualdehyde 8 CH3C6H4CHO 120.15 1020 -35 197
12 2
Propanone
Acetone 3 CH3COCH3 58.08 792 -95 57
13 2 Butanone Methylethylketo
ne
4 CH3COCH2CH3 72.11 805 -86 80
2.4 Health Effects of Aldehydes and Ketones:
The health effects of Aldehydes and Ketones are given at Annexure I

3. METHODOLOGY
The project had two major components of execution
1. Vehicle Selection
2. Vehicle testing
3.1 Vehicle selection
The vehicles selected for the testing were depending on high population of the specific
vehicle on the Indian market and also depending on the availability at ICAT (Annexure-III).
The vehicle models were sourced from retro fitment agencies, dealerships, etc. Normally
about three vehicle models of the same vintage and categories were taken for testing.
3.2. Vehicle Testing
The vehicles as selected above were brought to ICAT for testing. Initially, the vehicle was
subjected to the minimum check list like exhaust leak check, rectified if there was any
exhaust leak. The fuel in the vehicle tank was drained off and test fuel was topped up after
necessary flushing. After the minimum check vehicle was subjected to exhaust mass emission
test on the chassis dynamometer. The standard vehicle exhaust mass emission tests were
performed on the chassis dynamometer. The test procedures used for different vintages were
as per the prevalent emission test procedure applicable for that category and model of the
vehicle. The test cycle on the different categories of vehicles is given in Table 3.1.
Table 3.1 Vehicle category test cycles
Test Cycles
Vehicle Category Test Cycle
2/3 Wheeler vehicles Indian Driving Cycle (IDC)
Post 2000 Model year 4 Wheeled vehicle with Gross
Vehicle Weight (GVW) less than or equal to 3500 kgs
Modified Indian Driving Cycle
(MIDC)
Gross Vehicle Weight (GVW) more than 3500 kgs 13 Mode Cycle
During the mass emission test, the exhaust methane emission was measured for all the
vehicles (2 and 3 wheelers) tested at the running time (648 sec) by the use of Constant
Volume Sampler (CVS) bag and the methane emission is mentioned in g/min. Additionally
the cartridge sample for Aldehydes and Ketones has been taken at the same running time by
the use of Impinger System. The method SOP MLD 104 was used to determine aldehyde and
ketone compounds in automotive source samples by High Performance Liquid
Chromatography (HPLC). Measuring pollutants are collected based on the test cycle used and
vehicle/engine category is given in Table 3.2.
Table 3.2 Measuring pollutants from vehicle category

Measuring pollutants
Vehicle Category Testing Cycle Measuring Pollutants
2 & 3 Wheeler IDC Methane, Aldehydes and Ketones
3 Wheeler IDC Methane, Aldehydes and Ketones
4 Wheeler Passenger cars MIDC Methane, Aldehydes and Ketones
4 Wheeler LCV 13 Mode Cycle Methane, Aldehydes and Ketones
4 Wheeler HCV 13 Mode Cycle Methane, Aldehydes and Ketones
3.2.1 Inertia Setting For Different Categories of Vehicles
For the purpose of mass emission test, the following inertia setting for the dynamometer was
used.
2 wheelers: ULW (Unladen Weight) + 75 kg
3 wheeler gasoline: ULW + 150 kg (2 passengers X 75)
3 wheeler Diesel: GVW
Passenger Cars: ULW+150 kg (2 passengersX75)
Multi Utility Vehicles: ULW+450 kg (6 passengersX75)
LCV: GVW & HCV: GVW
The coast down equation for the dynamometer tests was used as per the available data with
ICAT.
3.3 Test procedure and equipment details
Equipment details for mass emission testing are given at Annexure VIII. Mass Emission Test
Procedure for Methane emissions are given at Annexure V.
Emission cycles were a sequence of speed and load conditions performed on an engine
dynamometer. Emissions measured on vehicle (chassis) dynamometers were expressed in
grams of pollutant per unit of travelled distance, expressed in g/km. In a transient cycle such
as the one used for the chassis dynamometer testing, the vehicle followed a prescribed
driving pattern, which included accelerations, decelerations, changes of speed and load, etc.
The final test results were obtained by analyzing exhaust gas samples collected in
polyurethane bags over the duration of the cycle. In order to determine the emission of a
vehicle, the vehicle was tested in ICAT’s emissions test cell, under conditions which
accurately simulated the driving cycle as applicable to the vehicle category under test.

Each test vehicle was mounted with its drive wheels on the rollers of the test bed whose
rotational resistance was adjusted to simulate friction and aerodynamic drag. Inertial masses
were added to simulate the weight of the test vehicle as per the category of the vehicle. A
variable speed, vehicle cooling blower mounted at a short distance in front of the vehicle
provided the necessary cooling. The test vehicle was then soaked (i.e., cooled to bring it to
ambient temperature and conditions and maintained in that state till the commencement of the
test) on the chassis dynamometer to get the vehicle and the engine conditions in line with the
test cell ambient conditions.
CVS –Constant Volume Sampler
Figure 3.1 Schematic Test Cell Layout
(*The used test procedures in this project for variable speed, vehicle cooling mechanism, etc
are as per the standard method followed in CMVR-126 and TAP 115/116, part-II of chapter
1, 2, 3, 4. It may be noted that these procedures are followed in India for any type approval
and homologating testing by govt. agencies.)
The ambient air flow rate for diluting exhaust is mentioned below:
1. Two wheelers ------- 2 m3/min
2. Three wheelers ------- 3 m3/min
3. Four wheelers ------- 8 m3/min
Before starting the test, the chassis dynamometer was warmed up for 30 minutes with the
vehicle mounted on the chassis dynamometer and the engine in OFF condition. After the
warm up chassis dynamometer was calibrated to compensate for frictional losses and then the
test was performed on the vehicles. A highly skilled driver was enlisted to drive the test
vehicles on the chassis dynamometer. The driver strictly followed the test cycle by
maintaining the speed, changing the gears and accelerating and decelerating the vehicle in
tandem with the driving instructions displayed on the monitor.
CVS

After ensuring the calibration of the test cell, the driver started the engine and remained in the
idling condition for a period prescribed as per the applicable regulatory test procedure
depending upon the vintage and category of the vehicle. Thereafter, the exhaust gases
produced by the test vehicle were diluted with fresh air using a DT (dilution tunnel) and a
critical flow venturi-type CVS (constant volume sampler). For gaseous emission
measurement, a constant proportion of the diluted exhaust gas was extracted for collection in
one sample bag. The pollutant concentration in the sample bag at the end of the test
corresponded exactly with the mean concentration in the total quantity of fresh air/exhaust
mixture that was extracted. As the total volume of the fresh air/mixture could be defined, the
pollutant concentrations were used as the basis for calculating the pollutant masses produced
during the vehicles, the diluted exhaust gas was measured continuously by using a heated
FID THC analyzer. The exhaust gas emission analyzers were calibrated before the gas
analysis. The gas analysis of each sample bag was done immediately after each test. The
gases in the sampling bag was analyzed for concentrations of CO (carbon monoxide), NOx
(nitrogen oxides), THC (gasoline) and CO2 (carbon dioxide), CH4 (Methane) and the
emissions were expressed in g/km. Diluted exhaust gas and ambient air was collected in
individual cartridges for analyzing carbonyl emission from vehicular exhaust. The time
duration for the cartridge collection is same as like bag collection time of regulated emission
(CO, NOx &HC). After completion of cartridge collection, was stored in a temperature of 4 0C till HPLC analysis, as per SOP MLD 104 (Annexure VI).
3.3.1. Test Conditions
During the test, the test cell temperature was maintained between 293 K and 303 K (20 and
30°C). The absolute humidity (H) of either the air in the test cell or the intake air of the
engine was maintained between 5.5 and 12.2 g H2O/kg dry air. For post 2000 vehicles, the
soak period was maintained for a minimum of 6 hours and up to a maximum of 30 hours at
20-30 degree Celsius.
3.3.1.1 Mass emission Calculations
The mass emission of pollutants was calculated by means of the following equation:
Mi = Mass emission of the pollutant in g/km
Vmix = Volume of the diluted exhaust gas expressed in m3 and corrected to standard
conditions 293 K and 101.33 kPa
Qi = Density of the pollutant in kg/m3 at normal temp & pressure (293 K and 101.33 kPa)
kH = Humidity correction factor used for the calculation of the mass emission of oxides of
nitrogen. There is no humidity correction factor for HC, CO and CH4.
Ci = Concentration of the pollutant in the diluted exhaust gas expressed in ppm and
corrected by the amount of the pollutant contained in the dilution air
d = Distance covered in km
Vmix X Qi X kH X Ci X 10 -6
d Mi =

3.3.2 Exhaust methane gas measurement:
Flame Ionization Detector – Low Cold Gas chromatography (FID 4000-LCG)
Figure 3.2 Flow diagram of FID 4000 LCG measurement system
3.3.2.1 Measuring system (FID 4000):
An Emission measurement system (AMA 4000) has been developed, designed and
manufactured in accordance with the EU guidelines 89/336/EWG (EMC) and 93/68/EWG
(low voltage)
The following harmonization standards have been used:
DIN EN 983 : Pneumatic safety
DIN EN 55 011 Class A : Limits and measuring processes for radio interface of
industrial, scientific and medical high frequency
equipment (ISM equipment)
DIN EN 61000-6-2 : Electromagnetic compatibility (EMC), basic technical
standard, interface resistance
DIN EN 61010-1 : Safety requirements for electrical equipment for

measurement, control and laboratory use
BGV A3 : Electric systems and operating material
Table 3.3 Description of FID 4000 LCG equipment
Parts Description Operation
Burner air Synthetic air Assisting for burning
Fuel Hydroge:Helium (60:40) Burning fuel to burn CH4
Control air Compressed air To operate regulating valves
Dosing capillary Sample gas pass through small passage
Dosing loop Acts like filter
Detector voltage To ignite the Fuel+Burn air+CH4
3.3.2.2 Method of Operation:
IN FID 4000 LCG is used to characterize the methane (CH4) gas from vehicle exhaust. The
sample gas is passing through filter, nozzle, Dosing capillary, Dosing loop and
Chromatographic column. Dosing capillary is a passage with small cross sectional area which
passes uniform flow of gas. After Dosing capillary, the gas is send to Dosing loop where
filtering operation take place. Then filtered sample gas is passing through Chromatographic
column. In chromatographic column segregate the CH4 from sample gas. Segregated CH4 is
mixed with fuel (Hydrogen (60%) + Helium (40%)) and burn air (Synthetic air). The mix is
drive into detector area. In detector area, the gas mix is burnt out with use of spark from
detector voltage. The burnt gas produces ions and it attracted by anode. Ions are converted
into current and it amplified. After amplification it is digitalized.
3.3.3. High-performance liquid chromatography analysis
High-performance liquid chromatography (or High pressure liquid chromatography, HPLC)
is a form of column chromatography used frequently in biochemistry and analytical
chemistry to separate, identify and quantify compounds. HPLC utilizes a column that holds
chromatographic packing material (stationary phase), a pump that moves the mobile phase(s)
through the column, and a detector that shows the retention times of the molecules. Retention
time varies depending on the interactions between the stationary phase, the molecules being
analyzed, and the solvent(s) used.

Figure 3.3 Schematic representation of an HPLC unit
(1) Solvent reservoirs,
(2) Solvent degasser,
(3) Gradient valve,
(4) Mixing vessel for delivery of the mobile phase,
(5) High-pressure pump,
(6) Switching valve in "inject position",
(6') Switching valve in "load position",
(7) Sample injection loop,
(8) Pre-column (guard column),
(9) Analytical column,
(10) Detector (i.e. IR, UV),
(11) Data acquisition, and
(12) Waste or fraction collector.
3.3.3.1 Theory of operation
The sample to be analyzed is introduced in small volume to the stream of mobile phase. The
analyte's motion through the column is slowed by specific chemical or physical interactions
with the stationary phase as it traverses (passes through) the length of the column. The
amount of retardation depends on the nature of the analyte, stationary phase and mobile phase
composition. The time at which a specific analyte elutes (comes out of the end of the column)
is called the retention time; the retention time under particular conditions is considered a
reasonably unique identifying characteristic of a given analyte. The use of smaller particle
size column packing (which creates higher backpressure) increases the linear velocity (speed)
giving the components less time to diffuse within the column, leading to improved resolution
in the resulting chromatogram. Common solvents used include any miscible combination
of water or various organic liquids (the most common are methanol and Acetonitrile). Water
may contain buffers or salts to assist in the separation of the analyte components, or
compounds such as Trifluoroacetic Acid which acts as an ion pairing agent.

A further refinement to HPLC has been made to vary the mobile phase composition during
the analysis; this is known as gradient elution. A normal gradient for reversed phase
chromatography might start at 5% methanol and progress linearly to 50% methanol over 25
minutes; the gradient chosen depends on how hydrophobic the analyte is. The gradient
separates the analyte mixtures as a function of the affinity of the analyte for the current
mobile phase composition relative to the stationary phase. This partitioning process is similar
to that which occurs during a liquid-liquid extraction but is continuous, not step-wise. In this
example, using a water/methanol gradient, the more hydrophobic components
will elute (come off the column) when the mobile phase consists mostly of methanol (giving
a relatively hydrophobic mobile phase). The more hydrophilic compounds will elute under
conditions of relatively low methanol/high water.
The choice of solvents, additives and gradient depend on the nature of the stationary phase
and the analyte. Often a series of tests are performed on the analyte and a number of trial runs
may be processed in order to find the HPLC method which gives the best separation of peaks.
3.3.3.2 Quality Control of HPLC analysis
The analysis of carbonyl compound by HPLC analysis was performed by the international
standard method CARB, SOP MLD-104. The details of the method are given at Annexure
VI.
A. Extraction Efficiency:
As per standard method, each cartridge contains an absorbing compound (2, 4-DNPH) which
complexes with the carbonyl compounds to form their Dinitro-phenylhydrazone derivatives
(called carbonyl-DNPH). The cartridges are then extracted with 5.0 milliliters (mL) HPLC
grade Acetonitrile. (Tejada, 1986b).
B. Calibration regression coefficient:
The instrument was calibrated and regression coefficient (r2) for each component (13
numbers) was found more than 0.99, which shows the evidence of standardized and
calibrated the instrument conditions. Regression coefficient of different carbonyl components
are given in table 3.4.
Table 3.4 Regression coefficient of different carbonyl components
Component Name Regression Coefficient (r2)
Formaldehyde 0.99 Acetaldehyde 0.99 Acrolin 0.99 Actone 0.99 Propionaldehyde 0.99 Crotonaldehyde 0.99 Methacrolein 0.99 Methyl ethyl ketone 0.99 Valeraldehyde 0.99 Butyraldehyde 0.99 Benzaldehyde 0.99 M-tolunaldehyde 0.99 Hexanal 0.99
C. Method of Detection Limit (MDL)

This is based on the standard concentration limit, lower than this limit of a sample cannot be
detected/ analyzed by the HPLC. This value is also term as LOD (limit of detection limit). As
per SOP-104, the limit should be lower than 0.0075 µg/ml. In our standard method, the LOD
values were found lower than this standard limit, which shows that the instrument is in
perfect. Minimum detection limit of various components are given in table 3.5.
Table 3.5 Minimum detection limit of various components
Component Name LOD Maximum
Std Limit
Formaldehyde 0.00271
0.0075
Acetaldehyde 0.00577
Acrolin 0.00591
Actone 0.00525
Propionaldehyde 0.00436
Crotonaldehyde 0.00602
Methacrolein 0.00319
Methyl ethyl ketone 0.00487
Valeraldehyde 0.00486
Butyraldehyde 0.00648
Benzaldehyde 0.00569
M-tolunaldehyde 0.00402
Hexanal 0.00425
All the data represented in the above tables are showing the quality control analysis of
carbonyl components for HPLC system.

4. RESULTS
This chapter gives the details of Aldehyde, Ketone and Methane emission results from various fuel
(BS II Petrol, BS III Petrol, E5+BS III Petrol, BS II Diesel, BSIII Diesel, B10+BS III Diesel, CNG
and LPG) engines based on the vehicle categories as discussed in Methodology.
Carbonyl (aldehyde and ketone) emissions from two wheeler, three wheeler and four wheeler
passenger car in ―µg/km‖ for each of three vehicles per vehicle category and fuel used specified in
section 4.1 and the same way methane emission were specified in section 4.2. Aldehyde, ketone and
methane emissions from Light commercial vehicle and heavy commercial vehicle/engine categories
also quantified in terms of ―mg/kW hr‖ and it has mentioned in section 4.1 and 4.2 respectively.
Summary of average carbonyl emission from two wheeler category with BS II Petrol, BS III Petrol
and BS III Petrol+E5 are given in table 4.1. Summary of other category with respect to fuels are
mentioned in Annexure IV.
4.1 Carbonyl emission (2W, 3W, 4W, LCV & HCV)
4.1.1 Two wheelers
* MEK: Methyl Ethyl Ketone
Figure 4.1 Carbonyl emissions from BS II Petrol fueled two wheeler (µg/km)
The above chart shows the carbonyl emissions from two wheeler vehicles run by BS II Petrol.
Formaldehyde is the major aldehyde from BS II Petrol which amounts to 62.1% of the total carbonyl
emission (14.84 µg/km). Other major Aldehydes are acetaldehyde and acetone from BS II Petrol
fueled vehicle.

* MEK: Methyl Ethyl Ketone
Figure 4.2 Carbonyl emissions from BS III Petrol fueled two wheeler (µg/km)
The above chart shows the carbonyl emissions from two wheeler vehicle run by BS III Petrol.
Formaldehyde is the major aldehyde from BS III Petrol which amounts to 64% of the total carbonyl
emission (17.49 µg/km). Other major Aldehydes are acetaldehyde, Acrolein and acetone from BS III
Petrol fueled vehicle.
* MEK: Methyl Ethyl Ketone
Figure 4.3 Carbonyl emissions from BS III Petrol + E5 fueled two wheeler (µg/km)
The above chart shows the carbonyl emissions from two wheelers which are run by 5% ethanol
blended BS III Petrol. Acetaldehyde & formaldehyde accounts for 45% and 41.3%, respectively of the
total aldehyde emission (9.72 µg/km). Other aldehydes emission includes acrolein, methyl ethyl
ketone and acetone from 5% ethanol blended BS III Petrol fueled vehicle.

Figure 4.4 Comparison of Total carbonyl compound emissions using various
fuels in two wheeler category
The graph above gives the comparison of total aldehyde emission from two wheelers which are run by BS II
Petrol, BS III petrol and BS III Petrol+E5 fuels. BS III Petrol fueled two wheeler vehicles emit 15% and 47%
more total carbonyl emission than BS II Petrol and BS III Petrol+E5 fueled vehicles respectively.
Table 4.1 Results of Carbonyl emissions from two wheeler vehicle Category
Fuel used
BS II Petrol BS III Petrol BS III Petrol (Ref) + E5
Name of the carbonyl compound
emission
Range µg/km Mean
µg/km
Range µg/km Mean
µg/km
Range µg/km Mean µg/km
Formaldehyde 7.88-10.09 9.22 6.31-15.61 11.21 3.61-4.79 4.01
Acetaldehyde 2.20-3.87 2.98 1.33-3.48 2.25 3.77-4.91 4.38
Acrolein Nd Nd 0-2.29 1.35 0-0.56 0.19
Acetone 0.63-1.67 1.29 0.92-1.73 1.23 0.18-0.81 0.58
Propionaldehyde 0.25-0.44 0.35 0.06-0.23 0.44 0-18 0.06
Crotonaldehyde 0-0.22 0.07 0-0.15 0.42 0-0.36 0.19
MEK 0.51-0.87 0.74 0-024 0.10 0.26-0.34 0.29
n-Butyraldehyde 0.08-0.14 0.11 0-0.16 0.48 Nd Nd
Methacrolein Nd Nd Nd Nd Nd Nd
Benzaldehyde Nd Nd Nd Nd Nd Nd
Valeraldehyde 0-0.25 0.08 Nd Nd Nd Nd
m-Tolualdehyde Nd Nd Nd Nd Nd Nd
Hexanal Nd Nd Nd Nd Nd Nd
Total Avg emission 14.84 µg/km 17.49 µg/km 9.72 µg/km
Nd-Not Detectable

4.1.2 Three wheelers
* MEK: Methyl Ethyl Ketone
Figure 4.5 Carbonyl emissions from BS II Diesel fueled three wheeler (µg/km)
The above chart shows the carbonyl emissions from three wheelers run by BS II Diesel.
Formaldehyde is the major aldehyde from BS II Diesel which amounts to 81.2% of the total carbonyl
emission (16.77 µg/km). Other major aldehydes are acetaldehyde, acrolein and acetone from BS II
Diesel fueled vehicle.
* MEK: Methyl Ethyl Ketone
Figure 4.6 Carbonyl emissions from BS III Diesel fueled three wheeler (µg/km)
The above chart shows the carbonyl emissions from three wheeler vehicles run by BS III Diesel.
Formaldehyde is the major aldehyde from BS III Diesel which amounts to 57.9% of the total carbonyl
emission (34.65 µg/km). Other major Aldehydes are Acetaldehyde, Acetone and Propionaldehyde
from BS III Diesel fueled vehicle.

Figure 4.7 Carbonyl emissions from CNG fueled three wheeler (µg/km)
The above chart shows the carbonyl emissions from three wheeler vehicles run by Compressed
Natural Gas (CNG). Formaldehyde is the major aldehyde from CNG which amounts to 88% of the
total carbonyl emission (20.62 µg/km). Other major aldehyde is acetaldehyde from CNG fueled
vehicle.
Figure 4.8 Carbonyl emissions from BS III Diesel+B10 fueled three wheeler (µg/km)
The above chart shows the carbonyl emissions from three wheeler vehicles run by 10% biodiesel
blended with BS III Diesel. Acetaldehyde is the major aldehyde from BS III Diesel+B10 which
amounts to 61% of the total carbonyl emission (19.94 µg/km). Other major aldehyde is formaldehyde
from BS III Diesel+B10 fueled vehicle.

* MEK: Methyl Ethyl Ketone
Figure 4.9 Carbonyl emissions from BS II Petrol fueled Three wheeler (µg/km)
The above chart shows the carbonyl emissions from three wheeler runs by BS II Petrol. Acetone is
the major aldehyde from BS II Petrol which amounts to 20.3% of the total carbonyl emission
(57.96µg/km). Other major aldehydes are Formaldehyde, Acetaldehyde, Acrolein, Propionaldehyde,
n-Butyraldehyde, Valaraldehyde and Acetone from BS III Petrol fueled vehicle.
* MEK: Methyl Ethyl Ketone
Figure 4.10 Carbonyl emissions from BS III Petrol fueled three wheeler (µg/km)
The above chart shows the carbonyl emissions from three wheeler run by BS III Petrol.
Formaldehyde and acetone are the major aldehydes from BS III Petrol which amounts to 18.5% and
17.5% of the total carbonyl emission (60.66 µg/km). Other major aldehydes are formaldehyde,
acetaldehyde, Acrolein, Propionaldehyde, Crotonaldehyde, Methyl Ethyl Ketone, n-Butyraldehyde,
Valaraldehyde and Acetone from BS III Petrol fueled vehicle.
* MEK: Methyl Ethyl Ketone
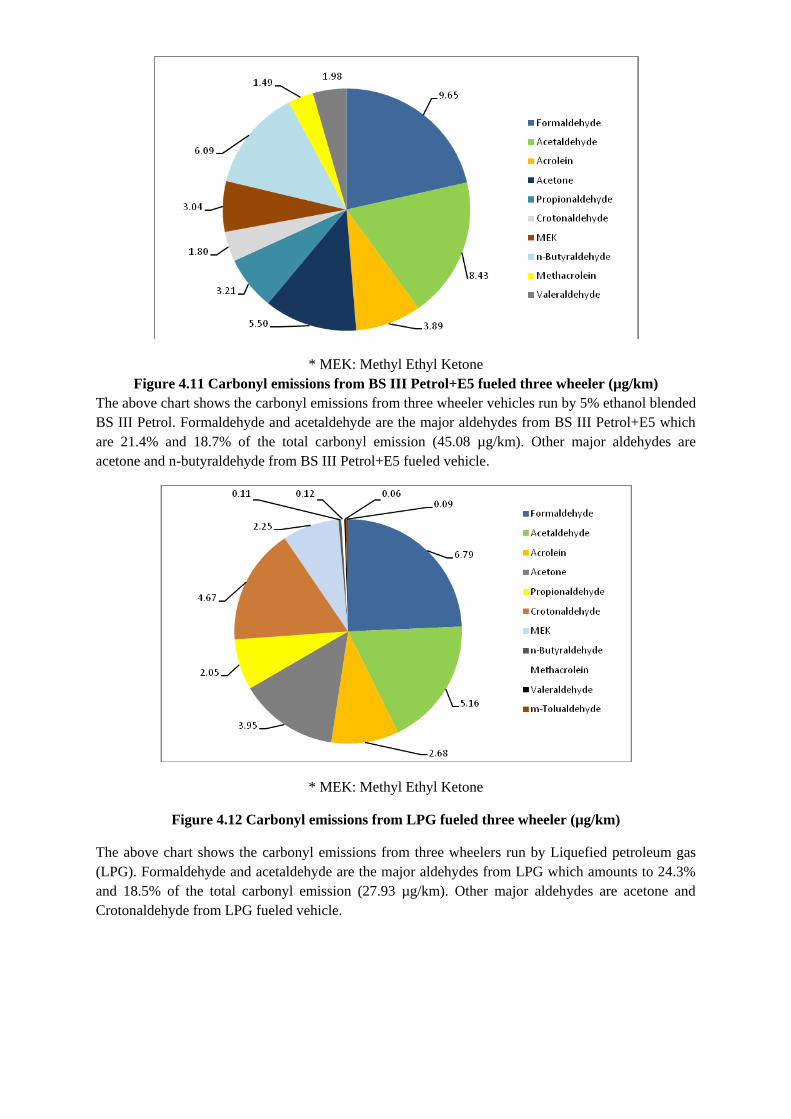
Figure 4.11 Carbonyl emissions from BS III Petrol+E5 fueled three wheeler (µg/km)
The above chart shows the carbonyl emissions from three wheeler vehicles run by 5% ethanol blended
BS III Petrol. Formaldehyde and acetaldehyde are the major aldehydes from BS III Petrol+E5 which
are 21.4% and 18.7% of the total carbonyl emission (45.08 µg/km). Other major aldehydes are
acetone and n-butyraldehyde from BS III Petrol+E5 fueled vehicle.
* MEK: Methyl Ethyl Ketone
Figure 4.12 Carbonyl emissions from LPG fueled three wheeler (µg/km)
The above chart shows the carbonyl emissions from three wheelers run by Liquefied petroleum gas
(LPG). Formaldehyde and acetaldehyde are the major aldehydes from LPG which amounts to 24.3%
and 18.5% of the total carbonyl emission (27.93 µg/km). Other major aldehydes are acetone and
Crotonaldehyde from LPG fueled vehicle.
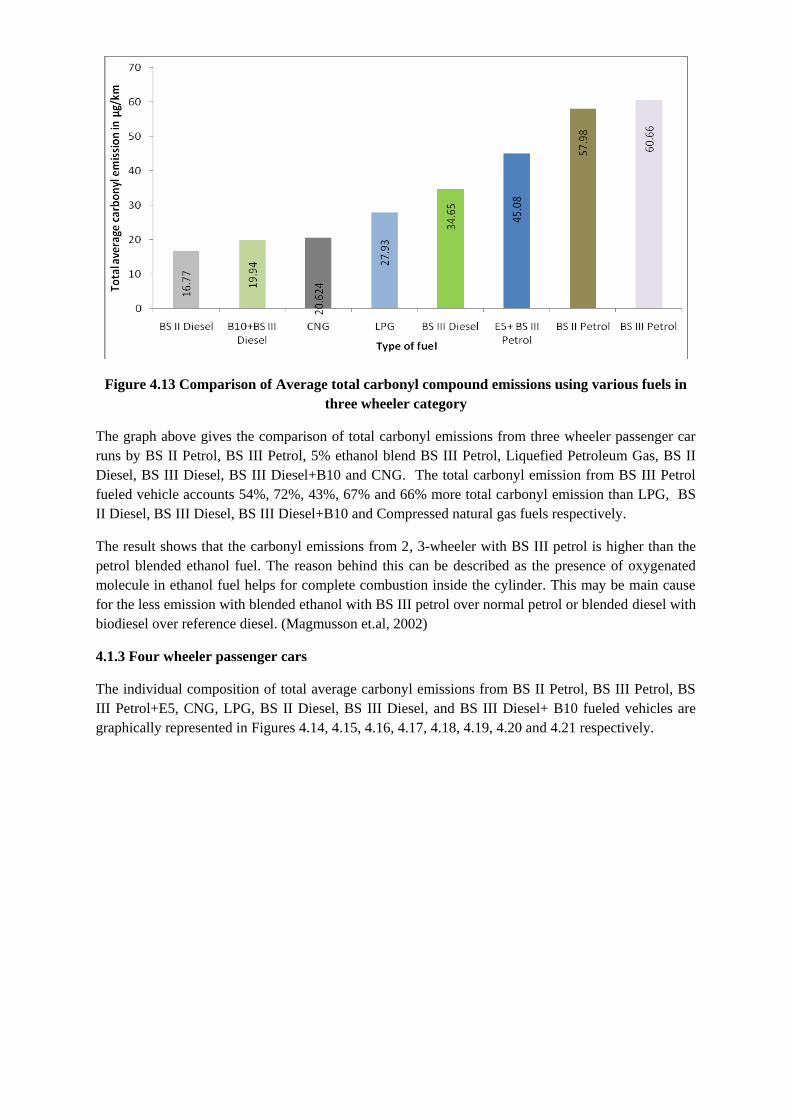
Figure 4.13 Comparison of Average total carbonyl compound emissions using various fuels in
three wheeler category
The graph above gives the comparison of total carbonyl emissions from three wheeler passenger car
runs by BS II Petrol, BS III Petrol, 5% ethanol blend BS III Petrol, Liquefied Petroleum Gas, BS II
Diesel, BS III Diesel, BS III Diesel+B10 and CNG. The total carbonyl emission from BS III Petrol
fueled vehicle accounts 54%, 72%, 43%, 67% and 66% more total carbonyl emission than LPG, BS
II Diesel, BS III Diesel, BS III Diesel+B10 and Compressed natural gas fuels respectively.
The result shows that the carbonyl emissions from 2, 3-wheeler with BS III petrol is higher than the
petrol blended ethanol fuel. The reason behind this can be described as the presence of oxygenated
molecule in ethanol fuel helps for complete combustion inside the cylinder. This may be main cause
for the less emission with blended ethanol with BS III petrol over normal petrol or blended diesel with
biodiesel over reference diesel. (Magmusson et.al, 2002)
4.1.3 Four wheeler passenger cars
The individual composition of total average carbonyl emissions from BS II Petrol, BS III Petrol, BS
III Petrol+E5, CNG, LPG, BS II Diesel, BS III Diesel, and BS III Diesel+ B10 fueled vehicles are
graphically represented in Figures 4.14, 4.15, 4.16, 4.17, 4.18, 4.19, 4.20 and 4.21 respectively.

* MEK: Methyl Ethyl Ketone
Figure 4.14 Carbonyl emissions from BS II Petrol fueled in four wheeler passenger cars (µg/km)
The above chart shows the carbonyl emissions from four wheeler passenger car run by BS II Petrol.
Acrolein is the major aldehyde from BS II Petrol which amounts to 68.7% of the total carbonyl
emission (14.52 µg/km). Other major Aldehydes are Formaldehyde and Acetaldehyde from BS II
Petrol fueled vehicle.
* MEK: Methyl Ethyl Ketone
Figure 4.15 Carbonyl emissions from BS III Petrol fueled in four wheeler passenger cars
(µg/km)
The above chart shows the carbonyl emissions from four wheeler passenger car run by BS III Petrol.
Acetone is the major aldehyde from BS II Petrol which amounts to 43% of the total carbonyl emission
(9.14 µg/km). Other major aldehydes are formaldehyde and acetaldehyde from BS III Petrol fueled
vehicle.

* MEK: Methyl Ethyl Ketone
Figure 4.16 Carbonyl emissions from BS III Petrol+ E5 fueled in four wheeler passenger cars
(µg/km)
The above chart shows the carbonyl emissions from four wheeler passenger car run by 5% ethanol
blended BS III Petrol. Acrolein is the major aldehyde from BS III Petrol+E5 which amounts to 80%
of the total carbonyl emission (13.41 µg/km). Other major aldehydes are formaldehyde and
acetaldehyde from BS II Petrol fueled vehicle.
Figure 4.17 Carbonyl emissions from Compressed Natural Gas fueled in four wheeler passenger
cars (µg/km)
The above chart shows the carbonyl emissions from four wheeler passenger car run by CNG.
Acetone is the major aldehyde from CNG which amounts to 62.2% of the total carbonyl emission
(27.47 µg/km). Other major aldehydes are formaldehyde and acetaldehyde from BS II Petrol fueled
vehicle.

* MEK: Methyl Ethyl Ketone
Figure 4.18 Carbonyl emissions from LPG fueled in four wheeler passenger cars (µg/km)
The above chart shows the carbonyl emissions from four wheeler passenger car run by Liquefied
petroleum gas (LPG). Acetaldehyde is the major aldehyde from LPG which amounts to 36.5% of the
total carbonyl emission (20.18 µg/km). Other major aldehydes are formaldehyde and acrolein from
LPG fueled vehicle.
* MEK: Methyl Ethyl Ketone
Figure 4.19 Carbonyl emissions from BS II Diesel fueled in four wheeler passenger cars (µg/km)
The above chart shows the carbonyl emissions from four wheeler passenger car run by BS II Diesel.
Acetaldehyde is the major aldehyde from BS II Diesel which amounts to 41.2% of the total carbonyl
emission (13.83 µg/km). Other major aldehydes are formaldehyde and acrolein from BS II Diesel
fueled vehicle.

* MEK: Methyl Ethyl Ketone
Figure 4.20 Carbonyl emissions from BS III Diesel fueled four wheeler passenger cars (µg/km)
The above chart shows the carbonyl emissions from four wheeler passenger car run by BS III Diesel.
Formaldehyde and acrolein are the major aldehydes from BS III Diesel which amounts to 33.4% and
32.6% of the total carbonyl emission (9.89 µg/km). Other major aldehyde is Acetaldehyde from BS
III Diesel fueled vehicle.
* MEK: Methyl Ethyl Ketone
Figure 4.21 Carbonyl emissions from BS III Diesel +B10 fueled four wheeler passenger cars
(µg/km)
The above chart shows the carbonyl emissions from four wheeler passenger car run by 10% biodiesel
blend with BS III Diesel. Acetaldehyde is the major Aldehydes from BS III Diesel+B10 which
amount to 40.7% of the total carbonyl emission (13.88 µg/km). Other major Aldehydes are
Formaldehyde and acrolein from BS III Diesel+B10 fueled vehicle.

Figure 4.22 Comparison of Average total carbonyl compound emissions using various fuels in
four wheeler passenger car category
The above graph gives the comparison of total carbonyl emissions from four wheeler passenger car
runs by BS II Petrol, BS III Petrol, 5% ethanol blend BS III Petrol, Liquefied Petroleum Gas, BS II
Diesel, BS III Diesel, BS III Diesel+B10 and Compressed Natural Gas (CNG). The total carbonyl
emission from CNG fueled vehicle accounts 26.5%, 47%, 51%, 49.6% and 49.4% more total carbonyl
emission than Liquefied petroleum gas, BS II Petrol, BS III Petrol+E5, BS II Diesel, BS III
Diesel+B10 fuels respectively. Vehicles run by BS II Petrol and BS II Diesel emit minimum carbonyl
emissions.
It is inferred from the results that emission from the 4-wheeler are showing reverse to the 2,3-wheeler
vehicle. The probable cause for this emission aspect is may be due to the use of carbureted engine in 2
& 3 wheeler, where proper mixing (Quantity governing method) is not done. Where, in 4-wheeled
vehicles multi point injection systems for SI engines and Common rail direct injection for CI engines
(Quality governing method) were used for this experiment. That may be the probable reason for
which the 4-wheeler emits less emission with blended fuel over 2,3-wheeler engine.
4.1.4 Light Commercial Vehicle (LCV): (Tested on engines)
In this category, light commercial vehicle engines were tested and emission collected as per 13 mode
test procedure. Carbonyl emissions of BS II Diesel, BS III Diesel, BS III Diesel+B10 and Compressed
Natural Gas fueled engines results are represented in figures 4.23, 4.24, 4.25 and 4.26 respectively.
For Compressed Natural Gas (CNG), retro-fitment engines have been used due to unavailability of
dedicated engine in the market. Total average carbonyl compound emissions comparison chart
represented in figure 4.27.

* MEK: Methyl Ethyl Ketone
Figure 4.23 Carbonyl emissions from BS II Diesel fueled LCV (mg/kW.hr)
The above chart shows the carbonyl emissions from Light commercial vehicle run by BS II Diesel.
Acrolein is the major Aldehyde from BS II Diesel which amounts to 31.6% of the total carbonyl
emission (56.66 mg/kW.hr). Other major Aldehydes are Formaldehyde, Acetaldehyde and
Methacrolein from BS II Diesel fueled vehicle.
* MEK: Methyl Ethyl Ketone
Figure 4.24 Carbonyl emissions from BS III Diesel fueled LCV (mg/kW.hr)
The above chart shows the carbonyl emissions from Light commercial vehicle run by BS III Diesel.
Acrolein is the major aldehyde from BS II Diesel which amounts to 23.1% of the total carbonyl
emission (81.56 mg/kW.hr). Other major aldehydes are Formaldehyde, Crotonaldehyde and m-
Tolualdehyde from BS III Diesel fueled vehicle.

* MEK: Methyl Ethyl Ketone
Figure 4.25 Carbonyl emissions from BS III Diesel +B10 fueled LCV (mg/kW.hr)
The above chart shows the carbonyl emissions from Light commercial vehicle run by 10% Biodiesel
blended BS III Diesel. Acrolein is the major aldehyde from BS II Diesel+B10 which amounts to
22.4% of the total carbonyl emission (97.22 mg/kW.hr). Other major aldehydes are Formaldehyde,
Propionaldehyde and Methacrolein from BS III Diesel+B10 fueled vehicle.
* MEK: Methyl Ethyl Ketone
Figure 4.26 Carbonyl emissions from CNG fueled LCV (mg/kW.hr)
The above chart shows the carbonyl emissions from Light commercial vehicle run by compressed
natural gas. Formaldehyde is the major aldehyde from CNG which amounts to 39.2% of the total
carbonyl emission (116.34 mg/kW.hr). Other major aldehydes are Acetaldehyde and Acetone from
CNG fueled vehicle.

Figure 4.27 Comparison of total carbonyl compound using various fuels in LCV category
The above graph shows the comparison of total carbonyl emissions from Light commercial vehicle runs by
BS II Diesel, BS III Diesel, BS III Diesel+B10 and Compressed Natural Gas (CNG). The total carbonyl
emission from CNG fueled vehicle accounts 51%, 30% and 16% more than carbonyl emission from BS II
Diesel, BS III Diesel, BS III Diesel+B10 fuels respectively.
4.1.5 Heavy Commercial Vehicles (HCV): (Tested on engines)
In this category, heavy commercial vehicle engines were tested and emissions collected as per 13
mode test procedure. Carbonyl emissions of BS II Diesel, BS III Diesel, BS III Diesel+B10 and
Compressed Natural Gas fueled engines results are represented in figures 4.28, 4.29, 4.30 and 4.31
respectively. The comparison of total average carbonyl emission are combined and mentioned in
figure 4.32.
Figure 4.28 Carbonyl emissions from BS II Diesel fueled in HCV (mg/kW.hr)
The above chart shows the carbonyl emissions from Heavy commercial vehicle run by BS II Diesel.
Formaldehyde is the major aldehyde from BS II Diesel which amounts to 29.7% of the total carbonyl

emission (67.37 mg/kW.hr). Other major aldehydes are acetaldehyde and acrolein from BS II Diesel
fueled vehicle.
Figure 4.29 Carbonyl emissions from BS III Diesel fueled in HCV (mg/kW.hr)
The above chart shows the carbonyl emissions from Heavy commercial vehicle run by BS III Diesel.
Formaldehyde is the major aldehyde from BS III Diesel which amounts to 30.4% of the total carbonyl
emission (96.93 mg/kW.hr). Other major aldehydes are acetaldehyde, acetone and acrolein from BS II
Diesel fueled vehicle, apart from formaldehyde.
* MEK: Methyl Ethyl Ketone
Figure 4.30 Carbonyl emissions from BS III Diesel +B10 fueled in HCV (mg/kW.hr)
The above chart shows the carbonyl emissions from Heavy commercial vehicle run by 10% Biodiesel
blended BS III Diesel. Formaldehyde is the major aldehyde from BS III Diesel+B10 which amounts
to 32% of the total carbonyl emission (121.97 mg/kW.hr). Other major aldehydes are n-
Butyraldehyde, Acrolein and Acetaldehyde from BS III Diesel+B10 fueled vehicle, apart from
formaldehyde.

* MEK: Methyl Ethyl Ketone
Figure 4.31 Carbonyl emissions from Compressed Natural Gas fueled in HCV (mg/kW.hr)
The above chart shows the carbonyl emissions from Heavy commercial vehicle run by CNG.
Formaldehyde is the major aldehyde from CNG which amounts to 52% of the total carbonyl emission
(127.52 mg/kW.hr). Other major aldehydes are acetaldehyde and acrolein from CNG fueled vehicle,
apart from formaldehyde.
Figure 4.32 Comparison of total carbonyl compound emissions using various fuels in HCV
From the above figure it can be seen that the comparison of total carbonyl emissions from Light
commercial vehicle runs by BS II Diesel, BS III Diesel, BS III Diesel+B10 and Compressed Natural
Gas (CNG). The total carbonyl emission from CNG fueled vehicle accounts 47%, 26% and 4% more
total carbonyl emission than BS II Diesel, BS III Diesel, BS III Diesel+B10 fuels respectively.
4.2 Methane emission (2W, 3W, 4W, LCV &HCV)
Comparison of total average methane emission of each fuel with respect to vehicle category are
graphically represented in figures 4.33, 4.34, 4.35, 4.36 and 4.37 respectively.

Figure 4.33 Comparison of methane emissions using various fuels in two wheeler category
The Figure above shows the comparison of methane emission from two wheeler vehicle runs by BS II
petrol, BS III Petrol and BS III Petrol +E5. The methane emission from BS III Petrol +E5 fueled
vehicle accounts 72.3% and 63.8% more than BS II Petrol and BS III Petrol, fuels respectively.
Figure 4.34 Comparison of Average methane emissions using various fuels in three wheeler
category
The above figure shows the comparison of methane emission from three wheeler vehicle category
runs by BS II Petrol, BS III Petrol, BS II Petrol+E5, Liquefied petroleum gas, BS II Diesel, BS III
Diesel, BS III Diesel+B10 and Compressed Natural Gas. In the three wheeler vehicle category, the
methane emission from CNG is more compared to other fuels. (** Three wheeler CNG vehicle emits
2852 mg/km amount of methane emission)

Figure 4.35 Comparison of Average methane emissions using various fuels in four wheeler
category
From the above figure it can be inferred that the methane emission from CNG fueled vehicle accounts
approximately 5 times more than other fuels.
Figure 4.36 Comparison of Average methane emissions using various fuels in LCVs
The figure above shows the comparison of methane emission from Light commercial vehicle runs by
BS II Diesel, BS III Diesel, BS III Diesel+B10 and Compressed Natural Gas (CNG). The methane
emission from CNG fueled vehicle accounts 30%, 23.3% and 35.5% more than BS II Diesel, BS III
Diesel, and BS III Diesel + B10 fuels respectively.

Figure 4.37 Comparison of methane emissions using various fuels in HCVs
The figure above shows the comparison of methane emission from Heavy commercial vehicle runs by
BS II Diesel, BS III Diesel, BS III Diesel+B10 and Compressed Natural Gas (CNG). The methane
emission from CNG fueled vehicle accounts 70%, 77% and 71% more methane emission than BS II
Diesel, BS III Diesel, BS III Diesel + B10 fuels respectively.
4.3 Formaldehyde emission (2W, 3W, 4W, LCV &HCV):
Comparison of average formaldehyde emission of each fuel with respect to vehicle category are
graphically represented in figures 4.38, 4.39, 4.40, 4.41 and 4.42 respectively.
Figure 4.38 Comparison of formaldehyde emission from various fuels in two wheeler.
The figure above shows the comparison of Average formaldehyde emission from two wheeler vehicle
runs by BS II petrol, BS III Petrol and BS III Petrol +E5. The Average formaldehyde emission from
BS III Petrol fueled vehicle accounts 17.8% and 64.2% more total carbonyl emission than BS II Petrol
and BS III Petrol +E5 fuels respectively.

Figure 4.39 Comparison of formaldehyde emission from various fuels in three wheeler
The figure above shows the comparison of Average formaldehyde emission from four wheeler
passenger cars runs by BS II Petrol, BS III Petrol, BS II Petrol+E5, Liquefied petroleum gas, BS II
Diesel, BS III Diesel, BS III Diesel+B10 and Compressed Natural Gas (CNG). In the three wheeler
vehicle category, major formaldehyde emitting fuel is BS III Diesel fuel. Other major formaldehyde
emission emitting fuels are BS III petrol, BS II Diesel and CNG.
Figure 4.40 Comparison of formaldehyde emission from various fuels in four wheeler
The figure above shows the comparison of Average formaldehyde emission from three wheeler
vehicles runs by BS II Petrol, BS III Petrol, BS II Petrol+E5, Liquefied petroleum gas, BS II Diesel,
BS III Diesel, BS III Diesel+B10 and Compressed Natural Gas (CNG). The Average formaldehyde
emission from LPG fueled vehicle accounts approximately 2.5 times more emission than other fuels
run by vehicle. Other major methane emission emitting fuels are BS III Diesel, BS III Petrol and LPG
from four wheeler passenger cars, apart from CNG.

Figure 4.41 Comparison of formaldehyde emission from various fuels in LCVs
The figure above shows the comparison of average formaldehyde emission from Light commercial
vehicle runs by BS II Diesel, BS III Diesel, BS III Diesel+B10 and Compressed Natural Gas (CNG).
The average formaldehyde emission from CNG fueled vehicle accounts 76.8%, 72.3% and 71.2%
more methane emission than BS III Diesel, BS II Diesel and BS III Diesel+B10 fuels respectively.
Figure 4.42 Comparison of formaldehyde emission from various fuels in HCVs
The figure above shows the comparison of average formaldehyde emission from Heavy commercial
vehicle runs by BS II Diesel, BS III Diesel, BS III Diesel+B10 and Compressed Natural Gas (CNG).
The average formaldehyde emission from CNG fueled vehicle accounts 69.8%, 55.6% and 41.1%
more methane emission than BS II Diesel, BS III Diesel and BS III Diesel + B10 fuels respectively.
5. DISCUSSIONS
The results are discussed in terms of Carbonyl emissions and methane emissions respectively
5.1 Carbonyl emissions
The discussions of results in terms of carbonyl emissions per kilometer for three major vehicle
categories (i.e..two wheelers, three wheelers and four wheeler Passenger cars) and carbonyl
emissions per mg/kW.hr for two vehicle categories (i.e..LCVs and HCVs) with various fuels.
Pie-charts are plotted for each vehicle categories viz. two wheeler, three wheeler, four wheeler
passenger car, Light commercial vehicle and Heavy commercial vehicle respectively with
respect to fuel used. Tabulation of carbonyl emissions are presented in Annexure IV (in terms
of Range, Mean and Standard deviation).
As per mass emission test procedure (CMVR-Type Approval Procedure), vehicle category of
two wheeler, three wheeler and four wheeler passenger cars were tested on chassis
dynamometer. Emission collection bag (for methane) and DNPH (2,4-
Dinitrophenylhydrazine) sample cartridges collection (for aldehyde and ketones) was done.
Both the collection time period was same. Collected cartridges were analyzed in High
performance Liquid Chromatography (HPLC) for aldehyde and ketone measurement values.
Figures 4.1 to 4.32 show carbonyl emissions apportionment for each fuel and comparative
data based on vehicle category. Charts are plotted with average individual carbonyl compound
emissions. Eleven type of aldehydes and two type of ketones values are shown (µg/km) in
each figure for two wheeler, three wheeler and four wheeler passenger cars and for Light
commercial vehicle and Heavy commercial vehicles in mg/kW.hr.
5.1.1 Two wheelers
Figure 4.1 to 4.3 shows the distribution of carbonyl compounds in the total emission as result
of usage of various fuels (BS II Petrol, BS III Petrol, and BS III Petrol+ E5) in two wheeler
category. Formaldehyde is dominating in the emission of carbonyl compounds from
conventional BS II & BS III petrol fueled two wheeler vehicles. In detail formaldehyde
emission is 1.9% more in lower aromatic and sulfur content (BS III petrol) fueled vehicles
compared to slightly higher aromatic and sulfur content (BS II petrol) fueled vehicles in
respect to respective total carbonyl emission. Acetaldehyde, Acetone, Acrolein,
Crotonaldehyde are next to the formaldehyde emission level. Acetaldehyde is major
carbonyl emission in the oxygenated (BS III petrol+5% ethanol) blended fuel vehicles.
Two wheeler vehicles run by 5% ethanol blended fuel, emitted 40% and 53% average more
Acetaldehyde, comparing with BS II Petrol and BS III Petrol. Increase in acetaldehyde
emission for BS III petrol + E5 run vehicle may be due to partial oxidation of ethanol during
combustion. Karl-Erik Egebäck et al (2005) found similar observation for ethanol blended
petrol fuel.
Conventional fuels (i.e. BS II Petrol & BS III Petrol) emit higher formaldehyde, acetone,
acrolein, propionaldehyde, n-valeraldehyde than Ethanol blended fuel (BS III Petrol+E5)
gasoline. This may be due to complete combustion and oxidation in the presence of
oxygenated fuel in BS III Petrol.
The total average aldehyde and ketone emission results revealed that vehicles run by lower
aromatic content petrol (i.e. BS III Petrol) produced 17.7% and 80.2 % more total carbonyl
emission than higher (than BS III petrol) aromatic content petrol (BS II petrol ) and 5%
ethanol blended BS III Petrol (BS III+E5), respectively. (Yao et al. 2008) suggested that
reduction in aromatic content in Gasoline increases aldehyde emission. The higher aldehyde
emissions may be the result of increased fraction of the paraffin and olefins (Oberdorfer et al,
1967) and Wigg et al, 1973).
Another most important findings is that blending of 5% ethanol with BS III petrol reduces
the total carbonyl emission to almost half (44.4% reduction) compared to total carbonyl
emission coming from BS III petrol. This tremendous reduction may be due to the presence
of ethanol in BS III petrol which supplies more free oxygen, resulting in more complete
combustion.
5.1.2 Three wheeler
Figure 4.5 to 4.8 shows the carbonyl emissions from three wheeler vehicle categories for BS
II Diesel, BS III Diesel, Compressed Natural Gas (CNG) and 10% Bio-diesel blend with BS
III Diesel fuels. The order of increasing formaldehyde emissions corresponds to BS III
Diesel+B10, BS II Diesel, BS III Diesel and Compressed Natural gas. Higher cetane number
fuel (BS III diesel) emits higher carbonyl emissions than lower cetane number fuel (BS II
diesel) (Wagner et.al, 1996). The other important property is higher sulfur content in BS II
Diesel also one of the parameter to emit lower aldehyde emissions (Yung-chen yao et.al,
2008).
Figures 4.9 to 4.12 show that the carbonyl compound emissions from BS II petrol, BS III
Petrol, BS III Petrol+E5 and Liquefied Petroleum Gas (LPG) fueled vehicles. Based on
experimental results, increasing order of carbonyl emissions from above mentioned fuel are
given below:
CNG < LPG < BS III Petrol+ E5 < BS II Petrol < BS III Petrol
(20.624 µg/km) < (27.928 µg/km) < (45.077 µg/km) < (57.978 µg/km) < (60.664 µg/km)
The carbonyl emission is less in LPG, may be due to cylinder combustion. In LPG vehicles,
improved and smoother acceleration, reduced combustion chamber and spark plug deposit
leads (due to gaseous state) to less carbonyl emissions. Emissions of aldehydes from LPG
vehicles nearly always generate lower than diesel and often lower than petrol (Anonymous,
2009).
Major aldehydes emitted by ethanol blended fueled (BS III Petrol+E5) vehicles are
acetaldehyde and formaldehyde compared to other aldehydes. In cylinder combustion ethanol
produces acetaldehyde emission (Magnusson Roger et al, 2002).
The total carbonyl emission from BS III Petrol fueled vehicle accounts 54%, 72%, 43%, 67%
and 66% more than Liquefied petroleum gas, BS II Diesel, BS III Diesel, BS III Diesel+B10
and Compressed natural gas fuels respectively. Conventional fuels (BS II Petrol and BS III
Petrol) generate higher aldehydes emission than LPG and ethanol blend fuel. Considering

Conventional fuels, BS II petrol (sulfur content: 500 mg/kg) vehicle gives slightly less
aldehyde (carbonyl) emissions than BS III petrol (sulfur content: 350 mg/kg) vehicle due to
reduction of aromatic content and sulfur content. Reduction of maximum aromatic content in
BS III petrol is less than BS II petrol may resulted in increased aldehydes emission for BS III
petrol vehicles. Yao et al. (2008) also showed that reduction in aromatic content increased
aldehydes emission.
5.1.3 Four wheeler passenger car
Figure 4.14 shows Carbonyl emissions from BS II Petrol fueled vehicles majorly emit
acrolein, acetaldehyde, formaldehyde and methyl ethyl ketone. With BS III Petrol fueled
vehicles, acetone is dominating from other carbonyls followed by formaldehyde and by
acetaldehyde. The emissions from four wheeler vehicle are less than two wheeler category
because of exhaust treatment processes (warmed-up catalyst results in reduction in aldehyde
emission). As per Bharat stage emission norms, four wheeler category norms are stringent
than two wheeler and three wheeler norms.
The average total carbonyl emissions from BS III petrol (figure 4.15) and 5% ethanol blend
(BS III petrol+E5) fueled four wheeler (figure 4.16) are more than BS II petrol fueled four
wheeler may be due to fuel aromatics, olefins, paraffin, sulfur and benzene contents.
Particularly, decreasing the amount of aromatic content, benzene content and sulfur content
increases aldehyde emissions. In the total carbonyl compound emissions of four wheelers
(three vehicles), the increase in the individual carbonyl compound emissions correspond to
following order of the BS II Petrol fuel (Figure 4.14):
Methyl ethyl ketone < Acetaldehyde < Formaldehyde < Acrolein
BS II Petrol and ethanol blend fueled vehicles emit majorly the above mentioned emissions
because of advanced injection technology and catalytic converter design parameters (i.e cell
density, percentage change in catalyst, etc.,) the carbonyl emissions are less when compared
to three wheeler category.
Considering the total average carbonyl emissions from BS III Petrol (figure 4.15) fueled
passenger car gives less (37%) than BS II Petrol may be due to increased percentage of
complete combustion in engine in-cylinder compared with BS II Petrol.
In the total carbonyl compound emissions of four wheelers (three vehicles), increase in the
individual carbonyl compound emissions correspond to following order of the 5% ethanol
blended BS III Petrol fuel (Figure 4.16):
Acetaldehyde < Formaldehyde < Acrolein
Figure 4.17 shows the comparison of average total carbonyl compound emissions using
various fuels. In India, now only the automobile manufacturers start to produce dedicated
CNG engine vehicles. While doing this project the testing has been done on retro-fitment
vehicle due to un-availability of dedicated CNG vehicle in the market. As far as the emission
point of concern, the Compressed Natural gas (CNG) vehicles emitted more amounts of total
carbonyl emission compared to other seven fuels. This may be due to older engine
technologies and poor exhaust treatment process which emits higher aldehyde emission.
Newkirk M.S et al, 1995 explained that formaldehyde emissions from CNG engines without
catalyst could be rather high.

Figure 4.18, 4.19, 4.20 and 4.21 represents the total average carbonyl emissions from
Liquefied Petroleum Gas (LPG), BS II Diesel, BS III Diesel and B10 blended BS III Diesel
respectively. Vehicle mass emission test has been done with same vehicle model, vintage and
fuels (BS II Diesel, BS III Diesel and BS III Diesel+B10). The results show that,
formaldehyde, acetaldehyde and acrolein emissions dominated by all three fuels (BS II
Diesel, BS III Diesel and B10 blended BS III Diesel) because of improper air fuel ratio and
insufficient combustion air result in improper combustion and it leads to aldehyde emissions.
Bio diesel blend fuel vehicle emits higher acetaldehyde emission than other carbonyl
emission (i.e formaldehyde, acrolein, acetone etc.)
Figure 4.22 shows the comparison of total average carbonyl emission from different fuels.
The Conventional fuels emit less carbonyl emissions than LPG and CNG fuels. BS II Petrol,
BS III Petrol, Ethanol blend fuels releases less emission because petrol engine vehicles are
having new and effective treatment devices (Catalytic converter) compared with retro-fitment
vehicles (two years older below 10000 km).
Considering BS II Diesel, BS III Diesel and B10 blended fuel vehicles where the oxidation
catalysts are used. Both catalytic converter and oxidation catalyst are reduced the amount of
total carbonyl emission.
5.1.4 Light commercial vehicle (LCV)
Figure 4.23, 4.24, 4.25 and 4.26 shows that the average carbonyl emissions by Light
Commercial Vehicle engines run by BS II Diesel, BS III Diesel, BS III Diesel+B10 and
Compressed Natural Gas respectively. Out of three fuels (BS II Diesel, BS III Diesel and
B10+BS III Diesel), engine run by BS III Diesel+B10 gives more carbonyl emission (97.224
g/kW.hr) than BS II Diesel (56.663 g/kW.hr) and BS III Diesel (81.562 g/kW.hr). Correa S
M et al. (2008) experimental study shows that Formaldehyde, Acrolein, Crotonaldehyde,
Propinaldehyde, Methacrolein, acetone and Butyraldehyde are major emission from B10+ BS
III Diesel fuel is higher than conventional diesel fuels (BS II Diesel and BS III Diesel).
C. He et al, 2009 experimental results indicates that biodiesel-fueled engine almost have
triple carbonyls emissions of diesel-fueled engine.
Figure 4.26 explained that CNG fueled LCV engine gives higher carbonyl emission (116.343
g/kW.hr) than other three fuels. Meeks Jr., N.N et al (1995) explained that a single methane
and oxygen molecule can directly produce formaldehyde as a stable intermediate combustion
product. Quenching the formaldehyde molecule before it can act on oxygen molecule can
leave formaldehyde in the exhaust. Similarly, acetaldehyde and acrolein are stable
compounds that can be produced from partial combustion of ethane. Because natural gas
largely consists of methane and ethane, aldehyde testing was limited to their direct analogs:
formaldehyde, acetaldehyde, and acrolein (Meeks et al, 1992).
Figure 4.27 shows various fuels average total carbonyl compound emissions comparison
from the light commercial vehicles. Carbonyl emissions are in the increasing order of the
following:
BS II Diesel < BS III Diesel < B10+BS III Diesel< CNG

5.1.5 Heavy commercial Vehicle (HCV)
Figure 4.28, 4.29 and 4.30 shows that the average carbonyl emissions emitted by Heavy Commercial
Vehicle engines which is run by BS II Diesel, BS III Diesel, BS III Diesel+B10 and Compressed
Natural Gas respectively. The average total carbonyl emission results revealed that vehicles run by
Bio-diesel blended fuel (121.97 mg/kW.hr) produced 45% and 23% more emission than BS II Diesel
(67.37 mg/kW.hr) and BS III diesel (93.96 mg/kW.hr). Bio-diesel blended fueled engine releases
high carbonyl emission because bio-diesel itself contains some appreciable amount of carbonyl
compounds. Bio-diesel inheriting oxygen atoms are basically an ester mixture of saturated and non-
saturated fatty acids which may include secondary oxidation products (like volatile and non volatile
carbonyl compounds). Yacoub et al. (1996) mentioned that aldehyde emissions increase as the
cetane number of the fuel is increased (lower fuel density and aromatic content). Weidmann et al.
(1988) investigated that the emissions of aldehyde from diesel engine were slightly lower for lower
cetane number and higher for higher cetane number.
Figure 4.31 show that the total average carbonyl emissions emitted by Compressed Natural Gas
fueled (CNG) Heavy Commercial Vehicle engines. It explained that CNG fueled HCV engine gives
higher carbonyl emission (127.52 mg/kW.hr) than other three fuels (BS II Diesel, BS III Diesel and
BS III Diesel+B10). The reason for higher carbonyl emissions are same as mentioned in Light
Commercial Vehicle engine. In Both Light Commercial Vehicle and Heavy commercial Vehicle
CNG engines were converted from diesel engines so that combustion inside the cylinder is not
perfect while comparing with diesel fueled (BS II Diesel, BS III Diesel and BS III Diesel+B10)
engines. Figure 4.32 show that the comparison of total average carbonyl emission emitted by four
fuels.
5.2. Methane Emissions
This section presents methane emissions per kilometer results for each fuel of three vehicle
categories analyzed. Methane emissions were estimated by the use of bag collection at that
time of testing (Mass emission Test). The bag collection time can vary with respect to vehicle
category and fuels. A summary of the results are provided in Annexure IV.
The Methane emissions from BS II Petrol and BS III Petrol fueled two wheeler vehicle
category is almost same level. Both fuels were tested in same model and same vintage
vehicles. Due to the incomplete combustion inside the engine and the incomplete oxidation of
methane at exhaust develop higher methane emission (RE Hayes, 2004).
The ethanol blended petrol fueled vehicle (4.7 mg/km) releases 3.61 times and 2.76 times
more methane emissions than conventional fuels (1.3 mg/km & 1.7 mg/km for BS II & BS III
petrol respectively. Results showing in figure 4.33 describes the vehicles with 5% ethanol
blended BS III Petrol are giving more methane emission than using BS II & BS III Petrol. In
the experiment catalytic converter efficiency was taken as same for all. This concludes,
increase in ethanol percentage in gasoline enhances the methane emission in the exhaust may
be due to increase in octane number of the gasoline which has the probability of knocking
(Anonymous, 2008).
In three wheeler category, vehicle model used for testing is same for BS II Diesel, BS III
Diesel and 10% bio-diesel blended BS III diesel fuels (figure 4.34). The emission level of
methane (F) from Compressed Natural Gas fueled vehicles is more due to presence of
methane in compressed natural gas emits more methane than other fuels.
Figure 4.35 shows the comparison of average methane emission from BS II Petrol, BS III
Petrol, E5+ BS III Petrol, LPG, BS II Diesel, BS III Diesel and B10+BS III Diesel and CNG
fueled four wheeler category passenger cars. Retrofitted CNG vehicle emits more methane
than conventional, blended and alternative fuels (Annexure VI). The advancement in exhaust
after treatment technology gives fewer amounts of HC emissions but average methane
emission level is increasing may be because of cylinder combustion characteristics or due to
catalytic converter not attaining peak conversion temperatures.
Figure 4.36 shows that CNG fueled engine emits more methane (197 mg/kW.hr) than BS II
Diesel (138 mg/kW.hr) and BS III Diesel (151 mg/kW.hr) and B10+BS III Diesel (127
mg/kW.hr) due to higher methane content (Min 87% methane) (Annexure VI).
Figure 4.37 shows the comparison of average methane emission from BS II Diesel, BS III
Diesel, B10+BS III Diesel and CNG fuels. Due to un- availability of dedicated CNG, HCV
engines retro fitment CNG engines has been tested. Figure 4.37 shows that CNG engine (706
g/kW.hr) emits higher amount of methane than BS II Diesel (0.066 g/kW.hr), BS III Diesel
(51 g/kW.hr) and B10 blended BS III Diesel (0.063 g/kW.hr) fuels.

6. CONCLUSION
For two wheeler category
The average of total aldehyde and ketone emission results revealed that vehicles run by BS
III Petrol (17.47 µg/km) produced 15% and 44 % more emission than BS II petrol (14.84
µg/km) and 5% ethanol blended BS III (BS III+E5) Petrol (9.72 µg/km), respectively.
Reduction of maximum aromatic content in BS III petrol as compared to BS II petrol may
have resulted in increased aldehyde emission for BS III run vehicles.
Two wheeler vehicles, run by 5% ethanol blended BS III Petrol, emitted 40% and 53%
average more Acetaldehyde (4.91 µg/km), comparing with BS II Petrol (2.97 µg/km) and BS
III Petrol (2.26 µg/km). Increase in Acetaldehyde emission for BS III+E5 run vehicle may be
due to partial oxidation of ethanol during combustion.
Conventional fuels (BS II Petrol & BS III Petrol) emit higher formaldehyde, acetone,
acrolein, propionaldehyde, Valeraldehyde compared to alternative fuel (E5 + BSIII Petrol).
Michelle Heath reported that conventional fuels can also be modified to a reformulated
gasoline to help reduce toxic emissions. The oxygen content of ethanol fuels used in properly
modified vehicles results in increased energy efficiency and engine performance. Extended
spark-plug life and lower carbon deposits are also expected because ethanol burns cleaner
than gasoline.
The ethanol blended petrol (4.7 mg/km) emits more methane i.e 3.61 times and 2.76 times
more than conventional fuels (1.3 mg/km & 1.7mg/km) for BS II & BS III petrol
respectively.
For three wheeler category
The average total aldehyde and ketone emission results revealed that vehicles run by BS III
diesel (34.65 µg/km) emits 51.5% , 42.4% and 40.4 % more than BS II Diesel (16.77
µg/km), 10% bio diesel blended BS III Diesel (19.94 µg/km) and CNG (20.62 µg/km),
respectively. Yacoub et al. (1996) mentioned that aldehyde emissions increase as the cetane
number of the fuel increased (lower fuel density and aromatic content).
Three wheeler vehicles run by 10% biodiesel blended BS III Diesel, emitted 95%, 27% and
83% more Acetaldehyde (12.26 µg/km) compared to BS II Diesel (0.54 µg/km) BS III
Diesel (8.92 µg/km) and CNG (1.99 µg/km) respectively.
Based on experimental results, increasing order of carbonyl emissions from BS II petrol, BS
III Petrol, E5+BS III Petrol and LPG fueled vehicles is as follows:
LPG < E5+BS III Petrol < BS II Petrol < BS III Petrol
(27.93 µg/km) < (45.08 µg/km) < (57.98 µg/km) < (60.66 µg/km)
Three wheeler vehicles run by CNG emits more methane (2852 mg/km) compared to BS II
Diesel (1 mg/km), BS III Diesel (1.3 mg/km), 10% biodiesel blended BS III Diesel (1
mg/km), BS II Petrol (17.3 mg/km), BS III Petrol (1 mg/km), E5+ BS III Petrol (2.4 mg/km)
and LPG (8.7 mg/km).

Major aldehydes emissions emitted by 5% ethanol blended petrol fueled vehicles are
acetaldehyde and formaldehyde compared to other aldehydes.
Conventional fuels (BS II Petrol and BS III Petrol) generate higher aldehydes emission than
LPG and E5 petrol. Considering Conventional fuels, BS II petrol vehicle gives slightly less
emissions than BS III petrol vehicle due to reduction of aromatic content. Reduction of
maximum aromatic content in BS III petrol than BS II petrol may have resulted in increased
aldehydes emission for BS III run vehicles.
For four wheeler category
The average total aldehyde and ketone emission results revealed that vehicles run by CNG
(27.49 µg/km) produced 47.1%, 66.7% and 51.2 % more emission than BS II Petrol (14.52
µg/km), BS III petrol (9.14 µg/km), 5% ethanol blended BS III (BS III+E5) Petrol (13.41
µg/km) respectively. Comparing the aldehyde emissions from natural gas fueled vehicle with
the gasoline fueled vehicle shows an increase of 20% in the formaldehyde value when the
engine is fueled with natural gas while the catalytic converter efficiency for formaldehyde
was 96% and 98%. Retro-fitment CNG vehicles gives more aldehyde emission when
compared to direct CNG vehicles.
Acrolein emission is higher in BS II Petrol (9.97 µg/km) and 5% ethanol blended BS III
Petrol (10.73 µg/km) run vehicles compared to other aldehydes and ketone emissions (from
BS III petrol and CNG vehicle acrolein emission were absent).
As per the experimental analysis, the Increasing order for formaldehyde emission from
gasoline engine are as follows:
E5+BS III Petrol < BS III Petrol < BS II Petrol < CNG
(1.95 µg/km) < (2.69 µg/km) < (3.41 µg/km) < (8.72 µg/km)
The increasing order of average methane emission from conventional, alternative and blended
fuel are as follows:
BS II Petrol < E5+BS III Petrol < BS III Petrol < CNG
(5.7 mg/km)< (6.3 mg/km) < (10 mg/km) < (181 mg/km)
Considering Diesel engine fuels, Propionaldehyde, acetone, Crotonaldehyde, Methyl ethyl ketone, n-
Butyraldehyde, Methacrolein, Benzaldehyde, m-Tolualdehyde and Hexanal emissions were absent.
The complete combustion percentage will be more when compare to older engines and technologies.
The aldehyde emissions are absent due to the improved vehicle catalytic converter technologies,
location of catalytic converter and better fuel injection technologies.
For Light Commercial Vehicle’s
Out of three fuels (BS II Diesel, BS III Diesel and B10+BS III Diesel), engine run by B10+
BS III Diesel emits more carbonyl (97.22 g/kW.hr) compared to BS II Diesel (56.66 g/kW.hr)
and BS III Diesel (81.56 g/kW.hr).
CNG fueled LCV engine emits more carbonyls (116.34 mg/kW.hr) than BS II Diesel (56.66
mg/kW.hr), BS III Diesel (81.562 mg/kW.hr) and B10+ BS III Diesel (97.22 mg/kW.hr). A
single methane and oxygen molecule can directly produce formaldehyde as a stable
intermediate combustion product.
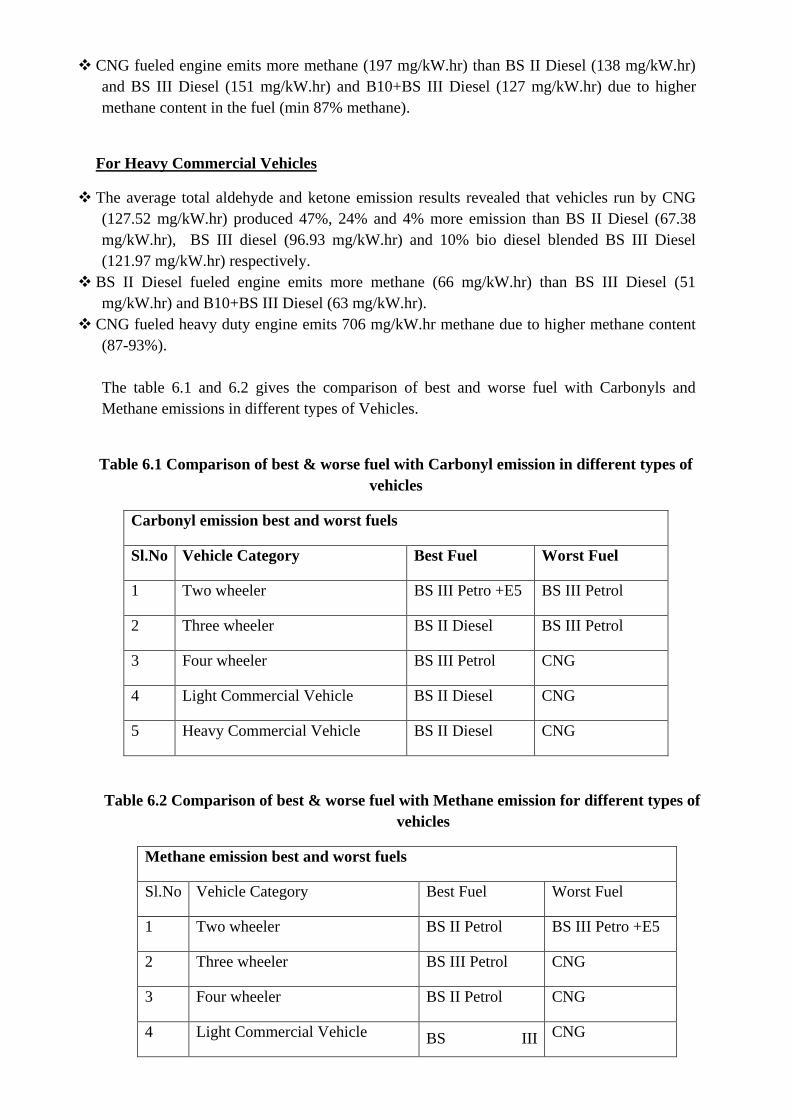
CNG fueled engine emits more methane (197 mg/kW.hr) than BS II Diesel (138 mg/kW.hr)
and BS III Diesel (151 mg/kW.hr) and B10+BS III Diesel (127 mg/kW.hr) due to higher
methane content in the fuel (min 87% methane).
For Heavy Commercial Vehicles
The average total aldehyde and ketone emission results revealed that vehicles run by CNG
(127.52 mg/kW.hr) produced 47%, 24% and 4% more emission than BS II Diesel (67.38
mg/kW.hr), BS III diesel (96.93 mg/kW.hr) and 10% bio diesel blended BS III Diesel
(121.97 mg/kW.hr) respectively.
BS II Diesel fueled engine emits more methane (66 mg/kW.hr) than BS III Diesel (51
mg/kW.hr) and B10+BS III Diesel (63 mg/kW.hr).
CNG fueled heavy duty engine emits 706 mg/kW.hr methane due to higher methane content
(87-93%).
The table 6.1 and 6.2 gives the comparison of best and worse fuel with Carbonyls and
Methane emissions in different types of Vehicles.
Table 6.1 Comparison of best & worse fuel with Carbonyl emission in different types of
vehicles
Carbonyl emission best and worst fuels
Sl.No Vehicle Category Best Fuel Worst Fuel
1 Two wheeler BS III Petro +E5 BS III Petrol
2 Three wheeler BS II Diesel BS III Petrol
3 Four wheeler BS III Petrol CNG
4 Light Commercial Vehicle BS II Diesel CNG
5 Heavy Commercial Vehicle BS II Diesel CNG
Table 6.2 Comparison of best & worse fuel with Methane emission for different types of
vehicles
Methane emission best and worst fuels
Sl.No Vehicle Category Best Fuel Worst Fuel
1 Two wheeler BS II Petrol BS III Petro +E5
2 Three wheeler BS III Petrol CNG
3 Four wheeler BS II Petrol CNG
4 Light Commercial Vehicle BS III CNG

Diesel+B10
5 Heavy Commercial Vehicle BS II Diesel CNG

7. RECOMMENDATIONS
A huge database of unregulated carbonyl emission from Indian vehicles with different fuels
has been generated in this project. This database in future may work as the preliminary
platform for any future norms/guideline for Indian Vehicular Emission Norms. During the
course of this project some recommendations have been identified and mentioned below.
As an outcome of this project, it has been concluded that retro-fitment CNG fueled
vehicle emits significantly more amount of carbonyl emissions, compared with other
fueled vehicles. More studies can be done on retro-fitment CNG vehicles which are thrust
area of future fuel to improve clean environment.
In LCV and HCV categories, Biodiesel blended diesel emits significant amount of
carbonyl emission next to CNG category. This significant finding demands future detailed
study in this area. A comparative study of gain (power, regulated emission and easy
availability) and loss (increased unregulated emissions) from biofuel may be a very
interesting area of future research.
This study indicates that India may require directive or emission norms for aldehyde and
ketone emission for certain category of vehicle and fuel. [In this regard, it is interesting to
note that California has already legislated formaldehyde emission norms for Passenger
cars (0.015 g/mile) and for Light duty vehicle (0.015 g/mile)]. But, more detailed All
India Coordinated Research Project (AICRP) on this area is required before imposing any
such directive or emission norms.

GLOSSARY
Compression ratio:
It is the ratio between the volume of the cylinder and combustion chamber when the piston is at the
bottom of its stroke, and the volume of the combustion chamber when the piston is at the top of its
stroke.
Secondary air injection:
The first systems injected air very close to the engine, either in the cylinder head's exhaust ports or in
the exhaust manifold. These systems provided oxygen to oxidize (burn) unburned and partially-
burned fuel in the exhaust before its ejection from the tailpipe. There was significant unburned and
partially-burned fuel in the vehicle exhaust and so secondary air injection significantly reduced
tailpipe emissions. However, the extra heat of re-combustion, particularly with an excessively rich
exhaust caused by misfiring or a mal-adjusted carburetor, tended to damage exhaust valves and could
even be seen to cause the exhaust manifold to incandesce.
Equivalence ratio:
The equivalence ratio of a system is defined as the ratio of the fuel-to-oxidizer ratio to the
stoichiometric fuel-to-oxidizer ratio.
Ignition timing:
In a spark ignition internal combustion engine, the process of setting the time that a spark will occur
in the combustion chamber (during the compression stroke) relative to piston position and crankshaft
angular velocity.
Inertia Setting:
A physical object’s inertia describes the resistance to a change in its state of motion. By varying the
inertia setting on the chassis dynamometer the influence of vehicle mass is isolated from the effect
this change may have on other vehicle properties, e.g. rolling resistance. An increase in inertia will
yield a higher engine load during acceleration but also a less rapid deceleration due to the increased
momentum. A reduction in inertia, obviously, has the opposite effect. At constant speed a change in
inertia will not affect engine load.
Aromatic content:
Percent aromatic hydrocarbons present in a solvent mixture or in a compound.
REFERENCES
Anonymous, U.S. Departmentof Energy --
www.afdc.energy.gov/afdc/vehicles/natural_gas_emissions.html, report on 5/28/09
Anonymous, Climate Leaders, Greenhouse Gas Inventory Protocol Core Module Guidance,
Direct emissions from mobile combustion sources, May 2008.
Anonymous, Update of Methane and Nitrous Oxide Emission Factors for On-
Highway Vehicles, Assessment and Standards Division Office of Transportation and Air
Quality, U.S. Environmental Protection Agency. 2004,
Atlantic Consulting, LPG and Local Air Quality, Scientific review, 2009
Chao H, Yunshan G , Jianwei T , Kewei Y, Xunkun H, Junfang W ,Qiuwen Y, Asad N S,
Comparison of carbonyl compounds emissions from diesel engine fueled with biodiesel and
diesel, Atmospheric Environment 43,3657–3661, 2009
Chiung-Yu P, Hsi-Hsien Y, Cheng-Hang L and Shu-Mei C, Effects of the biodiesel blend
fuel on aldehyde emissions from diesel engine exhaust, Atmospheric Environment, Volume
42 (5), 906-915, 2008.
Grimm H. emissions of benzene and other hydrocarbons in exhaust of otto-engines and the
effect of catalytic after-treatment. Ph.D Thesis. Technical university, Clausthal, Germany,
1988
Heywood J.B., Internal Combustion Engine Fundamentals, McGraw-Hill, 1988.
Weidmann K., Menrad H., Reders K., Hutcheson R. C., Diesel Fuel Quality Effects on
Exhaust Emissions, SAE paper, 881649, 1988.
Karl-Erik E, Magnus H, Roger Wolm, Björn R, Blending of ethanol in gasoline for spark
ignition engines, AVL MTC AB, 2005.
Kaiser E.W, Siegal W.O, Henig Y.I, andersoon R.W, Trinker F.H. Effect of fuel structure
emission from a spark-ignited engine. Environ Sci Technol 25:2005-2010 (1991)
Light Duty Vehicle Methane and Nitrous Oxide Emissions, Greenhouse Gas Impacts,
Northeast States Center for a Clean Air Future, July 28, 2004.
Machado C.S, Arbilla G, Carbonyl emissions in diesel and biodiesel exhaust, Atmospheric
environment, 42 (4), 769-775, 2008
Magnusson R, Nilsson C, Andersson B, Emissions of Aldehydes and Ketones from a Two-
Stroke Engine Using Ethanol and Ethanol-Blended Gasoline as Fuel, Environmental science
& technology ISSN 0013-936X, , vol. 36 (8), 1656-1664, 2002

Meeks Jr., N.N., Arco Oil and Gas Co, Air Toxics Emissions From Gas-Fired Engines,
Journal of Petroleum Technology, Volume 44, Number 7, 840-845, 1992
Oberdofer, P.E,.The determination of aldehydes in automotive exhaust gas, SAE 670123,
1967
Quader A.A, How injector, engine and fuel variable impact smoke and hydrocarbon
emissions with port fuel injection. Technical paper No. 890623, Society of Automotive
Engineering, 1989
Rui de A, João V de A, Edegar Y.H, Emission of aldehydes from light duty diesel vehicles,
Rev. Saúde Pública, 39 (3), 2005
R.E. Hayes, Catalytic solutions for fugitive methane emissions in the oil and gas sector,
Chemical Engineering Science, Volume 59 (19), 4073-4080, 2004
Sloane, T.R, chemistry of combustion process. American chemical society symposium series
No. 249, 1984
Siegl W.O, McCabe R.W, Chun W, Kaiser E.W, Perry J, Henig Y.I, Trinker F.H, Anderson
R.W, Speciated hydrocarbon emissions from the combustions of single component fuels. I.
Effects of fuel structure. J Air waste Mamag Assoc 42: 912,1992
Warner-Selph, M.A, Harvey C.A, Assessment of unregulated emissions from gasoline
oxygenated blends, SAE 902131, 1990
Weaver, C.S, Natural gas vehicles- a review of the state of the art, SAE 891223, 1989.
Wigg, E. E. Reactive exhaust emission from current and future emission control system.
SAE 730196, 1973.
Yacoub Y, Method procedures for sampling aldehyde and ketone using 2,4-dinitro-
phenylhydrazine—a review, Proceedings of the Institution of Mechanical Engineers, Part D:
Journal of Automobile Engineering, 213 (5), 1999.

ANNEXURE I
Health effects of Aldehydes and Ketones
Sl.No Name of aldehyde/ketone Health effects
1 Formaldehyde Irritation of the eyes, respiratory tract , nausea,
headache, tiredness, and thirst.
2 Acrolein, Acetaldehyde and
Crotonaldehyde
Irritation of the eyes, skin, and mucous
membranes of the upper respiratory tract.
3 Propionaldehyde, n-Butyraldehyde and
Isobutyraldehyde
Eye and respiratory tract irritation
4 Other high-molecular- weight aldehydes
such as Chloroacetaldehyde,
valeraldehyde,
Furfural, the Butyl aldehydes , Glyoxal,
Malonaldehyde, Benzaldehyde,
Synapaldehyde
less toxic than formaldehyde and Acrolein
5 methyl ethyl ketone affects nervous system, creates headaches,
dizziness, fatigue, narcosis (acts like a narcotic),
nausea, vomiting, and passing out ,irritates the
eyes, nose, skin and throat, contact with the eyes
can permanently damage them. Repeated
exposure may damage the nervous system and
may affect the brain.

ANNEXURE II
VEHICLE TEST MATRIX
Test matrix of Project activity
Sl.No Fuel Consumption 2
Wheelers
3
Wheelers
4 Wheelers
Passenger
Cars
Light Duty
Commercial
vehicles
Heavy Duty
Commercial
vehicles
1 Reference BS II Petrol 3 3 3
2 Reference BS II Diesel 3 3 3 3
3 Reference BS III Petrol 3 3 3
4 Reference BS III Diesel 3 3 3 3
5 LPG (retrofitted) 3 3
6 CNG (retrofitted) 3 3 3 3
7 Ethanol 5% Blend with BS
III Petrol
3 3 3
8 Biodiesel 10% blend with BS
III Diesel
3 3 3 3

ANNEXURE III
FUEL SPECIFICATIONS
Gasoline specification
Parameter Unit BS II Petrol BS III Petrol Test method
Research Octane Number (RON) 95 95 EN 25164
Motor Octane Number (MON) 85 85 EN 25163
Density @ 15 C kg/m3 748-762 740-754 ISO 3675
Reid Vapour Pressure kPa 56-60 56-60 EN 12 (BS II)
Pr EN ISO; 13016-1; (DVPE) (BS
III)
Distillation:
Evaporated @ 100 C % v/v 49-57 50-58 EN-ISO 3405
Evaporated @ 150 C % v/v 81-87 83-89 EN-ISO 3405
Final boiling point C 190-215 190-210 EN-ISO 3405
Residue % volume 2 2 EN-ISO 3405
Hydrocarbon analysis
Olefins % v/v max 10.0 max 10.0 ASTM D 1319
Aromatics % v/v 28-40 29-35 ASTM D 1319
Benzene % v/v max 1.0 max 1.0 Pr. EN 12177 (BS II)
ASTM D 1319 (BS III)
Oxygen content % m/m max 2.3 max 1.0 EN 1601
Sulphur content mg/kg max 100 max 10.0 Pr. EN ISO/DIS 14596 (BS II)
ASTM D 5453 (BS III)
Lead content mg/l max 5.0 max 5.0 EN 237
Phosphorous content mg/l max 1.3 max 1.3 ASTM D 3231
Source: GSR 686 (E) (BS II) & GSR 84(E) (BS III))

Diesel Specification
Parameter Unit BS II Diesel BS III Diesel Test method
Cetane Number 52-54 52-54 EN-ISO 5165
Density @ 15 ºC kg/m3 833-837 833-837 EN-ISO 3675
Viscousity @ 40 ºC mm2/sec 2.5-3.5 2.3-3.3 EN-ISO 3104
Distillation:
50% point ºC min 245 min 245 EN-ISO 3405
95% point ºC 345-350 345-350 EN-ISO 3405
Final boiling point ºC max 370 max 370 EN-ISO 3405
Flash point ºC min 55 min 55 EN-22719
CFPP ºC max -5 max -5 EN 116
Polycyclic aromatic hydrocarbon % m/m 3.0-6.0 3.0-6.0 IP 391
Water content % m/m max 0.05 max 0.02 EN-ISO 12937
Ash content % m/m max 0.01 max 0.01 EN-ISO 6245
Sulphur content mg/kg max 300 max 10.0 Pr. EN-ISO/DIS 14596
(BS II) ASTM D 5453
(BS III)
(Source: GSR 686 (E) (BS II) & GSR 74 (E) (BS III))
Jatropha Bio-diesel specification
S.No. Characteristics Requirement
i. Density at 15°C, kg/m3 860-900
ii. Kinematic Viscosity at 40°C, cSt 2.5-6.0 iii. Flash point (PMCC) °C, min 120 iv. Sulphur, mg/kg max. 50
v Carbon residue (Rams bottom) ,% by mass, max 0.05 vi. Sulfated ash, % by mass, max 0.02
vii. Water content, mg/kg, max 500
viii Total contamination, mg/kg, max 24
ix Cu corrosion, 3 hrs at 50°C, max 1
x Cetane No., min 51 xi Acid value, mg KOH/g, max 0.5 xii Methanol, % by mass, max 0.2 xiii Ethanol, % by mass, max 0.2 xiv Ester content, % by mass, min 96.5 xv Free Glycerol, % by mass, max 0.02

xvi Total Glycerol, % by mass, max 0.25
xvii Phosphorous, mg/kg, max 10
xviii Oxidation stability, at 110°C hrs, min 6
(Source: Society of Indian Automobile Manufacturers)
Auto Compressed Natural Gas specification
Sl.no Constituent Value Tolerance
1 Wobbe Number 1350 +/- 20
2 Water, lbs/million ft3 0.5 Maximum
3 Hydrogen Sulphide, grains/100 ft3 0.1 Maximum
4 Other soluble sulphide, grains/100 ft3 0.1 Maximum
5 Carbon dioxide, vol.% 3 Maximum
6 Oxygen, vol.% 1 Maximum
Hydrocarbons (% of Total Organic Carbon Present)
7 Methane 80 Minimum
8 Ethane 10 Maximum
9 C3 and higher HC 5 Maximum
10 C6 and higher HC 1 Maximum
11 Total Unsaturated HC 1 Maximum
Other species (mole %)
12 Hydrogen 0.1 Maximum
13 Carbon Monoxide 0.1 Maximum
(Source: Haryana City Gas Distribution Ltd, Sector-29, Gurgaon)

Liquid Petroleum Gas specification
S.No. Characteristic Requirement
1 Vapour pressure at 40 0C, KPa gauge 520-1050
2 C5 Hydrocarbons and heavier, mole percent, Max 2
3 Dienes (as 1,3 Butadiene), mole percent, Max 0.5
4 Total volatile sulphur (after stenching), ppm, Max 150
5 Copper strip corrosion at 40 0C for 1 hour, Max Class 1
6 Hydrogen sulphide Pass the test
7 Evaporation residue, mg/kg, Max 100
8 Free water content Nil
9 Motor Octane Number (MON), Min 88
10 Odour Unpleasant and distinctive down to
20 percent lower explosive limit
(LEL)
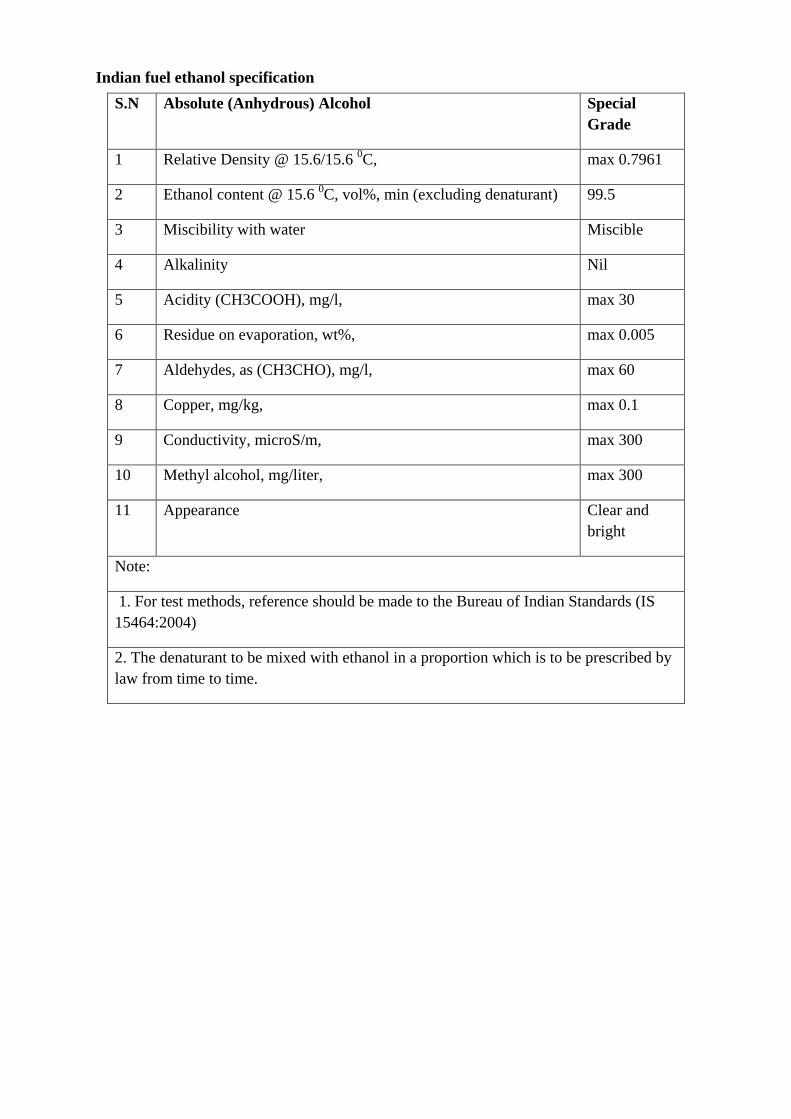
Indian fuel ethanol specification
S.N Absolute (Anhydrous) Alcohol Special
Grade
1 Relative Density @ 15.6/15.6 0C, max 0.7961
2 Ethanol content @ 15.6 0C, vol%, min (excluding denaturant) 99.5
3 Miscibility with water Miscible
4 Alkalinity Nil
5 Acidity (CH3COOH), mg/l, max 30
6 Residue on evaporation, wt%, max 0.005
7 Aldehydes, as (CH3CHO), mg/l, max 60
8 Copper, mg/kg, max 0.1
9 Conductivity, microS/m, max 300
10 Methyl alcohol, mg/liter, max 300
11 Appearance Clear and
bright
Note:
1. For test methods, reference should be made to the Bureau of Indian Standards (IS
15464:2004)
2. The denaturant to be mixed with ethanol in a proportion which is to be prescribed by
law from time to time.
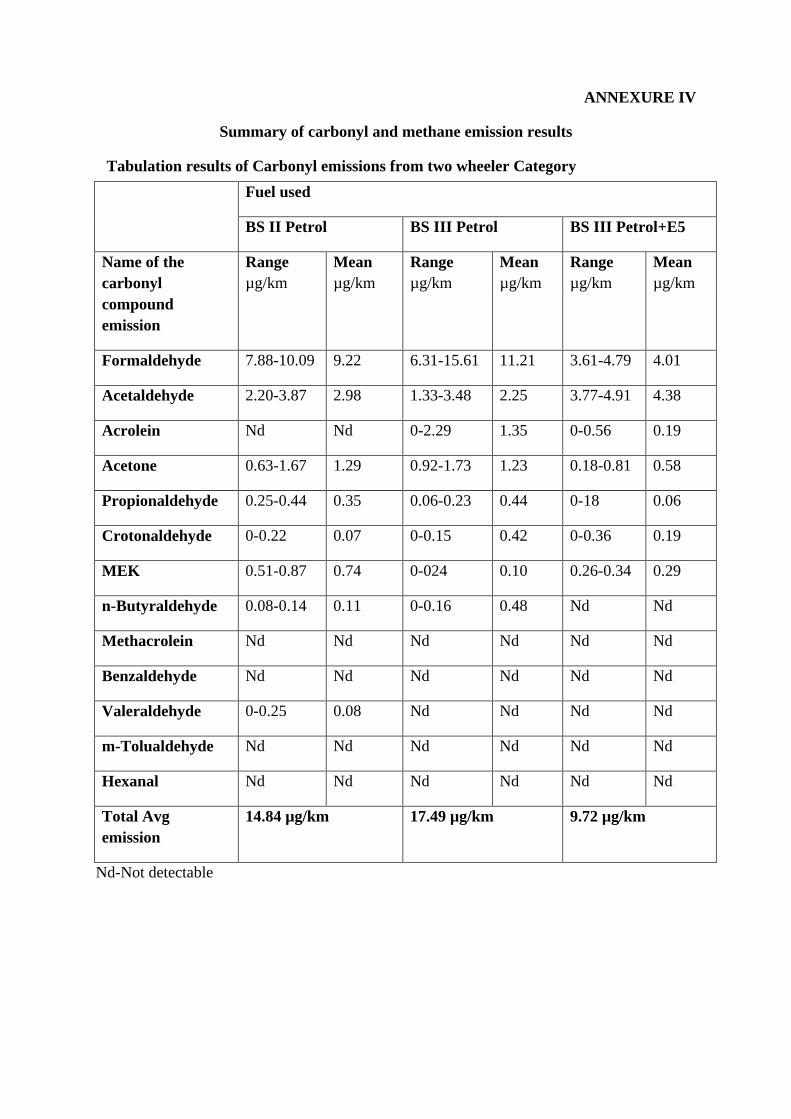
ANNEXURE IV
Summary of carbonyl and methane emission results
Tabulation results of Carbonyl emissions from two wheeler Category
Fuel used
BS II Petrol BS III Petrol BS III Petrol+E5
Name of the
carbonyl
compound
emission
Range
µg/km
Mean
µg/km
Range
µg/km
Mean
µg/km
Range
µg/km
Mean
µg/km
Formaldehyde 7.88-10.09 9.22 6.31-15.61 11.21 3.61-4.79 4.01
Acetaldehyde 2.20-3.87 2.98 1.33-3.48 2.25 3.77-4.91 4.38
Acrolein Nd Nd 0-2.29 1.35 0-0.56 0.19
Acetone 0.63-1.67 1.29 0.92-1.73 1.23 0.18-0.81 0.58
Propionaldehyde 0.25-0.44 0.35 0.06-0.23 0.44 0-18 0.06
Crotonaldehyde 0-0.22 0.07 0-0.15 0.42 0-0.36 0.19
MEK 0.51-0.87 0.74 0-024 0.10 0.26-0.34 0.29
n-Butyraldehyde 0.08-0.14 0.11 0-0.16 0.48 Nd Nd
Methacrolein Nd Nd Nd Nd Nd Nd
Benzaldehyde Nd Nd Nd Nd Nd Nd
Valeraldehyde 0-0.25 0.08 Nd Nd Nd Nd
m-Tolualdehyde Nd Nd Nd Nd Nd Nd
Hexanal Nd Nd Nd Nd Nd Nd
Total Avg
emission
14.84 µg/km 17.49 µg/km 9.72 µg/km
Nd-Not detectable

Tabulation results of Carbonyl emissions from three wheeler Category
Fuel used
Name of the
carbonyl
compound
emission
BS II Diesel BS III Diesel B10+ BS III Diesel CNG
Range Mean Range Mean Range Mean Range Mean
Formaldehyde 12.25-
15.28
13.74 19.37-
21.27
20.07 6.6-7.64 6.94 15.34-
21.89
18.06
Acetaldehyde 0.03-0.96 0.54 7.88-9.54 8.92 2.89-18.7 12.26 1.54-2.44 1.99
Acrolein 0-1.20 0.43 0.24-0.97 0.50 0-0.50 0.19 Nd Nd
Acetone 0.16-1.78 1.02 1.29-1.37 1.34 0-0.55 0.29 0.02-0.34 0.19
Propionaldehyde 0.05-0.77 0.31 0.61-1.86 1.32 0.09-0.26 0.17 0-0.66 0.22
Crotonaldehyde 0.07-0.37 0.25 0.22-1.35 0.71 Nd Nd 0.02-0.25 0.16
MEK 0-0.3 0.17 0-0.53 0.26 Nd Nd Nd Nd
n-Butyraldehyde 0-0.1 0.03 0.07-0.66 0.32 Nd Nd Nd Nd
Methacrolein 0-0.40 0.14 0.35-0.68 0.49 Nd Nd Nd Nd
Benzaldehyde 0-0.16 0.05 0-0.29 0.10 0-0.27 0.09 Nd Nd
Valeraldehyde 0-0.27 0.09 0-0.49 0.32 Nd Nd Nd Nd
m-Tolualdehyde Nd Nd 0.88-0.32 0.29 Nd Nd Nd Nd
Hexanal Nd Nd Nd Nd Nd Nd Nd Nd
Total Avg
Emission
16.77 µg/km 34.650 µg/km 19.94 µg/km 20.624 µg/km

Fuel used
Name of the
carbonyl
compound
emission
BS II Petrol BS III Petrol E5+ BS III Petrol LPG
Range Mean Range Mean Range Mean Range Mean
Formaldehyde 2.46-11.03 8.00 8.29-14.87 11.2 7.18-11.26 9.65 4.17-9.85 6.79
Acetaldehyde 1.62-5.12 3.60 2.9-7.17 5.1 8.05-12.14 8.43 2.76-6.90 5.16
Acrolein 0.94-4.44 2.78 1.81-4.44 3.1 2.95-5.48 3.89 0.68-3.79 2.68
Acetone 8.17-13.84 11.75 8.17-13.24 10.6 4.03-8.17 5.50 2.60-4.90 3.95
Propionaldehyde 4.73-5.59 5.95 4.73-7.51 5.9 2.43-4.73 3.21 1.19-2.79 2.05
Crotonaldehyde 1.37-12.13 5.14 1.37-12.13 7.5 1.31-2.72 1.80 4.27-5.31 4.67
MEK 4.00-7.36 5.43 4.00-7.36 5.4 2.19-4.00 3.04 1.95-2.75 2.25
n-Butyraldehyde 1.82-10.33 7.18 3.31-9.38 5.5 3.44-9.38 6.09 0-0.34 0.11
Methacrolein 0-2.77 1.00 0-2.77 1.0 0-2.77 1.49 0-0.28 0.12
Benzaldehyde Nd Nd Nd Nd Nd Nd Nd Nd
Valeraldehyde 0-15.34 6.79 4.57-5.16 4.9 0-5.04 1.98 0-0.17 0.06
m-Tolualdehyde 0-1.10 0.34 0-1.10 0.4 ab ab 0-0.14 0.09
Hexanal Nd Nd Nd Nd Nd Nd Nd Nd
Total Avg
emission
57.98 µg/km 60.66 µg/km 45.08 µg/km 27.93 µg/km
Nd-Not detectable

Tabulation results of Carbonyl compound emissions from four wheeler Category
Fuel used
Name of the
Carbonyl
compound
emission
BS II Petrol BS III Petrol E5+ BS III
Petrol
CNG
Range Mean Range Mean Range Mean Range Mean
Formaldehyde 1.29-6.15 3.41 1.47-3.63 2.69 0.31-3.83 1.95 4.39-13.14 8.72
Acetaldehyde 0.57-1.6 1.14 1.14-2.15 1.66 0.66-0.97 0.73 1.03-2.04 1.68
Acrolein 2.99-20.4 9.97 Nd Nd 0-16.89 10.74 Nd Nd
Acetone Nd Nd 3.11-4.93 3.93 Nd Nd 15.60-18.14 17.07
Propionaldehyde Nd Nd 0.08-0.15 0.11 Nd Nd Nd Nd
Crotonaldehyde Nd Nd Nd Nd Nd Nd Nd Nd
MEK Nd Nd 0-0.65 0.29 Nd Nd Nd Nd
n-Butyraldehyde Nd Nd 0-0.30 0.12 Nd Nd Nd Nd
Methacrolein Nd Nd 0-0.04 0.01 Nd Nd Nd Nd
Benzaldehyde Nd Nd 0-0.36 0.24 Nd Nd Nd Nd
Valeraldehyde Nd Nd 0-0.27 0.09 Nd Nd Nd Nd
m-tolualdehyde Nd Nd Nd Nd Nd Nd Nd Nd
Hexanal Nd Nd Nd Nd Nd Nd Nd Nd
Total Avg
emission
14.52 µg/km 9.14 µg/km 13.41 µg/km 27.47 µg/km
Nd-Not detectable

Fuel used
Name of the
Carbonyl
compound
emission
BS II Diesel BS III Diesel B10+ BS III
Diesel
LPG
Range Mean Range Mean Range Mean Range Mean
Formaldehyde 0.46-3.6 2.19 0.46-6 3.23 0.08-3.6 2.16 2.83-3.85 3.45
Acetaldehyde 0.66-10.20 5.70 0-5.05 1.90 0.31-9.90 5.65 5.99-7.65 7.36
Acrolein 3.47-4.01 3.66 1.14-5.28 3.30 0.59-4.62 3.09 2.94-7.65 4.53
Acetone 0-1.78 0.88 0-0.85 0.28 0-1.82 0.97 0.75-1.2 0.99
Propionaldehyde 0-0.16 0.11 0-0.13 0.05 0-0.24 0.10 0.19-1.23 0.62
Crotonaldehyde 0-0.81 0.34 0-1.04 0.39 0-1.51 0.66 0.53-1.05 0.82
MEK 0-0.8 0.39 0-0.56 0.23 0-1.25 0.77 0.8-1.91 1.20
n-Butyraldehyde 0-0.24 0.13 0-0.12 0.04 Nd Nd 0-0.49 0.37
Methacrolein 0-0.43 0.27 0-0.66 0.27 0-0.51 0.21 0.45-0.67 0.59
Benzaldehyde Nd Nd Nd Nd Nd Nd Nd Nd
Valeraldehyde 0-0.088 0.03 0-0.14 0.05 0 0.00 0-0.17 0.06
m-tolualdehyde 0-0.28 0.14 0-0.52 0.14 0-0.84 0.29 0.13-0.32 0.20
Hexanal Nd Nd Nd Nd Nd Nd Nd Nd
Total Avg
emission
13.83 µg/km 9.89 µg/km 13.88 µg/km 20.18 µg/km
Nd-Not detectable

Tabulation results of Carbonyl compound emissions from Light Commercial Vehicle
Category
Fuel used
Name of the
Carbonyl
compound
BS II Diesel BS III Diesel B10+ BS III Diesel CNG
Range Mean Range Mean Range Mean Range Mean
Formaldehyde 4.59-20.88 12.65 2.82-24.13 10.59 1.02-25.85 13.15 43.18-46.87 45.59
Acetaldehyde 7.4-10.16 8.33 2.78-11.56 8.54 4.93-
15.046
8.71 13.40-30.79 22.55
Acrolein 9.01-43.94 17.93 7.69-48.73 18.89 2.74-45.66 21.82 9.2-10.48 9.65
Acetone 0-3.95 1.97 1.06-5.82 2.31 3.20-10.2 6.47 6.88-17.28 13.92
Propionaldehyde 0-0.08 0.04 0-2.4 1.28 0-34.36 17.57 3.58-7.91 5.59
Crotonaldehyde 0.05-3.46 1.38 3.08-36.24 14.58 3.47-13.4 6.78 0.85-1.91 1.53
MEK 0.76-2.67 1.73 0-7.52 3.14 0.13-1.34 0.85 1.16-4.16 2.88
n-Butyraldehyde 0.23-3.06 1.32 0.81-17.77 6.56 1.21-8.86 4.00 3.49-6.36 4.97
Methacrolein 0-17.25 6.01 0-2.10 0.89 0-31.34 10.92 3.96-7.68 5.98
Benzaldehyde 0-1.89 1.08 0-2.97 0.99 Nd Nd Nd Nd
Valeraldehyde Nd Nd 0-1.98 0.66 0-1.35 0.79 0-3.26 1.09
m-tolualdehyde 2.03-5.61 3.68 4.85-34.57 13.14 0.93-13.89 6.15 1.80-3.67 2.58
Hexanal 0-1.66 0.55 Nd Nd Nd Nd Nd Nd
Total Avg
emission
56.66 mg/kW.hr 81.56 mg/kW.hr 97.22 mg/kW.hr 116.34 mg/kW.hr
Nd-Not detectable

Tabulation results of Carbonyl compound emissions from Heavy Commercial Vehicle
Category
Fuel used
Name of the
Carbonyl
compound
BS II Diesel BS III Diesel B10+ BS III Diesel CNG
Range Mean Range Mean Range Mean Range Mean
Formaldehyde 14.54-26.61 20.02 27.47-32.7 29.48 17.34-52.46 39.12 45.08-91.35 66.40
Acetaldehyde 6.31-13.95 9.28 22.36-33.24 28.05 11.66-15.76 13.45 11.64-27.89 19.72
Acrolein 7.87-13.99 11.75 6.94-10.83 9.50 6.61-32.76 15.44 10.76-14.87 13.45
Acetone 4.89-5.45 5.18 3.83-14.16 10.70 5.66-9.32 6.91 6.49-7.60 7.20
Propionaldehyde 1.26-5.66 3.13 0-10.27 4.96 1.83-4.50 3.11 0.11-4.24 2.01
Crotonaldehyde 0.27-1.12 0.79 4.89-8.43 6.47 0.09-2.24 1.26 3.72-6.28 5.37
MEK 1.09-5.11 2.92 Nd Nd 2.37-15.80 7.58 0.20-5.11 2.16
n-Butyraldehyde 0-4.53 1.90 0-1.67 0.63 1.12-55.35 19.47 0.23-3.14 1.82
Methacrolein 0.80-1.52 1.20 0-1.86 0.62 1.82-4.78 3.54 0-1.4 0.92
Benzaldehyde 0-4.7 1.57 0.10-16.97 6.51 Nd Nd 0-13.05 4.35
Valeraldehyde 3.81-7.01 5.07 Nd Nd 0-12.35 4.12 0-4.9 2.34
m-tolualdehyde 2.23-3.2 2.79 Nd Nd 0.36-18.16 6.80 0.76-0.97 0.85
Hexanal 0.73-2.35 1.78 Nd Nd 0-3.52 1.17 0-0.57 0.96
Total Avg emission 67.37 mg/kW.hr 93.96 mg/kW.hr 121.97 mg/kW.hr 127.52 mg/kW.hr
Nd-Not detectable

Tabulation results of Methane emission from various category vehicles
S.N Vehicle category Fuel used Emissions (mg/km)
Range Mean
1 Two wheeler BS II Petrol 1-2 1.3
2 BS III Petrol 1-2 1.7
3 E5+BS III Petrol 4-5 4.7
4 Three wheeler BS II Petrol 14-20 17.3
5 BS III Petrol 1-2 1.5
6 E5+BS III Petrol 19-32 24
7 LPG 8-9 8.7
8 BS II Diesel 1 1
9 BS III Diesel 1-2 1.3
10 B10+BS III
Diesel
1 1
11 CNG (mg/km) 2014-3303 2852
12 Four wheeler BS II Petrol 5-6 5.7
13 BS III Petrol 4-7 6
14 E5+BS III Petrol 5-7 6.3
15 LPG 9-26 15.0
16 BS II Diesel 1-50 17.3
17 BS III Diesel 16-53 28.7
18 B10+BS III
Diesel
1-55 21
19 CNG 120-280 177

Vehicle Category Fuel used Emissions in mg/kW.hr
Range Mean
20 Light Commercial
Vehicle Engine
BS II Diesel 136-140 138
21 BS III Diesel 143-156 151
22 B10+BS III
Diesel
125-130 127
23 CNG 178-217 197
24 Heavy Commercial
Vehicle Engine
BS II Diesel 63-71 66
25 BS III Diesel 32-63 51
26 B10+BS III
Diesel
63-71 65
27 CNG 209-237 220
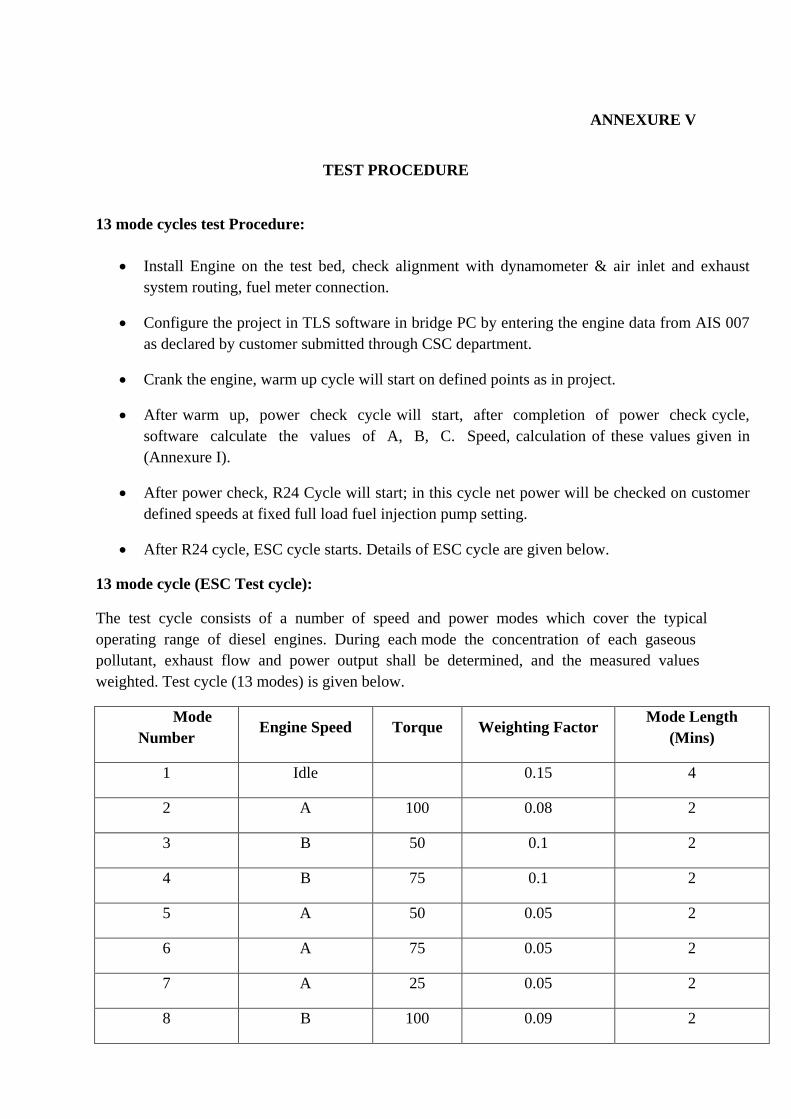
ANNEXURE V
TEST PROCEDURE
13 mode cycles test Procedure:
Install Engine on the test bed, check alignment with dynamometer & air inlet and exhaust
system routing, fuel meter connection.
Configure the project in TLS software in bridge PC by entering the engine data from AIS 007
as declared by customer submitted through CSC department.
Crank the engine, warm up cycle will start on defined points as in project.
After warm up, power check cycle will start, after completion of power check cycle,
software calculate the values of A, B, C. Speed, calculation of these values given in
(Annexure I).
After power check, R24 Cycle will start; in this cycle net power will be checked on customer
defined speeds at fixed full load fuel injection pump setting.
After R24 cycle, ESC cycle starts. Details of ESC cycle are given below.
13 mode cycle (ESC Test cycle):
The test cycle consists of a number of speed and power modes which cover the typical
operating range of diesel engines. During each mode the concentration of each gaseous
pollutant, exhaust flow and power output shall be determined, and the measured values
weighted. Test cycle (13 modes) is given below.
Mode
Number Engine Speed Torque Weighting Factor
Mode Length
(Mins)
1 Idle 0.15 4
2 A 100 0.08 2
3 B 50 0.1 2
4 B 75 0.1 2
5 A 50 0.05 2
6 A 75 0.05 2
7 A 25 0.05 2
8 B 100 0.09 2

9 B 25 0.1 2
10 C 100 0.08 2
11 C 25 0.05 2
12 C 75 0.05 2
13 C 50 0.05 2
INDIAN DRIVING CYCLE: (2/3 Wheelers)
Mass Emission test on 2/3 wheelers (BSII/BSIII)
1. Test Sample preparation (Vehicle):
Ensure that exhaust system of vehicle is leak proof by blocking the exhaust pipe and see if the
vehicle’s engines stall.
If the engine stalls and stops, no leakages in the system.
Physical verification of the vehicle for any leakages i.e. oil or grease.
Ensure that the settings of the engine and of the vehicle’s control are adequate as prescribed by
the manufacturer.
Ensure that tyre pressure is adjusted to the indicated value by the vehicle manufacturer.
Appropriate test fuel i.e. BSII & BS III as required by the test standard to be filled in the fuel
tank.
In case of ―Type Approval‖ the 90% of the fuel tank capacity is filled with the fuel.
Perform the preconditioning of the vehicle.
After preconditioning keep the vehicle in soak room in which a temperature remains relatively
constant between 293 K and 303 K (20 and 30°C). The vehicle soaking shall be carried out for
at least 6 hours and continue until the engine oil temperature, if any, are within ± 2°C of the
temperature of the room.
2. Pre Test Preparation:
Ensure that all the instruments are switched on 1 hr before the test for warmup.
Ensure that the temperature of test cell should be in between: 20 and 30°C.
Ensure that the absolute humidity (H) of the test cell or the intake air of the engine should be in
between: 5.5 ≤ H ≤ 12.2 g H2O/kg dry air.
Verify the calibration status of the instruments before the test.

Weight the particulate filters and record the initial weights of primary and secondary filters for
particulate emission measurements for Diesel Vehicles and fit them in the dilution tunnel.
Ensure that the road load equation is available for coast down
Test procedure:
For Gasoline/Diesel/LPG/CNG Vehicles
Type I:- Emission Measurements
Push the vehicle on the chassis dynamometer and clamp the non driving wheel without starting
the engine.
Connect vehicle exhaust pipe to the gas sampling system based on the type of fuel used in the
vehicle.
Align the vehicle on the chassis dyno through AVL’s dyno software.
The vehicle shall be approximately horizontal during the test so as to avoid any abnormal
distribution of the fuel.
Set the required inertia on chassis dynamometer as obtained from the road load equation of the
vehicle.
Perform the coast down of the vehicle through software.
Prepare the AMA by checking the zero and span of the system
Ready the CVS and FFP (for diesel engines) system by enabling them for remote mode.
Fill the vehicle data in the GEM software and ready the system for test.
Check all the systems are in remote mode.
Start the test and rider will ride the vehicle as per the IDC. The operator is provided with the
speed tolerance of ± 1 kmph in driving cycles.(Annexure I)
Bag filling and Sampling will start as per the driving cycle i.e. Indian Driving Cycle.
After the test, analysis of the exhaust gas collected in the sample bags will be done by AMA and
GEM will generate a file for the test.
Test data is generated and printout is taken of the file.
Annexure is generated for the test
Abbreviations:
AMA: - It’s an exhaust gas analyzer of AVL Pvt. Ltd.
CVS:- Constant Volume Sample
FFP:- Full Flow Particulate(for Diesel)
IDC: - Indian Driving Cycle.
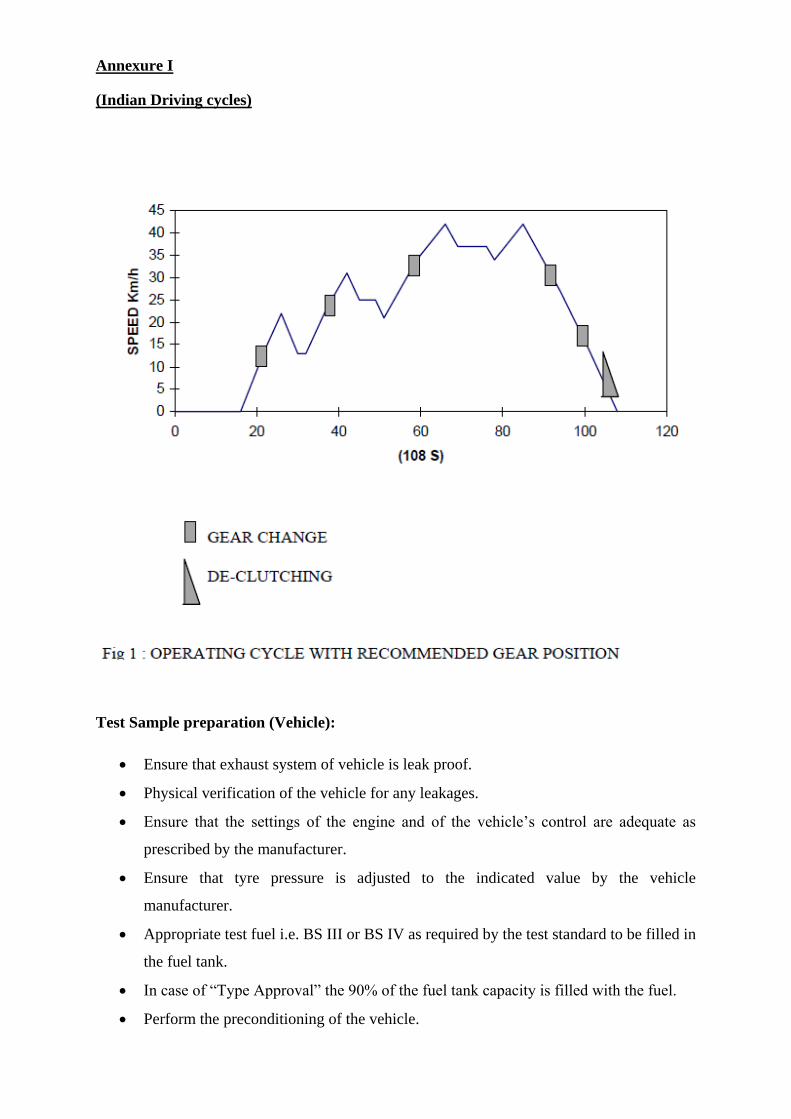
Annexure I
(Indian Driving cycles)
Test Sample preparation (Vehicle):
Ensure that exhaust system of vehicle is leak proof.
Physical verification of the vehicle for any leakages.
Ensure that the settings of the engine and of the vehicle’s control are adequate as
prescribed by the manufacturer.
Ensure that tyre pressure is adjusted to the indicated value by the vehicle
manufacturer.
Appropriate test fuel i.e. BS III or BS IV as required by the test standard to be filled in
the fuel tank.
In case of ―Type Approval‖ the 90% of the fuel tank capacity is filled with the fuel.
Perform the preconditioning of the vehicle.

After preconditioning keep the vehicle in soak room in which a temperature remains
relatively constant between 293 K and 303 K (20 and 30°C). The vehicle soaking
shall be carried out for at least 6 hours and continue until the engine oil temperature,
if any, are
within ± 2°C of the temperature of the room.
Pre Test Preparation:
Ensure that all the instruments are switched on 1 hr before the test for warmup.
Ensure that the temperature of test cell should be in between: 20 and 30°C.
Ensure that the absolute humidity (H) of the test cell or the intake air of the engine
should be in between: 5.5 ≤ H ≤ 12.2 g H2O/kg dry air.
Verify the calibration status of the instruments before the test as per clause 3.
Precondition the particulate filters and record the initial weights of primary and
secondary filters for particulate emission measurements for Diesel Vehicles and fit
them in the dilution tunnel.
Ensure that the road load equation is available for coast down and if in case not
available, perform the coast down by power absorption method provided unladen
mass is given.
Test procedure:
For Gasoline Vehicles
Type I:- Emission Measurements
Push the vehicle on the chassis dynamometer and clamp the non driving wheel
without starting the engine.
Connect vehicle exhaust pipe to the gas sampling system based on the type of fuel
used in the vehicle.
Align the vehicle on the chassis dyno through AVL’s dyno software.
The vehicle shall be approximately horizontal during the test so as to avoid any
abnormal distribution of the fuel.
Set the required inertia on chassis dynamometer as obtained from the road load
equation of the vehicle.
Perform the coast down of the vehicle through software.
Prepare the AMA by checking the zero and span of the system

Ready the CVS and FFP (for diesel engines) system by enabling them for remote
mode.
Fill the vehicle data in the GEM software and ready the system for test.
Check all the systems are in remote mode.
Start the test and rider will ride the vehicle as per the MIDC. The operator is provided
with the speed tolerance of ± 1 kmph in driving cycles.(Annexure I)
Bag filling and Sampling will start as per the driving cycle i.e. Modified Indian
Driving Cycle for the Year 2000(annexure I)
After the test, analysis of the exhaust gas collected in the sample bags will be done by
AMA and GEM will generate a file for the test.
Test data is generated and printout is taken of the file.
Annexure is generated for the test

ANNEXURE VI
AUTOMOTIVE SOURCE SAMPLES BY HIGH PERFORMANCE LIQUID
CHROMATOGRAPHY AIR RESOURCE BOARD (SOP MLD 104)
1 Introduction
1.1 The procedure describes a method of sampling and analyzing automotive engine exhaust
for aldehyde and ketone compounds (carbonyls) in the range of 0.02 to 200 micrograms (mg)
in 2,4-dinitrophenylhydrazine (DNPH) impregnated cartridges. Currently the target
compounds analyzed and reported by this method are: formaldehyde, acetaldehyde, acrolein,
acetone, propionaldehyde, Crotonaldehyde, Methacrolein, Butyraldehyde, Methyl Ethyl
Ketone (MEK), Benzaldehyde, Valeraldehyde, m-Tolualdehyde, and Hexanal.
1.2 The procedure is derived from a method used by the U.S.EPA (Riggin, 1984; Winberry
et. al., 1999) and integrated into Method 1004 of the California Nonmethane Organic Gas
Test Procedures (ARB, 2002).
2 Method Summary
2.1 Sample Collection:
2.1.1 For routine motor vehicle testing, the vehicle is tested according to the Federal Test
Procedure (FTP), using a dynamometer (dyno) and constant volume sampler (CVS) to dilute
the exhaust for sampling (see CFR in the reference section).
2.1.2 Samples are also received from CVS testing using non-FTP driving cycles, Sealed
Housing Evaporative Determinations (SHEDs), cartridge samples for round-robin testing and
carbonyl-containing samples from other miscellaneous sources.
2.1.3 The automotive test personnel collect the carbonyl samples by flowing dilute exhaust
(approximately 1.0 liter/min. flow rate) through cartridges (Tejada, 1986a). The samples are
then brought to the laboratory for analysis.
2.2 Extraction and Analysis:
2.2.1 Each cartridge contains an absorbing compound (2,4-DNPH) which complexes with
the carbonyl compounds to form their dinitrophenylhydrazone derivatives (called carbonyl-
DNPH in this document). The cartridges are then extracted with 5.0 milliliters (mL)
acetonitrile and analyzed (Tejada, 1986b).
2.2.2 Separation and analysis is performed using a High Performance Liquid Chromatograph
(HPLC) with an ultraviolet (UV/VIS) detector.

3 Interferences and Limitations
3.1 As with any chromatographic method, this method is subject to interference by
compounds in the acetonitrile extract having the same retention time as one of the
thirteen target compounds and detectable by ultraviolet absorption. Periodic
confirmations using an alternative method and/or instrumentation, e.g., alternative HPLC
column or mobile phase may be needed to minimize these interferences.
3.2 If samples are not analyzed the same day as received, they must be refrigerated at a
temperature below 40°F. Refrigerated samples are stable for up to 30 days.
3.3 The extraction of cartridges with 5.0 mL acetonitrile performed in the laboratory
established a statistical average eluted volume of 4.4 mL; the remaining 0.6 mL is
retained in the cartridge.
4 Instruments and Apparatus
4.1 The Southern Laboratory Branch (SLB) currently utilizes a modular Waters HPLC
analytical system assembled from the components listed below. Equivalent HPLC
systems that meet the requirements of this analytical procedure are also acceptable.
4.1.1 Dual high pressure pumps (Waters Model 510). An equivalent HPLC system should
consist of pump/pumps with a minimum of two channels and sufficient pulse
dampening for meeting the limit of detection (LOD) requirement.
. 4.1.2 Pump controller module (Water PCM/15xx). Typical modern HPLC systems do not
require a separate pump controller module.
4.1.3 Liquid autosampler with sample tray at 20°C (Waters Model 717 WISP). An equivalent
HPLC system should consist of a sample handling module capable of maintaining
20°C.
4.1.4 Temperature control module (Waters TCM). An equivalent HPLC system should
consist of column holding module capable of maintaining 40°C.
4.1.5 Chromatographic Columns: two Supelcosil columns (Supelco, Inc., 4.6 mm inside
diameter x 25 cm long) in series and a guard column (2.0 cm long) packed with LC-18
beads of 5 mm particle size. Many vendors supply HPLC columns with similar
stationary phase compositions (i.e. C-18). An equivalent column should be able to
resolve the DNPH-derivatives of the 13 target compounds into 13 peaks.
4.1.6 UV/VIS Detector (Waters Model 486 tunable absorbance detector). An equivalent
HPLC system should consist of a detector able to measure absorbance in the 360-370
nm region and meet the specified LOD requirement.
4.1.7 Computer-based data system for peak integration (Millennium32). An equivalent
software package should be able to control the HPLC system and to facilitate peak
integration.

5 Reagents and Materials
5.1 For sample collection: DNPH impregnated cartridges (SEP-PAK DNPH Silica
cartridges from Waters)
5.2 Acetonitrile (ACN), HPLC grade, VWR Scientific or equivalent
5.3 Purified water, HPLC grade, VWR Scientific or equivalent
5.4 Methanol, HPLC grade, VWR Scientific or equivalent
5.5 Stock solutions – Carbonyl-DNPH standard solution, by Cerilliant Corporation or
equivalent, consisting of thirteen compounds (see Table 3.4), each having a
concentration of 1.0 mg/mL, 3.0 mg/mL, or 15.0 mg/mL and 99% purity. The
concentrations are the amount of carbonyl compound (NOT the carbonyl-DNPH
derivative) per mL of solution.
5.6 Working Standard – A typical working standard is prepared as needed by diluting 2.0
mL of the 3.0 mg/mL stock solution to 10 mL (v/v) using ACN for dilution. Current
working standard concentration is 0.6 mg/mL.
5.7 Control Standard – A quality control standard, containing all target carbonyl-DNPH
derivatives within the typical concentration range of real samples, is analyzed to
monitor the precision of the analysis of each target carbonyl. The control standard is
prepared by batch mixing old samples and spiking with the stock carbonyl-DNPH
standard solution, if needed, to obtain the desired concentration levels of the target
analytes. All target compounds except acrolein have been found to be stable in the
control standard.
6. Procedure
6.1 DNPH-impregnated cartridges are used to collect carbonyl samples from automotive
exhaust. Separate background samples are collected during each of the three test phases,
although one composite background may be collected instead.
6.2 Each cartridge is extracted by connecting it to a syringe assembly and applying 5.0 mL
of acetonitrile. The liquid containing the carbonyl-DNPH derivatives is allowed to flow
by gravity into a glass storage container until the entire yellow color band has been
eluted.The plunger is then pressed to expel the excess ACN from the cartridge. Although
approximately 0.6 mL of ACN is retained in the cartridge, no carbonyls are retained.
6.3 Approximately 0.75 mL of the extract is transferred into a 1.0 mL autosampler glass
vial and sealed with a plastic snap cap. For equivalent HPLCs sample vials of different
volume and cap type are acceptable.
6.4 A typical sample run is comprised of:
6.4.1 Working standard, control standards, ACN blank, field blank, and samples.
6.4.2 A stock standard solution of an appropriate concentration is loaded within
sequence if a sample that exceeds the working standard concentration (0.6
mg/mL) is expected.

6.5 Typical operating conditions for the HLPC system are:
Elution of profile of the target carbonyl-hydrazone from the supelcosil HPLC Column
6.6 The peaks are identified and quantified by the data system. All chromatograms are
checked for proper identification and baseline drift. Any misidentification and drifting in
the baseline are manually corrected by the reintegration of the chromatograms
6.7 Only the target carbonyl peaks at or above the LOD are reported.

7 Calculations
7.1 The target carbonyl concentrations, in μg/mL, are calculated by the data system using
each carbonyl-DNPH compound (Table 1) as an external standard.
7.2 The mass of each carbonyl compound per cartridge is determined using the following
Calculation:
Mass sample (μg) = Peak Area sample x RF x Volume of Extract (mL)
Where the RF is the response factor calculated from the daily calibration as follows
Peak Area (working standard)
Concentration (working standard) μg/mL
RF=
Peak Area (working standard)

ANNEXURE VII
EQUIPMENT SPECIFICATION
Dynamometer specification
Parameter Chassis dynamometer
Engine
dynamometer
AVL make 2/3
wheeler
AVL make 4 wheeler(PC)
and LCV
HCV
Type DC machine DC machine Eddy Current
Max. Power 70 kW 140 Kw 550 kW
Max. speed 200 kmph 200 kmph 9000 rpm
Max. Tractive
effort
660 N 1000 N N/A
Roller diameter 955 mm 1019.2 mm N/A
No.of rollers Single roller Double roller N/A
Max. Torque N/A N/A 2000 Nm
Accuracy Less than 2% Less than 2% 1%
Control Volume Sampler specification
Parameter 2/3 wheeler 4 wheeler (PC)
Horiba Horiba
Venturi 1,2,4,5 m3/min 6,8,….12 m
3/min
Tunnel diameter 297 mm 297 mm
Filter holder
assembly 70-47 70-47
Propane injection Critical Flow Orifice
(CFO)
Critical Flow Orifice
(CFO)

Methane analyzer specification
CH4
2/3 wheeler 4 wheeler (PC) LCV & HCV
Model FID 4000 Low Cold Gas
chromatograph (LCG)
FID 4000 Low Cold Gas
chromatograph (LCG)
Flame Ionization
Analyzer (FIA)
Range 0-250 ….2500ppmc 0-250 ….2500ppmc 0-250 ….2500ppmc
ppmc- Parts per million concentration

High Performance Liquid Chromatography (HPLC) Specifications:
Parts Parameters Specification
Gra
die
nt
Pu
mp
Pump type quaternary gradient pump
Flow Rate 0.001 to 10 mL/min in 0.001 steps
Flow Accuracy 0.05% at 1 mL/min
Flow Precision Less than 0.075% RSD
Pressure Pulsation + 0.5% at 2mL/min
Max Pressure 0-40 MPa (400 bar)
Gradient Precision < 0.20% RSD
Gradient Composition accuracy + 1% (1mL/min)
Flow repeatability better than 0.1%
Va
ria
ble
UV
Det
ect
or
Detector Type Double beam photometric
Wavelength 190 – 900 nm
Drift 1x10⁻⁴ AU/h at 230 nm, 3x10⁻⁴ AU/h at 254 nm
Linearity Better than 1%, 0.001 to 2A
Wavelength Accuracy + 1 nm with auto calibration
Wavelength Precision + 0.1 nm
Noise 0.6 x 10⁻⁵ AU or less at 250 nm
Light Source Deuterium lamp
Band/Slit width 6 nm typical over entire range
Co
lum
n O
ven
Temperature range 1 to 65 0C
Temperature stability 0.1 0C
Column Capacity Upto 3, 25 cm (10 mm ID max)
Heat-up/cool down time 5 min from ambient to 400C, 10 min from 40 0C to 20 0C
Temperature Accuracy + 0.8 0C with calibration + 0.5 0C
Deg
ass
er
Max Flow Rate 5ml/min
Number of Channels 4
Internal Volume Approx. 7 mL/flow path (not including the tubes connected)
Max Withstand Pressure 0.2 MPa
Inje
cto
r
Injector Type Rheodyne, Manual injection valve, 20 µl sample loop and mounting
stand.
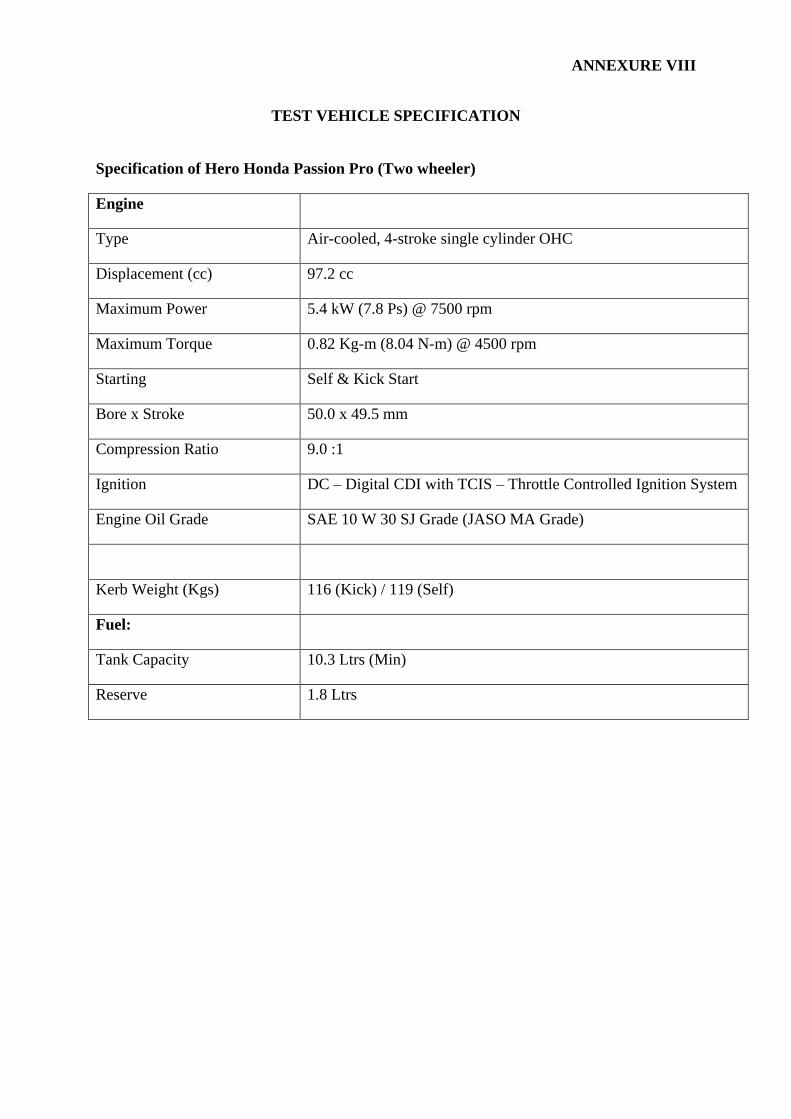
ANNEXURE VIII
TEST VEHICLE SPECIFICATION
Specification of Hero Honda Passion Pro (Two wheeler)
Engine
Type Air-cooled, 4-stroke single cylinder OHC
Displacement (cc) 97.2 cc
Maximum Power 5.4 kW (7.8 Ps) @ 7500 rpm
Maximum Torque 0.82 Kg-m (8.04 N-m) @ 4500 rpm
Starting Self & Kick Start
Bore x Stroke 50.0 x 49.5 mm
Compression Ratio 9.0 :1
Ignition DC – Digital CDI with TCIS – Throttle Controlled Ignition System
Engine Oil Grade SAE 10 W 30 SJ Grade (JASO MA Grade)
Kerb Weight (Kgs) 116 (Kick) / 119 (Self)
Fuel:
Tank Capacity 10.3 Ltrs (Min)
Reserve 1.8 Ltrs

Specification of Wagon R vxi BS III (4- wheeler LPG & CNG)
Engine
Engine Type In-Line Engine
Engine Description 1.1L 64bhp 4 cyl. In-line, FC engine
Engine Displacement(cc) 1061
No. of Cylinders 4
Maximum Power 64@6,200 (PS@rpm)
Maximum Torque 8.6@3,500 (kgm@rpm)
Valves Per Cylinder 4
Fuel Supply System MPFI
Bore x Stroke 68.5 x 72 mm
Compression Ratio 9.0:1
Turbo Charger No
Super Charger No
Fuel
Fuel Type Petrol
Fuel Tank Capacity (litres) 35
Emission Norm Compliance Bharat Stage III
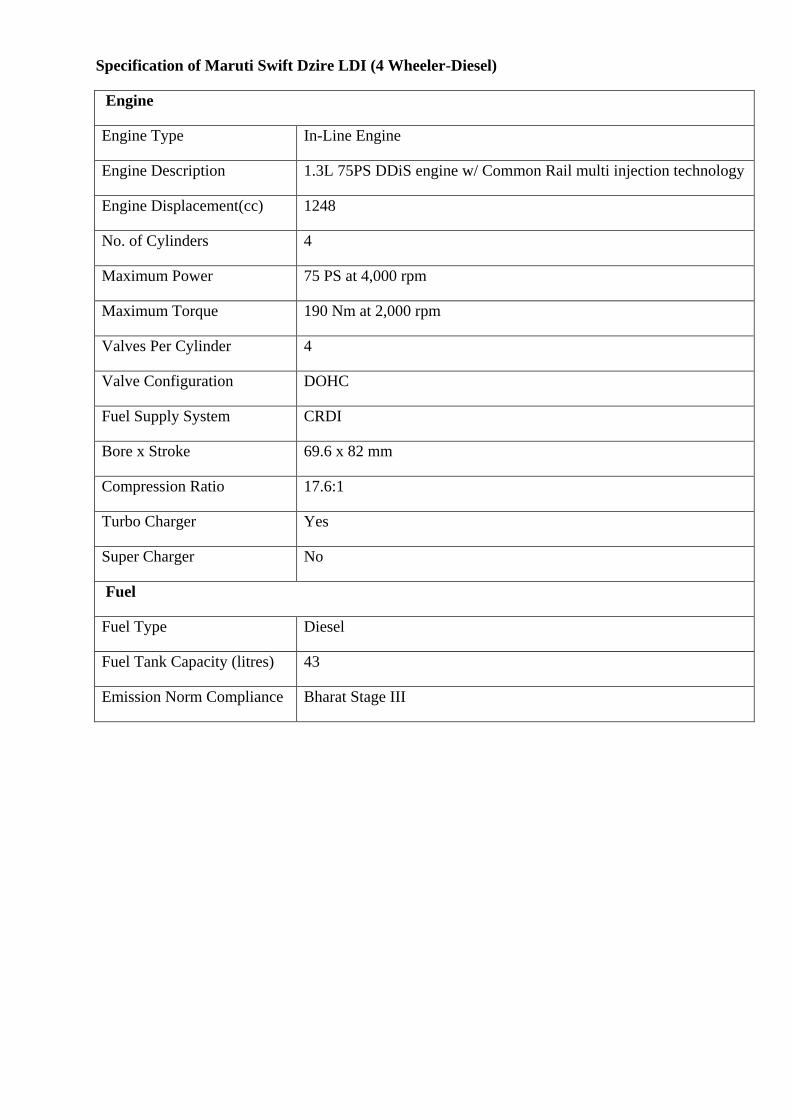
Specification of Maruti Swift Dzire LDI (4 Wheeler-Diesel)
Engine
Engine Type In-Line Engine
Engine Description 1.3L 75PS DDiS engine w/ Common Rail multi injection technology
Engine Displacement(cc) 1248
No. of Cylinders 4
Maximum Power 75 PS at 4,000 rpm
Maximum Torque 190 Nm at 2,000 rpm
Valves Per Cylinder 4
Valve Configuration DOHC
Fuel Supply System CRDI
Bore x Stroke 69.6 x 82 mm
Compression Ratio 17.6:1
Turbo Charger Yes
Super Charger No
Fuel
Fuel Type Diesel
Fuel Tank Capacity (litres) 43
Emission Norm Compliance Bharat Stage III

Specification Of Maruti Swift Dzire VXI (4 Wheeler-Petrol)
Engine
Engine Type In-Line Engine
Engine Description 1.3L 85PS AlTec32 engine
Engine Displacement(cc) 1197
No. of Cylinders 4
Maximum Power 85PS at 6000 rpm
Maximum Torque 113Nm at 45 rpm
Valves Per Cylinder 4
Valve Configuration SOHC
Fuel Supply System MPFI
Bore x Stroke 74 x 75.5 mm
Compression Ratio 9.0:1
Turbo Charger No
Super Charger No
Fuel Type Petrol
Fuel Tank Capacity (litres) 43
Emission Norm Compliance Bharat Stage III

Specification of JSA 1360D II Load Carrier (Petrol / CNG Variant- 3 wheeler)
Engine
Type Air Cooled , Four Stroke
No. Of cylinders Single
Bore 85mm
Stroke 90mm
Cubic capacity 510cc
Max output 11BHP @ 3000 rpm
Max. Torque 29.0 Nm
Capacities
Fuel tank 10.25 ltr.
Engine oil 1.75 ltr
Gear oil 1.0 ltr.
Gross vehicle weight 1359.5 Kg
Seating capacity 1+1 6+1

Specification of TATA 709 (HCV)
Make: Tata
Model: 709
Variant: LPT
Type: Truck
Application: For Goods Transport
Engine
Displacement: 2956cc
Engine Type: TATA 497 TC
Gear Box: GBS-27 synchromesh
Maximum Power: 67.5 @ 2800
Maximum Torque: 261 @ 1800
Cylinders: 4-in-line DI Turbo
Bore & Stroke: 97x100
Kerb Weight: 2820kgs
Gross Vehicle Weight: 7500 kgs

Specification of TATA 407 (LCV)
Model TATA 497 SP
Type
High speed, water cooled, naturally aspirated,
high pressure direct injection diesel engine with
dry liners.
No of cylinders 4 in line
Bore/Stroke 97/100 mm
Capacity 2356cc turbo
Maximum engine output 75 PS@ 2800rpm
Maximum operating speed 3500 rpm
Idling speed 600 rpm
Maximum torque 225Nm @ 1250-1800rpm
Firing order (From F.W end) 1-3-4-2
Compression Ratio 17. :1
Air filter Oil bath type
Oil filter Full flow paper type
Fuel filter Single stage find filteration
Fuel injection pump Inline type– MICS
Governor Centrifugal type variable speed RSV
Fuel injection begins 15 degree before TDC
Cooling water temperature 850 C to 950 C
Cooling system pressure 0.5 bar
Max permissible GVW (kg) 5700
Maximum Payload (kg) 3626