study of the structural, electrical and magnetic
TRANSCRIPT

STUDY OF THE STRUCTURAL, ELECTRICAL AND
MAGNETIC PROPERTIES OF RARE EARTH YTTRIUM
DOPED Mn-Zn FERRITES
M. Phil. Thesis
By
SUBROTO SUBON ACHARJEE
DEPARTMENT OF PHYSICS
KHULNA UNIVERSITY OF ENGINEERING & TECHNOLOGY
KHULNA - 9203, BANGLADESH
JUNE - 2018

STUDY OF THE STRUCTURAL, ELECTRICAL AND
MAGNETIC PROPERTIES OF RARE EARTH YTTRIUM
DOPED Mn-Zn FERRITES
M. Phil. Thesis
By
SUBROTO SUBON ACHARJEE
ROLL No. 1455502
SESSION: JANUARY - 2014
A THESIS SUBMITED TO THE DEPARTMENT OF PHYSICS, KHULNA
UNIVERSITY OF ENGINEERING & TECHNOLOGY, KHULNA - 9203 IN
PARTIAL FULFILMENT OF THE REQUIRMENT FOR THE DEGREE OF
MASTER OF PHILOSOPHY
DEPARTMENT OF PHYSICS
KHULNA UNIVERSITY OF ENGINEERING & TECHNOLOGY
KHULNA - 9203, BANGLADESH
JUNE - 2018

TO
MY PARENTS
i
DECLARATION
This is to certify that the thesis work entitled as “Study of the Structural,
Electrical and Magnetic Properties of Rare Earth Yttrium Doped Mn-Zn
Ferrites” has been carried out in partial fulfillment of the requirement for M. Phil.
degree in the department of Physics, Khulna University of Engineering &
Technology, Khulna - 9203, Bangladesh. The above research work or any part of this
work has not been submitted anywhere for the award of any degree or diploma. No
other person’s work has been used without due acknowledgement.
1. Supervisor Candidate
---------------------------- --------------------------------
(Prof. Dr. S. S. Sikder) (Subroto Subon Acharjee)
2. Co-Supervisor
----------------------------
(Dr. Mohammed Nazrul Islam Khan)

ii
Acknowledgements
First and foremost, I would like to thank the Almighty for giving me the
strength, knowledge, ability and opportunity to undertake this research study and
complete it satisfactorily.
I with due respect express my deepest sense of sincere gratitude indebtedness
to my supervisor Prof. Dr. Shibendra Shekher Sikder, Department of Physics, Khulna
University of Engineering & Technology (KUET), Khulna for his indispensable
guidance, erudite discussion, constructive suggestions, fruitful discussion and
constant inspiration throughout the research work. He is always ready to provide a
lucid explanation of the different concepts involved and critical reading of the script
and subsequent corrections are much appreciated. Any mistake that remain is of
course mine. Without his constant supervision this thesis work could not be
performed.
I am very much indebted to my Co-Supervisor Dr. Mohammad Nazrul Islam
Khan, Principal Scientific Officer, Materials Science Division, Atomic Energy
Centre, and Dhaka for introducing the present research topic and inspiring guidance
and valuable suggestion throughout the research work. It would have not been
possible for me to bring out this thesis without his help and constant encouragement.
I am indebted to Professor Dr. Md. Mahbub Alam, Head, Department of
Physics; Khulna University of Engineering & technology, Khulna his accurate
acceptable direction and instruction was as sweet as honey which was quality with
tonic and antibiotic to overcome opposite chronicle.
I am very much grateful to Dr. Sk. Manjura Haque, Head and Chief Scientific
Officer, Materials Science Division, Atomic Energy Centre, Dhaka for providing kind
opportunity to work in her laboratory for experimental work. Ms. Nazmunnahar
Begum, Ms. Jarna Begum and Ms. Arunnahar Irin, Scientific Officer, Materials
Science Division, Atomic Energy centre, Dhaka for providing me with technical
assistance from time during my research work
I gratefully acknowledge Professor Dr. Md. Abdullah Elias Akhtar and
Professor Dr. Jolly Sultana, Department of Physics, Khulna University of Engineering
& Technology for his co-operation and inspiration during this work. My thanks are
also for Mr. Md. Kamrul Hasan Reza, Associate Professor, Mr.Sujit Kumar Shil,

iii
Mr.Suman Halder, and Mr. Suman Debnath, Assistant Professor, Mr. Probal Roy and
Mr. Saifullah, Lecturer, Department of Physics, KUET for their moral supports.
I am very much indebted to Mr. Md. Alamgir Hossain, Assistant Professor,
Department of Physics, KUET, and Khulna. I feel and realize that it was not possible
to complete my thesis work without his cordial nursery help tendency with generous
thinking and expert skillful suggestion and perfect instruction.
I am very much indebted to Prof. Dr. Mohammad Abu Yusuf, Department of
Chemistry, Khulna University of Engineering & Technology, and Khulna for his
useful suggestion and help to carry out my research work.
I would like to extend my special thanks to Engineer. Md. Ashraful Kabir ,
Chairman and Engineer S.M. Rezaul Kabir, Principal, BCMC College of Engineering
& Technology, Jessore who inspired and helped me highly to reach my goal.
My thanks are also for my Colleagues, Md. Shahidul Alam, Md. Habibur
Rahman, Assistant Professor and Md.Abdullah Al Mamun, Lecturer, Department of
Social Science & Related Subjects, BCMC College of Engineering & Technology,
Jessore. I would also like to thank my well wishers Prodip Kumar Mondal, Kaushik
Sarkar, Al-Masud and Md.Deloar Hossain Solid State Physics Lab, KUET.
A very special thank to Mrs. Nandita Saha, spouse of Prof. Dr. S. S. Sikder for
her heartfelt encouragement, cares and helps throughout the entire period of M. Phil.
program.
My thanks are due to Director, Atomic Energy Centre, and Dhaka for his kind
permission to use the Laboratory of Materials Science Division, Atomic Energy
Centre, and Dhaka.
My acknowledgement would be incomplete without thanking my parents
(Shyama Ranjan Acharjee & Swapan Acharjee), my wife (Protima Chowdhury) and
other family members for their multifaceted support and love no matter distance.
Words are not enough to express my feelings and sincere thanks to my loving.
I also wish to thank the authority of Khulna University of Engineering &
Technology (KUET), for providing me with the necessary permission and financial
assistance for conducting this thesis work.
SUBROTO SUBON ACHARJEE
iv
ABSTRACT
Mn-Zn ferrites belong to a group of spinels studied extensively because of
their interesting technical properties. The present work focused on rare earth (Y)
substituted for Fe in Mn-Zn ferrites are well-known technological magnetic materials
used for manufacturing of multilayer chip inductor and applications in various
electrical devices. The series of ferrite sample of composition Mn0.5Zn0.5YxFe2-xO4
where x = 0.00, 0.02, 0.04, 0.06, 0.08 and 0.10 were prepared by solid state reaction
technique sintered at 1200oC with 2 hours holding time. The X-ray diffraction
analysis revealed that rare earth free sample shows formulation of single phase cubic
spinel structure with no extra peak but Y substituted for Fe in Mn-Zn samples show
additional peaks manifested the formation of secondary phase presumably YFeO3.
Lattice constant primarily increase up to x = 0.04 and thereafter decreases. X-ray
density of this composition is slightly greater than that of their bulk densities due to
existence of some pores in the bulk sample. The average grain size decrease
monotonically with increasing Y content while the porosity of studied samples follow
the opposite trend. The average grain size has significant influenced on the magnetic
properties such as permeability. A significant change in initial permeability has been
found to increase or decrease by the amount of Y3+
in Mn0.5Zn0.5YxFe2-xO4 ferrite.
But the initial permeability decreases with increasing Y ions in ferrite except x = 0.06.
Relative Quality factor (RQF) signifies the merit of the material from the application
point of view and found to have high values for the samples with x= 0.04 and x=
0.08.The saturation magnetization (MS), coercivity (Hc) and remanent induction (Mr)
have been calculated from M – H curve at room temperature. The decrease of MS with
increasing of Y substitutions has been explained as the effect of dilution of Fe3+
magnetic moment by nonmagnetic Y3+
. The electrical DC resistivity decreases with
increasing temperature for all studied samples manifesting semiconducting nature of
Y substituted Mn-Zn ferrites. The dielectric constant is found to decrease
continuously with increasing frequency and remain almost constant at higher
frequency range. Dielectric polarization and conduction process arise due to the local
displacements of electrons which in turn gives the dielectric constants.

v
Contents Page No.
Title Page
Declaration Page i
Acknowledgement ii
Abstract iv
Contents v
List of Figures viii
List of Tables x
List of Symbols xi
CHAPTER - I
INTRODUCTION
1.1 Introduction 1
1.2 The Aims and Objectives of the Resent Work 3
1.3 Experimental Reason for This Research Work 4
1.4 Application of Ferrites 5
1.5 Review of the Earlier Research Work 6
1.6 Outline of the Thesis 9
CHAPTER - II
THEROETICAL BACKGROUND
2.1 Rare Earth Ferrites 10
2.2 Types Ferrites 11
2.2.1 Cubic Ferrites 11
2.2.2 Spinel Ferrites 12
2.2.3 Hexagonal Ferrites 12
2.2.4 Garnets 13
2.2.5 Ortho-ferrites 14
2.3 Soft Magnetic Materials 14
2.3.1 Soft Ferrites 15
vi
2.3.2 Hard Ferrites 16
2.4 Magnetic Exchange Interaction 16
2.5 Super Exchange Interaction 17
2.6 Theory of Initial Permeability 18
2.7 Magnetization Process 20
2.7.1 Magnetization Curve 21
2.8 DC Resistivity of Ferrites 22
2.9 Microstructure 23
CHAPTER-III
EXPERIMENTAL PROCEDURE
3.1 Methodology of Rare Earth Ferrite Preparation 25
3.1.1 Compositions of the Studied Ferrites 25
3.1.2 Sample Preparation Technique 26
3.1.3 Material synthesis and sample preparation 26
3.2 Solid State Reaction Method 28
3.2.1 Preparing a Mixture of Materials 28
3.2.2 Pre-sintering the Mixture to Form Ferrite 29
3.2.3 Converting the Raw Ferrite into Powder and Pressing the Powder 29
3.2.4 Sintering 31
3.3 X-ray Diffraction (XRD) 33
3.3.1 Different Parts of the PHILIPS X’ Pert PRO XRD System 35
3.3.2 Interpretation of the XRD data 36
3.3.3 Lattice Parameter 36
3.3.4 X-ray Density and Bulk Density 37
3.3.5 Porosity 37
3.4 Permeability Measurement 37
3.4.1 Wayne Kerr Precision Impedance Analyzer 37
3.4.2 Permeability 38
3.5 Magnetization Measurement Techniques 39
3.5.1 Vibrating Sample Magnetometer of Model EV7 System 40
3.6 Surface morphology and microstructure 41

vii
3.6.1 Scanning Electron Microscope (SEM) 41
3.6.2 Scanning Process and Image Formation 42
3.7 Dielectric Properties 43
3.7.1 Dielectric Constant 43
CHAPTER-IV
RESULTS AND DISCUSSION
4.0 Introduction 45
4.1 X-Ray Diffraction Analysis 45
4.1.1 Phase Analysis 46
4.1.2 Lattice Parameters 47
4.1.3 Density and Porosity 49
4.2 Microstructures 52
4.3 Magnetic Properties 54
4.3.1 Frequency Dependence of Initial Permeability 54
4.3.2 Frequency Dependence of Loss Tangent 57
4.3.3 Frequency Dependence of Relative quality factor 59
4.3.4 Variation of Saturation Magnetization at Room Temperature 60
4.4 Electrical Properties 63
4.4.1 Temperature Dependence of DC Electrical Resistivity 63
4.4.2 Frequency Dependence of Dielectric Constant 64
CHAPTER-V
CONCLUSIONS
5.1 Conclusion 67
5.2 Scope for Future Work 68
References 70
Conference Publications 76

viii
List of Figures
Figure No Descriptions Page No
Figure 2.1 Three major types of super exchange interactions in
spinel ferrites are as follows: JAB, JBB and JAA. The small
empty circle is A-site, the small solid circle is B-site, and
the large empty circle is oxygen anion.
18
Figure 2.2 Domain dynamics during various parts of the
magnetization curve
21
Figure 2.3 Magnetization curve and the classification of
magnetization mechanism
22
Figure 2.4 Porosity character: (a) intergranular, (b) intragranular 24
Figure 2.5 Grain growth (a) discontinuous, (b) duplex (schematic). 24
Figure 3.1 Flow chart of ferrite preparation 27
Figure 3.2 Hydraulic press used to make different shaped samples 30
Figure 3.3 Toroid and disk shape sample 30
Figure 3.4 Bonding Mechanism in Powder Sintering 31
Figure 3.5 Furnace used in solid state Physics lab of KUET 32
Figure 3.6 Bragg’s diffraction pattern 33
Figure 3.7 Block diagram of the PHILIPS PW 3040 X’ Pert PRO
XRD system
34
Figure 3.8 Internal arrangement of a PHILIPS X’ Pert PRO X-ray
diffractometer
35
Figure 3.9 Impedance Analyzer Model-Wayne kerr,6500B 39
Figure 3.10 Vibrating Sample Magnetometer 40
Figure 3.11 Scanning Electron Microscope (SEM) 42
Figure 4.1 X-ray diffraction patterns of Mn0.5Zn0.5YxFe2-xO4 [x =
0.00, 0.02, 0.04, 0.06, 0.08 and 0.10] ferrites sintered at
12000C for 2hrs.
47
Figure 4.2(a-f) Variation of lattice parameter ‘a’ with N - R function and
determination of exact lattice parameter ‘a0’ of
Mn0.5Zn0.5YxFe2-xO4 [x=0.00, 0.02, 0.04,0.06,0.08 and 0.10]
49

ix
Figure 4.3 Exact lattice parameter ‘a0’ of Mn0.5Zn0.5YxFe2-xO4
[x = 0.00, 0.02, 0.04, 0.06, 0.08 and 0.10] with Yttrium
Content.
49
Figure 4.4 Variation of bulk density and X-ray density as a function
of Y content.
51
Figure 4.5 Variation of bulk density and Porosity as a function of Y
content.
52
Figure 4.6(a -f) Variation of SEM photographs with Y content (x) of
Mn0.5Zn0.5YxFe2-xO4 ferrites whose [x = 0.00, 0.02, 0.04,
0.06, 0.08 and 0.10] sintered at 12000C for 2 hrs.
53
Figure 4.7 Variation of initial permeability with frequency of
Mn0.5Zn0.5YxFe2-xO4 [x = 0.00, 0.02, 0.04, 0.06, 0.08 and
0.10] ferrites sintered at 1200oC for 2 hrs.
56
Figure 4.8 Complex imaginary permeability μ'' with frequency of
Mn0.5Zn0.5YxFe2-xO4 [x = 0.00, 0.02, 0.04, 0.06, 0.08 and
0.10] sintered at 12000C for 2 hrs.
57
Figure 4.9 Loss Factor tanδ with frequency of Mn0.5Zn0.5YxFe2-xO4
[x = 0.00, 0.02, 0.04, 0.06, 0.08 and 0.10] ferrites
sintered at 1200oC for 2 hrs.
59
Figure 4.10 Variation of RQF as a function of frequency of
Mn0.5Zn0.5YxFe2-xO4 ferrites sintered at 1200oC for 2hrs.
61
Figure 4.11 Variation of magnetization at room temperature as a
function of applied field on Mn0.5Zn0.5YxFe2-xO4 ferrites
Where x = 0.00, 0.02, 0.04, 0.06, 0.08 and 0.10 sintered
at 1200oC for 2hrs.
62
Figure 4.12 Variation of a magnetization at room temperature as a
applied field on Mn0.5Zn0.5YxFe2-xO4 [x = 0.00, 0.02,
0.04, 0.06, 0.08 and 0.10 sintered at 1200oC for 2hrs.
63
Figure 4.13 Resistivity as a function of Temperature of
Mn0.5Zn0.5YxFe2-xO4 where x = 0.00, 0.02, 0.04, 0.06,
0.08 and 0.10 sintered at 1200oC for 2hrs.
65
Figure 4.14 Dielectric constant as a function of frequency of the
ferrite system of Mn0.5Zn0.5YxFe2-xO4 ferrites sintered at
12000C for 2hrs.
67

x
List of Tables
Table. No Descriptions Page No
Table 4.1 Data of the lattice parameter (a˳), X-ray density (ρx), bulk
density (ρB), porosity (P) of Mn0.5Zn0.5YxFe2-xO4 [x = 0.00,
0.02, 0.04, 0.06, 0.08 and 0.10] ferrites sintered at 12000C for
2hrs.
50
Table 4.2 Grain Size of Mn0.5Zn0.5YxFe2-xO4 composites from SEM
Micrographs with Sintering temperature of 12000C for 2hrs.
54
Table 4.3 Initial Permeability of Mn0.5Zn0.5YxFe2-xO4 composites at
different frequency range sintering at the temperature
12000C for 2hrs.
56
Table 4.4 Data for Loss Tangent (tanδ) and frequency (fr ) of
Mn0.5Zn0.5YxFe2-xO4 ferrites sintered at 12000C for 2hrs.
59
Table 4.5 Data for Loss Tangent (tanδ) and frequency (fr ) of
Mn0.5Zn0.5YxFe2-xO4 ferrites sintered at 12000C for 2hrs.
63
Table 4.6 Activation energy for Mn0.5Zn0.5YxFe2-xO4 ferrites at
sintering temperature 12000C for 2hrs
65

xi
List of Symbols
Manganese = Mn
Zinc = Zn
Lanthanum = La
Samarium = Sm
Gadolinium = Gd
Dysprosium = Dy
Neodymium = Nd
Yttrium = Y
Europium = Eu
Nickel = Ni
Cobalt = Co
Magnesium = Mg
Iron = Fe
Cerium = Ce
Terbium = Tb
Bohr mgneton = µB
Bragg’s angle = θ
Bulk density = dB
Charge of electron = e
Capacitance = C
Coercivity = HC
Cross-sectional area of toroids = S
Curie temperature = TC
DC resistivity = ρdc
Dielectric constant = є'
Diffraction angle = θ
Chemical bath deposition = CBD
Exchange integral = J
Exchange coupling constant = Jij
Exchange correlation length = L0

xii
Face centered cubic = fcc
Frequency = fr
Rare Earth = RE
Imaginary part of initial permeability = µ''
Impedance = Z
Inductance = L
Initial permeability = µi
Inter planner spacing = d
Loss factor = tanδ
Magnetization = M
Magnetic field = H
Transmission electron microscopy = TEM
Scanning electron microscopy = SEM
Vibrating sample magnetometer = VSM
Electromagnetic interference device = EMI
Nelson-Riley function = F(θ)
Number of turns = N
Boltzmann constant = KB
Permeability of in free space = µ0
Relative quality factor = RQF
Absolute temperature = T
Real part of initial permeability = µ'
Activation Energy = Ea
Remanent Induction = Mr
Resistance = R
Resistivity = ρ
Saturation magnetization = MS
Saturation induction = Mr
Oersted = Oe
Yttrium aluminum garnet = YAG
Yttrium iron garnet = YIG
Susceptibility = χ
X-ray density = dX
X-ray diffraction = XRD
Wavelength = λ

1
INTRODUCTION
1.1 Introduction
Ferrites pervade almost every sphere of modern technology. The present day
technology owes a lot to the ferrite industry ranging from the very ordinary radio sets
to the complicated and exhaustive hardwires involved in computers, ferrites have
found their way to prove their importance. As a result, at high frequency applications
eddy current losses are negligible in ferrites indispensible materials in
telecommunications and in the electronic industry where frequencies in the range of
103 to 10
11Hz have to handle. Ferrites are ferromagnetic materials composed of
certain double oxide of Fe and another metal which have two unequal sublattices and
are ordered antiparallel to each other. Spinel ferrites are playing important role in
ferromagnetic materials due to their incredible magnetic properties particularly in the
radio frequency region due to physical flexibility, high electrical resistivity,
mechanical hardness and chemical stability.
Mn–Zn ferrites belong to the group of soft ferrite materials characterized by
high magnetic permeability low power loss, high saturation magnetization and
relatively high curie temperature, have widely served as fundamental materials in
electronic and information industries, being used as recording heads, choke coils and
communication pulse transformers, antenna roads, loading coils, deflection yokes,
magnetic amplifiers, electromagnetic interference device (EMI), power transformers,
splitters and so on. Moreover, Mn-Zn ferrites are very important in biomedicine as
magnetic carries fir bioseperation, enzymes and proteins immobilization.
The Mn-Zn ferrites preferred over other ferrites for their high initial
permeability, low losses, high saturation magnetization and relatively high Curie
temperature. The very well known fact that substituted SiO2, CaO, Ta2O5, Nb2O5 in to
Mn-Zn ferrites have excellent magnetic properties at high frequency [1.1-1.2]. It is
well established that in Mn-Zn ferrites are simple cubic structure most of the Zn2+
ions
occupy in tetrahedral A-sites [1.3] which results in a lowering of Fe3+
in octahedral A-
sites. Higher values of electrical resistivity could be achieved by incorporating the
divalent cations as well as by controlling their others properties. The grain growth of
introducing divalent cations in to the Mn-Zn ferrites produces grain boundaries which
may act as barrier for electrons flow, causing the declination of eddy current losses.

2
The surface morphology, magnetic and transport properties depend on the
microstructure, particle size, surface to volume ratio [1.4], milling technique,
preparation temperature concentration of the dopants and impurities of the new
prepared materials. Hence it is possible to incorporate metallic ions to the ferrite Mn-
Zn to enlargement their electronic and magnetic properties significantly [1.5]. The
structural, magnetic and electrical properties are found to be sensitive to their
composition and microstructure. There are many chemical processing techniques are
available to prepare of ferrites. The choice of an appropriate synthetic procedure often
depends on the desired properties and the final applications. Among these methods the
solid state reaction technique has several advantages over others for the preparation of
the specimen.
The influence of different rare earth atoms like La, Sm, Gd, Nd, Dy, Ce, Th,
Y, Eu on the properties of ferrites. Rare earth (RE) ions can be divided into two
categories: one with the radius larger than Fe-ions [1.6]. The rare earth ions
commonly reside at the octahedral sites by replacing Fe3+
ions and have been limited
solubility in the spinel lattice due their large ionic radii [1.7]. Ferrimagnetisms in
ferrite is largely governed by Fe-Fe interaction means the spin coupling of the 3d
electrons. Rare earth ions enter the spinel lattice, the RE-Fe interactions also appears
4f-3d coupling, which is to changes in the magnetization and Curie temperature. Rare
earth doped materials can occupy different positions on the octahedral and tetrahedral
sites and alter the microstructure, magnetic, transport as well as optical properties.
The RE ion forms the orthoferrite phase. The occupation of RE ions on B-sites
impedes the motion of Fe2+
in the conduction process in ferrite, thus causing an
increase in resistivity. Some considerations must be taken into account to incorporate
rare earth ions into the Mn-Zn ferrites due to the large dimension of RE ions.
Introducing a very poor amount of rare earth ions may significantly changes the
microstructure, electrical, magnetic as well as optical properties of the ferrites
composites. By introducing optimally rare earth materials in to the ferrite specimen
like Mn-Zn ferrites it is possible to develop good magnetic materials. Rare earth Gd3+
and Eu3+
ions replace the metallic cations in tetrahedral A-sites or octahedral B-sites
to improve various properties of the samples [1.8 - 1.11].
Mn-Zn ferrites have a great importance from the technological view points.
Researcher continues their efforts to find out optimum parameters of ferrites, like high
saturation magnetization, high permeability, high resistivity etc. However, till now, as

3
far as the effect of Fe replacement by Yttrium (Y) ions on the properties of Mn-Zn
ferrites concerned systematic study. For this reason, in this work we report some
systematic investigation on composition, temperature and frequency dependent
magnetic, dielectric and electrical properties of Mn-Zn ferrites with the addition of Y.
1.2 The Aims and Objectives of the Resent Work
This main objective has been the search for the best suited composition and
preparation parameters for optimum performance of ferrite samples in respect of
frequency response permeability and dielectrics. Ferrites are especially convenient for
high frequency uses because of their high resistivity. The high frequency response of
the complex permeability is therefore very in determining the convenient frequency
range in which a particular ferrite material can be used. The mechanism of eddy
current losses and damping of domain wall motion can be understood from the
relative magnitudes of the real and imaginary part of the complex permeability.
The rare earth substituted different ferrites are becoming the promising
materials applications. Addition of small amount of rare earth ions to Mn-Zn ferrites
samples produces a change in their magnetic and electrical as well as structural
properties depending upon and amount of rare elements like Y used. The main
purpose of this work is to amalgamate Mn-Zn ferrites of composition
Mn0.5Zn0.5YxFe2-xO4 where [x = 0.00, 0.02, 0.04, 0.06, 0.08 and 0.10] and, hence to
study the effect of substitution of rare earth Yttrium ions (Y3+
) doped on the surface
morphology, saturation magnetization, the loss of quality factors, the electrical
resistivity of Mn-Zn ferrites.
The main objectives of the present research are as follows:
Preparation of various Mn0.5Zn0.5YxFe2-xO4 (where x = 0.00, 0.02,
0.04, 0.06,0.08, 0.10) samples by solid state reaction technique.
Determination of crystal structure (X-ray diffraction), density and
porosity of the samples.
Investigation of surface morphology, microstructure and
compositional analyses using Scanning Electron Microscopy
(SEM).
Study of complex initial permeability as a function of frequency
(100Hz-120MHz) using Wayne Kerr Impedance Analyzer.

4
Investigation of specific magnetization process using Vibrating
Sample Magnetometer (VSM).
Measurement of complex dielectric constant of various
compositions over a range of frequency (20Hz-120MHz)
Measurement of resistivity using Electrometer Cathley.
Finally, it is expected to use powder particles as starting materials may give
uniform microstructure exhibiting better magnetic and electrical transport properties.
With the substitution of rare earth metals in the Mn-Zn ferrite system permeability
and magnetic properties are expected to be improved. Thus this system will have
further good technological application in high frequency range. In our research in soft
magnetic materials and in rare earth metal doped ferrites, Bangladesh may develop a
profitable electronic industry
1.3 Experimental Reason for This Research Work
Mn0.5Zn0.5YxFe2-xO4 samples has been prepared by standard solid state
reaction technique. High purity powders of MnO (99.9%), ZnO (99.9%), Y2O3
(99.9%), Fe2O3 (99.9%) will be mixed thoroughly in an appropriate amount mixing
will be performed in both dry and acetone. The mixed powders will be calcined at
high temperature. After calcinations toroid and disk shaped sample will be prepared
and will be sintered at temperatures. The experimental methods that have been used in
this work are as follows:
The prepared sample would be characterized in terms of their
crystal structure, unit cell parameters and phase presents in the
prepared sample with the help of X-ray diffractometer (XRD) in
the material science division, Atomic Energy Center (AEC),
Dhaka
Sintering of the samples has been carried out in a microprocessor
controlled high temperature furnace department of Physics,
Khulna University of Engineering & Technology(KUET) , Khulna
Surface morphology of the samples has been investigated using
scanning electron microscope in the material science division,
AEC, Dhaka.

5
Permeability, magnetic loss factor and quality factor as function
of frequency have been determining using impedance analyzer in
the department of Physics, KUET, Khulna
Magnetizations of the samples have been measured as a function
of field using vibrating sample magnetometer (VSM) in the
material science division, AEC, Dhaka
AC electrical resistivity as a function temperature has been
studied with the help of electrometer in the department of Physics,
KUET, Khulna
Dielectric properties as a function of frequency have been studied
with the help of inductance meter department of Physics, KUET,
Khulna
Finally the structural properties of Fe replaced Y in Mn-Zn ferrites such as
grain size, lattice parameters is modified due to the incorporation Y3+
ions. The
saturation magnetization, the quality factor, electrical resistivity of Mn-Zn ferrites are
also expected to improve and accumulated results has been interpreted on the basis of
existing theories of magnetic.
1.4 Application of Ferrites
Ferrites are primarily used as inductive components in a large variety of
electronic circuits such as low noise amplifiers, filters, voltage controlled oscillators,
impedance matching networks for instance. The basic components to produce the
inductance are very soft ferrite and a metallic coil. Multilayer chip inductors for high
frequency circuit’s applications use sheets made of dielectric ceramics instead of
ferrite industry. Rare earth ferrites are used widely now-a-days due to their following
applications:
Biomedical (e.g., hip and joint replacements)
Ball bearings and hard face seals
Oil drilling
Automotive and marine engines
Industrial machines
Magneto-optical materials
Magnetic refrigerant materials

6
Neutron absorber material for atomic reactor and catalysts for
chemical reactions
Microwave technology, manufacture of fluorescent powder for
color TV sets etc.
1.5 Review of the Earlier Research Work
Remarkable properties such as high permeability, high quality factor, high
stability of initial permeability with temperature and time, high resistivity, controlled
coercive force etc. have appositely placed Mn-Zn ferrites as high demandable
materials to both researchers and manufacturers. Hilpert [1.12] first focused of the
usefulness of ferrites at high frequency applications. Ferrites were developed into
commercially useful materials by Snoek [1.13] and his associates at Philips research
laboratories in Holland during years 1933 – 1945. The greatest advances for the Mn-
Zn ferrites were made in the mid-sixties fast centuries. Mn-Zn ferrites with
composition Mn0.3Zn0.4Fe2.3O4 have high permeability because of low value of
magnetostriction and anisotropy [1.14]. As soft magnetic materials Mn-Zn ferrites
have been proved to be the smart candidate of highest rank. The requisites for modern
ferrite are so many in numbers that only extensive research in this field can meet the
huge demand of technology.
Takai [1.15] in Japan at the same time was engaged in the research on the
ferrite materials. He was particularly looking for high permeability materials of cubic
structure. He found suitable materials in the form of mixed spinel of the type (Me-
Zn).Fe2O4, where Me represents metal Like Mn, Ni, Mg, Cu, etc. Many Scientists and
technologists have focused their attention on the improvement of electromagnetic
properties of the ferrite by divalent ions substitution. Generally, the divalent metal
ions (Me2+
); Ni, Zn, Cu, Mg, Mn, Co or mixtures of these are substituted in different
spinel ferrites. Spinel ferrites are extremely important for academic and technological
applications. The physical properties such as structural, electrical and magnetic
properties are governed by the type of magnetic ion residing on the tetrahedral A –site
and octahedral B-site of the spinel lattice and the relative strength of the inter and
inter-sub lattice interaction. Divalent ion substitutes have different sitting preferences
for the two sites (‘A’ and ‘B’) in the spinel structure and can change many properties
as an effect of modified cation distribution in the ferrite. On the basis of site
distribution of Me2+
ions and the strength of the exchange interaction among magnetic
7
ions, the influent influence of Me2+
substitution on electromagnetic properties can be
explained.
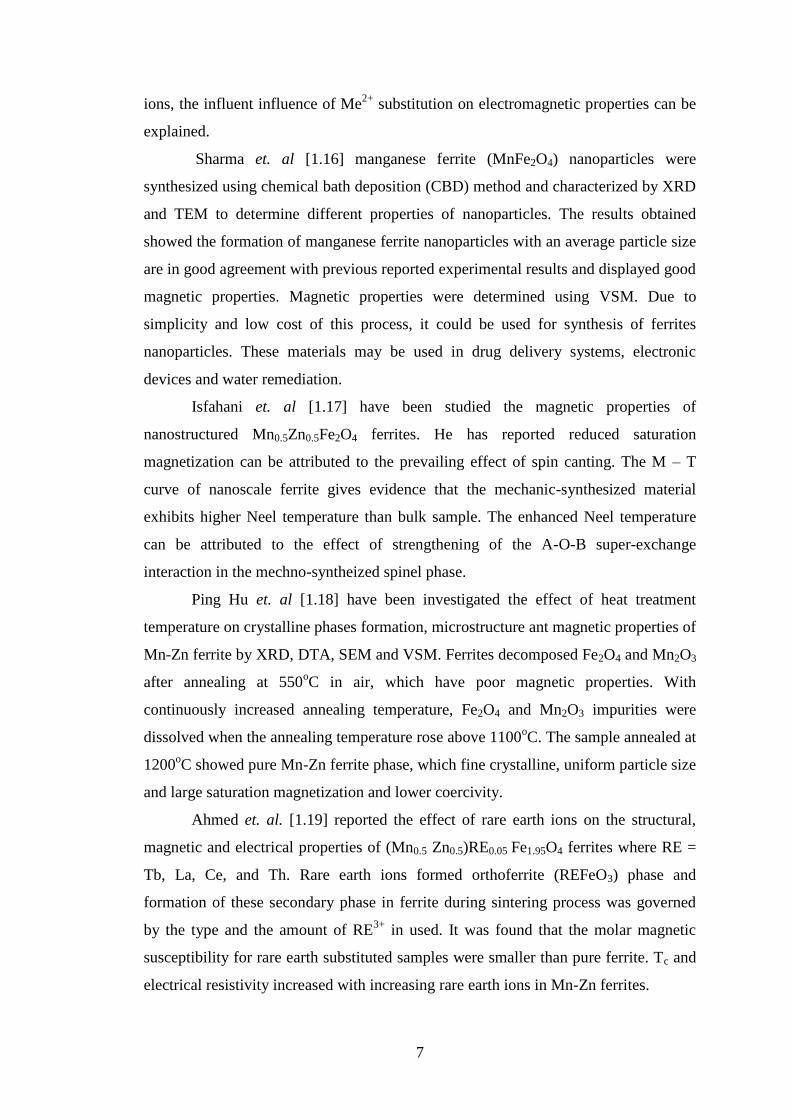
Sharma et. al [1.16] manganese ferrite (MnFe2O4) nanoparticles were
synthesized using chemical bath deposition (CBD) method and characterized by XRD
and TEM to determine different properties of nanoparticles. The results obtained
showed the formation of manganese ferrite nanoparticles with an average particle size
are in good agreement with previous reported experimental results and displayed good
magnetic properties. Magnetic properties were determined using VSM. Due to
simplicity and low cost of this process, it could be used for synthesis of ferrites
nanoparticles. These materials may be used in drug delivery systems, electronic
devices and water remediation.
Isfahani et. al [1.17] have been studied the magnetic properties of
nanostructured Mn0.5Zn0.5Fe2O4 ferrites. He has reported reduced saturation
magnetization can be attributed to the prevailing effect of spin canting. The M – T
curve of nanoscale ferrite gives evidence that the mechanic-synthesized material
exhibits higher Neel temperature than bulk sample. The enhanced Neel temperature
can be attributed to the effect of strengthening of the A-O-B super-exchange
interaction in the mechno-syntheized spinel phase.
Ping Hu et. al [1.18] have been investigated the effect of heat treatment
temperature on crystalline phases formation, microstructure ant magnetic properties of
Mn-Zn ferrite by XRD, DTA, SEM and VSM. Ferrites decomposed Fe2O4 and Mn2O3
after annealing at 550oC in air, which have poor magnetic properties. With
continuously increased annealing temperature, Fe2O4 and Mn2O3 impurities were
dissolved when the annealing temperature rose above 1100oC. The sample annealed at
1200oC showed pure Mn-Zn ferrite phase, which fine crystalline, uniform particle size
and large saturation magnetization and lower coercivity.
Ahmed et. al. [1.19] reported the effect of rare earth ions on the structural,
magnetic and electrical properties of (Mn0.5 Zn0.5)RE0.05 Fe1.95O4 ferrites where RE =
Tb, La, Ce, and Th. Rare earth ions formed orthoferrite (REFeO3) phase and
formation of these secondary phase in ferrite during sintering process was governed
by the type and the amount of RE3+
in used. It was found that the molar magnetic
susceptibility for rare earth substituted samples were smaller than pure ferrite. Tc and
electrical resistivity increased with increasing rare earth ions in Mn-Zn ferrites.
8
Zhao et. al [1.20] reported influence of Gd on magnetic properties of
Ni0.7Mn0.3GdxFe2-xO4 ferrites. It has been found the crystallite sizes decreased when
Gd ions were doped into Ni-Mn ferrites. With Gd substitution, when x > 0.06 all Gd
ions could not enter into the ferrite lattice but resided at grain boundary. The
maximum content of Gd3+
ions in ferrite lattices was substituted when x = 0.06.
Razlescu et. al [1.21] investigated the influence of RE like Yb, Er, Dy, Tb, Gd, Sm
substitution on structure, magnetic and electrical properties of Li0.3Zn0.4Fe1.96RE0.04O4
ferrites. They found that RE2O3 facilitated the formation of secondary phases at grain
boundary which suppressed the grain growth. The results also showed that the Curie
point shifted to lower temperature and increased the electrical resistivity.
Sun et. al [1.22] reported the effect of Fe substitution by La and Gd on the
structure, magnetic and dielectric properties of Ni0.5Zn0.5Fe2-xRExO4 ferrites. It was
found that the relative density of sintered bodies decreased and the lattice parameter
increased with increasing RE ion substitution. La and Gd both tend to increase the
cut-off frequency, decrease the initial permeability and magnetic loss tangent which
could be explained by a combination of low density, small grain size, secondary phase
formation and more lattice defects. The low loss tangent values resulted mainly from
the reduction in eddy current loss due to the higher electrical resistivity with
increasing RE ion.
Nakamura [1.23] reported on frequency dispersion of permeability in ferrite
composite materials. The permeability increases with increasing density of composite
materials. As the ferrite content decreases both the real and imaginary parts of the low
frequency permeability is significantly reduced, and the peak frequency of imaginary
part of permeability shifts toward higher frequency.
Zhong et. al. [1.24] the effects of RE2O3 (RE = Sm, Gd, Ce and Y) doping on
the microstructure and magnetic properties of Mn-Zn ferrite have been investigated.
The single spinel phase structure can be maintained with the doping amounts up to
0.07 wt.%. A refined grain structure and uniform grain size distribution can be
obtained in the optimally doped materials. With a small amount of doping, the
permeability increases significantly and the magnetic loss and coercivity decrease, but
further increase of the doping content leads to a reduced permeability and increased
loss and coercivity. To achieve excellent magnetic properties, the optimized doping
amount for Sm2O3 or Gd2O3 is 0.01 wt. %, while for Ce2O3 or Y2O3 is 0.03 wt. %. The
9
sample with 0.01 wt. % Sm2O3 shows the magnetic properties with permeability, loss,
and coercivity of 2586, 316W/ kg, and 24A/m, respectively, at 200 mT and 100 kHz.
In the present work, the attempt is made to systematically investigate the
structural, magnetic, electric and dielectric properties of rare earth (RE = Y3+
, x =
0.00, 0.02, 0.04, 0.06, 0.08 and 0.10) substituted Mn0.50Zn0.50RExFe2-xO4 spinel
ferrites and it is prepared by Standard Ceramic Method. This composition can be used
for technological applications
1.6 Outline of the Thesis
The thesis has been configured into five chapters which are as follows:
Chapter 1: Introduction
In this chapter, presents a brief introduction to Mn-Zn ferrites and organization
of thesis. This chapter incorporates background information to assist in understanding
the aims and objectives of this investigation, and also reviews recent reports by other
investigators with which these results can compared.
Chapter II: Theoretical Background
In this chapter, a briefly describe theories necessary to understand magnetic
materials as well as ferrites, classification of ferrites, cation distribution, super
exchange interaction, two sub lattices modules etc. have been discussed in details.
Chapter III: Experimental Background
In this chapter, the experiment procedures are briefly explained along with
description of the sample preparation, raw materials. This chapter deals with mainly
the design and construction of experimental and preparation of ferrite samples. The
fundamentals and working principles of measurement set up are discussed.
Chapter IV: Results and Discussion
In this chapter, results and discussion are thoroughly explained. The various
experimental and theoretical studies namely Effect of Rare Earth Metal Substitution
on the Structural, Electrical and Magnetic properties of Mn-Zn Ferrites are presented
and discussed step by step.
Chapter V: Conclusion
In this chapter, the results obtained in this study are summarized. Suggestions
for future works on these studies are included.
Finally a complete list of references and publications as been given towards
the end of this chapter.

10
THEROETICAL BACKGROUND
2.1 Rare Earth Ferrites
In 1948, L. Neel announced his celebrated theoretical contribution on
ferrimagnetism. This deal with the basic phenomenon of “spin-spin interaction” takes
place in the magnetic sublattices in ferrites. The stage was now set for development of
microwave ferrite devices. In 1956, Neel, Bertaut, Ferrat and Pauthenet discovered
the garnet ferrite class of materials. This type of ferrite material has three sublattices
and also referred to as rare earth iron garnets. These materials, through having a
magnetization lower than spinel ferrite, possess extremely low ferromagnetic line
width. The rare earth substituted different ferrites are becoming the promising
materials for different applications. Addition of small amount of rare earth ions to
ferrite samples producing a change in their magnetic and electrical as well as
structural properties depending upon the types and the amount of rare earth elements
used. The rare earth elements are all metals, and the group is often referred to as the
"rare earth metals." These metals have many similar properties and that often causes
them to be found together in geologic deposits. They are also referred to as "rare earth
oxides" because many of them are typically sold as oxide compounds. Rare earth
elements are not as "rare" as their name implies. Thulium and lutetium are the two
least abundant rare earth elements - but they each have an average crustal abundance
that is nearly 200 times greater than the crustal abundance of gold [2.1].
The rare earth ions have unpaired 4f electrons and the strong spin orbit
coupling of the angular momentum. Moreover, 4f shell of rare earth ions is shielded
by 5s25p
6 and almost not affected by the potential field of surrounding ions. Doping
rare earth ions into spinel type ferrites, the occurrence of 4f-3d couplings which
determine the magneto-crystalline anisotropy in spinel ferrite can also improve the
electric and magnetic properties of spinel ferrites [2.2-2.5]. Spinel ferrites ceramic are
widely used in microwave devices to control transmission path, frequency, amplitude
and phase of microwave signals. Accurate dielectric and magnetic properties
measurement at the operational frequency and temperature ranges are needed for
optimized development of these devices, as well as to assist in the manufacture of the
ferrite [2.6]. The structured magnetic materials have an interesting area of study
because of its possible applications in a variety of widely areas ranging from
information technology to biotechnology [2.7]. The properties of ferrites are being

11
improved due to the increasing trends in ferrite technology. It is believed that there is
a bright future for ferrite technology. Ferric magnetism in ferrite is largely governed
by Fe-Fe interaction, i.e. the spin coupling of the 3d electron. In view of the great
interest of rare earth doped Mn-Zn ferrites, both their technological applications and
theoretical understanding of the mechanisms involved, the present work is aimed at
finding the effect Y ions. A large number of workers are engaged in research to bring
about improvement on the qualities of rare earth doped Mn-Zn ferrites.
2.2 Types Ferrites
In terms of the magnetic properties, ferrites are often classified as soft and
hard which refers to their low or high coercivity respectively. Exhibiting dielectric
properties means that even through electromagnetic waves can pass through ferrites,
they do not readily conduct electricity. This also gives them an advantage over irons,
nickel and other transition metals that have magnetic properties in many applications
because these metals conduct electricity. Ferrites are classified into two categories
based on their coercive field strength.
They are:
(i) Soft ferrite with coercive field strength < 10 Oe
(ii) Hard ferrite with coercive field strength > 125Oe
In terms of the crystal structure, ferrites are often classified crystal structure,
ferrites are of following types. [2.12]
Cubic ferrites
Spinel Ferrite
Hexagonal ferrites
Garnet
Ortho- ferrite
The present research work is a spinel ferrites, therefore it has been discussed
in detail the spinel ferrites only.
2.2.1 Cubic Ferrites
General formula of cubic ferrites is MO.Fe2O3, where M is divalent metal ion
like Mn, Ni, Fe, Co, Zn, Mg, Cd, Cu, etc. Cobalt ferrite like CoO.Fe2O3 is
magnetically hard, but all other cubic ferrites are magnetically soft. Usually, ferrites
have spinel structures, often called ferro-spinel because their crystal structure is
closely related to that of mineral spinel MgO.Al2O3. In case of ferrites the divalent

12
ions replace Mg and trivalent ions replace Al. In all cases the ionic radii of the
substitution ion should be between about 0.5 to 1Ao.
2.2.2 Spinel Ferrites
Soft ferrites entirely belong to spinel family. They are also called cubic ferrite.
Spinel is the most widely used family of ferrite. High values of electrical resistivity
and low eddy current losses make them ideal for their use at microwave frequencies.
The spinel structure of ferrite as possessed by mineral spinel MgAl2O4 was first
determined by Bragg and Nishikawa in 1915 [2.8 - 2.9]. The chemical composition of
a spinel ferrite can be written in general as MFe2O4 where M is a divalent metal ion
such as Co2+
, Zn2+
, Fe2+
, Mg2+
, Ni2+
, Cd2+
, Cu2+
or a combination of these ions. Spinel
is an important class of mixed metal oxides, which has the general chemical
composition of A2+
B3+
O42-
. Normally A is a divalent metal such as Mg, Mn, Fe, Zn,
Cu etc and B is trivalent metal such as Ti, Fe, Al and Co. The structure consists of a
cubic closed-packed array of 32 oxide ions, which forms 64 tetrahedral holes and 32
octahedral in a unit cell. There are two main types of spinels:
(i) In normal spinel all the A2+
cations occupy one of the available
tetrahedral holes and all the B3+
cations occupy other of the
octahedral holes. Normal spinels represented as A3+
[B23+
]O42-
[2.10].
(ii) In inverse spinels all the A2+
cations and half of the B3+
cations
are in octahedral and other half of the B2+
cations are in the
tetrahedral holes. Inverse spinels are represented as
B3+
[A2+
B3+
]O42-
.
The magnetic properties of spinel ferrites are generally influenced by
composition and cation distributions. Variation of cation distribution between the
cationic sites lead to different electrical and magnetic properties even if the
composition of cations over A and B sites is determined by their ionic radius,
electronic configuration and electrostatic energy in the spinel lattice
2.2.3 Hexagonal Ferrites
Hexagonal ferrites widely used in microwave applications, have an axis of
symmetry, C and high magnetocrystalline anisotropy. This was first identified by
Went, Rathenau, Gorter and Van Oostershout 1952 [2.11] and Jonker, Wijn and

13
Braun 1956. The preparation of hexagonal ferrites is the ceramic technique is almost
same as that of spinels. During the pressing the grains are oriented by a magnetic field
in order to align the C-axis of all crystallites in the same direction. As a result, sample
similar to a perpendicular to magnetization direction, a gyro-resonance effect is
observed. There are two types of hexagonal ferrites:
(i) M-type ferrites are derived from Ba or Sr-ferrites, whose formulae are
BaFe12O9 and SrFe12O9, by partial substitution of Al3+
ions for Fe2+
ions which causes the magnetization and magneto crystalline
anisotropy field to increase; by substitution of the groups Ti4+
M2+
or
Ge4+
M2+
(with M2+
= Co, Ni, Zn, Mg, etc) for Fe3+
ions, which causes
both the magnetization and the anisotropy field to decrease.
(ii) W-type are derived from Ba-ferrites whose formula is Ni2BaFe16O27,
by partial substitution of Al3+
ions for Fe3+
ions, causing an increment
in magnetization and anisotropy field; by partial substitution of Co2+
for Ni2+
causes anisotropy field to decrease keeping magnetization
unchanged. These ferrites are used in circulators with resonance
frequencies lower than those M-type.
2.2.4 Garnets
Garnets refer to a group of mixed oxides with chemical formula A33+
B53+
O122-
,
where A3+
is a rare earth or Yttrium ions. The B3+
ions form two anti-parallel sub-
lattices composed of 16 octahedral and 24 tetrahedral sites. The A3+
ions form a third
sublattice of 24 dodecahedral sites in which each A3+
is surrounded by 8 oxygen ions
located at the corners of a polyhedron with12 faces and 18 edges. 24 A3+
ions enter
into dodecahedral sites. Examples of garnets are Yttrium Iron Garnet (YIG) and
Yttrium Aluminum Garnet (YAG) etc., YIG with chemical composition
Y33+
Fe53+
O122-
, has a spontaneous magnetization that arises from unequal number of
Fe3+
ions in each of two sub-lattices.
The mineral garnet refers to group of mixed oxides, of which the widely
known on has the chemical formula Mn3Al2Si13O12, or equivalently 3MnO.
Al2O3.3Si2O3 single magnetic garnets have the general formula.
3M2O3. 5 Fe2O3 = 2 M33+
Fe53+
O12
It is to be noted that in magnetic garnets the 24 positive charge units per
formula units are divided unequally between the ferrites ions (15 units) and another

14
species of trivalent ions (9 units). Technically metal garnets are those with M = Sm,
Eu, Gd, Tb, Dy, Ho, Er, Tm, Yb and Yttrium. They are known as rare garnets. A code
system has been adopted to name them. REG stands for the rare –earth garnets, GDIG
for gadolinium-iron garnet (Gd3 Fe5O12) etc. Garnets crystallize in the cubic system
with two fifths of the ferrite ions forming a bcc lattice, like ferrospinel, the garnets
too. Patch a large number (160) of ions in eight unit‟s formula unit cell. The lattice
constant is nearly 12.5oA about 50% larger than those ferrospinel.
2.2.5 Ortho-ferrites
Ortho-ferrites have the general formula MFeO3, where, M is a large trivalent
metal ion, such as rare-earth ion or Y. They crystallize in a distorted pervoskite
structure with an orthorhombic unit cell. These ortho-ferrites show a weak
ferromagnetism, which has been attributed to the small canting in the alignment of
two anti-ferromagnetically coupled lattices. The canting angle is of the order of 10-2
radian but is sufficient to introduce a small net ferromagnetic moment perpendicular
to the antiferromagnetic axis.
2.3 Soft Magnetic Materials
The wide variety of magnetic materials can be divided into two groups, the
magnetically soft and the magnetically hard. Soft magnetic materials are those
materials that are easily magnetized and demagnetized. They have low magneto
crystalline anisotropy resulting in reduced coercivity and high permeability. They
typically have intrinsic coercively less than 1000 Am-1
. They are used primarily to
enhance and/or channel the flux produced by an electric current. The important
parameter, often used as a figure of merit for soft magnetic materials, is the high
relative permeability (where μr
=B
μ0H), which is a measure of how readily the
material responds to the applied magnetic field. The other main parameters of interest
are the coactivity, the saturation magnetization and the electrical conductivity.
The types of applications for soft magnetic materials fall into two main
categories: AC and DC. In DC applications the material is magnetized in order to
perform an operation and then demagnetized at the conclusion of the operation, e.g.
an electromagnet on a crane at a scrap yard will be switched on to attract the scrap
steel and then switched off to drop the steel. In AC applications the material will be
continuously cycled from being magnetized in one direction to the other, throughout
15
the period of operation, e.g. a power supply transformer. A high permeability will be
desirable for each type of application but the significance of the other properties
varies.
For DC applications the main consideration for material selection is most
likely to be the permeability. This would be the case, for example, in shielding
applications where the flux must be channeled through the material. Where the
material is used to generate a magnetic field or to create a force then the saturation
magnetization may also be significant. For AC applications the important
consideration is how much energy is lost in the system as the material is cycled
around its hysteresis loop. The energy loss can originate from three different sources:
(1) hysteresis loss, which is related to the area contained within the hysteresis loop;
(2) eddy current loss, which is related to the generation of electric currents in the
magnetic material and the associated resistive losses and (3) anomalous loss, which is
related to the movement of domain walls within the material. Hysteresis losses can be
reduced by the reduction of the intrinsic coercivity, with a consequent reduction in the
area contained within the hysteresis loop.
2.3.1 Soft Ferrites
Soft ferrites are those that can be easily magnetized or demagnetized. This
shows that soft magnetic materials have low coercive field and high magnetization
that is required in many applications. At high frequency metallic soft magnetic
materials simply cannot be used due to the eddy current losses. Therefore, soft
ferrites, which are ceramic insulators, become the most desirable material. These
materials are ferrimagnetic with a cubic crystal structure and the general composition
MO.Fe2O3, where M is a transition metal such as nickel, manganese, magnesium or
zinc. The magnetically soft ferrites first came into commercial production in 1948.
The hysteresis loop for a soft ferrite should be thin and long, therefore the energy loss
is very low in soft magnetic material. Example are Ni, Fe, Co, Mn etc. They are used
in transformer cores, inductors, recording heads and microwave devices [2.12]. Soft
ferrites have certain advantages over other electromagnetic materials including high
resistivity and low eddy current losses over wide frequency ranges.
Mn-Zn ferrite, sold commercially as ferroxcube, can be used at frequencies up
to 10MHz, for example in telephone signal transmitters and receivers and in switch
mode power supplies (also referred to as AC-DC converters). For these type of

16
application the driving force to increase frequency is to allow miniaturization.
Additionally, part of the family of soft ferrites, are the microwave ferrites, e.g. yttrium
iron garnet. These ferrites are used in the frequency range from 100MHz to 500GHz,
for waveguides for electromagnetic radiation and in microwave devices such as phase
shifters.
2.3.2 Hard Ferrites
Hard ferrites are difficult to magnetize or demagnetize. Hard magnets are
characterized by high remnant inductions and high coercivities. They generally
exhibit large hysteresis losses. Hard ferrite referred to as permanent magnets retain
their magnetism after being magnetized. Hard ferrite likes Ba-ferrite, Sr-ferrite, Pb-
ferrite are used in communication device operating with high frequency currents
because of their high resistivity, negligible eddy currents and lower loss of energy due
to Joule heating and hysteresis. These are found useful in many applications including
fractional horse-power motors, automobiles, audio- and video- recorders, earphones,
computer peripherals, and clocks. The magnets can also be used to moderate
demagnetizing fields and hence can be used for applications such as permanent
magnet motors. The hexagonal ferrite structure is found in both BaO.6Fe2O3 and
SrO.6Fe2O3, but Sr ferrites have superior magnetic properties.
2.4 Magnetic Exchange Interaction
In physics, the exchange interaction is a quantum mechanical effect without
classical analogue which increases or decreases the expectation value of the energy or
distance between two or more identical particles when their wave functions overlap.
For example, the exchange interaction results in identical particles with specially
symmetric wave function (bosons) appearing closer together than would be expected
distinguishable particles, and identical particles with spatially anti symmetric wave
functions (fermions) appearing further apart. The exchange interaction is the
mechanism responsible for ferromagnetism, among other consequences.
The electron spin of the two atoms Si and Sj which is proportional to their
product .The exchange energy can be written as universally in terms of Heisenberg
Hamiltonian [2.13]
H = -ΣJij Si.Sj = -ΣJij Si Sj cosϕ , (2.1)

17
Where Jij is the exchange integral represents the strength of the coupling
between the spin angular momentum i and j and φ is the angle between the spins. It is
well known that the favored situation is the one with the lowest energy and it turns out
that there are two ways in which the wave functions can combine there are two
possibilities for lowering the energy by H.
These are:
a. If Jij is positive and the parallel spin configuration (cosϕ = 1) the
energy is minimum.
b. If Jij is negative and the spins are ant parallel (cosϕ = -1) energy is
maximum. This situation leads to ant ferromagnetism.
2.5 Super Exchange Interaction
The magnetic interaction in magnetic oxide ferrites cannot be explained on the
basis of direct interaction because of the following facts:
(i) The magnetic ions are located too far apart from each other shielded by the
non magnetic anion i.e., oxygen. This is because these are not band type
semiconductor [2.14] .The non magnetic anion such as oxygen is situated in
the line joining magnetic cations.
(ii) Super exchange interaction appears, i.e. indirect exchange via anion p-orbital
that may be strong enough to order the magnetic moments.
This p-orbital of an anion (center) interact with the d orbital of the transitional
metal cations.
Three major types of super exchange interactions in spinel ferrites are: JAB,
JBB, and JAA. Ferromagnetic oxides are one kind of magnetic system in which there
exist at least two in equivalent sub lattice for the magnetic ions. The anti parallel
alignment between these sub lattices (ferrimagneting ordering ) may occur provided
the inter sub lattice (JAB) exchange interaction are ant ferromagnetic and some
requirements concerning the signs and strength of the intra-sub lattice (JAA, JBB)
exchange interactions are fulfilled.
Since usually in ferromagnetic oxides the magnetic cations are surrounded by
bigger oxygen anions (almost excluding the direct overlap between cation orbital)
magnetic interactions occur via indirect super exchange interactions depends both on
the electronic structure of the cations and their geometrical arrangement [2.15]. In

18
most of ferromagnetic oxides the crystallographic and electronic structure give rise to
ant ferromagnetic inter and intra-sub lattice competing interactions.
Figure 2.1: Three major types of super exchange interactions in spinel ferrites are
as follows: JAB, JBB and JAA. The small empty circle is A-site, the small
solid circle is B-site, and the large empty circle is oxygen anion.
The magnitude of negative exchange energies between the two magnetic ions
M and M' depend upon the distances from these ions to the oxygen ion O2-
via which
the super exchange takes place and on the angle M-O-M'(ϕ). According to the super
exchange theory the angle ϕ= 180° gives rise to the greatest exchange energy, and this
energy decrease very rapidly as the distance between the ions increases. The magnetic
properties of the spinel ferrites are governed by the type of magnetic ions residing on
the A and B-sites and the relative strengths of the inter-sub lattice (JAB) and intra-sub
lattice (JAA, JBB) exchange interactions.
2.6 Theory of Initial Permeability
Initial permeability describes the relative permeability of a material at low
values of B. The maximum value for μ in a material is frequently a facing of between
2 and 5 or more above its initial value. Low flux has the advantage that every ferrite
JAA
JAB
JBB

19
can be measured at that density without risk of saturation. This consistency means that
comparison between different ferrite is easy.
For high frequency application, the desirable property of a ferrite is the high
initial permeability with low loss. The present goal of the most of the recent ferrite
researches is to fulfill this requirement. The initial permeability μi is defined as the
derivative of induction B with respect to the initial field H in the demagnetization
state.
𝜇𝑖 = 𝑑𝐵
𝑑𝐻 𝐻 → 0, 𝐵 → 0 (2.2)
At microwave frequency and also in low anisotropic materials, dH and dB
may be in different directions. The permeability is thus a tensor character. In the case
of amorphous materials containing a large number of randomly oriented magnetic
atoms the permeability will be scalar. As we have
B = μ0 (H+M) (2.3)
and susceptibility
𝜒 = 𝑑𝑀
𝑑𝐻 =
𝑑
𝑑𝑥𝐻(
𝐵
𝜇0 – 1) =
1
𝜇0 (𝜇 − 1) (2.4)
The magnetic energy density
𝐸= 1
𝜇0 𝐻. 𝑑𝐵 (2.5)
For time harmonic fields H = H0 Sin wt. The dissipation can be described by a
phase difference between B+ and B.
Permeability is namely defines as the proportional constant between the
magnetic field induction B and applied intensity H:
HB (2.6)
If a magnetic material is subjected to an AC magnetic field as given below:
tieHH
0 (2.7)
Then it is observed that the magnetic flux density B experiences a delay. The delay is
caused due to presence of various losses and is thus expressed as
B = B0 ei (ωt –δ)
(2.8)
Where δ is the phase angle and marks the delay of B with respect to H. The
permeability is then given by
ti
ti
eH
eB
H
B
0
)(
0
= 0
0
H
eB i
= cos0
0
H
B-i sin
0
0
H
B (2.9)
μ = μ' - iμ'' (2.10)
20
Where cos0
0
H
B (2.11)
µ'' =i sin0
0
H
B (2.12)
The real Part μ' of complex permeability μ represent the component of B
induction which is in phase with H, so it corresponds to the normal permeability. If
there is no losses , we should have μ = μ', The imaginary part μ'' corresponds to that
part of B which is delayed by phase angle δ from H arranging up to 90° from H . The
presence of such a component requires a supply of energy to maintain the alternating
magnetization regardless of the origin of delay. The ratio of μ'' to μ‟ as is evident from
equation gives:
cos
sin
0
0
0
0
H
B
H
B
= tan δ (2.13)
This tan δ is called the loss Factor or loss tangent. The Q-Factor or quality
factor is defined as the reciprocal of this loss factor, i.e.
tan
1Q (2.14)
And the relative quality factor = μ ′
tan δ= μ' Q (2.15)
The behavior of μ' and μ'' versus frequency is called the permeability
spectrum. The initial permeability of a ferromagnetic or ferromagnetic substance is
the combined effects of the wall permeability and rotational permeability
mechanisms.
2.7 Magnetization Process
A review of magnetization process, namely the response of ferro-or ferri
magnetic material (bulk) to an applied field with a semi-microscopic approach is
presented. In ferro- or ferri-magnetic material, the magnetization curves, especially in
low magnetic fields differ widely from sample to sample and as a function of the
magnetic history of the sample i.e., of the previous fields which have been
successively applied.

21
2.7.1 Magnetization Curve
For unmagnetized bulk materials, there is a zero net magnetic moment. It can
be predicted that there will be an infinite number of degree of magnetization between
the unmagnetized and saturation conditions, when the material is subjected to an
external magnetic field. These extreme situations are corresponds respectively to
random orientation of domains complete alignment is one direction with elimination
of domain walls. If we start with a demagnetized specimen and increase the applied
magnetic field, the bulk material will progressively magnetized by the domain
dynamics. The magnetization of the sample will follow the course as shown in figure
2.2 [2.16]. The slop from the origin to a point on the curve r the ratio 𝑀𝐻 is defined
as magnetic susceptibility. This curve is called magnetization curve. This curve is
generally perceived as being made of three major portions.
Figure 2.2: Domain dynamics during various parts of the magnetization curve
The first, the lower section, is the initial susceptibility region and
characterized by reversible domain wall movements and rotations. By reversible
means that after the magnetization slightly with an increase in field the origin
magnetization can be reversed if the field is reduced to initial value. The condition of
the displacement walls to an initial permeability is entirely dependent on the sort of
material studied
In the second stage magnetization curve if the field is increased, the intensity
of the magnetization increases more drastically is called the irreversible magnetization

22
range. This range is obtained mainly by the reversible domain wall motion from one
stable state to another
If the field is increased further, the magnetization curve less step and its process
become reversible once more. In the third section of magnetization curve, the
displacement of domain walls have all ready been completed and the magnetizations
take place by rotation magnetization. This range is called rotation magnetization
range. Beyond this range the magnetization gradually approaches to saturation
magnetization shown in figure 2.3
Figure 2.3: Magnetization curve and the classification of magnetization mechanism
2.8 DC Resistivity of Ferrites
Extensive investigation into the origin of the electrical conductivity of the
spinels has been carried out by Verwey [2.17] and later on by Van Uitert [2.18] and
Jonker [2.19]. The resistivity of ferrites at room temperature can vary, depending on
chemical composition between about 10-2
to higher than 10+11
ohm-cm [2.8]. The low
value of resistivity is due to the simultaneous presence of ferrous and ferric ions on
equivalent lattice sites (octahedral) as proposed by Verwey [2.17]. For example Fe3O4
at room temperature has resistivity of approximately 7×10⁻³
Ohm-cm and Fe2O4 with
some deficiency in iron and sintered in a sufficiently oxidizing atmosphere so that the
product contains no ferrous ions can have a resistivity higher than 7×10⁶ ohm-cm. To
make high resistivity ferrites one must sure that there are no ferrous ions in the
stoichiometric ferrites.

23
Temperature dependent resistivity of ferrites follows Arrhenius relation [2.19]:
kT
Ea
e0 , (2.16)
Where ρ is the resistively and Ea is the activation energy required for hopping of an
electron from one lattice site to another.
2.9 Microstructure
A polycrystal is much more than many tiny crystals bonded together. The
interfaces between the crystals, or the grain boundaries which separate and bond the
grains, are complex and interactive interfaces. The whole set of a given material‟s
properties (mechanical, chemical and especially electrical and magnetic) depend
strongly on the nature of the microstructure. In the simplest case, the grain boundary
is the region, which accommodates the difference in crystallographic orientation
between the neighboring grains. For certain simple arrangements, the grain boundary
is made of an array of dislocations whose number and spacing depends on the angular
deviation between the grains. The ionic nature of ferrites leads to dislocation patterns
considerably more complex than in metals, since electrostatic energy accounts for a
significant fraction of the total boundary energy [2.20].
For low-loss ferrite, Ghate [2.20] states that the grain boundaries influence properties
by
(i) Creating a high resistivity intergranular layer,
(ii) Acting as a sink for impurities which may act as a sintering aid and grain
growth modifiers,
(iii) Providing a path for oxygen diffusion, which may modify the oxidation state
of the cations near the boundaries.
In addition to grain boundaries, ceramic imperfections can impede domain
wall motion and thus reduce the magnetic property. Among these are pores, cracks,
inclusions, second phases, as well as residual strains. Imperfections also act as energy
wells that pin the domain walls and require higher activation energy to detach.
Stresses are micro structural imperfections that can result from impurities or
processing problems such as too rapid a cool. They affect the domain dynamics and
are responsible for a much greater share of the degradation of properties than would
expect.

24
Grain growth kinetics depends strongly on the impurity content. A minor do
pant can drastically change the nature and concentration of defects in the matrix,
affecting grain boundary motion, pore mobility and pore removal [2.21]. The effect of
a given do pant depends on its valence and solubility with respect to host material. If
it is not soluble at the sintering temperature, the do pant becomes a second phase
which usually segregates to the grain boundary.
Figure 2.4: Porosity character: (a) intergranular, (b) intragranular
The porosity of ceramic samples results from two sources, intragranular
porosity and intergranular porosity, figure 2.4. An undesirable effect in ceramic
samples is the formation of exaggerated or discontinuous grain growth which is
characterized by the excessive growth of some grains at the expense of small,
neighboring ones, figure 2.5. When this occurs, the large grain has a high defect
concentration. Discontinuous growth is believed to result from one or several of the
following: powder mixtures with impurities; a very large distribution of initial particle
size; sintering at excessively high temperatures; in ferrites containing Zn and /or Mn,
a low O2 partial pressure in the sintering atmosphere. When a very large grain is
surrounded by smaller ones, it is called „duplex‟ microstructure.
Figure 2.5: Grain growth (a) discontinuous, (b) duplex (schematic).

25
Experimental Procedure
3.1 Methodology of Rare Earth Ferrite Preparation
This chapter focuses on the methods and techniques used to synthesize,
characterization and investigation of Mn-Zn based substituted mixed ferrites. Ferrites
are ceramic compounds like Fe2O3 as their principal components. The spinel structure
is the common form of all ferrites. Now-a-day, majority of ferrite powders are made
by standard ceramic technique or solid state reaction methods are known as sintering.
Many techniques have been developed for the improvements of the basic operations
of ceramic fabrication. The preparation of rare earth ferrites with optimum desired
properties is still a complex and difficult task. Knowledge and control of the chemical
composition, homogeneity and microstructure are very crucial. The rare earth ferrite
is not completely defined by its chemistry and crystal structure but also requires
knowledge and control of parameters of its microstructure such as density grain size,
porosity and their intra and intergranular distribution. It is well known that almost all
rare earth ferrites decompose at the elevated temperature of we want to melt them
under normal conditions. This happens because the oxygen splits off at higher
temperature reducing Fe3+
and Fe2+
. This necessarily implies that ferrite preparation
by melting as in case of metals is not possible. The normal methods of preparation of
ferrites comprise of the conventional ceramic method or powder metallurgy chemical
co-precipitation method and sol-gel method.
In this work conventional ceramic method has been employed for the
preparation of Mn0.5Zn0.5YxFe2-xO4 ferrites for its relative simplicity and availability.
The excellent powder preparation process and sintering facility available at the Solid
State Physics Laboratory, KUET, Khulna has been utilized for the preparation of
samples.
3.1.1 Compositions of the Studied Ferrites
A series of mixed ferrites of various compositions were prepared by solid state
reaction technique keeping in view of their ionic radial and valences for maintaining
the charge neutrality. In the present research, several compositions of Y substituted
Mn-Zn soft ferrites are synthesized, characterized and investigated. The ferrites under
investigation of composition Mn0.5Zn0.5YxFe2-xO4 where [x = 0.00, 0.02, 0.04, 0.06,
0.08 and 0.10].

26
3.1.2 Sample Preparation Technique
Structural and magnetic properties of rare earth substituted Mn-Zn ferrites
are greatly dependent on fabrication technique. There are various fabrication
processes. Single crystals of Y2O3 based dilute magnetic composition can be grown
using chemical reaction. The most common methods for fabricating Yttrium oxide
based diluted magnetic composition are given below:
The sample fabrication technique:
(i) Solid state reaction technique.
(ii) Bulk ZnO ion implantation.
(iii) Chemical solution method.
The ferrites of different compositions were prepared using ceramic technique
involving solid state reaction from metal oxides MnO, ZnO, Y2O3, Fe2O3, in the form
of grained powder having 99.99%. Different oxides were weighted precisely
according to their molecular weight. The weight percentage of oxide to be mixed for
various samples was calculated by using formula. The appropriate weight percentage
of each oxide to be mixed for different composition by the following formula:
Weight % of oxide = sampleainoxideeachofweightmolecularofSum
sampletheofweightdrequireoxideofweighMolecular
The calculated weight of oxide materials, molecular weight of oxides and
wt.% calculated for each sample prepared are used for experiments.
3.1.3 Material synthesis and sample preparation
Most of the fabrication processes of diluted magnetic composition need many
critical conditions to maintain and the maintenance of critical condition makes the
fabrication process expensive. Among all the processes the solid state reaction process
is relatively less expensive. Maintenance of the critical conditions here is relatively
easier than other processes. Other advantages of this technique are reproducibility,
easy control, and obtaining sufficient products for measurements. With a careful
control of contamination and impurity, it is possible to fabricate a perfect dilute
magnetic composition. The detail of the fabrication technique is described in the
following section.
Polycrystalline Mn0.5Zn0.5Fe2-xYxO4 (X = 0.00, 0.02, 0.04, 0.06, 0.08 and 0.10)
were prepared by standard solid state reaction technique. Appropriate amount of

27
commercially available high purity powders of MnCO3 (99.9%), ZnO
(99.9%), Y2O3 (99.95%) and Fe2O3 (99.9%) were used as the raw materials. The
exact amounts of compounds were calculated for each composition. Using those raw
materials were weighed and mixed thoroughly by hand milling. During hand milling,
few drops of acetone were added to increase the degree of mixing. The mixture was
calcined at 700ºC for 3 hours. The calcined powder again was crashed into fine
powders. From the fine powders, toroid and disk-shaped samples were prepared and
sintered at temperatures (12000C). During sintering the samples were heated /cooled
in different heating and cooling rates. It was expected that sintering temperatures are
produced samples of various surface morphology, electric and magnetic properties.
The steps involving preparation of pellet or disc shaped and toroid shaped samples are
described in following sections.
Figure 3.1: Flow chart of ferrite preparation.
The normal methods of preparation of ferrites comprise of the conventional
ceramic method i.e. solid state reaction method involving hand milling of reactions
following by sintering at elevated temperature range and non-conventional method,
also called wet method chemical co-precipitation method and sol-gel method etc
examples of wet method. The general preparation procedure of ferrites comprises of
Oxide Raw
Materials
Weighing by
different Mole
percentage
Dry mixing by
Agate Mortar
Presintering Briquetting Drying
Wet mixing
by hand
milling
Milling Pressing to
Desired
shape
Sintering Finished
Product
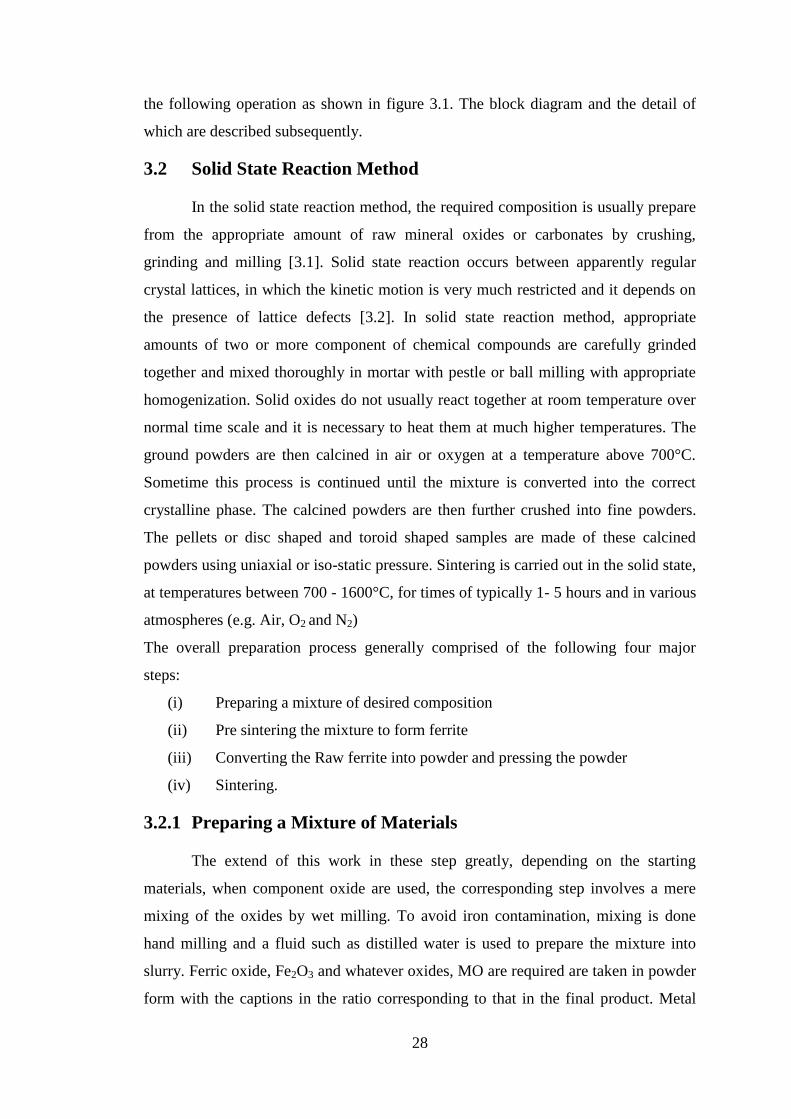
28
the following operation as shown in figure 3.1. The block diagram and the detail of
which are described subsequently.
3.2 Solid State Reaction Method
In the solid state reaction method, the required composition is usually prepare
from the appropriate amount of raw mineral oxides or carbonates by crushing,
grinding and milling [3.1]. Solid state reaction occurs between apparently regular
crystal lattices, in which the kinetic motion is very much restricted and it depends on
the presence of lattice defects [3.2]. In solid state reaction method, appropriate
amounts of two or more component of chemical compounds are carefully grinded
together and mixed thoroughly in mortar with pestle or ball milling with appropriate
homogenization. Solid oxides do not usually react together at room temperature over
normal time scale and it is necessary to heat them at much higher temperatures. The
ground powders are then calcined in air or oxygen at a temperature above 700°C.
Sometime this process is continued until the mixture is converted into the correct
crystalline phase. The calcined powders are then further crushed into fine powders.
The pellets or disc shaped and toroid shaped samples are made of these calcined
powders using uniaxial or iso-static pressure. Sintering is carried out in the solid state,
at temperatures between 700 - 1600°C, for times of typically 1- 5 hours and in various
atmospheres (e.g. Air, O2 and N2)
The overall preparation process generally comprised of the following four major
steps:
(i) Preparing a mixture of desired composition
(ii) Pre sintering the mixture to form ferrite
(iii) Converting the Raw ferrite into powder and pressing the powder
(iv) Sintering.
3.2.1 Preparing a Mixture of Materials
The extend of this work in these step greatly, depending on the starting
materials, when component oxide are used, the corresponding step involves a mere
mixing of the oxides by wet milling. To avoid iron contamination, mixing is done
hand milling and a fluid such as distilled water is used to prepare the mixture into
slurry. Ferric oxide, Fe2O3 and whatever oxides, MO are required are taken in powder
form with the captions in the ratio corresponding to that in the final product. Metal

29
carbonate may also be used; during the later firing, CO2 will be given off and they
will be converted to oxides.
3.2.2 Pre-sintering the Mixture to Form Ferrite
The slurry prepared in step-1 is dried, palletized and then transferred to a
porcelain crucible for pre sintering in a constant temperature of 700°C for 3 hours.
Presintering of the materials was performed in a furnace named KSL-1700X
FURNACE at Solid State Physics Laboratory, KUET, Khulna. The cooling and
heating rates were 4°C/min. The pre-sintering is very crucial because in this step of
sample preparation of ferrite is form its component oxides. The solid-state reactions,
leading to the formation of ferrites, actually achieved by counter diffusion. This
means that the diffusion involves two or more species of ions, which more in opposite
direction initially across the interface of two contacting particles of different
component oxides.
The ferrite is formed essentially in the pre-sintering step but the „raw‟ ferrite
formed has poor quality. In order to produce chemically homogeneous, dense and
magnetically better material of desired shape and size, sintering at an elevated
temperature is needed.
3.2.3 Converting the Raw Ferrite into Powder and Pressing the Powder
Besides reducing the particle size to ≈1micron, grinding also eliminates intra
particle pores and homogenizes the ferrite by mixing. To promote successful sintering
in the next steps, the powder must be well characterized after grinding with respect to
such factors as particles size and distribution, particle shape, homogeneity, absorbed
gases, impurities and intra particle porosity. Iron contamination due to continuous
wear of the mill wall and steel ball need to be closely watched and minimized. Now to
the ground homogeneous powder polyvinyl alcohol is added as a binder.
Pressing the powder into compacts of desired shapes is done either by
conventional method in a die-punch assembly or by hydrostatic or isocratic
compaction. We made use of the former one. Pressing a uniformly dense body by this
method is difficult owing to the friction gradient of the powder at the walls of the die
and between the particles themselves. This problems is somewhat overcome by the
addition of external and internal lubricant to the powder such as stearic acid. Mainly,
we made two types of samples- tablet and toroidal. Specimen was prepared by a

30
hydraulic press with a pressure of 1.5 ton/cm2. The die was designed and made in the
workshop of AECD. This is made of nonmagnetic stainless steel.
Figure 3.2: Hydraulic press used to make different shaped samples
Figure 3.3: Toroid and disk shape sample
These oxide mixtures were milled thoroughly for 4-6 hours to obtain
homogeneous mixture. The mixture was dried and a small amount of saturated
solution of polyvinyl alcohol (PVA) were added as a binder and pressed into pellet
and toroid shape respectively under pressure 1.75 ton-cm2
and 1.2 ton-cm2
using
hydraulic press figure 3.2. The prepared samples shown in figure 3.3 were sintered at

31
1200°C for 2hrs with a microprocessor controlled muffle furnace. The samples were
polished in order to remove any oxide layer formed during the process of sintering.
3.2.4 Sintering
Powder sintering involves raising the temperature of the green compact,
(pressed powder part), to a certain level and keeping it at that temperature for a certain
amount of time. The sintering temperature is usually between 70% and 90% of the
melting point of the powder metal. This will cause bonding mechanisms to occur
between powder particles pressed together in the compact. Bonding within the green
compact is weak and this pressed unsintered part usually has just enough structural
integrity to be handled. Bonding that occurs during sintering greatly strengthens the
part.
Figure 3.4: Bonding Mechanism in Powder Sintering.
Sintering involves heating the powdered metal compacts in vacuum or a
reducing gaseous atmosphere to a temperature that is below the melting point of the
primary constituent of the material. The metallic particles metalurgically bond and
alloying take place via diffusion processes. Changes occur during sintering, including
changes in size, configuration, and the nature of pores (figure 3.4). Commonly used
atmospheres for sintering are hydrogen, carbon monoxide, and ammonia. Sintering
operation ensures that powder particles are bonded strongly and that better alloying is
achieved [3.3].
This is a heat treatment by which a mass of compacted powder is transformed
into a dense object. The thermodynamic driving force is the reduction in the specific

32
surface area of the particles. The sintering mechanism usually involves atomic
transport over particle surfaces, along grain boundaries and through the particle
interiors. Sintering may result in densification, depending on the predominant
diffusion pathway. It is used in the fabrication of metal and ceramic components, the
agglomeration of ore fines for further metallurgical processing and occurs during the
formation of sandstones and glaciers. Sintering must fulfill three requirements
to bond the particles together so as to impart sufficient strength to the
product
to density the grain compacts by eliminating the pores and
To complete the reactions left unfinished in the pre-sintering step.
Figure 3.5: Furnace used in solid state Physics lab of KUET
The principle goal of sintering is the reduction of compact porosity. Sometimes
the initial spaces between compacted grains of ceramics are called “voids”, to
differentiate term from the isolated spaces pores, which occur in the final stages of
sintering. The sintering process is usually accompanied by other changes within the
materials, some desirable and some undesirable. The largest- changes occur in:
Binding the particles together so as to impart sufficient strength to the
products.
Densification the green compacts by eliminating the pores.

33
Making strength of elastic modulus
Making homogeneous distribution of grain number, grain size and shape.
Developing the average pore size and shape.
Sintering can be enhanced by the presence of a liquid phase. The liquid phase
can form directly from the elements when the sintering temperature is between the
melting point of the matrix and the additive, by the melting of eutectic phase
mixtures, which form by diffusion or by incipient melting. The liquid flows between
the particles filling pores and causing densification by capillary action and through the
provision of a fast diffusion pathway.
3.3 X-ray Diffraction (XRD)
The peaks in an X-ray diffraction pattern are directly related to the atomic
distance. Let us consider an incident X-ray beam interacting with the atoms arranged
in a periodic manner as shown in two dimensions in figure 3.6. The atoms,
represented as spheres in the illustration, can be viewed as forming different sets of
planes in the crystal. For a given set of lattice planes with an inter-plane distance of d,
the condition for a diffraction (peak) to occur can be simple written as
nnd sin2 , (3.1)
which is known as Bragg‟s law. In the equation, λ is the wavelength of the X-ray, θ is
the scattering angle, and n is an integer representing the order of the diffraction peak.
The Bragg‟s Law is one of the most important laws used for interpreting X - ray
diffraction data. From the law, we find that the diffraction is only possible when λ <
2d [3.4].
Figure 3.6: Bragg‟s diffraction pattern
In the present work, A PHILIPS PW 3040 X‟pert PRO X-ray diffractometer
was used for the lattice parameter to study the crystalline phases of the prepared
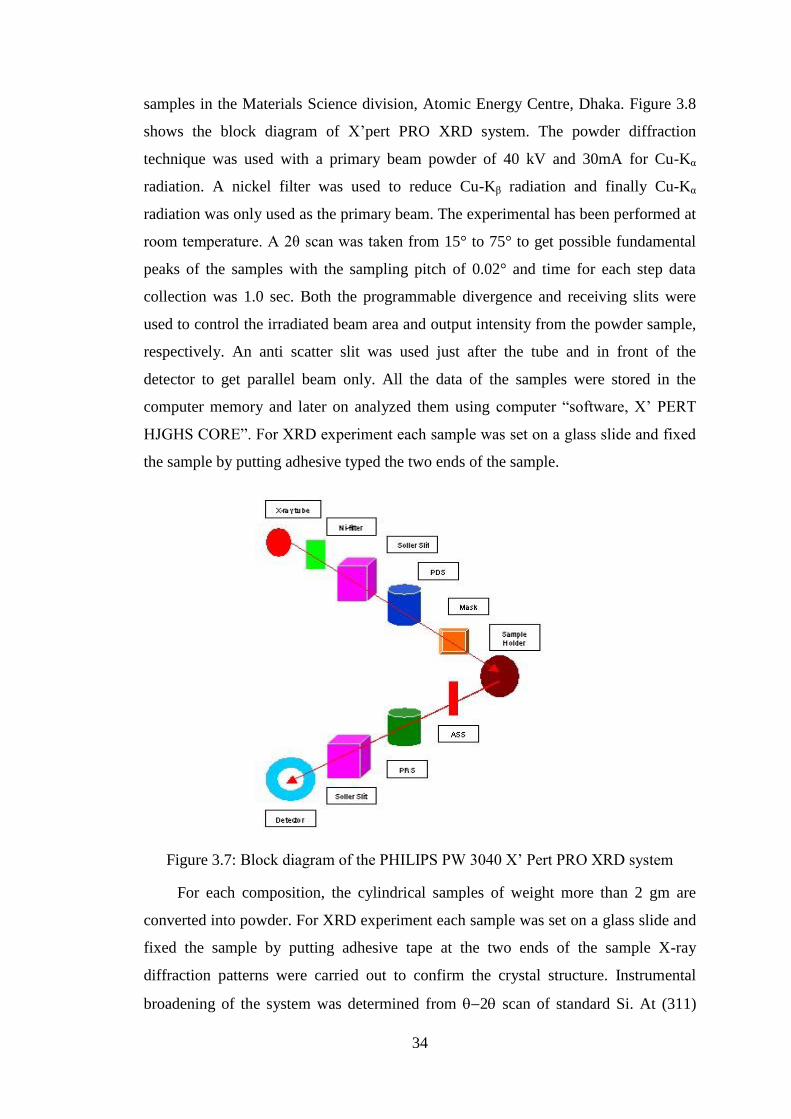
34
samples in the Materials Science division, Atomic Energy Centre, Dhaka. Figure 3.8
shows the block diagram of X‟pert PRO XRD system. The powder diffraction
technique was used with a primary beam powder of 40 kV and 30mA for Cu-Kα
radiation. A nickel filter was used to reduce Cu-Kβ radiation and finally Cu-Kα
radiation was only used as the primary beam. The experimental has been performed at
room temperature. A 2θ scan was taken from 15° to 75° to get possible fundamental
peaks of the samples with the sampling pitch of 0.02° and time for each step data
collection was 1.0 sec. Both the programmable divergence and receiving slits were
used to control the irradiated beam area and output intensity from the powder sample,
respectively. An anti scatter slit was used just after the tube and in front of the
detector to get parallel beam only. All the data of the samples were stored in the
computer memory and later on analyzed them using computer “software, X‟ PERT
HJGHS CORE”. For XRD experiment each sample was set on a glass slide and fixed
the sample by putting adhesive typed the two ends of the sample.
Figure 3.7: Block diagram of the PHILIPS PW 3040 X‟ Pert PRO XRD system
For each composition, the cylindrical samples of weight more than 2 gm are
converted into powder. For XRD experiment each sample was set on a glass slide and
fixed the sample by putting adhesive tape at the two ends of the sample X-ray
diffraction patterns were carried out to confirm the crystal structure. Instrumental
broadening of the system was determined from 2 scan of standard Si. At (311)

35
reflection‟s position of the peak, the value of instrumental broadening was found to be
0.07°. This value of instrumental broadening was subtracted from the pattern. After
that, using the X-ray data, the lattice constant (a) and hence the X-ray densities were
calculated.
3.3.1 Different Parts of the PHILIPS X’ Pert PRO XRD System
Figure 3.9 shows the inside view of the X‟ pert PRO XRD system. A complex of
instruments of X- ray diffraction analysis has been established for both materials
research and specimen characterization.
Figure 3.8: Internal arrangement of a PHILIPS X‟ Pert PRO X-ray diffractometer
These include facilities for studying single crystal defects, and a variety of other
materials problems.
The PHILIPS X‟ Pert PRO XRD system comprised of the following parts;
(i) Cu-Tube with maximum input power of 60 kV and 55 mA,
(ii) Ni- Filter to remove Cu-Kα component,
(iii) Solar slit to pass parallel beam only,
(iv) Programmable Divergent slits (PDS) to reduce divergence of beam and
control irradiated beam area,
(v) Mask to get desired beam area,
(vi) Sample holder for powder sample,
(vii) Anti Scatter slit (ASS) to reduce air scattering back ground,

36
(viii) Programmable Receiving slit (PRS) to control the diffracted beam
intensity and
(ix) Solar slit to stop scattered beam and pass parallel diffracted beam only.
3.3.2 Interpretation of the XRD data
The XRD data consisting of θhkl and dhkl values corresponding to the different
crystallographic planes are used to determine the structural information of the samples
like lattice parameter and constituent phase. Lattice parameters of Co-ferrites samples
were determined. Normally, lattice parameter of an alloy composition is determined
by the Debye-Scherrer method after extrapolation of the curve. We determine the
lattice spacing (interplaner distance), d using these reflections from the equation
which is known as Bragg‟s Law.
2dhkl Sinθ = λ
i.e. dhkl =
sin2 , (3.2)
where λ is the wavelength of the X-ray, θ is the diffraction angle and n is an integer
representing the order of the diffraction.
3.3.3. Lattice Parameter
The lattice parameter for each peak of each sample was calculated by using
the formula:
a = 222 lkhdhkl , (3.3)
where h, k, l are the indices of the crystal planes. We get dhkl values from the
computer using software “X‟ Pert HJGHS CORE”. So we got ten „a‟ values for ten
reflection planes such as a a1 , a2 a3 ….. etc. Determine the exact lattice parameter for
each sample, through the Nelson-Riley extrapolation method. The values of the lattice
parameter obtained from each reflected plane are plotted against Nelson-Riley
function [3.4].The Nelson-Riley function F (θ), can be written as
22 cos
sin
cos
2
1)(F , (3.4)
where θ is the Bragg‟s angle. Now drawing the graph of „a‟ vs. F(θ) and using linear
fitting of those points will give us the lattice parameter „a0‟. This value of „a0‟ at F(θ) = 0
or θ = 90° .These „a0‟s are calculated with an error estimated to be ± 0.0001Ǻ.

37
3.3.4 X-ray Density and Bulk Density
X-ray density, dx was also calculated usual from the lattice constant. The
relation between dx and „a‟ is as follows,
dx =ZM
Na3 (3.5)
where M is the molecular weight of the corresponding composition, N is the
Avogadro‟s number (6.023X10²³
mole-1
), „a‟ is the lattice parameter and Z is the
number of molecules per unit cell, (Z = 8 for the spinel cubic structure). The bulk
density was calculated considering a cylindrical pellet of mass (m) and volume (V) of
the pellets using the relation
dB = V
m
=
hr
m2
, (3.6)
where m is the mass of the pellet sample, r is the radius and h is the thickness of the
pellet.
3.3.5 Porosity
Porosity is a parameter which is inevitable during the process of sintering of
oxide materials. It is noteworthy that the physical and electromagnetic properties are
strongly dependent on the porosity of the studied samples. Therefore an accurate idea
of percentage of pores in a prepared sample is prerequisite for better understanding of
the various properties of the studied samples to correlate the microstructure property
relationship of the samples under study. The porosity of a material depends on the
shape, size of grains and on the degree of their storing and packing. The difference
between the bulk density dB and X-ray density dx gave us the measure of porosity.
Percentage of porosity has been calculated using the following relation [2.19]
00100)1(
x
B
d
dP (3.7)
3.4 Permeability Measurement
3.4.1 Wayne Kerr Precision Impedance Analyzer
The Wayne Kerr Technologies 6500B impedance analyzer greatly supports
accurate impedance measurement and analysis of a wide variety of electronic devices
(components and circuits) as well as electronic and non-electronic material Fig: 3.10.
We made use of the excellent experimental facilities available at the Solid State
Physics Laboratory, KUET, Khulna. Moreover, the 6500B‟s high measurement

38
performance and capable functionally delivers a powerful tool to circuit design and
development as well as materials research and development (both electronic and non
electronic materials) environments:
Accurate measurement over wide impedance range and wide frequency
range.
Powerful impedance analysis functions.
Ease of use and versatile PC connectivity.
The following are application examples:
Impedance measurement of two terminal components such as capacitors,
inductors, ferrite beads, resistors, transformers, crystal / ceramic resonators,
multi-chip modules or array/network components
Semiconductor components:
C – r characteristic analysis of varac for diodes.
Parasitic analysis of a diode, transistor or IC package terminal/leads.
Amplifier input/output impedance measurement
Impedance evaluation of printed circuit boards, relays, switches, cables,
batteries etc.
Dielectric materials: Permittivity and loss tangent evaluation of plastics, ceramics,
printed circuit boards and other dielectric material.
Magnetic materials : Permeability and loss tangent evaluation of ferrite, amorphous
and other magnetic materials.
Semiconductor material: Permittivity, conductivity and C–V characteristics of
semiconductor materials.
3.4.2 Permeability
From the frequency dependence of complex permeability, evolution of
permeability and magnetic loss component at different stages of ferrite sample as
affected by thermal treatment at different temperature was determined using toroids
shape sample prepared with insulating Cu wire. The WK 6500B Impedance analyzer
directly measures the value of inductance as shown in figure 3.10, L and loss factor.
D = tanδ (3.8)
From inductance the value of real part of complex permeability, µ' can be
obtained by using the relation
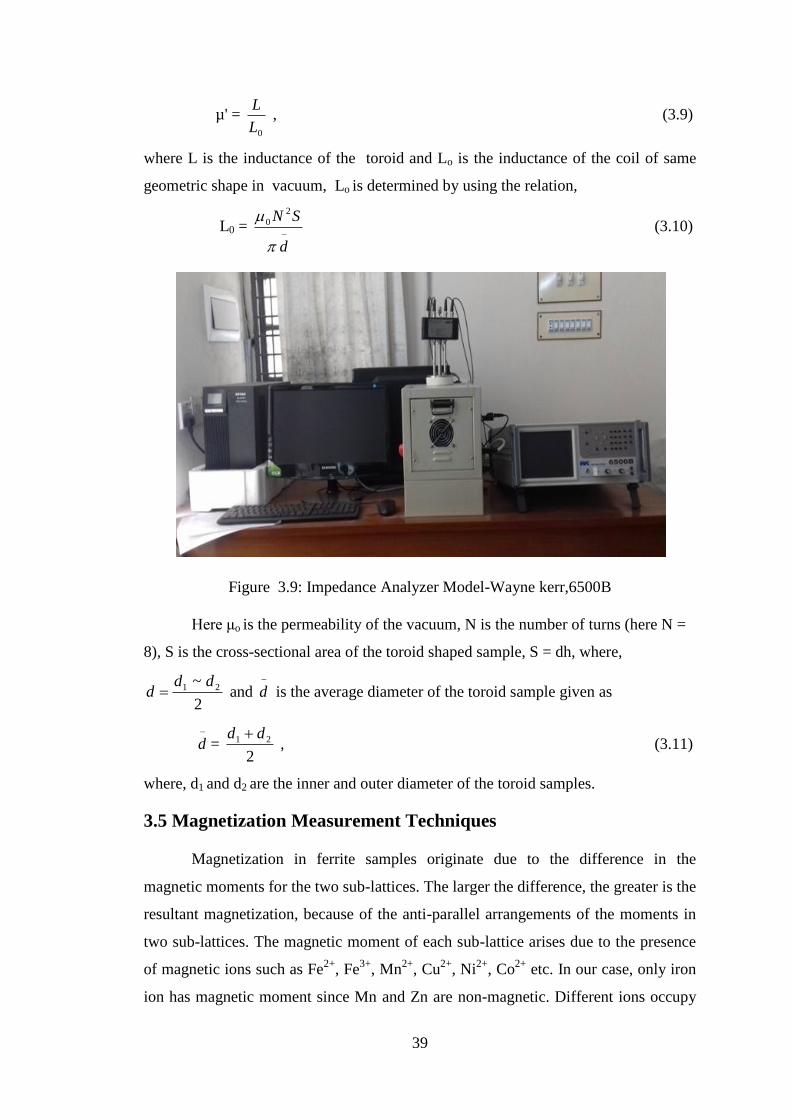
39
µ' = 0L
L , (3.9)
where L is the inductance of the toroid and Lo is the inductance of the coil of same
geometric shape in vacuum, Lo is determined by using the relation,
L0 =
d
SN
2
0 (3.10)
Figure 3.9: Impedance Analyzer Model-Wayne kerr,6500B
Here μo is the permeability of the vacuum, N is the number of turns (here N =
8), S is the cross-sectional area of the toroid shaped sample, S = dh, where,
2
~ 21 ddd and
d is the average diameter of the toroid sample given as
d = 2
21 dd , (3.11)
where, d1 and d2 are the inner and outer diameter of the toroid samples.
3.5 Magnetization Measurement Techniques
Magnetization in ferrite samples originate due to the difference in the
magnetic moments for the two sub-lattices. The larger the difference, the greater is the
resultant magnetization, because of the anti-parallel arrangements of the moments in
two sub-lattices. The magnetic moment of each sub-lattice arises due to the presence
of magnetic ions such as Fe2+
, Fe3+
, Mn2+
, Cu2+
, Ni2+
, Co2+
etc. In our case, only iron
ion has magnetic moment since Mn and Zn are non-magnetic. Different ions occupy

40
different 2 sites. So, as a whole, the two sub-lattices have their individual resultant
magnetic moments. The differences in magnetic moment between the two sub-lattices
give rise to net magnetic moment which in turn yields magnetization. In the present
study magnetization has been performed using a VSM.
3.5.1 Vibrating Sample Magnetometer of Model EV7 System
The principle of VSM is the measurement of the electromotive force induces
by magnetic sample when it is vibrate at a constant frequency in the presence of a
static and uniform magnetic field. A small part of 10-50mg was weighed and made to
avoid movements inside the sample holder
Figure 3.10: Vibrating Sample Magnetometer
The magnetic properties measurement system Model EV7 is a sophisticated
analytical instrument configured specially for the study of the magnetic properties of
small samples over a broad range of temperature from 103K to 800k and magnetic
field from-20KOe to +20KOe. Vibrating Sample Magnetometer is a versatile and
sensitive method of measuring magnetic properties developed by S. Foner [3.5] and is
based on the flux change in a coil when the sample is vibrated near it.
The VSM is designed to continuously measure the magnetic properties of
materials as a function of temperature and field. In this type of magnetometer, the
sample is vibrated up and down in a region surround by several pickup coils. The
magnetic sample is thus acting as a time-changing magnetic flux, varying magnetic
flux is accompanied by an electric field and the field induces a voltage in pickup coils.
This alternating voltage signal is processed by a control unit system, in order to
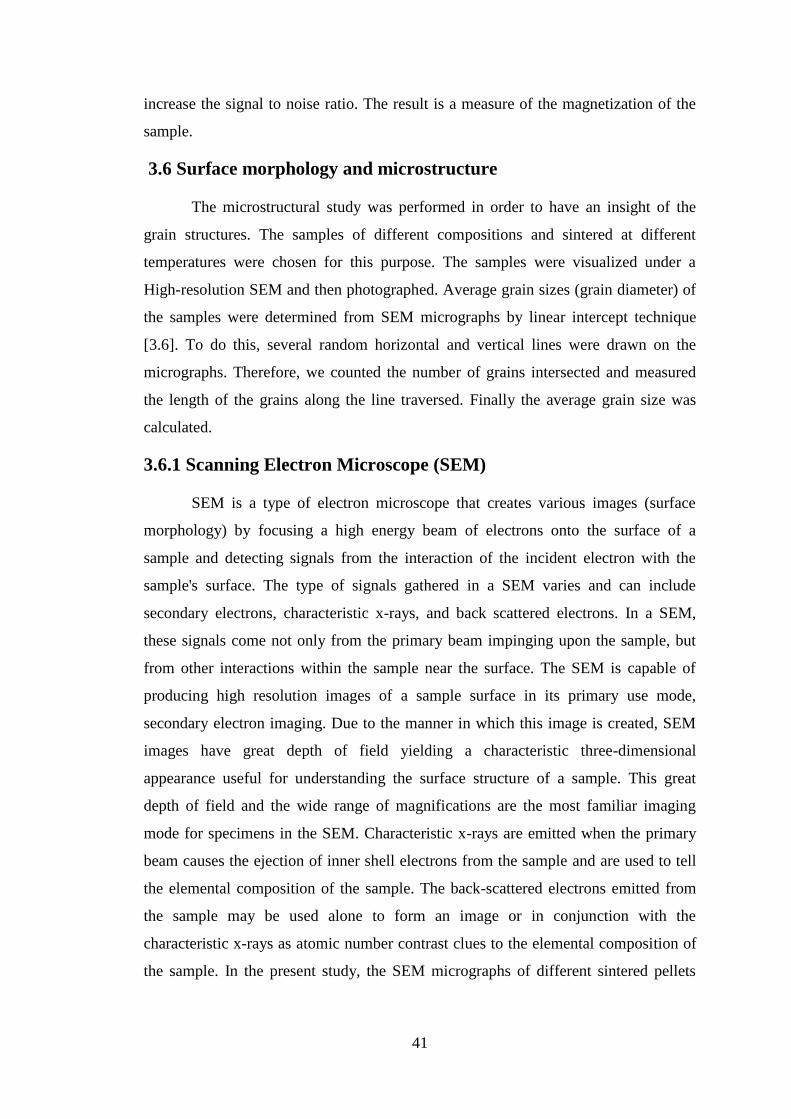
41
increase the signal to noise ratio. The result is a measure of the magnetization of the
sample.
3.6 Surface morphology and microstructure
The microstructural study was performed in order to have an insight of the
grain structures. The samples of different compositions and sintered at different
temperatures were chosen for this purpose. The samples were visualized under a
High-resolution SEM and then photographed. Average grain sizes (grain diameter) of
the samples were determined from SEM micrographs by linear intercept technique
[3.6]. To do this, several random horizontal and vertical lines were drawn on the
micrographs. Therefore, we counted the number of grains intersected and measured
the length of the grains along the line traversed. Finally the average grain size was
calculated.
3.6.1 Scanning Electron Microscope (SEM)
SEM is a type of electron microscope that creates various images (surface
morphology) by focusing a high energy beam of electrons onto the surface of a
sample and detecting signals from the interaction of the incident electron with the
sample's surface. The type of signals gathered in a SEM varies and can include
secondary electrons, characteristic x-rays, and back scattered electrons. In a SEM,
these signals come not only from the primary beam impinging upon the sample, but
from other interactions within the sample near the surface. The SEM is capable of
producing high resolution images of a sample surface in its primary use mode,
secondary electron imaging. Due to the manner in which this image is created, SEM
images have great depth of field yielding a characteristic three-dimensional
appearance useful for understanding the surface structure of a sample. This great
depth of field and the wide range of magnifications are the most familiar imaging
mode for specimens in the SEM. Characteristic x-rays are emitted when the primary
beam causes the ejection of inner shell electrons from the sample and are used to tell
the elemental composition of the sample. The back-scattered electrons emitted from
the sample may be used alone to form an image or in conjunction with the
characteristic x-rays as atomic number contrast clues to the elemental composition of
the sample. In the present study, the SEM micrographs of different sintered pellets
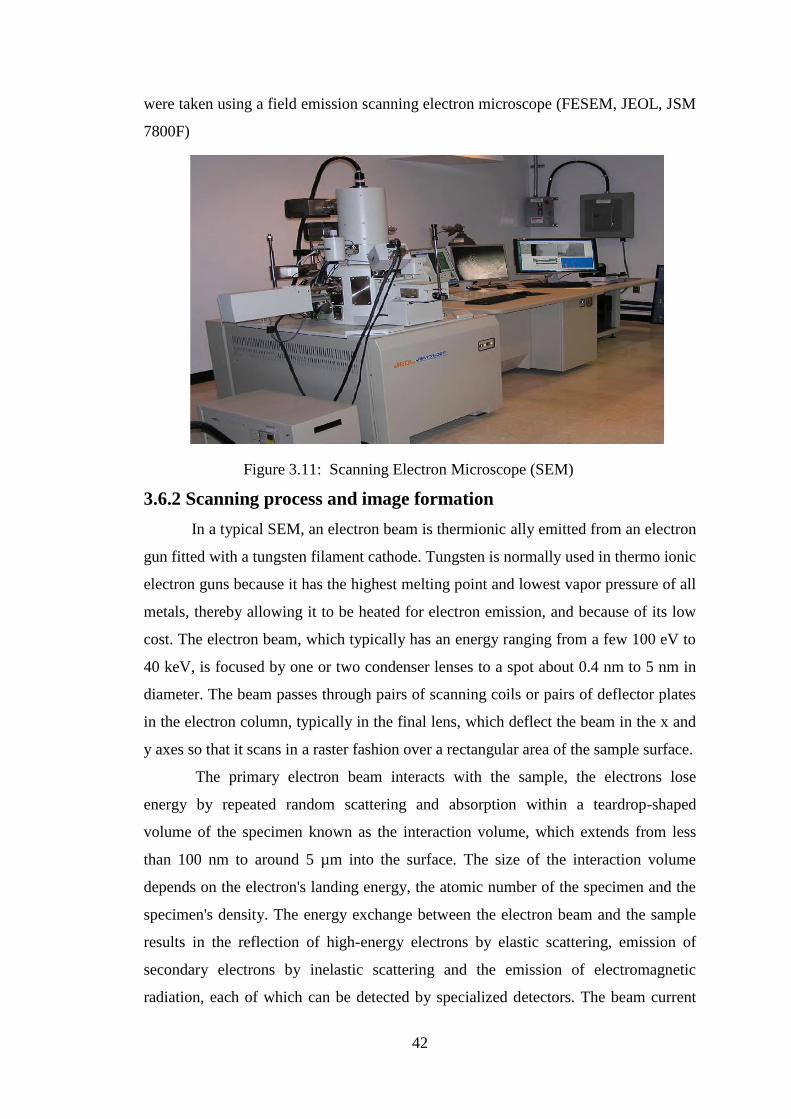
42
were taken using a field emission scanning electron microscope (FESEM, JEOL, JSM
7800F)
Figure 3.11: Scanning Electron Microscope (SEM)
3.6.2 Scanning process and image formation
In a typical SEM, an electron beam is thermionic ally emitted from an electron
gun fitted with a tungsten filament cathode. Tungsten is normally used in thermo ionic
electron guns because it has the highest melting point and lowest vapor pressure of all
metals, thereby allowing it to be heated for electron emission, and because of its low
cost. The electron beam, which typically has an energy ranging from a few 100 eV to
40 keV, is focused by one or two condenser lenses to a spot about 0.4 nm to 5 nm in
diameter. The beam passes through pairs of scanning coils or pairs of deflector plates
in the electron column, typically in the final lens, which deflect the beam in the x and
y axes so that it scans in a raster fashion over a rectangular area of the sample surface.
The primary electron beam interacts with the sample, the electrons lose
energy by repeated random scattering and absorption within a teardrop-shaped
volume of the specimen known as the interaction volume, which extends from less
than 100 nm to around 5 µm into the surface. The size of the interaction volume
depends on the electron's landing energy, the atomic number of the specimen and the
specimen's density. The energy exchange between the electron beam and the sample
results in the reflection of high-energy electrons by elastic scattering, emission of
secondary electrons by inelastic scattering and the emission of electromagnetic
radiation, each of which can be detected by specialized detectors. The beam current

43
absorbed by the specimen can also be detected and used to create images of the
distribution of specimen current. Electronic amplifiers of various types are used to
amplify the signals which are displayed as variations in brightness on a cathode ray
tube. The raster scanning of the CRT display is synchronized with that of the beam on
the specimen in the microscope, and the resulting image is therefore a distribution
map of the intensity of the signal being emitted from the scanned area of the
specimen. The image may be captured by photography from a high resolution cathode
ray tube, but in modern machines is digitally captured and displayed on a computer
monitor.
3.7 Dielectric Properties
Ceramics are mostly covalently bonded material hence electrically non
conductive or insulator. Importance of particular property depends on the application
demand. For instance, dielectric strength is an important parameter for application of
ceramic as insulators used in power transmission line, load bearing general insulators,
in house hold appliances etc. In this kind of applications where frequency do not
exceed 1kHz, the break down strength, measured in kV/cm, together with mechanical
strength are important factors. The dielectric constant (ε/) or loss factor (ε
//) does not
matter much. On the other hand, for capacitors and electronics application just the
opposite required. The values of ε/ and ε
// are of prime importance, not only their
room temperature values but also as function of frequency. These are intrinsic
properties of material; especially of polycrystalline ceramic can be modified by
doping, micro structural variation.
3.7.1 Dielectric Constant
Dielectric constant measurements were done by using Wayne Kerr Impedance
Analyzer 6500B. The overall dielectric constant (ε/) of an insulator material as given
by the relation:
EED 00 (3.12)
D represents the electric displacement, E the electric field in the dielectric, ε/ the
dielectric constant and ε0 permittivity of the vacuum. The electric displacement
describes the extent to which the electric field has been altered by the presence of the
dielectric material. The dielectric constant ε/ is an intrinsic property of a material and

44
a measure of the ability of the material to store electric charge relative to vacuum. It is
measured directly from the capacitance of a capacitor in which the material is used as
electrode separator or dielectric. The capacitive cell, the dielectric constant (ε/), total
charge (q) and capacitance © can be developed as follows:
d
V
A
Q
E
D
00
(3.13)
CVd
AVQ
0 (3.14)
Where d
AC
0
(3.15)
Here A represents the area of the capacitive cell, d its thickness, C is the
capacitance of the material, V the voltage across the cell and
m
F0 the material
permittivity in vacuum. Thus ε/ represents the ratio of the permittivity or charge
storage capacity relative to air or vacuum as dielectric.
A
cd
o ' , (3.16)
where c is the capacitance of the pellet in Farad, d the thickens of the pellet in meter ,
A the cross-sectional area of the flat surface of the pellet in m2
and εo the constant of
permittivity for free space. Dielectric measurement as a function of frequency in the
range 100Hz-13MHz at room temperature were carried out by using Wayne Kerr
Impedance Analyzer 6500B in conjunction with a laboratory made furnace which
maintain the desired temperature with the help of a temperature controller.

45
RESULTS AND DISCUSSION
4.0 Introduction
The polycrystalline spinel ferrites present an important set of properties such
as high permeability in the radio frequency level, high electrical resistivity, low
dielectric losses, low eddy current losses, low cost and environmental stability [4.1 –
4.3]. Ferrites are used today in radio and television, microwaves and satellite
communications, audio, video and digital recording and as permanent magnets. The
best quality video heads require ferrite cores which can show high permeability in its
operating frequency band. Mn-Zn ferrites can be used as video heads. Thus, we
believe that researches on ferrites are very important for Bangladesh perspective.
Dilute Mn0.5Zn0.5Fe2O4 with non magnetic Zn and Mn content higher than percolation
limit where frustration and competing interaction start to play dominant role has
higher to not been studied in much detail. Some anomaly must be found for
Mn0.5Zn0.5Fe2O4 ferrite because the ionic radii of substituted Zn2+
ion lower than Mn
2+
ion. Now–a-days the rare earth oxides are becoming promising additives to change
the magnetic properties of ferrites. The properties can be changed by substitutions
various kinds of divalent cations or relatively small amount of rare earth ions [4.4].
The properties are very sensitive to preparation environment such as sintering
temperature, time and type of additives [4.5]. The spinel ferrites having general
formula Mn0.5Zn0.5YxFe2-xO4 where x = 0.00, 0.02, 0.04, 0.06, 0.08, 0.10 have been
prepared by the standard solid state reaction method sintered at 1200 ºC for 2 hours.
The effects rare earth ion Y3+
substitution on Mn-Zn ferrites are significant change in
the structural, microstructure, permeability, magnetic loss, saturation magnetization,
electrical resistivity and dielectric constant.
4.1 X-Ray Diffraction Analysis
X-ray neutron and electron diffraction are useful techniques to evaluate the
various phases of the synthesized ferrites as well as their unit cell parameters. In the
present study X-ray diffraction technique has been utilized to discern these parameters
X-ray diffraction (XRD) studies of the samples were performed by using Philips
PERT PRO X-ray Diffraction using Cu-Kα radiation in the range of 2θ = 150 to 65
0 in
steps of 0.020. The Fe replaced Y substitution in base ferrite Mn0.5Zn0.5YxFe2-xO4 has

46
a significant influence on the structural and physical properties such as lattice
constant, X-ray density, bulk density, porosity etc. The porosity was calculated from
the X-ray density and bulk density. The possible experimental and theoretical reasons
responsible for the change in substitution of the above mentioned properties have
been discussed below.
4.1.1 Phase Analysis
XRD patterns of the sample Mn0.5Zn0.5YxFe2-xO4 ferrites where x = 0.00, 0.02,
0.04, 0.06, 0.08, 0.10 sintered at 1200oC for 2 hours shown figure 4.1. The XRD
patterns for all the samples were indexed for fcc spinel structure and Bragg diffraction
planes are shown in the patterns. The structural model has been taken as the spinel
phase. All the samples show good crystallization with well defined diffraction lines. It
is obvious that the characteristic peaks for spinel ferrites i. e. (111), (220),
(311),(222),(400),(422), (511) and (440), which represent either all odd or even
indicating that the samples are spinel cubic phase. The single phase has been obtained
Mn0.5Zn0.5Fe2O4 without any extra peak where as Y3+
doped samples how additional
peaks other than spinel structure probably corresponding to second phase of YFeO3
(Ortho ferrite) shown in figure 4.1.
However, a very weak reflection peak at 2θ = 36.02o is about to emerge for x
= 0.02 – 0.10 is more prominent indicated by the arrow. This peak is identified as the
weak reflection peak of the YFeO3 phase. To identify the possible formation of a
second phase YFeO3 in the substituted ferrites, the slow step scan XRD analysis was
conducted on the samples after different steps of processing. YFeO3 phase was in all
Y substituted ferrites in the replace of Fe. The amount of YFeO3 that is peak intensity
increased with increasing Y concentrations indicated by arrow. This apparently
indicated that Y did not form a solid solution with spinel ferrites or it had very solid
solubility.
Determination of exact phase could not be possible, since the number of extra
peaks other than Spinel is not sufficient for accurate analysis. XRD analysis
evidenced that the compounds containing Y3+
ions are pluri-phasic. Rare earth is
formed orthoferrite (YFeO3) phase and the formation of these secondary phases in
ferrite during sintering process was governed by the type and the amount of Y3+
ions
used. The lattice parameter ‘a’ corresponding to each plane was calculated by using

47
the X-ray data. The average values of ‘a’ were found by plotting a against Nelson-
Riley function.
15 20 25 30 35 40 45 50 55 60 65 70
Inte
nsity (
a.u
)
(degree)
(111) (220)
(311)
(222) (400) (422)(511) (440)
X=0.00
X=0.02
X=0.04
X=0.06
X=0.08
X=0.10
Ortho ferrrite phase
Figure 4.1: X-ray diffraction patterns of Mn0.5Zn0.5YxFe2-xO4 [x = 0.00, 0.02,
0.04, 0.06, 0.08 and 0.10] ferrites sintered at 12000C for 2hrs.
4.1.2 Lattice Parameters
The values of lattice parameters have been determined from each plane of XRD
pattern using Nelson Relay function (4.6)
22
2
1 Cos
Sin
CosF where θ is the
Bragg’s angle, by extrapolating lattice parameter’s values of F (θ) = 0 or θ = 900. The
lattice parameters are plotted against the Nelson Relay function, F (θ) shown in figure
4.2 (a – f) for Y content.

48
0.5 1.0 1.5 2.0 2.5 3.0 3.5
8.41
8.42
8.43
8.44
8.45
8.46
8.47
B
Linear Fit of B
Lattic
e P
ara
mete
r,a(A
)
N-R function,f()
Mn0.5
Zn0.5
Y0.00
Fe2O
4
(a)
X=0.00
0.5 1.0 1.5 2.0 2.5 3.0 3.5
8.43
8.44
8.45
8.46
8.47
8.48
B
Linear Fit of B
Lattic
e P
ara
mete
r,a(A
)
N-R function,f()
Mn0.5
Zn0.5
Y0.02
Fe1.98
O4
(b)
X=0.02
0.5 1.0 1.5 2.0 2.5 3.0 3.5
8.42
8.43
8.44
8.45
8.46
8.47
8.48 B
Linear Fit of B
Lattic
e P
ara
mete
r,a(A
)
N-R function,f()
Mn0.5
Zn0.5
Y0.04
Fe1.96
O4
(c)
X=0.04
0.5 1.0 1.5 2.0 2.5 3.0 3.5
8.39
8.40
8.41
8.42
8.43
8.44
8.45
8.46
8.47 B
Linear Fit of B
Lattic
e P
ara
mete
r,a(A
)
N-R function,f()
Mn0.5
Zn0.5
Y0.06
Fe1.94
O4
(d)
X=0.06
0.5 1.0 1.5 2.0 2.5 3.0 3.5
8.40
8.41
8.42
8.43
8.44
8.45
8.46 B
Linear Fit of B
Lattic
e P
ara
mete
r, a
()
N-R Function, F()
Mn0.5
Zn0.5
Y0.08
Fe1.92
O4
(e)
X=0.08
0.5 1.0 1.5 2.0 2.5 3.0 3.5
8.410
8.415
8.420
8.425
8.430
8.435
8.440
8.445
8.450
B
Linear Fit of B
Lattic
e P
ara
mete
r,a(A
)
N-R function,f()
Mn0.5
Zn0.5
Y0.10
Fe1.90
O4
(f)
X=0.10
Figure 4.2 (a-f): Variation of lattice parameter ‘a’ with N - R function and determination
of exact lattice parameter ‘a0’ of Mn0.5Zn0.5YxFe2-xO4 [x = 0.00, 0.02, 0.04,
0.06, 0.08 and 0.10]

49
The lattice parameter (a0) increases at x = 0.02 and 0.04 due the replacement
of Fe3+
ions (radius = 0.64Ao) by the larger Y
3+ ions (radius = 1.12A
o) in the
octahedral sites shown in table 4.1. No significant decrease in ‘a0’ is observed in the
present experiment. There is a slight decrease Y3+
(radius = 0.90Å) in the octahedral
sites, indeed, lattice parameter was in the same range of different. However, no
significant decrease in ‘a0’ is observed in the present experiment for x = 0.06, 0.08
and 0.10. The decrease in ‘a0’ between x = 0.06, 0.08 and 0.10 is probably due to
distortion in the spinel lattice because of the relatively large radius of Y3+
shown in
table 4.1. This is evidenced by the appearance of the minor YFeO3 phase at x = 0.06,
0.08 and 0.10.
Figure 4.3: Exact lattice parameter ‘a0’ of Mn0.5Zn0.5YxFe2-xO4 [x = 0.00,0.02, 0.04, 0.06,
0.08 and 0.10] with Yttrium contents
4.1.3 Density and Porosity
The bulk density was measured by usual mass and dimensional consideration
whereas X-ray density was calculated from the molecular weight and the volume of
the unit cell for each sample by using the equation(3.5) and (3.6).The calculated
values of the bulk density and theoretical (or X-ray) density of the present ferrite
system are listed in table 4.1. It is observed that bulk density is lower than the X-ray
density shown in figure 4.4. This may be due to the existence of pores which were
formed and developed during the sample preparation or sintering process.
The bulk density slightly decreases with increasing Y3+
ions and the X-ray
density increases continuously with increasing Y content. There are two possible
existence states of rare earth ions Y3+
in the Mn-Zn ferrites: Some of Y3+
entered the
lattice and substituted the Fe3+
; other Y3+
diffused to the grain boundary during the
sintering process. Y3+
ions entering the lattice can result in the increasing of the lattice

50
parameter because Y3+
ions’ larger radius than Fe3+
; But Y3+
congregating at grain
boundary will reduce lattice parameter due to the vacancies left in the Mn-Zn lattice;
As a combination of the two effect described above, a very small overall lattice
parameter change can be observed.
Table 4.1: Data of the lattice parameter (a˳), X-ray density (ρx), bulk density
(ρB), porosity ( P ) of Mn0.5Zn0.5YxFe2-xO4 [x = 0.00, 0.02, 0.04,
0.06, 0.08 and 0.10] ferrites sintered at 12000C for 2hrs.
X ao (A) ρx (gm/cm3) ρB (gm/cm
3) Porosity P (%)
0.00 8.4446 5.6767 4.2786 24.63
0.02 8.4611 5.6711 4.2578 24.93
0.04 8.4603 5.6849 4.2400 25.42
0.06 8.4416 5.7374 4.2057 26.67
0.08 8.4375 5.7604 4.1786 27.46
0.10 8.4311 5.7882 4.1631 28.08
As for the crystallite size reducing, two kinds of Y3+
existence states both can
constrain the growth of the grain. The Y3+
substitution in the lattice will induce lattice
distortion, internal stress caused by this distortion hinders the growth of grains. If Y3+
diffused to the grain boundaries, that will also restrain the grain growth by lower
down the grain mobility. That explains why the crystallite size of the substituted Mn-
Zn ferrite is much smaller than un-doped ferrites [4.7- 4.8]. The enhancement of Bulk
density is due to activated diffusion process triggered by the excess vacancies created
by Fe3+
deficiency. Table 4.1 shows the results of lattice parameter, theoretical
density, and bulk density shows the results of lattice parameter, theoretical density,
and bulk density calculated porosity. It is observed all the samples that porosity
increases monotonically with increasing Y3+
shown in figure 4.5. Specimens
contained some closed porosity. It was difficult to remove these closed porosities
completely due to the evaporation of constituents Y replace Fe.

51
0.00 0.02 0.04 0.06 0.08 0.104.0
4.5
5.0
5.5
6.0
De
nsi
ty,g
m/c
m3
Content, x
Bulk density
X-ray density
Figure 4.4: Variation of Bulk density and X-ray density as a function of Y content.
0.00 0.02 0.04 0.06 0.08 0.10
24.5
25.0
25.5
26.0
26.5
27.0
27.5
28.0
28.5
Content x
Poro
sity
4.16
4.18
4.20
4.22
4.24
4.26
4.28
Blu
k de
nsi
ty
Figure 4.5: Variation of Bulk density and Porosity as a function of Y content
It is known that the porosity of the samples come from two sources,
intragranular porosity and intergranular porosity. The intergranular porosity mainly
depends on the grain size [4.9]. At higher sintering temperatures the density is
decreased because the intergranular porosity is increased resulting from discontinuous
grain growth. The porosity which is intrinsic for any oxide material plays an
important role in the deciding the magnetic and electrical properties.

52
4.2 Microstructures
Figure 4.6(a-f): Variation of SEM photographs with Y content (x) of Mn0.5Zn0.5YxFe2-
xO4 ferrites whose [x = 0.00, 0.02, 0.04, 0.06, 0.08 and 0.10 ] sintered
at 12000C for 2 hrs
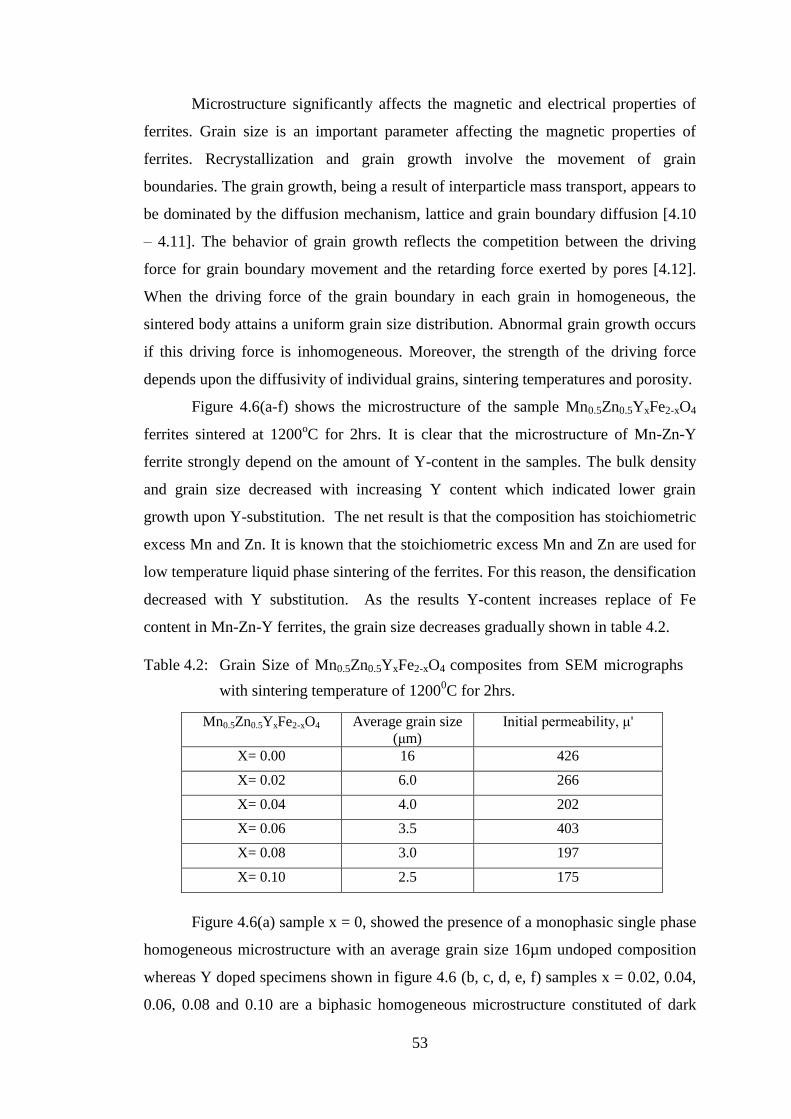
53
Microstructure significantly affects the magnetic and electrical properties of
ferrites. Grain size is an important parameter affecting the magnetic properties of
ferrites. Recrystallization and grain growth involve the movement of grain
boundaries. The grain growth, being a result of interparticle mass transport, appears to
be dominated by the diffusion mechanism, lattice and grain boundary diffusion [4.10
– 4.11]. The behavior of grain growth reflects the competition between the driving
force for grain boundary movement and the retarding force exerted by pores [4.12].
When the driving force of the grain boundary in each grain in homogeneous, the
sintered body attains a uniform grain size distribution. Abnormal grain growth occurs
if this driving force is inhomogeneous. Moreover, the strength of the driving force
depends upon the diffusivity of individual grains, sintering temperatures and porosity.
Figure 4.6(a-f) shows the microstructure of the sample Mn0.5Zn0.5YxFe2-xO4
ferrites sintered at 1200oC for 2hrs. It is clear that the microstructure of Mn-Zn-Y
ferrite strongly depend on the amount of Y-content in the samples. The bulk density
and grain size decreased with increasing Y content which indicated lower grain
growth upon Y-substitution. The net result is that the composition has stoichiometric
excess Mn and Zn. It is known that the stoichiometric excess Mn and Zn are used for
low temperature liquid phase sintering of the ferrites. For this reason, the densification
decreased with Y substitution. As the results Y-content increases replace of Fe
content in Mn-Zn-Y ferrites, the grain size decreases gradually shown in table 4.2.
Table 4.2: Grain Size of Mn0.5Zn0.5YxFe2-xO4 composites from SEM micrographs
with sintering temperature of 12000C for 2hrs.
Mn0.5Zn0.5YxFe2-xO4 Average grain size
(μm)
Initial permeability, μ'
X= 0.00 16 426
X= 0.02 6.0 266
X= 0.04 4.0 202
X= 0.06 3.5 403
X= 0.08 3.0 197
X= 0.10 2.5 175
Figure 4.6(a) sample x = 0, showed the presence of a monophasic single phase
homogeneous microstructure with an average grain size 16µm undoped composition
whereas Y doped specimens shown in figure 4.6 (b, c, d, e, f) samples x = 0.02, 0.04,
0.06, 0.08 and 0.10 are a biphasic homogeneous microstructure constituted of dark

54
ferrite matrix grain and small whitish grain at the grain junction/boundary and with
grain size decreases monotonically with increases Y content. The Y substituted
materials where x = 0.02 to 0.10 show biphasic microstructure consisting of a bigger
matrix of ferrite grains and a smaller YFeO3 secondary phase at the grain junctions.
The grain size of matrix phase was maximum at x = 0.10 composition for Y content.
Relatively lower grain size of ferrite matrix at x =0.10 composition shows in figure
4.6(f) might be due to the grain growth inhibition caused by YFeO3 are clear visible.
4.3 Magnetic Properties
4.3.1 Frequency Dependence of Initial Permeability
The complex permeability is given by i , is the real
permeability (in phase) and the imaginary permeability (900 out of phase).
Complex permeability has been determined as a function of frequency, f up to
120MHz at room temperature for all the samples of series Mn0.5Zn0.5YxFe2-xO4 ferrites
by using the conventional technique based on the determination of the complex
impedance of circuit loaded with toroid shaped sample. Figure 4.7 represents the
results of the real part of the permeability and figure 4.8 imaginary part, as a
function of frequency for the whole series of ferrite samples at 12000C for 2hrs.
It is clearly evident from these figures 4.7 that the initial permeability as a
function of frequency in the range of 1kHz to 120MHz decreases with Y content, x
i.e. the permeability decreases monotonically up to x = 0.10. It is seen that the
initial permeability significantly increases at x = 0.06 of Y substitution other doped
samples but this lower than x = 0. Decreased in permeability of Mn-Zn ferrites with
Y substitution for Fe, where secondary phase FeYO3 is also identified XRD analysis.
Y3+
has no unpaired electrons and it behaves as diamagnetic. The substitution of
ferromagnetic Fe3+
(5µB) by diamagnetic Y3+
for x = 0.06 in the spinel is not useful
for increasing permeability. It had been suggested that the substitution of Y3+
ion
moved Mn2+
and Zn2+
ion from ‘B’ to ‘A’ sublattice dilution and increased the
magnetic permeability in Mn-Zn ferrites. The decrease in initial permeability at x =
0.02 - 0.10 is probably due to minor precipitation of secondary phase FeYO3. That is,
total initial permeability in this case is the sum of the contributions from the spinel
and FeYO3 phase. However, the permeability decreased with Y substitution due to
presence of higher amount FeYO3 phase.

55
Figure 4.7: Variation of initial permeability with frequency of Mn0.5Zn0.5YxFe2-xO4 [x =
0.00, 0.02, 0.04, 0.06, 0.08 and 0.10] ferrites sintered at 12000C for 2hrs.
From figure 4.7 it is noticed that the real component of permeability, is
fairly constant with frequency up to certain frequency range and then falls rather
rapidly to very low value at higher frequency for compositions with x = 0.0, 0.02 &
0.06. The permeability of composition with x = 0.0, 0.02 & 0.06 were stable up to 7 –
9 MHz and then falls rather rapidly to very low value at high frequency. As a result
decreases figure 4.7 shows the permeability of the compositions with x = 0.04,
0.08 & 0.10 are stable within the range 80 - 90MHz, the maximum frequency stable
limit of the instrumentations.
The constant value of permeability over a wide frequency range, which is
named the zone of utility of ferrites, is desirable over various applications such a
broad band transformer and wide band read-writes head for video recording [4.13].
The range of operating frequency in the x = 0.04, 0.08 & 0.10 samples are wider than
that in the others which shows the compositional stability and quality of the rare earth
Y doped ferrites samples.

56
Table 4.3: Initial Permeability of Mn0.5Zn0.5YxFe2-xO4 composites at different
frequency range sintering at the temperature 12000C for 2hrs.
Mn0.5Zn0.5YxFe2-
xO4
μ' at 100
Hz
μ' at
10
KHz
μ' at
100KHz
μ' at 1
MHz
μ' at 10
MHz
μ' at 100
MHz
X= 0.00 192 199 199 196 189 181
X= 0.02 253 257 253 249 237 212
X= 0.04 260 263 259 255 245 214
X= 0.06 318 310 301 275 88 18
X= 0.08 447 440 436 404 199 ------
X= 0.10 469 461 457 422 202 ------
Figure 4.8: Complex imaginary permeability μ'' with frequency of Mn0.5Zn0.5Yx Fe2O4 [x =
0.00, 0.02, 0.04, 0.06, 0.08 and 0.10] ferrites.
The decrease of permeability with increasing Y may be explained on the basis
of intragranular pores entrapped within the grain decreases which create constraint on
the domain wall mobility. From the figure 4.8, the imaginary permeability, μ// initially
high at low frequency zone all the samples and then decreases with increasing
frequency and almost μ// constant high frequency range.
The grain growth decreases with increasing Y content diminishes the grain
boundary, thereby the domain walls can move easily, which leads to higher
permeability. Also during grain growth pores become fewer, which act as
independents to domain wall motion due to pinning wall. At high frequencies where
at the constant μ// parameters become more significant, the inductors show high
impedance and become resistive and dissipate interfacing signals rather than
reflecting these source [4.14]. The operational frequency in the x = 0.04, 0.08 & 0.10

57
samples is wider than the others sample sintered at 1200oC for 2hrs, because of small
grain size and more grain boundaries the permeability is lower that of the others case.
4.3.2 Frequency Dependence of Loss Tangent
Energy loss is an extremely important subject in soft ferrimagnetic
materials, since the amount of energy wasted on process other than magnetization
can prevent the AC applications of a given material. The ratio of μʹʹand μʹ is equal
tanδ representing the losses in the material are a measure of the inefficiency of the
magnetic system. The variation of loss factor, tanδ (= μʹʹ/ μʹ) with frequency for all
samples has been studied. Figure 4.9 shows the variation of loss factor (tanδ) with
frequency for various Mn0.5Zn0.5YxFe2-xO4 samples sintered at 1200°C holding time 2
hours. The magnetic losses, which cause the phase shift, can be split up into three
components: hysteresis losses, eddy current losses and residual losses. This gives the
formula tanδm = tanδh + tanδe + tanδr. As μʹi is the initial permeability which is
measured in presence of low applied magnetic field, therefore, hysteresis losses
vanish at very low field strengths.
Thus at low field the remaining magnetic losses are due to eddy
current losses and residual losses. Residual losses are independent of frequency.
Eddy current losses increase with frequency and are negligible at very low
frequency. Eddy current loss can be expressed energy loss per unit volume and is the
resistivity [4.15 – 4.16 & 2.8].To Keep the eddy current losses constant as frequency
is increased; the resistivity of the material chosen must increase as the square of
frequency. Eddy currents are not problem in the Mn-Zn ferrites until higher
frequencies are encountered because they have very high resistivity about 105Ω-cm to
108Ω-cm [4.17]. The ferrite microstructure is assumed to consist of grains of low
resistivity separated by grain boundaries of high resistivity. Thicker grain boundaries
are preferred to increase the resistance
It is seen from the inset of figure 4.9 that the tanδ decreases with increasing
frequency up to 108Hz and beyond the frequency 10
8Hz, tanδ increases with the
frequency. It is also observed that tanδ value for the Y substituted samples is
comparably less than the un-substituted samples at frequency greater than 108Hz. It is
clear from the figure 4.9 that the value of tanδ is less frequency dependent in the
frequency range from 100Hz to 108Hz. Therefore, it is concluded that the synthesized
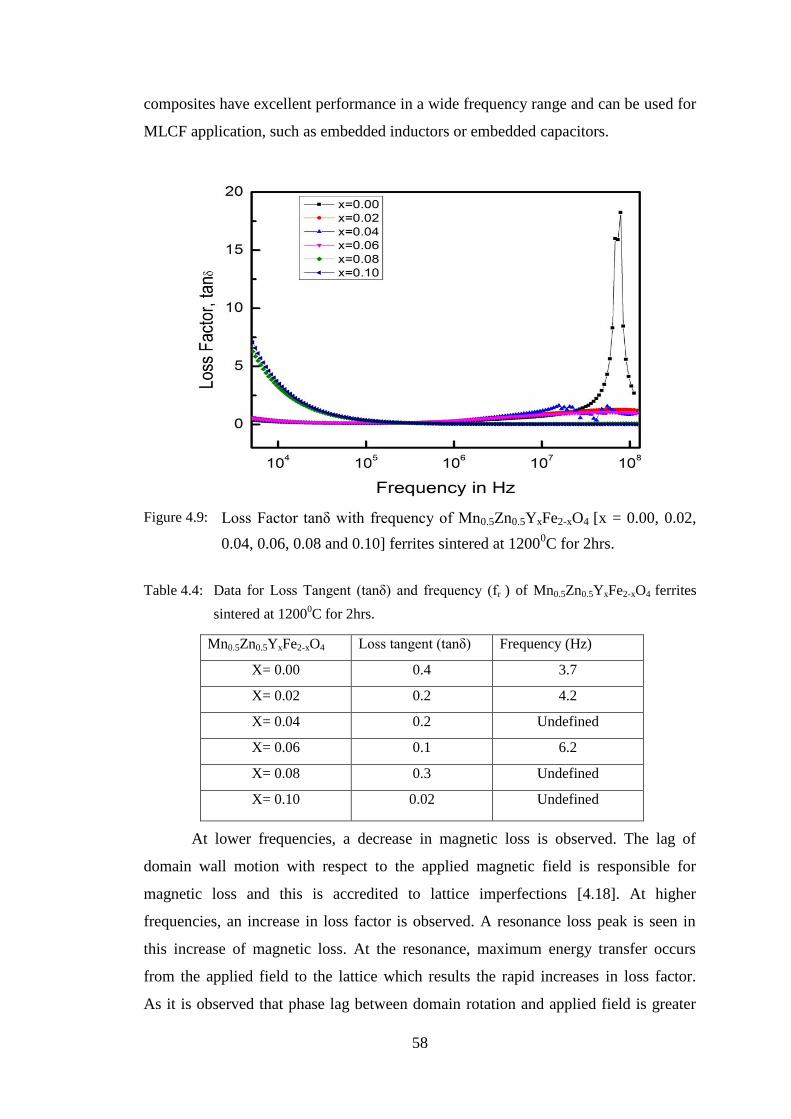
58
composites have excellent performance in a wide frequency range and can be used for
MLCF application, such as embedded inductors or embedded capacitors.
Figure 4.9: Loss Factor tanδ with frequency of Mn0.5Zn0.5YxFe2-xO4 [x = 0.00, 0.02,
0.04, 0.06, 0.08 and 0.10] ferrites sintered at 12000C for 2hrs.
Table 4.4: Data for Loss Tangent (tanδ) and frequency (fr ) of Mn0.5Zn0.5YxFe2-xO4 ferrites
sintered at 12000C for 2hrs.
Mn0.5Zn0.5YxFe2-xO4 Loss tangent (tanδ) Frequency (Hz)
X= 0.00 0.4 3.7
X= 0.02 0.2 4.2
X= 0.04 0.2 Undefined
X= 0.06 0.1 6.2
X= 0.08 0.3 Undefined
X= 0.10 0.02 Undefined
At lower frequencies, a decrease in magnetic loss is observed. The lag of
domain wall motion with respect to the applied magnetic field is responsible for
magnetic loss and this is accredited to lattice imperfections [4.18]. At higher
frequencies, an increase in loss factor is observed. A resonance loss peak is seen in
this increase of magnetic loss. At the resonance, maximum energy transfer occurs
from the applied field to the lattice which results the rapid increases in loss factor.
As it is observed that phase lag between domain rotation and applied field is greater

59
than that between applied field and domain wall displacement, the magnetic losses
due to domain rotation overrides those due to domain wall displacement [4.19].
4.3.3 Frequency Dependence of Relative quality factor
The frequency dependence of Mn0.5Zn0.5YxFe2-xO4 ferrites sintered at 1200oC
for 2hrs have been calculated (RQF = μ''/ tanwere calculated by the ratio real part
of initial permeability and magnetic loss tangent measured on the coil wound toroidal
samples. Figure 4.10 show the frequency dependence RQF showed almost similar
trend for all the samples. By increasing Y content, the RQF decreases and the peak
associated with the RQF shifting to higher frequencies.
It is observed that the RQF increases with an increase of frequency showing a
peak and then decreases with further increase of frequencies and the peak associated
with the RQF shifting to lower frequencies. It is seen that RQF deteriorates beyond
10MHz for x = 0, 3MHz for x = 0.02 & 0.04, 5MHz for x = 0.06 and 100MHz for x =
0.08 the loss tangent is minimum. The is due to the loss of domain wall motion with
respect to the applied alternating magnetic field and is attributed to various domain
defects [4.20], which include non-uniform and non-repetitive domain wall motion,
domain wall bowing, localized variation of flux density, nucleation and annihilation
of domain walls.
Figure 4.10: Variation of RQF as a function of frequency of Mn0.5Zn0.5YxFe2-xO4 ferrites
sintered at 12000C for 2hrs.

60
All the samples except x = 0.10 are shown here for better understanding for
the merit of the prepared materials for an induction device application. These
phenomenon is associated with the ferromagnetic resonance within the range 10kHz
to 2MHz for x = 0, 20kHz to 1MHz for x = 0.02 & 0.04, 8kHz to 3MHz and 500kHZ
to 100MHz for x = 0.08 at the resonance maximum energy transferred from the
applied magnetic field to the lattice resulting in the rapid decrease RQF. Samples with
x = 0.08 sintered at 1200oC for 2hrs possess the maximum value of RQF. Mn-Zn-Y
ferrites have been found to demonstrate reasonably good permeability at room
temperature covering stable wide range of frequency different from different Y
content up to several MHz induction and /or core materials.
4.3.4 Variation of Saturation Magnetization at Room Temperature
The room temperature magnetic hysteresis loop of the samples has been
measured and is presented in figure 4.11. The hysteresis loops do not show any
noticeable hysteresis effect. All samples exhibited low coercivity values inducting
that all the samples being to the family of soft ferrites. Figure 4.12 shows the variation
of magnetization of the Mn0.5Zn0.5YxFe2-xO4 ferrites as a function of applied magnetic
field for various samples where x = 0.00, 0.02, 0.04, 0.06, 0.08 and 0.10. It is
observed from the figure 4.11 that virgin saturation magnetization (MS) decrease up to
x =0.00 to 0.10. According to Neel’s two sublattice model of ferrimagnetism [4.21],
MS is given by MS = MB – MA where MB and MA are the octahedral and tetrahedral
sublattice magnetizations respectively. In these ferrites Y3+
ions occupy the A-sites
only.
The decrease in MS can be explained by the cation distribution in which Y3+
ions can convert some of Fe3+
to Fe2+
in B-sites. Since the magnetic moment of Fe2+
is
less than that of the Fe3+
, therefore the net moment is expected to decrease as well as
magnetization. By substituting Y3+
ions, it prefers B-sites; therefore magnetic moment
in B-sites is decreased, leading to the decrease of the saturation magnetization of the
ferrites.
The insignificant decrease of Ms may be experimental uncertainty. The
observed variation in Ms can be explained on the basis of cation distribution and the
exchange interactions between A- and B-sites. It is observed that the magnetization
increases sharply at very low field (H < 3KOe) which corresponds to magnetic
domain reorientation that thereafter increases slowly up to saturation due to spin

61
rotation. This magnetization process is connected with soft magnetic behavior of
magnetic material. The slow process of magnetization toward the saturation value is
connected with the magnetic anisotropy effect. Actual saturation could not be attained
even with magnetic field as high as 12KOe.
From these M – H loops at figure 4.11, the remanance induction (Mr) and
coercive force (HC) were determined shown in table 4.5. The MS and HC both
decreasing with increasing Y content again MS and HC are increasing with increasing
Y content, which distinguish reversible and irreversible type’s relaxation due to Y3+
ions. Irreversible type of relaxation is those which are compared ordering an atomic
pair which corresponds to irreversible domain wall movements under external field.
Figure 4.11: Variation of magnetization at room temperature as a function of applied field
on Mn0.5Zn0.5YxFe2-xO4 ferrites where x = 0.00, 0.02, 0.04, 0.06, 0.08 and 0.10
sintered at 12000C for 2hrs.

62
Figure 4.12: Variation of a magnetization at room temperature as a function of applied
field on Mn0.5Zn0.5YxFe2-xO4 [x = 0.00, 0.02, 0.04, 0.06, 0.08 and 0.10]
ferrites sintered at 12000C for 2hrs.
Table 4.5: The experimental values of coercive force (Hc), remanence induction (Mr),
and saturation Magnetization (Ms),of Mn0.5Zn0.5YxFe2-xO4 ferrites at
sintering temperature 12000C for 2hrs
Mn0.5Zn0.5YxFe2-xO4 HC (Oe) Mr in emu/g Ms in emu/g
0.00 61 11 76
0.02 22 04 63
0.04 60 08 54
0.06 46 06 53
0.08 67 07 51
0.10 81 09 47

63
4.4 Electrical Properties
4.4.1 Temperature Dependence of DC Electrical Resistivity
DC electrical resistivity is an important electrical property of ferrites in high
frequency application. The electrical properties of ferrite materials depend upon the
method of preparation, chemical composition, grain size and sintering temperature.
The temperature dependence of electrical resistivity of Mn0.5Zn0.5YxFe2-xO4 ferrites of
different compositions has been investigated. Figure 4.13 shows the variation of DC
electrical resistivity as a function of temperature of Mn0.5Zn0.5YxFe2-xO4 ferrites by
using a Keithley Electrometer. It is seen that the electrical DC resistivity decreases
with increasing temperature for all studied samples according to equation exhibiting
the semiconducting nature of the Y doped Mn-Zn ferrites. Table 4.6 gives the DC
electrical resistivity is found to increases with increasing Y content up to x = 0.06 and
resistivity found to decrease with further addition of Y content. The resistivity
increases with increasing porosity up to x = 0.06, because the charge carriers on their
way face less number of pores i.e. obstacles and after x ≥ 0.06 decrease of resistivity
may be attributed to the entrapped intragranular porosity. The resistivity is primarily
dependent on the temperature but temperature ≥ 200oC all the samples are
independent except x = 0.02 & 0.04.
The relationship between resistivity and temperature has been mentioned in
the equation number 2.16.It is seen that the electrical resistivity decreases with 103/T
for all the studied samples according to equation (2.16) exhibiting the semiconducting
nature of the samples. From figure one can observe that in the investigated
temperature range, the resistivity decreased by about three orders of magnitude. This
strong increase in the conductivity with temperature must be regarded mainly as due
to the thermally activated mobility of charge carriers, but not to a thermally activated
creation of theses carriers.
Table 4.6 shows activation energy for all samples. It is observed that
activation energy increasing with increasing Y content. It is noted that the high
activation energy goes hand in hand with low conductivity of the ferrite. This is in
good accordance with the conclusion that the lower activation energies are associated
with higher electrical conductivity while higher activation energies are associated
with lower electrical conductivity
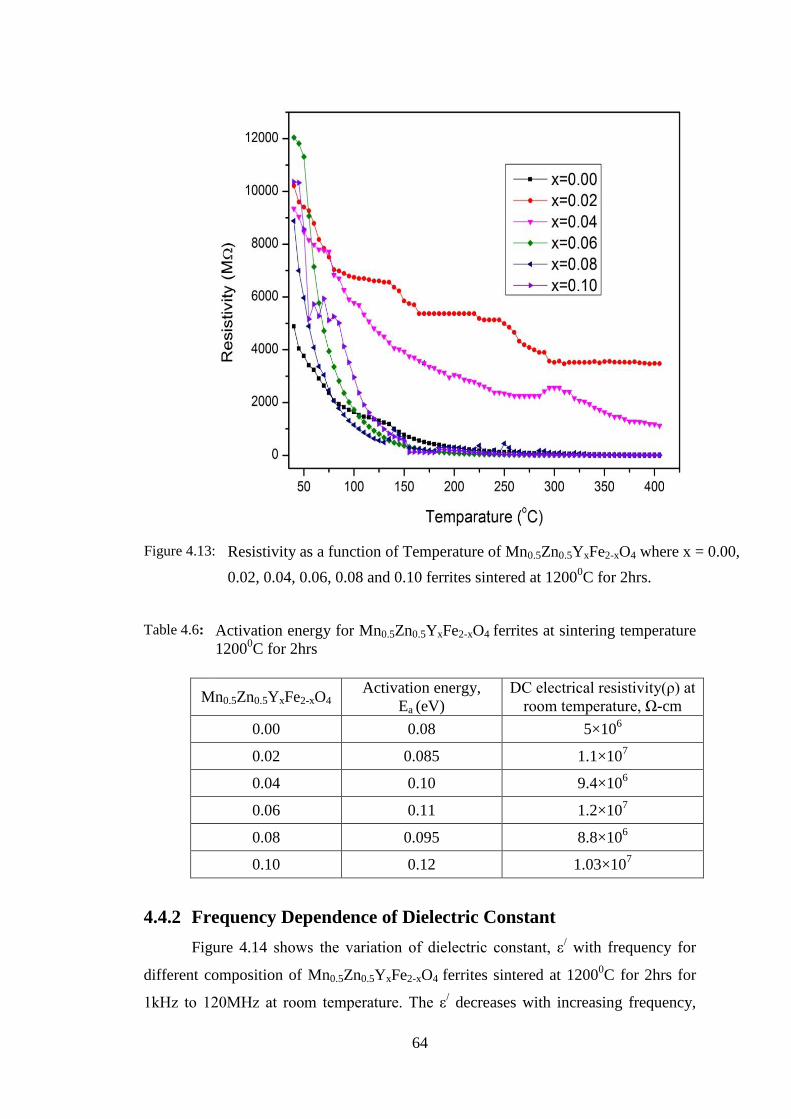
64
Figure 4.13: Resistivity as a function of Temperature of Mn0.5Zn0.5YxFe2-xO4 where x = 0.00,
0.02, 0.04, 0.06, 0.08 and 0.10 ferrites sintered at 12000C for 2hrs.
Table 4.6: Activation energy for Mn0.5Zn0.5YxFe2-xO4 ferrites at sintering temperature
12000C for 2hrs
Mn0.5Zn0.5YxFe2-xO4
Activation energy,
Ea (eV)
DC electrical resistivity(ρ) at
room temperature, Ω-cm
0.00 0.08 5×10⁶
0.02 0.085 1.1×10⁷
0.04 0.10 9.4×10⁶
0.06 0.11 1.2×10⁷
0.08 0.095 8.8×10⁶
0.10 0.12 1.03×10⁷
4.4.2 Frequency Dependence of Dielectric Constant
Figure 4.14 shows the variation of dielectric constant, ε/ with frequency for
different composition of Mn0.5Zn0.5YxFe2-xO4 ferrites sintered at 12000C for 2hrs for
1kHz to 120MHz at room temperature. The ε/ decreases with increasing frequency,
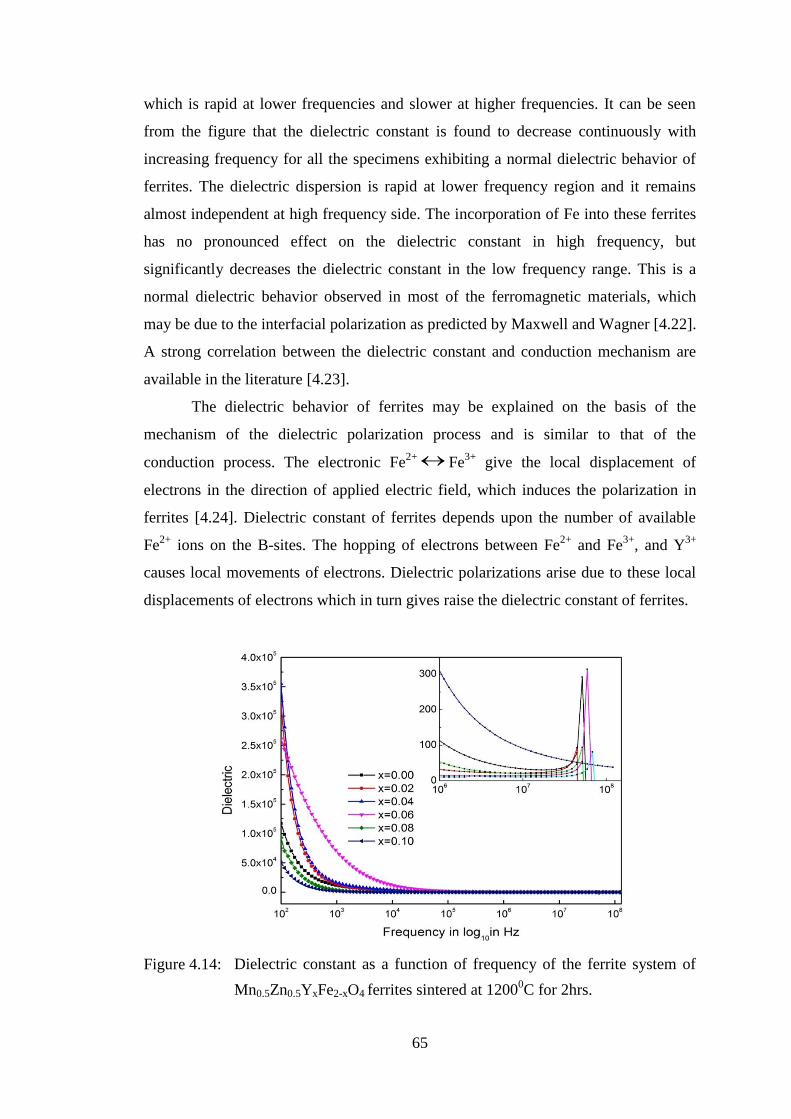
65
which is rapid at lower frequencies and slower at higher frequencies. It can be seen
from the figure that the dielectric constant is found to decrease continuously with
increasing frequency for all the specimens exhibiting a normal dielectric behavior of
ferrites. The dielectric dispersion is rapid at lower frequency region and it remains
almost independent at high frequency side. The incorporation of Fe into these ferrites
has no pronounced effect on the dielectric constant in high frequency, but
significantly decreases the dielectric constant in the low frequency range. This is a
normal dielectric behavior observed in most of the ferromagnetic materials, which
may be due to the interfacial polarization as predicted by Maxwell and Wagner [4.22].
A strong correlation between the dielectric constant and conduction mechanism are
available in the literature [4.23].
The dielectric behavior of ferrites may be explained on the basis of the
mechanism of the dielectric polarization process and is similar to that of the
conduction process. The electronic Fe2+ Fe
3+ give the local displacement of
electrons in the direction of applied electric field, which induces the polarization in
ferrites [4.24]. Dielectric constant of ferrites depends upon the number of available
Fe2+
ions on the B-sites. The hopping of electrons between Fe2+
and Fe3+
, and Y3+
causes local movements of electrons. Dielectric polarizations arise due to these local
displacements of electrons which in turn gives raise the dielectric constant of ferrites.
Figure 4.14: Dielectric constant as a function of frequency of the ferrite system of
Mn0.5Zn0.5YxFe2-xO4 ferrites sintered at 12000C for 2hrs.

66
The magnitude of exchange depends on the concentration Fe2+
/Fe3+
in pairs
present on B-site for the present ferrite. All the samples have high value of ε/ in the
order of 105 at low frequencies. This could be explained using koop’s
phenomenological theory [4.25] which was based on the Maxwell-Wagner model
[4.22, 4.26] for the inhomogeneous double layer dielectric structure. The first layer is
the fairly well conducting large ferrite grain which is separated by the second thin
layer of the poorly conducting grain boundaries. The grain boundaries of the lower
conductivity were found to be ferrite at lower frequencies while ferrite grains of high
conductivity are effective at high frequency.

67
CONCLUSIONS
5.1 Conclusions
The present research work has been undertaken mainly to investigate the rare
earth metal (Y) ions on the structural electrical and magnetic properties of Mn-Zn
ferrites. A series of polycrystalline having nominal composition Mn0.5Zn0.5YxFe2-xO4
where x = 0.00, 0.02, 0.04, 0.06, 0.08, 0.10 have been prepared by the standard solid
state reaction method sintered at 1200ºC for two hours. The effects of Y3+
on
substitution on Mn-Zn ferrites have imparted significant change in structural,
microstructural, magnetic and electrical resistivity properties.
From this Study the following conclusions can be outlined:
(i) The Y substitution for Fe in the Mn0.5Zn0.5YxFe2-xO4 ferrites mainly
produced secondary phase YFeO3. The lattice parameter increases initially
due the replacement of Fe3+
ions by the larger Y3+
ions in the octahedral
sites after increasing Y content no significant decrease in lattice parameter
is observed in the present experiment.
(ii) The bulk density is lower than the X-ray density due to the existence of
pores which are formed developed samples are preparation or sintering
process. The bulk density slightly decreases with increasing Y content and
X-ray density increases continuously with increasing Y content. Porosity
increases monotonically with increasing Y content but contained some
closed porosity due to the evaporation of constituents Y replace Fe.
(iii) SEM micrographs indicate the grain size decreased with increasing Y
content which indicated lower grain growth. In the absence of Y content in
Mn-Zn ferrite of a monophasic single phase homogeneous microstructure
with an average grain size ~16µm but Y doped specimen are a biphasic
homogeneous microstructure of dark ferrite matrix grain and small whitish
grain at the grain boundary and with grain size decreases monotonically
with increases Y content.
(iv) The initial permeability decreases with increasing Y content due to
secondary phase of YFeO3 segregated in the prepared samples. The
maximum permeability undoped Mn-Zn ferrite value of µi = 426 and Y
doped for the sample x = 0.6 value of µi = 403 after decreasing. The
permeability of the compositions with x = 0.04 & 0.08 are stable up to the

68
range 80 - 90MHZ, the maximum frequency stable limit of the
instrumentations. The highest RQF found for the sample x = 0.08 is 5500
& x = 0.04 is 3000. All the samples Mn0.5Zn0.5YxFe2-xO4 except x = 0.10
are shown for better understanding for good permeability at room
temperature covering stable wide range of frequency different from
different Y content up to several MHz range.
(v) Magnetization increases sharply at very low field (H < 3kOe) which
corresponds to magnetic domain reorientation due to domain wall
displacement and there after increase slowly up to saturation due to spin
rotation for Y doped in Mn-Zn ferrites. Saturation magnetization decreases
with increasing both Y substituted Fe in Mn-Zn ferrites can be explained
on the basis of cation distribution and exchange interaction A- and B-sites.
(vi) The DC electrical resistivity is found to decrease with increasing
temperature for all studied samples which means Y doped Mn-Zn ferrites
are semiconducting nature.
(vii) Dielectric constant decreases with increasing frequency exhibiting
normally dielectric behavior of ferrites like all the samples. The dielectric
dispersion is rapid at lower frequency region and remains almost
independent at high frequency region. The increases in frequency enhance
the hopping frequency of charge carriers, resulting in an increase in the
conduction process, thereby decreasing the dielectric constant.
5.2 Scope for Future Work
Some studies on different aspects are possible for fundamental interest and
also for potential applications of the studied rare earth doped ferrite materials. These
modern devices exclusively need soft ferrite materials are used in inductors which
form a basic requirement in high technology areas. Mn-Zn-Y ferrites are suitable for
these devices for future.
The scopes of the future works are proposed as:
(i) Different spinel ferrite systems to investigate the effect on lowering the
sintering temperature are improving electromagnetic properties.
(ii) Neutron diffraction analysis may be performed for these compositions to
determine the distribution of substituted Y3+
ions between A- and B-sites.
Mossbauer spectroscopy can also be studied.

69
(iii) Fabrication and characterization of multilayer chip inductor using
improved Mn-Zn-Y ferrites as stated.
(iv) Some AC and DC electrical properties may be studied.
(v) For the domain wall motion and degree of ordering present in the samples,
MFM study can carried out.

70
REFERENCES
CHPATER-I
[1.1] Akashi T.; ―Effect of Rare Earth Substitution on Magnetic and Electrical
Properties of Mn–Zn Ferrites‖. Inst. Tran. Jpn Met. 2, 171, 1961.
[1.2] Hossain M. A., Khan M. N. I. and Sikder S. S.; ―Structural Magnetic and
Dielectric Behaviors of Y3+
Substituted Ni-Zn Ferrites‖, International Journal
of Nano Science Trends and Technology, 1, 2, 1-19, 2017.
[1.3] Modak S., Ammar M., Mazaleyrat F., Das S., and Chakrabarti P. K.; ―XRD,
HRTEM and Magnetic Properties of Mixed Spinel Nanocrystalline Ni–Zn–
Cu-Ferrite‖, J. Alloys Compd. 473, 15, 2009.
[1.4] Dahotre S. G. and Singh L. N.; ―Study of Magnetic Properties of
Nanostructure Mn-Zn Ferrite‖, Archives of Physics Research, 2 (1): 81-89,
2011.
[1.5] Su H., Zhang H. W., Tang X. L., and Shi Y.; ―Improving Soft Magnetic
Properties of Mn-Zn Ferrite by Rare Earth ions Doping‖, J. Alloys Compd.
468, 290, 2009
[1.6] Rezlescu N., Rezlescu E., Pasnicu C., Craus M. L.; ―Effect of the Rare Earth
Metal of Some Properties of Nickel-Zinc Ferrite‖, J. Phys. Condens. Matter, 6,
5707, 1994.
[1.7] Satter A. A. and El-Shokrofy K. M.; J. ―Rare Earth Doping Effect on the
Electrical Properties of Cu-Zn Ferrites‖ ,Physics.IV CI, 245, 1997.
[1.8] Shokrollahi H.; ―Magnetic Properties and Densification of Manganese–Zinc
Soft Ferrites (Mn 1-x Zn x Fe 2 O 4) Doped With Low Melting Point Oxides‖, J.
Magn. Magn. Mater. 320, 463, 2008.
[1.9] Shaikh P. A., Kambale R. C., Rao A. V., Kolekar Y. D.; ―Studies on Structural
and Electrical Properties of Co 1− x Ni x Fe 1.9 Mn0.1 O4 Ferrite‖, J. Alloys
Compd. 482, 276, 2009 .
[1.10] Calderón-Ortiz E., Perales-Perez O., Voyles P., Gutierrez G. and Tomar M. S.;
―MnxZn1−xFe2−yRyO4 (R=Gd, Eu) Ferrite Nanocrystals for Magnetocaloric
Applications‖ Microelec. J. 40, 677, 2009.
[1.11] Hossain M. A., Khan M. N. I. and Sikder S. S.; ―Effect of Resistivity,
Permeability and Curie Temperature of Rare Earth Metal Europium (Eu)

71
Substitution on Ni0.60Zn0.40-xEuxFe2O4(x = 0.05, 0.10, 0.15) Ferrites‖, ARPN
Journal of Science and Technology, Vol. 5, No. 10, pp. 520-524, 2015.
[1.12] Hilpert, S.; Ber. Deutsh. ― Magnetic Properties of Ferrite and Iron Oxide‖,
Chem. Ges. BD2, Vol.42, pp. 2248-2261, 1909.
[1.13] Snoek, J. L., ―Magnetic and Electrical Properties of the Binary Systems
MO.Fe2O3‖, physica, Vol.3, pp.463-483, 1936.
[1.14] Smit J.; ―Magnetic Properties of Materials‖, Macgraw Hill, New York, 1997.
[1.15] Takai T.; ―Introduction to Magnetic Ferrites and Nanocomposites‖, J. Electr.
Chems. Japan, Vol. 5, pp.411, 1937.
[1.16] Uma Shankar Sharma, Ram Naresh Sharma and Rashmi Shah ― Physical and
Magnetic Properties of Manganese Ferrite Nanoparticles‖ August 2014.
[1.17] Isfahani M. J. N., Myndyk M., Menzel D., Feldhoff A., Amighian J. and
Sepelak V.; ―Magnetic Properties of Nanostructured Mn-Zn Ferrites‖, J.
Magn. Magn. Mater., 321, 152 – 156, 2009.
[1.18] Ping Hu, Yang H., Pan D., Wang H., Tian J., Zhang S., Wang X. and Volnsky
A. A.; ―Heat Treatment Effects on Microstructure and Magnetic Properties of
Mn-Zn Ferrite Powders‖, J. Magn. Magn. Matter., 322, 173 – 177, 2010.
[1.19] Ahmed M. A., Okasha N. and Sayed M. M. E; “Enhancement of the Physical
Properties of Rare-Earth Substituted Mn–Zn Ferrites Prepared by Flash
Method‖ Cera Intern. 33(1), 49, 2007.
[1.20] Zhao L., Cui Y., Yang H., Yu L., Jin W. and Feng S.; ‗‘Study on Magnetic
Properties of Nanocrystalline La-, Nd-, or Gd-Substituted Ni–Mn Ferrite at
Low Temperatures‘‘ Mat. Lett., 60, 104, 2006.
[1.21] Rezlescu N., Rezlescu E., Popa P. D. and Rezlescu L.; ―Effects of Rare-Earth
Oxides on Physical Properties of Li–Zn Ferrite‖, J. Alloy Compd., 275 – 277,
657, 1998.
[1.22] Sun J., Li J. and Sun G.; ―A Novel Architecture of the 3D Stacked MRAM L2
Cache for CMPs‖, J. Magn. Magn. Matter., 25, 20, 2002.
[1.23] Nakamura T., ―Low Temperature Sintering of Ni – Cu- Zn Ferrite and Its
Permeability Spectra‖, J. Magn. Magn. Mater., 168, 285 – 291, 1997.
[1.24] Zhong X. C., Guo X. J., Zou S. Y., Yu H. Y., Liu Z. W., Zhang Y. F. and
Wang K. X.; ―Soft Magnetic Properties of Mn-Zn Ferrite by Rrare Earth ions
Doping‖, AIP ADVANCES 8, 047807, 2018.

72
CHPATER-II
[2.1] Rare Earth Elements - Critical Resources for High Technology: United States
Geological Survey; Fact Sheet 087-02.
[2.2] Jing J., Liang-Chao L., Feng X.; ―Preparation, Characterization and Magnetic
Properties of PANI/La‐substituted LiNi Ferrite Nan Composites‖, Chin. J.
Chem. 24, 1804, 2006.
[2.3] Jing J., Liang-Chao L., Feng X.; ―Structural Analysis and Magnetic Properties
of Gd-Doped Li-Ni Ferrites Prepared Using Rheological Phase Reaction
Method”, J. Rare Earths.25, 79, 2007.
[2.4] Vanuitert L. G.; ―High‐Resistivity Nickel Ferrites—the Effect of Minor
Additions of Manganese or Cobalt‖. J. Chemi. Phys. 23, 1883, 1955.
[2.5] Kolekar C. B., Kamble P.N., Vaingankar A.S.; ―Thermoelectric Power in
Gd3+
-substituted Cu-Cd Ferrites‖, J. Bull. Mater. Sci. 18(2), 133, 1995.
[2.6] Jie S., Lixi W., Naicen X., Qitu Z.; ―Introduction to Ferrite‖, J. Rare Earths,
28, 445, 2010.
[2.7] Bahadur D. Giri J. Nayak B. B, Sriharsha T., Pradhan P., Prasad N. K.;
―Processing, Properties and Some Novel Applications of Magnetic
Nanoparticles‖ 2J. Pramana Phys., 65, 663, 2005. [2.8] Valenzuela R.; ―Magnetic Ceramics‖, Cambridge University Press, Cambridge
1994.
[2.9] Murdock E. S., Simmons R. F., Davidson R.; Roadmap for 10 Gbit/in2
Media: Challenges. IEEE Trans. Magnetics, 28, 5, 3078, 1992.
[2.10] Wulfsberg G.; ―Inorganic Chemistry‖, University Science Books, 691, 2000.
[2.11] Standly K. J, ―Oxide Magnetic Materials‖, 2nd ed., Oxford University Press,
1972
[2.12] Vijaya M. S. and Rangarajan G.; ―Materials Science‖, McGraw-Hill Publ.
Comp. Ltd., New Delhi, 447, 1999-2002.
[2.13] Van Uitert L. G.; ―High-Resistivity Nickel Ferrites – The Effect of Minor
Additions of Manganese or Cobalt‖, J. Chem. Phys. 24(2), 306-310, 1956.
[2.14] Virginia Fuentes, Aburto S. and Velenzuela R.; ―Sub lattice in Nickel Ferrite.‖
J. Magn. Magn. Mater., 69, 233, 1987.

73
[2.15] Anderson P. W.; ―π-Electron Magnetism: From Molecules to Magnetic
Materials‖, Vol 1, Eds, G. T. Rado and H. Shul; Academic Press, New York,
1963.
[2.16] Samokhvalov A. A. and Rustamov A. G.; SOV. Phys. Solid State, 6, 749,
1964.
[2.17] Verway E. J. W., Heilmann E. L. and Romeijin F. C.; ―Physical Properties and
Cation Arrangement of Oxides with Spinel Structure 11. Electronic
Conductivity‖, J. Chem. Phys. 15(4), 181-187, 1947.
[2.18] Jonker G. H.; ―Analysis of the Semiconducting Properties of Cobalt Ferrite‖,
J. Phys. Chem. Solids, 9(2), 165-175, 1959.
[2.19] Smit and Wijn W. J. P.; ―Ferrites‖, Philips Technical Libery C Wiley, New
York, 1959.
[2.20] Goldman A.; ―Handbook of Modern Ferromagnetic Materials‖, Kulwer Acad.
Pub, Boston, U.S.A 1999.
[2.21] M. F. Yan and D. W. Johnson, ―Impurity Induced Exaggerated Grain Growth
in Mn-Zn Ferrites,‖ J. Am. Ceram. Soc., 61, 342, 1978.
Chapter III
[3.1] Kittel C.; ―Introduction to Solid State Physics‖, 7th edition, John Wiley &
Sons, Inc., Singapore, 1996.
[3.2] Nelson J. B., Riley D. P; ―An Experimental Investigation of Extrapolation
Methods in the Derivation of Accurate Unit-Cell Dimensions of Crystals‖,
Proc. Phys. Soc. London 57, 160, 1945.
[3.3] Kin O. Low, Frank Sale R.; ―Electromagnetic Properties of Gel-Derived Ni-
Cu-Zn Ferrites.‖ J. Magn. Magn. Mater., 246, 30 - 35, 2002.
[3.4] Tahir Abbas, Islam M. U. and Ashraf Ch M.; ―Study of Sintering Behavior
and Electrical Properties of Cu-Zn-Fe-O System‖, Mod. Phy. Letts., B 9(22),
1419, 1995.
[3.5] Simon Forner; ―Versatile and Sensitive Vibrating Sample Magnetometer‖, Rev.
Sci. Instr. 30, P.548, 1959
[3.6] Hossain A. K. M. A.; ―Investigation of Colossal Magnetoresistance in Bulk and
Thick Film Magnetites”, Ph. D. Thesis, Imperial College, London, 1998.

74
Chapter IV
[4.1] Ovidiu F. Caltun, Leonard Spinu; ―Magnetic Properties of High Frequency Ni-
Zn Ferrites Doped with CuO‖, Trans. Magn., Vol.37, No.4, July 2001.
[4.2] Goldman A.; ―Hand book of Modern Ferromagnetic Metals‖, Kulwer
Academic Publishers, Boston, USA, 1999.
[4.3] Akhter Hossain A. K. M., Mahmud S. T., Seki M., Kawai T. and Tabata H.;
―Structural, Electrical Transport and Magnetic properties of Ni1-xZnxFe2O4‖, J.
Magn. Magn. Mater., 312, 210, 2007.
[4.4] Zhao L., Cui Y., Yang H., Yu L., Jin W. and Feng S.; ―The Magnetic
Properties of Ni0.7Mn0.3GdxFe2-xO4 Ferrite‖, Mater. Lett., 60, 104, 2006.
[4.5] Ashok Gadkari, Tukaram Shinde and Pramod Vasambekar; ―Influence of Rare
Earth ions on Structural and Magnetic Properties of CdFe2O4 Ferrites‖, RARE
METALS, Vo.29, No. 2, p.168, Apr. 2010.
[4.6] Nelson J. B., Riley D. P.; ―An Experimental Investigation of Extrapolation
Methods in the Derivation of Accurate Unit-Cell Dimensions of Crystals‖;
Proc. Phys. Soc. London 57, 160, 1945.
[4.7] Sun G., Li J., Sun J. and Yang X.; ―The Influences of Zn2+ and Some Rare
Earth Ions on the Magnetic Proper-ties of Nickel-Zinc Ferrites‖, J. Magn.
Magn. Mater., 281, 173 - 177, 2004.
[4.8] Jacobo S. E., Fano W. G. and Razzitte A. C.; ―The Effect of Rare Earth
Substitution on the Magnetic Properties of Ni0.5Zn0.5MxFe2-xO4 (M: Rare
Earth)‖, Physica B., 320, 261 - 263, 2002.
[4.9] Yang Z. H., Gong Z., Q., Li H. X., Ma Y. T. and Yang Y. F., ― Synthesis of
Ni-Zn Ferrites and Its Microstructure and Magnetic Properties‖, Journal of
Central South University of Technology, 13, 618 - 623, 2006.
[4.10] Gupta T. K. and Coble R. L.; ―Sintering of ZnO: I, Densification and Grain
Growth‖, J. Am. Ceram. Soc., 51, 521, 1968.
[4.11] Coble R. L. and Gupta T. K.; ―Sintering and Related Phenomena‖, G. C.
Khcznski, N. A. Hroton and C. F. Gibbon (eds.) p.423, Gordon and Breach,
New York, 1967.

75
[4.12] Bellad S. S., Watawe S. C. and Chougule B. K.; ―Microstructure and
Permeability Studies of Mixed Li-Cd Ferrites‖, J. Magn. Magn. Mater., 195,
57, 1999.
[4.13] Verma A. and Chatterjee R.; ―Effect of Zinc Concentration on the Structural,
Electrical and Magnetic Properties of Mixed Mn-Zn and Ni-Zn Ferrites
Synthesized by the Citrate Precursor Technique‖; J. Magn. Magn. Mater. 306,
313 – 320, 2006.
[4.14] Snelling E. C.; ―Soft Ferrites; Properties and Applications‖, Ed. Butterworth,
London, 1988.
[4.15] Shrotri J. J., Kulkarni S. D., Deshpande C. E. and Date S. K.; ―Effect of Cu
Substitution on the Magnetic and Electrical Properties of Ni-Zn Ferrite
Synthesized by Soft Chemical Method‖, Mater. Chem. Phys. 59, 1, 1999.
[4.16] Tsutaoka T., Ueshima, Tokunaga M., Nakamura T. and Hatakeyama K.;
―Frequency Dispersion and Temperature Variation of Complex Permeability
of Ni-Zn Ferrite Composite Materials‖, J. Appl. Phys., 78(6), 3983, 1995.
[4.17] Brailsford F.; ―Physical Principles of Magnetism‖, D. Van Nostrand company
Ltd., London, 1996.
[4.18] Cullity B. D.; ―Introduction to Magnetic Materials‖, Addision - Wisley
Publishing Company, Inc., California, 1972.
[4.19] Rado G.T., Wright R.W., Emerson W. H. and Terris A.; ―Ferromagnetic at
Very High Frequencies. IV. Temperature Dependence of the Magnetic
Spectrum of a Ferrite‖, Physical Review, Vol-88, pp 909-915, 1952
[4.20] Chauhan B. S., Kumar R., Jadhav K. M. and Singh M.; ―Magnetic Study of
Substituted Mg-Mn Ferrites Synthesized by Citrate Precursor Method‖,
Journal of Magnetism and Magnetic Materials, Vol. 283, pp 71 - 81, 2004.
[4.21] Neel I.; ―Propriétés Magnétiques Des Ferrites ; Ferrimagnétisme et
Antiferromagnétisme‖, Ann. Phys. 3, 137, 1948.
[4.22] Maxwell J.; 1873, ―Electricity and Magnetism‖, Vol.1, Oxford University
Press. London Wanger K., Ann. Phys. 40, 817, 1913.
[4.23] Nutan Gupta, Kashyap S. C. and Dube D. C.; ―Dielectric and Magnetic
Properties of Citrate Route Processed Li-Co Spinel Ferrites‖, Phys. Stat. Solidi
(a), 204(7), 2007.

76
[4.24] Zhenxing Yue, Zhou Ji, Longtu Li, Xiaolui Wang and Zhilun Gui; ―Effect of
Copper on the Electromagnetic Properties of Mg-Zn-Cu Ferrites Prepared by
Sol-gel Auto-Combustion Method‖, Mater. Sci. Eng. B, 86, 64, 2001.
[4.25] Koops C. G.; ―On the Dispersion of Resistivity and Dielectric Constant of
Some Semiconductors at Audio Frequencies‖, Phys. Rev., 83, 121, 1951.
[4.26] Venugopal Reddy P. and Seshagiri Rao T.; ―Dielectric Behavior of Mixed Li-
Ni Ferrites at Low Frequencies‖, J. Less Common Met., 86, 255, 1982.
CONFERENCE PUBLICATIONS
1. S. S. Acharjee, M. A. Hossain, M. N. I. Khan and S. S. Sikder; ―Study of the
Structural and Magnetic Properties of Rare Earth Yttrium Doped Mn-Zn
Ferrites‖, International Conference on Physics 2018, 08-10 March, DU,
Dhaka-1000, Bangladesh
2. M. A. Hossain, S. S. Acharjee, M. N. I. Khan and S. S. Sikder;; ―Complex
Permeability of Yttrium (Y) Substituted Mn-Zn Rare Earth Ferrites Prepared
by Solid State Reaction Technique‖; Conference on Whether Forecasting
and Advances in Physics, 11-12 May, 2018, KUET, Khulna-9203,
Bangladesh
3. S. S. Acharjee, M. A. Hossain, M. N. I. Khan and S. S. Sikder; ―Structure
and Transport Properties of Yttrium (Y) Substituted Mn-Zn Rare Earth
Ferrites Prepared By Soild State Reaction Method‖, Conference on Whether
Forecasting and Advances in Physics, 11-12 May, 2018, KUET, Khulna-
9203, Bangladesh