study of the tear topography dynamics using a lateral shearing
TRANSCRIPT
Study of the tear topography dynamicsusing a lateral shearing interferometer
Alfredo Dubra and Carl PatersonPhotonics Group, The Blackett Laboratory, Imperial College London, SW7 2BW, UK
Christopher DaintyApplied Optics, Dept. of Experimental Physics, National University of Ireland, Galway,
University Road, Galway, Ireland.
http://www.imperial.ac.uk/research/photonics/research/topics/tear film topography/index.htm
Abstract: The dynamics of the pre-corneal tear film topography arestudied on 21 subjects with a purpose-built lateral shearing interferometer.It was found that in most of the recorded data the tear surface is continuousand smooth. Eye movement is identified as a major problem in quantitativetear topography estimation. Based on the reconstructed tear topographymaps, the effects of tear dynamics in visual performance, wavefront sensingfor refractive surgery and ophthalmic adaptive optics are discussed in termsof wavefront RMS. The potential of lateral shearing interferometry forclinical applications such as dry eye diagnosis and contact lens performancestudies is illustrated by the recorded topography features such as post-blinkundulation, break-up, eyelid-produced bumps/ridges, bubbles and roughtear surfaces in front of contact lenses.
© 2004 Optical Society of America
OCIS codes: (330.5370) Physiological optics, (010.1080) Adaptive optics, (170.3890) Medicaloptics instrumentation, (170.4580) Optical diagnostics for medicine, (330.4300) Noninvasiveassessment of the visual system and (330.4460) Ophthalmic optics.
References and links1. H.S. Smirnov, “Measurement of wave aberration in the human eye,” Biophys. 6, 52–66 (1961).2. I. Iglesias, E. Berrio, and P. Artal, “Estimates of the ocular wave aberration from pairs of double pass retinal
images,” J. Opt. Soc. Am. A 15(9), 2466–2476 (1998).3. J. Liang and D.R. Williams, “Aberrations and retinal image quality of the normal human eye,” J. Opt. Soc. Am.
A 14(11), 2873–2883 (1997).4. T.O. Salmon, L.N. Thibos, and A. Bradley, “Comparison of the eye’s wave-front aberration measured psyco-
physically and with the Shack-Hartmann wave-front sensor,” J. Opt. Soc. Am. A 15(9), 2457–2465 (1998).5. W.N. Charman and G. Heron, “Fluctuations in accommodation: a review,” Ophthal. Physiol. Opt. 8(2), 153–164
(1988).6. L.S. Gray, B. Winn, and B. Gilmartin, “Effect of target luminance on microfluctuations of accommodation,”
Ophthal. Physiol. Opt. 13(3), 258–265 (1993).7. H. Hofer, P. Artal, B. Singer, J.L. Aragon, and D.R. Williams, “Dynamics of the eye’s aberration,” J. Opt. Soc.
Am. A 18(3), 497–506 (2001).8. E. Moreno-Barriuso and R. Navarro, “Laser ray tracing versus Hartmann-Shack sensor for measuring optical
aberrations in the human eye,” J. Opt. Soc. Am. A 17(6), 974–985 (2000).9. R. Tutt, A Bradley, C Begley, and L.N. Thibos, “Optical and visual impact of tear break-up in human eyes,”
Invest. Ophth. Vis. Sci. 41(13), 4117–4123 (2000).10. Ignacio Iglesias and Pablo Artal, “High-resolution retinal images obtained by deconvolution from wave-front
sensing,” Opt. Lett. 25(24), 1804–1806 (2000).
(C) 2004 OSA 13 December 2004 / Vol. 12, No. 25 / OPTICS EXPRESS 6278#5435 - $15.00 US Received 29 October 2004; revised 25 November 2004; accepted 3 December 2004

11. F. Vargas-Martin, P.M. Prieto, and P. Artal, “Correction of the aberrations in the human eye with a liquid-crystalspatial light modulator: limits to its performance,” J. Opt. Soc. Am. A 15(9), 2552–2562 (1998).
12. Shizuka Koh, Naoyuki Maeda, Teruhito Kuroda, Yuichi Hori, Hitoshi Watanabe, Takashi Fujikado, Yasuo Tano,Yoko Hirohara, and Toshifumi Mihashi, “Effect of tear film break-up on higher-order aberrations measured withwavefront sensor,” Am. J. Ophthalmol. 134(1), 115–117 (2002).
13. Luis Diaz-Santana, Cristiano Torti, Ian Munro, Paul Gasson, and Chris Dainty, “Benefit ofhigher closed-loop bandwidths in ocular adaptive optics,” Opt. Express 11(20), 2597–2605 (2003).http://www.opticsexpress.org/abstract.cfm?URI=OPEX-11-20-2597
14. Nikole L. Himebaugh, Annette R. Wright, Arthur Bradley, Carlolyn G. Begley, and Larry Thibos, “Use ofretroillumination to visualize optical aberrations caused by tear film break-up,” Optom. Vis. Sci. 80(1), 69–78(2003).
15. Xu Cheng, Nikole L. Himebaugh, Pete S. Kollbaum, Larry N. Thibos, and Arthur Bradley, “Test-retest reliabilityof clinical shack-hartmann measurements,” Invest. Ophth. Vis. Sci. 45(1), 351–360 (2004).
16. M. Glanc, E. Gendron, F. Lacombe, D. Lafaille, J.-F. Le Gargasson, and P. Lena, “Towards wide-field retinalimaging with adaptive optics,” Opt. Commun. 230, 225–238 (2004).
17. T.J. Licznerski, H.T. Kasprzak, and W. Kowalik, “Two interference techniques for in vivo assesment of the tearfilm stability on a cornea and contact lens,” Proc. SPIE 3320, 183–186 (1998).
18. Alfredo Dubra, Carl Paterson, and J. Christopher Dainty, “Lateral shearing interferometer for the evaluation oftear topography dynamics,” To be published in App. Opt. (2004).
19. M. Takeda, H. Ina, and S. Kobayashi, “Fourier-transform method of fringe-pattern analysis for computer basedtopography and interferometry,” J. Opt. Soc. Am. 72(1), 156–160 (1982).
20. Alfredo Dubra, Carl Paterson, and J. Christopher Dainty, “Wave-front reconstruction from shear phase maps byuse of the discrete Fourier transform,” App. Opt. 43(5), 1108–1113 (2004).
21. Austin Roorda, Associate professor, university of houston, college of optometry, houston tx 77204-2020, US.Personal communication,” (2002).
22. R. Montes-Mico, J.L. Alio, G. Munoz, and W.N. Charman, “Temporal changes in optical quality of airtear filminterface at anterior cornea after blink,” Invest. Ophth. Vis. Sci. 45, 1752–1757 (2004).
1. Introduction
It has been known since Smirnov’s work in 1961[1] that the variability in wavefront sensingmeasurements is dominated not by the wavefront sensors but by changes within the eye. Under-standing the sources of this variability is required for making better use of the measurements,for example in the context of refractive surgery. Reported values for the variability of the root-mean-squared (RMS) of the wavefront aberration of the eye are typically 0.1 µm [1, 2, 3, 4]. AnRMS of 0.1 µm of defocus for a 3mm pupil corresponds to approximately 1/4 of a diopter (D), which is the minimum step between consecutive ophthalmic lenses. Therefore, the wavefrontaberration variability is not an issue for spectacle prescription. However, when trying to achievediffraction limited retinal imaging, that is when the RMS of the wavefront aberration of the eyecombined with that of the ophthalmic instrument being used has to be kept below Marechal’sdiffraction limit, λ /14 (i.e., 0.03−0.05 µm for visible wavelengths), then the variability of thewavefront sensing measurements is by no means negligible.
Some of the sources of variability in the optical quality of the eye have been identified andcharacterized, such as the fluctuation of the accommodation [5, 6] whose influence can bereduced by the use of drugs (usually cyclopentolate) [2, 3, 7, 8, 9]. Other sources have beenidentified but to our knowledge not studied in sufficient depth yet: the eye movement, axiallength change [7] and tear dynamics [1, 3, 4, 7, 9, 10, 11, 12, 13, 14, 15, 16].
Most of the research related to the effect of the tear on the optical quality of the eye has so farconcentrated on the extreme situation of tear break-up [9, 14]. In 1998, Licznerski et al. [17]proposed the use of lateral shearing interferometry for the study of the tear topography, andrecently based on this work, we proposed and tested an improved version of this interferometer(and data processing), which is capable of estimating tear topography maps from pairs of lateralshearing interferograms [18]. In this work we present the results of using this interferometer on21 different subjects, three of them being contact lens users and one with dry eye condition.
(C) 2004 OSA 13 December 2004 / Vol. 12, No. 25 / OPTICS EXPRESS 6279#5435 - $15.00 US Received 29 October 2004; revised 25 November 2004; accepted 3 December 2004
2. Lateral shearing interferometer
In order to study the tear topography dynamics we built an interferometer [18] sketched in Fig.1, that produces pairs of lateral shearing interferograms from a beam reflected off the frontsurface of the tear film. The phase maps of these interferograms are, to first order, gradients ofthe tear topography. Thus the need for two interferograms with shear in different directions forthe estimation of a single topography map.
The interferometer consists of an illumination branch and two imaging branches. The il-lumination branch produces a smooth (ideally uniform) normal illumination over a circularregion of the front surface of a subject’s pre-corneal tear film approximately 3.5mm in diam-eter. Although a larger diameter would have been desirable, technical limitations such as therequirement for large optical elements with high numerical apertures and practical issues suchas the need for moderate tolerance to eye movement, restricted the studied area of the tear. Thelight source is a linearly polarized He-Ne laser (λ = 632.8nm) with an output power after aneutral density filter (ND) of around 5µW. In this way the power of the radiation reaching theeye is kept 3000 times below safety limits for exposures of up to 100s according to the Britishand European standard for Safety of Laser Products (BS EN 60825-1:1994 with amendments1, 2 and 3). The laser beam at the output of the laser is expanded and spatially filtered using anafocal system formed by a microscope objective, a lens (L250
1 ) and a pinhole. After reflectionon the polarizing beam splitter (PBS), the beam is focused towards the subject’s corneal centerof curvature, to achieve normal illumination at the tear surface.
The polarization of the laser and the axis of a quarter-waveplate after the PBS were orientedto direct all the light reflected by the tear back into the imaging branches. The use of this com-bination of optical elements and polarization control, not only keeps the light levels reachingthe eye to a minimum, but also reduce the undesired reflections in the system by two orders ofmagnitude (with respect to a non-polarizing beam splitter configuration).
The two imaging branches produce 1:1 magnification lateral shearing interferograms of thetear film onto a single CCD camera (Retiga 1300, Qimaging), with horizontal and vertical shear.The 3 dimensional folding of the imaging branches makes it possible to image both interfero-grams onto a single camera, eliminating the need for a second camera and their synchronization.The key optical elements in the interferogram generation are the glass wedges, each of themproducing a pair of beams from the reflections on their front and back surface. The tilt betweenthe surface of the wedges leads to fringes in the interferograms, which are required for thephase recovery algorithm used in the data processing. The relative intensity of the interfero-grams was equalized by rotating the input polarization state of both imaging branches using aλ /2 waveplate.
The recorded interferograms are processed using Takeda’s phase recovery method [19].Thespectra of the interferograms show a central peak and two (symmetric) side ones. The separationbetween these peaks is given by the spatial frequency of the tilt fringes. To extract the phase, thespectra are filtered asymmetrically, by masking out the central peak and one of the side peaks,then inverse Fourier transforming and finally retaining only the imaginary part. The separationof the peaks in the Fourier plane determines the maximum spatial frequency unaffected bythe filter, and thus the minimum size of the tear features to be recovered. Finally from eachpair of phase maps corresponding to horizontal and vertical shearing, a tear topography mapis estimated by using a least-squares integrator [20]. A conservative error estimation in thetopography maps accounting for different error sources would be 15% [18].
3. Data collection protocol
A bite registration with soft dental wax was made and mounted on a x-y-z translation stage forprecise positioning of the subject with respect to the experiment. When the subject was aligned
(C) 2004 OSA 13 December 2004 / Vol. 12, No. 25 / OPTICS EXPRESS 6280#5435 - $15.00 US Received 29 October 2004; revised 25 November 2004; accepted 3 December 2004

ND filter
late
λ/2 plate microscope objective
spatia
PBS
He-Ne (632.8nm)
eye
wedge
aperture stop
L250
1
L40
2
L150
3
CCD camera
PP
Fig. 1. Sketch of the 3 dimensional lateral shearing interferometer. After the light is re-flected back from the front surface of the tear, the first glass wedge produces two hori-zontally sheared and tilted copies of the incident beam by reflection and a third copy bytransmission. The second wedge allows the first pair of copies of the beam to go throughunchanged, while on reflection produces a second pair of copies of the beam carrying in-formation from the eye, sheared and tilted in the perpendicular direction. The superscriptin the lenses indicates focal length in millimeters.
with respect to the optical system, he/she was asked to remain as steady as possible and to blinknormally, while sequences of 100 pairs of shearing interferograms were recorded at a rate of 5per second. No attempt was made to process the interferograms affected by vignetting, eyelidsor eyelashes.
4. Series of raw interferograms
Before performing any data processing, it is worth studying the series of recorded interfer-ograms, where several tear topography features and their evolution can be clearly identified.This suggests that interferometry, and not necessarily lateral shearing interferometry, is poten-tially a non-invasive clinical tool for tear pathology diagnostics (e.g. dry eye), as illustrated bythe movies in Fig. 2. In these movies, the interferograms have been centered to remove mostof the eye movement, which otherwise would show the interferograms moving by up to a tenthof the interferogram diameter. The raw sequences consisted of 100 frames, but for display pur-poses, the frames where the interferograms were vignetted due to large eye movements wereremoved, hence the discontinuous numbering in some series.Movie (a) shows a smooth tear surface throughout the approximately 25s where the subjectdid not blink. This smooth topography is the most common scenario in the collected data, evenwhen the subjects are not blinking (the average blink rate is approximately 1 every 5 seconds[9]).Movie (b) shows a sequence with several consecutive blinks. Here it can be seen that the surfaceis very smooth before the blinks and that immediately after becomes undulated and sometimeseven breaks-up (see frame 29/100). This undulation appears in all subjects immediately after
(C) 2004 OSA 13 December 2004 / Vol. 12, No. 25 / OPTICS EXPRESS 6281#5435 - $15.00 US Received 29 October 2004; revised 25 November 2004; accepted 3 December 2004

the blink and takes one to two seconds to relax into a smooth surface again.In movie (c) the tear surface of a regular soft contact lens wearer is shown (without the con-tact lenses). Throughout the series a number of small tear features with stable positions can beidentified. Notice that all of the features are duplicated because the interferogram is formed byoverlapping two sheared copies of the same beam. The distance between the duplicated featuresis the interferogram shear that can be seen at the pupil edge along the horizontal direction. Theseries of interferograms also shows horizontal bumps/ridges caused by the eyelids, either afterreaching and/or resting in a given position and then withdrawing from it. These features arerelatively common, and are clearly always horizontal. Some post-blink undulation can also beseen in this series, producing rough surfaces around the small tear features (e.g., frame 13/100).Movie (d) shows a clear bump/ridge on the top part of the pupil, which moves downwards veryslowly until it is flattened during the blink. After the post-blink undulation the surface remainssmooth other than for a single small feature (possibly a bubble) that slides downwards until itstabilizes at the center of the pupil.The series in (e) shows the development of a small tear break-up (top left corner) in an other-wise smooth and very slightly undulated tear surface.Movie (f) shows the most dramatic surface undulation recorded, ending in the breaking of thetear surface in multiple points, mainly around the pupil edge. It is remarkable how after a singlelong blink a very smooth continuous tear surface is restored.In (g) we can see an initially smooth continuous tear surface breaking and undulating before ablink prevents the tear from breaking. Towards the end of the series, the tear eventually breakssimultaneously in several places and the smooth surface is restored after a single blink. Thisfinal blink leaves some small features (possibly bubbles) that disappear within half a second(frames 91 and 92/100).Finally, the movies in (h) and (i) show typical tear surfaces in front of contact lenses, for hardand soft contact lenses respectively. In general the tear surface becomes smoother after blinking,but this does not last. Eventually the surface becomes so rough that fringes cannot be identified.This very high spatial frequency roughness would not change the prescription of the wearer orsignificantly affect the aberrations of the eye, but more likely increase the scattering.
5. Eye movement and its effect on tear topography measurements
5.1. Eyeball rotation
Let us model the eyeball as a rigid body formed by two spherical surfaces, the sclera with atypical radius of approximately 11mm and the cornea with 8mm radius (typical values rangefrom 7 to 9mm). When the eyeball rotates an angle θ around the center of the sclera (assumingthat the center of the corneal surface is 6mm away from it), the change in observed topographyRMS over a circular pupil of 3mm in diameter is
RMS(θ) ≈ (2.4 µm)×θ. (1)
where piston, tip and tilt (which together account for 99.5% of the topography change) wereremoved, because they do not affect the optical quality of the eye. To convert this topographyRMS value to wavefront error RMS in full wavefront sensing measurements in the eye, oneonly needs to multiply the topography RMS by the difference in refractive indices between airand cornea (ncornea ≈ 1.37).
We estimated the movement of the eye by tracking the movement of the center of the recordedinterferograms. Figure 3 a shows a typical eye movement pattern over a period of 30 seconds.From the standard deviation of the eye movement (see Figs. 3(b) and (c)) and using formula1, one can estimate the RMS of the wavefront error that would be produced by eye movement
(C) 2004 OSA 13 December 2004 / Vol. 12, No. 25 / OPTICS EXPRESS 6282#5435 - $15.00 US Received 29 October 2004; revised 25 November 2004; accepted 3 December 2004

Tear interferogram horizontal shear
Subject: jm2 ( 1 / 100 ) Dubra, Paterson & Dainty
Tear interferogram horizontal shear
Subject: jn3 ( 1 / 100 ) Dubra, Paterson & Dainty
Tear interferogram horizontal shear
Subject: im4 ( 1 / 100 ) Dubra, Paterson & Dainty
(a) (b) (c)Tear interferogram horizontal shear
Subject: te4 ( 1 / 100 ) Dubra, Paterson & Dainty
Tear interferogram horizontal shear
Subject: gk3 ( 1 / 100 ) Dubra, Paterson & Dainty
Tear interferogram horizontal shear
Subject: mk1 ( 1 / 100 ) Dubra, Paterson & Dainty
(d) (e) (f)Tear interferogram horizontal shear
Subject: st1 ( 1 / 100 ) Dubra, Paterson & Dainty
Tear interferogram horizontal shear
Subject: fr4 ( 1 / 100 ) Dubra, Paterson & Dainty
Tear interferogram horizontal shear
Subject: te2 ( 1 / 100 ) Dubra, Paterson & Dainty
(g) (h) (i)
Fig. 2. Movies illustrating tear topography features: (a) smooth surface (2.8MB); (b) post-blink undulation (2.8MB); (c) bubbles and post-blink undulation (2.8MB); (d) eyelid-produced bumps (2.8MB); (e) break-up in an otherwise smooth surface (2.8MB); (f) and(g) dramatic break-up (2.8MB); (h) and (i) rough surfaces in front of hard and soft contactlenses respectively(2.8MB). These movies play at 5 frames per second, that is the rate atwhich the interferograms were recorded.
of those amplitudes. This can be taken as an estimation of the uncertainty in RMS due to eyemovement, giving approximately 0.01 µm. This value is too small to explain the large rapidfluctuations of defocus and astigmatism that were measured in the experiments (see plot c inFig. 6).
(C) 2004 OSA 13 December 2004 / Vol. 12, No. 25 / OPTICS EXPRESS 6283#5435 - $15.00 US Received 29 October 2004; revised 25 November 2004; accepted 3 December 2004

-0.2 0 0.2
-0.2
-0.1
0
0.1
0.2
horizontal displacement (mm)
ve
rtic
al d
isp
lace
me
nt
(mm
)
-0.5 0 0.50
0.02
0.04
0.06
0.08
0.1
horizontal displacement (mm)-0.5 0 0.5
0
0.02
0.04
0.06
0.08
0.1
vertical displacement(mm)
Fig. 3. Eye movement: the plot on the left shows a typical eye movement pattern over 30s(the radius of the red circle corresponds to one standard deviation); the center and rightplots are the normalized histograms of the horizontal and vertical eye displacement for allthe 2450 usable frames from 14 different subjects. Both distributions have zero mean and0.16 and 0.12mm standard deviations respectively, which is equivalent to 9nm of wavefronterror RMS.
0.9 1 1.1
-0.5
0
0.5
1
relative pupil radii
RM
S m
ea
su
red
(m
)u
Fig. 4. Correlation between the relative change in the radius of the interferograms and theestimated change in defocus (0.67).
5.2. Head movement
It was noticed in the course of the experiments that despite the use of the bite bar, the headof the subject pivoted a little around the biting point during the 20 to 30 seconds of the dataacquisition in a vertical plane. This shows very clearly in the interferograms, as noticeable fluc-tuations in the interferogram diameter of up to 10%, and on the number of fringes across theinterferograms due to the changes in defocus when the front tear surface changes its distanceto the experimental setup along the optical axis. The processed data also shows the head move-ment through a correlation coefficient of 0.7 between the defocus component of the measuredtopography maps and the relative change in pupil diameter (Fig. 4). However, by looking at theplots in Fig. 6(c), it seems reasonable to think that the measured fast fluctuations of defocus arenot solely due to the much slower head movement (usually with a time scale comparable to thatof respiration). We should therefore be aware that both the eyeball rotation and head movementmight lead to a small over-estimation of tear topography changes. In order to address this is-sue, the data analysis considers the tear topography with and without defocus and astigmatism,which are the aberrations introduced by eye movement that have the most impact.
(C) 2004 OSA 13 December 2004 / Vol. 12, No. 25 / OPTICS EXPRESS 6284#5435 - $15.00 US Received 29 October 2004; revised 25 November 2004; accepted 3 December 2004
Tear topographychanges
defocus & astigsremoved
Subject: jm2 ( 2 / 100 ) Dubra, Paterson & Dainty
Tear topographychanges
defocus & astigsremoved
Subject: te4 ( 2 / 100 ) Dubra, Paterson & Dainty
(a) (b)
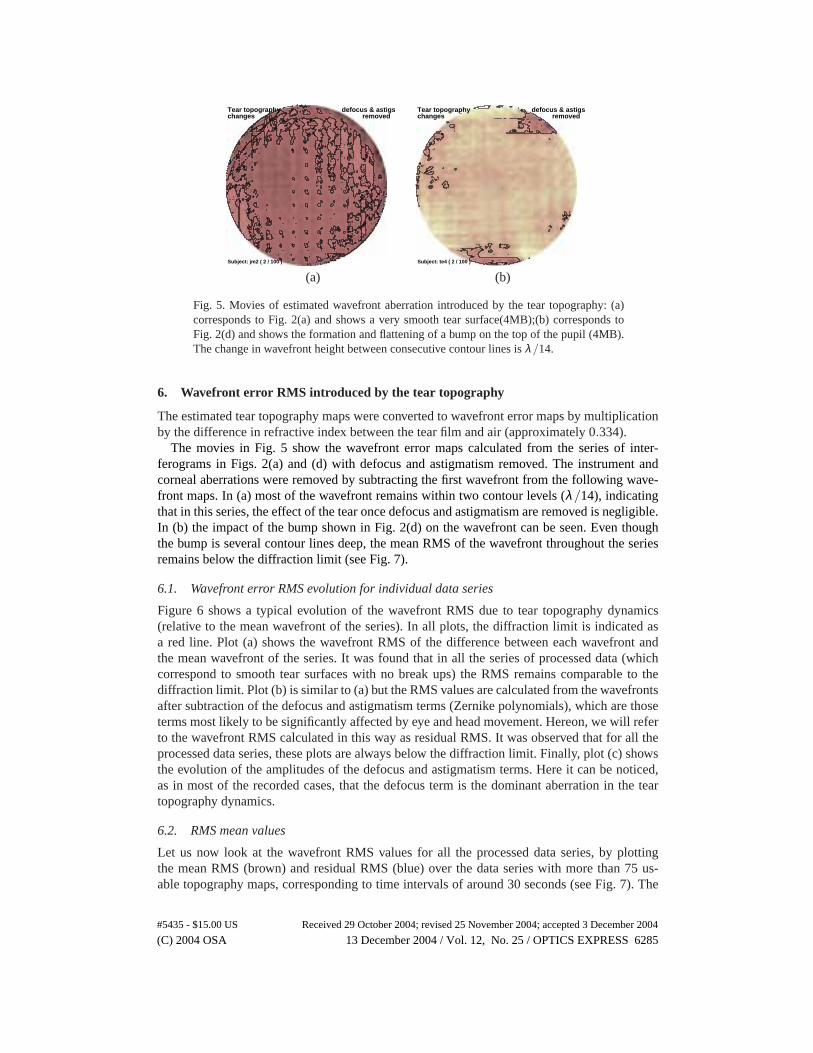
Fig. 5. Movies of estimated wavefront aberration introduced by the tear topography: (a)corresponds to Fig. 2(a) and shows a very smooth tear surface(4MB);(b) corresponds toFig. 2(d) and shows the formation and flattening of a bump on the top of the pupil (4MB).The change in wavefront height between consecutive contour lines is λ /14.
6. Wavefront error RMS introduced by the tear topography
The estimated tear topography maps were converted to wavefront error maps by multiplicationby the difference in refractive index between the tear film and air (approximately 0.334).
The movies in Fig. 5 show the wavefront error maps calculated from the series of inter-ferograms in Figs. 2(a) and (d) with defocus and astigmatism removed. The instrument andcorneal aberrations were removed by subtracting the first wavefront from the following wave-front maps. In (a) most of the wavefront remains within two contour levels (λ /14), indicatingthat in this series, the effect of the tear once defocus and astigmatism are removed is negligible.In (b) the impact of the bump shown in Fig. 2(d) on the wavefront can be seen. Even thoughthe bump is several contour lines deep, the mean RMS of the wavefront throughout the seriesremains below the diffraction limit (see Fig. 7).
6.1. Wavefront error RMS evolution for individual data series
Figure 6 shows a typical evolution of the wavefront RMS due to tear topography dynamics(relative to the mean wavefront of the series). In all plots, the diffraction limit is indicated asa red line. Plot (a) shows the wavefront RMS of the difference between each wavefront andthe mean wavefront of the series. It was found that in all the series of processed data (whichcorrespond to smooth tear surfaces with no break ups) the RMS remains comparable to thediffraction limit. Plot (b) is similar to (a) but the RMS values are calculated from the wavefrontsafter subtraction of the defocus and astigmatism terms (Zernike polynomials), which are thoseterms most likely to be significantly affected by eye and head movement. Hereon, we will referto the wavefront RMS calculated in this way as residual RMS. It was observed that for all theprocessed data series, these plots are always below the diffraction limit. Finally, plot (c) showsthe evolution of the amplitudes of the defocus and astigmatism terms. Here it can be noticed,as in most of the recorded cases, that the defocus term is the dominant aberration in the teartopography dynamics.
6.2. RMS mean values
Let us now look at the wavefront RMS values for all the processed data series, by plottingthe mean RMS (brown) and residual RMS (blue) over the data series with more than 75 us-able topography maps, corresponding to time intervals of around 30 seconds (see Fig. 7). The
(C) 2004 OSA 13 December 2004 / Vol. 12, No. 25 / OPTICS EXPRESS 6285#5435 - $15.00 US Received 29 October 2004; revised 25 November 2004; accepted 3 December 2004

(a) (b) (c)
0 10 200
0.02
0.04
0.06
0.08
RMS evolution
time (s)
am
plit
ud
e
(µ m
)
0 10 200
0.02
0.04
0.06
0.08
Residual RMS
time (s)
am
plit
ud
e
(µ m
)
0 10 200
0.02
0.04
0.06
0.08
second order zernike evolution
time (s)
am
plit
ud
e
(µ m
)
astig
defocus1
astig2
Fig. 6. Typical wavefront RMS evolution due to the tear topography dynamics. The redhorizontal line in the plots indicates the diffraction limit for the wavelength used in the ex-periment. Plot (a) shows the evolution of the RMS (after subtraction of the mean wavefrontof the series). Plot (b) is similar to (a) but with the defocus and astigmatism terms removed,and (c) plots the evolution of the defocus and astigmatism components.
numbers on top of the bars are the maximum correlation coefficient between the correspondingRMS and the eyeball rotation and head movement. One can think of these numbers as indicatorsof the likelihood of the estimated RMS being an artifact due to the undesired eye movementsas opposed to true tear topography change.
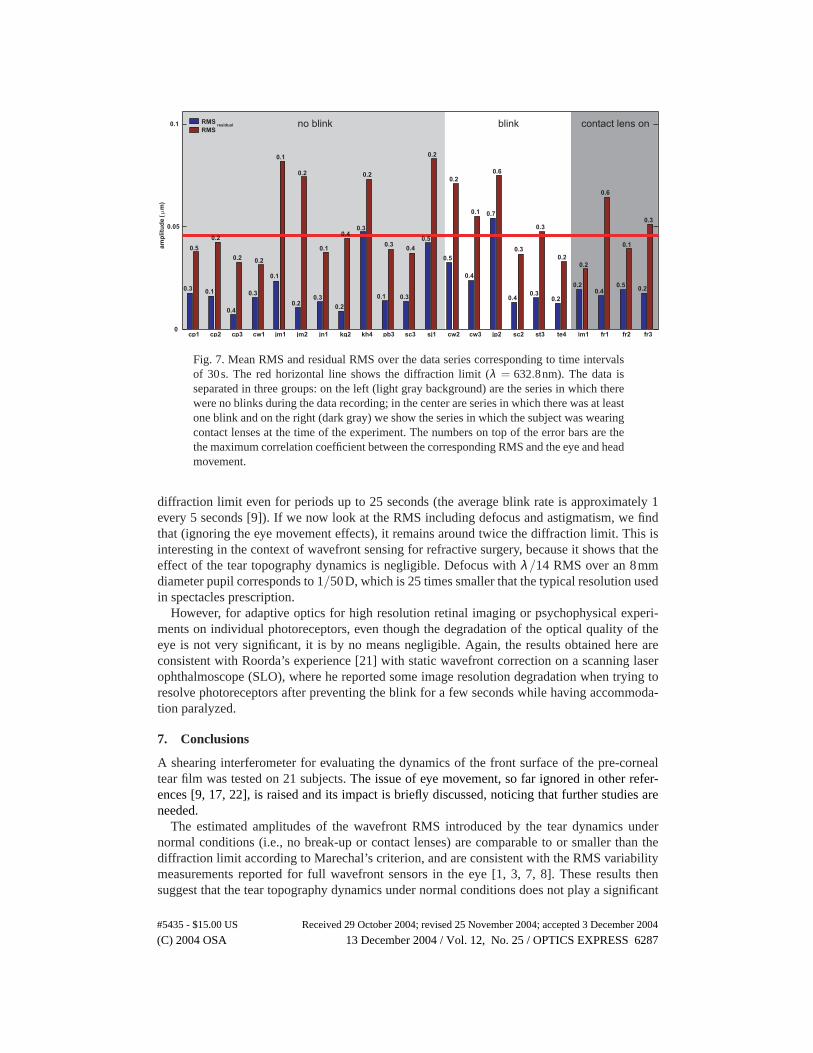
In almost all cases the mean residual RMS is comparable to or lower than the diffractionlimit, while the mean RMS values, including the defocus and astigmatism components seemcomparable to or greater than the diffraction limit.
Note that the results shown in Fig. 7 correspond only to a sample of 14 subjects and withinthose, to the data series with no break-ups or extreme roughness. Thus, it might be argued thatFig. 7 shows an underestimation the RMS values. Nevertheless, the processed data correspondsto the most representative situation (more than 70% of the recorded data series) among non-contact lens wearers.
The analyzed data shows no discernable difference between the tear in front of the contactlenses and the tear in front of the cornea when no contact lens is being worn. However, theanalyzed data in this case represents only a small portion (less than 30%) of the recorded datafrom contact lens users. In the rest of the data, the roughness of the tear surface is such that nofringes could be identified (see Figs. 2(h) and (i)), and therefore no quantitative analysis couldbe performed.
6.3. RMS mean evolution
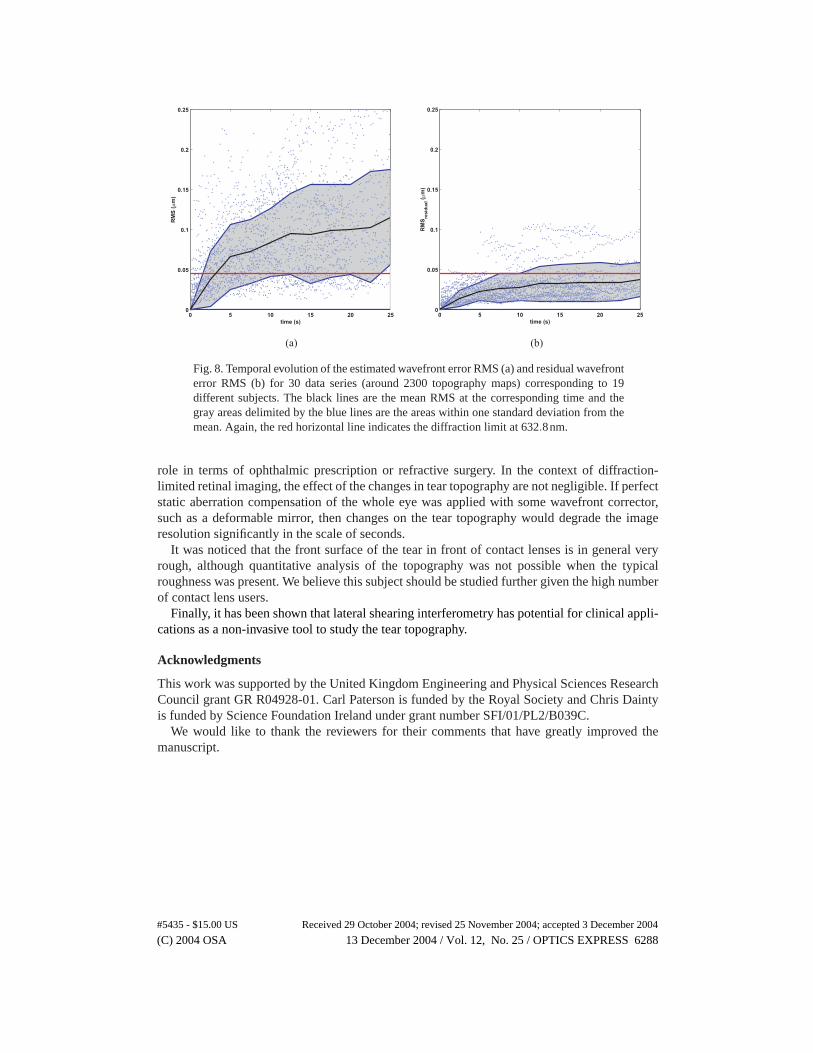
We now consider the temporal behavior of the RMS. Figure 8 plots the evolution of estimatedRMS (b) and residual RMS (a) for 30 data series , using approximately 2300 topography mapscorresponding to 19 different subjects. In this figure, the wavefront RMS deviation has beencalculated relative to the first topography map of the series. The residual RMS stays below the
(C) 2004 OSA 13 December 2004 / Vol. 12, No. 25 / OPTICS EXPRESS 6286#5435 - $15.00 US Received 29 October 2004; revised 25 November 2004; accepted 3 December 2004
no blink blink contact lens on
cp1 cp2 cp3 cw1 jm1 jm2 jn1 kg2 kh4 pb3 sc3 sj1 cw2 cw3 jp2 sc2 st3 te4 im1 fr1 fr2 fr30
0.05
0.1
am
pli
tud
e ( m
)µ
0.3
0.5
0.1
0.2
0.4
0.2
0.3
0.2
0.1
0.1
0.2
0.2
0.3
0.1
0.2
0.40.3
0.2
0.1
0.3
0.3
0.4
0.5
0.2
0.5
0.2
0.4
0.1 0.7
0.6
0.4
0.3
0.3
0.3
0.2
0.2
0.2
0.2
0.4
0.6
0.5
0.1
0.2
0.3
RMSresidual
RMS
Fig. 7. Mean RMS and residual RMS over the data series corresponding to time intervalsof 30s. The red horizontal line shows the diffraction limit (λ = 632.8nm). The data isseparated in three groups: on the left (light gray background) are the series in which therewere no blinks during the data recording; in the center are series in which there was at leastone blink and on the right (dark gray) we show the series in which the subject was wearingcontact lenses at the time of the experiment. The numbers on top of the error bars are thethe maximum correlation coefficient between the corresponding RMS and the eye and headmovement.
diffraction limit even for periods up to 25 seconds (the average blink rate is approximately 1every 5 seconds [9]). If we now look at the RMS including defocus and astigmatism, we findthat (ignoring the eye movement effects), it remains around twice the diffraction limit. This isinteresting in the context of wavefront sensing for refractive surgery, because it shows that theeffect of the tear topography dynamics is negligible. Defocus with λ /14 RMS over an 8mmdiameter pupil corresponds to 1/50D, which is 25 times smaller that the typical resolution usedin spectacles prescription.
However, for adaptive optics for high resolution retinal imaging or psychophysical experi-ments on individual photoreceptors, even though the degradation of the optical quality of theeye is not very significant, it is by no means negligible. Again, the results obtained here areconsistent with Roorda’s experience [21] with static wavefront correction on a scanning laserophthalmoscope (SLO), where he reported some image resolution degradation when trying toresolve photoreceptors after preventing the blink for a few seconds while having accommoda-tion paralyzed.
7. Conclusions
A shearing interferometer for evaluating the dynamics of the front surface of the pre-cornealtear film was tested on 21 subjects. The issue of eye movement, so far ignored in other refer-ences [9, 17, 22], is raised and its impact is briefly discussed, noticing that further studies areneeded.
The estimated amplitudes of the wavefront RMS introduced by the tear dynamics undernormal conditions (i.e., no break-up or contact lenses) are comparable to or smaller than thediffraction limit according to Marechal’s criterion, and are consistent with the RMS variabilitymeasurements reported for full wavefront sensors in the eye [1, 3, 7, 8]. These results thensuggest that the tear topography dynamics under normal conditions does not play a significant
(C) 2004 OSA 13 December 2004 / Vol. 12, No. 25 / OPTICS EXPRESS 6287#5435 - $15.00 US Received 29 October 2004; revised 25 November 2004; accepted 3 December 2004
0 5 10 15 20 250
0.05
0.1
0.15
0.2
0.25
time (s)
RM
Sre
sid
ual (µ
m)
0 5 10 15 20 250
0.05
0.1
0.15
0.2
0.25
time (s)
RM
S (µ
m)
(a) (b)
Fig. 8. Temporal evolution of the estimated wavefront error RMS (a) and residual wavefronterror RMS (b) for 30 data series (around 2300 topography maps) corresponding to 19different subjects. The black lines are the mean RMS at the corresponding time and thegray areas delimited by the blue lines are the areas within one standard deviation from themean. Again, the red horizontal line indicates the diffraction limit at 632.8nm.
role in terms of ophthalmic prescription or refractive surgery. In the context of diffraction-limited retinal imaging, the effect of the changes in tear topography are not negligible. If perfectstatic aberration compensation of the whole eye was applied with some wavefront corrector,such as a deformable mirror, then changes on the tear topography would degrade the imageresolution significantly in the scale of seconds.
It was noticed that the front surface of the tear in front of contact lenses is in general veryrough, although quantitative analysis of the topography was not possible when the typicalroughness was present. We believe this subject should be studied further given the high numberof contact lens users.
Finally, it has been shown that lateral shearing interferometry has potential for clinical appli-cations as a non-invasive tool to study the tear topography.
Acknowledgments
This work was supported by the United Kingdom Engineering and Physical Sciences ResearchCouncil grant GR R04928-01. Carl Paterson is funded by the Royal Society and Chris Daintyis funded by Science Foundation Ireland under grant number SFI/01/PL2/B039C.
We would like to thank the reviewers for their comments that have greatly improved themanuscript.
(C) 2004 OSA 13 December 2004 / Vol. 12, No. 25 / OPTICS EXPRESS 6288#5435 - $15.00 US Received 29 October 2004; revised 25 November 2004; accepted 3 December 2004