study on mark-to-market accounting - sec.gov · pdf filestatements of financial accounting...
TRANSCRIPT
Report and Recommendations Pursuant to Section 133 of the Emergency Economic Stabilization
Act of 2008: Study on Mark-To-Market Accounting
OFFICE OF THE CHIEF ACCOUNTANT DIVISION OF CORPORATION FINANCE
UNITED STATES SECURITIES AND EXCHANGE COMMISSION
This is a report by the Staff of the U.S. Securities and Exchange Commission. The Commission has expressed no view regarding the analysis, findings, or conclusions
contained herein.


i
TABLE OF CONTENTS
Commonly-Used Abbreviations viii Executive Summary 1 I. Introduction 11
A. How this Study Fulfills the Statutory Mandate 11 1. Statutory Mandate 11 2. Context for this Study 11 3. Approach to this Study 12 4. Structure of this Study 14 B. The Financial Reporting Framework 15 1. Balance Sheet 16 2. Income Statement 17 3. Other Basic Financial Statements 18
4. Notes to the Financial Statements, Management’s Discussion and Analysis of Financial Condition and Results of Operations, and Other Disclosures 19
C. Other Considerations 20
1. Role of Accounting in Prudential Oversight 20 2. International Considerations 20
D. Background Information on Fair Value Accounting 22 1. Definition of Fair Value 22 a. U.S. GAAP 22 b. IFRS 23 2. Application of Fair Value Accounting 24 a. How Fair Value Impacts Accounting for Financial Instruments 25 i. U.S. GAAP 25 ii. IFRS 31
b. How Fair Value Impacts Accounting for Non-Financial Instruments 32 i. U.S. GAAP 32 ii. IFRS 33
3. Historical Context for Fair Value Accounting 34 4. Other Measurement Bases 38
a. Description of Other Measurement Bases 38 b. Consideration of Measurement Attributes 40
ii
II. Effects of Fair Value Accounting Standards on Financial Institutions’ Balance Sheets 43 A. Methodology for Studying Effects of Fair Value Accounting Standards 43
B. Empirical Findings from this Study on Effects of Fair Value Accounting Standards 45
1. Assets 46 a. Significance of Assets Measured at Fair Value 46 i. Percentage of Assets Measured at Fair Value 46
ii. Percentage of Assets Measured at Fair Value through Income 49
iii. Distribution of Issuers by Percentage of Assets Measured at Fair Value 52
iv. Use of Fair Value Option 54 v. Comparison of Percentage of Assets Measured at Fair
Value Before and After Adoption of SFAS No. 157 and SFAS No. 159 57
b. Nature of Assets Measured at Fair Value on a Recurring Basis 58 c. Classification of Assets in Fair Value Hierarchy 60
i. Fair Value Hierarchy Classification over Time 61 ii. Distribution of Issuers by Percentage of Assets
Classified as Level 3 63
2. Liabilities 65 a. Significance of Liabilities Measured at Fair Value 65 i. Percentage of Liabilities Measured at Fair Value 65
ii. Distribution of Issuers by Percentage of Liabilities Measured at Fair Value 68
iii. Use of Fair Value Option 70 iv. Comparison of Percentage of Liabilities Measured at
Fair Value Before and After Adoption of SFAS No. 157 and SFAS No. 159 72
b. Nature of Liabilities Measured at Fair Value on a Recurring
Basis 74 c. Classification of Liabilities in Fair Value Hierarchy 75
i. Fair Value Hierarchy Classification over Time 75 ii. Distribution of Issuers by Percentage of Liabilities
Classified as Level 3 78
3. Equity 79 a. SFAS No. 157 Adoption 79 b. SFAS No. 159 Adoption 82 c. Accumulated Other Comprehensive Income 84
iii
4. Income Statement 86
a. Recurring Fair Value Measurements 87 i. Recurring Mark-to-Market Adjustments 87
ii. Level 3 Fair Value Measurements 89 iii. Impact of Changes in Creditworthiness in Measuring
Liabilities 91
b. Non-Recurring Fair Value Measurements (Impairments) 92 i. All Impairments 92
ii. Other-than-Temporary Impairments on Securities 93 iii. Goodwill Impairment 94
c. Key Income Statement Drivers Unrelated to Fair Value
Measurements 94
d. Conclusions 95 III. Impact of Fair Value Accounting on Bank Failures in 2008 97
A. Methodology for Studying Bank Failures 97 B. Regulatory Framework Governing Bank Failures 99
1. Capital Adequacy Guidelines 99 2. Reported Capital Status for 2008 Failed Banks 101
C. How Fair Value Accounting Affects Reporting under U.S. GAAP for Banks 104
1. Aggregate Failed Banks < $1 Billion of Total Assets 105 2. Aggregate Failed Banks > $1 Billion, but < $10 Billion of Total
Assets 107
3. Failed Banks > $10 Billion of Total Assets 109 a. Washington Mutual 109 b. IndyMac 111 c. Downey Savings and Loan 113
D. Interaction Between Regulatory Capital and U.S. GAAP 114 E. Analysis of Causes of Declines in Failed Bank Capital 117
1. Aggregate Failed Banks < $1 Billion of Total Assets 118 2. Aggregate Failed Banks > $1 Billion, but < $10 Billion of Total
Assets 119
3. Failed Banks > $10 Billion of Total Assets 120 a. Washington Mutual 121

iv
b. IndyMac 123 c. Downey Savings and Loan 125
F. Evaluation of the Circumstances Surrounding Each Bank Failure 125
1. Failed Banks < $1 Billion of Total Assets 126 2. Failed Banks > $1 Billion, but < $10 Billion of Total Assets 128 3. Failed Banks > $10 Billion of Total Assets 130
a. Washington Mutual 133 b. IndyMac 134 c. Downey Savings and Loan 135
G. Impact of Fair Value Accounting on Other Distressed Financial Institutions 136
IV. Impact of Fair Value Accounting on the Quality of Financial Information Available to Investors 139 A. Investor and User Views About the Use of Fair Value Measurements 139
1. Comment Letters and Other Public Statements 139 a. Representative Survey of Comment Letters 140 b. Other Public Statements 143 c. Observations 144 2. Common Themes in Individual Analyst Reports on Fair Value
Measurements 145
B. Views Presented by Participants at Recent SEC Fair Value Roundtables 146 1. July 9 Roundtable 146
a. Usefulness of Fair Value and Related Disclosures in Current Market Conditions 146
b. Application of Fair Value Accounting 147 c. Market Behavior Effects of Fair Value Accounting 147 d. Impact of Non-Performance Risk on Fair Value of Liabilities 148
2. October 29 Roundtable 148 a. Usefulness of Fair Value Accounting 148 b. Market Behavior Effects of Fair Value Accounting 149 c. Application of Fair Value Accounting 149 d. Interaction with Regulatory Capital Requirements 149 e. Potential Changes to Financial Statement Presentation 150
3. November 21 Roundtable 150 a. Usefulness of Fair Value Information 150 b. Asset Impairment Guidance and Estimates of Fair Value 150 c. Financial Statement Presentation 151 d. Additional Disclosures 151

v
C. Recent Advisory Committee Recommendations Related to Fair Value
Measurements 151 D. Prior Published Staff Views on Fair Value Accounting 153 E. Abstract of Available Academic Studies Addressing the Impact of Fair Value
Accounting on the Quality of Information Available to Investors 154 V. Process Used by the FASB in Developing Accounting Standards 157 A. Background and Mission 157 B. Governance and Structure 158 C. Standard-Setting Process 159
1. How Topics Are Added to the FASB’s Technical Agenda and Developed 160
2. Accessibility of Meetings 162 3. Public Exposure of Standards 162 4. Further Deliberation by the FASB 162 5. Statements of Financial Accounting Standards 163 6. Additional Due Process 163 a. Resource Groups 163 b. Other Due Process 163 7. Statements of Financial Accounting Concepts 164 8. Other Documents 164 9. Emerging Issues Task Force 165 10. Public Record 165
D. Recent Activities with Respect to FASB Governance and Process 165 E. FASB’s Interaction with the IASB 168 VI. Alternatives to Fair Value Accounting Standards 169
A. Impact of a Suspension of SFAS No. 157 169 B. Recent Proposals Regarding Measurement Attributes 172
vi
1. Broader Issues Related to Identifying Appropriate Measurement Bases 173
a. Past versus Current Values 175 b. Measurement Methods Within Past or Current Values 177
2. Concepts and Themes Underlying Recent Proposals 178 a. Theme 1 – Modify Fair Value (For Example, Return to Historical
Cost) 179 b. Theme 2 – Modify What is Considered to be a Current Value
Measure 186
C. Auditing Standards 188
VII. Advisability and Feasibility of Modifications to Fair Value Accounting Standards 191 A. Financial Reporting Responses to Global Economic Crisis 192
1. SEC Division of Corporation Finance “Dear CFO” Letters 192 2. SEC / FASB Staff Clarifications on Fair Value Measurements 192 3. IASB Expert Advisory Panel 192 4. IASB Fair Value Disclosures 193 5. IASB Amendments to IAS 39 and IFRS 7 193 6. Other-than-Temporary Impairment 193 7. Advisory Group on Financial Reporting Issues Arising from Global
Economic Crisis 194 8. G-20 Summit on Financial Markets and the World Economy 194 9. FASB / IASB Roundtables on Global Financial Crisis 195 10. Proposed FASB Staff Position on Amendments to EITF Issue No.
99-20 195 11. Project on Disclosures for Certain Financial Instruments 195 12. FASB Project on Recoveries of Other-than-Temporary Impairments
(Reversals) 196
B. Current Projects 196 1. Conceptual Framework Project 196 2. Financial Statement Presentation Project 197
a. Segregation of Activities 198 b. Reconciliation of Cash Flow to Comprehensive Income 198 c. Disaggregation of Assets / Liabilities Measured on Different
Bases 198 3. Reducing Complexity in Reporting Financial Instruments 199 4. Insurance Contracts Project 199
5. IASB’s Fair Value Measurement Project 200

vii
C. Recommendations and Related Key Findings 200 1. Recommendation – SFAS No. 157 Should Be Improved, but Not
Suspended 200 2. Recommendation – Existing Fair Value and Mark-to-Market
Requirements Should Not Be Suspended 201 3. Recommendation – Additional Measures Should Be Taken to
Improve the Application of Existing Fair Value Requirements 202 4. Recommendation – The Accounting for Financial Asset Impairments
Should be Readdressed 204 5. Recommendation – Implement Further Guidance to Foster the Use
of Sound Judgment 205 6. Recommendation – Accounting Standards Should Continue to Be
Established to Meet the Needs of Investors 206 7. Recommendation – Additional Formal Measures to Address the
Operation of Existing Accounting Standards in Practice Should Be Established 206
8. Recommendation – Address the Need to Simplify the Accounting for Investments in Financial Assets 208
Appendices 211
A. Summary of Comment Letters Received as Input to this Study B. Participants in SEC Roundtables on Fair Value Accounting C. Illustration of Revised Financial Statement Presentation to Segregate Amounts by
Measurement Attributes, as Proposed by CIFiR D. FASB and FAF Members (2008)
viii
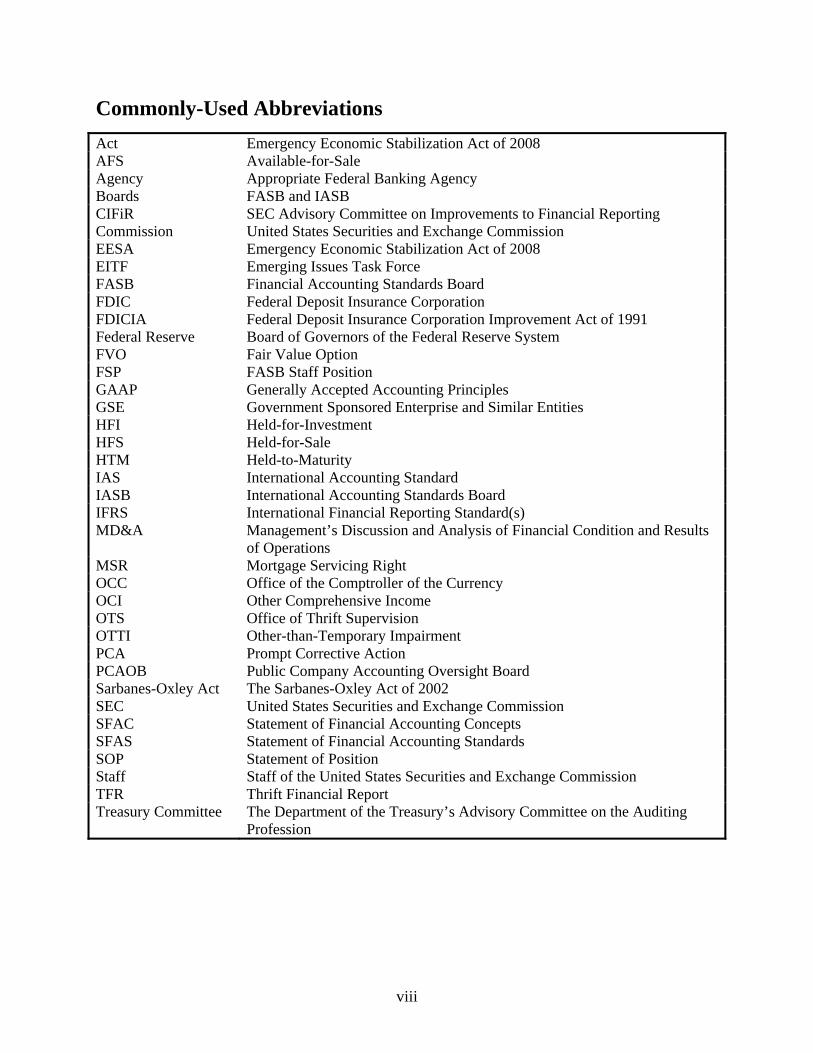
Commonly-Used Abbreviations Act Emergency Economic Stabilization Act of 2008 AFS Available-for-Sale Agency Appropriate Federal Banking Agency Boards FASB and IASB CIFiR SEC Advisory Committee on Improvements to Financial Reporting Commission United States Securities and Exchange Commission EESA Emergency Economic Stabilization Act of 2008 EITF Emerging Issues Task Force FASB Financial Accounting Standards Board FDIC Federal Deposit Insurance Corporation FDICIA Federal Deposit Insurance Corporation Improvement Act of 1991 Federal Reserve Board of Governors of the Federal Reserve System FVO Fair Value Option FSP FASB Staff Position GAAP Generally Accepted Accounting Principles GSE Government Sponsored Enterprise and Similar Entities HFI Held-for-Investment HFS Held-for-Sale HTM Held-to-Maturity IAS International Accounting Standard IASB International Accounting Standards Board IFRS International Financial Reporting Standard(s) MD&A Management’s Discussion and Analysis of Financial Condition and Results
of Operations MSR Mortgage Servicing Right OCC Office of the Comptroller of the Currency OCI Other Comprehensive Income OTS Office of Thrift Supervision OTTI Other-than-Temporary Impairment PCA Prompt Corrective Action PCAOB Public Company Accounting Oversight Board Sarbanes-Oxley Act The Sarbanes-Oxley Act of 2002 SEC United States Securities and Exchange Commission SFAC Statement of Financial Accounting Concepts SFAS Statement of Financial Accounting Standards SOP Statement of Position Staff Staff of the United States Securities and Exchange Commission TFR Thrift Financial Report Treasury Committee The Department of the Treasury’s Advisory Committee on the Auditing
Profession

1
Executive Summary On October 3, 2008, the Emergency Economic Stabilization Act of 2008 (“EESA” or the “Act”) was signed into law.1 Section 133 of the Act mandates that the U.S. Securities and Exchange Commission (the “SEC” or “Commission”) conduct, in consultation with the Board of Governors of the Federal Reserve System (“Federal Reserve”) and the Secretary of the Treasury, a study on mark-to-market accounting standards as provided by Financial Accounting Standards Board (“FASB”) Statement of Financial Accounting Standards (“SFAS”) No. 157, Fair Value Measurements (“SFAS No. 157”).2 As discussed further in this study, SFAS No. 157 does not itself require mark-to-market or fair value accounting. Rather, other accounting standards in various ways require what is more broadly known as “fair value” accounting, of which mark-to-market accounting is a subset. SFAS No. 157 defines fair value, establishes a framework for measuring fair value in U.S. generally accepted accounting principles (“GAAP”), and requires expanded disclosures about fair value measurements. However, to ensure that this study was responsive to the policy debate discussed below, for purposes of this study the SEC Staff (the “Staff”) considered the issue of fair value accounting in this larger context, including both mark-to-market accounting and SFAS No. 157. The events leading up to the Congressional call for this study illustrated the need for identifying and understanding the linkages that exist between fair value accounting standards and the usefulness of information provided by financial institutions. In the months preceding passage of the Act, some asserted that fair value accounting, along with the accompanying guidance on measuring fair value under SFAS No. 157, contributed to instability in our financial markets. According to these critics, fair value accounting did so by requiring what some believed were potentially inappropriate write-downs in the value of investments held by financial institutions, most notably due to concerns that such write-downs were the result of inactive, illiquid, or irrational markets that resulted in values that did not reflect the underlying economics of the securities. These voices pointed out the correlation between U.S. GAAP reporting and the regulatory capital requirements of financial institutions, highlighting that this correlation could lead to the failure of long-standing financial institutions if sufficient additional capital is unavailable to offset investment write-downs. Further, they believed the need to raise additional capital, the effect of failures, and the reporting of large write-downs would have broader negative impact on markets and prices, leading to further write-downs and financial instability. Just as vocal were other market participants, particularly investors, who stated that fair value accounting serves to enhance the transparency of financial information provided to the public. These participants indicated that fair value information is vital in times of stress, and a suspension of this information would weaken investor confidence and result in further instability in the markets. These participants pointed to what they believe are the root causes of the crisis, namely poor lending decisions and inadequate risk management, combined with shortcomings in the current approach to supervision and regulation, rather than accounting. Suspending the use 1 Pub. L. No. 110-343, Division A. 2 See Section 133(a) of the Act.

2
of fair value accounting, these participants warned, would be akin to “shooting the messenger” and hiding from capital providers the true economic condition of a financial institution. These participants noted that they were aware of the arguments about the correlation between U.S. GAAP reporting and the regulatory capital requirements of financial institutions. However, they pointed out that adjustments to the calculation of regulatory capital, like those adjustments currently in place for “available-for-sale” (“AFS”) securities, can be made to reduce this correlation where appropriate.3 As the debate intensified in late September of 2008, SEC Staff and the FASB staff issued a joint press release clarifying the application of SFAS No. 157.4 This joint release clarified the measurement of fair value when an active market for a security does not exist. On October 10, 2008, the FASB issued FASB Staff Position (“FSP”) 157-3, Determining the Fair Value of a Financial Asset When the Market for That Asset Is Not Active (“FSP FAS 157-3”), which further clarified the application of fair value measurements. Currently, the debate over fair value measurements extends beyond national borders and is being considered internationally by the International Accounting Standards Board (the “IASB”), the standard-setting body for international financial reporting standards (“IFRS”), and other global market participants. To coordinate international efforts, and address issues such as fair value measurements that have arisen from the global economic crisis, the IASB and FASB (the “Boards”) created a global advisory group comprising regulators, preparers, auditors, and investors. As a result of both domestic and international concern, it has become clear that a careful and thoughtful consideration of all competing viewpoints is necessary to determine what further action may be appropriate. The credibility and experience of parties on both sides of this debate demand careful attention to their points and counterpoints on the effects of fair value accounting on financial markets. Moreover, a broader understanding of the prevalence of fair value accounting relative to other measures of fair value that do not immediately impact a financial institution’s income or capital requirements is needed to narrow the issues to those most relevant to the debate. For many years, accounting standards have required measurement of financial instruments on a financial institution’s balance sheet at fair value. In some cases, for example when securities are actively traded, changes in fair value are required to be recognized in the income statement. This is the specific meaning of “mark-to-market” accounting. However, in most other cases, such changes in fair value are generally reported in other comprehensive income (“OCI”) or equity, and these changes do not flow through to income unless an impairment has occurred.
3 AFS securities are measured at fair value on a financial institution’s balance sheet with changes in fair value generally reported in a balance sheet line called accumulated other comprehensive income, or equity. The Staff understands that changes in fair value reported in other comprehensive income or equity are generally excluded from regulatory capital ratios. On the other hand, consistent with safety and soundness objectives, losses on assets that are reflected in income and retained earnings in accordance with U.S. GAAP are generally recognized in regulatory capital. 4 See “SEC Office of the Chief Accountant and FASB Staff Clarifications on Fair Value Accounting,” SEC Press Release No. 2008-234 (September 30, 2008).
3
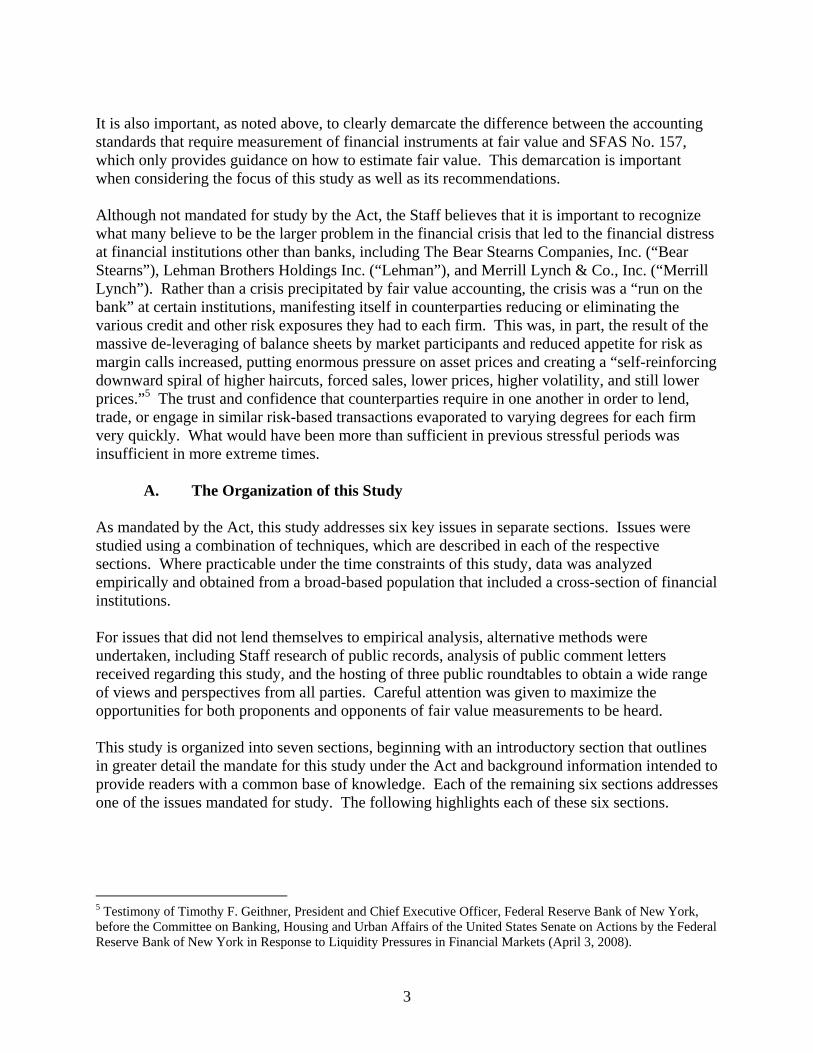
It is also important, as noted above, to clearly demarcate the difference between the accounting standards that require measurement of financial instruments at fair value and SFAS No. 157, which only provides guidance on how to estimate fair value. This demarcation is important when considering the focus of this study as well as its recommendations. Although not mandated for study by the Act, the Staff believes that it is important to recognize what many believe to be the larger problem in the financial crisis that led to the financial distress at financial institutions other than banks, including The Bear Stearns Companies, Inc. (“Bear Stearns”), Lehman Brothers Holdings Inc. (“Lehman”), and Merrill Lynch & Co., Inc. (“Merrill Lynch”). Rather than a crisis precipitated by fair value accounting, the crisis was a “run on the bank” at certain institutions, manifesting itself in counterparties reducing or eliminating the various credit and other risk exposures they had to each firm. This was, in part, the result of the massive de-leveraging of balance sheets by market participants and reduced appetite for risk as margin calls increased, putting enormous pressure on asset prices and creating a “self-reinforcing downward spiral of higher haircuts, forced sales, lower prices, higher volatility, and still lower prices.”5 The trust and confidence that counterparties require in one another in order to lend, trade, or engage in similar risk-based transactions evaporated to varying degrees for each firm very quickly. What would have been more than sufficient in previous stressful periods was insufficient in more extreme times.
A. The Organization of this Study As mandated by the Act, this study addresses six key issues in separate sections. Issues were studied using a combination of techniques, which are described in each of the respective sections. Where practicable under the time constraints of this study, data was analyzed empirically and obtained from a broad-based population that included a cross-section of financial institutions. For issues that did not lend themselves to empirical analysis, alternative methods were undertaken, including Staff research of public records, analysis of public comment letters received regarding this study, and the hosting of three public roundtables to obtain a wide range of views and perspectives from all parties. Careful attention was given to maximize the opportunities for both proponents and opponents of fair value measurements to be heard. This study is organized into seven sections, beginning with an introductory section that outlines in greater detail the mandate for this study under the Act and background information intended to provide readers with a common base of knowledge. Each of the remaining six sections addresses one of the issues mandated for study. The following highlights each of these six sections.
5 Testimony of Timothy F. Geithner, President and Chief Executive Officer, Federal Reserve Bank of New York, before the Committee on Banking, Housing and Urban Affairs of the United States Senate on Actions by the Federal Reserve Bank of New York in Response to Liquidity Pressures in Financial Markets (April 3, 2008).

4
1. Effects of Fair Value Accounting Standards on Financial Institutions’ Balance Sheets
This section explores the effects of fair value accounting standards on financial institutions’ balance sheets. In the debate concerning fair value accounting, some assert that accounting standards that require fair value accounting may inappropriately affect the balance sheets of financial institutions. This section studies those concerns by analyzing a sample of fifty financial institutions that were selected from a broad-based population of financial institutions in our markets. The effects of fair value accounting standards on each financial institution was studied to gauge the prevalence of assets measured at fair value on the balance sheet and the subset of those assets that are also marked-to-market through the income statement. This study also evaluated, among other items, the level within SFAS No. 157’s fair value hierarchy in which assets fell.6 Information was analyzed by type of financial institution to draw out common characteristics and dissimilarities that may exist within each industry type. From the sample of financial institutions studied in this section of the study, the Staff observed that fair value measurements were used to measure a minority of the assets (45%) and liabilities (15%) included in financial institutions’ balance sheets. The percentage of assets for which changes in fair value affected income was significantly less (25%), reflecting the mark-to-market requirements for trading and derivative investments. However, for those same financial institutions, the Staff observed that fair value measurements did significantly affect financial institutions’ reported income.
2. Impact of Fair Value Accounting on Bank Failures in 2008 This section analyzes possible linkages between fair value accounting and bank failures occurring during 2008. Some have asserted that fair value accounting contributed to the failure of one, or more, financial institutions during 2008. For purposes of studying this issue, banks were grouped based on asset size. Within each group, this study evaluated banks’ use of fair value measurements over time by analyzing data over a period of three years. The Staff also analyzed the key drivers of regulatory capital to evaluate the impact of fair value measurements on capital adequacy relative to other factors, such as incurred losses on loans. The Staff observes that fair value accounting did not appear to play a meaningful role in bank failures occurring during 2008. Rather, bank failures in the U.S. appeared to be the result of growing probable credit losses, concerns about asset quality, and, in certain cases, eroding lender and investor confidence. For the failed banks that did recognize sizable fair value losses, it does not appear that the reporting of these losses was the reason the bank failed. 6 SFAS No. 157’s fair value hierarchy prioritizes the inputs to valuation techniques used to measure fair value into three broad levels. The fair value hierarchy gives the highest priority to unadjusted quoted prices in active markets (Level 1) and the lowest priority to unobservable inputs (Level 3).

5
3. Impact of Fair Value Accounting on the Quality of Financial Information Available to Investors
This section describes investors’ views related to the usefulness of fair value accounting. Proponents of fair value accounting assert the importance of such concepts to the transparency of financial information provided to investors. To evaluate those assertions, the Staff considered how fair value accounting and fair value measurements are used by investors. The Staff considered a broad spectrum of investor perspectives, including those focused on both debt and equity analysis. The sources of information included Staff research of published investor views, analysis of comment letters received by the Commission on this topic, and consideration of the views expressed during a series of three roundtables hosted by the Commission. In addition, the Staff surveyed academic research on the topic and the conclusions of two recent federal advisory committees that addressed fair value accounting as part of their respective mandates. The Staff’s research on this issue reflects that, based on these sources, investors generally support measurements at fair value as providing the most transparent financial reporting of an investment, thereby facilitating better investment decision-making and more efficient capital allocation amongst firms. While investors generally expressed support for existing fair value requirements, many also indicated the need for improvements to the application of existing standards. Improvements to the impairment requirements, application in practice of SFAS No. 157 (particularly in times of financial stress), fair value measurement of liabilities, and improvements to the related presentation and disclosure requirements of fair value measures were cited as areas warranting improvement.
4. Process Used by the FASB in Developing Accounting Standards This section outlines the independent accounting standard-setting process in the U.S. A key aspect of this study mandates consideration of the viability and feasibility of modifications to accounting standards that require fair value accounting. To properly understand the viability and feasibility of such modifications, a complete understanding of how accounting standards are developed and promulgated is important. The Staff’s analysis of the FASB’s processes used to develop accounting standards reaffirms that an independent accounting standard-setter is best positioned to develop neutral and unbiased accounting guidance. The Staff believes that while the FASB’s process works well for this purpose, there are several steps that could be taken to enhance the existing procedures. These recommendations include steps that could enhance the timeliness and transparency of the process. For example, to be responsive to the need to timely identify and address challenges encountered in the application of standards in practice, key participants in the capital markets need to communicate and understand these challenges as they arise. To facilitate the more timely identification and resolution of issues, the Staff believes that it is advisable to move quickly to implement the recommendation of the SEC Advisory Committee on Improvements to Financial Reporting (“CIFiR”) related to the creation of a financial reporting forum (“FRF”).

6
5. Alternatives to Fair Value Accounting Standards This section examines the potential alternatives to fair value measurements. During the recent debate leading to the mandate for this study, some have considered the feasibility of suspending SFAS No. 157. This section first addresses the specific consequences of suspending the guidance in SFAS No. 157, which would not itself change fair value accounting requirements, but rather remove the currently operative guidance for implementation. This section also discusses whether it would be prudent to modify the guidance on fair value measurements that currently exists. This section also examines consideration of a suspension of fair value accounting itself, including the positives and negatives of available alternatives, such as historical cost-based measures. Valuable insights and thoughts for this section were obtained through review of academic research, comment letters received on this study, and also from the perspectives of participants at the three public roundtables hosted by the Commission. Through its study of this issue, the Staff found that suspending SFAS No. 157 itself would only lead to a reversion of practice, resulting in inconsistent and sometimes conflicting guidance on fair value measurements. As to alternatives to fair value accounting, while such alternative measurement bases exist, each alternative exhibits strengths and weaknesses, as well as implementation issues. Considering evidence regarding the usefulness of fair value information to investors, the suspension of fair value accounting to return to historical cost-based measures would likely increase investor uncertainty. However, given the significant challenges encountered in practice related to implementing existing standards, additional actions to improve the application and understanding of fair value requirements are advisable. Such additional measures to improve the application should include addressing the need for additional guidance for determining fair value in inactive markets (including examining the impact of illiquidity), assessing whether the incorporation of credit risk in fair value measurement of liabilities provides useful information to investors, and enhancing existing presentation and disclosure requirements. One of the most significant concerns expressed regarding existing fair value standards is the current state of accounting for impairments. Currently there are multiple different models applied in practice for determining when to record an impairment for investments in securities. Additionally, existing impairment guidelines for securities are not consistent with the reporting guidelines for impairment charges for other non-securitized investments (e.g., direct investments in loans). Accordingly, investors are provided information that is not recognized, calculated, or reported on a comparable basis. Further, under existing presentation requirements, investors are often not provided sufficient information to fully assess whether declines in value are related to changes in liquidity or whether declines relate to probable credit losses. In addition, subsequent increases in value generally are not reflected in income until the security is sold. The Staff believes that the existing impairment standards should be readdressed with the goal of improving the utility of information available to investors.
7
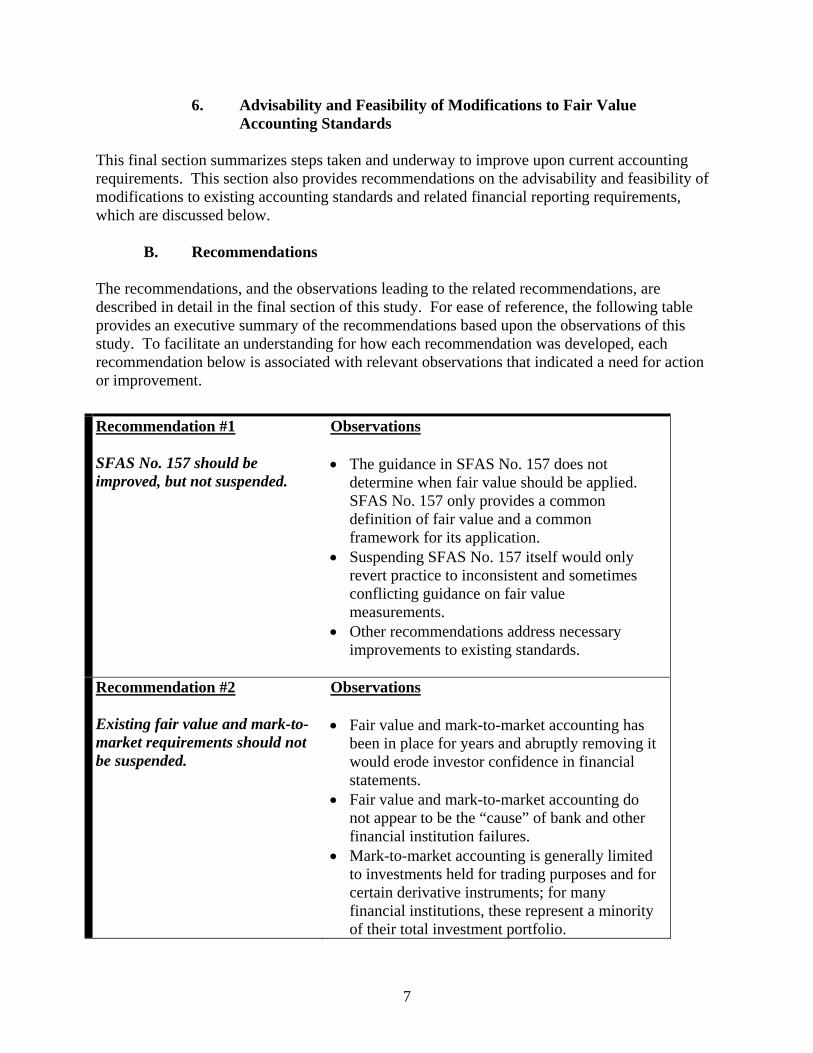
6. Advisability and Feasibility of Modifications to Fair Value Accounting Standards
This final section summarizes steps taken and underway to improve upon current accounting requirements. This section also provides recommendations on the advisability and feasibility of modifications to existing accounting standards and related financial reporting requirements, which are discussed below.
B. Recommendations The recommendations, and the observations leading to the related recommendations, are described in detail in the final section of this study. For ease of reference, the following table provides an executive summary of the recommendations based upon the observations of this study. To facilitate an understanding for how each recommendation was developed, each recommendation below is associated with relevant observations that indicated a need for action or improvement. Recommendation #1 SFAS No. 157 should be improved, but not suspended.
Observations • The guidance in SFAS No. 157 does not
determine when fair value should be applied. SFAS No. 157 only provides a common definition of fair value and a common framework for its application.
• Suspending SFAS No. 157 itself would only revert practice to inconsistent and sometimes conflicting guidance on fair value measurements.
• Other recommendations address necessary improvements to existing standards.
Recommendation #2 Existing fair value and mark-to-market requirements should not be suspended.
Observations • Fair value and mark-to-market accounting has
been in place for years and abruptly removing it would erode investor confidence in financial statements.
• Fair value and mark-to-market accounting do not appear to be the “cause” of bank and other financial institution failures.
• Mark-to-market accounting is generally limited to investments held for trading purposes and for certain derivative instruments; for many financial institutions, these represent a minority of their total investment portfolio.

8
• Over 90% of investments marked-to-market are valued based on observable inputs, such as market quotes obtained from active markets.
• Investors generally agree that fair value accounting provides meaningful and transparent financial information, though improvements are desirable.
Recommendation #3 While the Staff does not recommend a suspension of existing fair value standards, additional measures should be taken to improve the application and practice related to existing fair value requirements (particularly as they relate to both Level 2 and Level 3 estimates).
Observations • Fair value requirements should be improved
through development of application and best practices guidance for determining fair value in illiquid or inactive markets. This includes consideration of additional guidance regarding: o How to determine when markets become
inactive o How to determine if a transaction or group of
transactions is forced or distressed o How and when illiquidity should be
considered in the valuation of an asset or liability, including whether additional disclosure is warranted
o How the impact of a change in credit risk on the value of an asset or liability should be estimated
o When observable market information should be supplemented with and / or reliance placed on unobservable information in the form of management estimates
o How to confirm that assumptions utilized are those that would be used by market participants and not just by a specific entity
• Existing disclosure and presentation requirements related to the effect of fair value in the financial statements should be enhanced.
• FASB should assess whether the incorporation of changes in credit risk in the measurement of liabilities provides useful information to investors, including whether sufficient transparency is provided.
• Educational efforts to reinforce the need for management judgment in the determination of fair value estimates are needed.
• FASB should consider implementing changes to its Valuation Resource Group.

9
Recommendation #4 The accounting for financial asset impairments should be readdressed.
Observations • U.S. GAAP does not provide a uniform model
for assessing impairments. • The prominence of the measure “OCI,” where
certain impairments are disclosed, could be enhanced by requiring its display on the income statement.
• For many financial institutions, financial assets marked-to-market through the income statement represent a minority of their investment portfolio.
• A large portion of financial institutions’ investment portfolios consist of AFS securities or loans, subject to challenging judgments related to impairment, which determines when such losses are reported in the income statement.
• Current impairment standards generally preclude income recognition when securities prices recover until investments are sold.
Recommendation #5 Implement further guidance to foster the use of sound judgment.
Observations • SFAS No. 157 is an objectives-based accounting
standard that relies on sound, reasoned judgment in its application.
• Sound judgment is a platform from which to foster the neutral and unbiased measures of fair value desired by investors.
• Requests have been made for the Commission and the Public Company Accounting Oversight Board (“PCAOB”) to emphasize their support for sound judgment in the application of accounting and auditing standards.
Recommendation #6 Accounting standards should continue to be established to meet the needs of investors.
Observations • Investors, and most others, agree that financial
reporting’s primary purpose is to meet the information needs of investors.
• Most appear to agree that fair value measurements provide useful information to investors, meeting their information needs.
• Beyond meeting the information needs of investors, general-purpose financial reporting has secondary uses that may be of additional
10
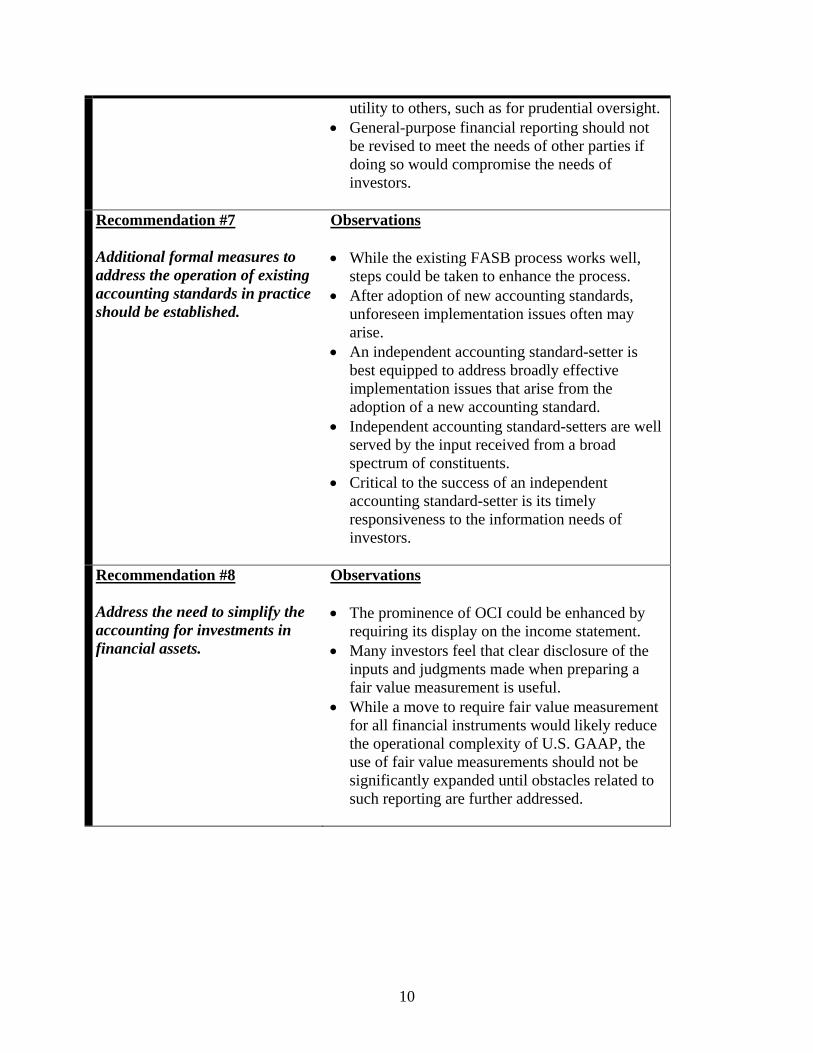
utility to others, such as for prudential oversight. • General-purpose financial reporting should not
be revised to meet the needs of other parties if doing so would compromise the needs of investors.
Recommendation #7 Additional formal measures to address the operation of existing accounting standards in practice should be established.
Observations • While the existing FASB process works well,
steps could be taken to enhance the process. • After adoption of new accounting standards,
unforeseen implementation issues often may arise.
• An independent accounting standard-setter is best equipped to address broadly effective implementation issues that arise from the adoption of a new accounting standard.
• Independent accounting standard-setters are well served by the input received from a broad spectrum of constituents.
• Critical to the success of an independent accounting standard-setter is its timely responsiveness to the information needs of investors.
Recommendation #8 Address the need to simplify the accounting for investments in financial assets.
Observations • The prominence of OCI could be enhanced by
requiring its display on the income statement. • Many investors feel that clear disclosure of the
inputs and judgments made when preparing a fair value measurement is useful.
• While a move to require fair value measurement for all financial instruments would likely reduce the operational complexity of U.S. GAAP, the use of fair value measurements should not be significantly expanded until obstacles related to such reporting are further addressed.
11
I. Introduction A. How this Study Fulfills the Statutory Mandate
1. Statutory Mandate The mandate for this study comes from the Emergency Economic Stabilization Act of 2008, which was signed into law on October 3, 2008. Section 133 of the Act mandates that the SEC conduct, in consultation with the Federal Reserve and the Secretary of the Treasury,
a study on mark-to-market accounting standards as provided in Statement Number 157 of the Financial Accounting Standards Board, as such standards are applicable to financial institutions, including depository institutions. Such a study shall consider at a minimum—
(1) the effects of such accounting standards on a financial institution’s balance sheet;
(2) the impacts of such accounting on bank failures in 2008; (3) the impact of such standards on the quality of financial information available
to investors; (4) the process used by the Financial Accounting Standards Board in developing
accounting standards; (5) the advisability and feasibility of modifications to such standards; and (6) alternative accounting standards to those provided in such Statement Number
157.7
Section 133 of the Act also mandated that the Commission
shall submit to Congress a report of such study before the end of the 90-day period beginning on the date of the enactment of this Act containing the findings and determinations of the Commission, including such administrative and legislative recommendations as the Commission determines appropriate.8
2. Context for this Study
Over the last 12 to 18 months, the world economy has experienced economic conditions that have affected financial and non-financial institutions. What at one time some viewed as an isolated crisis in the subprime mortgage sector has spread to the global economy as a whole. Factors that have been cited as causing or contributing to the current economic crisis include, among others, low interest rates, rapid housing appreciation, alternative mortgage products, relaxed underwriting standards, increased leverage, innovative new investments that were
7 Section 133(a) of the Act. 8 Section 133(b) of the Act.

12
believed to be safer than perhaps warranted, and insufficient regulation.9 While financial institutions are experiencing the brunt of increasing mortgage defaults, housing foreclosures, bank failures, and tighter credit, other industries are experiencing losses, liquidity issues, rapid decreases in market capitalization, layoffs, and lower consumer confidence – all underscored by the National Bureau of Economic Research’s recent announcement that the U.S. has been in a recession since December 2007, which is expected to “likely be the longest, and possibly one of the deepest, since World War II.”10 While analysis of the causes of this crisis is still underway, some believe that fair value accounting standards have contributed to or exacerbated this crisis, arguing that use of fair value accounting, particularly when markets are illiquid, has resulted in the valuing of assets well below their “true economic value.”11 Opponents of fair value accounting also argue that these write-downs have caused a downward spiral, as they have triggered margin and regulatory capital calls, “have forced rapid asset liquidation, exacerbating the loss of value, diminished counterparty confidence, and constrained liquidity.”12 Proponents counter that fair value accounting provides useful information to investors and its suspension would increase market uncertainty and decrease transparency.13 It is in this context that the Staff has performed this study of mark-to-market accounting to fulfill the Congressional mandate.
3. Approach to this Study
In order to fulfill the mandate and produce this study, the Staff has assigned meaning, as described below, to the terms “mark-to-market accounting standards,” “financial institutions,” and “bank failure.” When used in other contexts, these terms may have different definitions or meanings. • For the purposes of this study, the Staff interprets “mark-to-market accounting standards” as
accounting standards under U.S. GAAP that define fair value and / or require or permit fair value measurement in the financial statements with changes reported in income. Accordingly, “mark-to-market accounting standards” include, but are not limited to, SFAS No. 115, Accounting for Certain Investments in Debt and Equity Securities (“SFAS No. 115”); SFAS No. 133, Accounting for Derivative Instruments and Hedging Activities (“SFAS
9 See, e.g., The President’s Working Group on Financial Markets, Policy Statement on Financial Market Developments (March 2008); Robert Herz, Chairman, FASB, Lessons Learned, Relearned, and Relearned Again from the Credit Crisis – Accounting and Beyond (September 18, 2008); and The Financial Stability Forum, Report of the Financial Stability Forum on Enhancing Market and Institutional Resilience (April 7, 2008). 10 “Statement by Chad Stone, Chief Economist, on the November Employment Report,” Center on Budget and Policy Priorities (December 5, 2008). 11 See, e.g., letter from Isaac. Comment letters (“letters”) are available on the Commission’s website (at http://www.sec.gov/comments/4-573/4-573.shtml), and in the Commission’s Public Reference Room in its Washington, DC headquarters. Unless otherwise noted, comment letters in this study are cited by author (using the abbreviations in Exhibit A-1 to the comment summary, which is available at Appendix A to this study) and, if multiple letters were submitted by the same author, also by date. 12 Joyce Joseph-Bell, Ron Joas & Neri Bukspan, Banks: The Fight over Fair Value, BusinessWeek, October 15, 2008. 13 See, e.g., letter from Joint (October 15, 2008).

13
No. 133”); SFAS No. 140, Accounting for Transfers and Servicing of Financial Assets and Extinguishments of Liabilities (“SFAS No. 140”); SFAS No. 155, Accounting for Certain Hybrid Financial Instruments (“SFAS No. 155”); SFAS No. 156, Accounting for Servicing of Financial Assets (“SFAS No. 156”); SFAS No. 157; and SFAS No. 159, The Fair Value Option for Financial Assets and Financial Liabilities (“SFAS No. 159”).
• The term “financial institutions” is defined by the EESA to include public and non-public
banks, insurance companies, and broker-dealers.14 For purposes of Section II, and given the time constraints of this study, the Staff has limited the study sample to public companies, due to the readily available financial data for these entities. The Staff also included credit institutions15 and government-sponsored enterprises and similar entities (“GSEs”),16 as they are additional institutions in the financial sector that may be affected by fair value accounting standards.
• For purposes of Section III of this study, a “bank failure” refers to an insured depository
institution that is closed by the appropriate state or federal chartering authority in accordance with applicable law or regulations or by the appropriate federal banking agency (“Agency”) based on the authority provided under the Federal Deposit Insurance Act,17 entitled Prompt Corrective Action (“PCA”).
In addition, investment companies are subject to different standards than those of non-investment companies.18 Accordingly, the Staff determined those companies to be outside the scope of this study and they are generally not contemplated in the remainder of this study. The methodologies used by the Staff to gather and analyze data for Sections II - VII of this study are described in each of those sections. Broadly, the Staff gathered information for this study through: (1) a review of publicly available financial and other information, (2) consultations with 14 Specifically, Section 3(5) of the Act defines “financial institutions” to mean
…any institution, including, but not limited to, any bank, savings association, credit union, security broker or dealer, or insurance company, established and regulated under the laws of the United States or any State, territory, or possession of the United States, the District of Columbia, Commonwealth of Puerto Rico, Commonwealth of Northern Mariana Islands, Guam, American Samoa, or the United States Virgin Islands, and having significant operations in the United States, but excluding any central bank of, or institution owned by, a foreign government.
15 The Staff refers to establishments primarily engaged in providing loans to individuals as “credit institutions.” Also included in this industry are establishments primarily engaged in financing retail sales made on the installment plan and financing automobile loans for individuals. 16 “GSEs” refers to GSEs and other non-depository credit intermediation institutions that primarily provide federally guaranteed loans. 17 12 U.S.C. 1811 et seq. 18 Investment companies include entities registered under the Investment Company Act of 1940 [15 U.S.C. 80a-1 et seq. (the “Investment Company Act”)] and business development companies. Section 2(a)(41) of the Investment Company Act defines “value” with respect to the assets of registered investment companies and business development companies and generally requires the use of either: (1) market value when market quotations are readily available or (2) fair value, as determined in good faith by the Board of Directors, when market quotations are not readily available.

14
the Federal Reserve and the Department of Treasury, as mandated by the Act, as well as other federal banking regulators and the FASB, (3) a review of relevant academic research on fair value accounting, and (4) a request for public comment19 and a series of three public roundtables20 to obtain constituent views about fair value. Views from commenters that responded to the Staff’s request for public comment and roundtable participants are referenced throughout this study. A summary of comments and commenters is provided in Appendix A to this study. A summary of the public roundtable discussions is presented in Section IV and a list of roundtable participants is provided in Appendix B to this study.
4. Structure of this Study
The remainder of this introductory section contains the following subsections: • Subsection B presents a short primer summarizing the financial reporting framework,
including the basic accounting concepts necessary to understand the issues discussed in this study. Those who are familiar with the financial reporting framework may skip this subsection of the study with no loss of continuity.
• Subsection C presents other considerations, namely the role of accounting in prudential
oversight and international developments, which necessitate consideration throughout this study.
• Subsection D presents background information on fair value accounting, including the
definition of fair value, information about the application of fair value accounting, a historical context for mark-to-market or fair value accounting, and information about other measurement bases used in accounting.
The remainder of this study is generally arranged according to the order of the sections in the legislative mandate, with one exception to facilitate organization: the section describing “Alternatives to Fair Value Accounting Standards” appears before the section describing “Advisability and Feasibility of Modifications to Fair Value Accounting Standards.” Specifically: • Section II of this study is “Effects of Fair Value Accounting Standards on Financial
Institutions’ Balance Sheets.” This section examines the balance sheets of a sample of public financial institutions to analyze total assets and liabilities that were measured at fair value and the extent to which changes in fair value impacted those institutions’ income statements.
• Section III of this study is “Impact of Fair Value Accounting on Bank Failures in 2008.”
This section examines the extent to which public and non-public failed banks applied fair
19 See SEC Release No. 33-8975 (October 8, 2008), SEC Study of Mark to Market Accounting Request for Public Comment. 20 Commission roundtables took place on July 9, 2008 (International Roundtable on Fair Value Accounting Standards), October 29, 2008 (Roundtable on Mark-to-Market Accounting), and November 21, 2008 (Mark-to-Market Accounting Roundtable). (Archived webcasts are available at: http://www.sec.gov/spotlight/fairvalue.htm.)
15
value accounting and whether fair value accounting contributed significantly to their failures. This section also discusses the impact of fair value accounting on other distressed financial institutions.
• Section IV of this study is “Impact of Fair Value Accounting on the Quality of Financial
Information Available to Investors.” This section discusses the views of investors and other financial statement users on the role of fair value accounting and whether it enhances or impairs their understanding of financial information.
• Section V of this study is “Process Used by the FASB in Developing Accounting Standards.”
This section discusses the FASB governance and processes that result in the accounting standards U.S. public companies apply.
• Section VI of this study is “Alternatives to Fair Value Accounting Standards.” This section
examines the potential impact of a suspension of SFAS No. 157 and recent proposals regarding alternatives to fair value accounting.
• Section VII of this study is “Advisability and Feasibility of Modifications to Fair Value
Accounting Standards.” This section outlines current actions taken and projects in process to address and improve existing fair value accounting standards. Further, this section draws upon the analysis and findings of the previous sections of this study and develops a list of recommendations of additional measures to improve fair value accounting and the accounting for financial asset impairments.
B. The Financial Reporting Framework21
The objective of financial reporting is to provide information useful to investors and creditors in their decision-making processes.22 The Commission has responsibilities under the federal securities laws to specify acceptable standards for the preparation of financial statements that provide this financial information.23 The Commission has, for virtually its entire existence, looked to the private sector for assistance in this task. Currently, the body that the Commission looks to for the setting of financial reporting standards for U.S. issuers is the FASB.24 The FASB has promulgated accounting standards in many areas and has also created a conceptual
21 Parts of this section are excerpted, with modifications, from SEC Staff, Report and Recommendations Pursuant to Section 401(c) of the Sarbanes-Oxley Act of 2002 On Arrangements with Off-Balance Sheet Implications, Special Purpose Entities, and Transparency of Filings by Issuers, (“Off-Balance Sheet Report”). (This report is available at: http://www.sec.gov/news/studies/soxoffbalancerpt.pdf.) 22 See Statement of Financial Accounting Concept (“SFAC”) No. 1, Objectives of Financial Reporting by Business Enterprises (“SFAC No. 1”), paragraph 32. 23 See, e.g., Sections 7, 19(a) and Schedule A, Items (25) and (26) of the Securities Act of 1933 (the “Securities Act”), 15 U.S.C. 77g, 77s(a), 77aa(25) and (26); Sections 3(b), 12(b) and 13(b) of the Securities Exchange Act of 1934 (the “Exchange Act”), 15 U.S.C. 78c(b), 78l(b) and 78m(b); and Sections 8, 30(e), 31 and 38(a) of the Investment Company Act, 15 U.S.C. 80a-8, 80a-29(e), 80a-30 and 80a-37(a). 24 See SEC Release No. 33-8221 (April 25, 2003), Policy Statement: Reaffirming the Status of the FASB as a Designated Private-Sector Standard Setter (“2003 Policy Statement”).
16
framework for accounting and financial reporting that it uses in setting accounting standards. However, despite the Commission’s recognition of the FASB’s financial accounting and reporting standards as “generally accepted” for purposes of the federal securities laws, the Commission retains the authority to require U.S. issuers to apply accounting other than that set by the FASB to ensure compliance with the securities laws and the protection of investors.25 Filings by issuers include four main financial statements: the balance sheet, the income statement, the cash flow statement, and the statement of changes in equity.26 Each financial statement provides different types of information, but they are interrelated in that they “reflect different aspects of the same transactions or other events affecting an entity,” as well as complementary in that “none is likely to serve only a single purpose or provide all the financial statement information that is useful for a particular kind of assessment or decision.”27
A complete set of financial statements also includes notes, which disclose quantitative and qualitative information not in the basic four financial statements. Public filings also generally require the inclusion of additional information, including information about the company’s business, the risk factors it faces, and a discussion of its financial condition, results of operations, liquidity, and capital resources.
1. Balance Sheet
Given the topic of this study, the Staff’s primary focus is on the balance sheet and the income statement. The balance sheet portrays an issuer’s financial position at a point in time. Its basic components include: • Assets, which are “probable future economic benefits obtained or controlled by a particular
entity as a result of past transactions or events;”28
• Liabilities, which are “probable future sacrifices of economic benefits arising from present
obligations of a particular entity to transfer assets or provide services to other entities in the future as a result of past transactions or events;”29
and
• Equity, which is “the residual interests in the assets of an entity that remains after deducting its liabilities.”30
Under current accounting standards in the U.S., the items that are recorded on the balance sheet are valued or measured using different measurement bases or attributes. This use of different
25 See, e.g., Sections 3(c) and 108(c) of the Sarbanes-Oxley Act of 2002 (the “Sarbanes-Oxley Act”), 15 U.S.C. 7202(c) and 7218(c). 26 See SFAC No. 5, Recognition and Measurement in Financial Statements of Business Enterprises (“SFAC No. 5”), paragraphs 39-41 and 55-57. 27 SFAC No. 5, paragraph 23; see also paragraph 24. 28 SFAC No. 6, Elements of Financial Statements (“SFAC No. 6”), paragraph 25. 29 Ibid., paragraph 35. 30 Ibid., paragraph 49.
17
measurement attributes is often referred to as the “mixed-attribute model.” Under the current mixed-attribute model, the carrying amounts of some assets and liabilities are reflected in the balance sheet at historical cost, some at fair value, and some at other bases, such as lower-of-cost-or-fair-value. Financial accounting standards in the U.S. establish the basis on which items reported in the balance sheet should be measured. Section I.D of this study more fully describes measurement bases that the FASB considers in setting standards. Measurement using historical cost can be done in several ways, but the general concept is to record items on the balance sheet using the original amount paid or received, with or without adjustments in subsequent periods for depreciation, amortization, or impairment. Accordingly, one historical cost measure is not necessarily comparable to another historical cost measure due to differences in when the historical cost was measured and the individual amount paid or received, as well as differences in depreciation, amortization, and impairment techniques or requirements. Fair value measurement is defined by SFAS No. 157. Prior to the issuance of SFAS No. 157 in 2006, “fair value” was defined or described in various accounting standards that prescribe its use, but the definition of fair value, and its application, were not necessarily consistent across standards.31 SFAS No. 157 now provides a standardized definition of fair value. Section I.D of this study further explains the definition of fair value provided in SFAS No. 157. Other measurement bases, such as lower-of-cost-or-fair-value, are described or explained in the accounting standards in which they are used.32 In connection with a current joint project to improve upon their respective conceptual frameworks, the Boards are focusing on measurement bases that are appropriate for future standard-setting. Rather than referring to “historical cost” versus “fair value,” the Boards are focusing on nine measurement bases that are related to either past, present or future prices or amounts. The Boards’ work is discussed further in Sections I.D and VI.B of this study.
2. Income Statement
The income statement reflects the issuer’s revenues and expenses, gains and losses, and, thus, is intended to capture “the extent to which and the ways in which the equity of an entity increased or decreased from all sources other than transactions with owners during a period.”33 Over the years, there has been tremendous controversy about what should be reported in the income statement. In large part, the controversy can be traced to the fact that net income (often expressed as a per share measure) often receives more focus than other measures in evaluating performance. As such, a decision or proposal to change accounting standards in a way that would result in more volatility being reported in income has often prompted controversy.
31 See SFAS No. 157, Reasons for Issuing this Statement. 32 See, e.g., SFAS No. 65, Accounting for Certain Mortgage Banking Activities (“SFAS No. 65”), paragraphs 9-10. 33 SFAC No. 5, paragraph 30. There are several transactions that meet the criteria to be included in the income statement, but have nonetheless been excluded from net income, and are instead categorized as OCI.

18
Due to the complementary and integrated nature of the balance sheet and income statement, choosing the accounting treatment for one statement has implications for the other.34 One of the most critical and timely examples relates to standards that require the recognition of more assets and liabilities on the balance sheet at their fair values. For some assets and liabilities that are measured at fair value on the balance sheet, unrealized changes (gains and losses) in fair value from period to period impact net income, while, for other assets and liabilities that are measured at fair value, unrealized changes in fair value do not impact net income, but instead are recorded through the equity section of the balance sheet by way of an accounting construct referred to as OCI. Unrealized gains and losses related to assets and liabilities are those that occur while an issuer holds the asset or liability, as opposed to realized gains and losses that generally occur when an asset or liability is sold or settled. Proponents of the “all inclusive” approach to defining net income contend that it is appropriate to include both realized and unrealized gains and losses in net income because this information enables users to better predict future income or cash flows. However, others point out that recording unrealized gains and losses in the income statement may lead to increased income volatility, which they believe results in lower predictability of future income or cash flows. As noted above, the alternative to reporting unrealized gains and losses as part of net income is to report these changes in OCI, which most often appears in the statement of changes in equity,35 until the gain or loss is realized generally through sale of the asset or settlement of the liability.
3. Other Basic Financial Statements The other two basic financial statements describe, each in their own way, the changes in various balance sheet items from one period to the next. The statement of changes in equity reflects the ways in which assets and liabilities have changed due to transactions with owners during the period, such as declarations of dividends, issuances of stock and options, exchanges of shares in mergers and acquisitions, and items that are classified outside of the measurement of net income (i.e., OCI, as discussed above).
The cash flow statement reflects an entity’s cash receipts classified by major sources and its cash payments classified by major uses during a period.
This statement groups the inflows and
outflows of cash into three broad categories: operating cash flows, investing cash flows, and financing cash flows. Operating cash flows include: cash received from customers; cash spent on materials and labor; cash paid for utilities, insurance, compensation and benefits; and many other types of operating items. The other two sections of the cash flow statement report investing cash flows and financing cash flows. Investing cash flows include: cash inflows and outflows related to 34 Historically, the relative focus of standard-setters on the balance sheet versus the income statement (or vice versa) has varied. The balance sheet was emphasized in the early part of the 20th Century (and before), in part because creditors had little reliable information available to them. Liquidation values and conservatism were of central importance. By the late 1930s, the focus shifted to a shareholder orientation, the income statement and value in use rather than liquidation value. See Elden S. Hendriksen, Accounting Theory, 257 (4th ed. 1982). 35 The statement of changes in equity is discussed further in Section I.B.3.

19
purchases or sales of property, plant, and equipment; investments in equity or debt of other entities; and other types of investments. Financing cash flows include: cash inflows from raising capital through issuing stock or debt, cash outflows to repay mortgages and other liabilities, cash paid for dividends, and the like.
4. Notes to the Financial Statements, Management’s Discussion and Analysis of Financial Condition and Results of Operations, and Other Disclosures
The basic financial statements alone cannot reasonably be expected to provide sufficient information for investment decisions. The FASB’s concept statements note that “[s]ome useful information is better provided by financial statements and some is better provided, or can only be provided, by notes to financial statements or by supplementary information or other means of financial reporting.”36 These disclosures in the notes to the financial statements are intended to provide information that the four main financial statements cannot (or do not) provide. In addition, although the notes provide much information that is not provided in the basic financial statements, they generally do not provide an explanation of the business activities underlying the numbers. Recognizing that such information may be as important to investors as the information in the financial statements and notes, the Commission requires issuers to include a management’s discussion and analysis of financial condition and results of operations (“MD&A”) section in many filings. MD&A requires a discussion of known trends, demands, commitments, uncertainties, and events that are reasonably likely to materially affect the issuer’s financial condition, results of operations, or liquidity, as well as other information that provides context to the financial statements. As noted in Financial Reporting Release 67:
The disclosure in MD&A is of paramount importance in increasing the transparency of a company's financial performance and providing investors with the disclosure necessary to evaluate a company and to make informed investment decisions. MD&A also provides a unique opportunity for management to provide investors with an understanding of its view of the financial performance and condition of the company, an appreciation of what the financial statements show and do not show, as well as important trends and risks that have shaped the past or are reasonably likely to shape the future.37
Because of the importance of the notes to the financial statements and other disclosures, including MD&A, in providing information that is not provided by the basic financial statements themselves, questions of whether items should or should not be included on the balance sheet and income statement and whether sufficient transparency in reporting has been achieved must be assessed in light of the presence and role of these other reporting tools.
36 SFAC No. 5, paragraph 7. 37 SEC Release No. 33-8182 (January 28, 2003), Disclosure in Management's Discussion and Analysis about Off-Balance Sheet Arrangements and Aggregate Contractual Obligations.

20
C. Other Considerations
1. Role of Accounting in Prudential Oversight
Financial information is also used in prudential oversight. The primary objective of prudential oversight is to foster safety and soundness and financial stability.38 For prudential oversight purposes, regulatory capital requirements for banks in the U.S. start with financial information provided in accordance with U.S. GAAP. However, in certain instances, the effects of U.S. GAAP accounting are adjusted, thereby reflecting the important differences between the objectives of U.S. GAAP reporting and the objectives of U.S. bank regulatory capital requirements. These adjustments are discussed in greater detail in Section III.D. Consistent with the Act’s mandate, the focus of this study is on financial reporting for investors, rather than prudential supervisors. However, because of the role of prudential oversight in bank failures and the existing relationship between U.S. GAAP and regulatory capital, where relevant, this study also discusses such considerations.
2. International Considerations
As mandated by the Act, this study principally focuses on fair value accounting in the context of U.S. companies reporting under U.S. GAAP. However, developments over the past few years necessitate consideration of the international financial reporting landscape. First, on a global basis, the number of companies that report under IFRS has increased substantially. In 2002, the European Union (“E.U.”) adopted a regulation requiring its listed companies to report under IFRS by 2005.39 Since then, other countries have followed suit. Approximately 113 countries around the world currently require or permit IFRS reporting for domestic, listed companies, including the E.U., Australia, and Israel.40 The market capitalization of exchange listed companies in the E.U., Australia, and Israel totals $11 trillion (or approximately 26% of global market capitalization), and the market capitalization from those countries plus Brazil and Canada, both of which have announced plans to move to IFRS, totals $13.4 trillion (or approximately 31% of global market capitalization).41 Second, the Boards have made concerted efforts to converge U.S. GAAP and IFRS to minimize or eliminate differences in the two bodies of accounting literature. This process began with the signing of the “Norwalk Agreement” by the Boards in October 2002.42 In this agreement, the
38 See Basel Committee on Banking Supervision, Core Principles for Effective Banking Supervision (October 2006). 39 See Regulation (EC) No. 1606/2002 of the European Parliament and of the Council of the European Union of 19 July 2002 on the Application of International Accounting Standards, Official Journal L. 243, November 9, 2002, at pages 0001-0004. 40 See SEC Release No. 33-8982 (November 14, 2008), Roadmap for the Potential Use of Financial Statements Prepared in Accordance with International Financial Reporting Standards by U.S. Issuers (“Proposed Roadmap”). 41 Ibid. 42 See the Boards, Memorandum of Understanding, “The Norwalk Agreement,” (September 18, 2002) (the “Norwalk Agreement”). (available at: http://www.fasb.org/news/memorandum.pdf) For further details, see IASB,
21
Boards acknowledged their joint commitment to convergence. They also pledged to use their best efforts to develop, “as soon as practicable,” high quality, compatible accounting standards that could be used for both domestic and cross-border financial reporting. Most recently, in September 2008, the Boards issued a progress report and a timetable for the completion of joint major projects by 2011 in areas such as financial statement presentation, revenue recognition, lease accounting, liabilities and equity distinctions, consolidation accounting, and pension and post-retirement benefit accounting.43 The Commission recognizes the increasingly global nature of the capital markets and has long expressed its support for a single set of high-quality global accounting standards to benefit both U.S. and global capital markets and U.S. and foreign investors by facilitating comparison of financial information.44 To further this goal, the SEC has taken the following steps: • In December 2007, the SEC published rules to accept from foreign private issuers in their
filings with the Commission, financial statements prepared in accordance with IFRS as issued by the IASB without reconciliation to U.S. GAAP.45
• In November 2008, the Commission published for comment a proposed roadmap for the
potential use of financial statements prepared in accordance with IFRS as issued by the IASB by U.S. issuers for purposes of their filings with the Commission.46 This proposed roadmap sets forth seven milestones that, if achieved, could lead to the required use of IFRS by U.S. issuers in 2014 if the Commission believes it to be in the public interest and for the protection of investors. In addition, the Commission also proposed to permit early use of IFRS, beginning with filings in 2010, by a limited number of U.S. issuers where this would enhance the comparability of financial information to investors.
In light of these developments, the U.S. standard-setting process and changes to U.S. GAAP are intertwined with those abroad. Accordingly, where relevant, this study includes discussion of international considerations and events. For example, Section I.D of this study provides information about fair value accounting under IFRS, while Section VII discusses the accounting developments in response to the current global economic crisis from a global perspective and recommends modifications that should be coordinated with the IASB, as well as national and regional securities regulators.
A Roadmap for Convergence between IFRSs and US GAAP—2006-2008, Memorandum of Understanding between the FASB and the IASB, February 27, 2006. (available at: http://www.iasb.org/NR/rdonlyres/874B63FB-56DB-4B78-B7AF-49BBA18C98D9/0/MoU.pdf) 43 See the Boards’ update to the 2006 Memorandum of Understanding, Completing the February 2006 Memorandum of Understanding: A Progress Report and Timetable for Completion, September 2008. (available at: http://www.fasb.org/intl/MOU_09-11-08.pdf) 44 See, e.g., SEC Release No. 33-6807 (November 14, 1988), Regulation of International Securities Markets. 45 See SEC Release No. 33-8879 (December 21, 2007), Acceptance from Foreign Private Issuers of Financial Statements Prepared in Accordance with International Financial Reporting Standards without Reconciliation to U.S. GAAP. 46 See Proposed Roadmap.
22
D. Background Information on Fair Value Accounting
The purpose of this section is to provide an understanding of the definition of fair value in accounting, the application of fair value accounting, a historical context for fair value accounting, and information about other measurement bases used in accounting.
1. Definition of Fair Value
a. U.S. GAAP
As previously mentioned, fair value measurement is defined by SFAS No. 157, which was issued in 2006. SFAS No. 157 became effective at the beginning of 2008 for all reporting entities, with early adoption permitted.47 Prior to the issuance of SFAS No. 157, fair value measurement principles were not consistently defined and codified in a single accounting standard, which led to the potential for disparate fair value measurement practices under different accounting standards. SFAS No. 157 defines fair value, establishes a framework for measuring fair value, and expands disclosures about fair value measurements.48 Accordingly, SFAS No. 157 was issued to provide a single set of measurement principles to be uniformly applied for fair value measurement when U.S. GAAP requires or permits reporting entities to measure and / or disclose the fair value of an asset or a liability. Importantly, SFAS No. 157 did not change which assets and liabilities are subject to fair value accounting or when fair value should be applied. As noted in Section I.D.2 of this study, other previously existing accounting standards provide the requirement or permission to measure assets and liabilities at fair value.
SFAS No. 157 defines “fair value” as follows:
Fair value is the price that would be received to sell an asset or paid to transfer a liability in an orderly transaction between market participants at the measurement date.49
Key principles underpinning the definition of fair value under SFAS No. 157 are as follows: • Fair value is based upon an exchange price. Specifically, SFAS No. 157 highlights that the
concept of fair value is based on an exit price notion (the price to be received on sale of an asset or price to be paid to transfer a liability) from a hypothetical exchange transaction.
• The exchange price is the price in an orderly transaction which allows for due diligence, and
is not from a distressed sale or a forced transaction.
47 SFAS No. 157 was effective for financial statements issued for fiscal years beginning after November 15, 2007, and interim periods within those fiscal years. Delayed application was permitted for non-financial assets and non-financial liabilities, except for items that are recognized or disclosed at fair value in the financial statements on a recurring basis (at least annually), until fiscal years beginning after November 15, 2008, and interim periods within those fiscal years. See SFAS No. 157, paragraph 36. 48 See SFAS No. 157, paragraph 1. 49 SFAS No. 157, paragraph 5.

23
• Fair value measurement assumes that the asset is sold in its principal market or, in the absence of a principal market, the most advantageous market.
• Fair value is determined based on the assumptions that market participants50 would use in
pricing the asset or liability. A fair value measurement should include an adjustment for risk if market participants would include one in pricing the related asset or liability, even if the adjustment is difficult to determine.
• Company-specific information should be factored into fair value measurement when relevant
information is not observable in the market.51 • SFAS No. 157 provides a hierarchy for inputs used in fair value measurement based on the
degree to which the inputs are observable in the market. Level 1 in the hierarchy includes inputs that are based on quoted prices in active markets for the identical asset or liability (“Level 1”). Level 2 includes quoted prices of similar instruments in active markets, quoted prices for identical or similar instruments in inactive markets, and observable market information on valuation parameters or market-corroborated information (“Level 2”), and Level 3 represents measurements that incorporate significant unobservable inputs that reflect the reporting entity’s own assumptions regarding valuation parameters that market participants would use (“Level 3”). Valuation techniques used to measure fair values should maximize the use of relevant observable inputs and minimize the use of unobservable inputs. When Level 1 inputs are available, those inputs should generally be used.
• Companies measuring the fair value of their own liabilities should incorporate the effect of
their credit risk (credit standing) on the fair value of their liabilities. For example, declines in a company’s own creditworthiness will generally result in a decrease in the fair value of the company’s own liabilities, all else being equal.
b. IFRS
Currently, under IFRS, “guidance on measuring fair value is dispersed throughout [IFRS] and is not always consistent.”52 However, as discussed in Section VII.B, the IASB is developing an exposure draft on fair value measurement guidance. IFRS generally defines fair value as “the amount for which an asset could be exchanged, or a liability settled, between knowledgeable, willing parties in an arm’s length transaction” (with
50 Market participants are knowledgeable and informed buyers and sellers in the relevant market, who are independent of the reporting entity and are able and willing to transact for the asset or liability that is subject to fair value measurement. See SFAS No. 157, paragraphs 10-11. 51 Company-specific information factored into fair value measurement should reflect the company’s expectation regarding market participant assumptions. 52 IASB Discussion Paper, Fair Value Measurements, Part I – Invitation to Comment and Relevant IFRS Guidance (November 2006) (“Fair Value Discussion Paper”), paragraph 6.
24
some slight variations in wording in different standards).53 While this definition is generally consistent with SFAS No. 157, it is not fully converged in the following respects: • The definition in SFAS No. 157 is explicitly an exit price, whereas the definition in IFRS is
neither explicitly an exit price nor an entry price. • SFAS No. 157 explicitly refers to market participants, which is defined by the standard,
whereas IFRS simply refers to knowledgeable, willing parties in an arm’s length transaction. • For liabilities, the definition of fair value in SFAS No. 157 rests on the notion that the
liability is transferred (the liability to the counterparty continues), whereas the definition in IFRS refers to the amount at which a liability could be settled.54
2. Application of Fair Value Accounting
Under both U.S. GAAP and IFRS, fair value is most prevalently used to measure “financial” assets and liabilities,55 as opposed to “non-financial” assets and liabilities, such as property or intangible assets. Financial assets and liabilities include, but are not limited to, investment securities, derivative instruments, loans and other receivables, notes and other payables, and debt instruments issued. Not all of these financial assets and liabilities are required to be measured at fair value; some are permitted to be measured at fair value because of provisions that generally permit an entity to elect fair value accounting for financial assets and liabilities. As noted in Section I.B.2, for those assets and liabilities that are measured at fair value, some have unrealized changes in fair value recognized through income and some have unrealized changes in fair value recognized in OCI in the equity section of the balance sheet.
Fair value measurements that are required on a quarterly basis (or each reporting period) are often referred to as “recurring,” while fair value measurements that are required only if assets are considered impaired are considered to be “non-recurring.” Recurring fair value measurements apply to certain classes of investment securities and derivatives instruments, among other items. Non-recurring fair value measurements apply to various types of assets, both financial and non-financial, that are required to be tested for impairment in their value and, if impaired, are required to have their carrying amounts written down to fair value. The discussion below further explains how fair value accounting impacts both financial and non-financial assets and liabilities under U.S. GAAP and, as a comparison, highlights the more 53 Ibid. 54 See Ibid. 55 Under U.S. GAAP, a financial asset is defined as “[c]ash, evidence of an ownership interest in an entity, or a contract that conveys to one entity a right (1) to receive cash or another financial instrument from a second entity or (2) to exchange other financial instruments on potentially favorable terms with the second entity.” A financial liability is defined as “[a] contract that imposes on one entity an obligation (1) to deliver cash or another financial instrument to a second entity or (2) to exchange other financial instruments on potentially unfavorable terms with the second entity” (SFAS No. 159, paragraph 6). The definition of financial assets and financial liabilities under IFRS is substantially converged to U.S. GAAP (International Accounting Standard (“IAS”) 32, Financial Instruments: Presentation, paragraph 11).
25
significant differences in the treatment under IFRS. Others have pointed out the complexity of the current accounting requirements.56
a. How Fair Value Impacts Accounting for Financial Instruments
i. U.S. GAAP This section provides further information about different types of financial instruments and the extent to which fair value measurement is applied to those instruments. The extent to which U.S. GAAP requires financial instruments to be measured at fair value with changes in fair value recognized in income generally depends on the characteristics of the financial instrument, the legal form, and how the company intends to use the financial instrument. Measurement of financial instruments at fair value is also determined in some circumstances by the industry in which the reporting entity operates. For certain specialized industries like brokers and dealers in securities and investment companies (including mutual funds), fair value measurement has long been used for financial instruments.57 To the extent that financial assets are not measured at fair value each reporting period through income, companies are required to assess whether those financial assets are impaired. Impairment accounting can be complex, as there are different definitions of impairment and different impairment tests for different types of financial assets. Impairment accounting is summarized at the end of this subsection. Equity Securities
Investments in equity securities (e.g., an investment in common stock) may be accounted for in a number of different ways. Equity investments that provide a company with controlling financial interest generally result in the consolidation of the investee, such that the investee’s underlying assets and liabilities are accounted for based on their nature (e.g., cash, investments, property, and debt).58 For example, an entity that owns 80% of the equity securities of another entity and has voting control would consolidate the accounts of the controlled entity. Investments in equity securities of an entity over which a company has significant influence are presented on one line and accounted under the “equity method.” Equity method accounting is often viewed as a form of historical cost accounting in which the pro rata share of the operations of the investment is reflected in a “one line” consolidation of the books of the investee. These equity method investments are also subject to write-downs to fair value, but only when the
56 See, e.g., IASB Discussion Paper, Reducing Complexity in Reporting Financial Instruments (March 2008), and Final Report of CIFiR (August 1, 2008) (“CIFiR Final Report”). (available at: http://www.sec.gov/about/offices/oca/acifr/acifr-finalreport.pdf) 57 See American Institute of Certified Public Accountants (“AICPA”) Audit and Accounting Guide – Brokers and Dealers in Securities, Chapter 7, paragraph 2 (with conforming changes as of May 1, 2007), and Section 2(a)(41) of the Investment Company Act. 58 See Accounting Research Bulletin No. 51, Consolidated Financial Statements.
26
impairment is other-than-temporary.59 Alternatively, a company has the option to measure equity method investments at fair value, as discussed in further detail below.60 All other investments in equity securities for which fair value is readily determinable are measured at fair value. However, changes in fair value may be recognized either in income or in OCI, based on an election made by management. Changes in the fair value of securities that management has classified as trading are required to be recognized in income each period. Changes in the fair value of securities that management has classified as AFS, which represent all other equity securities, are required to be recognized in OCI each period, until the investment is ultimately sold or impairment in the security is determined to be other-than-temporary.61 It is possible to transfer equity securities into or out of the trading classification; however, U.S. GAAP indicates that such circumstances should be rare. Equity securities for which fair value is not readily determinable are generally measured at cost, with adjustments only made when the decline in the estimated fair value below cost is considered other-than-temporary.62 Debt Securities Investments in debt securities may also be accounted for in a number of different ways.63 Investments classified as trading are required to be measured at fair value each period, with all changes in fair value recognized in income each period. In rare circumstances, companies can reclassify debt securities into or out of the trading classification. Debt securities that a company purchases with the strict intent and ability to hold until maturity may be designated as held-to-maturity (“HTM”). In limited circumstances, companies can sell HTM debt securities or transfer those securities out of the HTM classification. HTM securities are recorded on the balance sheet at amortized cost. Declines in fair value are not reported in the balance sheet or income statement, except when the security value is impaired (the carrying amount is above fair value) and the impairment is determined to be other-than-temporary.
Investments that a company does not choose to designate as trading or HTM are classified as AFS. AFS securities are recorded on the balance sheet at fair value; however, unrealized
59 See Accounting Principles Board (“APB”) Opinion No. 18, The Equity Method of Accounting for Investments in Common Stock. 60 See SFAS No. 159. 61 See SFAS No. 115. 62 See FSP FAS No. 115-1 / 124-1, The Meaning of Other-Than-Temporary Impairment and Its Application to Certain Investments (“FSP FAS 115-1 / 124-1”). 63 See SFAS No. 115; Emerging Issues Task Force (“EITF”) Issue No. 99-20, Recognition of Interest Income and Impairment on Purchased Beneficial Interests and Beneficial Interests That Continue to Be Held by a Transferor in Securitized Financial Assets (“EITF Issue No. 99-20”); SFAS No. 5, Accounting for Contingencies (“SFAS No. 5”); SFAS No. 114, Accounting by Creditors for Impairment of a Loan (“SFAS No. 114”); Statement of Position (“SOP”) 03-3, Accounting for Certain Loans or Debt Securities Acquired in a Transfer (“SOP 03-3”).
27
changes in fair value are generally not recorded in the income statement. Rather, changes in the fair value of AFS securities are required to be recognized in OCI each period, until the investment is ultimately sold or impairment in the security is determined to be other-than-temporary. Reclassifications from AFS to HTM are permitted, provided that the company has the positive intent and ability to hold the security to maturity. Securitized Assets Some assets undergo a process, referred to as securitization, by which the assets are transformed into securities.64 While both financial and non-financial assets can be securitized, it is more commonly observed for financial assets. In a typical securitization, a company transfers a portfolio of financial assets, such as mortgage loans, automobile loans, student loans, credit card receivables, or other assets, into a trust or other form of “special purpose entity.” The special purpose entity then issues interests in the underlying assets to investors. The interests are often issued in different classes, with different risks and payoffs for the investors.65 A holder of an interest in a securitization would follow the accounting requirements for either debt or equity securities depending on the characteristics of the interest held. One unique aspect of accounting for interests in securitized financial assets is the accounting for impairment (summarized at the end of this subsection). Direct Investments in Loans
The accounting for a direct investment in a loan (as opposed to a debt security) varies based on whether the loan is held-for-investment (“HFI”) or held-for-sale (“HFS”). Generally, HFI loans are accounted for at amortized cost, with impairment recognized only for probable credit losses. Recognition of probable credit losses differs significantly from fair value losses in that the measurement of loss incorporates only expected delays in the timing and amount of expected cash flows that are due to events that have been incurred as of the measurement date (incurred credit losses). HFS loans (e.g., loans made with the intent to package and securitize) are reported at the lower-of-cost-or-fair-value, with declines in fair value recognized in income.66 Losses recognized for declines in the fair value of loans include the impact of all market factors, including changes in expected cash flows, risk premiums, and liquidity. Companies can transfer loans into or out of the HFS classification as a result of changes in intentions regarding whether the loans will be sold or HFI. Alternatively, a company may elect to measure its loans at fair value, as discussed further below, regardless of whether they are HFI or HFS.67 64 See SFAS No. 140, Glossary. 65 See Ibid., paragraphs 73-75. 66 See SFAS No. 65; SFAS No. 5; SFAS No. 114; and SOP 03-3. 67 See SFAS No. 159.
28
Derivative Assets and Liabilities Derivatives, as defined in SFAS No. 133 and related guidance, are required to be reported on a company’s balance sheet at fair value. The basis for conclusions in SFAS No. 133 states that:
The Board believes fair value is the only relevant measurement attribute for derivatives. Amortized cost is not a relevant measure for derivatives because the historical cost of a derivative often is zero, yet a derivative generally can be settled or sold at any time for an amount equivalent to its fair value.68
Common types of financial instruments that are accounted for as derivatives include interest rate, commodity, foreign exchange, and credit-default swap and forward contracts. SFAS No. 133 also provides special accounting treatment for derivatives that are designated and qualify as hedges. Changes in the fair value (unrealized gains and losses) of derivative contracts that are not designated as a hedge are recorded directly in income. For derivatives that are designated as hedges of future cash flows (“cash flow hedges”), the changes in the fair value of those derivatives are not immediately recorded in income. Rather, changes in fair value are initially recorded in the accumulated OCI section of the shareholder’s equity portion of the balance sheet and then reclassified into income when the related cash flows (the cash flows being hedged) impact income. For derivatives that are designated as hedges of changes in the fair value of a recognized asset or liability (“fair value hedges”), changes in the fair value of the derivative, together with the offsetting change in the fair value of the hedged item, are recognized immediately in income. Thus, to the extent that the hedge is effective, the impact in income is offset. Other Financial Liabilities Currently, U.S. GAAP generally only requires derivative liabilities to be measured on a recurring basis at fair value. However, SFAS No. 159 provides companies with an option to elect to fair value certain financial liabilities, as discussed further below. As fair value is defined in SFAS No. 157, if an entity elects fair value (or, in the case of derivative liabilities, fair value is required), the fair value is measured based on a transfer notion as opposed to a settlement notion. That is, the fair value of a liability is based on how much it would cost a company to pay another market participant to assume its liability. The non-performance risk (the risk of borrower default) should be the same before and after the transfer. This measurement requires companies to include changes in creditworthiness of the borrower in the fair value of the liability. A decline in the creditworthiness of a company results in the recognition of a gain in the income statement as the fair value of the liability declines.
68 SFAS No. 133, paragraph 223.

29
Fair Value Option In recent years, the FASB has included a “fair value option” (“FVO”) in several standards, which permits, but does not require, reporting entities to make elections to measure certain assets and / or liabilities at fair value. In 2006, the FASB issued SFAS No. 155 and SFAS No. 156. Both of these standards permit fair value elections in certain circumstances.69 In 2007, the FASB issued SFAS No. 159. SFAS No. 159 expanded the ability of reporting entities to elect fair value measurement for most financial assets and liabilities, with unrealized changes in fair value reported in earnings and thereby impacting net income. The FASB stated the objective of SFAS No. 159 as follows:
This Statement permits entities to choose to measure many financial instruments and certain other items at fair value that are not currently required to be measured at fair value. The objective is to improve financial reporting by providing entities with the opportunity to mitigate volatility in reported earnings caused by measuring related assets and liabilities differently without having to apply complex hedge accounting provisions. This Statement is expected to expand the use of fair value measurement, which is consistent with the Board’s long-term measurement objectives for accounting for financial instruments. In addition, it is similar to a measurement choice permitted in International Financial Reporting Standards.70
While SFAS No. 159 provides an “option,” the FASB set parameters around application of the FVO. A reporting entity’s decision about whether to elect the FVO: (1) is applied on an instrument-by-instrument basis, with certain limited exceptions, (2) is irrevocable (once selected for an individual instrument) and therefore cannot be changed subsequent to election, and (3) is applied only to an entire instrument and not to only specified risks, specific cash flows, or a portion of that instrument.71 When specifying that the FVO may be elected on an instrument by instrument basis, the FASB noted that the option may be elected for a single eligible item without electing it for other identical items, with certain limited exceptions.72 SFAS No. 159 became effective at the beginning of 2008 for calendar-year entities, with early adoption allowed in 2007 in certain circumstances.73 Reporting entities could elect the FVO for 69 SFAS No. 155 permits fair value remeasurement for any hybrid financial instrument that contains an embedded derivative that otherwise would require bifurcation. SFAS No. 156 permits an entity to elect to subsequently measure its servicing assets and servicing liabilities at fair value, by class. 70 SFAS No. 159, paragraph 1. 71 See SFAS No. 159, paragraph 5. 72 See SFAS No. 159, paragraph 12. The exceptions involve multiple advances made to one borrower pursuant to a single contract; investments that would otherwise be accounted for under the equity method of accounting; eligible instruments or reinsurance contracts; and insurance contracts with integrated or nonintegrated contract features or coverages. 73 SFAS No. 159 became effective as of the beginning of each reporting entity’s first fiscal year that began after November 15, 2007. See SFAS No. 159, paragraph 24. An entity was permitted to adopt the standard and elect the FVO for existing eligible items as of the beginning of a fiscal year that begins on or before November 15, 2007. See SFAS No. 159, paragraph 30.

30
individual financial instruments that existed upon initial adoption of SFAS No. 159 and for new financial instruments when acquired. Impairments
The accounting for impairments of financial assets not subject to mark-to-market accounting developed over many years on a standard-by-standard basis and differs depending upon the characteristics, form, and intended use of the financial asset. For example, an HFI loan is generally impaired when it is probable that a creditor will be unable to collect all amounts due.74 Measurement of loan impairment is based on management’s estimate of incurred credit losses and is accounted for using a valuation allowance, often referred to as an allowance for credit losses, with changes in the estimated valuation allowance recognized in income. In contrast, a debt or equity security is generally considered impaired when its carrying amount (generally based on amortized cost) exceeds its fair value.75 As noted earlier, fair value incorporates assumptions that market participants would use in pricing the asset, including those related to general interest rates, credit spreads, and liquidity. For impaired debt or equity securities, only impairments that are considered to be “other-than-temporary” (referred to as “other-than-temporary impairment” or “OTTI”) result in a remeasurement at current fair value, with the change in fair value recognized in income. Judgment is required in assessing whether an OTTI exists. Some of the factors that companies consider in evaluating whether an OTTI exists include: the length of the time and the extent to which the fair value has been less than its carrying amount; the financial condition and prospects of the issuer; and the intent and ability of the holder to retain its investment in the issuer for a period of time sufficient to allow for any anticipated recovery in fair value.76 U.S. GAAP generally mandates that subsequent to recording an impairment loss, further increases in the fair value of an asset are not reflected in income until the asset is sold. The current global economic crisis has highlighted difficulties in performing OTTI evaluations.77 As required by SFAS No. 115, a company that classifies securities as either HTM or AFS must determine whether a decline in fair value below the amortized-cost basis is other-than-temporary. There are basically three steps in determining if a company is required to take an OTTI charge to income, including: (1) calculating the fair value of a security, (2) determining if a decline in fair value is due to a credit related event, and (3) assessing whether or not the investor has the ability and intent to hold the security until recovery. The current market environment has posed several challenges for preparers as it relates to the calculation of the fair value of certain financial instruments (e.g., certain Level 2 and Level 3 assets). Furthermore, preparers have struggled
74 See SFAS No. 114, paragraph 8. 75 See SFAS No. 115, paragraph 16. 76 See Staff Accounting Bulletin Topic 5M, Other Than Temporary Impairment of Certain Investments in Debt and Equity Securities. See also FSP FAS 115-1 / 124-1. 77 See, e.g., letters from ABA (November 13, 2008), MassMutual, Citi, CAQ, Nationwide, ACLI, and FHLBC.
31
with the multiple models that exist to determine if a decline in fair value is other-than-temporary.78 Under U.S. GAAP, a debt security is subject to an assessment of OTTI under SFAS No. 115 with a subset of debt securities (interests in securitized financial assets) requiring incremental procedures under EITF Issue No. 99-20.79 If a security is impaired for credit concerns utilizing one of these models, the security is written down to current fair value and an expense is recorded in the income statement. However, complexity exists regarding the determination of which model should be utilized to determine if a credit-based impairment exists and the different recognition thresholds required under each model. In determining whether an impairment is other-than-temporary, EITF Issue No. 99-20 requires a preparer to test for an adverse change in cash flows by using its best estimate of the cash flows that a market participant would use in determining the fair value. In contrast, for securities not within the scope of EITF Issue No. 99-20, there is no similar requirement to use a market participant’s view. While on the surface this distinction may seem minor, EITF Issue No. 99-20’s requirement to utilize market participant cash flows as compared to management’s own internal estimates under SFAS No. 115, combined with the substantial decline in the fair value of various securities in the current market environment, has resulted in substantial disparity in the application of the models in practice and has reduced the comparability of financial statements. To address these issues, on December 19, 2008, the FASB issued an exposure draft of FSP EITF 99-20-a, Amendments to the Impairment and Interest Income Measurement Guidance of EITF 99-20 (“FSP EITF 99-20-a”), that would remove the requirement to use market participant assumptions for purposes of testing for OTTI. Section VII.A of this study provides further information about recent FASB activities in this area.
ii. IFRS
As it relates to the application and use of fair value, IFRS differs from U.S. GAAP in its accounting for financial instruments most significantly in the following respects: • IFRS does not distinguish between investments that are in the form of debt securities and
those that are investments in loans. Under IFRS, regardless of the form, investments in obligations with fixed or determinable payments generally can be accounted for as loans, if
78 See, e.g., letter from BDO Seidman, LLP to the FASB, dated November 17, 2008, as input to the FASB and IASB’s November 25, 2008 Round Table Meeting on the Global Financial Crisis (available at: http://72.3.243.42/board_handouts/11-25-08_Joint_FASB_IASB_Roundtable_Global_Financial_Crisis.pdf), which states:
U.S. GAAP has four different impairment models for economically similar fixed income investments: FAS 5/FAS 114 for loans, SOP 03-3 for loans purchased with known deterioration in collectibility since origination, EITF Issue 99-20 for retained interests in securitizations, and FAS 115 other-than-temporary impairment for debt securities.
79 SOP 03-3 provides additional guidance regarding OTTI for acquired securities. The guidance in SOP 03-3 utilizes aspects of both SFAS No. 115 and EITF Issue No. 99-20.
32
the investments do not trade in an active market and the holder does not intend to sell the investment in the near term.80 Similar to U.S. GAAP, accounting for investments not classified as loans is based on whether the investment is classified as trading, AFS, or HTM.
• Prior to recent IASB amendments in October 2008, IFRS had more restrictive requirements
than U.S. GAAP about transferring certain financial assets. Subsequent to these amendments, which are retroactively effective to July 1, 2008, non-derivative financial assets held for trading and AFS financial assets may be reclassified under IFRS in particular situations,81 as discussed in greater detail in Section VII.A.
• Under IFRS, the trigger for recognizing impairment differs from U.S. GAAP, resulting in the
potential for differences in the timing of when an impairment charge is recorded. • Measurement of impairment losses differs under IFRS for HTM securities, which are written
down through income under both U.S. GAAP and IFRS. However, under U.S. GAAP, these securities are written down to fair value; under IFRS, they are written down only for incurred credit losses.
• IFRS has greater restrictions on the use of the option to elect fair value accounting.
b. How Fair Value Impacts Accounting for Non-Financial Instruments
i. U.S. GAAP
Non-financial assets and liabilities generally are not accounted for at fair value on a recurring basis. Currently, non-financial assets and liabilities are generally initially measured at their cost or based upon proceeds received (which many would view to be generally in line with fair value). In addition, U.S. GAAP provides for many non-financial assets to be written down to their current value when those assets are determined to be impaired. If the fair value of those assets subsequently increases, the assets are generally not marked up to the new fair value. A description of U.S. GAAP requirements that include non-recurring fair value measurements for non-financial assets and liabilities is provided below. Business Combinations
SFAS No. 141, Business Combinations (“SFAS No. 141”), was issued in June 2001.82 Though this standard provides guidance on how to account for business acquisitions, it is significant from a fair value measurement standpoint because the acquirer is required to measure many of the 80 See IAS 39, as amended, paragraph 9. 81 See “IASB amendments permit reclassification of financial instruments,” IASB press release (October 13, 2008). 82 SFAS No. 141(R), Business Combinations (“SFAS No. 141R”), was issued and will be effective for companies in fiscal years beginning after December 15, 2008. SFAS No. 141R supersedes SFAS No. 141 and further requires the use of fair value by requiring that most assets and liabilities acquired in an acquisition be measured at fair value. It also requires that any non-controlling interest in the acquiree be measured at fair value.

33
assets and liabilities acquired in the business combination at fair value. However, there are many exceptions under SFAS No. 141 to the use of fair value upon initial recognition. Accordingly, while assets may be reported on a target’s books at historical cost, they are often remeasured to fair value upon acquisition. SFAS No. 141 also requires the identification and recognition of intangible assets at fair value. While SFAS No. 141 only requires fair value measurement on acquisition (and not on a recurring basis subsequent to the acquisition), this statement indicates the FASB’s view that fair value measurement is relevant not only for financial instruments, but also for certain transactions such as business combinations and for non-financial assets such as intangible assets that are acquired in such transactions.83 Goodwill
Although goodwill itself is not measured at fair value, it represents a residual amount after other amounts on the balance sheet have been measured at the date of acquisition. Goodwill must be tested for impairment annually or more frequently if certain triggering events occur. If the carrying amount of goodwill exceeds the residual amount from recognizing all other assets and liabilities on the balance sheet at the date of the impairment test, then goodwill must be written down to this revised residual amount, with the loss recognized in income.84 Indefinite-Lived Intangible Assets
Like goodwill, indefinite-lived intangible assets are required to be tested for impairment annually or more frequently if certain triggering events occur. If the carrying value of the indefinite-lived intangible exceeds its fair value, it must be written down to the estimated fair value, with the loss recognized in income.85 Other Long-Lived Assets
U.S. GAAP requires other long-lived assets, such as property, plant, and equipment, and finite-lived intangible assets, to be written down to fair value, in certain circumstances (e.g., when the expected cash flows to be generated by an asset or group of assets are less than the carrying value). In addition, long-lived assets held-for-sale must be written down to fair value less costs to sell. These losses are recognized in income.86
ii. IFRS
IFRS differs from U.S. GAAP as it relates to the use of fair value for non-financial instruments in two primary respects. First, IFRS provides a FVO for non-financial assets such as property, plant, equipment, and investment property, but does not do so for mortgage servicing rights (“MSRs”), as permitted under U.S. GAAP.87 Second, IFRS requires reversal of impairment 83 See, e.g., SFAS No. 141, paragraph B171. 84 See SFAS No. 142, Goodwill and Other Intangible Assets. 85 See Ibid. 86 See SFAS No. 144, Accounting for the Impairment or Disposal of Long-Lived Assets (“SFAS No. 144”). 87 See IAS 16, Property, Plant and Equipment; and IAS 40, Investment Property.
34
losses (when and if the value of an asset recovers) on non-financial assets other than goodwill in certain circumstances.88
3. Historical Context for Fair Value Accounting
Early-Twentieth Century through the Great Depression
Prior to the development of mandatory accounting standards following the Great Depression, companies had significant latitude in selecting their own accounting practices and policies. There is evidence that the use of “current values” or “appraised values” for assets, and the recording of upward asset revaluations, were common in the early-twentieth century in the period prior to the Depression. During this period, balance sheets often included upward revaluations of long-term assets such as property, plant, equipment, and intangible assets. For example, a survey of 208 large industrial firms between 1925 and 1934 revealed that 75% of the sample firms recorded upward or downward asset revaluations during this period, including 70 write-ups of property, plant, and equipment, seven write-ups of intangibles, and 43 write-ups of investments.89 Further, prior to 1938, banking organizations were required for supervisory purposes to use market value accounting for their investment securities portfolios. Serious concerns on the part of the U.S. Treasury and the bank regulators over how this affected the banks’ financial performance and investment decisions led the agencies to abandon in that year the use of this accounting concept for supervisory purposes.90 In the aftermath of the Great Depression, there was a general move toward more “conservative” accounting. This included a move away from the use of “current values” or “appraised values” for long-lived assets such as fixed assets and intangibles.91 This move away from “current value” accounting and towards the use of historic cost accounting for long-lived assets was strongly supported by Robert E. Healy, the first Chief Accountant of the SEC. Healy had participated in the Federal Trade Commission (“FTC”) investigation of business practices that preceded the formation of the SEC. This investigation uncovered widespread use of asset write-ups which the FTC viewed as arbitrary. Commenting on the findings of this investigation, Healy is quoted as observing that “you can capitalize in some [s]tates practically everything except the furnace ashes in the basement.”92 During Healy’s tenure, the newly-formed SEC strongly 88 See IAS 36, Impairment of Assets. 89 See Solomon Fabricant, Revaluations of Fixed Assets, 1925-1934, National Bureau of Economic Research Bulletin (December 1936). As a counterpoint, however, a study by Kirsten Eli & Gregory Waymire, Intangible Assets and Stock Prices in the Pre-SEC Era, 37 Journal of Accounting Research (Supplement) (1999), at 17-44, found evidence of some firms adopting deliberately conservative accounting policies in this pre-regulatory period. For example, many firms (e.g., General Electric) wrote-down their intangible assets to nominal amounts, e.g., $1. For a further discussion, see Gregory Waymire & Sudipta Basu, Accounting is an Evolving Economic Institution, Foundations and Trends in Accounting (2008), Forthcoming. 90 See, e.g., letter dated November 1, 1990, from Federal Reserve Chairman Alan Greenspan to SEC Chairman Richard Breeden. 91 See R. G. Walker, The SEC’s Ban on Upward Asset Revaluations and the Disclosure of Current Values, 28 Abacus 1 (1992), at 3-35. 92 Joel Seligman, The Transformation of Wall Street: A History of the Securities and Exchange Commission and Modern Corporate Finance, 108 (3rd ed. 2003).
35
endorsed historic cost accounting for long-lived assets and moved to curtail the use of “appraised values” through the registration process. By 1940, the practice of the upward revaluation of fixed assets – a practice that had been commonplace in the late 1920s – was virtually extinct from financial reporting in the U.S.93 Valuation of Securities The use of fair value measurement expanded significantly in 1975, with the issuance of authoritative accounting literature that mandated its use in certain circumstances due to concerns about the appropriate measurement attribute for equity securities. Prior to 1975, there was a lack of consistency in accounting literature, which resulted in diversity in accounting practice, specifically with respect to marketable securities. Accounting practices included carrying such securities at cost, at market, and, in some cases, a combination of both measurements for different classes of securities. During 1973 and 1974, there were substantial declines in the market values of many securities. These declines, in many cases, were not reflected in financial reports. When the market recovered in 1975, the accounting guidance was unclear on whether securities previously written down could be written up to previous carrying amounts. As a result of these issues, the FASB issued SFAS No. 12, Accounting for Certain Marketable Securities, in December 1975, which required that all marketable equity securities be recorded at the lower-of-cost-or-fair-value. Debt securities continued to be accounted for at amortized cost. Banking and Savings and Loan Crisis
The banking and savings and loan crisis of the 1980s exposed challenges with the historic cost model of accounting for financial institutions, as:
…in the Savings and Loan Crisis in the U.S., historic cost accounting masked the [extent of the] problem by allowing losses to show up gradually through negative net interest income. It can be argued that a mark-to-market approach would have helped to reveal to regulators and investors that these institutions had problems. This may have helped to prompt changes earlier than actually occurred and that would have allowed the problem to be reversed at a lower fiscal cost.94
Specifically, savings and loan institutions accepted short-term deposits and used these deposits to fund long-term fixed-rate (e.g., 30-year) mortgage loans, their primary asset. In the late 1970s and early 1980s, interest rates were driven up by high inflation. Many savings and loans were then in a position where they had to pay a higher rate of interest on their deposits than they were earning on their existing fixed-rate mortgage loans. If these savings and loan institutions had to sell their mortgage assets, which yielded, for example, five percent, to repay their deposits that were currently yielding, for example, ten percent, they would have had to severely discount their mortgage assets (because the current market rate was ten percent rather than the five percent
93 See Stephen Zeff, The SEC Rules Historic Cost Accounting: 1934 to the 1970s, 37 Accounting and Business Research (International Accounting Policy Forum Issue) (2007). 94 Franklin Allen & Elena Carletti, Mark-to-Market Accounting and Liquidity Pricing, 45 Journal of Accounting and Economics, at 358-378.
36
when their mortgages were originated). In some cases, the “current value” of their assets was less than the value of their liabilities, and these institutions were economically insolvent. However, under the historic cost accounting model, these losses were not reflected in their financial statements, with the effect of reducing transparency surrounding the solvency position of these institutions. This, in turn, created a moral hazard problem, whereby the management of economically less solvent institutions then had an incentive to take-on more risky investments (e.g., commercial real estate) in the hope that they could trade their way out of their current economically less solvent position. In effect, the historical-cost-based financial statements obscured underlying economic losses and allowed troubled financial institutions to go undetected. This led to various calls in the late 1980s and early 1990s for more use of market values in regulatory accounting for financial institutions.95
Historical-cost-based financial statements also allowed financial institutions to engage in “gains trading.”96 With the greater interest rate volatility in the 1980s, financial institutions were increasingly in the position of holding assets or liabilities where the current market values of these financial instruments differed markedly from their historical cost values shown in their financial statements. In this situation management could opportunistically choose which assets to sell, or which liabilities to settle, in order to realize gains (or losses) in particular accounting periods. This afforded management a powerful income statement management tool.97 In addition, for financial institutions short of capital, this created an incentive for the management to sell their well-performing assets in order to realize gains to boost their capital, but retain their poorly-performing assets (which had unrealized losses).
Changes in the Banking Model During the 1980s
The change in the business environment during the 1980s also provides the backdrop that is necessary to understand the progress of fair value accounting. Historically, many financial institutions did not have dynamic risk management strategies and would rarely sell investments before their maturity. Deregulation of interest rates during this period caused a change in the strategies of financial institutions, and securities positions were traded more actively. New financial instruments were created in response to changes in the market, such as deregulation, tax law changes, volatility, and other factors.98 U.S. GAAP for such changes in financial instruments was being developed on an issue-by-issue basis. For example, accounting literature issued included SFAS No. 52, Foreign Currency Translation, issued in 1981, which required fair value accounting for certain foreign exchange contracts through the income statement and SFAS 95 See, e.g., Edward J. Kane, The Gathering Crisis in Federal Deposit Insurance (1985); Lawrence J. White, On Measurement of Bank Capital, 13 Journal of Retail Banking 2 (1991), at 27-34; and George Benston, Market Value Accounting: Benefits, Costs and Incentives, Proceedings of the Conference on Bank Structure and Competition, Chicago: Federal Reserve Bank of Chicago (1989), at 547-563. 96 The FASB’s subsequent adoption of SFAS No. 115, requiring fair value accounting for most marketable securities was motivated, in part, by the desire to curtail such “gains trading.” See James Thompson, SFAS 115: A Victory for Fair Value Accounting, 39 National Public Accountant 10 (1994), at 21-30. 97 See testimony of Richard C. Breeden, Chairman, SEC, before Committee of Banking, Housing and Urban Affairs of United States Senate on Issues Involving Financial Institutions and Accounting Principles (June 25, 1999). 98 See SFAS No. 105, Disclosure of Information about Financial Instruments with Off-Balance-Sheet Risk and Financial Instruments with Concentrations of Credit Risks.

37
No. 80, Accounting for Futures Contracts, issued in 1984, which required futures contracts that do not qualify for hedge accounting to be measured at fair value through income.
FASB’s Financial Instruments Project
Due, in part, to the savings and loan crisis, the FASB recognized the need to develop disclosure and accounting requirements on a broader basis for all classes of financial instruments. The broader project was added to the FASB’s agenda in 1986 “to address financial reporting issues that were arising, or that were given a new sense of urgency, as a result of financial innovation.”99 A disclosure project was viewed as an interim step in addressing accounting issues surrounding such financial instruments and off-balance sheet financing. This project resulted in the issuance of SFAS No. 105, in March 1990, and SFAS No. 107, Disclosures about Fair Value of Financial Instruments (“SFAS No. 107”), in December 1991.
The FASB continued its work on a second phase of the broader project of accounting for financial instruments to address issues of inconsistent literature, the perceived greater relevance of fair value information, gains trading practices, and the inequitable result of lower-of-cost-or-fair-value accounting. This work resulted in the FASB issuing SFAS No. 115 in 1994. As previously described in this study, this statement requires companies to classify their investments in debt or equity securities as trading, AFS, or HTM, with different accounting models for each classification.
In June 1997, the FASB issued SFAS No. 130, Reporting Other Comprehensive Income (“SFAS No. 130”). This statement was issued in response to user concerns that changes in certain assets and liabilities were being recorded directly in equity, bypassing the income statement. In an attempt to improve the transparency and prominence of such items, the FASB required that changes in equity needed to be reported individually and with the same prominence as other financial statements included in a full set of financial statements. Unrealized gains and losses on AFS securities were one category required to be so reported. The impact of SFAS No. 130 was to make changes in value of AFS securities – which continue to be excluded from income – more transparent.
Expanded Use of Derivative Instruments in the 1990s
The historical cost accounting model was not well-suited to address the development and proliferation of derivative instruments. These instruments often involve little or no initial investment but, given the leveraged nature of the positions, subsequent changes in value can be dramatic. The historical accounting model did not appropriately capture the associated risks and uncertainties or subsequent changes in value. An increase in the use of derivatives, lack of transparency around their values, and major losses incurred by various entities as a result of investments in derivatives100 were factors that led the FASB to develop a new accounting
99 SFAS No. 133, paragraph 207. 100 See Thomas R. Weirich & Lynn E. Turner, What’s New in Derivative Regulation, 6 The Journal of Corporate Accounting and Finance 1 (Autumn 1994) at 1-16. Exhibit 2 in the article presents, “Major Losses due to Derivative Activity,” including $1 billion losses for Metallgesellschaft and Proctor & Gamble Co.
38
standard on derivative instruments, resulting in the issuance of SFAS No. 133 in June 1998.101 As noted previously in this study, SFAS No. 133 requires that all derivatives be accounted for at fair value on the balance sheet (with minor exceptions). Changes in the fair value of the derivatives are to be recorded in income unless the derivatives qualify for special accounting treatment known as hedge accounting.
4. Other Measurement Bases
a. Description of Other Measurement Bases
For the purpose of this discussion, measurement (the basis given for purposes of accounting) refers to both the initial measurement of an asset or liability and subsequent measurement, including revaluations, impairment, and depreciation. As noted above, fair value is only one of several measurement bases currently used in the mixed-attribute accounting model. Other measurement bases used in current accounting practice include:102 • Historical cost • Current cost • Net realizable value • Present value of future cash flows This list is not intended to be exhaustive. Some aspects of the measurement bases listed above could be disputed (e.g., the present value of future cash flows could be considered a measurement technique rather than a measurement basis per se). Other bases arguably could also be added (e.g., deprival value, which is the loss that an entity would suffer if it were deprived of an asset), but such other bases would typically be defined by reference to or hold attributes in common with the measurement bases listed.103 The Boards have been engaged in ongoing work to identify, define, and evaluate potential measurement bases in order to draw conceptual conclusions regarding their appropriateness in future standard-setting projects. Below, brief descriptions of the measurement bases listed above as used in current practice is provided, followed by discussion of the Boards’ ongoing work regarding potential measurement attributes. Section VI.B further discusses issues related to identifying appropriate measurement bases.
101 See SFAS No. 133, Background Information and Basis for Conclusions, especially paragraph 212, and United States General Accounting Office, Report to Congressional Requesters, Financial Derivatives: Actions Needed to Protect the Financial System (May 1994) 102 See SFAC No. 5, paragraph 67. 103 See IASB Discussion Paper, Measurement Bases for Financial Accounting – Measurement on Initial Recognition, prepared by the staff of the Canadian Accounting Standards Board (November 17, 2005), paragraphs 71, 73, and 94.

39
Historical Cost Historical cost (or historical proceeds) is the amount of cash, or its equivalent, paid to acquire an asset or received when an obligation is incurred.104 After initial measurement, it is often adjusted for impairment, depreciation, amortization or other allocations (e.g., historical cost less accumulated depreciation). Some have observed that the term “historical exchange price” may be more descriptive than “historical cost.” While such terms describe the measurement basis for many classes of assets (e.g., most inventory, property, equipment), it is less fitting for other classes of assets and liabilities (e.g., deferred income tax assets, warranties payable).105 Current Cost
Current cost broadly refers to the amount of cash or its equivalent currently required to replace the asset with an identical one or one with equivalent productive capacity or service potential.106 Some inventories are reported at current cost. Variations of current cost include replacement cost and reproduction cost. Net Realizable Value Net realizable value, sometimes referred to as settlement value, is the non-discounted amount of cash, or its equivalent, expected to be derived from the sale of an asset, net of selling costs and costs to complete, as well as the non-discounted amount of cash, or its equivalent, that is expected to be paid to liquidate an obligation in the due course of business. Examples of items where this measure is utilized include short-term receivables, trade payables, and warranty obligations.107
Present Value of Future Cash Flows
Present value of future cash flows refers to the present or discounted value of estimated future net cash flows, generally as expected to arise from an asset or to satisfy a liability in due course of business.108 Long-term receivables and payables are examples of items that incorporate the concept of discounted cash flows. This definition is similar to the concept of fundamental value or value-in-use,109 which would also take into account the entity’s internal information about the likely performance of the asset, such as its ability to extract above average net cash flows from
104 See SFAC No. 5, paragraph 67a. 105 See SFAC No. 5, paragraphs 68-69. 106 See SFAC No. 5, paragraph 67b; and IASB Discussion Paper, Measurement Bases for Financial Accounting – Measurement on Initial Recognition, prepared by the staff of the Canadian Accounting Standards Board (November 17, 2005), paragraph 320. 107 See SFAC No. 5, paragraph 67d. 108 See SFAC No. 5, paragraph 67e. 109 See SFAC No. 7, Using Cash Flow Information and Present Value in Accounting Measurements (“SFAC No. 7”), paragraph 24b; and IFRS 5A, Non-current Assets Held for Sale and Discontinued Operations (“IFRS 5A”).
40
an asset. Under IFRS, value-in-use is used, for example, to determine the recoverable amount in accounting for some impairment evaluations.110
b. Consideration of Measurement Attributes In developing standards, accounting standard-setters typically provide some degree of measurement guidance, including the required or permitted measurement attribute(s) to apply to the assets and liabilities that are covered by the particular standard. Ideally, the conceptual frameworks for the set of accounting standards would provide the standard-setter with tools to use in deciding when to apply particular measurement attributes. However, the Boards’ staffs have noted that measurement is one of the more underdeveloped areas in the accounting conceptual frameworks, commenting that “[n]either of the current [conceptual] frameworks provides any analysis of the strengths and weaknesses of the various measurement bases, nor do they offer any guidance on choosing among the listed bases or considering other alternatives.”111 In a 2003 study on principles-based accounting standards, the Staff observed that an ideal principles-based or objectives-oriented accounting standard would, among other things, be based on an improved and consistently applied conceptual framework.112 The Staff also observed that several facets of the FASB’s existing conceptual framework would need to be addressed in order to facilitate a shift to a more principles-based regime, including the establishment of a paradigm for selecting from among possible measurement attributes.113 Since 2004, the Boards have been engaged in ongoing work to improve, on a joint basis, their existing respective conceptual frameworks. The project has multiple phases, with “Phase C” focusing on measurement.114 Phase C of the project seeks to identify and define possible measurement bases (“Milestone I”), evaluate the measurement basis candidates (“Milestone II”), and draw conceptual conclusions (such as whether use of a single measurement basis would satisfy the needs of financial statement users or if some combination of bases is needed), as well as address practical measurement issues that the Boards encounter when developing standards (“Milestone III”). Milestone I was completed in Spring 2007, with the Boards agreeing to a set of nine proposed measurement basis candidates, which differ in terminology from the measurement bases described earlier that are currently in use.115 The nine proposed measurement basis candidates are discussed further in Section VI.B of this study. 110 See IFRS 5A. 111 See the Boards’ staffs, Conceptual Framework Project Phase C: Measurement Milestone I Summary Report – Inventory and Definitions of Possible Measurement Bases (“Milestone I Summary Report”). (available at: http://www.fasb.org/project/CF_Milestone_I_Summary_Report.pdf) 112 See Study Pursuant to Section 108(d) of the Sarbanes-Oxley Act of 2002 on the Adoption by the United States Financial Reporting System of a Principles-Based Accounting System, July 2003 (“Principles-Based Accounting Study”), at Executive Summary. 113 See Ibid. 114 See information about the Boards’ joint project at: http://www.fasb.org/project/conceptual_framework.shtml#background. 115 See Milestone I Summary Report.
41
The Staff has previously observed a need for the FASB’s existing conceptual framework to more clearly articulate how the trade-offs among relevance, reliability, and comparability of accounting information should be made.116 Relevance, reliability, and comparability are referred to as “qualitative characteristics” of accounting information, and have been described as follows:117 • Relevance – the capacity of information to make a difference in a decision by helping users
to form predictions about the outcomes of the past, present, and future events or to confirm or correct prior expectations.
• Reliability – the quality of information that assures that information is reasonably free from
error and bias and faithfully represents what it purports to represent. • Comparability – the quality of information that enables users to identify similarities in and
differences between two sets of economic phenomena. During January and February 2007, the Boards held roundtable discussions on measurement and gathered views from the roundtable participants as to how well different measurement bases satisfied these qualitative characteristics.118 The most frequent comment about historical cost as a measurement basis was that it is reliable. The most frequent criticism of historical cost was that it is not relevant. A few participants noted that historical cost is not comparable (i.e., it gives different numbers for the same items). In contrast, the most frequent comment about fair value was that it is the most relevant attribute for an asset or liability (i.e., contemporary information is more useful to financial statement users in making decisions). However, some participants expressed concerns about fair value on the grounds that it is not reliable. More specific comments about fair value were that it is not objective, it is not precise, it is subject to too many assumptions, and that investors are skeptical of mark-to-model numbers.
116 See Principles-Based Accounting Study. 117 See SFAC No. 2, Qualitative Characteristics of Accounting Information. 118 Roundtable participants included representatives of reporting entities (preparers), auditors, investors, regulators, and other users of financial reporting. See Boards’ staffs, Summary Report of the Conceptual Framework Measurement Roundtables, Hong Kong, London, and Norwalk (January and February 2007), paragraph 52. (available at http://www.fasb.org/project/cf_roundtable_summary_report.pdf)

42

43
II. Effects of Fair Value Accounting Standards on Financial Institutions’ Balance Sheets
This section of the study examines the impact of fair value accounting on financial institutions’ balance sheets.119 While not mandated by the Act, to obtain a more complete understanding of the impact of such accounting, this section also considers its impact on the income statement. Specifically, this section provides: • An overview of the methodology for studying the effects of fair value accounting standards;
and • Empirical findings from this study. As demonstrated by this study, fair value, on an overall basis, is used to measure less than a majority of assets and liabilities of financial institutions, with mark-to-market accounting (for which changes in fair value are recognized in income) representing a significantly smaller population of instruments, generally comprised of trading securities and derivatives. However, the impact of changes in fair value on the income statement is significant.
A. Methodology for Studying Effects of Fair Value Accounting Standards
For purposes of this section, the Staff studied the application of fair value accounting on financial institutions’ balance sheets based on a sample of 50 issuers determined as follows: • The Staff prepared a list of public financial institutions on a best-efforts basis. The Staff
focused on public entities due to the readily available financial data for these entities. This list included banks, broker-dealers, and insurance companies, as mandated by the Act, as well as credit institutions and GSEs, as they are also institutions in the financial sector that may be affected by fair value accounting standards. Inclusion in this list was based on Standard Industrial Classification, or SIC, codes120 and comprised over 900 issuers.
• The Staff ranked this population by total reported value of assets as of the issuer’s most
recent fiscal year end. • The Staff selected a sample of 50 issuers from this ranked list as follows:
o To obtain at least 75% coverage of financial institution assets in the U.S. as of the most recent fiscal year end, after the exclusions discussed below, the Staff chose the first 30 issuers on this list. Throughout this section, these larger financial institutions are referred
119 Unless otherwise specified, percentages and dollar amounts throughout the remainder of this study represent approximations. 120 The following SIC codes were included in the sample: 6000, 6011, 6020-22, 6025, 6030, 6035-36, 6111, 6140, 6141, 6200, 6210-11, 6231, 6282, 6305, 6310-11, 6320-21, 6324, 6330-31, 6350-51, 6360-61, 6399, 6411 6712, and 6719.

44
to as “large issuers.” All issuers in this sample had assets as of the most recent fiscal year end of greater than $135 billion.
o To obtain a representative sample of smaller financial institutions, the Staff chose 20
issuers, starting with the next largest company in this ranked list and then every 42nd company. Throughout this study, these smaller financial institutions are referred to as “small issuers.”
o If an initially selected company did not meet the additional criteria below, it was
excluded and the immediately following company was selected.
- Foreign private issuers were excluded due to the difficulty in obtaining financial information under U.S. GAAP on an annual and quarterly basis.
- Issuers with year-ends other than November 30 or December 31 were excluded to
facilitate comparability of financial results on an annual and quarterly basis.121
- Issuers were excluded if they did not have current financial statements, notes to the financial statements, and MD&A disclosures available via annual filings (i.e., Forms 10-K or 10-KSB) and quarterly filings (i.e., Forms 10-Q or 10-QSB) with the SEC.
Data utilized for this study were obtained from Forms 10-K, 10-KSB, 10-Q, and 10-QSB, as applicable, filed by these issuers with the SEC.
The effective date for SFAS No. 157 and SFAS No. 159 was January 1, 2008 for all calendar year-end companies. Accordingly, the Staff performed its study as of the end of the first reporting quarter after the effective date of SFAS No. 157 and SFAS No. 159 (first quarter 2008) for all companies for the purposes of the balance sheet study. However, companies were permitted to early adopt both standards as of January 1, 2007. Eleven issuers in the sample (primarily large banks and broker-dealers) early adopted these standards. Therefore, during the 2007 calendar year, there is a lack of comparability of accounting information between early adopters and those that did not early adopt. Accordingly, to understand progression and changes in the use of fair value over time, the Staff compared financial information as of the end of 2006 and first quarter 2008, as neither SFAS No. 157 nor SFAS No. 159 was effective for the 2006 calendar year for any company and all companies had completed their adoption of these standards as of the first quarter of 2008. Where SFAS No. 157 and SFAS No. 159 had no impact on specific financial data, the Staff compared 2006, 2007, and 2008. The inclusion of third quarter information in the analysis of the impact was determined by the timing of the availability of third quarter information, as third quarter filings for most issuers in the sample selected were not due until November 10, 2008. Accordingly, third quarter information was primarily utilized in certain analyses to demonstrate the progressive impact of fair value accounting over time. As of December 15, 2008, two issuers (one large bank and one
121 There were three issuers in the sample which had November 30 year-ends and 47 issuers in the sample which had December 31 year-ends.
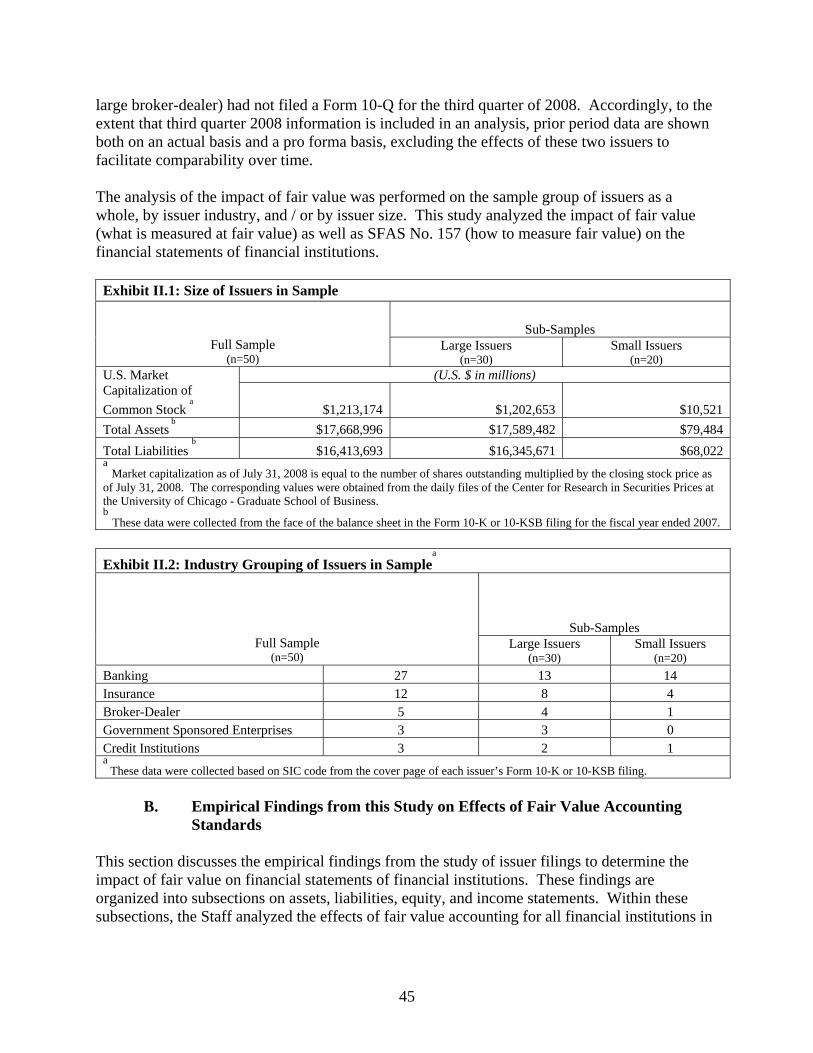
45
large broker-dealer) had not filed a Form 10-Q for the third quarter of 2008. Accordingly, to the extent that third quarter 2008 information is included in an analysis, prior period data are shown both on an actual basis and a pro forma basis, excluding the effects of these two issuers to facilitate comparability over time. The analysis of the impact of fair value was performed on the sample group of issuers as a whole, by issuer industry, and / or by issuer size. This study analyzed the impact of fair value (what is measured at fair value) as well as SFAS No. 157 (how to measure fair value) on the financial statements of financial institutions. Exhibit II.1: Size of Issuers in Sample
Sub-Samples Full Sample
(n=50) Large Issuers
(n=30) Small Issuers
(n=20) (U.S. $ in millions) U.S. Market
Capitalization of Common Stock
a $1,213,174 $1,202,653 $10,521
Total Assets b $17,668,996 $17,589,482 $79,484
Total Liabilities b $16,413,693 $16,345,671 $68,022
a Market capitalization as of July 31, 2008 is equal to the number of shares outstanding multiplied by the closing stock price as of July 31, 2008. The corresponding values were obtained from the daily files of the Center for Research in Securities Prices at the University of Chicago - Graduate School of Business. b These data were collected from the face of the balance sheet in the Form 10-K or 10-KSB filing for the fiscal year ended 2007.
Exhibit II.2: Industry Grouping of Issuers in Sample
a
Sub-Samples Full Sample
(n=50) Large Issuers
(n=30) Small Issuers
(n=20) Banking 27 13 14 Insurance 12 8 4 Broker-Dealer 5 4 1 Government Sponsored Enterprises 3 3 0 Credit Institutions 3 2 1 a
These data were collected based on SIC code from the cover page of each issuer’s Form 10-K or 10-KSB filing.
B. Empirical Findings from this Study on Effects of Fair Value Accounting Standards
This section discusses the empirical findings from the study of issuer filings to determine the impact of fair value on financial statements of financial institutions. These findings are organized into subsections on assets, liabilities, equity, and income statements. Within these subsections, the Staff analyzed the effects of fair value accounting for all financial institutions in
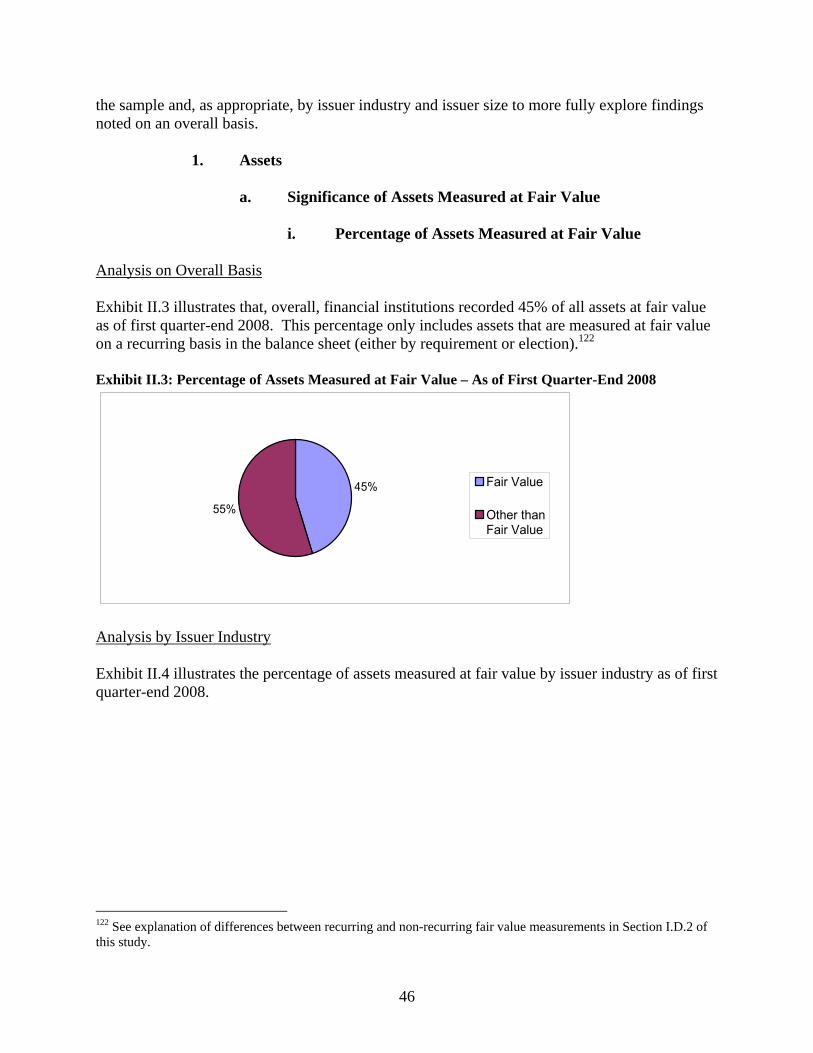
46
the sample and, as appropriate, by issuer industry and issuer size to more fully explore findings noted on an overall basis.
1. Assets
a. Significance of Assets Measured at Fair Value
i. Percentage of Assets Measured at Fair Value Analysis on Overall Basis Exhibit II.3 illustrates that, overall, financial institutions recorded 45% of all assets at fair value as of first quarter-end 2008. This percentage only includes assets that are measured at fair value on a recurring basis in the balance sheet (either by requirement or election).122 Exhibit II.3: Percentage of Assets Measured at Fair Value – As of First Quarter-End 2008
45%
55%
Fair Value
Other thanFair Value
Analysis by Issuer Industry Exhibit II.4 illustrates the percentage of assets measured at fair value by issuer industry as of first quarter-end 2008.
122 See explanation of differences between recurring and non-recurring fair value measurements in Section I.D.2 of this study.
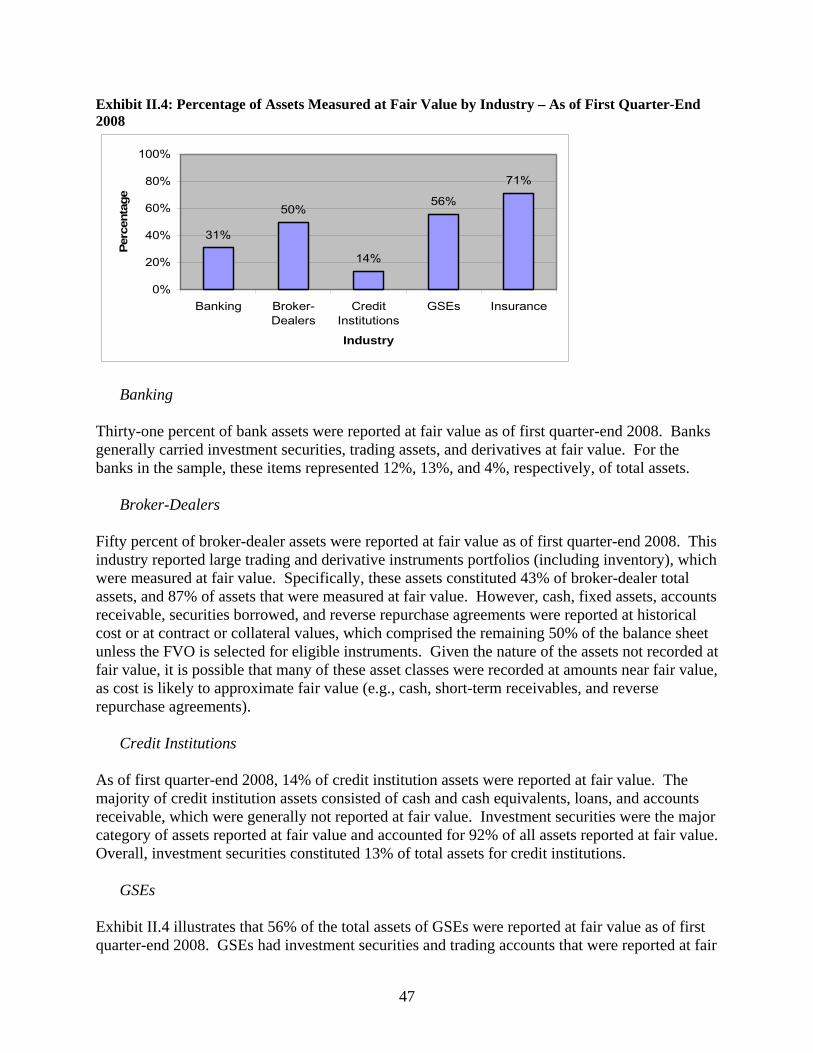
47
Exhibit II.4: Percentage of Assets Measured at Fair Value by Industry – As of First Quarter-End 2008
50%56%
71%
14%
31%
0%
20%
40%
60%
80%
100%
Banking Broker-Dealers
CreditInstitutions
GSEs Insurance
Industry
Perc
enta
ge
Banking
Thirty-one percent of bank assets were reported at fair value as of first quarter-end 2008. Banks generally carried investment securities, trading assets, and derivatives at fair value. For the banks in the sample, these items represented 12%, 13%, and 4%, respectively, of total assets.
Broker-Dealers
Fifty percent of broker-dealer assets were reported at fair value as of first quarter-end 2008. This industry reported large trading and derivative instruments portfolios (including inventory), which were measured at fair value. Specifically, these assets constituted 43% of broker-dealer total assets, and 87% of assets that were measured at fair value. However, cash, fixed assets, accounts receivable, securities borrowed, and reverse repurchase agreements were reported at historical cost or at contract or collateral values, which comprised the remaining 50% of the balance sheet unless the FVO is selected for eligible instruments. Given the nature of the assets not recorded at fair value, it is possible that many of these asset classes were recorded at amounts near fair value, as cost is likely to approximate fair value (e.g., cash, short-term receivables, and reverse repurchase agreements).
Credit Institutions
As of first quarter-end 2008, 14% of credit institution assets were reported at fair value. The majority of credit institution assets consisted of cash and cash equivalents, loans, and accounts receivable, which were generally not reported at fair value. Investment securities were the major category of assets reported at fair value and accounted for 92% of all assets reported at fair value. Overall, investment securities constituted 13% of total assets for credit institutions.
GSEs
Exhibit II.4 illustrates that 56% of the total assets of GSEs were reported at fair value as of first quarter-end 2008. GSEs had investment securities and trading accounts that were reported at fair

48
value. For the GSEs in the sample, these items represent 49% and 6%, respectively, of total assets. Investment securities were the major category of assets reported at fair value and accounted for 87% of all assets reported at fair value.
Insurance
Exhibit II.4 illustrates that at 71% of total assets, the insurance industry had the greatest amount of assets reported at fair value on the balance sheet as of first quarter-end 2008. Insurance companies reported investment securities and separate account assets at fair value. For the insurance companies in the sample, these items represented 44% and 24%, respectively, of total assets. These two asset categories accounted for 96% of all assets at fair value. Analysis by Issuer Size Exhibit II.5 shows the level of fair value measurements as a percentage of total assets of the large issuers compared to the small issuers as of first quarter-end 2008. Exhibit II.5: Percentage of Assets Measured at Fair Value by Issuer Size – As of First Quarter-End 2008
45%54%55%
46%
0%
20%
40%
60%
80%
100%
Large Issuers Small Issuers
Size
Perc
enta
ge
Fair ValueOther than Fair Value
As of first quarter-end 2008, the analysis illustrates that the percentage of assets measured at fair value was 45% for the large issuers and 54% for the small issuers. The small issuers included in the sample have a larger percentage of assets at fair value than the large issuers due to the industry composition of the large and small issuer groups. As noted above, insurance companies comprised about 18% of large issuer total assets, and approximately 72% of small issuer total assets. Insurance companies generally reported a greater percentage of assets at fair value. Further, insurance companies in the small issuer group reported 69% of total assets are at fair value, which was only slightly lower than the 71% of assets at fair value for the large insurance companies.
With respect to the non-insurance companies in the large issuer group, 39% of their assets were recorded at fair value compared to only 16% of assets at fair value for the non-insurance companies in the small issuers sampled. There were two primary reasons the percentage of
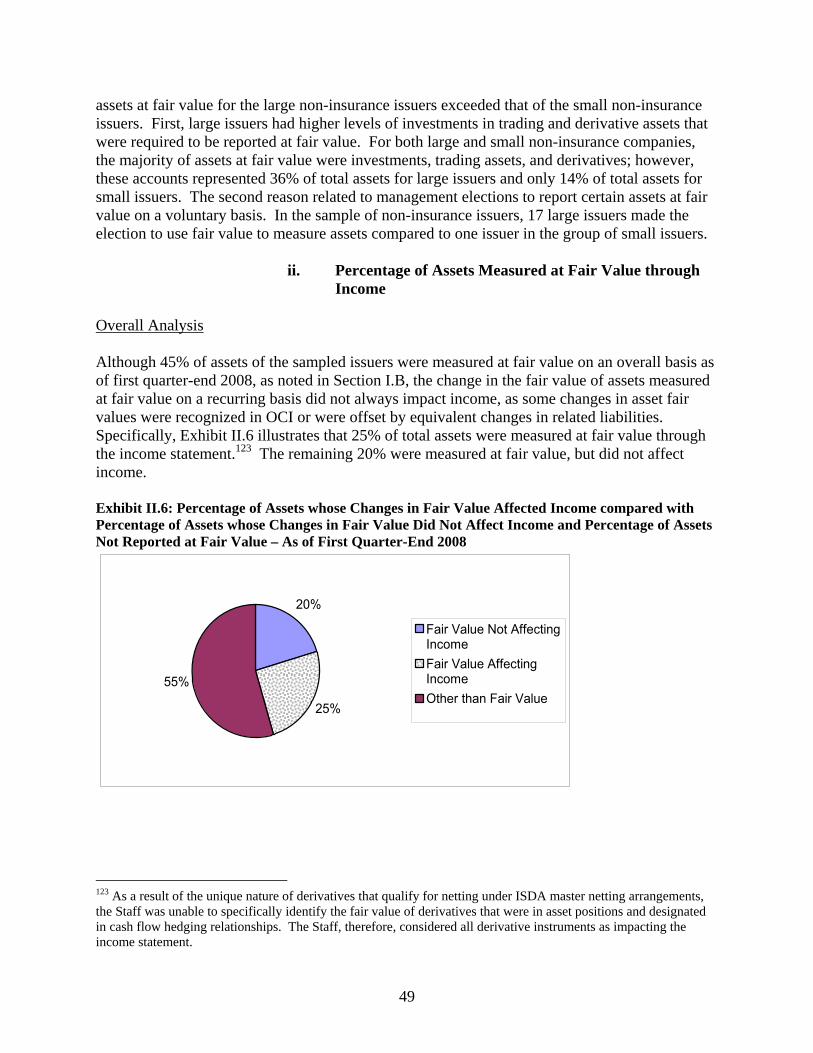
49
assets at fair value for the large non-insurance issuers exceeded that of the small non-insurance issuers. First, large issuers had higher levels of investments in trading and derivative assets that were required to be reported at fair value. For both large and small non-insurance companies, the majority of assets at fair value were investments, trading assets, and derivatives; however, these accounts represented 36% of total assets for large issuers and only 14% of total assets for small issuers. The second reason related to management elections to report certain assets at fair value on a voluntary basis. In the sample of non-insurance issuers, 17 large issuers made the election to use fair value to measure assets compared to one issuer in the group of small issuers.
ii. Percentage of Assets Measured at Fair Value through
Income
Overall Analysis Although 45% of assets of the sampled issuers were measured at fair value on an overall basis as of first quarter-end 2008, as noted in Section I.B, the change in the fair value of assets measured at fair value on a recurring basis did not always impact income, as some changes in asset fair values were recognized in OCI or were offset by equivalent changes in related liabilities. Specifically, Exhibit II.6 illustrates that 25% of total assets were measured at fair value through the income statement.123 The remaining 20% were measured at fair value, but did not affect income. Exhibit II.6: Percentage of Assets whose Changes in Fair Value Affected Income compared with Percentage of Assets whose Changes in Fair Value Did Not Affect Income and Percentage of Assets Not Reported at Fair Value – As of First Quarter-End 2008
20%
25%
55%
Fair Value Not AffectingIncomeFair Value AffectingIncomeOther than Fair Value
123 As a result of the unique nature of derivatives that qualify for netting under ISDA master netting arrangements, the Staff was unable to specifically identify the fair value of derivatives that were in asset positions and designated in cash flow hedging relationships. The Staff, therefore, considered all derivative instruments as impacting the income statement.

50
Analysis by Issuer Industry Exhibit II.7 provides an analysis of assets measured at fair value through the income statement, assets measured at fair value without affecting income, and assets that were measured at other than fair value by issuer industry.
Exhibit II.7: Percentage of Assets whose Changes in Fair Value Affected Income compared with Percentage of Assets whose Changes in Fair Value Did Not Affect Income and Percentage of Assets Not Reported at Fair Value by Industry – As of First Quarter-End 2008
0%
20%
40%
60%
80%
100%
Fair ValueNot Affecting
Income
Fair ValueAffectingIncome
Other thanFair Value
Perc
enta
ge
BankingBroker-DealersCredit InstitutionsGSEsInsurance
Banking
Exhibit II.4 illustrates that 31% of total bank assets were reported at fair value as of first quarter-end 2008. Of assets reported at fair value, 30% constituted investment securities reported as AFS (with changes in fair value recognized in OCI). Accordingly, as illustrated in Exhibit II.7, 22% of total assets were reported at fair value with changes in value impacting income, primarily comprised of trading securities and derivatives, and 9% of total assets were reported at fair value changes recognized in OCI.
Broker-Dealers
Exhibit II.4 illustrates that 50% of broker-dealer assets were measured at fair value and changes in the fair value of almost all of these assets were reported in the income statement. Broker-dealers generally had an insignificant percentage of assets that were measured at fair value through OCI. This industry reported large trading and derivative instruments portfolios (including trading inventory), which were measured at fair value with changes recorded in the income statement.
Credit Institutions
Of the 14% of total credit institution assets measured at fair value as of first quarter-end 2008, 90% of assets measured at fair value were investment securities classified as AFS. Thus, the issuers sampled in this industry group had 1% of total assets measured at fair value with changes
51
in fair value recorded in the income statement, and 13% of total assets measured at fair value with changes recorded in OCI.
GSEs
Of the 56% of total assets measured at fair value as of first quarter-end 2008, 76% were investment securities classified as AFS. Therefore, this industry group had 13% of assets that were measured at fair value with changes in fair value recorded in the income statement and 43% of assets measured at fair value with change recorded in OCI.
Insurance
Exhibit II.4 illustrates that at 71% of total assets as of first quarter-end 2008, the insurance industry had the greatest amount of assets reported at fair value on the balance sheet. However, 62% of total insurance company assets that were reported at fair value did not affect net income. Specifically, 38% of their total assets were AFS investment securities which were measured at fair value, with the changes in the fair value of such assets recorded in OCI. The next largest group of assets recorded at fair value was separate account assets, which represented 24% of total assets. These separate account assets had an offsetting separate accounts liability, and the change in the fair value of the separate account assets generally resulted in an equal and offsetting change in the separate account liability. Therefore, although this item was recorded at fair value, the net change in fair value of the asset and liability had little, if any, impact on net income on a recurring basis. In other words, the changes in fair value offset. After considering investment securities and separate account assets, 9% of total assets measured at fair value impacted the income statement for the insurance industry. Analysis by Issuer Size Exhibit II.8 provides an analysis of assets measured at fair value through the income statement, assets measured at fair value without affecting income, and assets that were measured at other than fair value by issuer size as of first quarter-end 2008.
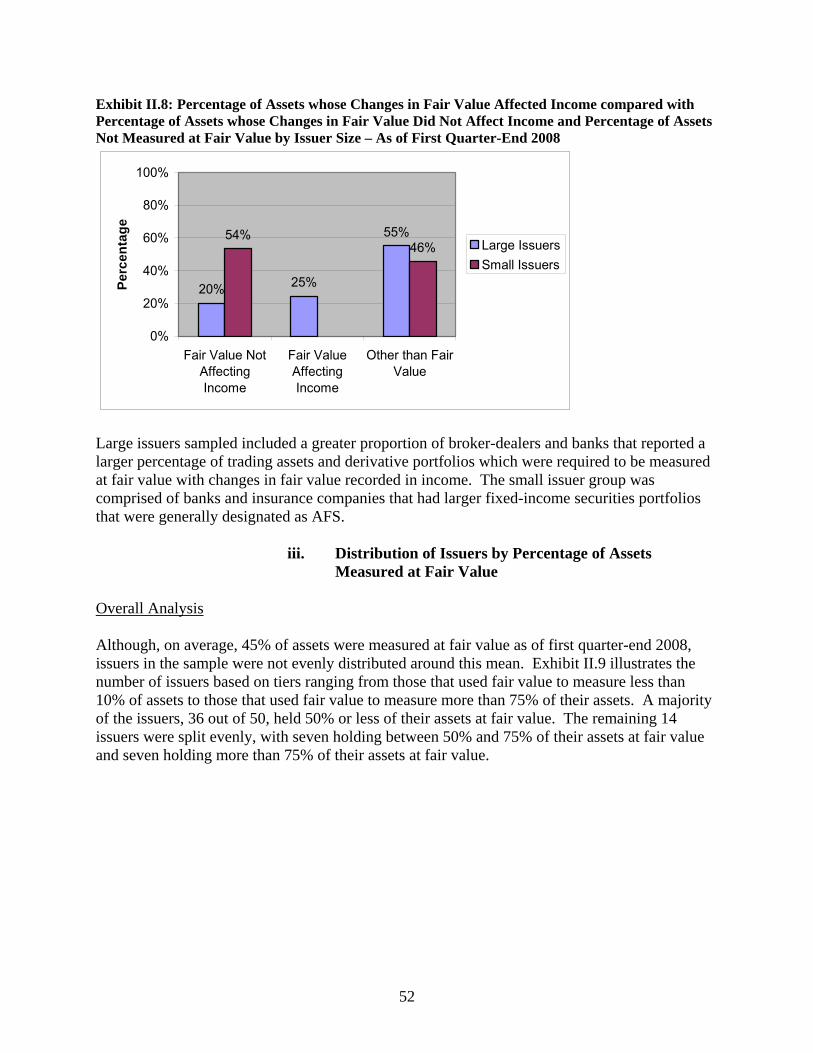
52
Exhibit II.8: Percentage of Assets whose Changes in Fair Value Affected Income compared with Percentage of Assets whose Changes in Fair Value Did Not Affect Income and Percentage of Assets Not Measured at Fair Value by Issuer Size – As of First Quarter-End 2008
20% 25%
55%54%46%
0%
20%
40%
60%
80%
100%
Fair Value NotAffectingIncome
Fair ValueAffectingIncome
Other than FairValue
Perc
enta
ge
Large IssuersSmall Issuers
Large issuers sampled included a greater proportion of broker-dealers and banks that reported a larger percentage of trading assets and derivative portfolios which were required to be measured at fair value with changes in fair value recorded in income. The small issuer group was comprised of banks and insurance companies that had larger fixed-income securities portfolios that were generally designated as AFS.
iii. Distribution of Issuers by Percentage of Assets Measured at Fair Value
Overall Analysis Although, on average, 45% of assets were measured at fair value as of first quarter-end 2008, issuers in the sample were not evenly distributed around this mean. Exhibit II.9 illustrates the number of issuers based on tiers ranging from those that used fair value to measure less than 10% of assets to those that used fair value to measure more than 75% of their assets. A majority of the issuers, 36 out of 50, held 50% or less of their assets at fair value. The remaining 14 issuers were split evenly, with seven holding between 50% and 75% of their assets at fair value and seven holding more than 75% of their assets at fair value.
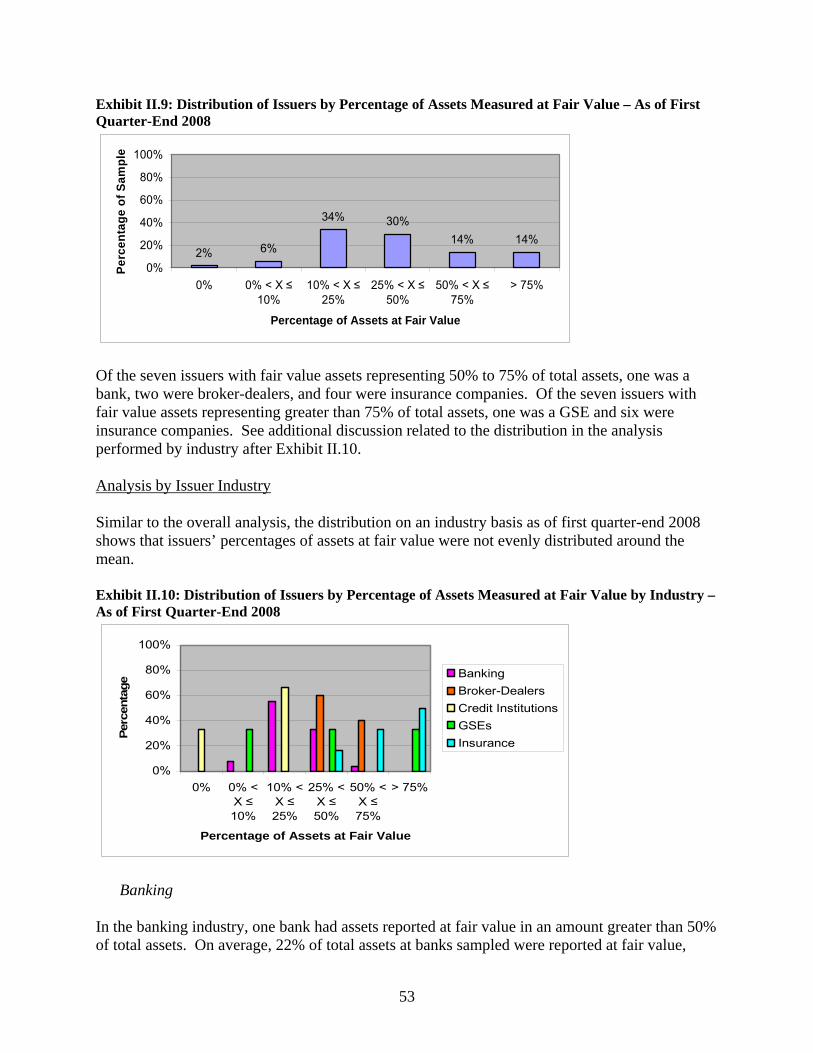
53
Exhibit II.9: Distribution of Issuers by Percentage of Assets Measured at Fair Value – As of First Quarter-End 2008
2% 6%
34% 30%14% 14%
0%
20%
40%
60%
80%
100%
0% 0% < X ≤10%
10% < X ≤25%
25% < X ≤50%
50% < X ≤75%
> 75%
Percentage of Assets at Fair Value
Perc
enta
ge o
f Sam
ple
Of the seven issuers with fair value assets representing 50% to 75% of total assets, one was a bank, two were broker-dealers, and four were insurance companies. Of the seven issuers with fair value assets representing greater than 75% of total assets, one was a GSE and six were insurance companies. See additional discussion related to the distribution in the analysis performed by industry after Exhibit II.10. Analysis by Issuer Industry Similar to the overall analysis, the distribution on an industry basis as of first quarter-end 2008 shows that issuers’ percentages of assets at fair value were not evenly distributed around the mean. Exhibit II.10: Distribution of Issuers by Percentage of Assets Measured at Fair Value by Industry – As of First Quarter-End 2008
0%
20%
40%
60%
80%
100%
0% 0% <X ≤10%
10% <X ≤25%
25% <X ≤50%
50% <X ≤75%
> 75%
Percentage of Assets at Fair Value
Perc
enta
ge
BankingBroker-DealersCredit InstitutionsGSEsInsurance
Banking
In the banking industry, one bank had assets reported at fair value in an amount greater than 50% of total assets. On average, 22% of total assets at banks sampled were reported at fair value,
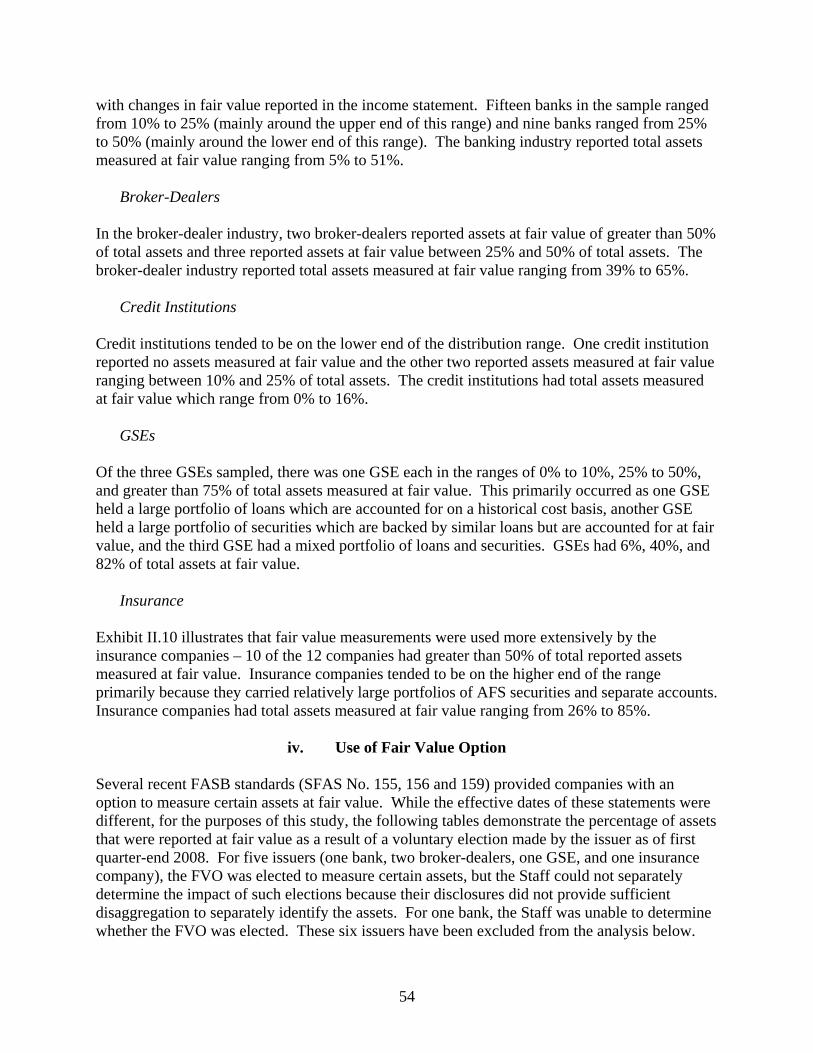
54
with changes in fair value reported in the income statement. Fifteen banks in the sample ranged from 10% to 25% (mainly around the upper end of this range) and nine banks ranged from 25% to 50% (mainly around the lower end of this range). The banking industry reported total assets measured at fair value ranging from 5% to 51%.
Broker-Dealers
In the broker-dealer industry, two broker-dealers reported assets at fair value of greater than 50% of total assets and three reported assets at fair value between 25% and 50% of total assets. The broker-dealer industry reported total assets measured at fair value ranging from 39% to 65%.
Credit Institutions
Credit institutions tended to be on the lower end of the distribution range. One credit institution reported no assets measured at fair value and the other two reported assets measured at fair value ranging between 10% and 25% of total assets. The credit institutions had total assets measured at fair value which range from 0% to 16%.
GSEs
Of the three GSEs sampled, there was one GSE each in the ranges of 0% to 10%, 25% to 50%, and greater than 75% of total assets measured at fair value. This primarily occurred as one GSE held a large portfolio of loans which are accounted for on a historical cost basis, another GSE held a large portfolio of securities which are backed by similar loans but are accounted for at fair value, and the third GSE had a mixed portfolio of loans and securities. GSEs had 6%, 40%, and 82% of total assets at fair value.
Insurance
Exhibit II.10 illustrates that fair value measurements were used more extensively by the insurance companies – 10 of the 12 companies had greater than 50% of total reported assets measured at fair value. Insurance companies tended to be on the higher end of the range primarily because they carried relatively large portfolios of AFS securities and separate accounts. Insurance companies had total assets measured at fair value ranging from 26% to 85%.
iv. Use of Fair Value Option
Several recent FASB standards (SFAS No. 155, 156 and 159) provided companies with an option to measure certain assets at fair value. While the effective dates of these statements were different, for the purposes of this study, the following tables demonstrate the percentage of assets that were reported at fair value as a result of a voluntary election made by the issuer as of first quarter-end 2008. For five issuers (one bank, two broker-dealers, one GSE, and one insurance company), the FVO was elected to measure certain assets, but the Staff could not separately determine the impact of such elections because their disclosures did not provide sufficient disaggregation to separately identify the assets. For one bank, the Staff was unable to determine whether the FVO was elected. These six issuers have been excluded from the analysis below.

55
Analysis on Overall Basis The elective use of fair value under the FVO was not made extensively by issuers in the sample. As illustrated in Exhibit II.11 below, 4% of total assets were reported at fair value by using fair value accounting on a voluntary basis as of first quarter-end 2008. This may explain the slight increase in fair value from year-end 2006 to first quarter-end 2008 noted in Exhibit II.13 below. Exhibit II.11: Percentage of Assets Reported under the FVO – As of First Quarter-End 2008
4%
96%
Fair Value OptionAssetsAll Other Assets
The fair value election was primarily selected for certain HFS loans, which issuers manage on a fair value basis and for other assets such as MSRs where hedge accounting provisions are complex making FVO an attractive choice. Additionally, several issuers elected the FVO for reverse repurchase agreements.
Analysis by Issuer Industry As illustrated in Exhibit II.12 below, the percentage of FVO assets to total assets, by industry, was 4% for banks, 6% for broker-dealers, 5% for GSEs, and 3% for insurance companies.
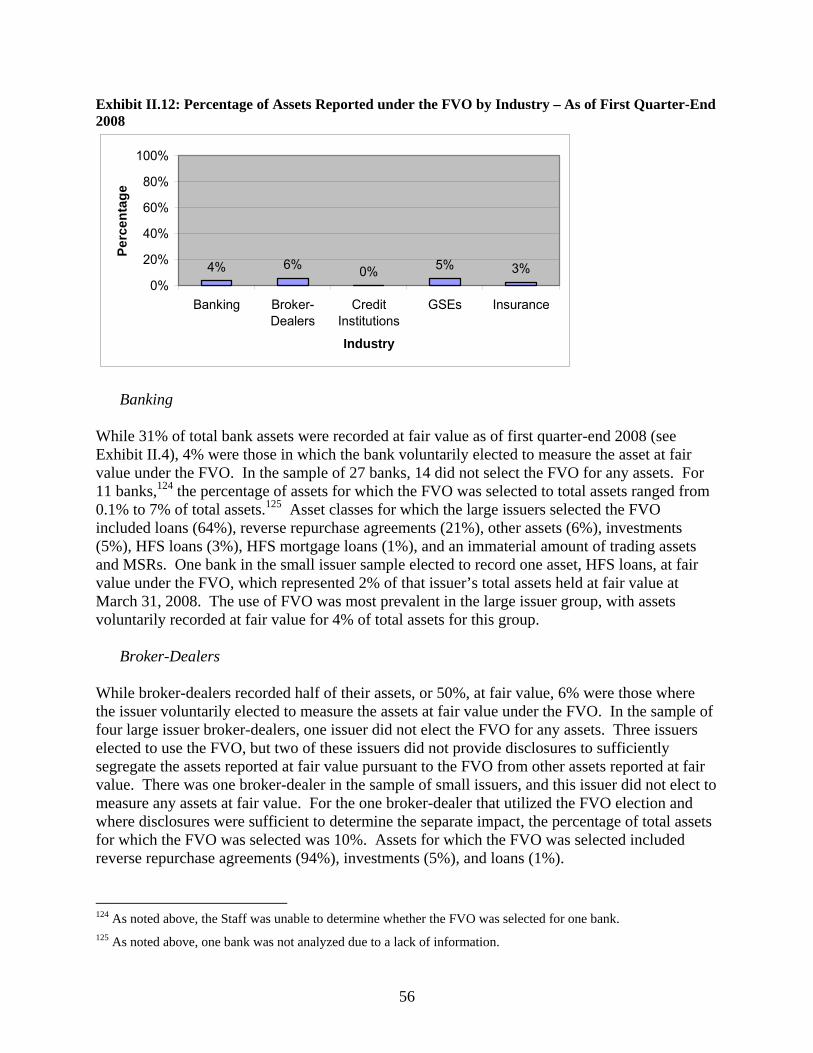
56
Exhibit II.12: Percentage of Assets Reported under the FVO by Industry – As of First Quarter-End 2008
4% 6% 0% 5% 3%0%
20%
40%
60%
80%
100%
Banking Broker-Dealers
CreditInstitutions
GSEs Insurance
Industry
Perc
enta
ge
Banking
While 31% of total bank assets were recorded at fair value as of first quarter-end 2008 (see Exhibit II.4), 4% were those in which the bank voluntarily elected to measure the asset at fair value under the FVO. In the sample of 27 banks, 14 did not select the FVO for any assets. For 11 banks,124 the percentage of assets for which the FVO was selected to total assets ranged from 0.1% to 7% of total assets.125 Asset classes for which the large issuers selected the FVO included loans (64%), reverse repurchase agreements (21%), other assets (6%), investments (5%), HFS loans (3%), HFS mortgage loans (1%), and an immaterial amount of trading assets and MSRs. One bank in the small issuer sample elected to record one asset, HFS loans, at fair value under the FVO, which represented 2% of that issuer’s total assets held at fair value at March 31, 2008. The use of FVO was most prevalent in the large issuer group, with assets voluntarily recorded at fair value for 4% of total assets for this group.
Broker-Dealers While broker-dealers recorded half of their assets, or 50%, at fair value, 6% were those where the issuer voluntarily elected to measure the assets at fair value under the FVO. In the sample of four large issuer broker-dealers, one issuer did not elect the FVO for any assets. Three issuers elected to use the FVO, but two of these issuers did not provide disclosures to sufficiently segregate the assets reported at fair value pursuant to the FVO from other assets reported at fair value. There was one broker-dealer in the sample of small issuers, and this issuer did not elect to measure any assets at fair value. For the one broker-dealer that utilized the FVO election and where disclosures were sufficient to determine the separate impact, the percentage of total assets for which the FVO was selected was 10%. Assets for which the FVO was selected included reverse repurchase agreements (94%), investments (5%), and loans (1%). 124 As noted above, the Staff was unable to determine whether the FVO was selected for one bank. 125 As noted above, one bank was not analyzed due to a lack of information.
57
Credit Institutions None of the three credit institutions elected to measure assets at fair value under the FVO.
GSEs While 56% of total GSE assets were recorded at fair value, 5% were those related to a voluntary election to measure assets at fair value under the FVO. All three of the GSEs in the sample elected the FVO. However, as mentioned above, one GSE did not provide disclosures to sufficiently segregate the assets reported at fair value pursuant to the FVO from other assets reported at fair value. For the two GSEs that did use the FVO election and for which disclosure was sufficient to segregate the impact, the analysis illustrated that assets for which the FVO was selected constituted 6% and 2%, respectively. Assets for which the FVO was selected included both non-mortgage-related securities and mortgage-related securities.
Insurance Four of the 12 insurance companies made a FVO election, which involved insignificant assets and liabilities in comparison to the respective consolidated amounts. The FVO was elected for short-term investments; trading securities (previously classified as AFS); securities purchased under agreements to resell; fixed-maturity and equity securities backing certain pension products; commercial loans; private equity investments; and investments in loan funds, hedge funds, non-U.S. fixed-income funds, and catastrophe bonds.
v. Comparison of Percentage of Assets Measured at Fair Value Before and After Adoption of SFAS No. 157 and SFAS No. 159
To isolate the impact of SFAS No. 157 and SFAS No. 159 on the amount of assets measured at fair value, the Staff compared the use of fair value before and after the effective date of these standards. Towards this end, the percentage of assets at fair value before the adoption of SFAS No. 157 (as of year-end 2006) was compared with the percentage of assets at fair value upon the adoption of SFAS No. 157 (as of first quarter-end 2008). Further, as illustrated in Exhibit II.11, the voluntary FVO election appears to explain the slight increase. Analysis on Overall Basis The results of this analysis illustrate that the adoption of SFAS No. 157 and SFAS No. 159 did not have a significant impact on the percentage of assets that were measured at fair value, which changed from 42% as of year-end 2006 to 45% as of first quarter-end 2008.

58
Exhibit II.13: Percentage of Assets Measured at Fair Value over Time
42% 45%
0%
20%
40%
60%
80%
100%
2006 Q1 2008
Period End
Perc
enta
ge
Analysis by Issuer Industry As illustrated in Exhibit II.14, other than broker-dealers and GSEs, the percentage of assets at fair value was fairly consistent by issuer industry over time. The increase in the percentage of assets at fair value for broker-dealers appears to, in part, be explained by the FVO discussed above, which accounted for 6% of additional assets at fair value. The decline in the percentage of assets at fair value for the GSEs occurred, in part, due to voluntary growth limits on retained portfolios and sales of AFS securities, decreasing the size of investment securities carried at fair value. Exhibit II.14: Percentage of Assets Measured at Fair Value over Time by Industry
27%39%
12%
62%71%
31%
50% 56%
14%
71%
0%
20%
40%
60%
80%
100%
Banking Broker-Dealers
CreditInstitutions
GSEs Insurance
Industry
Perc
enta
ge
2006Q1 2008
b. Nature of Assets Measured at Fair Value on a Recurring Basis Exhibit II.15 below provides detail of the various types of assets that are measured at fair value on a recurring basis. Investment securities represented the largest percentage of such assets at 44%, of which 85% are AFS securities with changes in fair value recognized in OCI and 15% are
59
reported at fair value through income. Therefore, at 32% of the total population of assets measured at fair value, trading instruments is the largest category that impacts the income statement, followed by derivatives at 9%. Separate accounts, which comprised 9% of the total assets at fair value, did not impact the income statement as changes in the fair value of separate account assets were offset by corresponding changes in the separate account liabilities. Accounting for the various types of assets is discussed in detail in Section I.D. A brief discussion of the types of instruments that are included in these asset classes follows. Investments Investments generally include investments in debt or equity securities. Debt securities generally include investments in fixed-income securities, agency and non-agency mortgage-backed securities, and other asset-backed securities. Some of these securities are reported at fair value, while others are reported at cost (e.g., equity securities without readily determinable fair values). Trading Accounts Trading accounts consist of instruments that financial institutions are holding for trading purposes, including derivatives; debt and equity trading instruments, including fixed-income securities and government and corporate debt; equity, including convertible securities; loans; and physical commodities inventories. The revenue derived from trading accounts is primarily based on the changes in the fair value of the portfolio. Separate Accounts Separate account assets are reported at fair value and are generally established by insurance companies to make certain investments on behalf of contract holders. These assets may be used to fund retirement plan contracts or group pension contracts. While these contract holders retain the risk of the investment and receive some or all of the investment returns, the assets in these accounts are legally owned by the insurance company. A separate account liability is recorded representing amounts payable to contractholders. As such, investment performance, including realized capital gains and losses, and changes in unrealized gains and losses are generally fully offset within the statement of operations.
Derivatives Derivative instruments enable users of such investments to increase, reduce, or alter exposure to interest, credit, or other market risks. The value of a derivative is derived from its reference to an underlying variable or combination of variables, such as interest rate indices, equity prices, foreign exchange rates, credit, and commodity prices. Issuers in the sample could be both dealers and users of derivatives. Companies often use derivatives in order to hedge market exposures, modify the interest rate characteristics of related balance sheet instruments or meet longer-term investment objectives.

60
Exhibit II.15: Nature of Assets Measured at Fair Value – As of First Quarter-End 2008
44%
32%
9%
9%6%
InvestmentsTrading AccountsSeparate AccountsDerivativesOther*
* Includes reverse repurchase agreements, loans, other assets, and MSRs.
c. Classification of Assets in Fair Value Hierarchy
One objective of SFAS No. 157 is to improve the consistency and comparability of fair value measurements. Accordingly, SFAS No. 157 requires a tabular disclosure for all items measured at fair value on a recurring basis. Specifically, as discussed in Section I.D, the FASB created a fair value hierarchy and required that all items measured at fair value be classified in this hierarchy based on the nature of the inputs used to develop the measurement. A significant concern expressed in applying a fair value measurement standard is the challenge that companies face in valuing instruments when markets are not active. As illustrated by Exhibit II.16, of all assets that were reported at fair value, a majority (76%) of the assets were Level 2 instruments for which inputs were observable, followed by Level 1 instruments (15%) which had quoted prices, and Level 3 instruments (9%) where significant market information is not observable.
Exhibit II.16: Fair Value Hierarchy Classification of Assets Measured at Fair Value – As of First Quarter-End 2008
15%
76%
9%
Level 1Level 2Level 3

61
i. Fair Value Hierarchy Classification over Time Analysis on Overall Basis To determine the impact of the change in economic conditions, especially the increasing lack of liquidity in the marketplace, the change in the classification of assets measured at fair value was analyzed from first quarter-end 2008 to third quarter-end 2008. See Exhibit II.17 for this analysis. Overall, this analysis illustrated the classification within each of the levels remained fairly consistent from first quarter-end 2008 to third quarter-end 2008, with a 1% decline in the percentage of assets in Level 1 and a 1% increase in Level 3.
Exhibit II.17: Fair Value Hierarchy Classification of Assets Measured at Fair Value over Time
15%
76%
9%15%
76%
9%14%
76%
10%
0%
20%
40%
60%
80%
100%
Level 1 Level 2 Level 3
Classification
Perc
enta
ge
Q1 2008
Q1 2008 excluding Q3 Non-FilersQ3 YTD 2008
Analysis by Issuer Industry Exhibit II.18 provides an analysis of the fair value hierarchy classification of assets reported at fair value by issuer industry. The insurance industry had the lowest Level 2 and the highest Level 1 composition, credit institutions had the highest Level 2 and lowest Level 3 composition, and GSEs had the highest Level 3 and the lowest Level 1 composition.
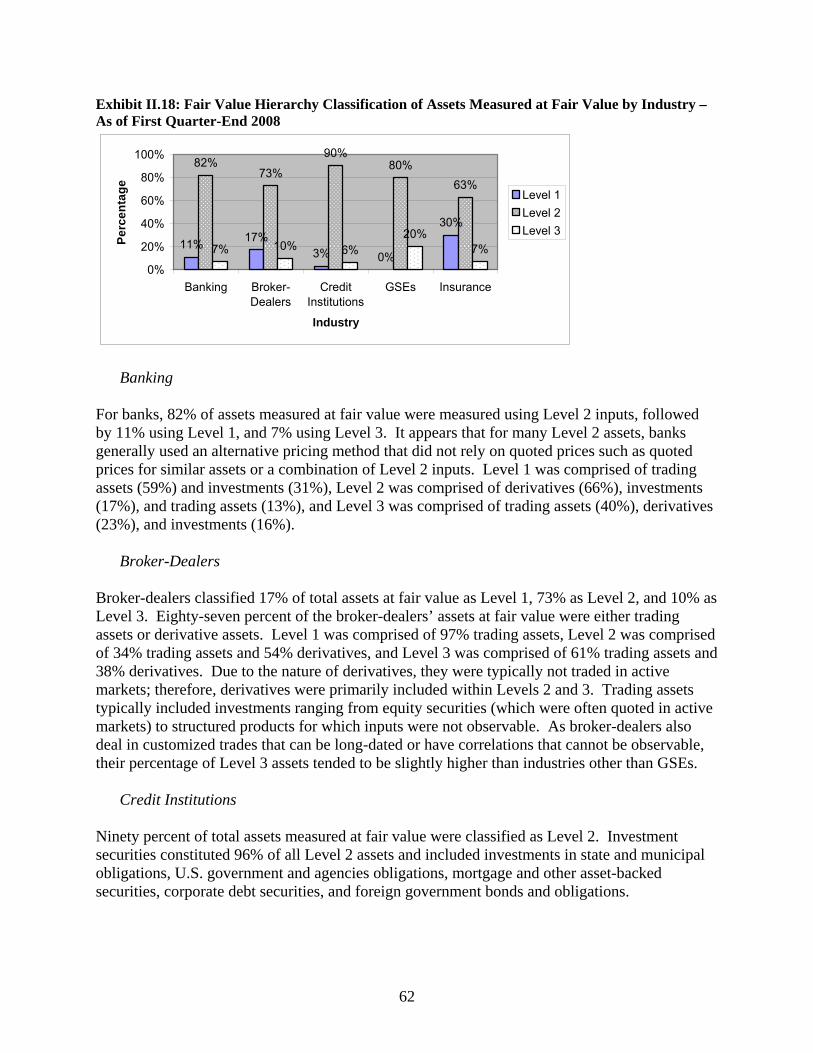
62
Exhibit II.18: Fair Value Hierarchy Classification of Assets Measured at Fair Value by Industry – As of First Quarter-End 2008
11% 17%3% 0%
30%
82%73%
90%80%
63%
7% 10% 6%20%
7%
0%
20%
40%
60%
80%
100%
Banking Broker-Dealers
CreditInstitutions
GSEs Insurance
Industry
Perc
enta
ge Level 1Level 2Level 3
Banking For banks, 82% of assets measured at fair value were measured using Level 2 inputs, followed by 11% using Level 1, and 7% using Level 3. It appears that for many Level 2 assets, banks generally used an alternative pricing method that did not rely on quoted prices such as quoted prices for similar assets or a combination of Level 2 inputs. Level 1 was comprised of trading assets (59%) and investments (31%), Level 2 was comprised of derivatives (66%), investments (17%), and trading assets (13%), and Level 3 was comprised of trading assets (40%), derivatives (23%), and investments (16%).
Broker-Dealers
Broker-dealers classified 17% of total assets at fair value as Level 1, 73% as Level 2, and 10% as Level 3. Eighty-seven percent of the broker-dealers’ assets at fair value were either trading assets or derivative assets. Level 1 was comprised of 97% trading assets, Level 2 was comprised of 34% trading assets and 54% derivatives, and Level 3 was comprised of 61% trading assets and 38% derivatives. Due to the nature of derivatives, they were typically not traded in active markets; therefore, derivatives were primarily included within Levels 2 and 3. Trading assets typically included investments ranging from equity securities (which were often quoted in active markets) to structured products for which inputs were not observable. As broker-dealers also deal in customized trades that can be long-dated or have correlations that cannot be observable, their percentage of Level 3 assets tended to be slightly higher than industries other than GSEs.
Credit Institutions Ninety percent of total assets measured at fair value were classified as Level 2. Investment securities constituted 96% of all Level 2 assets and included investments in state and municipal obligations, U.S. government and agencies obligations, mortgage and other asset-backed securities, corporate debt securities, and foreign government bonds and obligations.
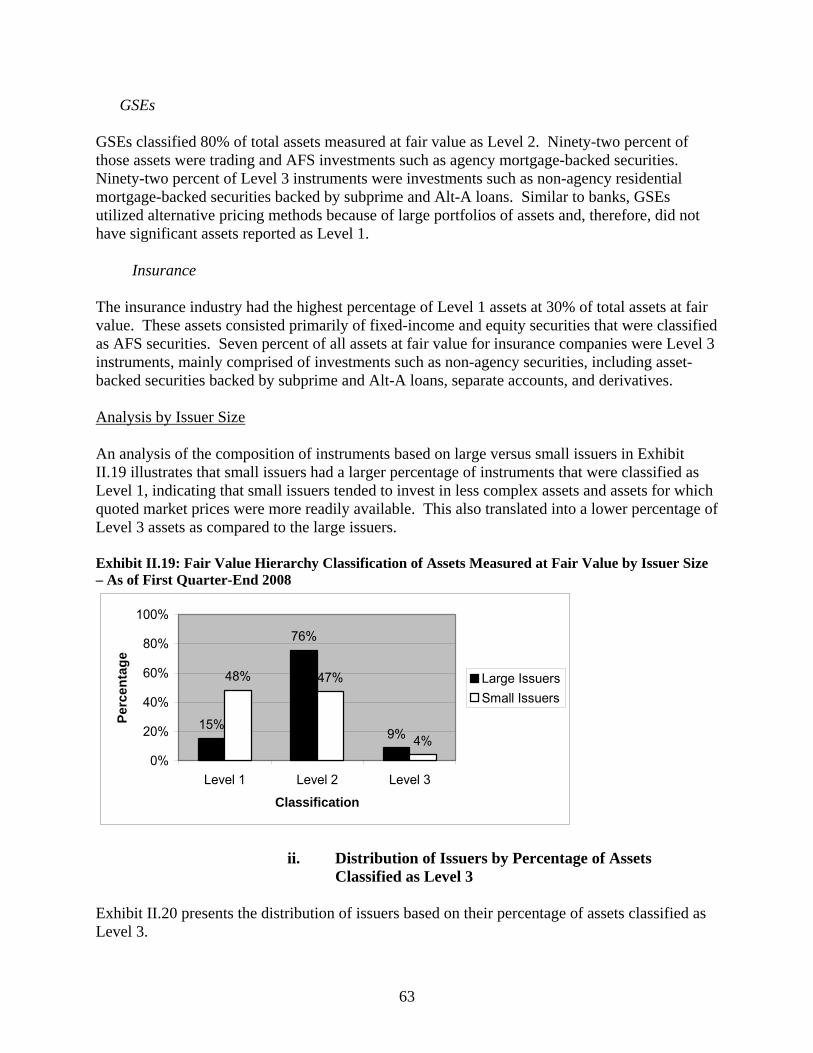
63
GSEs GSEs classified 80% of total assets measured at fair value as Level 2. Ninety-two percent of those assets were trading and AFS investments such as agency mortgage-backed securities. Ninety-two percent of Level 3 instruments were investments such as non-agency residential mortgage-backed securities backed by subprime and Alt-A loans. Similar to banks, GSEs utilized alternative pricing methods because of large portfolios of assets and, therefore, did not have significant assets reported as Level 1.
Insurance
The insurance industry had the highest percentage of Level 1 assets at 30% of total assets at fair value. These assets consisted primarily of fixed-income and equity securities that were classified as AFS securities. Seven percent of all assets at fair value for insurance companies were Level 3 instruments, mainly comprised of investments such as non-agency securities, including asset-backed securities backed by subprime and Alt-A loans, separate accounts, and derivatives.
Analysis by Issuer Size
An analysis of the composition of instruments based on large versus small issuers in Exhibit II.19 illustrates that small issuers had a larger percentage of instruments that were classified as Level 1, indicating that small issuers tended to invest in less complex assets and assets for which quoted market prices were more readily available. This also translated into a lower percentage of Level 3 assets as compared to the large issuers.
Exhibit II.19: Fair Value Hierarchy Classification of Assets Measured at Fair Value by Issuer Size – As of First Quarter-End 2008
15%
76%
9%
48% 47%
4%0%
20%
40%
60%
80%
100%
Level 1 Level 2 Level 3
Classification
Perc
enta
ge
Large IssuersSmall Issuers
ii. Distribution of Issuers by Percentage of Assets Classified as Level 3
Exhibit II.20 presents the distribution of issuers based on their percentage of assets classified as Level 3.
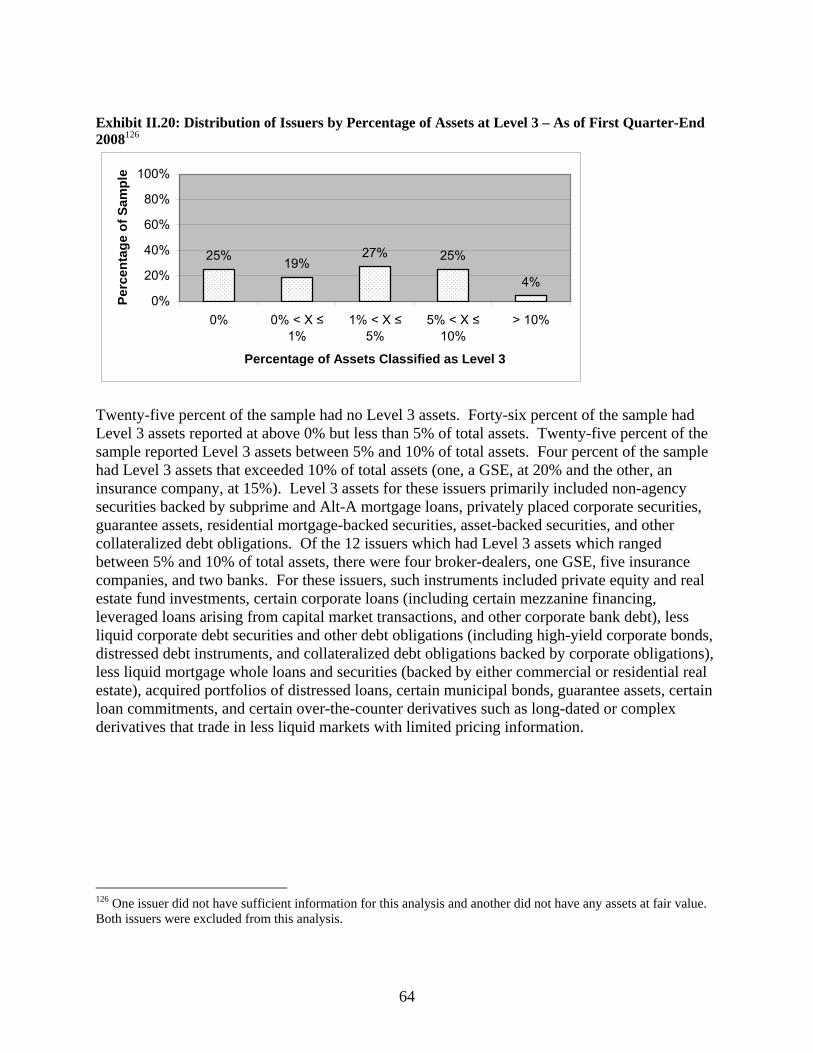
64
Exhibit II.20: Distribution of Issuers by Percentage of Assets at Level 3 – As of First Quarter-End 2008126
25% 19%27% 25%
4%0%
20%
40%
60%
80%
100%
0% 0% < X ≤1%
1% < X ≤5%
5% < X ≤10%
> 10%
Percentage of Assets Classified as Level 3
Perc
enta
ge o
f Sam
ple
Twenty-five percent of the sample had no Level 3 assets. Forty-six percent of the sample had Level 3 assets reported at above 0% but less than 5% of total assets. Twenty-five percent of the sample reported Level 3 assets between 5% and 10% of total assets. Four percent of the sample had Level 3 assets that exceeded 10% of total assets (one, a GSE, at 20% and the other, an insurance company, at 15%). Level 3 assets for these issuers primarily included non-agency securities backed by subprime and Alt-A mortgage loans, privately placed corporate securities, guarantee assets, residential mortgage-backed securities, asset-backed securities, and other collateralized debt obligations. Of the 12 issuers which had Level 3 assets which ranged between 5% and 10% of total assets, there were four broker-dealers, one GSE, five insurance companies, and two banks. For these issuers, such instruments included private equity and real estate fund investments, certain corporate loans (including certain mezzanine financing, leveraged loans arising from capital market transactions, and other corporate bank debt), less liquid corporate debt securities and other debt obligations (including high-yield corporate bonds, distressed debt instruments, and collateralized debt obligations backed by corporate obligations), less liquid mortgage whole loans and securities (backed by either commercial or residential real estate), acquired portfolios of distressed loans, certain municipal bonds, guarantee assets, certain loan commitments, and certain over-the-counter derivatives such as long-dated or complex derivatives that trade in less liquid markets with limited pricing information.
126 One issuer did not have sufficient information for this analysis and another did not have any assets at fair value. Both issuers were excluded from this analysis.

65
2. Liabilities
a. Significance of Liabilities Measured at Fair Value
i. Percentage of Liabilities Measured at Fair Value Analysis on Overall Basis
As illustrated in Exhibit II.21, 15% of total liabilities were reported at fair value (either by requirement or election) for all the financial institutions selected as of the end of the first reporting quarter after the effective date of SFAS No. 157. Overall, there was a smaller percentage of liabilities measured at fair value compared to assets. Generally, only trading liabilities (at broker-dealers) and derivative liabilities were required to be reported at fair value (certain other liabilities may be reported at fair value on an elective basis). These two types of liabilities constituted 53% of all liabilities at fair value. Generally, changes in the fair value of liabilities are recognized in income. The only changes in liability fair value that would be recognized in OCI relate to derivative liabilities that are accounted for as cash flow hedges, which typically are an insignificant portion of a financial institution’s balance sheet. Exhibit II.21: Percentage of Liabilities Measured at Fair Value – As of First Quarter-End 2008
15%
85%
Fair ValueOther than Fair Value
Analysis by Issuer Industry Exhibit II.22 below presents the percentage of liabilities at fair value by industry as of first quarter-end 2008.
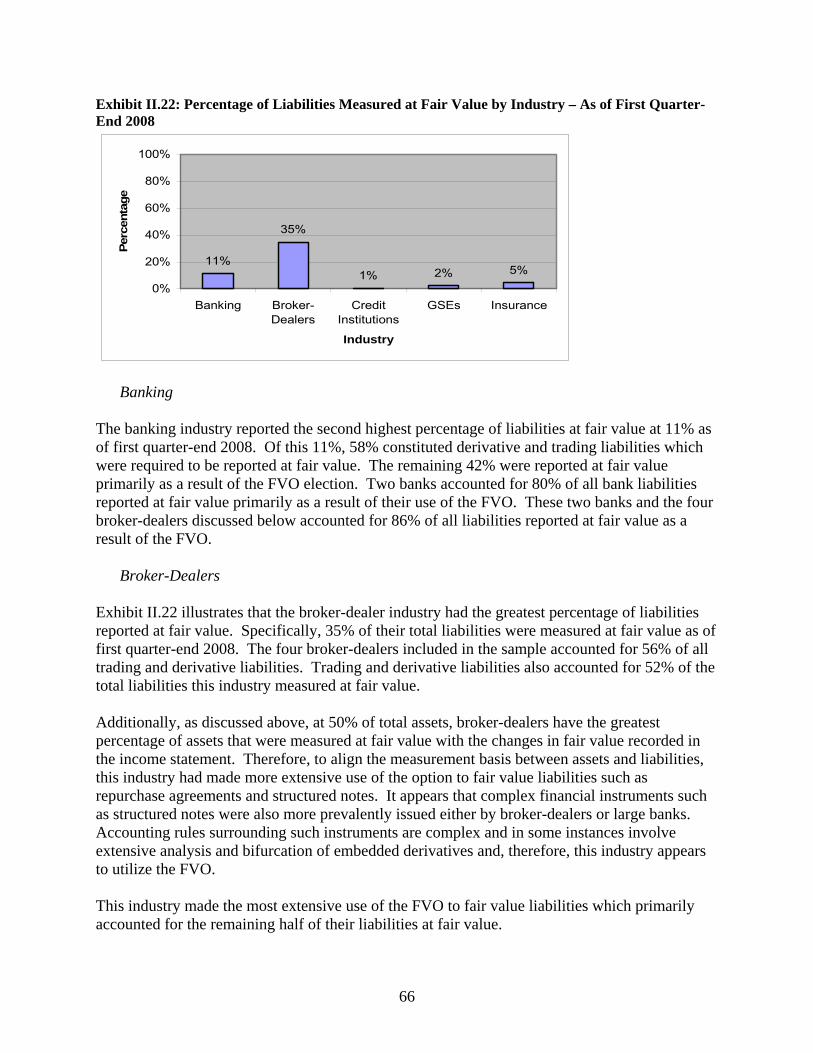
66
Exhibit II.22: Percentage of Liabilities Measured at Fair Value by Industry – As of First Quarter-End 2008
35%
2% 5%1%11%
0%
20%
40%
60%
80%
100%
Banking Broker-Dealers
CreditInstitutions
GSEs Insurance
Industry
Perc
enta
ge
Banking
The banking industry reported the second highest percentage of liabilities at fair value at 11% as of first quarter-end 2008. Of this 11%, 58% constituted derivative and trading liabilities which were required to be reported at fair value. The remaining 42% were reported at fair value primarily as a result of the FVO election. Two banks accounted for 80% of all bank liabilities reported at fair value primarily as a result of their use of the FVO. These two banks and the four broker-dealers discussed below accounted for 86% of all liabilities reported at fair value as a result of the FVO.
Broker-Dealers
Exhibit II.22 illustrates that the broker-dealer industry had the greatest percentage of liabilities reported at fair value. Specifically, 35% of their total liabilities were measured at fair value as of first quarter-end 2008. The four broker-dealers included in the sample accounted for 56% of all trading and derivative liabilities. Trading and derivative liabilities also accounted for 52% of the total liabilities this industry measured at fair value. Additionally, as discussed above, at 50% of total assets, broker-dealers have the greatest percentage of assets that were measured at fair value with the changes in fair value recorded in the income statement. Therefore, to align the measurement basis between assets and liabilities, this industry had made more extensive use of the option to fair value liabilities such as repurchase agreements and structured notes. It appears that complex financial instruments such as structured notes were also more prevalently issued either by broker-dealers or large banks. Accounting rules surrounding such instruments are complex and in some instances involve extensive analysis and bifurcation of embedded derivatives and, therefore, this industry appears to utilize the FVO. This industry made the most extensive use of the FVO to fair value liabilities which primarily accounted for the remaining half of their liabilities at fair value.
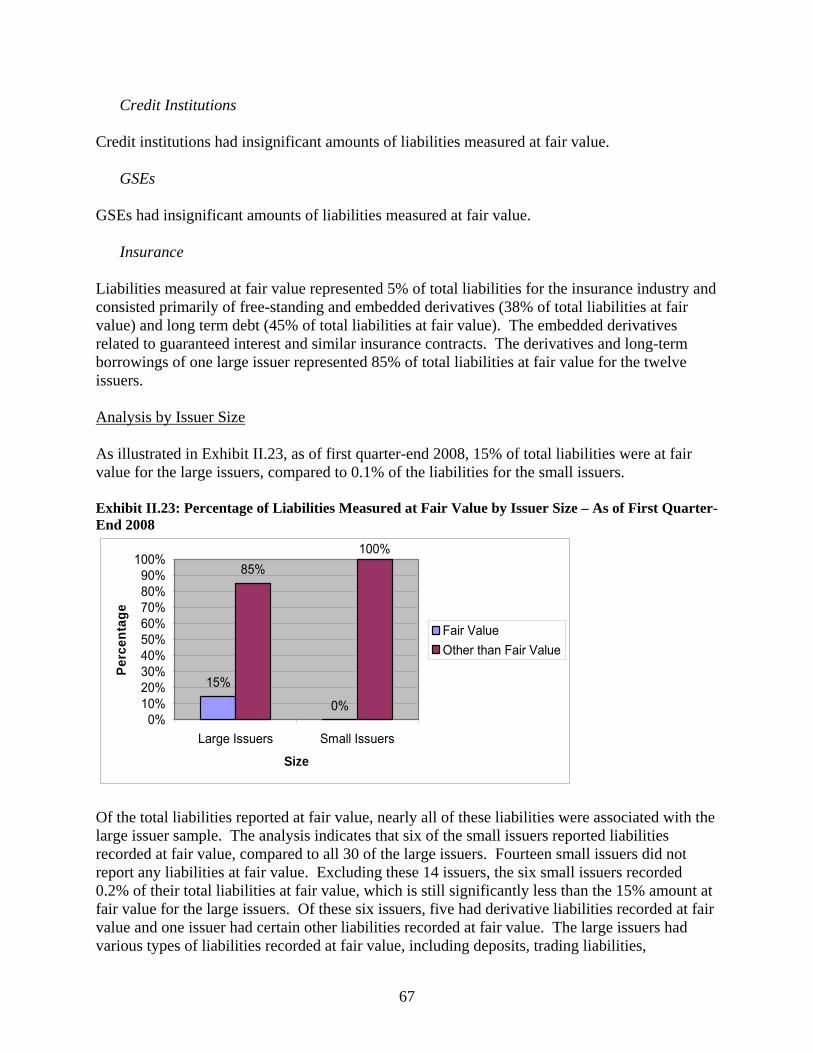
67
Credit Institutions
Credit institutions had insignificant amounts of liabilities measured at fair value. GSEs
GSEs had insignificant amounts of liabilities measured at fair value. Insurance
Liabilities measured at fair value represented 5% of total liabilities for the insurance industry and consisted primarily of free-standing and embedded derivatives (38% of total liabilities at fair value) and long term debt (45% of total liabilities at fair value). The embedded derivatives related to guaranteed interest and similar insurance contracts. The derivatives and long-term borrowings of one large issuer represented 85% of total liabilities at fair value for the twelve issuers.
Analysis by Issuer Size As illustrated in Exhibit II.23, as of first quarter-end 2008, 15% of total liabilities were at fair value for the large issuers, compared to 0.1% of the liabilities for the small issuers.
Exhibit II.23: Percentage of Liabilities Measured at Fair Value by Issuer Size – As of First Quarter-End 2008
15%
0%
85%100%
0%10%20%30%40%50%60%70%80%90%
100%
Large Issuers Small Issuers
Size
Perc
enta
ge
Fair ValueOther than Fair Value
Of the total liabilities reported at fair value, nearly all of these liabilities were associated with the large issuer sample. The analysis indicates that six of the small issuers reported liabilities recorded at fair value, compared to all 30 of the large issuers. Fourteen small issuers did not report any liabilities at fair value. Excluding these 14 issuers, the six small issuers recorded 0.2% of their total liabilities at fair value, which is still significantly less than the 15% amount at fair value for the large issuers. Of these six issuers, five had derivative liabilities recorded at fair value and one issuer had certain other liabilities recorded at fair value. The large issuers had various types of liabilities recorded at fair value, including deposits, trading liabilities,

68
derivatives, debt, repurchase agreements, and other liabilities. Certain of these liabilities, such as derivative liabilities, were required to be at fair value, while others, such as repurchase agreements, were at fair value due to the FVO election. Only one of the small issuers, an insurance company, selected the FVO for certain liabilities. However, 14 of the large issuers selected the FVO for certain liabilities.
ii. Distribution of Issuers by Percentage of Liabilities
Measured at Fair Value Although, on average, 15% of liabilities were measured at fair value, the issuers in the sample were not evenly distributed around this mean. Exhibit II.24 illustrates the percentage of issuers reporting liabilities at fair value based on graduated tiers. A majority of the issuers, or 39 out of 50 (78%), held 5% or less of their liabilities at fair value. Exhibit II.24: Distribution of Issuers by Percentage of Liabilities at Fair Value – As of First Quarter-End 2008
30%
48%
8% 4% 10%0%
0%
20%
40%
60%
80%
100%
0% 0% < X ≤5%
5% < X ≤10%
10% < X ≤20%
20% < X ≤50%
> 50%
Percentage of Liabilities at Fair Value
Perc
enta
ge o
f Sam
ple
Analysis by Industry As depicted in Exhibit II.25, of the 15 issuers that did not have any liabilities at fair value, 13 were banks, one was a broker-dealer, and one was a GSE. The banks and broker-dealer were all small issuers. Thirty issuers reported liabilities at fair value of greater than 0% but less than 20%, of which 13 were banks, three were credit institutions, two were GSEs, and 12 were insurance companies. These issuers had minimal items required to be recorded at fair value, such as trading liabilities and derivatives, and made minimal use of the FVO election. Five issuers reported liabilities of greater than 20%, but less than 50% (one bank and four broker-dealers).
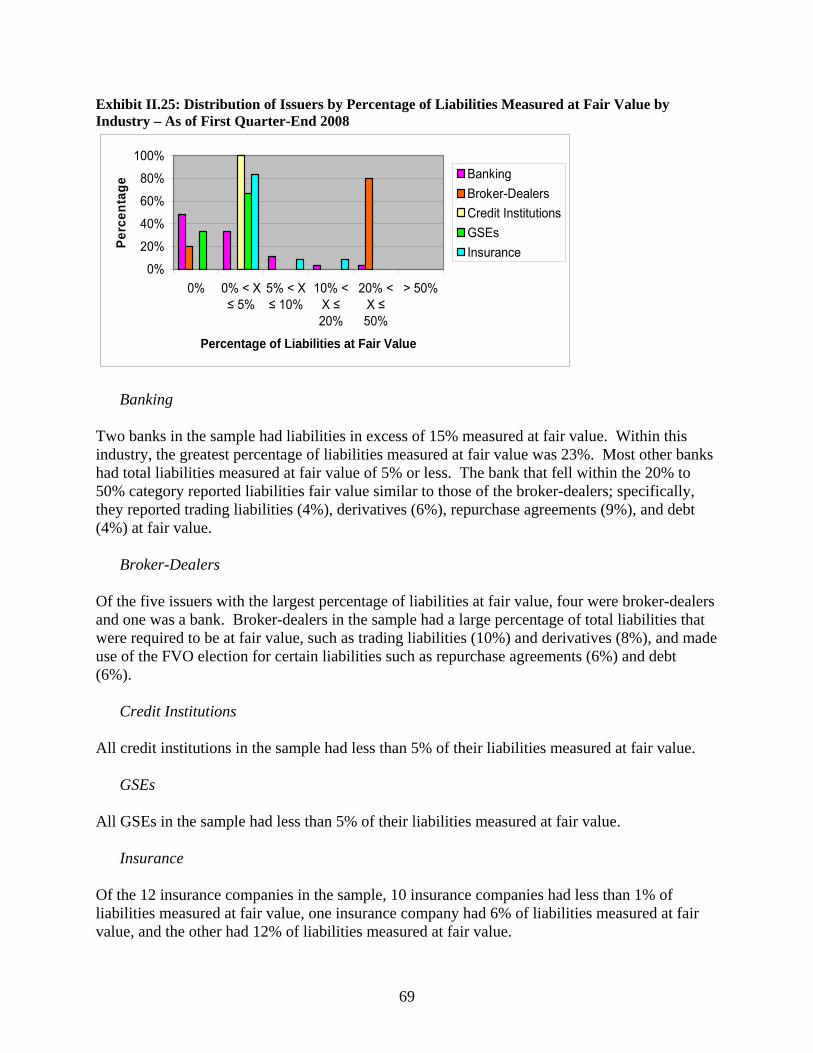
69
Exhibit II.25: Distribution of Issuers by Percentage of Liabilities Measured at Fair Value by Industry – As of First Quarter-End 2008
0%
20%
40%
60%
80%
100%
0% 0% < X≤ 5%
5% < X≤ 10%
10% <X ≤20%
20% <X ≤50%
> 50%
Percentage of Liabilities at Fair Value
Perc
enta
ge
BankingBroker-DealersCredit InstitutionsGSEsInsurance
Banking Two banks in the sample had liabilities in excess of 15% measured at fair value. Within this industry, the greatest percentage of liabilities measured at fair value was 23%. Most other banks had total liabilities measured at fair value of 5% or less. The bank that fell within the 20% to 50% category reported liabilities fair value similar to those of the broker-dealers; specifically, they reported trading liabilities (4%), derivatives (6%), repurchase agreements (9%), and debt (4%) at fair value.
Broker-Dealers Of the five issuers with the largest percentage of liabilities at fair value, four were broker-dealers and one was a bank. Broker-dealers in the sample had a large percentage of total liabilities that were required to be at fair value, such as trading liabilities (10%) and derivatives (8%), and made use of the FVO election for certain liabilities such as repurchase agreements (6%) and debt (6%).
Credit Institutions
All credit institutions in the sample had less than 5% of their liabilities measured at fair value.
GSEs All GSEs in the sample had less than 5% of their liabilities measured at fair value.
Insurance Of the 12 insurance companies in the sample, 10 insurance companies had less than 1% of liabilities measured at fair value, one insurance company had 6% of liabilities measured at fair value, and the other had 12% of liabilities measured at fair value.

70
iii. Use of Fair Value Option
Overall Analysis The increase in total liabilities reported at fair value as illustrated in Exhibit II.28 appears to result primarily from the use of the FVO, as illustrated in Exhibit II.26, which illustrates that 5% of total liabilities in the sample are reported at fair value under FVO. The data below excludes three issuers (two broker-dealers and one insurance company) that elected liabilities under the FVO, but did not provide sufficient detail to be included in the analysis. Exhibit II.26: Percentage of Liabilities Reported under the FVO – As of First Quarter-End 2008
5%
95%
Fair Value OptionLiabilitiesAll Other Liabilities
Analysis by Issuer Industry To focus on the impact of the FVO on the change in the percentage of liabilities at fair value from year-end 2006 to first quarter-end 2008 by industry, the Staff performed an analysis, as illustrated in Exhibit II.27. Excluding broker-dealers, the use of the FVO was fairly consistent in the different industry groupings. As illustrated in Exhibit II.27 below, the percentage of FVO liabilities to total liabilities, by industry, was 5% for banks, 12% for broker-dealers, 2% for GSEs and 3% for insurance companies. Among the small issuers, the option was selected for 0.01% of total liabilities.

71
Exhibit II.27: Percentage of Liabilities Reported under the FVO by Industry – As of First Quarter-End 2008
Broker-Dealers, 12%
GSEs, 2% 3%0%5%
0%
20%
40%
60%
80%
100%
Banking Broker-Dealers
CreditInstitutions
GSEs Insurance
Industry
Perc
enta
ge
Banks With respect to banks within the large issuer group, FVO liabilities represented 43% of total liabilities at fair value. Liabilities elected under the FVO consisted of repurchase agreements (48%), long-term debt (39%), short-term debt (5%), interest-bearing deposits (3%), and beneficial interests in variable interest entities (1%). No banks in the small issuer group selected the FVO for liabilities.
Broker-Dealers Of the four broker-dealers within the large issuer group, two elected to fair value liabilities under the FVO. FVO liabilities represented 37% of total liabilities at fair value. Liabilities elected under the FVO consisted of long-term debt (45%), repurchase agreements (40%), deposits (6%), short-term debt (5%), and other liabilities (4%). The remaining two broker-dealers also elected to fair value liabilities under the FVO but, as noted above, end-of-period information was not available. The one broker-dealer in the small issuer group did not select the FVO for liabilities.
Credit Institutions
No credit institutions in the sample elected to fair value liabilities under the FVO.
GSEs FVO liabilities represented 87% of total liabilities at fair value (however, liabilities at fair value are less than 2% of total liabilities). Liabilities elected under the FVO consisted of long-term debt (98%) and short-term debt (2%). There were no GSEs included in the small issuer group.
Insurance With respect to insurance companies within the large issuer group, one company elected the FVO for liabilities. FVO liabilities for all insurance companies in the sample represented 56% of
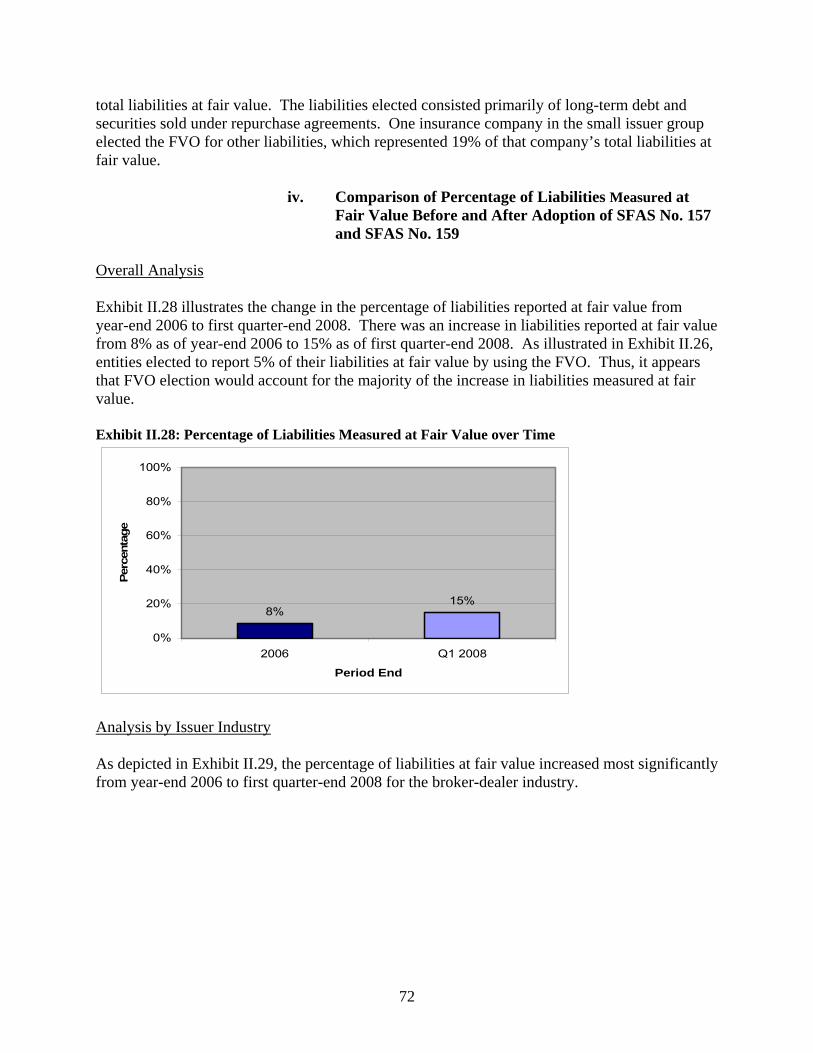
72
total liabilities at fair value. The liabilities elected consisted primarily of long-term debt and securities sold under repurchase agreements. One insurance company in the small issuer group elected the FVO for other liabilities, which represented 19% of that company’s total liabilities at fair value.
iv. Comparison of Percentage of Liabilities Measured at Fair Value Before and After Adoption of SFAS No. 157 and SFAS No. 159
Overall Analysis Exhibit II.28 illustrates the change in the percentage of liabilities reported at fair value from year-end 2006 to first quarter-end 2008. There was an increase in liabilities reported at fair value from 8% as of year-end 2006 to 15% as of first quarter-end 2008. As illustrated in Exhibit II.26, entities elected to report 5% of their liabilities at fair value by using the FVO. Thus, it appears that FVO election would account for the majority of the increase in liabilities measured at fair value.
Exhibit II.28: Percentage of Liabilities Measured at Fair Value over Time
8%15%
0%
20%
40%
60%
80%
100%
2006 Q1 2008
Period End
Perc
enta
ge
Analysis by Issuer Industry As depicted in Exhibit II.29, the percentage of liabilities at fair value increased most significantly from year-end 2006 to first quarter-end 2008 for the broker-dealer industry.
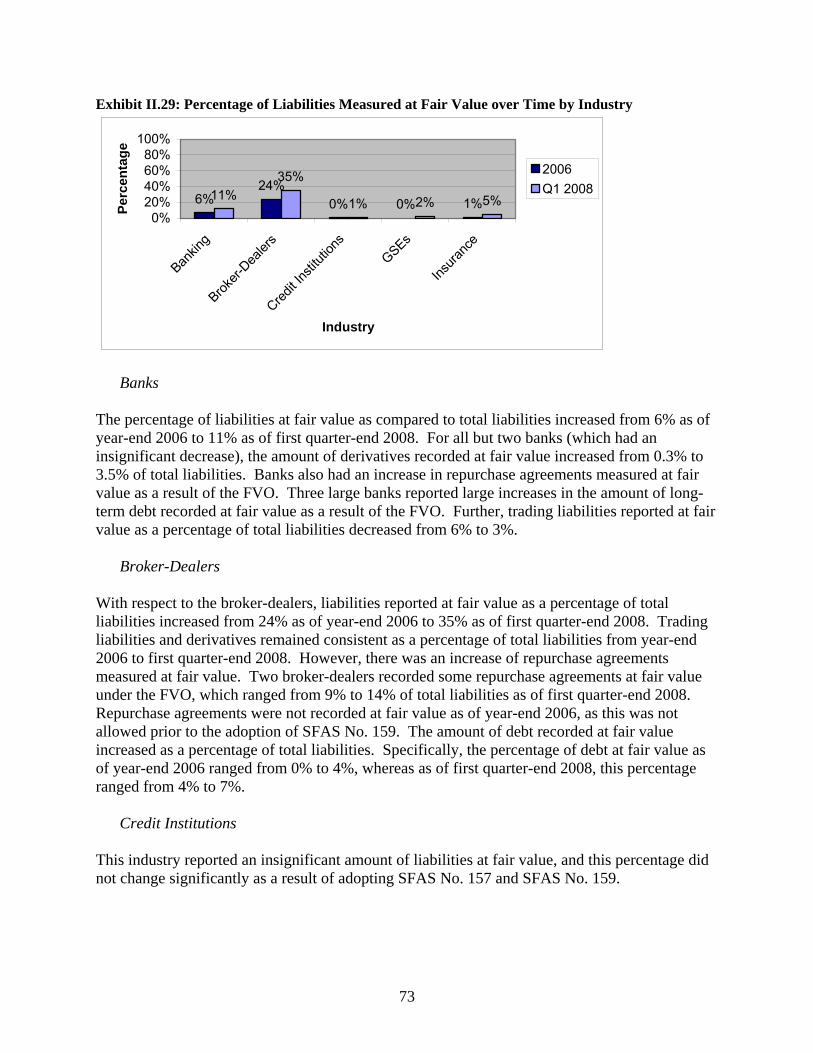
73
Exhibit II.29: Percentage of Liabilities Measured at Fair Value over Time by Industry
6%24%
0% 0% 1%11%35%
1% 2% 5%0%
20%40%60%80%
100%
Bankin
g
Broker-
Dealer
s
Credit I
nstitu
tions
GSEs
Insura
nce
Industry
Perc
enta
ge
2006Q1 2008
Banks The percentage of liabilities at fair value as compared to total liabilities increased from 6% as of year-end 2006 to 11% as of first quarter-end 2008. For all but two banks (which had an insignificant decrease), the amount of derivatives recorded at fair value increased from 0.3% to 3.5% of total liabilities. Banks also had an increase in repurchase agreements measured at fair value as a result of the FVO. Three large banks reported large increases in the amount of long-term debt recorded at fair value as a result of the FVO. Further, trading liabilities reported at fair value as a percentage of total liabilities decreased from 6% to 3%.
Broker-Dealers With respect to the broker-dealers, liabilities reported at fair value as a percentage of total liabilities increased from 24% as of year-end 2006 to 35% as of first quarter-end 2008. Trading liabilities and derivatives remained consistent as a percentage of total liabilities from year-end 2006 to first quarter-end 2008. However, there was an increase of repurchase agreements measured at fair value. Two broker-dealers recorded some repurchase agreements at fair value under the FVO, which ranged from 9% to 14% of total liabilities as of first quarter-end 2008. Repurchase agreements were not recorded at fair value as of year-end 2006, as this was not allowed prior to the adoption of SFAS No. 159. The amount of debt recorded at fair value increased as a percentage of total liabilities. Specifically, the percentage of debt at fair value as of year-end 2006 ranged from 0% to 4%, whereas as of first quarter-end 2008, this percentage ranged from 4% to 7%.
Credit Institutions This industry reported an insignificant amount of liabilities at fair value, and this percentage did not change significantly as a result of adopting SFAS No. 157 and SFAS No. 159.
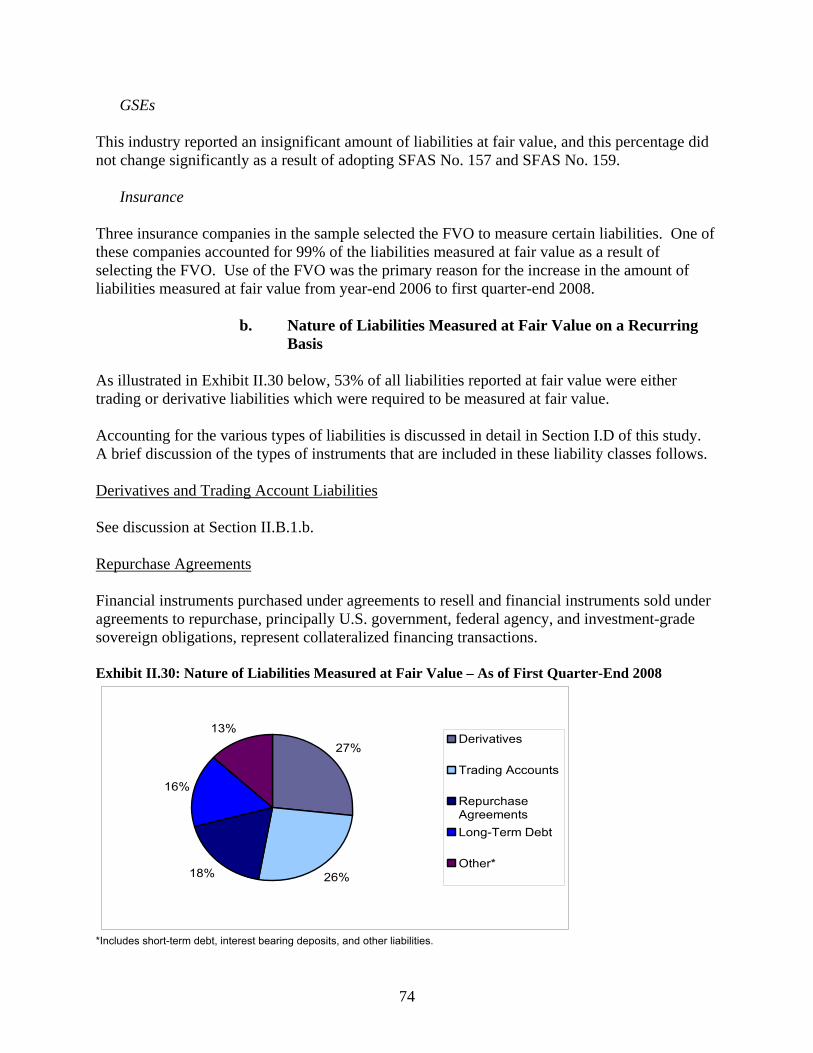
74
GSEs This industry reported an insignificant amount of liabilities at fair value, and this percentage did not change significantly as a result of adopting SFAS No. 157 and SFAS No. 159.
Insurance
Three insurance companies in the sample selected the FVO to measure certain liabilities. One of these companies accounted for 99% of the liabilities measured at fair value as a result of selecting the FVO. Use of the FVO was the primary reason for the increase in the amount of liabilities measured at fair value from year-end 2006 to first quarter-end 2008.
b. Nature of Liabilities Measured at Fair Value on a Recurring Basis
As illustrated in Exhibit II.30 below, 53% of all liabilities reported at fair value were either trading or derivative liabilities which were required to be measured at fair value. Accounting for the various types of liabilities is discussed in detail in Section I.D of this study. A brief discussion of the types of instruments that are included in these liability classes follows. Derivatives and Trading Account Liabilities See discussion at Section II.B.1.b. Repurchase Agreements
Financial instruments purchased under agreements to resell and financial instruments sold under agreements to repurchase, principally U.S. government, federal agency, and investment-grade sovereign obligations, represent collateralized financing transactions.
Exhibit II.30: Nature of Liabilities Measured at Fair Value – As of First Quarter-End 2008
27%
26%18%
16%
13%Derivatives
Trading Accounts
RepurchaseAgreementsLong-Term Debt
Other*
*Includes short-term debt, interest bearing deposits, and other liabilities.

75
An analysis of the sampled issuers illustrated that issuers used the FVO to measure structured notes, repurchase agreements, and other long-term liabilities at fair value. The elections which accounted for the remaining 47% of liabilities measured at fair value appear to be made primarily as a result of rules requiring bifurcation of derivatives embedded in some of these instruments and in other cases to avoid mismatch of measurement basis between the funding used to purchase assets and the related assets (such as funding used to purchase trading securities).
c. Classification of Liabilities in Fair Value Hierarchy
Exhibit II.31 below shows the classification of liabilities measured at fair value within the fair value hierarchy as of first quarter-end 2008. As illustrated in this exhibit, a majority (84%) of the liabilities that were reported at fair value were Level 2 instruments for which inputs were observable, followed by Level 1 instruments which had quoted prices (11%). Level 3 instruments comprised 5% of all liabilities that were reported at fair value. Exhibit II.31: Fair Value Hierarchy Classification of Liabilities at Fair Value – As of First Quarter-End 2008
11%
84%
5%
Level 1Level 2Level 3
i. Fair Value Hierarchy Classification over Time
Analysis on Overall Basis The change in the classification of liabilities from first quarter-end 2008 to third quarter-end 2008 is illustrated in Exhibit II.32. The classification of liabilities remained consistent and unaffected by changes in market conditions between the first and third quarters, as depicted by Exhibit II.32.

76
Exhibit II.32: Fair Value Hierarchy Classification of Liabilities Measured at Fair Value over Time
11%
84%
5%9%
86%
5%8%
86%
6%
0%
20%
40%
60%
80%
100%
Level 1 Level 2 Level 3
Classification
Perc
enta
ge
Q1 2008
Q1 2008 excluding Q3 Non-FilersQ3 YTD 2008
Analysis by Issuer Industry Exhibit II.33 illustrates the classification of liabilities reported at fair value by issuer industry, greater than 75% of which were classified as Level 2 for all industries. Other than broker-dealers which had the greatest percentage of Level 1 liabilities and the lowest percentage of Level 2 liabilities, and the insurance industry which had the greatest percentage of liabilities classified as Level 3, most industries had consistent classifications of fair value measurements of liabilities. Exhibit II.33: Fair Value Hierarchy Classification of Liabilities Measured at Fair Value by Industry – As of First Quarter-End 2008
6%20%
0% 0% 0%
90%75%
99% 96%76%
5% 5% 1% 4%24%
0%20%40%60%80%
100%
Banking
Broker-
Dealer
s
Credit I
nstitu
tions
GSEs
Insura
nce
Industry
Perc
enta
ge Level 1Level 2Level 3
Banking Of bank liabilities reported at fair value, 90% were measured using Level 2 inputs, followed by 6% using Level 1 inputs, and 5% using Level 3 inputs. Of the liabilities measured using Level 2 inputs, derivatives comprised 88%. This composition was consistent with the nature of these
77
liabilities. Due to their nature, derivatives were typically not traded in active markets where quoted prices were available and were therefore included within Levels 2 or 3.
Broker-Dealers Twenty percent of broker-dealer liabilities reported at fair value as of first quarter-end 2008 were within the Level 1 category. Accordingly, this industry had the highest percentage of Level 1 liabilities. Trading liabilities comprised 76% of these Level 1 liabilities. Due to the nature of their business, broker-dealers had a substantial amount of trading liabilities, which included items that were valued using Level 1 inputs, such as short positions on U.S. government securities and equities listed in an active market. Derivative liabilities constituted 64% of all Level 2 liabilities for broker-dealers.
Credit Institutions Credit institutions had an immaterial amount of liabilities measured at fair value and almost all of these liabilities were classified as Level 2. The liabilities measured at fair value included long-term and short-term debt and customer time deposits. This industry grouping reported an insignificant amount of derivatives.
GSEs Liabilities measured at fair value were 2% of total liabilities for GSEs. Ninety-six percent of total liabilities measured at fair value were classified using Level 2 inputs. Of the liabilities measured using Level 2 inputs, derivatives comprised 64% and long- and short-term debt instruments comprised 35%.
Insurance Insurance companies had virtually no Level 1 liabilities and the highest percentage of Level 3 liabilities among the various industry groups. Among the various liabilities classes, derivative liabilities were prevalent among insurance companies and constituted 38% of total liabilities at fair value and 86% of liabilities classified at Level 3. Insurance companies often carried portfolios of specialized derivatives, such as credit default swaps and other derivatives, for which inputs were not observable, resulting in the larger proportion of Level 3 liabilities. Analysis by Issuer Size
As mentioned earlier in this section, the liabilities of large issuers comprised over 99% of all liabilities that are reported at fair value. Exhibit II.34 below illustrates that small issuers had greater Level 3 liabilities. In dollars, the large issuers accounted for $2.5 trillion of total liabilities at fair value compared to $88 million for the small issuers.
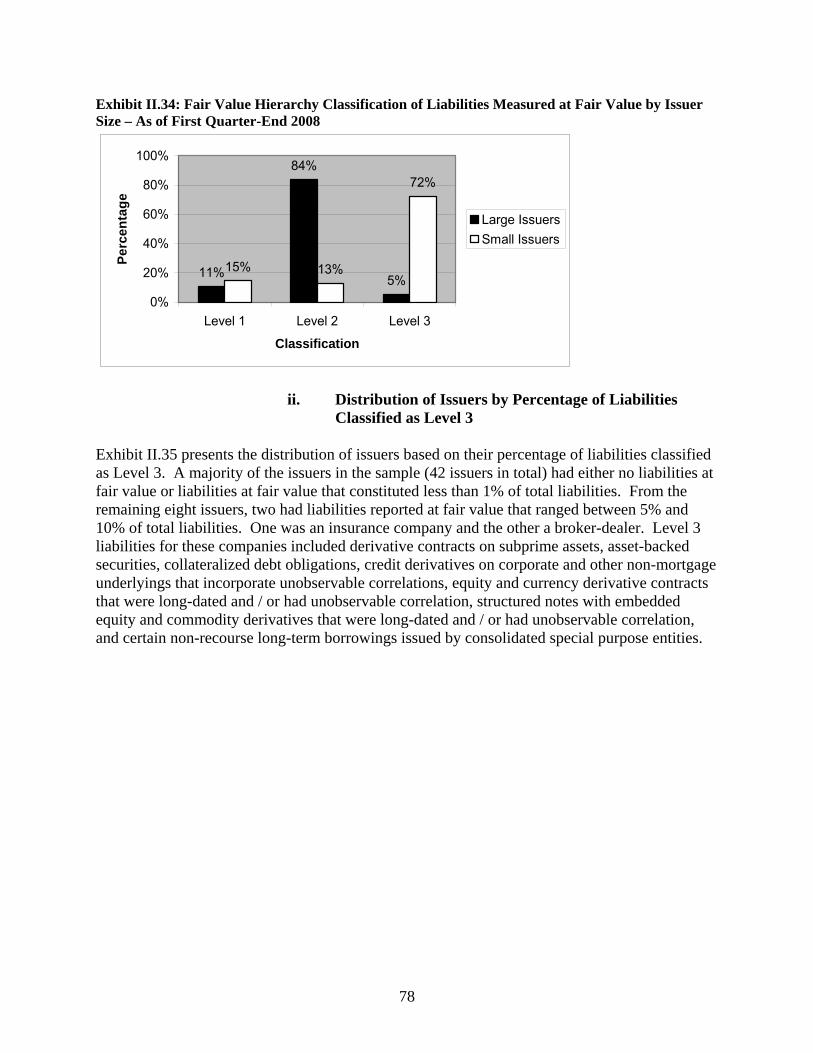
78
Exhibit II.34: Fair Value Hierarchy Classification of Liabilities Measured at Fair Value by Issuer Size – As of First Quarter-End 2008
11%
84%
5%15% 13%
72%
0%
20%
40%
60%
80%
100%
Level 1 Level 2 Level 3
Classification
Perc
enta
ge
Large IssuersSmall Issuers
ii. Distribution of Issuers by Percentage of Liabilities
Classified as Level 3 Exhibit II.35 presents the distribution of issuers based on their percentage of liabilities classified as Level 3. A majority of the issuers in the sample (42 issuers in total) had either no liabilities at fair value or liabilities at fair value that constituted less than 1% of total liabilities. From the remaining eight issuers, two had liabilities reported at fair value that ranged between 5% and 10% of total liabilities. One was an insurance company and the other a broker-dealer. Level 3 liabilities for these companies included derivative contracts on subprime assets, asset-backed securities, collateralized debt obligations, credit derivatives on corporate and other non-mortgage underlyings that incorporate unobservable correlations, equity and currency derivative contracts that were long-dated and / or had unobservable correlation, structured notes with embedded equity and commodity derivatives that were long-dated and / or had unobservable correlation, and certain non-recourse long-term borrowings issued by consolidated special purpose entities.
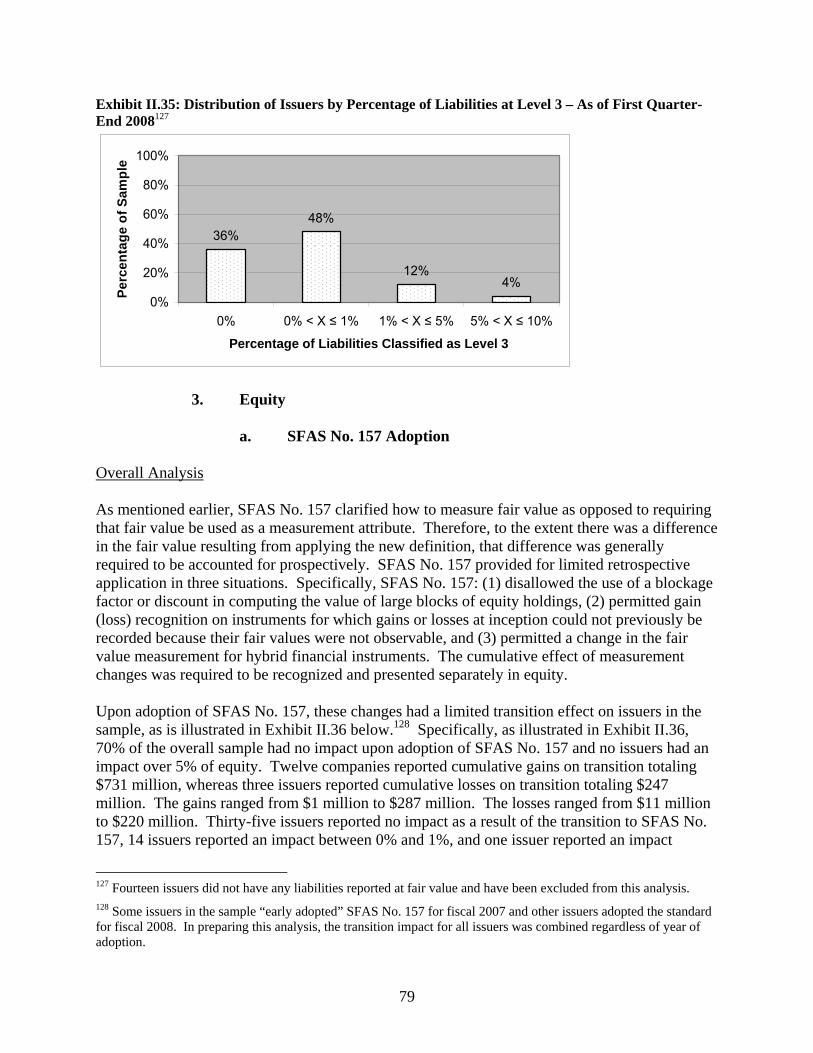
79
Exhibit II.35: Distribution of Issuers by Percentage of Liabilities at Level 3 – As of First Quarter-End 2008127
36%48%
12%4%
0%
20%
40%
60%
80%
100%
0% 0% < X ≤ 1% 1% < X ≤ 5% 5% < X ≤ 10%
Percentage of Liabilities Classified as Level 3
Perc
enta
ge o
f Sam
ple
3. Equity
a. SFAS No. 157 Adoption
Overall Analysis As mentioned earlier, SFAS No. 157 clarified how to measure fair value as opposed to requiring that fair value be used as a measurement attribute. Therefore, to the extent there was a difference in the fair value resulting from applying the new definition, that difference was generally required to be accounted for prospectively. SFAS No. 157 provided for limited retrospective application in three situations. Specifically, SFAS No. 157: (1) disallowed the use of a blockage factor or discount in computing the value of large blocks of equity holdings, (2) permitted gain (loss) recognition on instruments for which gains or losses at inception could not previously be recorded because their fair values were not observable, and (3) permitted a change in the fair value measurement for hybrid financial instruments. The cumulative effect of measurement changes was required to be recognized and presented separately in equity. Upon adoption of SFAS No. 157, these changes had a limited transition effect on issuers in the sample, as is illustrated in Exhibit II.36 below.128 Specifically, as illustrated in Exhibit II.36, 70% of the overall sample had no impact upon adoption of SFAS No. 157 and no issuers had an impact over 5% of equity. Twelve companies reported cumulative gains on transition totaling $731 million, whereas three issuers reported cumulative losses on transition totaling $247 million. The gains ranged from $1 million to $287 million. The losses ranged from $11 million to $220 million. Thirty-five issuers reported no impact as a result of the transition to SFAS No. 157, 14 issuers reported an impact between 0% and 1%, and one issuer reported an impact
127 Fourteen issuers did not have any liabilities reported at fair value and have been excluded from this analysis. 128 Some issuers in the sample “early adopted” SFAS No. 157 for fiscal 2007 and other issuers adopted the standard for fiscal 2008. In preparing this analysis, the transition impact for all issuers was combined regardless of year of adoption.
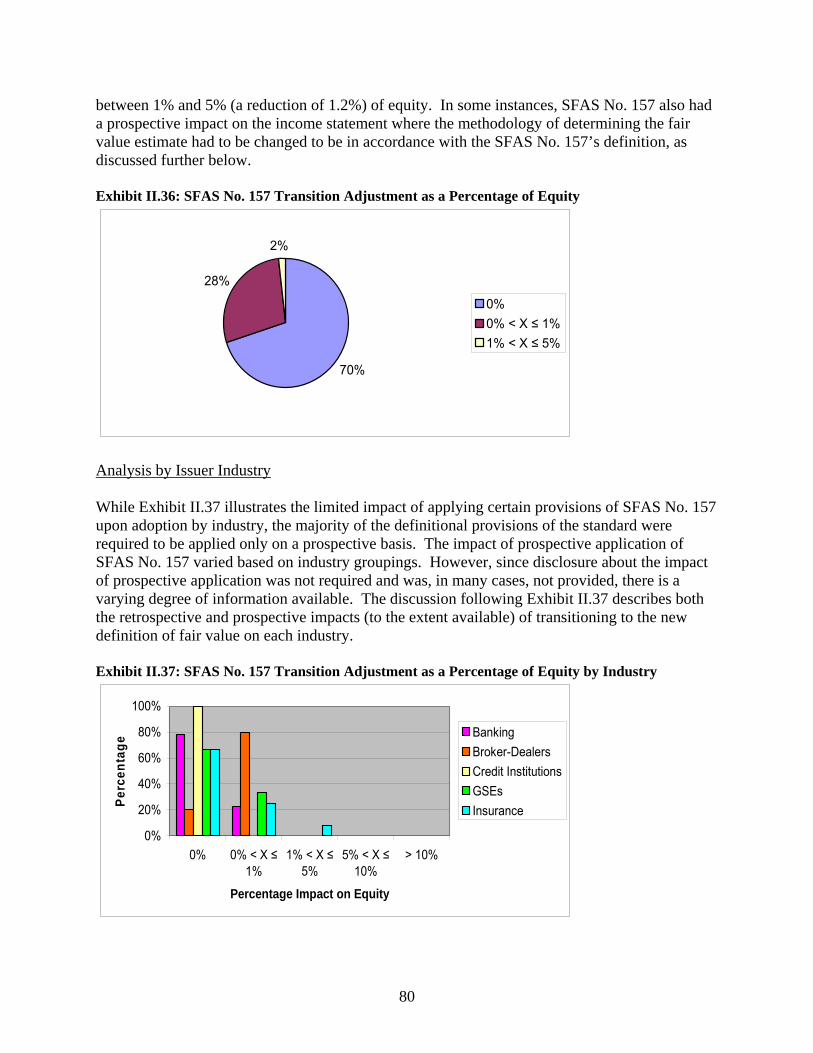
80
between 1% and 5% (a reduction of 1.2%) of equity. In some instances, SFAS No. 157 also had a prospective impact on the income statement where the methodology of determining the fair value estimate had to be changed to be in accordance with the SFAS No. 157’s definition, as discussed further below.
Exhibit II.36: SFAS No. 157 Transition Adjustment as a Percentage of Equity
70%
28%
2%
0%0% < X ≤ 1%1% < X ≤ 5%
Analysis by Issuer Industry While Exhibit II.37 illustrates the limited impact of applying certain provisions of SFAS No. 157 upon adoption by industry, the majority of the definitional provisions of the standard were required to be applied only on a prospective basis. The impact of prospective application of SFAS No. 157 varied based on industry groupings. However, since disclosure about the impact of prospective application was not required and was, in many cases, not provided, there is a varying degree of information available. The discussion following Exhibit II.37 describes both the retrospective and prospective impacts (to the extent available) of transitioning to the new definition of fair value on each industry. Exhibit II.37: SFAS No. 157 Transition Adjustment as a Percentage of Equity by Industry
0%
20%
40%
60%
80%
100%
0% 0% < X ≤1%
1% < X ≤5%
5% < X ≤10%
> 10%
Percentage Impact on Equity
Perc
enta
ge
BankingBroker-DealersCredit InstitutionsGSEsInsurance
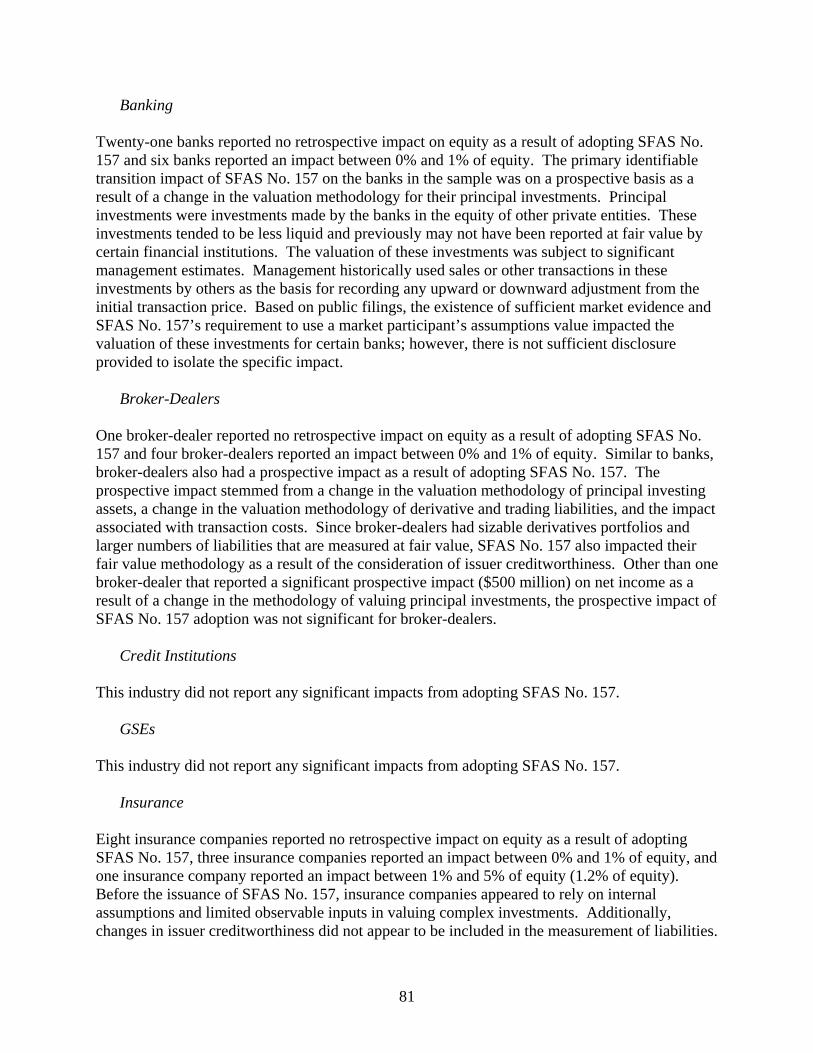
81
Banking
Twenty-one banks reported no retrospective impact on equity as a result of adopting SFAS No. 157 and six banks reported an impact between 0% and 1% of equity. The primary identifiable transition impact of SFAS No. 157 on the banks in the sample was on a prospective basis as a result of a change in the valuation methodology for their principal investments. Principal investments were investments made by the banks in the equity of other private entities. These investments tended to be less liquid and previously may not have been reported at fair value by certain financial institutions. The valuation of these investments was subject to significant management estimates. Management historically used sales or other transactions in these investments by others as the basis for recording any upward or downward adjustment from the initial transaction price. Based on public filings, the existence of sufficient market evidence and SFAS No. 157’s requirement to use a market participant’s assumptions value impacted the valuation of these investments for certain banks; however, there is not sufficient disclosure provided to isolate the specific impact.
Broker-Dealers
One broker-dealer reported no retrospective impact on equity as a result of adopting SFAS No. 157 and four broker-dealers reported an impact between 0% and 1% of equity. Similar to banks, broker-dealers also had a prospective impact as a result of adopting SFAS No. 157. The prospective impact stemmed from a change in the valuation methodology of principal investing assets, a change in the valuation methodology of derivative and trading liabilities, and the impact associated with transaction costs. Since broker-dealers had sizable derivatives portfolios and larger numbers of liabilities that are measured at fair value, SFAS No. 157 also impacted their fair value methodology as a result of the consideration of issuer creditworthiness. Other than one broker-dealer that reported a significant prospective impact ($500 million) on net income as a result of a change in the methodology of valuing principal investments, the prospective impact of SFAS No. 157 adoption was not significant for broker-dealers.
Credit Institutions
This industry did not report any significant impacts from adopting SFAS No. 157.
GSEs
This industry did not report any significant impacts from adopting SFAS No. 157.
Insurance
Eight insurance companies reported no retrospective impact on equity as a result of adopting SFAS No. 157, three insurance companies reported an impact between 0% and 1% of equity, and one insurance company reported an impact between 1% and 5% of equity (1.2% of equity). Before the issuance of SFAS No. 157, insurance companies appeared to rely on internal assumptions and limited observable inputs in valuing complex investments. Additionally, changes in issuer creditworthiness did not appear to be included in the measurement of liabilities.

82
Insurance companies’ fair value estimates were therefore prospectively impacted by SFAS No. 157’s requirement to maximize observable inputs when developing fair value measurements and including changes in issuer creditworthiness in determining the fair value of liabilities. Five insurance companies in the sample disclosed the prospective after–tax impact of SFAS No. 157 adoption, which generally resulted from changes in key fair value assumptions as these were aligned with those of the market. While, in several cases, issuer disclosures were not specific, in the case where the impact was identifiable, the after-tax amounts ranged from a $220 million loss to a $1.8 billion gain.
b. SFAS No. 159 Adoption Overall Analysis As discussed earlier, SFAS No. 159 provided issuers with an opportunity to elect to expand the use of fair value. At transition, companies had the ability to elect the FVO for previously owned assets and liabilities. The transition provisions required that any difference between the fair value and carrying value of the item on the adoption date be recorded as an adjustment in equity. For the sampled issuers, the analysis illustrates that the FVO was used for certain loans, loan commitments, structured notes, and AFS securities. SFAS No. 159 also requires companies to disclose the reasons for electing the FVO. Based on a review of the disclosures, reasons cited in electing fair value as a measurement attribute included: (1) to avoid complex hedge accounting requirements for items that were hedged; (2) to avoid mismatching between assets and their related funding; and (3) to have a common measurement basis for items that otherwise would not qualify for hedge accounting. As noted earlier, the FVO was selected by issuers in the sample on 4% of total assets and 5% of total liabilities upon adoption.129 The transition impact of expanding the use of fair value as a percentage of equity is illustrated in Exhibit II.38 below.
Exhibit II.38: SFAS No. 159 Transition Adjustment as a Percentage of Equity
66%
26%
6%
2%
0%
0%0% < X ≤ 1%1% < X ≤ 5%5% < X ≤ 10%> 10%
129 Some issuers in the sample “early adopted” SFAS No. 159 for fiscal 2007 and other issuers adopted the standard for fiscal 2008. In preparing this analysis, the transition impact for all issuers was combined regardless of year of adoption.
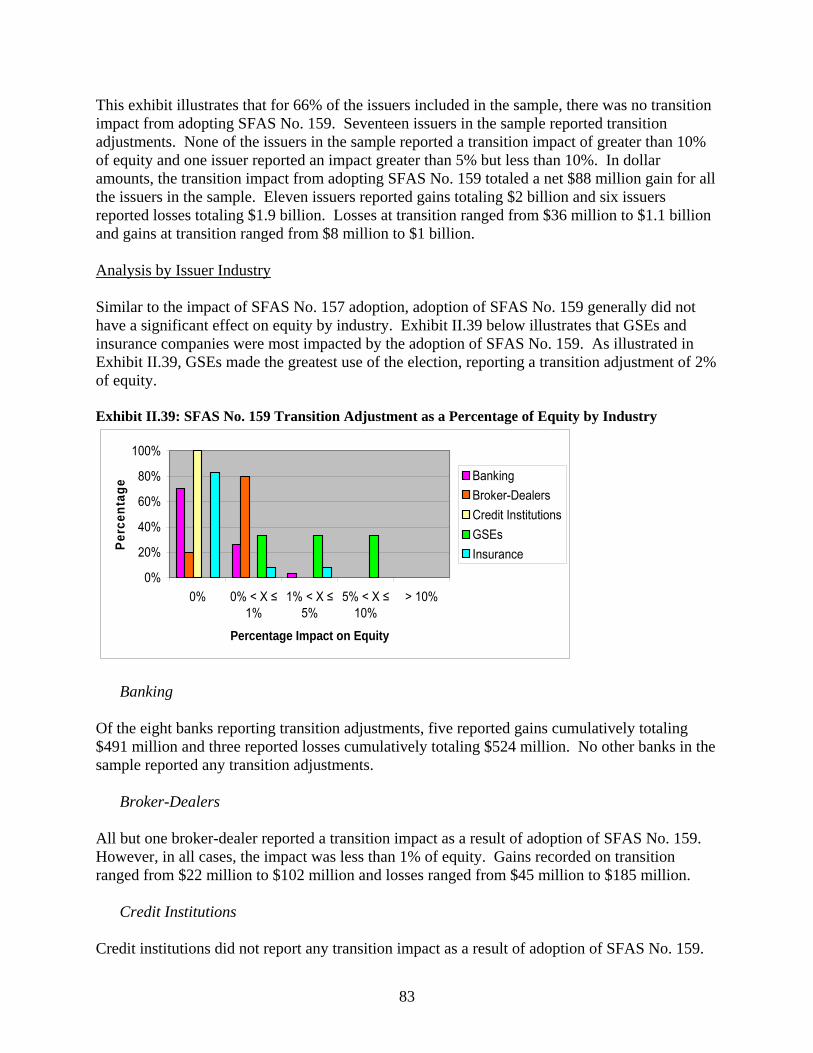
83
This exhibit illustrates that for 66% of the issuers included in the sample, there was no transition impact from adopting SFAS No. 159. Seventeen issuers in the sample reported transition adjustments. None of the issuers in the sample reported a transition impact of greater than 10% of equity and one issuer reported an impact greater than 5% but less than 10%. In dollar amounts, the transition impact from adopting SFAS No. 159 totaled a net $88 million gain for all the issuers in the sample. Eleven issuers reported gains totaling $2 billion and six issuers reported losses totaling $1.9 billion. Losses at transition ranged from $36 million to $1.1 billion and gains at transition ranged from $8 million to $1 billion. Analysis by Issuer Industry Similar to the impact of SFAS No. 157 adoption, adoption of SFAS No. 159 generally did not have a significant effect on equity by industry. Exhibit II.39 below illustrates that GSEs and insurance companies were most impacted by the adoption of SFAS No. 159. As illustrated in Exhibit II.39, GSEs made the greatest use of the election, reporting a transition adjustment of 2% of equity. Exhibit II.39: SFAS No. 159 Transition Adjustment as a Percentage of Equity by Industry
0%
20%
40%
60%
80%
100%
0% 0% < X ≤1%
1% < X ≤5%
5% < X ≤10%
> 10%
Percentage Impact on Equity
Perc
enta
ge
BankingBroker-DealersCredit InstitutionsGSEsInsurance
Banking
Of the eight banks reporting transition adjustments, five reported gains cumulatively totaling $491 million and three reported losses cumulatively totaling $524 million. No other banks in the sample reported any transition adjustments.
Broker-Dealers All but one broker-dealer reported a transition impact as a result of adoption of SFAS No. 159. However, in all cases, the impact was less than 1% of equity. Gains recorded on transition ranged from $22 million to $102 million and losses ranged from $45 million to $185 million.
Credit Institutions Credit institutions did not report any transition impact as a result of adoption of SFAS No. 159.
84
GSEs
One GSE reported a significant gain ($1 billion) in equity as a result of adopting SFAS No. 159. In this instance, the option was elected for certain AFS mortgage-related securities that were identified as economic offsets to the changes in fair value of the guarantee assets and investments in securities classified as AFS securities. For GSEs, the transition impact primarily resulted in a reclassification of amounts that were deferred in accumulated OCI to retained earnings. The two other GSEs reported gains on transition to SFAS No. 159 of $281 million in total (4% and 0.2% of equity).
Insurance
One insurance company reported a significant loss ($1.1 billion) as a result of adopting SFAS No. 159. The FVO was utilized to closely align the financial reporting and economic performance of hedging programs for certain life and investment-linked life insurance products. The transition impact also included amounts related to changes in own creditworthiness for long term borrowings for which the option was selected. Only one other insurance company reported an impact from transition to SFAS No. 159, which was less than 1% of equity.
c. Accumulated Other Comprehensive Income Overall Analysis Two types of instruments were measured at fair value on the balance sheet where changes in their fair value are not reported in income but rather in equity.130 Specifically, these were AFS securities and derivative instruments that were designated in cash flow hedging relationships. For AFS securities, the impact was recognized in the income statement only when the security was impaired or sold. For derivative instruments used in cash flow hedging relationships, the impact in the income statement was recognized in the same period as the hedged cash flows.
AFS Securities
Exhibit II.40 illustrates the unrealized gains or losses recorded in accumulated OCI. Exhibit II.40 indicates that for the first quarter of 2008, two issuers reported unrealized gains that ranged between $1 and $5 billion deferred in accumulated OCI, seven issuers reported unrealized losses in excess of $1 billion and less than $10 billion which had been recorded in OCI, and one issuer reported unrealized losses exceeding $10 billion. Of the issuers studied, a total of $39 billion in unrealized losses (carrying value greater than fair value) had been deferred in accumulated OCI compared to $25 billion in unrealized gains (three issuers comprised $25 billion of these unrealized gains and 13 issuers collectively reported $600 million in unrealized gains deferred in accumulated OCI).
130 The Staff was unable to obtain disaggregated information from the filings of five banks; these banks have been excluded from the analyses in this subsection.

85
There was a significant increase in the amount of deferred losses in accumulated OCI for the first three quarters of 2008. One issuer reported unrealized losses in excess of $20 billion, three issuers reported unrealized losses that ranged between $5 and $10 billion, and 12 issuers reported unrealized losses that ranged between $1 and $5 billion deferred in accumulated OCI. Only one issuer reported an unrealized gain in excess of $15 billion deferred in OCI and one issuer reported unrealized gains that ranged between $500 million and $1 billion. Of the issuers sampled, a total of $79 billion in unrealized losses (carrying value greater than fair value) had been deferred in accumulated OCI compared to $16.9 billion in unrealized gains (two issuers comprised $16.8 billion of these unrealized gains and six issuers collectively had $39 million in unrealized gains deferred in accumulated OCI). Since the dollar amounts of gains and loss deferred were significant, an analysis of these deferred amounts as a percentage of the AFS asset class was performed. Net unrealized losses as a percentage of AFS securities were 0.5% as of first quarter-end 2008 and 2% as of third quarter-end 2008. The highest percentage of gains and losses deferred in accumulated OCI as a percentage of AFS security carrying value were 17% for unrealized gains and 69% for unrealized losses as of first quarter-end 2008. The highest percentage of gains and losses deferred in accumulated OCI as a percentage of AFS security carrying value were 15% for unrealized gains and 10% for unrealized losses as of third quarter-end 2008. As of first quarter-end 2008 and third quarter-end 2008, there were 40 issuers and 37 issuers, respectively, in the sample for which deferred unrealized gains or losses constituted less than 5% of the total AFS security carrying value.
By industry, broker-dealers had the largest percentage of net losses deferred in accumulated OCI for both first quarter- and third quarter-end 2008, at 8% and 9% of their total AFS securities. Broker-dealer AFS portfolios were not significant relative to other industry groups (2% and 1% of total AFS securities for all issuers as of the first and third quarters, respectively). Broker-dealers were followed by GSEs, which had net losses of 2% and 3% of total AFS securities for first quarter- and third quarter-end 2008, respectively. In terms of dollar amounts, one GSE reported unrealized losses in excess of $15 billion and one insurance company reported unrealized gains of greater than $15 billion, representing 3% and 17% of the AFS securities portfolio, respectively, as of first quarter-end 2008. As of third quarter-end 2008, in terms of dollars, one GSE reported unrealized losses in excess of $20 billion and one insurance company reported unrealized gains of greater than $15 billion, representing 5% and 15% of the AFS securities portfolio, respectively.

86
Exhibit II.40: Distribution of Issuers by Amount of Accumulated Other Comprehensive Income
0%20%40%60%80%
100%
<($
10,0
00)
($10
,000
)≤
X <
($1,
000)
($1,
000)
≤X
< $0
$0 ≤
X <
$1,0
00
$1,0
00 ≤
X <
$5,0
00
≥ $5
,000
Amount of Accumulated Other Comprehensive Income
Perc
enta
ge o
f Sam
ple
Q1 2008 Q1 2008 Excluding Q3 Non-Filers Q3 2008
Derivatives Designated in Cash Flow Hedging Relationships
As of first quarter-end 2008, total unrealized losses and gains recorded in accumulated OCI on derivatives designated in cash flow relationships totaled $18 billion and $2 billion, respectively. Four issuers recorded unrealized losses on derivative instruments in excess of $1 billion but less than $5 billion. The combined total loss deferred by these four issuers was $15 billion. Fifteen issuers recorded losses that ranged from $1 million to $687 million for a collective total of $3 billion. A total of seven issuers recorded unrealized gains on derivatives in accumulated OCI ranging from $44 million to $619 million for a combined deferred gain of $1.7 billion.
4. Income Statement
While the mandate calls for a study of the impact of fair value accounting on the balance sheet of financial institutions, to provide a more complete understanding of the impact of fair value accounting, this section considers the income statement impact, given the focus on net income, as discussed in Section I.B. The scope of this study was therefore expanded to provide an analysis of the impact on income and included information obtained from the footnotes and MD&A. While the section provides an assessment of the impact of fair value accounting on the income statement, this analysis is limited by existing presentation and disclosure requirements that, in many cases, do not provide for or facilitate the separate identification of fair value measures. Thus, this subsection should be viewed as providing approximations and should not be considered to represent a full assessment of the impact. In this subsection, the Staff analyzed gains and losses recorded in income as a percentage of issuer equity at the beginning of the related period. The exhibits in this subsection are based on the absolute value of net gains and losses by issuer, which were summed on an overall basis for analysis. Where the related discussion reflects the same convention, the term “absolute basis” is used.
87
In addition, to account for differences in the timeframes analyzed (12 months for 2006, 12 months for 2007, three months for the first quarter of 2008, and nine months for year-to-date third quarter 2008, as applicable), 2008 data was annualized when presented for comparative purposes in the exhibits below. In the discussion, actual amounts are presented, unless otherwise stated.131
U.S. GAAP has historically not provided prescriptive guidance on how items are presented in the income statement. With respect to items that are measured at fair value, companies often do not present changes in fair value on a pre-specified line item or separate these fair value changes between realized and unrealized components. In certain instances, accounting rules require companies to disclose in the footnotes where in the income statement a company has recorded the impact of certain fair value changes.
SFAS No. 157 significantly expanded the disclosures required for items measured at fair value. Specifically, with respect to Level 3 measurement, the disclosures are extensive and require that companies present a rollforward of Level 3 measurement indicating how much of the measurement continues to be unrealized and how much is realized. While this disclosure has been useful, it is still difficult to determine the overall income statement impact related to the changes in fair value. In many instances the impact of fair value measurement is recorded in more than one line item. For example, debt securities measured at fair value may have a component of the value related to the interest presented in the interest line item and all other changes in the value presented elsewhere in the income statement.
Current requirements with respect to financial statement presentation generally do not require companies to separately display the impact of fair value measurement or to differentiate the impact in the income statement between realized and unrealized gains and losses for instruments measured at fair value. As a result, the analysis of the impact of fair value measurement only included those items for which changes in fair value are readily apparent on the income statement.
a. Recurring Fair Value Measurements
i. Recurring Mark-to-Market Adjustments
The objective of this analysis was to determine the approximate impact of recurring fair value measurements on equity of financial institutions overall and by issuer industry progressively over time from the first quarter of 2008 to the year-to-date third quarter of 2008. That is, this analysis was performed to gauge the impact of gains and losses recognized in the income statement as a result of mark-to-market accounting. For purposes of this analysis, income statement impact was identified either by a review of the income statement or based on disclosure in the footnotes and MD&A. Specifically, this review included trading revenues, items optionally reported at fair value as a result of the fair value elections, and changes in values of instruments classified as 131 The Staff uses the term “comparable nine-month basis” to refer to comparisons between the first quarter and first three quarters of 2008, in which the first quarter 2008 gains (losses) are multiplied by three. Where the Staff uses the term “annualized,” gains (losses) in the first quarter of 2008 and the first three quarters of 2008 are multiplied by four and 4/3, respectively.
88
Level 3. The income statement impact of certain items could not be determined, such as the amount of changes in the fair value of Level 1 and Level 2 derivatives.
The impact of fair value measurement on the income statement of insurance companies was analyzed separately, as discussed further below.
Overall Analysis On an overall basis, excluding the insurance companies, this analysis covered approximately 90% of instruments recorded at fair value (those instruments for which recurring fair value impacts on the income statement could be approximately identified) as of first quarter- and third quarter-end 2008. Items reported at fair value on a recurring basis, using absolute values for each issuer in the sample, resulted in an 11% and a 10% impact on equity (on a comparable nine-month basis) for the first quarter and the first three quarters of 2008, respectively. The impact on equity was 3% and 4% increase (on a comparable nine-month basis) for the first quarter and the first three quarters of 2008, respectively, when the gains and losses of items reported at fair value on a recurring basis were netted together for all issuers in the sample. However, income from trading activities was significantly lower in 2008 (on an annualized basis), when compared to 2007. Therefore, the increase to equity from recurring fair value measurements in 2008 was lower compared to increase in equity from recurring fair value measurements in 2007. Trading income is a significant source of revenue for broker-dealers, an industry group that had the greatest percentage of assets whose changes in fair value impacted the income statement. Annualized trading income for 2008 declined by 65% from 2007 and resulted at least partly in reduced profitability for the broker-dealers and banks who were engaged in significant trading activities. The decline in trading income was partly offset by increases in income as a result of changes in own creditworthiness included in fair value measurements of certain liabilities. For the first quarter 2008, the sum of all fair value gains and losses, netted by issuer, related to recurring fair value adjustments (on a comparable nine-month basis) were $56 billion and ($43) billion, respectively, for the sample, excluding insurance companies. The resulting net fair value gain of $13 billion consisted primarily of net trading gains of $32 billion, net MSR losses of ($16) billion, net derivative losses of ($9) billion, and net gains related to liabilities (e.g., time deposits, debt, other liabilities) of $2 billion. The remaining fair value gain of $4 billion was related to the remaining asset classes, such as loans, guarantee assets, reverse repurchase agreements and other investments. The range of recurring fair value gain adjustments recorded ranged from $40 thousand to $9 billion, and the range of recurring fair value loss adjustments recorded was from ($161) million to ($4) billion. For the first quarter of 2008, no issuers in the sample had a percentage impact of recurring fair value measurements greater than 15% of equity. The percentage impact on equity ranged from a decrease of 10% to an increase of 11%. Sixteen issuers reported increases in equity. For all except three issuers, this increase was less than 5% of equity. Ten issuers reported decreases in equity. For all except three issuers, this decrease was less than 5% of equity. Generally, for the first quarter of 2008, credit institutions reported the smallest impact on equity from recurring fair
89
value measurements. Banks reported the largest impact in amount, while broker-dealers reported the largest impact as a percentage of overall equity. For the first three quarters of 2008, the sum of all fair value gains and losses, netted by issuer, related to recurring fair value adjustments was $56.5 billion and ($26.2) billion, respectively, for all issuers in the sample, excluding insurance companies. The resulting net fair value gain of $30.3 billion consisted primarily of net trading gains of $15.1 billion, net MSR losses of ($1.3) billion, net derivative losses of ($6.0) billion, and net gains related to liabilities (e.g., deposits, debt, other liabilities) of $21.0 billion. The remaining fair value gain of $1.5 billion was related to the remaining asset and liabilities classes, such as loans, guarantee assets, repurchase agreements and other investments. The range of recurring fair value gain adjustments recorded ranged from $60 thousand to $19.8 billion, and the range of recurring fair value loss adjustments recorded ranged from ($20) thousand to ($13.1) billion. For the first three quarters of 2008, six issuers reported a percentage impact of recurring fair value measurements of greater than 15% of equity, and two issuers reported a percentage impact ranging from 5% to 15% of equity. The percentage impact on equity ranged from a decrease of 41% to an increase of 29%. Seventeen issuers reported increases in stockholders equity. For all except five issuers, this increase was less than 5% of equity. Nine issuers reported decreases in equity. For all except three issuers, this decrease was less than 5% of equity. Generally, for the first three quarters of 2008, credit institutions were impacted the least by recurring fair value measurements, whereas banks had the greatest impact in dollars and broker-dealers had the greatest impact as a percentage of overall equity. Insurance Due to limitations in available information on a disaggregated basis, the Staff could not precisely analyze the fair value impact on insurance company income statements for approximately 13% of assets reported as of first quarter- and third quarter-end 2008. These assets generally consisted of trading assets, derivatives, and other invested assets such as hedge funds and private equity investments. The remaining 87% of assets reported at fair value consisted of AFS securities and separate account assets, neither of which normally affects income on a recurring basis. However, AFS securities did produce increasing OTTI write-downs during 2008, as discussed below.
ii. Level 3 Fair Value Measurements
Expanded disclosures are required for items which fall within Level 3. The following is an analysis of the impact of the change in the fair value of Level 3 instruments record in the income statement evaluated as a percentage of equity.
The analysis illustrates that Level 3 assets comprised 9%, or $1,049 billion, of total assets at fair value, and Level 3 liabilities comprised 5%, or $326 billion, of total liabilities at fair value as of first quarter-end 2008. From first quarter-end to third quarter-end 2008, there was an increase in the percentage of assets and liabilities classified as Level 3, from 9% to 10%, or $1,023 billion, for assets and from 5% to 6%, or $307 billion, for liabilities.
90
Despite the lower percentage of financial instruments measured using Level 3 inputs, changes in the fair value of Level 3 instruments had a significant impact on equity. On a net basis, gains on Level 3 instruments were 6% of equity for both the first quarter and first three quarters of 2008 (on a comparable nine-month basis). Using absolute dollars, the impact of Level 3 instruments was 10% and 7% of equity (on a comparable nine-month basis) for the first quarter and first three quarters of 2008, respectively, as shown in Exhibit II.41 below. For the first quarter of 2008, for the sample overall, the net unrealized loss related to Level 3 assets on a comparable nine-month basis was ($61.2) billion, and the net unrealized loss related to Level 3 liabilities was ($9.8) billion. The unrealized gains (losses) related to Level 3 assets ranged from a $6.4 billion gain to a ($12.9) billion loss. The unrealized gains (losses) related to Level 3 liabilities ranged from a $1.2 billion gain to a ($1.7) billion loss. Eighteen issuers in the sample had no impact of Level 3 instruments in equity. Ten issuers had a positive impact in the income statement, and therefore to equity, of $9.4 billion, with specific issuers ranging from $2 million to $5.6 billion. Twenty-two issuers had a negative impact in the income statement and, therefore to equity, of $33 billion, with specific issuers losses ranging from $10 million to $13 billion. For the first three quarters of 2008, for the sample overall, the net unrealized loss related to Level 3 assets was ($61.3) billion, and the net unrealized loss related to Level 3 liabilities was ($13.1) billion. The unrealized gains (losses) related to Level 3 assets ranged from a $3.8 billion gain to a ($18.8) billion loss. The unrealized gains (losses) related to Level 3 liabilities ranged from a $7.2 billion gain to a ($18.7) billion loss. Eighteen issuers in the sample had no impact of Level 3 instruments in equity. Six issuers reported a positive impact in the income statement, and therefore to equity, of $6.9 billion, with specific issuers ranging from $1.9 million to $4.4 billion. Twenty-four issuers had a negative impact in the income statement and, therefore to equity, of $81.4 billion, with specific issuer losses ranging from $50 million to $28.8 billion. Insurance companies, which reported the highest percentage of Level 3 liabilities, also recorded the highest losses on these Level 3 liabilities ($23 billion). From an industry perspective, the most significant impact of Level 3 instruments in the first quarter of 2008 was on the broker-dealer industry, and the most significant impact was on the GSE industry for the first three quarters of 2008. For these industries, Level 3 instruments on an absolute and a comparable nine-month basis were 23% and 17% of equity in each period, respectively. Credit institutions reported the least significant impact from Level 3 measurements for both the first quarter and the first three quarters of 2008, at 1% of equity in each period on an absolute basis.

91
Exhibit II.41: Impact on Equity from Level 3-Related Gains / Losses Recorded in Income132
10% 10% 7%0%
20%40%60%80%
100%
Q1 2008(Comparable Nine-
Month Basis)
Q1 2008 excludingQ3 Non-Filers
(Comparable Nine-Month Basis)
Q3 YTD 2008
Period
Perc
enta
ge
iii. Impact of Changes in Creditworthiness in Measuring Liabilities
For the first quarter of 2008, for the sample overall, 15%, or $2,457 billion, of total liabilities of financial institutions were reported at fair value, and 5%, or $708 billion, of total liabilities were reported at fair value as a result of the FVO election made by these issuers. SFAS No. 157 requires that companies incorporate the change in their own creditworthiness in determining the fair value of liabilities. Further, SFAS No. 159, which provides the option to make an election to fair value certain liabilities, requires disclosure to the extent that changes in own creditworthiness impact the measurement of fair value. The following is an analysis of the impact of fair value changes associated with changes in an issuer’s own creditworthiness. This analysis is performed based upon amounts disclosed only for those liabilities on which the FVO was selected for both the first quarter and the first three quarters of 2008. The analysis indicated that the total impact on income and equity from changes in own creditworthiness included in the fair value for liabilities was a gain of $6.8 billion and $17 billion for the first quarter and first three quarters of 2008, respectively. The analysis indicated that the total dollar amount reported related to changes in an issuer’s own creditworthiness ranged from a high of $2.1 billion gain to a low of $0 for the first quarter of 2008. This compares to a high of $5 billion and to a low of $0 for the first three quarters of 2008. Nine and 10 issuers in the sample reported an impact on fair value measurement of liabilities as a result of changes in own creditworthiness for the first quarter and first three quarters of 2008, respectively.
The percentage impact on equity of changes in an issuer’s own creditworthiness varied significantly among the industries and can be partially explained by the greater use of the FVO election for liabilities in certain industries. On a comparable nine-month basis, at 8% of equity for the first quarter and first three quarters of 2008, the broker-dealer industry had the largest percentage impact as a result of change in their creditworthiness of issuers that selected the FVO
132 The Staff used the absolute value of net gains and losses by issuer. These absolute values were summed on an overall basis, by issuer industry, and by issuer size, as appropriate, for analysis.

92
for liabilities. Specifically, the analysis illustrated that, for the first quarter of 2008, all four of the broker-dealers in the large issuer sample selected the FVO for certain liabilities, as compared to six of the 13 large banks, two of the eight large insurance companies, two of the three large GSEs, and neither of the two credit institutions selecting the FVO for their liabilities.
b. Non-Recurring Fair Value Measurements (Impairments)
The objective of this analysis is to determine how items measured at fair value on a non-recurring basis impact the income statement and therefore equity. For example, securities held as AFS are written down in the income statement if they are deemed to be other than temporarily impaired. It should be noted that this subsequent measurement at fair value would be required even when items are measured at historical cost.
For the purposes of this analysis, impairment losses recorded by issuers as a result of OTTI on AFS and HTM securities, valuation adjustments recorded on HFS loans, impairments recorded for goodwill, other intangibles and long-lived assets were totaled. The total recorded impairments were analyzed as a percentage of equity for financial institutions on an overall basis. Since these measurements of impairment were required before the issuance of SFAS No. 157, the information was also analyzed on a progressive basis for 2006, 2007, and the first nine months of 2008.
i. All Impairments
Exhibit II.42 illustrates that impairment charges totaling $11 billion (or $34 billion on a comparable nine-month basis) and $91 billion represented 3% and 8% of equity (on a comparable nine-month basis) for the first quarter of 2008 and the first three quarters of 2008, respectively. Impairment charges for the first three quarters of 2008 substantially increased from the $5 billion (1% of equity), reported in 2006. This substantial increase reflects the deteriorating economic conditions which have led to a reduction in asset values.
Exhibit II.42: Impact on Equity of Impairments Recorded in Income
0% 1% 4% 10%
0%20%40%60%80%
100%
2006
2007
Q1
2008
Annu
aliz
ed
Q3
YTD
2008
Annu
aliz
ed
Period
Perc
enta
ge
Actual
Excluding Q3Non-Filers
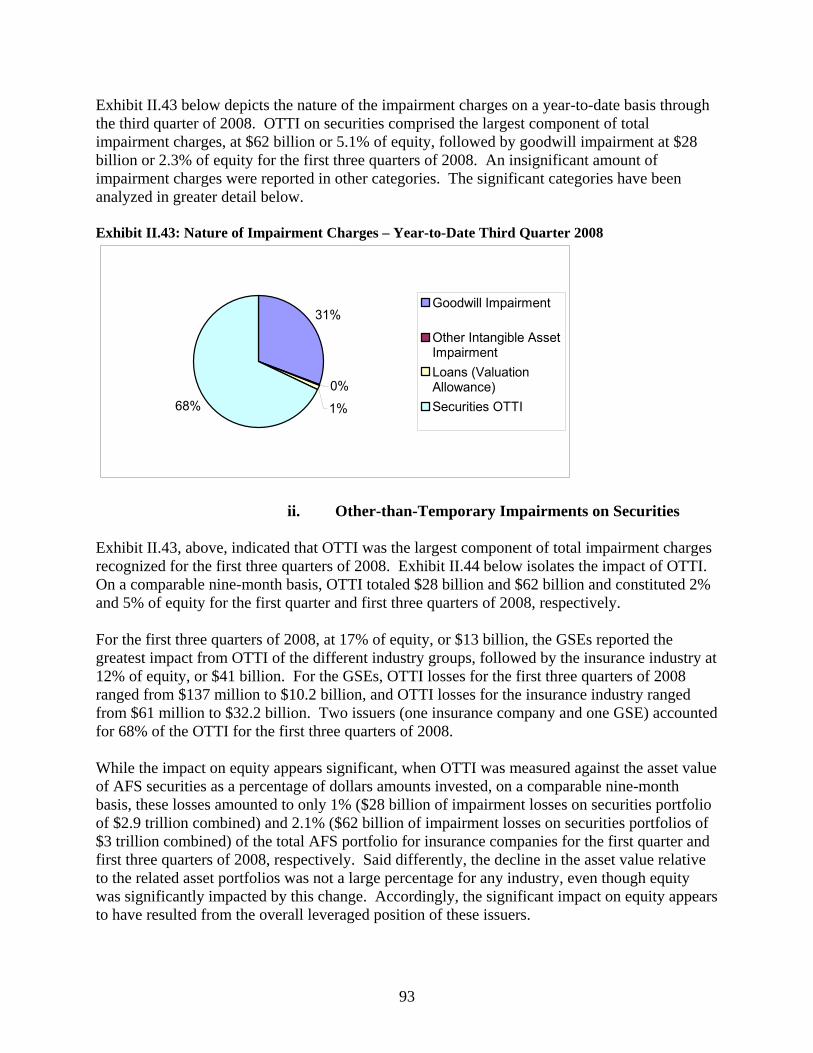
93
Exhibit II.43 below depicts the nature of the impairment charges on a year-to-date basis through the third quarter of 2008. OTTI on securities comprised the largest component of total impairment charges, at $62 billion or 5.1% of equity, followed by goodwill impairment at $28 billion or 2.3% of equity for the first three quarters of 2008. An insignificant amount of impairment charges were reported in other categories. The significant categories have been analyzed in greater detail below. Exhibit II.43: Nature of Impairment Charges – Year-to-Date Third Quarter 2008
31%
0%
1%68%
Goodwill Impairment
Other Intangible AssetImpairmentLoans (ValuationAllowance)Securities OTTI
ii. Other-than-Temporary Impairments on Securities
Exhibit II.43, above, indicated that OTTI was the largest component of total impairment charges recognized for the first three quarters of 2008. Exhibit II.44 below isolates the impact of OTTI. On a comparable nine-month basis, OTTI totaled $28 billion and $62 billion and constituted 2% and 5% of equity for the first quarter and first three quarters of 2008, respectively. For the first three quarters of 2008, at 17% of equity, or $13 billion, the GSEs reported the greatest impact from OTTI of the different industry groups, followed by the insurance industry at 12% of equity, or $41 billion. For the GSEs, OTTI losses for the first three quarters of 2008 ranged from $137 million to $10.2 billion, and OTTI losses for the insurance industry ranged from $61 million to $32.2 billion. Two issuers (one insurance company and one GSE) accounted for 68% of the OTTI for the first three quarters of 2008.
While the impact on equity appears significant, when OTTI was measured against the asset value of AFS securities as a percentage of dollars amounts invested, on a comparable nine-month basis, these losses amounted to only 1% ($28 billion of impairment losses on securities portfolio of $2.9 trillion combined) and 2.1% ($62 billion of impairment losses on securities portfolios of $3 trillion combined) of the total AFS portfolio for insurance companies for the first quarter and first three quarters of 2008, respectively. Said differently, the decline in the asset value relative to the related asset portfolios was not a large percentage for any industry, even though equity was significantly impacted by this change. Accordingly, the significant impact on equity appears to have resulted from the overall leveraged position of these issuers.
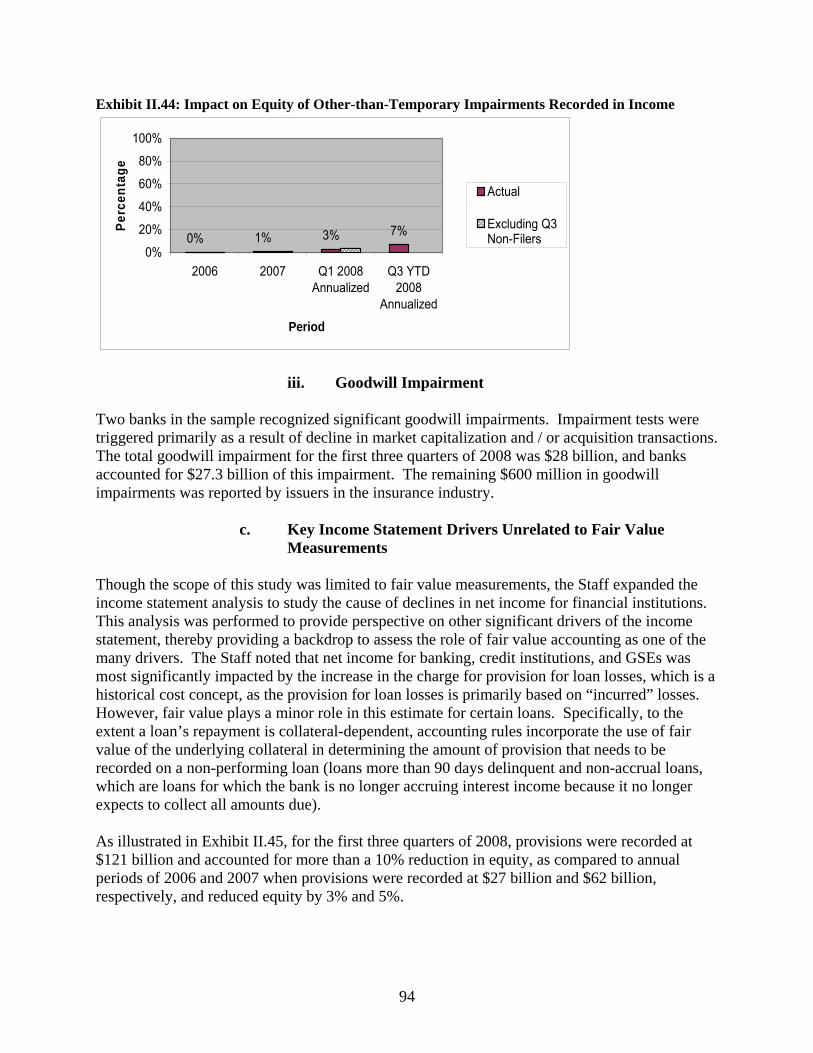
94
Exhibit II.44: Impact on Equity of Other-than-Temporary Impairments Recorded in Income
0% 1% 3% 7%0%
20%
40%
60%
80%
100%
2006 2007 Q1 2008Annualized
Q3 YTD2008
Annualized
Period
Perc
enta
ge
Actual
Excluding Q3Non-Filers
iii. Goodwill Impairment
Two banks in the sample recognized significant goodwill impairments. Impairment tests were triggered primarily as a result of decline in market capitalization and / or acquisition transactions. The total goodwill impairment for the first three quarters of 2008 was $28 billion, and banks accounted for $27.3 billion of this impairment. The remaining $600 million in goodwill impairments was reported by issuers in the insurance industry.
c. Key Income Statement Drivers Unrelated to Fair Value
Measurements
Though the scope of this study was limited to fair value measurements, the Staff expanded the income statement analysis to study the cause of declines in net income for financial institutions. This analysis was performed to provide perspective on other significant drivers of the income statement, thereby providing a backdrop to assess the role of fair value accounting as one of the many drivers. The Staff noted that net income for banking, credit institutions, and GSEs was most significantly impacted by the increase in the charge for provision for loan losses, which is a historical cost concept, as the provision for loan losses is primarily based on “incurred” losses. However, fair value plays a minor role in this estimate for certain loans. Specifically, to the extent a loan’s repayment is collateral-dependent, accounting rules incorporate the use of fair value of the underlying collateral in determining the amount of provision that needs to be recorded on a non-performing loan (loans more than 90 days delinquent and non-accrual loans, which are loans for which the bank is no longer accruing interest income because it no longer expects to collect all amounts due).
As illustrated in Exhibit II.45, for the first three quarters of 2008, provisions were recorded at $121 billion and accounted for more than a 10% reduction in equity, as compared to annual periods of 2006 and 2007 when provisions were recorded at $27 billion and $62 billion, respectively, and reduced equity by 3% and 5%.
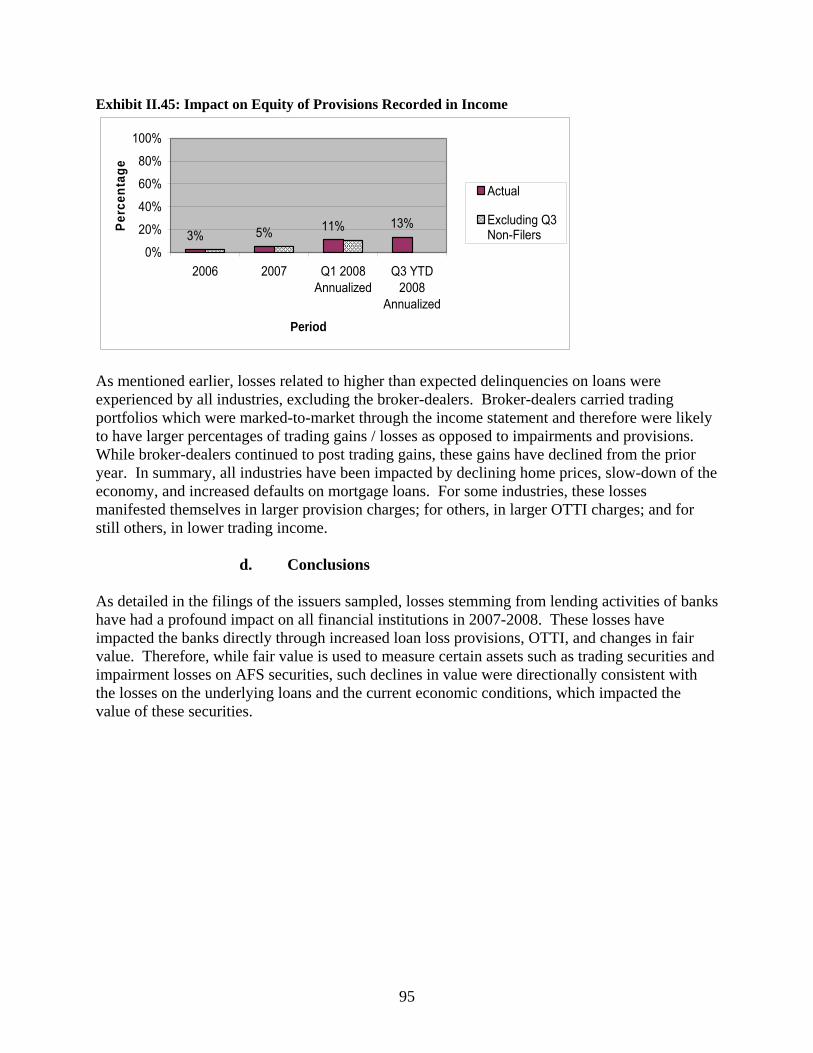
95
Exhibit II.45: Impact on Equity of Provisions Recorded in Income
3% 5% 11% 13%
0%
20%
40%
60%
80%
100%
2006 2007 Q1 2008Annualized
Q3 YTD2008
Annualized
Period
Perc
enta
ge
Actual
Excluding Q3Non-Filers
As mentioned earlier, losses related to higher than expected delinquencies on loans were experienced by all industries, excluding the broker-dealers. Broker-dealers carried trading portfolios which were marked-to-market through the income statement and therefore were likely to have larger percentages of trading gains / losses as opposed to impairments and provisions. While broker-dealers continued to post trading gains, these gains have declined from the prior year. In summary, all industries have been impacted by declining home prices, slow-down of the economy, and increased defaults on mortgage loans. For some industries, these losses manifested themselves in larger provision charges; for others, in larger OTTI charges; and for still others, in lower trading income.
d. Conclusions
As detailed in the filings of the issuers sampled, losses stemming from lending activities of banks have had a profound impact on all financial institutions in 2007-2008. These losses have impacted the banks directly through increased loan loss provisions, OTTI, and changes in fair value. Therefore, while fair value is used to measure certain assets such as trading securities and impairment losses on AFS securities, such declines in value were directionally consistent with the losses on the underlying loans and the current economic conditions, which impacted the value of these securities.

96
97
III. Impact of Fair Value Accounting on Bank Failures in 2008 This section of the study examines the impact of fair value accounting on U.S. bank failures in 2008. Specifically, this section provides: • The methodology for studying bank failures; • An overview of the regulatory framework governing bank failures; • How fair value accounting affects U.S. GAAP reporting for banks, and how the failed banks
accounted for their assets and liabilities; • Background information on the interaction between regulatory capital requirements and U.S.
GAAP reporting; • Analysis of the causes of regulatory capital declines at the failed banks; • Evaluation of the circumstances surrounding each bank failure; and • Discussion of the impact of fair value accounting on other distressed financial institutions. Based on the analysis performed, the Staff believes that fair value accounting was not a primary underlying cause of the 2008 bank failures studied. For most of the failed banks studied, fair value accounting was applied in limited circumstances, and fair value losses recognized did not have a significant impact on the bank’s capital. For the failed banks that did recognize sizable fair value losses, it does not appear that the reporting of these losses was the reason the bank failed. Market concerns about these companies, as evidenced by their share price, appear to indicate that the marketplace factored in losses for these banks that had not been recognized in U.S. GAAP reported income. While most of the failed banks studied did not recognize significant fair value losses, each appears to have experienced default rates on assets held that significantly exceeded default rates experienced at non-failed banks of similar size. While declines in fair value and, to a lesser extent, U.S. GAAP-based incurred credit losses, are based on estimates, defaults on actual loans are much less subjective, as they indicate, in an objective way, the decline in quality of the underlying assets held by these banks. Even as it relates to defaults, the accounting for and reporting of defaults should not be viewed as causing a failure, but rather, a means of providing information used by market participants and others to evaluate an entity.
A. Methodology for Studying Bank Failures In completing this portion of the study, the Staff characterized a bank133 failure as an insured depository institution in the U.S. that is closed by the appropriate state or federal chartering
133 The Staff uses the term “bank” to refer to both banks and thrifts.

98
authority in accordance with applicable law or regulations or by the appropriate Agency134 based on the authority provided under the Federal Deposit Insurance Act, entitled Prompt Corrective Action, or PCA.135 Banks that did not fail according to these criteria, but may have received other federal assistance or resolution in 2008, were not included in the detailed study.136 In addition, as Section 133(a)(2) limits its scope to the impact of bank failures, failures of non-bank financial institutions were not included in this portion of the study. However, Section III.G below provides a general discussion of such institutions. The Federal Deposit Insurance Corporation (“FDIC”) website posts information about bank failures from 1991 to present. According to the information released by the FDIC, as of December 1, 2008, there were 22 bank failures during 2008.137 Separate analysis was performed for failed banks with assets less than $1 billion on an aggregate basis, those with assets between $1 billion and $10 billion on an aggregate basis, and those with assets greater than $10 billion on an individual basis. The groupings by size of bank were designed to ensure that data for smaller banks were not outweighed by data for larger banks. As of December 31, 2007, assets held in the failed banks with assets less than $1 billion represented 1% of total assets held by failed banks, while failed banks with assets between $1 billion and $10 billion represented 5% of total assets held by failed banks. Assets held at each of the three failed banks with assets greater than $10 billion (Washington Mutual Bank (“WaMu”), IndyMac Bank (“IndyMac”), and Downey Savings and Loan (“Downey”)) ranged from 3% to 83% of total assets held by failed banks. Given that most of the assets were held by these three banks, analysis performed for this group is presented individually. Additionally, more detailed analysis was performed to understand the causes of any significant fair value losses recognized by any of the failed banks. To analyze the impact of fair value accounting on the failed banks, the Staff reviewed publicly-available quarterly financial data for each of the 22 failed banks for periods during 2006, 2007, and 2008.138 The Staff used quarterly financial data to assess the extent to which the failed banks applied fair value accounting on a recurring and non-recurring basis and whether fair value
134 For a bank that is not a member of the Federal Reserve System and instead regulated by the banking laws in the state in which it is chartered, the primary bank regulator is the state bank regulator. For these banks the primary federal regulator for purposes of PCA is the FDIC. 135 12 U.S.C. 1831o et seq. 136 To the extent those banks met the relevant sample criteria, they were, however, included in Section II of this study. 137 In order to timely incorporate data for each failed bank, banks that failed after December 1, 2008 were not included in the analysis performed. As of December 29, 2008, three additional banks had failed: First Georgia Community Bank (December 5, 2008), Haven Trust Bank (December 12, 2008), and Sanderson State Bank (December 12, 2008). 138 The Federal Financial Institutions Examination Council (“FFIEC”) Central Data Repository Public Data Distribution (“CDR PDD”) website provides financial and structural information for FDIC-insured institutions. For institutions whose primary federal regulator is the FDIC, the Office of the Comptroller of the Currency (“OCC”) or the Federal Reserve, quarterly financial data are filed on Call Reports that are available on the FFIEC website. For thrifts regulated by the Office of Thrift Supervision (“OTS”), quarterly financial data are filed on Thrift Financial Reports (“TFRs”) that are available on the OTS website.
99
accounting significantly reduced regulatory capital. In assessing the safety and soundness of the institutions they supervise, Agencies distinguish between equity as reported under U.S. GAAP and regulatory capital used to assess capital adequacy. In analyzing the impact of fair value accounting on regulatory capital, the Staff considered the fact that not all changes in fair value that affect equity also affect regulatory capital during the periods analyzed. The Staff also reviewed data provided in quarterly financial reports on credit losses and past due loans to assess the role of credit performance on bank failures. To gain insight into the causes of the bank failures, the Staff also reviewed public reports and press releases regarding the failed banks available on the Agency websites. Seven of the 22 failed banks were owned by public companies that filed financial reports with the SEC. While the study methodology in Section II excluded non-public financial institutions, for purposes of this portion of the study, all 22 banks were analyzed. For those banks that filed periodic reports with the SEC, the Staff analyzed those filings, particularly the MD&A sections of Forms 10-K and 10-Q, to understand how management described the factors affecting bank performance. Three of the public banks that failed were larger banks with assets greater than $10 billion that had active equity analyst coverage. For these three banks, the Staff also reviewed a sample of equity analyst reports and looked at changes in market share price for insights into the causes of these bank failures.
B. Regulatory Framework Governing Bank Failures
1. Capital Adequacy Guidelines
The Federal Deposit Insurance Corporation Improvement Act of 1991 (“FDICIA”) established the current PCA provisions. PCA is a framework of supervisory actions for insured depository institutions that are not adequately capitalized. The purpose of the PCA requirements “is to resolve the problems of insured depository institutions at the least possible long-term loss to the Deposit Insurance Fund.”139 The PCA framework includes mandatory minimum Agency actions that become increasingly severe as an institution falls within lower capital categories. In addition to the minimum requirements, the Agencies also have the authority to initiate additional discretionary actions, such as memorandums of understanding, cease-and-desist orders, and capital directives. As illustrated in Exhibit III.1, the PCA provisions establish five capital categories ranging from well capitalized to critically under capitalized and requires that the capital standards put in place by the Agencies include a leverage limit and a risk-based capital requirement. With the exception of minimum requirements for determining whether an institution is critically undercapitalized, the specific capital standards currently in place were determined by the Agencies. Each Agency applies the guidelines below to determine in which capital category an institution falls.
139 12 U.S.C. 1381o(a)(1).

100
Exhibit III.1: Capital Adequacy Guidelines
Total Risk-Based140
Tier 1 / Risk-Based141
Tier 1 / Leverage142
Well Capitalized 10% or greater 6% or greater 5% or greater Adequately Capitalized 8% or greater 4% or greater 4% or greater* Undercapitalized Less than 8% Less than 4% Less than 4%* Significantly Undercapitalized Less than 6% Less than 3% Less than 3%
Critically Undercapitalized
Tangible equity to total assets that is equal to or less than 2%
* 3% for institutions with the highest rating under the CAMELS rating system In addition to setting the capital ratio requirements, the Agencies’ regulatory capital standards also provide instructions for deriving the numerators (Tier 1 and total risk-based capital) and the denominators (risk-based assets and average assets) used to calculate the capital ratios.143 Banks are required to calculate and report their capital levels as of each quarter end. Undercapitalized banks are subject to a number of mandatory requirements, including having to submit a capital restoration plan within 45 days. In addition to mandatory requirements, Agencies can also impose discretionary restrictions that are determined to be necessary to help resolve the problems at the bank at the least possible long-term cost to the FDIC. Significantly undercapitalized banks and undercapitalized banks that fail to submit and implement capital restoration plans are subject to additional restrictions. Critically undercapitalized banks are subject to the same restrictions as significantly undercapitalized banks along with a requirement that critically undercapitalized banks be placed in receivership or conservatorship within 90 days of becoming critically undercapitalized, unless the primary federal or state regulator and the FDIC agree that some other action would better achieve the purpose of PCA. The Agencies have the authority to appoint a receiver or conservator for a bank on grounds unrelated to whether it has become critically undercapitalized. In assessing the soundness of an institution, the Agencies employ a Uniform Financial Institutions Rating System,144 also referred
140 The Total Risk-Based Capital ratio is calculated by dividing total risk-based capital by risk-weighted assets. Total Risk-Based Capital is a measure that starts with U.S. GAAP equity and includes adjustments to remove items such as unrealized gains (losses) on AFS debt securities and deduct disallowed goodwill and other disallowed intangible assets, but also includes items that for U.S. GAAP purposes are not accounted for as equity, such as qualified subordinated debt, redeemable preferred stock and certain allowances for loan and lease losses. Risk-weighted assets are derived from a calculation that assigns risk weighting factors to assets reported in the U.S. GAAP balance sheet and to off-balance sheet exposures. 141 The Tier 1 risk-based capital ratio is calculated by dividing Tier 1 capital by risk-weighted assets. Tier 1 capital is a measure that starts with U.S. GAAP equity and includes adjustments to remove items such as unrealized gains (losses) on AFS debt securities and deduct disallowed goodwill and other disallowed intangible assets. Items such as certain allowances for loan losses that are included in Total Risk-Based Capital are not included in Tier 1 capital. 142 The leverage ratio is calculated by dividing Tier 1 capital by average assets which is adjusted for assets deducted from Tier 1 capital. 143 See 12 CFR part 3 (national banks); 12 CFR part 208 (state member banks); 12 CFR part 325 (state nonmember banks); and 12 CFR part 567 (savings associations). 144 See, FDIC, Uniform Financial Institutions Rating System. [62 FR 752 (January 6, 1997)]

101
to as the “CAMELS” rating system, and assign a composite rating based on an evaluation and rating of six essential components of the bank’s financial condition and operations. These component factors address the adequacy of capital, the quality of assets, the capability of management, the quality and level of income, the adequacy of liquidity, and the sensitivity to market risk (including interest rates). Grounds on which a receiver or conservator may be appointed include, among others: the bank is in an unsafe and unsound condition to conduct business, the bank is likely to be unable to pay its obligations or meet its depositors’ demands, and the bank has incurred or is likely to incur losses that will deplete all or substantially all of its capital and there is no reasonable prospect for the bank to become adequately capitalized without federal assistance. State chartering authorities also may appoint a conservator or receiver for a bank under state law. 2. Reported Capital Status for 2008 Failed Banks Exhibit III.2 below shows basic descriptive information, including the last reported capital status, for each of the 22 banks that failed as of December 1, 2008. As more fully described in the remainder of this section, for most of the failed banks studied, the immediate cause of failure was the inability to become adequately capitalized. For some failed banks, the immediate cause of failure was the inability to meet depositors’ needs. Some failed banks that were closed due to liquidity also had inadequate capital, but others had adequate capital at the time of closure. Most notably, the largest bank to fail, WaMu, was well-capitalized according to the applicable capital adequacy standards at the time of failure.

102
Exhibit III.2: Failed Banks
Bank Name Location Primary Federal
Regulator
Date of Failure
Total Assets (in U.S.
Dollars)*
Last Reported Capital Status
Estimated Cost to FDIC
Insurance Fund*
Source of Last Reported Capital
Status
1 Douglass National Bank Kansas City, MO
OCC 1/25/2008 < $1 billion Significantly Undercapitalized
$0.006 billion
December 31, 2007 Call Report
2 Hume Bank Hume, MO FDIC 3/07/2008 < $1 billion Well Capitalized No estimate provided
December 31, 2007 Call Report
3 ANB Financial Bentonville, AR OCC 5/09/2008 < $3 billion Critically
Undercapitalized $0.214 billion March 31, 2008 Call Report
4 First Integrity Bank Staples, MN OCC 5/30/2008 < $1 billion Critically
Undercapitalized $0.002 billion March 31, 2008 Call Report
5 IndyMac Bank Pasadena, CA OTS 7/11/2008 < $33 billion Significantly
Undercapitalized $4 to $8 billion June 30, 2008 Thrift Financial Report
6 First Heritage Bank Newport Beach, CA
OCC 7/25/2008 < $1 billion Critically
Undercapitalized **
July 25, 2008 press release by the OCC (NR 2008-88)
7 FN Bank of Nevada Reno, NV
OCC 7/25/2008 < $4 billion Undercapitalized $0.862 billion** June 30, 2008 Call Report
8 First Priority Bank Bradenton, FL FDIC 8/01/2008 < $1 billion Critically
Undercapitalized $0.072 billion June 30, 2008 Call Report
9 Columbian Bank and Trust Topeka, KS
FDIC 8/22/2008 < $1 billion Adequately Capitalized $0.06 billion June 30, 2008 Call
Report
10 Integrity Bank Alpharetta, GA FDIC 8/29/2008 < $2 billion Undercapitalized $0.25 to $0.35
billion June 30, 2008 Call Report
11 Silver State Bank Henderson, NV FDIC 9/05/2008 < $3 billion Adequately
Capitalized $0.45 to $0.55 billion
June 30, 2008 Call Report
12 Ameribank Northfork, WV OTS 9/19/2008 < $1 billion Critically
Undercapitalized $0.042 billion September 19, 2008 press release by the OTS (OTS 08-045)
13 Washington Mutual Bank Henderson, NV
OTS 9/25/2008 <$308 billion Well Capitalized $0 June 30, 2008 Thrift Financial Report
14 Main Street Bank Northville, MI FDIC 10/10/2008 < $1 billion Significantly
Undercapitalized $0.033 to $0.039billion
June 30, 2008 Call Report
15 Meridian Bank Eldred, IL FDIC 10/10/2008 < $1 billion Critically
Undercapitalized $0.013 to $0.015 billion
September 30, 2008 Call Report
16 Alpha Bank & Trust Alpharetta, GA FDIC 10/24/2008 < $1 billion Critically
Undercapitalized $0.158 billion September 30, 2008 Call Report

103
Bank Name Location Primary Federal
Regulator
Date of Failure
Total Assets (in U.S.
Dollars)*
Last Reported Capital Status
Estimated Cost to FDIC
Insurance Fund*
Source of Last Reported Capital
Status
17 Freedom Bank Bradenton, FL FDIC 10/31/2008 < $1 billion Significantly
Undercapitalized $0.08 to $0.104 billion
September 30, 2008 Call Report
18 Franklin Bank Houston, TX FDIC 11/07/2008 <$6 billion Significantly
Undercapitalized $1.4 to $1.6 billion
September 30, 2008 Call Report
19 Security Pacific Bank Los Angeles, CA
FDIC 11/07/2008 < $1 billion Significantly Undercapitalized $0.21 billion September 30, 2008
Call Report
20 The Community Bank Loganville, GA
FDIC 11/21/2008 < $1 billion Significantly Undercapitalized
$0.2 to $0.240 billion
September 30, 2008 Call Report
21 Downey Savings and Loan
Newport Beach, CA
OTS 11/21/2008 < $13 billion Well Capitalized $1.4 billion
September 30, 2008 Thrift Financial Report
22 PFF Bank and Trust Pomona, CA
OTS 11/21/2008 <$4 billion Undercapitalized $0.7 billion September 30, 2008 Thrift Financial Report
* As reported in the press release issued by the FDIC at the time of the institution’s closure. ** FDIC has estimated a combined cost to the FDIC insurance fund of $0.862 billion for First Heritage Bank of Newport Beach and FN Bank of Nevada.
104
C. How Fair Value Accounting Affects Reporting under U.S. GAAP for Banks
This subsection first summarizes how and the extent to which fair value accounting affects banks and then describes empirically how the failed banks accounted for their assets and liabilities.
As noted in Section II.B, the majority of a bank’s assets and liabilities overall are typically not accounted for at fair value with changes in fair value recognized in net income. For most banks, HFI loans represented the most significant asset type held.145 As more fully described in Section I.D, HFI loans are not generally accounted for at fair value, but instead are generally accounted for at amortized cost with recognition of incurred credit losses. Incurred credit losses are recognized when it becomes probable that the borrower will not make all contractual payments when due.146 Changes in the fair value of HFI loans usually do not affect a bank’s U.S. GAAP reported balance sheet or income statement. One instance in which the measurement of credit loss can be affected by fair value measurements is problem loans for which collection of the loan is expected to come solely from the underlying collateral. Measurement of credit losses for these types of loans is based on the fair value of the supporting collateral.147 Similarly, accounting for foreclosed property held by a bank is based on the fair value of the property.148 Most banks also tend to hold portfolios of securities that are classified as AFS under U.S. GAAP.149 As more fully described in Section I.D, unrealized fair value losses for AFS securities are only recognized in income when the decline is other-than-temporary. As indicated by the findings in Section II, typically, the more complex a bank’s activities, the more extensive role fair value plays in the bank’s accounting. For example, banks that originate and purchase loans to be sold generally report those activities on a fair value basis. Banks that historically originated and sold a high volume of loans are likely to have significant HFS loans on their balance sheet. HFS loans are generally accounted for either at the lower-of-cost-or-fair-value or at fair value with all changes in fair value recognized in income.150 Banks participating in the securitization business are also likely to hold MSRs in sold loans. These servicing rights 145 According to the FDIC-published third quarter 2008 “Quarterly Banking Profile,” for all FDIC-insured institutions, net loans and leases represented 58% of reported bank assets as of September 30, 2008. (available at http://www2.fdic.gov/qbp/index.asp) 146 See SFAS No. 5, paragraph 23. 147 SFAS No. 114 (paragraph 13) only requires measurement of impairment to be based on the fair value of the collateral when foreclosure is probable, but the Agencies require impairment of any collateral-dependent loans to be measured using the fair value of collateral method. A loan is collateral-dependent if repayment of the loan is expected to be provided solely by the underlying collateral. 148 SFAS No. 144 (paragraph 34) requires long-lived assets classified as held-for-sale to be measured at the lower of their carrying amount or fair value less cost to sell. 149 According to the FDIC-published third quarter 2008 “Quarterly Banking Profile,” all securities, including AFS and HTM securities, but excluding trading securities, held by FDIC-insured institutions represented 15% of reported bank assets as of September 30, 2008. 150 SFAS No. 159 (paragraph 7) provides banks with the option of electing fair value accounting for loans. SFAS No. 65 (paragraph 4) requires that HFS mortgage loans for which the FVO has not been elected be accounted for at the lower-of-cost-or-fair-value.
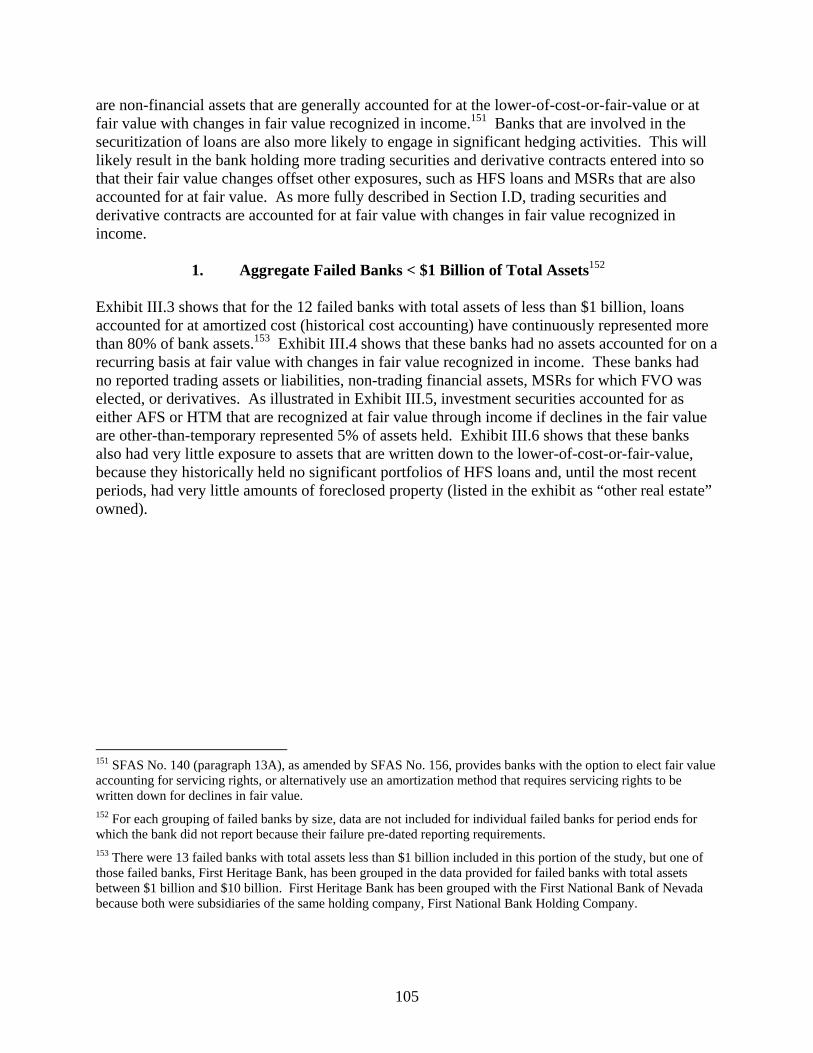
105
are non-financial assets that are generally accounted for at the lower-of-cost-or-fair-value or at fair value with changes in fair value recognized in income.151 Banks that are involved in the securitization of loans are also more likely to engage in significant hedging activities. This will likely result in the bank holding more trading securities and derivative contracts entered into so that their fair value changes offset other exposures, such as HFS loans and MSRs that are also accounted for at fair value. As more fully described in Section I.D, trading securities and derivative contracts are accounted for at fair value with changes in fair value recognized in income.
1. Aggregate Failed Banks < $1 Billion of Total Assets152 Exhibit III.3 shows that for the 12 failed banks with total assets of less than $1 billion, loans accounted for at amortized cost (historical cost accounting) have continuously represented more than 80% of bank assets.153 Exhibit III.4 shows that these banks had no assets accounted for on a recurring basis at fair value with changes in fair value recognized in income. These banks had no reported trading assets or liabilities, non-trading financial assets, MSRs for which FVO was elected, or derivatives. As illustrated in Exhibit III.5, investment securities accounted for as either AFS or HTM that are recognized at fair value through income if declines in the fair value are other-than-temporary represented 5% of assets held. Exhibit III.6 shows that these banks also had very little exposure to assets that are written down to the lower-of-cost-or-fair-value, because they historically held no significant portfolios of HFS loans and, until the most recent periods, had very little amounts of foreclosed property (listed in the exhibit as “other real estate” owned).
151 SFAS No. 140 (paragraph 13A), as amended by SFAS No. 156, provides banks with the option to elect fair value accounting for servicing rights, or alternatively use an amortization method that requires servicing rights to be written down for declines in fair value. 152 For each grouping of failed banks by size, data are not included for individual failed banks for period ends for which the bank did not report because their failure pre-dated reporting requirements. 153 There were 13 failed banks with total assets less than $1 billion included in this portion of the study, but one of those failed banks, First Heritage Bank, has been grouped in the data provided for failed banks with total assets between $1 billion and $10 billion. First Heritage Bank has been grouped with the First National Bank of Nevada because both were subsidiaries of the same holding company, First National Bank Holding Company.
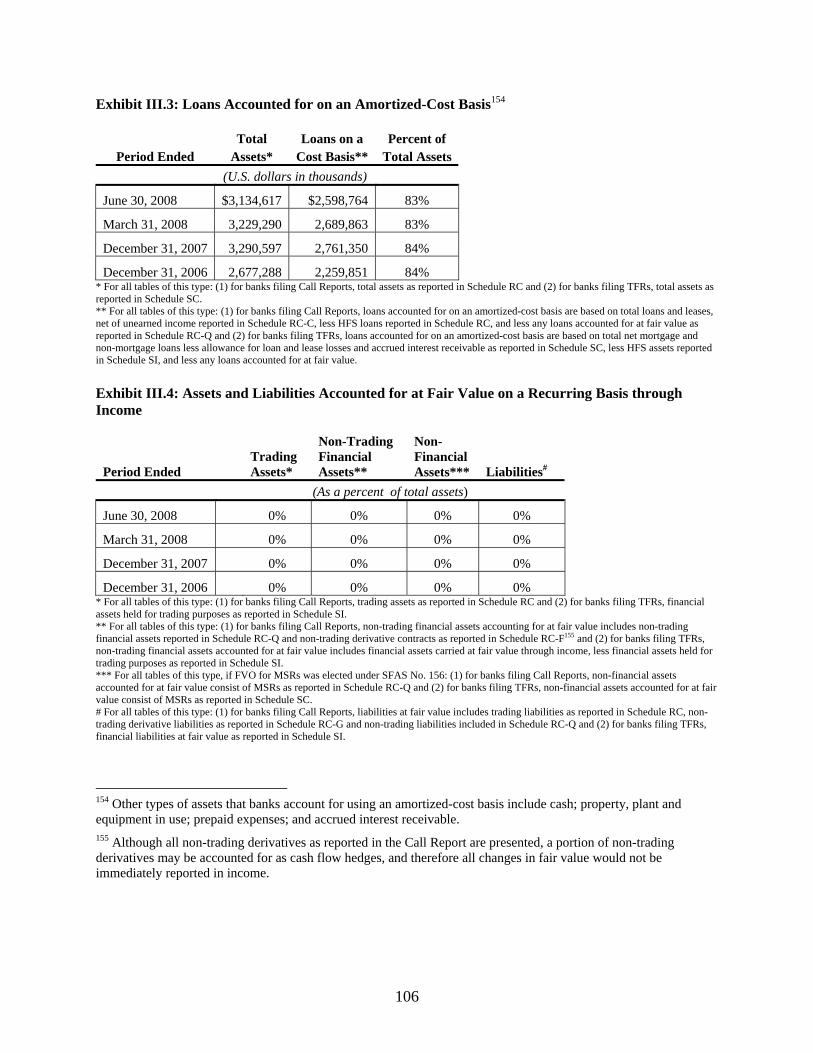
106
Exhibit III.3: Loans Accounted for on an Amortized-Cost Basis154
Total Loans on a Percent of Period Ended Assets* Cost Basis** Total Assets
(U.S. dollars in thousands)
June 30, 2008 $3,134,617 $2,598,764 83%
March 31, 2008 3,229,290 2,689,863 83%
December 31, 2007 3,290,597 2,761,350 84%
December 31, 2006 2,677,288 2,259,851 84% * For all tables of this type: (1) for banks filing Call Reports, total assets as reported in Schedule RC and (2) for banks filing TFRs, total assets as reported in Schedule SC. ** For all tables of this type: (1) for banks filing Call Reports, loans accounted for on an amortized-cost basis are based on total loans and leases, net of unearned income reported in Schedule RC-C, less HFS loans reported in Schedule RC, and less any loans accounted for at fair value as reported in Schedule RC-Q and (2) for banks filing TFRs, loans accounted for on an amortized-cost basis are based on total net mortgage and non-mortgage loans less allowance for loan and lease losses and accrued interest receivable as reported in Schedule SC, less HFS assets reported in Schedule SI, and less any loans accounted for at fair value. Exhibit III.4: Assets and Liabilities Accounted for at Fair Value on a Recurring Basis through Income
Period Ended Trading Assets*
Non-Trading Financial Assets**
Non-Financial Assets*** Liabilities#
(As a percent of total assets)
June 30, 2008 0% 0% 0% 0%
March 31, 2008 0% 0% 0% 0%
December 31, 2007 0% 0% 0% 0%
December 31, 2006 0% 0% 0% 0% * For all tables of this type: (1) for banks filing Call Reports, trading assets as reported in Schedule RC and (2) for banks filing TFRs, financial assets held for trading purposes as reported in Schedule SI. ** For all tables of this type: (1) for banks filing Call Reports, non-trading financial assets accounting for at fair value includes non-trading financial assets reported in Schedule RC-Q and non-trading derivative contracts as reported in Schedule RC-F155 and (2) for banks filing TFRs, non-trading financial assets accounted for at fair value includes financial assets carried at fair value through income, less financial assets held for trading purposes as reported in Schedule SI. *** For all tables of this type, if FVO for MSRs was elected under SFAS No. 156: (1) for banks filing Call Reports, non-financial assets accounted for at fair value consist of MSRs as reported in Schedule RC-Q and (2) for banks filing TFRs, non-financial assets accounted for at fair value consist of MSRs as reported in Schedule SC. # For all tables of this type: (1) for banks filing Call Reports, liabilities at fair value includes trading liabilities as reported in Schedule RC, non-trading derivative liabilities as reported in Schedule RC-G and non-trading liabilities included in Schedule RC-Q and (2) for banks filing TFRs, financial liabilities at fair value as reported in Schedule SI.
154 Other types of assets that banks account for using an amortized-cost basis include cash; property, plant and equipment in use; prepaid expenses; and accrued interest receivable. 155 Although all non-trading derivatives as reported in the Call Report are presented, a portion of non-trading derivatives may be accounted for as cash flow hedges, and therefore all changes in fair value would not be immediately reported in income.

107
Exhibit III.5: Investment Securities (Fair Value Losses Recognized Only When Impaired)156
Period Ended AFS* HTM** AFS HTM (U.S. dollars in thousands) (Percent of total assets)
June 30, 2008 $148,295 $2,990 5% 0%
March 31, 2008 167,053 3,127 5% 0%
December 31, 2007 181,142 3,164 6% 0%
December 31, 2006 129,922 3,193 5% 0% * For all tables of this type: (1) for banks filing Call Reports, AFS securities as reported in Schedule RC and (2) for banks filing TFRs, AFS securities as reported in Schedule SI. ** For all tables of this type: (1) for banks filing Call Reports, HTM securities as reported in Schedule RC and (2) for banks filing TFRs, HTM securities is based on total securities as reported in Schedule SC, less trading and AFS securities as reported in Schedule SI. Exhibit III.6: Assets Accounted for at the Lower-of-Cost-or-Fair-Value157
Period Ended Loans HFS* Other Real
Estate** Loans HFS Other Real
Estate (U.S. dollars in thousands) (Percent of total assets)
June 30, 2008 $1,320 $90,062 0% 3%
March 31, 2008 2,157 65,375 0% 2%
December 31, 2007 3,059 53,333 0% 2%
December 31, 2006 4,965 4,758 0% 0% * For all tables of this type: (1) for banks filing Call Reports, HFS loans and leases as reported in Schedule RC and (2) for banks filing TFRs, loans and HFS assets as reported in Schedule SI. ** For all tables of this type: (1) for banks filing Call Reports, other real estate owned as reported in Schedule RC and (2) for banks filing TFRs, total repossessed assets as reported in Schedule SC.
2. Aggregate Failed Banks > $1 Billion, but < $10 Billion of Total Assets158
As illustrated in Exhibit III.7, loans accounted for based on amortized cost also made up the majority of the assets held by the failed banks with assets greater than $1 billion, but less than $10 billion. Although these banks had slightly more assets accounted for on a recurring basis at fair value, as illustrated in Exhibit III.8, recurring fair value accounting made up a relatively insignificant portion of these banks’ balance sheets. As illustrated in Exhibit III.9, investment securities accounted for as either AFS or HTM that are recognized at fair value through income 156 Tables for investment securities for which fair value losses are recognized when impaired do not include equity securities that do not have readily determinable fair values. These securities are not accounted for in accordance with SFAS No. 115 as either AFS or HTM and are reported in the Call Report as “other assets.” Other assets are items that typically individually are not significant to the balance sheet. 157 Tables for assets accounted for at the lower-of-cost-or-fair-value do not include intangible assets which, as more fully discussed in Section I.D, are subject to impairment tests that are based on fair value measurements once certain triggers are met. 158 Because the First National Bank of Arizona was merged into First National Bank of Nevada and Choice Bank was merged into Silver State Bank as of June 30, 2008, information for these banks is included for all periods presented.

108
if declines in the fair value are other-than-temporary represented 6% of assets held. As illustrated in Exhibit III.10, prior to the 2007 tightening in the secondary market for non-agency mortgage loans, HFS loans made up 10% of the balance sheets of these banks. The majority of the HFS loans reported as of December 31, 2006 for this grouping were held at the First National Bank of Arizona, which merged into the First National Bank of Nevada just prior to the bank’s failure in 2008. The significant decease during 2007 in HFS loans was due to the decision made by First National Bank of Arizona during 2007 to wind down its national wholesale mortgage business.159 Exhibit III.7: Loans Accounted for on an Amortized-Cost Basis
Total Loans on a Percent of Period Ended Assets* Cost Basis** Total Assets
(U.S. dollars in thousands)
June 30, 2008 $ 16,406,725 $ 12,864,533 78%
March 31, 2008 19,666,923 15,398,023 78%
December 31, 2007 19,652,563 15,685,922 80%
December 31, 2006 18,731,349 14,368,103 77% Exhibit III.8: Assets and Liabilities Accounted for at Fair Value on a Recurring Basis through Income
Period Ended Trading Assets*
Non-Trading Financial Assets**
Non-Financial Assets*** Liabilities#
(As a percent of total assets)
June 30, 2008 0% 1% 0% 0%
March 31, 2008 0% 1% 0% 0%
December 31, 2007 0% 0% 0% 0%
December 31, 2006 0% 0% 0% 0% Exhibit III.9: Investment Securities (Fair Value Losses Recognized Only When Impaired)
Period Ended AFS* HTM** AFS HTM (U.S. dollars in thousands) (Percent of total assets)
June 30, 2008 $634,383 $340,354 4% 2%
March 31, 2008 687,064 355,636 3% 2%
December 31, 2007 909,440 346,709 5% 2%
December 31, 2006 856,319 14,092 5% 0%
159 See 2007 Annual Report for First National Bank Holding Company, The President’s Message, page 3.

109
Exhibit III.10: Assets Accounted for at the Lower-of-Cost-or-Fair-Value
Other Other Period Ended Loans HFS* Real Estate** Loans HFS Real Estate
(U.S. dollars in thousands) (Percent of total assets)
June 30, 2008 $195,535 $168,170 1% 1%
March 31, 2008 231,392 123,658 1% 1%
December 31, 2007 327,299 86,524 2% 0%
December 31, 2006 1,954,882 31,862 10% 0%
3. Failed Banks > $10 Billion of Total Assets
a. Washington Mutual
WaMu, with assets in excess of $300 billion, was much larger than the other failed banks. However, like the smaller failed banks, Exhibit III.11 indicates that loans accounted for on an amortized-cost basis made up a majority of WaMu’s assets. Because its activities were not as concentrated in the originate-to-distribute model, the portion of WaMu’s balance sheet accounted for at fair value was significantly smaller than large banks in general. Exhibit III.12 shows that, in total, WaMu had less then 5% of its assets accounted for on a recurring basis at fair value with changes in fair value through income. This is in contrast to the analysis in Section II.B, which demonstrated that 22% of bank assets were accounted for at fair value through income. Exhibit III.12 illustrates that MSRs made up approximately 50% of the assets that WaMu accounted for at fair value through income. In 2006, WaMu elected to early adopt the FVO provided in SFAS No. 156 to its MSRs because it actively hedged the fair value of these assets. As illustrated in Exhibit III.13, AFS investment securities represented 8% of WaMu’s assets. Exhibit III.14 shows that like failed banks with assets between $1 billion and $10 billion, the percentage of WaMu’s assets made up of HFS loans significantly decreased during 2007. In WaMu’s 2007 Form 10-K, it disclosed that:
Due to the illiquid market, residential mortgage loans designated as held for sale at December 31, 2007 were largely limited to conforming loans eligible for purchase by the housing government-sponsored enterprises. The December 31, 2006 balance of loans held for sale included approximately $17.5 billion of medium-term adjustable-rate home loans which were transferred during the fourth quarter of 2006 from loans held in portfolio to loans held for sale. These loans were subsequently sold during the first quarter of 2007. In addition, as a result of the severe contraction in secondary market liquidity, the Company transferred approximately $17 billion of real estate loans to its loan portfolio during the third quarter of 2007, which represented substantially all of the Company’s nonconforming loans that had been designated as held for sale prior to the market disruption.
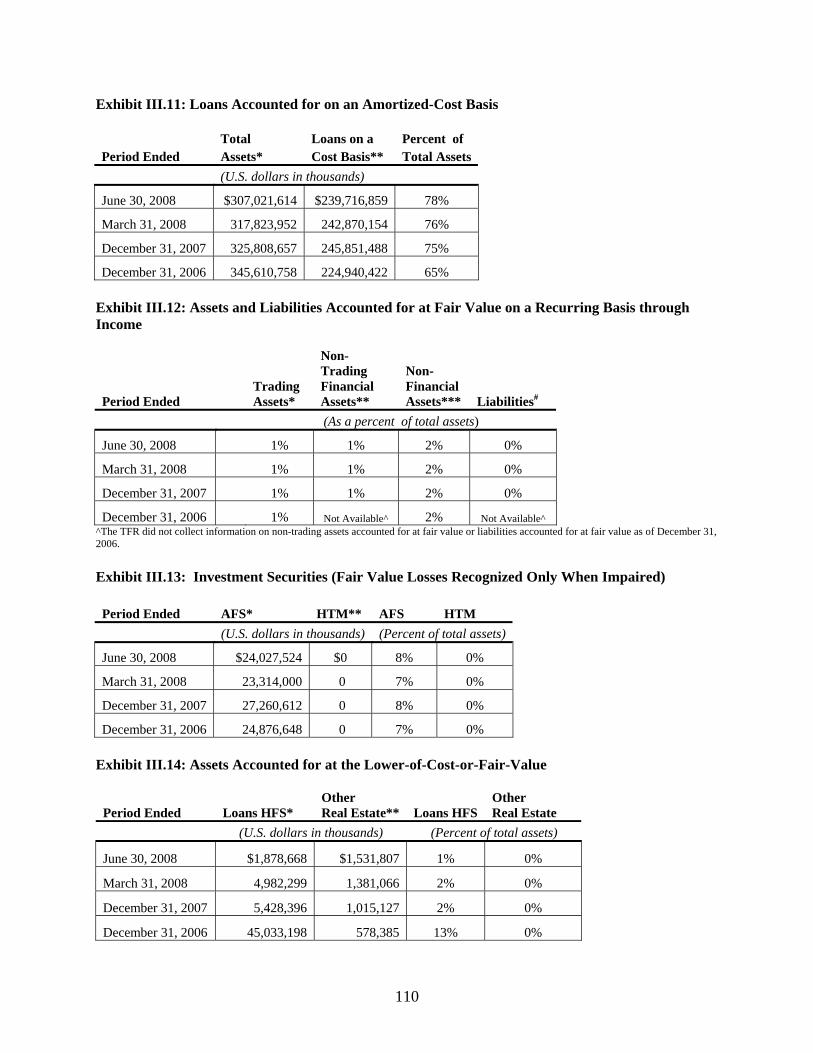
110
Exhibit III.11: Loans Accounted for on an Amortized-Cost Basis Total Loans on a Percent of Period Ended Assets* Cost Basis** Total Assets (U.S. dollars in thousands)
June 30, 2008 $307,021,614 $239,716,859 78%
March 31, 2008 317,823,952 242,870,154 76%
December 31, 2007 325,808,657 245,851,488 75%
December 31, 2006 345,610,758 224,940,422 65% Exhibit III.12: Assets and Liabilities Accounted for at Fair Value on a Recurring Basis through Income
Period Ended Trading Assets*
Non-Trading Financial Assets**
Non-Financial Assets*** Liabilities#
(As a percent of total assets)
June 30, 2008 1% 1% 2% 0%
March 31, 2008 1% 1% 2% 0%
December 31, 2007 1% 1% 2% 0%
December 31, 2006 1% Not Available^ 2% Not Available^ ^The TFR did not collect information on non-trading assets accounted for at fair value or liabilities accounted for at fair value as of December 31, 2006. Exhibit III.13: Investment Securities (Fair Value Losses Recognized Only When Impaired) Period Ended AFS* HTM** AFS HTM (U.S. dollars in thousands) (Percent of total assets)
June 30, 2008 $24,027,524 $0 8% 0%
March 31, 2008 23,314,000 0 7% 0%
December 31, 2007 27,260,612 0 8% 0%
December 31, 2006 24,876,648 0 7% 0% Exhibit III.14: Assets Accounted for at the Lower-of-Cost-or-Fair-Value
Period Ended Loans HFS* Other Real Estate** Loans HFS
Other Real Estate
(U.S. dollars in thousands) (Percent of total assets)
June 30, 2008 $1,878,668 $1,531,807 1% 0%
March 31, 2008 4,982,299 1,381,066 2% 0%
December 31, 2007 5,428,396 1,015,127 2% 0%
December 31, 2006 45,033,198 578,385 13% 0%

111
b. IndyMac
IndyMac, which had assets in excess of $30 billion and specialized in the securitization and servicing of non-agency loans, demonstrated a contrast to the other failed banks. For example, as shown in Exhibit III.15, loans accounted for at amortized cost made up a significant portion of its balance sheet, but a much smaller portion when compared to the other failed banks. IndyMac retained a significant portfolio of mortgage-backed securities and residual interests that were created by its private-label securitization activities. Many of these interests were classified as trading assets and therefore were accounted for at fair value with changes in fair value recognized in income. Due to changing market conditions for mortgage-backed securities, during 2007 IndyMac retained significantly more of the securities generated by its securitization activities. These interests included non-investment grade securities (rated below BBB) that have concentrated credit risk, as they typically absorb a greater amount of credit losses before such losses affect senior or other investment grade securities, as well as residual interests that represent the first loss position and are not typically rated by the nationally-recognized rating agencies. In IndyMac’s 2007 Form 10-K, it disclosed that:
We consider certain of our investment grade securities to be economic hedges of our non-investment grade securities and residuals. We classify these investment grade securities as trading securities in order to reflect changes in their fair values in our current results. Residuals are generally classified as trading securities so the accounting for these securities will mirror the economic hedging activities. All other MBS, including a portion of our non-investment grade securities, are classified as available for sale.
In addition to the significant portfolio of securities accounted for at fair value, in 2006 IndyMac elected to account for its MSRs at fair value because it actively hedged their fair value with derivatives and trading securities accounted for at fair value. Additionally, in 2008, IndyMac elected to account for its HFS mortgage loans also on a recurring basis at fair value with all changes in fair value recognized in income. Exhibit III.16 shows that as of March 31, 2008, financial assets accounted for at fair value on a recurring basis through income made up 13% of IndyMac’s assets, with MSRs accounted for at fair value through income making up an additional 8% of assets. Exhibit III.17 shows that IndyMac also had a significant amount of investment securities accounted for as AFS. Exhibit III.18 shows that during 2007, the amount of assets accounted for at the lower-of-cost-or-fair value declined from 33% of assets to 13% of assets, due to a significant decline in HFS loans.
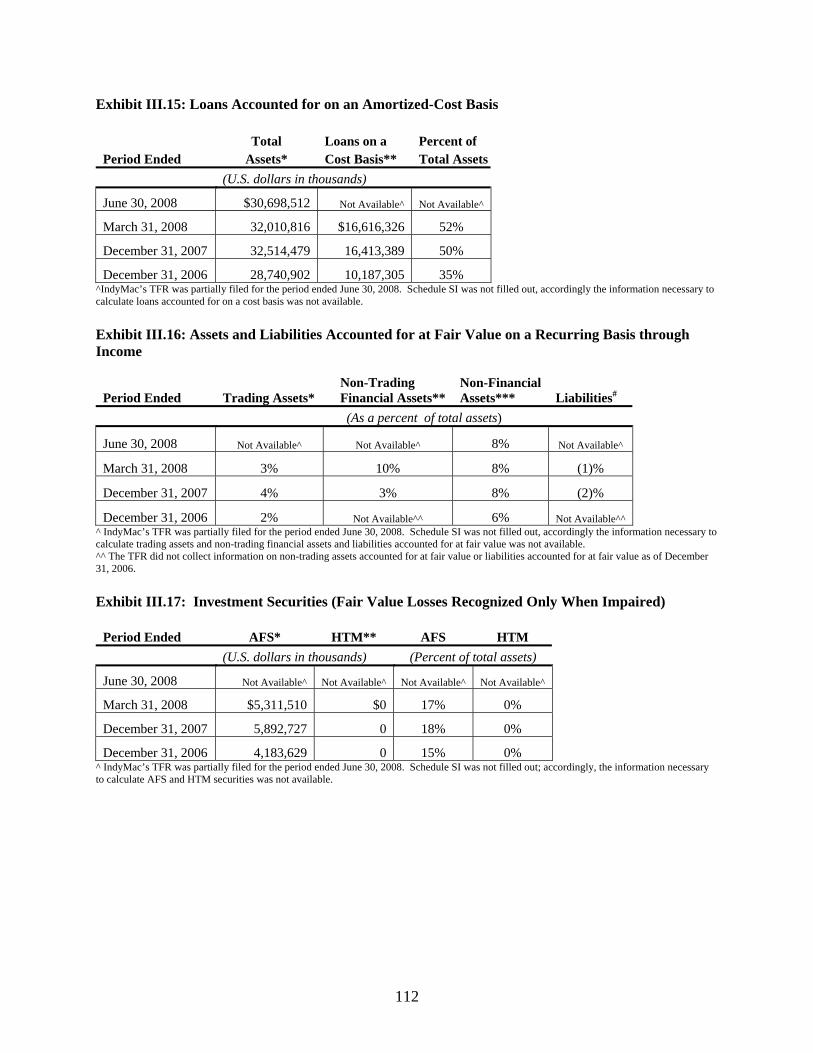
112
Exhibit III.15: Loans Accounted for on an Amortized-Cost Basis
Total Loans on a Percent of Period Ended Assets* Cost Basis** Total Assets (U.S. dollars in thousands)
June 30, 2008 $30,698,512 Not Available^ Not Available^
March 31, 2008 32,010,816 $16,616,326 52%
December 31, 2007 32,514,479 16,413,389 50%
December 31, 2006 28,740,902 10,187,305 35% ^IndyMac’s TFR was partially filed for the period ended June 30, 2008. Schedule SI was not filled out, accordingly the information necessary to calculate loans accounted for on a cost basis was not available. Exhibit III.16: Assets and Liabilities Accounted for at Fair Value on a Recurring Basis through Income
Period Ended Trading Assets*
Non-Trading Financial Assets**
Non-Financial Assets*** Liabilities#
(As a percent of total assets)
June 30, 2008 Not Available^ Not Available^ 8% Not Available^
March 31, 2008 3% 10% 8% (1)%
December 31, 2007 4% 3% 8% (2)%
December 31, 2006 2% Not Available^^ 6% Not Available^^ ^ IndyMac’s TFR was partially filed for the period ended June 30, 2008. Schedule SI was not filled out, accordingly the information necessary to calculate trading assets and non-trading financial assets and liabilities accounted for at fair value was not available. ^^ The TFR did not collect information on non-trading assets accounted for at fair value or liabilities accounted for at fair value as of December 31, 2006. Exhibit III.17: Investment Securities (Fair Value Losses Recognized Only When Impaired)
Period Ended AFS* HTM** AFS HTM (U.S. dollars in thousands) (Percent of total assets)
June 30, 2008 Not Available^ Not Available^ Not Available^ Not Available^
March 31, 2008 $5,311,510 $0 17% 0%
December 31, 2007 5,892,727 0 18% 0%
December 31, 2006 4,183,629 0 15% 0% ^ IndyMac’s TFR was partially filed for the period ended June 30, 2008. Schedule SI was not filled out; accordingly, the information necessary to calculate AFS and HTM securities was not available.
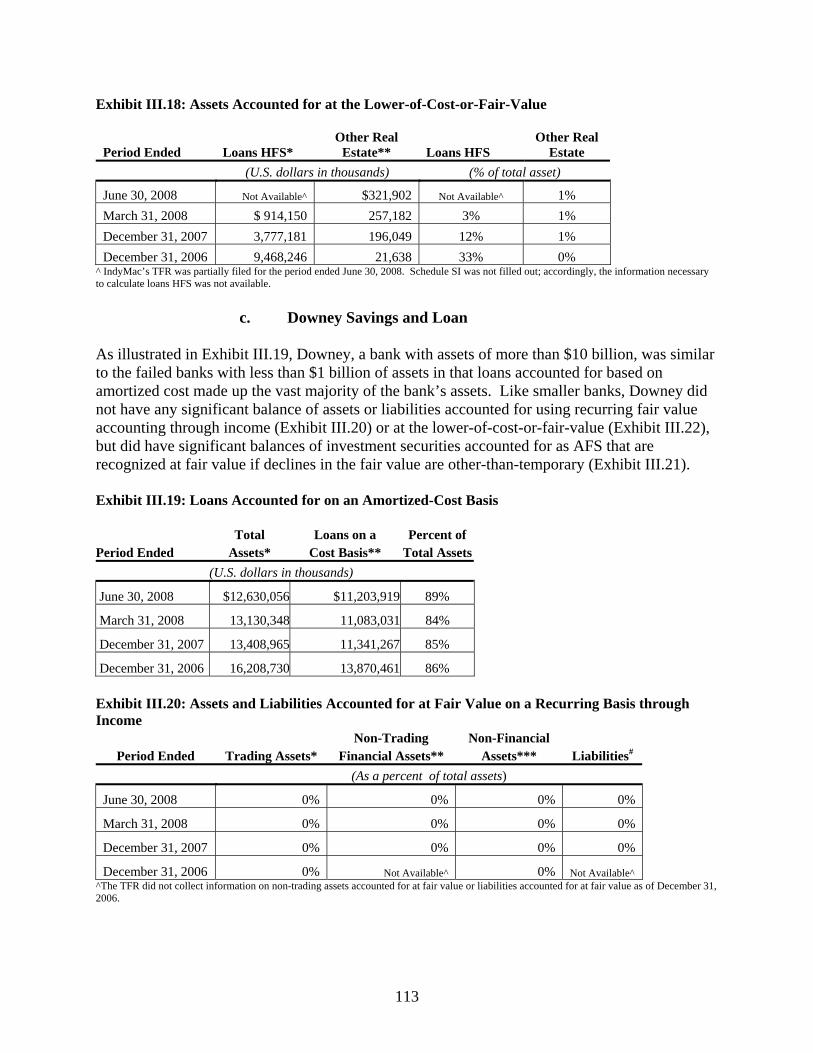
113
Exhibit III.18: Assets Accounted for at the Lower-of-Cost-or-Fair-Value
Period Ended Loans HFS*
Other Real Estate** Loans HFS
Other Real Estate
(U.S. dollars in thousands) (% of total asset)
June 30, 2008 Not Available^ $321,902 Not Available^ 1% March 31, 2008 $ 914,150 257,182 3% 1% December 31, 2007 3,777,181 196,049 12% 1% December 31, 2006 9,468,246 21,638 33% 0%
^ IndyMac’s TFR was partially filed for the period ended June 30, 2008. Schedule SI was not filled out; accordingly, the information necessary to calculate loans HFS was not available.
c. Downey Savings and Loan As illustrated in Exhibit III.19, Downey, a bank with assets of more than $10 billion, was similar to the failed banks with less than $1 billion of assets in that loans accounted for based on amortized cost made up the vast majority of the bank’s assets. Like smaller banks, Downey did not have any significant balance of assets or liabilities accounted for using recurring fair value accounting through income (Exhibit III.20) or at the lower-of-cost-or-fair-value (Exhibit III.22), but did have significant balances of investment securities accounted for as AFS that are recognized at fair value if declines in the fair value are other-than-temporary (Exhibit III.21). Exhibit III.19: Loans Accounted for on an Amortized-Cost Basis
Total Loans on a Percent of Period Ended Assets* Cost Basis** Total Assets (U.S. dollars in thousands)
June 30, 2008 $12,630,056 $11,203,919 89%
March 31, 2008 13,130,348 11,083,031 84%
December 31, 2007 13,408,965 11,341,267 85%
December 31, 2006 16,208,730 13,870,461 86% Exhibit III.20: Assets and Liabilities Accounted for at Fair Value on a Recurring Basis through Income
Non-Trading Non-Financial Period Ended Trading Assets* Financial Assets** Assets*** Liabilities#
(As a percent of total assets)
June 30, 2008 0% 0% 0% 0%
March 31, 2008 0% 0% 0% 0%
December 31, 2007 0% 0% 0% 0%
December 31, 2006 0% Not Available^ 0% Not Available^ ^The TFR did not collect information on non-trading assets accounted for at fair value or liabilities accounted for at fair value as of December 31, 2006.
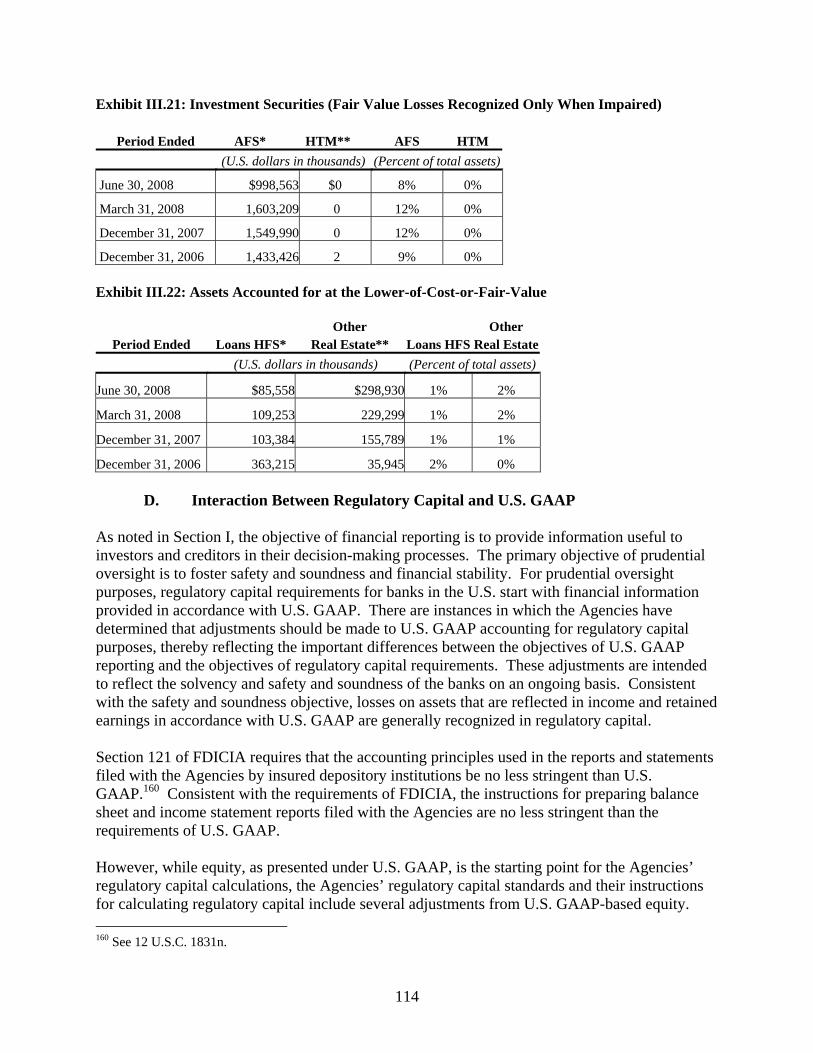
114
Exhibit III.21: Investment Securities (Fair Value Losses Recognized Only When Impaired)
Period Ended AFS* HTM** AFS HTM (U.S. dollars in thousands) (Percent of total assets)
June 30, 2008 $998,563 $0 8% 0%
March 31, 2008 1,603,209 0 12% 0%
December 31, 2007 1,549,990 0 12% 0%
December 31, 2006 1,433,426 2 9% 0% Exhibit III.22: Assets Accounted for at the Lower-of-Cost-or-Fair-Value
Other Other Period Ended Loans HFS* Real Estate** Loans HFS Real Estate
(U.S. dollars in thousands) (Percent of total assets)
June 30, 2008 $85,558 $298,930 1% 2%
March 31, 2008 109,253 229,299 1% 2%
December 31, 2007 103,384 155,789 1% 1%
December 31, 2006 363,215 35,945 2% 0%
D. Interaction Between Regulatory Capital and U.S. GAAP
As noted in Section I, the objective of financial reporting is to provide information useful to investors and creditors in their decision-making processes. The primary objective of prudential oversight is to foster safety and soundness and financial stability. For prudential oversight purposes, regulatory capital requirements for banks in the U.S. start with financial information provided in accordance with U.S. GAAP. There are instances in which the Agencies have determined that adjustments should be made to U.S. GAAP accounting for regulatory capital purposes, thereby reflecting the important differences between the objectives of U.S. GAAP reporting and the objectives of regulatory capital requirements. These adjustments are intended to reflect the solvency and safety and soundness of the banks on an ongoing basis. Consistent with the safety and soundness objective, losses on assets that are reflected in income and retained earnings in accordance with U.S. GAAP are generally recognized in regulatory capital. Section 121 of FDICIA requires that the accounting principles used in the reports and statements filed with the Agencies by insured depository institutions be no less stringent than U.S. GAAP.160 Consistent with the requirements of FDICIA, the instructions for preparing balance sheet and income statement reports filed with the Agencies are no less stringent than the requirements of U.S. GAAP. However, while equity, as presented under U.S. GAAP, is the starting point for the Agencies’ regulatory capital calculations, the Agencies’ regulatory capital standards and their instructions for calculating regulatory capital include several adjustments from U.S. GAAP-based equity. 160 See 12 U.S.C. 1831n.
115
For example, although unrealized gains and losses for AFS debt securities are included in U.S. GAAP-based equity (as part of accumulated OCI), these unrealized gains and losses generally do not impact regulatory capital. Losses that are realized by a bank, either by sale of the debt security or determination that the decline in the fair value of the debt security is other-than-temporary, are reflected in regulatory capital. In 1995, the OTS, as well as the other Agencies, issued a final rule to exclude unrealized gains and losses for AFS debt securities recognized under SFAS No. 115 from regulatory capital. In its final rule, the OTS stated:
After considering all the comments received, the OTS, in consultation with the other Agencies, has decided not to adopt its proposal to include the SFAS No. 115 equity component in computing regulatory capital. …Based on the comment letters received, the OTS determined that adoption of the proposal could potentially have an inappropriate impact on associations' regulatory capital and result in an inaccurate picture of their capital positions. For example, fluctuations in interest rates could cause temporary changes in regulatory capital levels, which in turn could trigger more permanent regulatory intervention and inappropriately affect industry profitability. …The OTS considered the comments received regarding FDICIA’s requirement that regulatory accounting policy be no less stringent than GAAP. Section 121 of FDICIA requires that policies applicable to reports and statements filed with the Federal banking agencies generally conform to GAAP. The section, however, does not require the calculation of an institution's regulatory capital or the components of regulatory capital to conform to GAAP, and the legislative history of the section indicates that was not necessarily the intent of Congress.161
In addition to making adjustments to exclude from regulatory capital certain amounts reported under U.S. GAAP in accumulated OCI, the regulatory calculation of capital also includes adjustments to certain assets that are recognized and included in equity under U.S. GAAP.162 For example, goodwill163 is deducted from regulatory capital and the inclusion in regulatory capital of certain servicing rights recognized as assets under U.S. GAAP is limited. As a result, fair value measurements that adjust the carrying amount of items excluded from regulatory capital, while reducing U.S. GAAP-based equity, may not have an impact on regulatory capital. In certain circumstances, the regulatory calculation of capital also includes items not reported in equity under U.S. GAAP. In 2005, the Federal Reserve issued a final rule addressing the definition of regulatory capital in which it stated:
161 OTS, OTS Release No. 95-151 (August 3, 1995), Regulatory Capital: Common Stockholders’ Equity. [60 FR 42025 (August 15, 1995)] 162 See “Instructions for Preparation of Consolidated Reports of Condition and Income (FFIEC 031 and 041),” last updated June 2008 as provided on the FFIEC website, for a description of the assets reported under U.S. GAAP that are not eligible to be included in Schedule RC-R – Regulatory Capital. (available at http://www.ffiec.gov/PDF/FFIEC_forms/FFIEC031_041_200806_i.pdf) 163 On September 30, 2008, the Agencies jointly issued a notice of proposed rulemaking seeking comment on whether to allow goodwill, which must be deducted from Tier 1 capital, to be reduced by the amount of any associated deferred tax liability. See, e.g., Federal Reserve System, Joint Notice of Proposed Rulemaking No. R-1329 (September 30, 2008), Minimum Capital Ratios; Capital Adequacy Guidelines; Capital Maintenance; Capital; Deduction of Goodwill Net of Associated Deferred Tax Liability. [73 FR 190 (September 30, 2008)]
116
A change in the GAAP accounting for a capital instrument does not necessarily change the regulatory capital treatment of that instrument. Although GAAP informs the definition of regulatory capital, the [Federal Reserve] is not bound to use GAAP accounting concepts in its definition of [T]ier 1 or [T]ier 2 capital because regulatory capital requirements are regulatory constructs designed to ensure the safety and soundness of banking organizations, not accounting designations established to ensure the transparency of financial statements. In this regard, the definition of [T]ier 1 capital since the [Federal Reserve] adopted its risk-based capital rule in 1989 has differed from GAAP equity in a number of ways. The [Federal Reserve] has determined that these differences are consistent with its responsibility for ensuring the soundness of the capital bases of banking organizations under its supervision. These differences are not differences between regulatory reporting and GAAP accounting requirements, but rather are differences only between the definition of equity for purposes of GAAP and the definition of [T]ier 1 capital for purposes of the Board’s regulatory capital requirements for banking organizations.164
In 2006 and 2007, with the issuance of U.S. GAAP standards that allowed banks to elect fair value accounting for their own liabilities, the Agencies considered, from a supervisory perspective, whether it is prudent for all changes in the fair value of liabilities to be included in regulatory capital. The quarterly call report supplemental instructions state:
The agencies are considering the regulatory capital implications of the use of a fair value option, including the fair value option in FASB Statement No. 155 on certain hybrid financial instruments (FAS 155) and FASB Statement No. 156 on servicing assets and liabilities (FAS 156). Except as discussed below, changes in the fair value of assets and liabilities to which a fair value option is applied that are recognized in earnings should be reflected in Tier 1 capital, pending further guidance from the agencies. For a liability to which a fair value option is applied, banks should consider the effect of a change in their own creditworthiness on the fair value of the liability. The agencies have determined that banks should exclude from Tier 1 capital the cumulative change in the fair value of liabilities accounted for under a fair value option that is included in retained earnings (Schedule RC, item 26.a) and is attributable to changes in the bank’s own creditworthiness.165
This adjustment to exclude from capital certain fair value changes recognized in equity addresses the Agencies concern that a bank in a deteriorating credit condition might recognize increases in regulatory capital as a result of unrealized fair value gains caused by declines in the bank’s own creditworthiness.
164 Federal Reserve System, Final Rule No. R-1193 (March 10, 2005), Risk-Based Capital Standards: Trust Preferred Securities and the Definition of Capital. [70 FR 11827 (March 10, 2005)] 165 FFIEC, Reporting Forms - FFIEC 031 Consolidated Reports of Condition and Income for a Bank with Domestic and Foreign Offices, Supplemental Instructions – September 2008. (available at http://www.ffiec.gov/PDF/FFIEC_forms/FFIEC031_041_suppinst_200809.pdf)
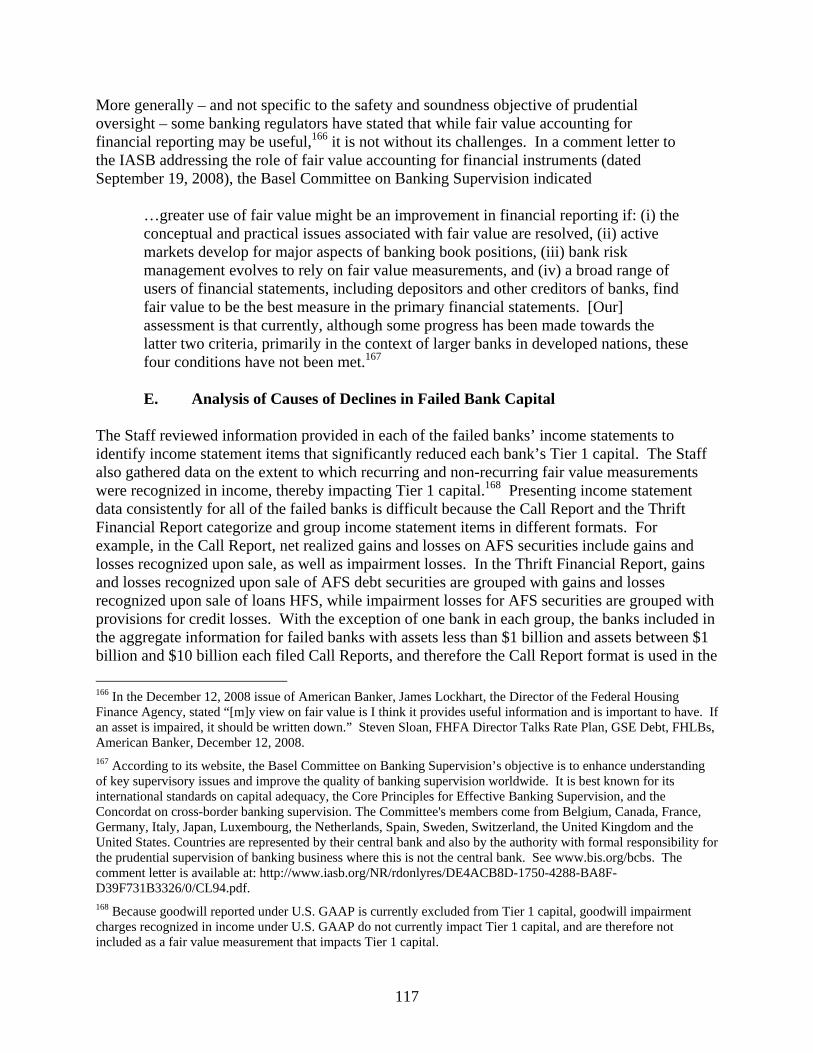
117
More generally – and not specific to the safety and soundness objective of prudential oversight – some banking regulators have stated that while fair value accounting for financial reporting may be useful,166 it is not without its challenges. In a comment letter to the IASB addressing the role of fair value accounting for financial instruments (dated September 19, 2008), the Basel Committee on Banking Supervision indicated
…greater use of fair value might be an improvement in financial reporting if: (i) the conceptual and practical issues associated with fair value are resolved, (ii) active markets develop for major aspects of banking book positions, (iii) bank risk management evolves to rely on fair value measurements, and (iv) a broad range of users of financial statements, including depositors and other creditors of banks, find fair value to be the best measure in the primary financial statements. [Our] assessment is that currently, although some progress has been made towards the latter two criteria, primarily in the context of larger banks in developed nations, these four conditions have not been met.167
E. Analysis of Causes of Declines in Failed Bank Capital
The Staff reviewed information provided in each of the failed banks’ income statements to identify income statement items that significantly reduced each bank’s Tier 1 capital. The Staff also gathered data on the extent to which recurring and non-recurring fair value measurements were recognized in income, thereby impacting Tier 1 capital.168 Presenting income statement data consistently for all of the failed banks is difficult because the Call Report and the Thrift Financial Report categorize and group income statement items in different formats. For example, in the Call Report, net realized gains and losses on AFS securities include gains and losses recognized upon sale, as well as impairment losses. In the Thrift Financial Report, gains and losses recognized upon sale of AFS debt securities are grouped with gains and losses recognized upon sale of loans HFS, while impairment losses for AFS securities are grouped with provisions for credit losses. With the exception of one bank in each group, the banks included in the aggregate information for failed banks with assets less than $1 billion and assets between $1 billion and $10 billion each filed Call Reports, and therefore the Call Report format is used in the 166 In the December 12, 2008 issue of American Banker, James Lockhart, the Director of the Federal Housing Finance Agency, stated “[m]y view on fair value is I think it provides useful information and is important to have. If an asset is impaired, it should be written down.” Steven Sloan, FHFA Director Talks Rate Plan, GSE Debt, FHLBs, American Banker, December 12, 2008. 167 According to its website, the Basel Committee on Banking Supervision’s objective is to enhance understanding of key supervisory issues and improve the quality of banking supervision worldwide. It is best known for its international standards on capital adequacy, the Core Principles for Effective Banking Supervision, and the Concordat on cross-border banking supervision. The Committee's members come from Belgium, Canada, France, Germany, Italy, Japan, Luxembourg, the Netherlands, Spain, Sweden, Switzerland, the United Kingdom and the United States. Countries are represented by their central bank and also by the authority with formal responsibility for the prudential supervision of banking business where this is not the central bank. See www.bis.org/bcbs. The comment letter is available at: http://www.iasb.org/NR/rdonlyres/DE4ACB8D-1750-4288-BA8F-D39F731B3326/0/CL94.pdf. 168 Because goodwill reported under U.S. GAAP is currently excluded from Tier 1 capital, goodwill impairment charges recognized in income under U.S. GAAP do not currently impact Tier 1 capital, and are therefore not included as a fair value measurement that impacts Tier 1 capital.
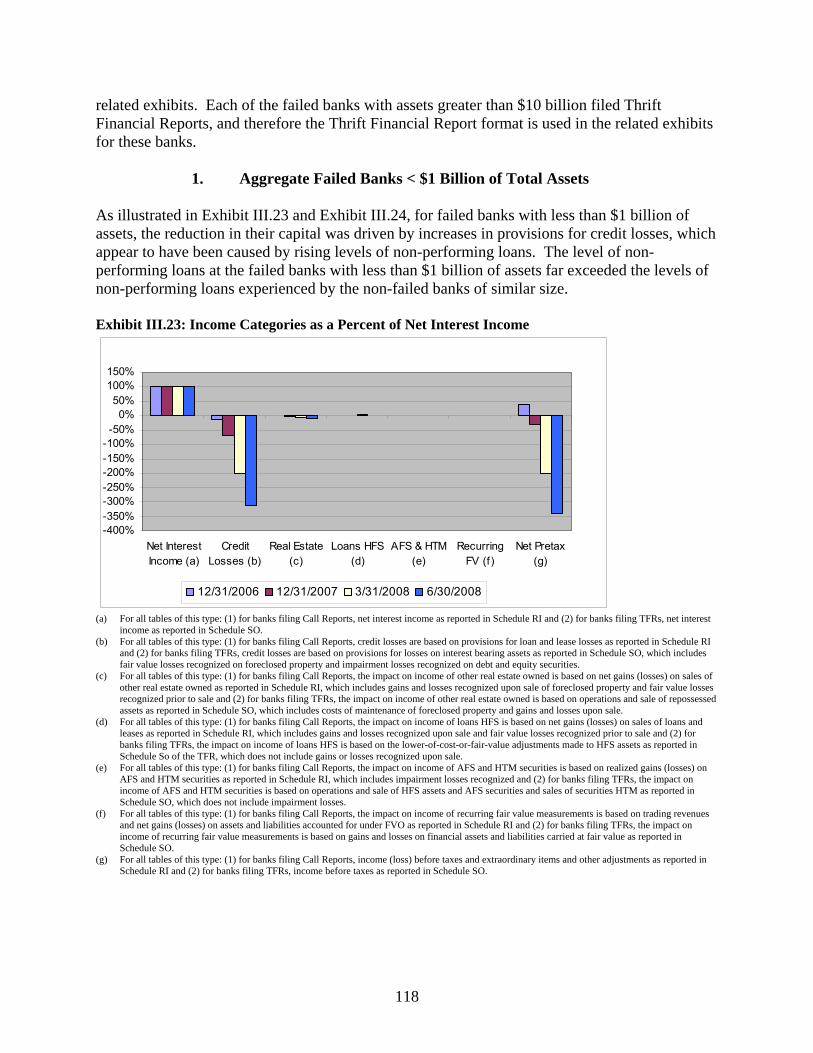
118
related exhibits. Each of the failed banks with assets greater than $10 billion filed Thrift Financial Reports, and therefore the Thrift Financial Report format is used in the related exhibits for these banks.
1. Aggregate Failed Banks < $1 Billion of Total Assets As illustrated in Exhibit III.23 and Exhibit III.24, for failed banks with less than $1 billion of assets, the reduction in their capital was driven by increases in provisions for credit losses, which appear to have been caused by rising levels of non-performing loans. The level of non-performing loans at the failed banks with less than $1 billion of assets far exceeded the levels of non-performing loans experienced by the non-failed banks of similar size. Exhibit III.23: Income Categories as a Percent of Net Interest Income
-400%-350%-300%-250%-200%-150%-100%-50%
0%50%
100%150%
Net InterestIncome (a)
CreditLosses (b)
Real Estate(c)
Loans HFS(d)
AFS & HTM(e)
RecurringFV (f)
Net Pretax(g)
12/31/2006 12/31/2007 3/31/2008 6/30/2008
(a) For all tables of this type: (1) for banks filing Call Reports, net interest income as reported in Schedule RI and (2) for banks filing TFRs, net interest income as reported in Schedule SO.
(b) For all tables of this type: (1) for banks filing Call Reports, credit losses are based on provisions for loan and lease losses as reported in Schedule RI and (2) for banks filing TFRs, credit losses are based on provisions for losses on interest bearing assets as reported in Schedule SO, which includes fair value losses recognized on foreclosed property and impairment losses recognized on debt and equity securities.
(c) For all tables of this type: (1) for banks filing Call Reports, the impact on income of other real estate owned is based on net gains (losses) on sales of other real estate owned as reported in Schedule RI, which includes gains and losses recognized upon sale of foreclosed property and fair value losses recognized prior to sale and (2) for banks filing TFRs, the impact on income of other real estate owned is based on operations and sale of repossessed assets as reported in Schedule SO, which includes costs of maintenance of foreclosed property and gains and losses upon sale.
(d) For all tables of this type: (1) for banks filing Call Reports, the impact on income of loans HFS is based on net gains (losses) on sales of loans and leases as reported in Schedule RI, which includes gains and losses recognized upon sale and fair value losses recognized prior to sale and (2) for banks filing TFRs, the impact on income of loans HFS is based on the lower-of-cost-or-fair-value adjustments made to HFS assets as reported in Schedule So of the TFR, which does not include gains or losses recognized upon sale.
(e) For all tables of this type: (1) for banks filing Call Reports, the impact on income of AFS and HTM securities is based on realized gains (losses) on AFS and HTM securities as reported in Schedule RI, which includes impairment losses recognized and (2) for banks filing TFRs, the impact on income of AFS and HTM securities is based on operations and sale of HFS assets and AFS securities and sales of securities HTM as reported in Schedule SO, which does not include impairment losses.
(f) For all tables of this type: (1) for banks filing Call Reports, the impact on income of recurring fair value measurements is based on trading revenues and net gains (losses) on assets and liabilities accounted for under FVO as reported in Schedule RI and (2) for banks filing TFRs, the impact on income of recurring fair value measurements is based on gains and losses on financial assets and liabilities carried at fair value as reported in Schedule SO.
(g) For all tables of this type: (1) for banks filing Call Reports, income (loss) before taxes and extraordinary items and other adjustments as reported in Schedule RI and (2) for banks filing TFRs, income before taxes as reported in Schedule SO.

119
Exhibit III.24: Percent of Loans Non-Performing
0%5%
10%15%20%25%30%35%40%45%
Columbia
n
First
Priority
Main Stre
et
Ameriba
nk
First
Integ
rity
Dougla
ss
Merida
n
Hume B
ank
Alpha B
ank
Freed
om Ban
k
Commun
ity
Securi
ty Pac
All < $1
Billio
n*
12/31/2006 12/31/2007 3/31/2008 6/30/2008
*The percent of loans that are non-performing for all banks with less than $1 billion of assets is based on the information provided in “Quarterly Banking Profile” issued by the FDIC, which covers all FDIC-Insured Institutions for banks with asset size between $100 million and $1billion.
2. Aggregate Failed Banks > $1 Billion, but < $10 Billion of Total Assets As illustrated in Exhibit III.25, increases in provisions for credit losses were also the most significant reason for the decrease in capital for the failed banks with assets between $1 billion and $10 billion. Exhibit III.26 shows that for these banks, the increase in credit losses appears to have been caused by rising levels of non-performing loans, which again far outpace the levels for all non-failed banks of similar size. Exhibit III.25: Income Categories as a Percent of Net Interest Income
-350%
-300%
-250%
-200%
-150%
-100%
-50%
0%
50%
100%
150%
Net InterestIncome (a)
CreditLosses (b)
Real Estate(c)
Loans HFS(d)
AFS & HTM(e)
RecurringFV (f)
Net Pretax(g)
12/31/2006 12/31/07 3/31/08 6/30/08

120
Exhibit III.26: Percent of Loans Non-Performing
0%5%
10%15%20%25%30%35%40%45%
First NBNevada
Silver StateBank
ANB FNA IntegrityBank
FranklinBank
PFF B & T All >$1Billion and
<$10Billion*
12/31/2006 12/31/2007 3/31/2008 6/30/2008
*The percent of loans that are non-performing for all banks with less than $1 billion of assets is based on the information provided in “Quarterly Banking Profile” issued by the FDIC, which covers all FDIC-Insured Institutions for banks with asset size between $1 billion and $10 billion.
3. Failed Banks > $10 Billion of Total Assets
As was found at the smaller banks, Exhibit III.27 shows that non-performing loans for the failed banks with assets greater than $10 billion also greatly exceeded the levels experienced generally for non-failed banks of similar size.
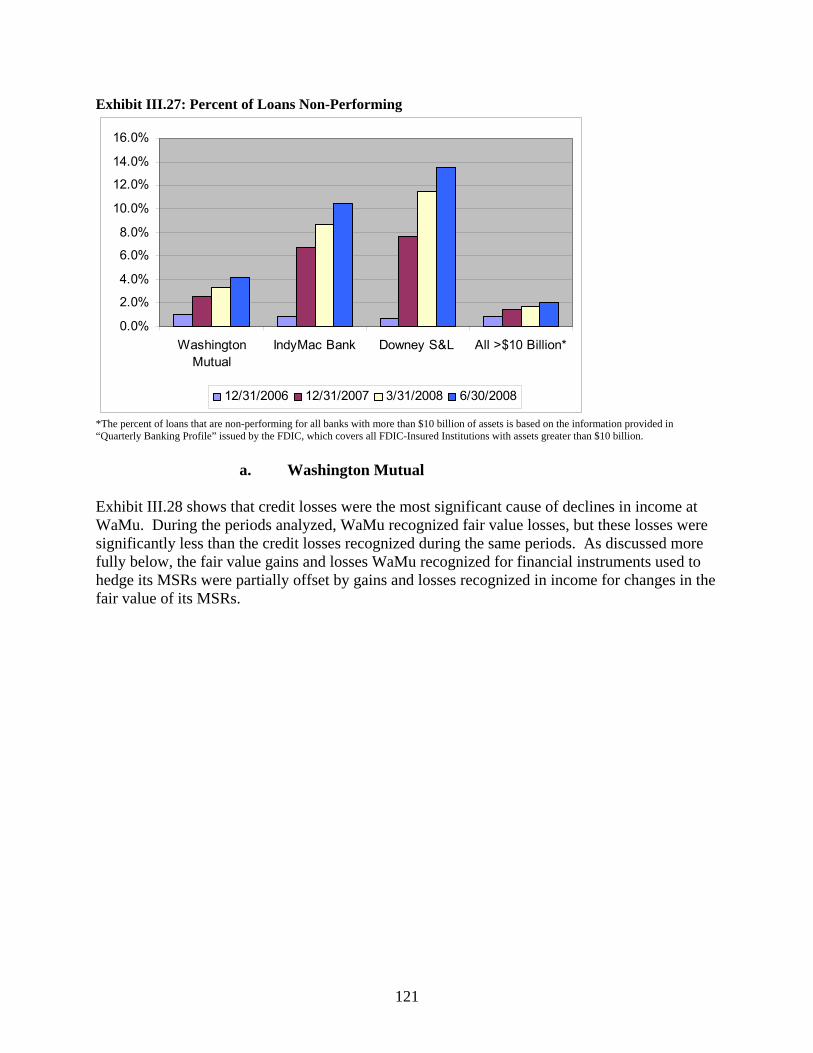
121
Exhibit III.27: Percent of Loans Non-Performing
0.0%
2.0%
4.0%
6.0%
8.0%
10.0%
12.0%
14.0%
16.0%
WashingtonMutual
IndyMac Bank Downey S&L All >$10 Billion*
12/31/2006 12/31/2007 3/31/2008 6/30/2008
*The percent of loans that are non-performing for all banks with more than $10 billion of assets is based on the information provided in “Quarterly Banking Profile” issued by the FDIC, which covers all FDIC-Insured Institutions with assets greater than $10 billion.
a. Washington Mutual Exhibit III.28 shows that credit losses were the most significant cause of declines in income at WaMu. During the periods analyzed, WaMu recognized fair value losses, but these losses were significantly less than the credit losses recognized during the same periods. As discussed more fully below, the fair value gains and losses WaMu recognized for financial instruments used to hedge its MSRs were partially offset by gains and losses recognized in income for changes in the fair value of its MSRs.
122
Exhibit III.28: Income Categories as a Percent of Net Interest Income
-250%
-200%
-150%
-100%
-50%
0%
50%
100%
150%
Net InterestIncome (a)
CreditLosses (b)
HFS Losses(c)
Gain/LossSale (d)
ServicingIncome -
MSR FV (e)
RecurringFV -
Financial (f)
Net Pretax(g)
12/31/06 12/31/07 3/31/08 6/30/08
(a) For all tables of this type: Net interest income as reported in Schedule SO of the TFR. (b) For all tables of this type: Credit losses as reported in provisions for losses on interest bearing assets in Schedule SO of the TFR, which includes fair
value losses recognized on foreclosed property and impairment losses recognized on debt and equity securities. (c) For all tables of this type: HFS losses is based on lower-of-cost-or-fair-value adjustments made to HFS assets as reported in Schedule SO of the TFR. (d) For all tables of this type: Gains / Losses on sales is based on sale of HFS assets and AFS securities as reported in Schedule SO of the TFR. (e) For all tables of this type: Servicing income is based on mortgage loan servicing fees and servicing amortization and valuation adjustments as
reported in Schedule SO of the TFR. (f) For all tables of this type: Recurring fair value is based on gains and losses on financial assets and liabilities carried at fair value as reported in
Schedule SO of the TFR. (g) For all tables of this type: Income before taxes as reported in Schedule SO of the TFR.
In its 2007 Form 10-K, WaMu disclosed the following:
The Company recorded a net loss for 2007 of $67 million, or $0.12 per diluted share, compared with net income of $3.56 billion, or $3.64 per diluted share, in 2006. The decline was primarily the result of significant credit deterioration in the Company’s single-family residential mortgage loan portfolio and significant disruptions in the capital markets, including a sudden and severe contraction in secondary mortgage market liquidity for nonconforming residential loan products.
Based on disclosures made in its 2007 Form 10-K, during 2007 WaMu recognized approximately $500 million of fair value losses for trading securities, which primarily consisted of below investment grade retained interests in credit card securitizations, and $200 million of losses for fair value write-downs of non-conforming residential mortgage loans HFS, compared to $3.1 billion of credit losses recognized. Based on disclosures made in its first and second quarter 2008 Forms 10-Q, during the first quarter of 2008, WaMu recognized approximately $600 million of fair value gains due to

123
derivatives that economically hedged the fair value of MSRs, which were partially offset by fair value declines in the related MSRs. During the second quarter of 2008, WaMu recognized losses on the derivatives it used to economically hedge the fair value of MSRs, which again were partially offset by gains in the fair value of its MSRs. In addition to the fair value effects of hedging activities, based on disclosures made in its second quarter 2008 Form 10-Q, it appears that WaMu recognized during the six months ended June 30, 2008 approximately $500 million of fair value losses for credit card retained interests and securities backed by Alt-A loans that were accounted for as trading securities, which was significantly less than the $9.4 billion of credit losses recognized during the same period.
b. IndyMac
As illustrated in Exhibit III.29, for IndyMac, the reduction of its capital was driven equally by the recognition of incurred credit losses and losses recognized for the decrease in fair value of its portfolio of HFS loans, investment securities, and derivatives. As discussed below, fair value gains and losses recognized for financial instruments used to hedge MSRs were partially offset by changes in the fair value of MSRs. Also, as discussed more fully below, a portion of the fair value losses IndyMac recognized related to incurred credit losses embedded in IndyMac’s trading securities portfolio. While IndyMac stated that it believed that a portion of the fair value losses it recognized during 2008 would recover over time, IndyMac also stated that it used its judgment to arrive at a fair value estimate for these securities that it believed did not represent a fire-sale valuation. Exhibit III.29: Income Categories as a Percent of Net Interest Income
-500%
-400%
-300%
-200%
-100%
0%
100%
200%
Net InterestIncome (a)
CreditLosses (b)
HFS Losses(c)
Gain/LossSale (d)
ServicingIncome -
MSR FV (e)
RecurringFV -
Financial (f)
Net Pretax(g)
12/31/06 12/31/07 3/31/08 6/30/08

124
In its 2007 Form 10-K, IndyMac disclosed the following:
2007 was also severely impacted by worsening credit conditions as home prices and home sales declined. This has led to a significant increase in delinquencies in many products, particularly in higher loan-to-value (“LTV”) first and second lien loans and builder construction loans. As a result of the significantly worsening trends in home prices and loan delinquencies, we recorded significant charges, principally related to credit risk in our HFI (held-for-investment) portfolio, builder construction portfolio, and consumer construction portfolio. In addition, we recorded significant valuation adjustments in our loans held for sale, investment and non-investment grade securities and in residual securities.
Based on disclosures made in its 2007 Form 10-K, IndyMac recognized its largest write-downs (valuation adjustments) for its non-investment grade securities and attributed a significant portion of these write-downs to incurred credit losses embedded in these securities. During 2008, IndyMac recognized additional charges for credit losses and valuation adjustments. In its Form 10-Q for the quarter ended March 31, 2008, IndyMac stated that the declines in the fair value of its trading portfolio were primarily due to widening credit spreads on non-agency mortgage-backed securities, but that “[t]hese losses are unrealized and we believe are a result of reduced liquidity in the currently disrupted market for these bonds and that actual realized losses will be much lower. As a result, we expect to substantially recover these losses over time as we have the ability and intent to hold the securities to recovery or maturity.” IndyMac also disclosed that it used its judgment to arrive at what it believed was a reasonable fair value measurement, instead of basing the values solely based on broker quotes, as follows:
Our determination of the fair values of our Level 3 assets, as described herein, involves significant judgment and, in our view, results in a reasonable measurement of fair value in accordance with the requirements of generally accepted accounting principles. These recorded fair values could be significantly in excess of the actual proceeds that would be received if we were forced to sell these assets in a short period of time into the current market which is characterized by illiquidity and opportunistic pricing by a limited number of buyers. In addition, given the current market illiquidity characterized by a lack of relevant and reliable market inputs for the private-label mortgage-related securities, had we relied solely on broker market indications the fair values of the trading securities would have declined by $120 million.
Offsetting these decreases in fair value was an increase in fair value of the bank’s MSRs which resulted from slower loan prepayments given the changes in available refinancing opportunities. These increases in fair value did not affect regulatory capital, because the amount of MSRs included in capital is limited by the regulatory capital instructions. IndyMac disclosed in its Form 10-Q for the quarter ended March 31, 2008, “we are currently required to hold capital on a dollar-for-dollar basis against the portion of our MSRs that exceed our Tier 1 core capital, even though we have a long track record of successfully hedging this asset, and it is our highest earning asset in this environment.” IndyMac did not file a second quarter 2008 Form 10-Q, so it is not possible to determine the extent to which fair value losses recognized for the six month

125
period ended June 30, 2008 related to instruments that were hedging MSRs, which were offset by fair value gains recognized for MSRs.
c. Downey Savings and Loan Exhibit III.30 shows that, similar to banks with assets less than $10 billion, credit losses were the most significant cause of declines in income at Downey, and there were no losses recognized for recurring fair value measurements. Since Downey did not recognize any significant fair value losses during the periods reviewed, no analysis was needed to understand the source of fair value losses recognized. Exhibit III.30: Income Categories as a Percent of Net Interest Income
-350%-300%-250%-200%-150%-100%
-50%0%
50%100%150%
Net InterestIncome (a)
CreditLosses (b)
HFSLosses (c)
Gain/LossSale (d)
ServicingIncome -MSR FV
(e)
RecurringFV -
Financial(f)
Net Pretax(g)
12/31/06 12/31/07 3/31/08 6/30/08
F. Evaluation of the Circumstances Surrounding Each Bank Failure
In this subsection, the Staff provides publicly-obtainable descriptive information regarding the circumstances surrounding each of the 22 bank failures as of December 1, 2008. Based on review of this information, it does not appear that fair value reporting was the primary cause of any of these bank failures. While currently available analysis is, in some cases, limited due to the recent nature of many of these failures, the information analyzed by the Staff appears to indicate that the most significant factor in these bank failures was the underlying lending activities of the banks. For most of these banks, fair value accounting was applied in only limited circumstances. The decreasing levels of regulatory capital for these banks, which, for most, led to their failure, was caused primarily by recognized credit losses as opposed to the recognition of general fair value declines. One question that cannot be analyzed from the available filings is whether fair value accounting, if more extensively applied, could have prevented such failures by adding transparency to the lending and risk management practices of these banks.

126
For the three banks with assets greater than $10 billion (WaMu, IndyMac and Downey), the Staff compared changes in the holding company’s stock price to changes in the U.S. GAAP-based book value per share. Based on this analysis, it appears that market concerns regarding these companies pre-dated any significant fair value losses that these companies recognized. Beginning in the third quarter of 2007, the stock price for each of these companies fell below the U.S. GAAP-based book value per share. Unless otherwise noted, the source of the financial information included in this section, such as capital levels, income statement, and balance sheet descriptions, is quarterly Call Reports or Thrift Financial Reports and, as applicable, public reports filed with the SEC.
1. Failed Banks < $1 Billion of Total Assets As illustrated in Exhibit III.31, all of the failed banks with assets less than $1 billion experienced a significant decrease in their Tier 1 capital during 2007, causing their leverage ratio to fall below the average for that relative size bank. Exhibit III.31: Leverage Ratio for Banks with Less than $1 Billion of Assets
-5%
0%
5%
10%
15%
20%
25%
30%
Columbia
n
Commun
ity
Securi
ty Pac
ific
First
Priority
Main Stre
et
Ameriba
nk
First
Integ
rity
Dougla
ss
Merida
n
Hume B
ank
Alpha B
ank
Freed
om Ban
k
All < $1
Billio
n*
December 31, 2006 December 31, 2007 March 31, 2008 June 30, 2008
*The leverage ratio is Tier 1 capital divided by Average Assets. The source of the failed bank leverage ratios is the Call Report or TFR. The source of leverage ratios for all banks with assets under $1 billion is based on the information provided in “Quarterly Banking Profile” issued by the FDIC, which covers all FDIC-Insured Institutions for banks with asset size between $100 million and $1 billion. More detailed information about the circumstances leading up to these bank failures (in order of the size of the failed banks with assets less than $1 billion) is as follows: • The Columbian Bank and Trust – According to a statement made by the Kansas State Bank
Commissioner Tom Thull, this bank was closed because the bank “would be unable to meet depositors’ demands in the normal course of business.”169 Columbian reported a sizable loss for the second quarter in 2008 due to a very large increase in loan loss provisions caused by
169 Mark Davis, Area Sees a Second Bank Fail This Year, The Kansas City Star, August 23, 2008.
127
problem real-estate loans. In July 2008 (a month before the bank’s failure), the FDIC and the Kansas Office of the State Bank Commissioner entered into an order for Columbian to cease and desist because “they had reason to believe that the Bank had engaged in unsafe and unsound banking practices and violations of law and regulation.”170
• The Community Bank – During the nine months ended September 30, 2008, this bank
recognized net losses of $28 million that were largely driven by credit losses and reduced the bank’s Tier 1 capital by more than 50%.
• Security Pacific Bank – In April 2008, this bank consented to an Order to Cease and Desist
issued by the FDIC and California’s Department of Financial Institutions (“CDFI”). The order states that the FDIC and the CDFI “determined that they had reason to believe that the [b]ank had engaged in unsafe or unsound banking practices.”171 Upon closing this bank, CDFI released a statement that this bank was being closely monitored and was ordered to “increase its capital reserves to a safe and sound level. But efforts by the bank to do so were unsuccessful.”172 This bank had a high concentration in construction real estate loans of which a significant percentage was non-performing.
• Alpha Bank & Trust – This bank was opened in May 2006 and was never profitable. The
bank expanded quickly and had a significant concentration of construction and land development loans.
• Freedom Bank – In September 2008, this bank consented to an Order to Cease and Desist
issued by the FDIC and the Division of Financial Institutions of the Florida Office of Financial Regulation (“OFR”). The order states that the FDIC and the OFR “determined that there is reason to believe that the [b]ank has engaged in unsafe or unsound banking practices and has committed violations of law and / or regulations.”173 Freedom Bank had been unprofitable since its opening in 2005.
• First Priority Bank – This bank had been undercapitalized since 2007. The bank had a
significant concentration in construction and development loans and a large percentage of those loans were past due.
• Main Street Bank – This bank recognized net losses for each quarter in 2007 and the first two
quarters of 2008 that significantly depleted its capital. In July 2008, the FDIC and the State of Michigan Office of Financial and Insurance Regulation ordered the bank to cease and desist from following unsafe or unsound banking practices, including engaging in hazardous lending and lax collection practices.174
170 In re The Columbian Bank and Trust Company Order to Cease and Desist, FDIC-9-95b, OSBC 08-1 (FDIC and Kansas Office of the State Bank Commissioner, July 15, 2008). 171 In re Security Pacific Bank Order to Cease and Desist, FDIC-08-063b (FDIC and CDFI, April 14, 2008). 172 “State Closes Security Pacific Bank,” Press Release 08-11, CDFI (November 7, 2008). 173 In re Freedom Bank Bradenton, Florida Order to Cease and Desist, FDIC-08-173b (FDIC, September 5, 2008). 174 See In re Main Street Bank Northville, Michigan Order to Cease and Desist, FDIC-08-166b (FDIC and State of Michigan Office of Financial and Insurance Regulation, July 22, 2008).
128
• Ameribank – This bank’s primary federal regulator, the OTS, issued a press release upon
closure stating that the bank’s troubles “stemmed from excessive growth in construction rehabilitation loans, which provided financing for the rehabilitation of distressed properties, predominantly in low- to moderate-income housing markets. The quarter ending June 30, 2008 marked the fourth consecutive quarter of net losses and capital erosion for Ameribank.”175
• Douglass National Bank – This bank’s primary federal regulator, the OCC, issued a press
release upon closure stating “the bank had experienced substantial dissipation of assets and earnings due to unsafe and unsound practices.”176
• First Integrity Bank – As was done for Douglass National Bank, the primary federal regulator
of First Integrity Bank, the OCC, issued a press release upon closure stating “the bank had experienced substantial dissipation of assets and earnings due to unsafe and unsound practices.”177
• Meridian Bank – In July 2008, the FDIC and the Illinois Department of Financial and
Professional Regulation Division of Banking entered into an order for Meridian Bank to cease and desist because they had reason to believe that the bank had engaged in unsafe and unsound banking practices. The order required the bank to cease and desist engaging in hazardous lending and lax collection practices.178
• Hume Bank – According to a press release issued by Missouri Commissioner of Finance D.
Eric McClure, the bank’s failure was “a direct result of alleged improprieties by former bank management, which resulted in past due loans not being reported and the true condition of the bank being misrepresented. Most of these loans were poorly conceived and inadequately serviced; resulting in losses which exhausted the bank’s capital and ultimately resulted in its failure.”179
2. Failed Banks > $1 Billion, but < $10 Billion of Total Assets
As illustrated in Exhibit III.32, all of the failed banks with assets between $1 and $10 billion also experienced decreases in their Tier 1 capital that caused their leverage ratio to fall in most cases significantly below the average for that relative sized bank.
175 “OTS Closes Ameribank and Appoints FDIC Receiver,” OTS 08-045, OTS (September 19, 2008). 176 “OCC Closes Douglass National Bank and Appoints FDIC Receiver,” NR 2008-7, OCC (January 25, 2008). 177 “OCC Closes First Integrity Bank, N.A. and Appoints FDIC Receiver,” NR 2008-62, OCC (May 30, 2008). 178 See In re Meridian Bank Eldred, Illinois Order to Cease and Desist, FDIC-08-121b, 2008-DB-29 (FDIC and State of Illinois Department of Financial and Professional Regulation Division of Banking, July 15, 2008). 179 “Commissioner of Finance Closed Hume Bank,” Release, Missouri Department of Insurance Financial Institutions & Professional Registration (March 7, 2008).

129
Exhibit III.32: Leverage Ratio for Banks with Assets Greater than $1 Billion, but Less than $10 Billion
0%
2%
4%
6%
8%
10%
12%
FranklinBank
PFF B & T First NBNevada
Silver StateBank
ANB FNA IntegrityBank
All >$1Billion and
<$10Billion*December 31, 2006 December 31, 2007 March 31, 2008 June 30, 2008
*The leverage ratio is Tier 1 capital divided by Average Assets. The source of the failed bank leverage ratios is the Call Report or TFR. The source of leverage ratios for all banks with assets between $1 and $10 billion is based on the information provided in “Quarterly Banking Profile” issued by the FDIC, which covers all FDIC-Insured Institutions for banks with asset size between $1 billion and $10 billion. More detailed information about the circumstances leading up to these bank failures (in order of size of failed banks with assets between $1 and $10 billion) is as follows: • Franklin Bank – This bank is a subsidiary of a public company that became delinquent in its
SEC filings during 2008 because of an internal investigation that uncovered accounting errors related to delinquent loans, foreclosed property, and loan modifications, as well as in other areas. In November 2008, this bank consented to an Order to Cease and Desist issued by the FDIC and the Texas Department of Savings and Mortgage Lending (“Texas Department”). The order states that the FDIC and the Texas Department “determined that they had reason to believe that the [b]ank had engaged in unsafe or unsound banking practices and had violated laws and regulations.”180 The underlying cause of this bank’s failure appears to be credit losses on real estate and construction loans. During the quarter ended September 30, 2008, the bank recognized credit losses of $147 million, which reduced Tier 1 capital to $113 million or to 2% of average assets.
• PFF Bank and Trust – This bank’s primary federal regulator, the OTS, issued a fact sheet
describing the circumstances that led to the bank’s closure. The fact sheet stated, “[t]he [b]ank’s asset quality rapidly declined beginning in late 2007. The [b]ank had a large concentration of tract construction and land loans. The steadily declining home values in the areas where the underlying properties are located have contributed to this deterioration. …Because of the [b]ank’s rapidly deteriorating asset quality and continuing negative affect
180 In re Franklin Bank, S.S.B. Houston, Texas Order to Cease and Desist, FDIC-08-297b (FDIC and Texas Department of Savings and Mortgage Lending, November 4, 2008).
130
on earnings and capital, the [b]ank was in an unsafe and unsound condition to transact business.”181
• First National Bank of Nevada and First Heritage Bank – The failures of these two banks are
grouped together because they are subsidiaries of the same holding company, First National Bank Holding Company. First Heritage Bank became critically undercapitalized as result of the failure of First National Bank of Nevada. The underlying cause of these bank failures appears to be credit losses on Alt-A residential mortgage loans purchased from correspondents and a concentration in problem construction and development loans.182 The primary federal regulator of these banks, the OCC, reported that there was no reasonable prospect of these banks becoming adequately capitalized without federal assistance.183
• Silver State Bank – The closure of this bank appears to have resulted from the inability of the
bank to meet depositor needs.184 The bank specialized in construction and land development loans. As of June 2008, approximately a quarter of its construction and land development loans were classified as either 90 days or more past due or non-accrual.
• ANB Financial – This bank operated under a formal agreement entered into in June 2007
with its primary federal regulator, the OCC. In the enforcement action, the OCC said it found “unsafe and unsound banking practices relating to the supervision of the affairs of the [b]ank.”185
• Integrity Bank – A spokesman for the FDIC, the primary federal regulator for Integrity Bank,
was quoted as saying that the bank failed due to its aggressive pursuit of construction loans, coupled with falling real estate values and inadequate risk management.186
3. Failed Banks > $10 Billion of Total Assets
As illustrated in Exhibit III.33, unlike the leverage ratios of the smaller banks, the largest and third-largest banks to fail (WaMu and Downey) did not experience a dramatic decrease in their Tier 1 capital. On the other hand, the second largest bank to fail (IndyMac) did experience during 2008 a decline in its leverage ratio that far exceeded the experience of the average bank of that relative size. As illustrated in Exhibit III.34, the market share price for all three companies began to decline significantly starting in July 2007 and fell below U.S. GAAP-based book value
181 “OTS Closes Two California Thrifts and Appoints FDIC Receiver,” OTS 08-057, OTS (November 21, 2008). 182 See Joe Adler, Declaring A Failure: When Should It Happen? Some See a Need for Quicker Action on Reserving, Disclosure, American Banker, August 7, 2008. 183 See “OCC Closes First National Bank of Nevada and Appoints FDIC Receiver,” NR 2008-87, OCC (July 25, 2008) and “OCC Closes First Heritage Bank, N.A., Newport Beach, CA and Appoints FDIC Receiver,” NR 2008-87, OCC (July 25, 2008). 184 See Nicole Lucht, FDIC Takes Over Silver State Bank of Henderson, Las Vagas Sun, September 5, 2008. 185 In re Agreement By and Between ANB Financial National Association Rogers, Arkansas and The Comptroller of the Currency, #2007-081 (OCC, January 29, 2008). 186 See Madlen Read, Georgia Bank Closes in 10th Failure This Year, Associated Press, August 30, 2008.
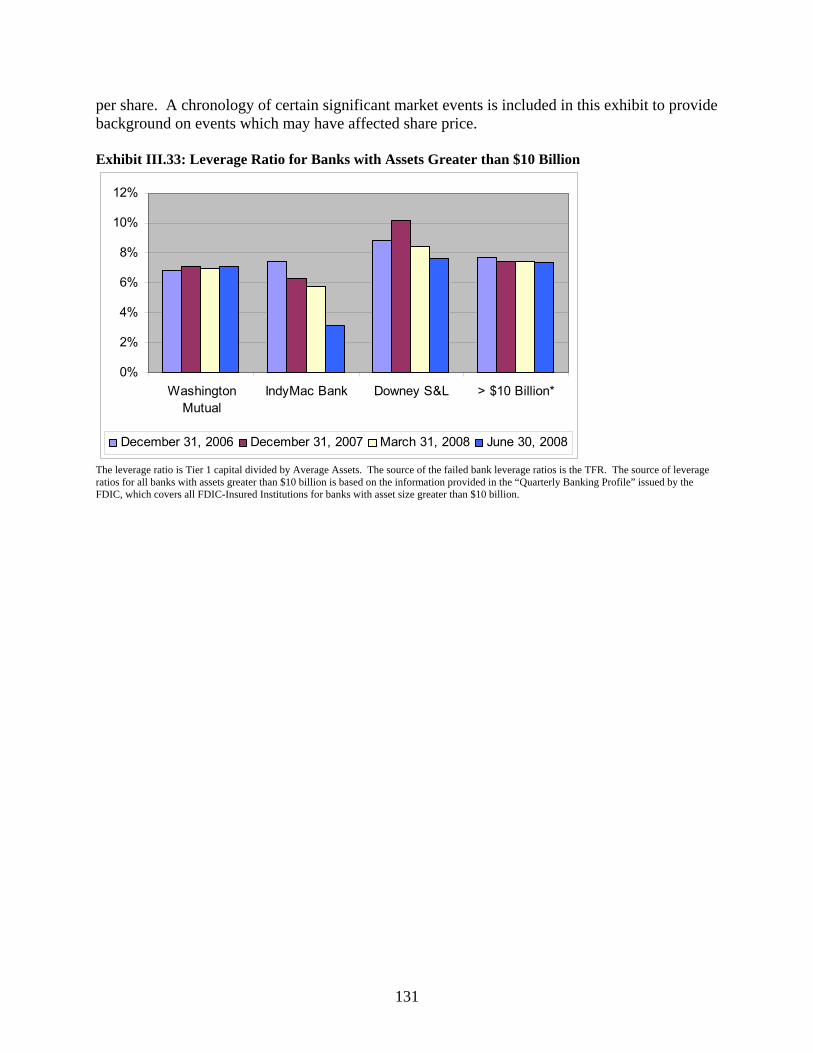
131
per share. A chronology of certain significant market events is included in this exhibit to provide background on events which may have affected share price. Exhibit III.33: Leverage Ratio for Banks with Assets Greater than $10 Billion
0%
2%
4%
6%
8%
10%
12%
WashingtonMutual
IndyMac Bank Downey S&L > $10 Billion*
December 31, 2006 December 31, 2007 March 31, 2008 June 30, 2008
The leverage ratio is Tier 1 capital divided by Average Assets. The source of the failed bank leverage ratios is the TFR. The source of leverage ratios for all banks with assets greater than $10 billion is based on the information provided in the “Quarterly Banking Profile” issued by the FDIC, which covers all FDIC-Insured Institutions for banks with asset size greater than $10 billion.
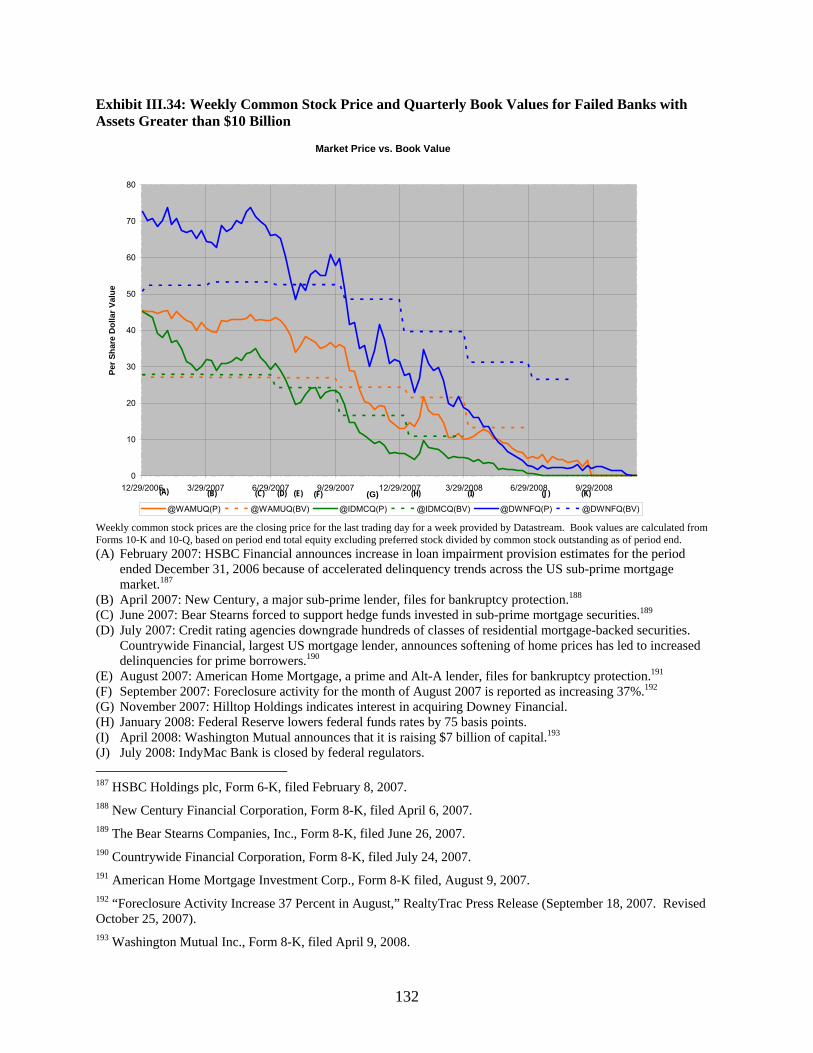
132
Exhibit III.34: Weekly Common Stock Price and Quarterly Book Values for Failed Banks with Assets Greater than $10 Billion
Market Price vs. Book Value
0
10
20
30
40
50
60
70
80
12/29/2006 3/29/2007 6/29/2007 9/29/2007 12/29/2007 3/29/2008 6/29/2008 9/29/2008
Per S
hare
Dol
lar V
alue
@WAMUQ(P) @WAMUQ(BV) @IDMCQ(P) @IDMCQ(BV) @DWNFQ(P) @DWNFQ(BV)
(B) (C) (D) (F) (H) (K)(J)(I)(E)(A) (G)
Weekly common stock prices are the closing price for the last trading day for a week provided by Datastream. Book values are calculated from Forms 10-K and 10-Q, based on period end total equity excluding preferred stock divided by common stock outstanding as of period end. (A) February 2007: HSBC Financial announces increase in loan impairment provision estimates for the period
ended December 31, 2006 because of accelerated delinquency trends across the US sub-prime mortgage market.187
(B) April 2007: New Century, a major sub-prime lender, files for bankruptcy protection.188 (C) June 2007: Bear Stearns forced to support hedge funds invested in sub-prime mortgage securities.189 (D) July 2007: Credit rating agencies downgrade hundreds of classes of residential mortgage-backed securities.
Countrywide Financial, largest US mortgage lender, announces softening of home prices has led to increased delinquencies for prime borrowers.190
(E) August 2007: American Home Mortgage, a prime and Alt-A lender, files for bankruptcy protection.191 (F) September 2007: Foreclosure activity for the month of August 2007 is reported as increasing 37%.192 (G) November 2007: Hilltop Holdings indicates interest in acquiring Downey Financial. (H) January 2008: Federal Reserve lowers federal funds rates by 75 basis points. (I) April 2008: Washington Mutual announces that it is raising $7 billion of capital.193 (J) July 2008: IndyMac Bank is closed by federal regulators. 187 HSBC Holdings plc, Form 6-K, filed February 8, 2007. 188 New Century Financial Corporation, Form 8-K, filed April 6, 2007. 189 The Bear Stearns Companies, Inc., Form 8-K, filed June 26, 2007. 190 Countrywide Financial Corporation, Form 8-K, filed July 24, 2007. 191 American Home Mortgage Investment Corp., Form 8-K filed, August 9, 2007. 192 “Foreclosure Activity Increase 37 Percent in August,” RealtyTrac Press Release (September 18, 2007. Revised October 25, 2007). 193 Washington Mutual Inc., Form 8-K, filed April 9, 2008.
133
(K) September 2008: Fannie Mae and Freddie Mac placed into conservatorship by federal regulators. Bank of America announces it will acquire Merrill Lynch. Lehman files for bankruptcy. Government pledges $85 billion to AIG.
a. Washington Mutual
Instead of reduced capital, the proximate cause for the failure of WaMu appears to have been dramatic increase in deposit outflows sparked by concerns about the quality of the bank’s mortgage loan assets. WaMu’s primary federal regulator, the OTS, released a fact sheet on September 25, 2008, explaining WaMu’s failure. This fact sheet states the following:
Beginning in late 2006 through today, WMB [WaMu] was proactively changing its business strategy to respond to declining housing and market conditions. Changes included tightening credit standards, eliminating purchasing and originating subprime mortgage loans, and discontinuing underwriting option ARM and stated income loans. Management reduced loans originated for sale and transferred held for sale loans to the held for investment portfolio. WMB was focusing on shrinking its balance sheet and developing a retail strategy through its branch operations. …Since July 2008, the pressure on WMB increased as market conditions continued to worsen. Significant deposit outflows began on September 15, 2008. During the next eight business days, WMB deposit outflows totaled $16.7 billion, shortening the time available to augment capital, improve liquidity, or find an equity partner. Given the [b]ank’s limited sources of funds and significant deposit outflows, it was highly likely to be unable to pay its obligations and meet its operating liquidity needs.194
There are a number of factors that likely contributed to market concerns about the viability of WaMu. One factor is that during late 2007 and 2008, as demonstrated in its financial filings with the SEC, WaMu’s management was continuously updating its estimate of credit losses to show higher and higher losses. In its Form 10-Q for the quarter ended June 30, 2008, WaMu disclosed the following:
The Company recorded a net loss in the second quarter of 2008 of $3.33 billion, compared with net income of $830 million in the second quarter of 2007, primarily due to the Company’s significant increase in loan reserves. …Adverse trends in key credit risk indicators, including high inventory levels of unsold homes, rising foreclosure rates, the significant contraction in the availability of credit for nonconforming mortgage products and negative job growth trends exerted severe pressure on the performance of the single-family residential (“SFR”) loan portfolio, particularly loans in geographic areas in which the Company’s lending activities have been concentrated in recent years.
General reports of fraudulent mortgage underwriting practices in the industry, as well as specific charges alleged against certain appraisal firms utilized by WaMu,195 only contributed to the
194 “OTS Fact Sheet on Washington Mutual Bank,” OTS 08-046A, OTS (September 25, 2008). 195 New York Attorney General Andrew Cuomo is quoted saying “By allowing Washington Mutual to hand-pick appraisers who inflated values, First American helped set the current mortgage crisis in motion.” Carl Gutierrez,
134
uncertainty surrounding the quality of loans it held. For instance, news outlets reported that the stock price of WaMu fell as much as 14% after an analyst report released in June 2008 suggested WaMu was underestimating losses on home loans.196 The elevated concerns in the general financial environment caused by the failures of other institutions also likely contributed to concerns regarding WaMu. The failure of IndyMac in July 2008 suggested that banks and financial services firms with heavy exposure to real estate prices were vulnerable. As illustrated in Exhibit III.34, WaMu’s share price fell from $45 on January 1, 2007 to less than $5 on July 11, 2008, the date of IndyMac’s failure. While WaMu reported in its second quarter Form 10-Q filed on August 11, 2008 a book value per common share of $13 as of June 30, 2008, WaMu’s stock price continued to decline below $5 a share (significantly less than U.S. GAAP reported equity) in August and September 2008. The problems at other large financial services firms in the weeks preceding deposit outflows at WaMu, including the conservatorship of Fannie Mae and Freddie Mac, Lehman filing for bankruptcy, the announced acquisition of Merrill Lynch by Bank of America, and the federal rescue of AIG, likely raised concerns that WaMu would not be able to raise capital should loan losses continue to rise.
b. IndyMac
As illustrated in Exhibit III.33, IndyMac experienced a significant decrease in capital levels during 2008. It appears that declining asset performance, past reliance on an originate-to-sell business model for higher risk loans, and highly mobile brokered deposits, along with the press highlighting IndyMac’s vulnerability, appear to have eroded the public’s confidence in the bank. As illustrated in Exhibit III.34, IndyMac’s common stock price per share fell from $45 on January 1, 2007 to $3 a share on May 12, 2008, the date on which IndyMac filed a Form 10-Q showing a book value per common share of $11. The decline in IndyMac’s share price (significantly below U.S. GAAP reported book value) may potentially suggest that investors factored in information not reflected in the bank’s reported balance sheet. IndyMac’s primary federal regulator, the OTS, released a fact sheet on July 11, 2008 explaining IndyMac’s failure. This fact sheet describes the failure as follows:
New York A.G. Cuomo Sues First American, Alleges Fraud, Forbes, November 11, 2007. In its Form 10-Q for the quarter ended June 30, 2008, WaMu describes the case as follows:
On November 1, 2007, the Attorney General of the State of New York filed a lawsuit against First American Corporation and First American eAppraiseIT. The People of the State of New York by Andrew Cuomo v. First American Corporation and First American eAppraiseIT, No. 07-406796 (N.Y. Sup. Ct. Filed Nov. 1, 2007). According to the Attorney General's Complaint, eAppraiseIT is a First American subsidiary that provides residential real estate appraisal services to various lenders, including the Bank. The Attorney General asserts that, contrary to various state and federal requirements and the Uniform Standards of Professional Appraisal Practice, the Bank conspired with eAppraiseIT in various ways to falsely increase the valuations done by appraisers eAppraiseIT retained to perform appraisals on Bank loans. First American Corporation and First American eAppraiseIT are not affiliates of the Company, and neither the Company nor the Bank is a defendant in the case.
196 See, e.g., a Bloomberg article citing a statement made by UBS AG analyst Eric Wasserstrom regarding his belief that WaMu was underestimating losses on home loans as a cause for the drop in WaMu’s stock price. Ari Levy & Linda Shen, Washington Mutual Falls to Lowest in 16 Years on Loss Estimate, Bloomberg.com, June 9, 2008. (available at http://www.bloomberg.com/apps/news?pid=newsarchive&sid=aPtqGUO0S7G0)
135
From June 2005 to March 2008, IndyMac grew from $18 billion to $32 billion. The growth was mainly due to the Alt-A mortgage loan production pipeline, private label mortgage-backed securities and MSRs. IndyMac Alt-A loans were generally jumbo loans that were underwritten largely based on the borrower’s credit score and the loan-to-value ratio, and many did not have full verification of income or assets (less than full documentation loans). Over the past nine months, IndyMac incurred significant losses, severely depleting capital and jeopardizing the institution’s continued viability. IndyMac’s mortgage banking operations focused on Alt-A single family mortgages, which the bank could not securitize and sell in late 2007 due to the decline in the secondary market for non-agency mortgage loans. IndyMac moved $10.7 billion of loans intended for sale to the category of “held for investment” in the fourth quarter of 2007. In response to market conditions and OTS concerns, IndyMac changed its business plan in November 2007 to focus on originating mortgage loans qualifying for purchase by the government sponsored enterprises (agency-eligible loans). With limited prospects of maintaining adequate capitalization, IndyMac sought to obtain a significant capital infusion or to find a buyer. The pressure on IndyMac required time to be relieved. Negative news coverage and a subsequent deposit run beginning on June 27, 2008 took that time away. The deposit run followed the release of a letter from Senator Charles Schumer to the FDIC and OTS on June 26, 2008. The letter outlined the Senator’s concerns with IndyMac. The institution did not have sufficient access to liquidity to withstand the deposit run. With insufficient liquidity to meet its obligations, and no viable alternatives to return to profitability and restore capital adequacy, IndyMac was in an unsafe and unsound condition to transact business.197
c. Downey Savings and Loan
Although Downey, at the time of its closure, had not experienced as significant a decline in its capital levels as those experienced by IndyMac, the closure of this bank was based on the expectation that such significant additional losses existed in the bank’s portfolio and that it would not be possible for the bank to remain adequately capitalized. Downey’s primary federal regulator, the OTS, released a fact sheet on November 21, 2008 explaining the failure. This fact sheet describes the failure as follows:
Downey had a concentration of nontraditional mortgages, including payment option adjustable rate mortgages (ARMS) and hybrids. The majority of the loans in this portfolio were originated by mortgage brokers and were based on the borrowers’ stated incomes. Many of the borrowers utilized the negative amortization features of the option ARM loans and borrowers were exposed to significant payment adjustments when the initial adjustable loan rate reset. The [B]ank discontinued option ARM and stated income lending, but the loans already in the portfolio are experiencing high delinquency levels and causing material negative earnings. The Bank posted a net loss of $50.9 million for 2007 because of necessary provisioning for losses on loans. In 2008, the Bank posted net losses of $246 million in the first quarter, $217 million for the second quarter, and $74 million in the third quarter. The projected cumulative losses for the loan portfolio were
197 “OTS Fact Sheet on IndyMac Bank,” OTS 08-029A, OTS (July 11, 2008).
136
substantial …Downey was likely to incur additional losses that would deplete all or substantially all of capital.198
As illustrated in Exhibit III.34, in 2008, the market price of Downey’s shares fell significantly below Downey’s reported book value, potentially suggesting that market participants may have factored in information not reflected in Downey’s balance sheet. Downey reported in its Form 10-Q for the quarter ended September 30, 2008 that two purported shareholder class actions had been brought against it. As described in its Form 10-Q, in these cases, the
plaintiffs contend that the defendants concealed that (a) the Bank’s portfolio of option ARMs contained millions of dollars worth of impaired and risky securities; (b) the Bank had been aggressive in acquiring loans from mortgage brokers that were highly risky; (c) the Bank had failed to properly account for highly leveraged loans; (d) the Bank had inadequate underwriting practices, which led to large numbers of loan defaults; and (e) the Bank had not adequately reserved for option ARM loans.
G. Impact of Fair Value Accounting on Other Distressed Financial Institutions As mandated by the Act, this section of the study examines the impact of fair value accounting on bank failures in 2008. Although not mandated for study by the Act, an overview of the circumstances leading to the financial distress of other financial institutions based upon Staff observation through its prudential oversight function is provided in order to consider whether any additional insight could be gained between fair value accounting and financial institution failures in general. Despite unprecedented efforts to stabilize the financial markets, a number of long-standing financial institutions faced such dire liquidity positions that they decided bankruptcy or acquisition was inevitable in 2008. As noted previously, some have asserted that these circumstances were the result of fair value accounting along with the accompanying guidance on measuring fair value under SFAS No. 157. Instead of accounting and reporting being the crisis’ primary driver, the observations indicate that the liquidity positions of some financial institutions, concerns about asset quality, lending practices, risk management practice, and a failure of other financial institutions to extend credit appear to be the primary drivers. For instance, Bear Stearns experienced a rapid deterioration of liquidity during March of 2008 akin to a “run on the bank” as seen in earlier financial crisis.199 However, the circumstances surrounding Bear Stearns were unique as it was the first time that a well-capitalized major investment bank experienced a crisis of confidence that resulted not only in a loss of unsecured financing, but also short-term secured financing. This occurred even though the collateral it was able to provide was high quality, such as agency securities, and had a market value that exceeded the amount to be borrowed. 198 “OTS Fact Sheet on Downey Savings and Loan Association,” OTS 08-057A, OTC (November 21, 2008). 199 See Testimony of Christopher Cox, Chairman, SEC, before the Committee on Banking, Housing and Urban Affairs of the United States Senate on Recent Events in the Credit Markets (April 3, 2008).
137
Bear Stearns’ difficulties began when certain over-the-counter derivatives counterparties sought to novate contracts, or replace their trades with Bear Stearns by entering into new contracts with other dealers, while simultaneously some of Bear Stearns’ prime brokerage clients began moving their cash balances elsewhere. The Staff believes that these initial decisions to no longer transact with Bear Stearns influenced others, and quickly other counterparties, clients, and lenders reduced their exposure to Bear Stearns. Ultimately, counterparties simply would not engage in derivatives transactions with Bear Stearns and lenders would not engage in stock lending and tri-party repurchase transactions with Bear Stearns. Bear Stearns’ hedge fund clients withdrew their funds and certain banks hesitated to clear for Bear Stearns. By March of 2008, Bear Stearns faced the prospect of either filing for bankruptcy or quickly concluding an acquisition agreement with a larger partner. The sequence of these events indicates that liquidity pressure, caused by a lack of market confidence in Bear Stearns, was the likely driver to the demise of Bear Stearns. These liquidity pressures and decline in market confidence were precipitated by concerns about the quality of assets held by Bear Stearns and the poor risk management decisions that permitted such holdings to be accumulated. After Bear Stearns’ bankruptcy, other investment banks, including Lehman, continued to have difficulty selling mortgage-related assets as the market for such assets continued to deteriorate over the summer of 2008. The financial distress of the GSEs, including Freddie Mac and Fannie Mae, increased in September 2008 due to worsening real estate values exacerbated by the illiquidity of mortgage-related assets and faltering market confidence in these financial institutions. These events led to Lehman’s bankruptcy filing, as well as the distress experienced by the GSEs and other financial institutions. The challenges facing Lehman became clear to the market with the reporting of results for the second quarter of 2008. At that time, Lehman disclosed a significant concentration of what have been termed “legacy” assets. These illiquid assets, which fell into three distinct categories (residential real estate, commercial real estate, and acquisition finance), were accumulated in anticipation of future securitization. However, when the securitization market ceased to function, these assets, which Lehman had expected to hold for only a short period, were required to be held on its balance sheet. In the days prior to Lehman’s filing for bankruptcy in September 2008, secured funding broadly remained in place. However, other critical business arrangements were bearing down on the firm and straining Lehman’s liquidity. Most critically, a number of banks that had clearing relationships with Lehman significantly increased their collateral or deposit requirements, particularly around those products that involve non-simultaneous settlement. Given the magnitude of these clearing firm issues, and the likelihood that the demands would continue to increase, Lehman’s management believed it would be difficult for the firm to operate normally and meet its obligations. The week following Lehman’s bankruptcy filing, the remaining stand-alone investment banks experienced severe downward pressure on their stock price. Bank of America Corporation’s acquisition of Merrill Lynch occurred nearly simultaneously with Lehman’s bankruptcy. The expedited application of The Goldman Sachs Group, Inc. and Morgan Stanley, two firms widely
138
perceived to be the strongest, best-capitalized, and most resilient of the investment banks, to become bank holding companies indicated that the management of these firms determined that they could not continue without adopting the federally-subsidized funding model enjoyed by key competitors, which included federal government support through federally-insured deposits and broad access to a central bank as a liquidity backstop. Although not detailed in this study, the Staff also believes that the liquidity pressures faced by Bear Stearns, Lehman, and the other investment banks were also encountered by many other financial institutions, including AIG and other banks. Based on this analysis, and similar to the observations concerning 2008 bank failures in this study, liquidity pressures brought on by risk management practices, and concerns about asset quality precipitated by a rapid decline in confidence in these financial institutions, appears to be the primary cause of their financial distress and in some cases bankruptcy.

139
IV. Impact of Fair Value Accounting on the Quality of Financial Information Available to Investors
This section of the study discusses the views of investors and other financial statement users on the role of fair value accounting and whether it enhances or impairs their understanding of financial information. Specifically, this section explores the following areas: • Investor and user views about the use of fair value measurements, as expressed in comment
letters in response to the SEC’s request for comment on fair value accounting standards200 and other public statements, as well as a review of a sample of analyst reports to determine whether user practice is consistent with these views;
• A summary of investor and user views expressed at the Commission’s three public
roundtables,201 presented in the context of debate with other constituents; • Recommendations related to fair value accounting measurements from two recent federal
advisory committees; • Prior published Staff views on fair value accounting matters; and • A summary of available academic studies addressing the impact of fair value accounting on
the quality of information available to investors. As described more fully below, the results of the Staff’s study indicate that there is broad support among investors for the view that fair value information is useful and increases the quality of financial information available to them. For example, investors indicated that fair value provides more reliable and comparable information than amounts determined using alternative methods.
A. Investor and User Views About the Use of Fair Value Measurements
As the debate around fair value accounting intensified during 2008, investors and other users have generally expressed support for current fair value reporting standards. Recurring themes are that it improves the transparency of a firm’s investments and improves comparability across firms.
1. Comment Letters and Other Public Statements
The Commission received 186 comment letters from a variety of constituents in response to its request for comment on fair value accounting.202 Consistent with the mandate of the Act, this section presents a representative survey of investor views in the form of quotations from relevant comment letters and other public statements to demonstrate perspectives held by institutional and 200 See Appendix A for a summary of the comments received in response to the SEC’s request for public comment. 201 See Appendix B for a list of roundtable participants. 202 This number reflects comments received through December 15, 2008.

140
retail investors, large equity research practices, credit rating agencies, and other users. However, other constituents may have expressed alternative views; accordingly, this survey should be read in conjunction with the more complete summary of the comment letters in Appendix A. a. Representative Survey of Comment Letters Investors Technical Advisory Committee (“ITAC”) –
We are especially concerned to witness in recent weeks calls by some politicians, banking and insurance industry lobbyists, and other parties for changes, suspensions, or overrides to fair value accounting. In our view, those activities erode the notion of independent private sector accounting standard setting supported by a thorough and public due process that gives pre-eminence to the views of investors. … We encourage the Commission to closely examine the potential grave consequences to investors’ confidence in financial reporting if this important tenet is impaired. … ITAC, consistent with the views of most U.S. investors and financial analysts, believes that financial reporting would be substantially improved if fair value was the required measurement approach for all financial instruments reported by financial institutions as well as non-financial services enterprises. … Although ITAC recognizes that certain improvements to presentation and disclosures for fair value measurements may be warranted, we maintain our strong support of fair value accounting and our belief that it should serve as the principal measure for reporting financial instruments.203
Center for Audit Quality, CFA Institute, Consumer Federation of America, Council of Institutional Investors, and Investment Management Association –
In the specific case of fair value reporting, investors require an accounting standard that reports a relevant and useful value of financial instruments regardless of the direction of markets. Fair value accounting with robust disclosures provides more reliable, timely, and comparable information than amounts that would be reported under other alternative accounting approaches.204
CFA Institute –
CFA Institute’s support for fair value accounting is backed by a poll conducted of our 12,000 person EU membership, which shows that 79% were opposed to suspension of fair value and 85% believe that suspending fair value would decrease investor confidence in the banking system. We acknowledge that there are some limitations and implementation difficulties associated with the fair value
203 Letter from ITAC (original footnotes omitted). 204 Letter from Joint (November 14, 2008). See also letter from CII (“We believe that fair value accounting for financial instruments, complemented by robust disclosures, is superior to other accounting alternatives in: (1) providing investors clear and accurate information and (2) restoring the free flow of money and credit to the U.S. and global capital markets.”)
141
measurement approach including measurement error. But these limitations are not unique to the fair value approach. In fact, fair value has a well established history of application under US Generally Accepted Accounting Principles (US GAAP) for financial assets for 15 years. Considering its overall benefits, fair value is the best available alternative of measuring financial instruments and on balance, it significantly contributes to the overall transparency of financial institutions.205
Investment Company Institute –
[W]e believe financial reporting that requires the use of mark-to-market or fair value accounting to measure financial instruments better serves the interests of investors and our capital markets than alternative cost-based measures.206
International Corporate Governance Network –
The impact of SFAS 157 and other accounting standards promote improved transparency and disclosure of information to ensure present and potential investors, shareowners, creditors, management and other users have the most accurate information to make investment, credit and resource allocation decision. We support the transparency that has been given by fair value, but feel that fair value reporting is still an evolving target and much more work is required to find the most appropriate language to communicate information about financial position and performance. There may be serious questions with respect to the application of fair value when markets are not functioning properly. … The role of the auditor in the process of reporting the quality of financial instruments should be addressed. Financial reporting must meet the needs of investors and other users of financial reporting.207
Jeffery B. Cross, retired securities analyst –
As a retired securities analyst I have always had a low opinion of so called “fair value” accounting because it allows far too much leeway for interpretative judgment. …Any cogent investor would rather see things carried at amortized costs and make their own judgment as to the degree to which underlying long term value might be more or less than amortized cost (more detailed disclosures in quarterly reports would be a very important help in this and an excellent improvement in market efficiency long term). Mark to market, while conceived with the best intentions in mind, causes both too much noise in the system and produces a degree of balance sheet variation wholly inconsistent with orderly markets, as must now be all too obvious.208
205 Letter from CFA (November 11, 2008) (emphasis in original). 206 Letter from ICI. 207 Letter from ICGN. 208 Letter from Cross.

142
David Hodge, Glimbal Capital Management –
I believe that the Commission should immediately exercise the powers granted it under Section 132 of EESA and suspend SFAS 157 for not less than 12 months, retaining required disclosure in the Notes of financial statements but setting aside fair value recognition in the balance sheet for the immediate term, to effect a ‘cooling off’ period. … This said, SFAS 157 is an admirable goal, but the implementation has clearly been mishandled, and consequences have been far beyond what anybody anticipated at its inception. I applaud fair value disclosure, and I recognize great value in this. I would even go so far as to say that disclosure in the Notes alone would achieve the stated goal of transparency. No investor looking into investing in securities should be satisfied with mere financial statement analysis. As I know, because I am a security analyst, far deeper diligence is required, with the first reading after the financial statements being the Notes.209
Dan Nguyen, CFA, MBA –
The goal of the FMV [fair market value] accounting is to provide transparency and useful information to investors. So far, the FMV accounting has provided no further transparency and usefulness. But, it has caused tremendous capital implosions at financial institutions instead. As an investor, I strongly believe that it is far better to force financial institutions to supply detailed, supplemental schedules with assumptions and methods of pricing securities with proper explanations of various pricing conventions.210
Credit Suisse Group –
We do not believe that fair value accounting was the cause or even a contributing factor to the current credit crisis. Fair value accounting did not create the losses, but rather reflected the market conditions by initially bringing to light the impact of poor lending practices and the resulting effect on the current lack of liquidity and overall crisis in the financial markets. Fair value accounting reflects the effects of a transaction on an entity's financial statements. It does not, however, drive the underlying economic activity.211
209 Letter from Hodge. 210 Letter from Nguyen. 211 Letter from Credit Suisse. See also David Zion, Amit Varshney & Christopher Cornett, Focusing on Fair Value, Credit Suisse Equity Research, June 27, 2008:
In our view [mark-to-market] accounting is not the problem, it is reflecting an economic reality, asset values are falling, the sooner the accounting reflects those losses the better. The real problem was overexposure to certain assets, poor risk management, misunderstood mispriced risks and lots of leverage (borrowing short and lending or investing long can catch up with you). We would prefer to see the financial statements reflect real economic volatility rather than a false sense of stability.
143
b. Other Public Statements Dane Mott and Sarah Deans, J.P. Morgan Securities Inc. –
In our July 28, 2008 piece. … we wrote “blaming fair value accounting for the credit crisis is a lot like going to a doctor for a diagnosis and then blaming him for telling you that you are sick.” We stand behind this statement. The reality is that fair value accounting and enhanced disclosures have helped markets quickly identify where problems exist and react to those problems. While we will not deny that at times markets have overreacted [sic] to some information, such a reality is a part of human nature and likely will persist no matter what accounting is used.212
Dennis Jullens, UBS Investment Research –
The debate on the financial bail-out plan in the U.S. has also triggered a call to suspend fair value accounting as a solution to the current credit crisis. We are against a suspension of fair value accounting as it reduces transparency just when investors and analysts need it to regain confidence in the financial sector. …In choosing a measurement basis for financial instruments, we defend our preference for fair value over historical cost by quoting John Maynard Keynes who stated ‘I would rather be vaguely right than precisely wrong’. Suspending fair value accounting and allowing banks to recognize their financial assets on the balance sheet at an adjusted historical cost number gives a wrong impression of the bank’s balance sheet strength. This could even prolong the crisis as neither investors nor analysts (nor regulators for that matter) can have any insight into the true financial position of entities in the financial sector if financial assets are not recognized on the balance sheet at a proxy for their fair value. So despite all the controversy, we argue that there is no sensible alternative to the current fair value measurement of financial assets and liabilities to assess the net worth of company.213
Bill Mann, The Motley Fool –
…[S]uspending fair value accounting because the answer is inconvenient is akin to firing the weatherman because it's raining. Fair value accounting didn’t cause the problems in the financial system. Rather, it pointed them out and highlighted the impact of a decade’s worth of poor risk control. Fair value exposed the problem; suspending it to allow banks to use alternate methods has the effect of reducing the amount of useful information for investors by obscuring the value of large portions of banks' balance sheets.214
212 Dane Mott & Sarah Deans, Shooting the Messenger, JP Morgan Global Equity Research, September 29, 2008. 213 Dennis Jullens, Valuation and Accounting Footnotes: Pensions and Fair Value Accounting, UBS Investment Research, October 7, 2008. 214 Bill Mann, How Not to Solve the Credit Crisis, The Motley Fool, October 22, 2008. (available at: http://www.fool.com/investing/general/2008/10/22/how-not-to-solve-the-credit-crisis.aspx)
144
Bridget Gandy, Dina Maher, and Olu Sonola, Fitch Ratings –
Volatile financial market conditions have caused many reporting financial institutions to call for a relaxation of fair value accounting, allowing issuers the option of changing from fair value to historical cost accounting. In Fitch Ratings’ view, the fundamental and intentional distortions that such unfettered flexibility would permit would not engender greater investor confidence in financial reporting nor would it foster sound capital markets or sound financial institutions.215
Neri Buckspan, Ron Joas, and Sue Harding, Standard & Poor’s article –
We support the basic premise that fair value, when coupled with robust disclosure, is a relevant basis of accounting for financial assets and liabilities. However, we recognize that accounting for assets and liabilities at theoretical market price measures may produce results that could mask the underlying economics for certain businesses and activities, especially during volatile and uncertain economic and market conditions. These inherent limitations underscore the need for financial statements to complement fair value measures with additional information about uncertainties in the measurement of assets and liabilities.216
Mark LaMonte, Wallace Enman, Wesley Smythe, Donald Robertson, and Jason Cuomo, Moody’s Global Credit Research –
Investors…need to closely analyze the disclosures companies make about the financial assets on their balance sheets. Current fair value amounts are critical in the assessment of a firm’s liquidity position. Additional disclosures firms may make about their estimates of the longer-term “economic value” may also be valuable to investors in assessing the long-term health and future prospects of those firms. These disclosures should be used carefully. They are most valuable when accompanied by thorough sensitivity analysis related to key assumptions underlying the estimates of economic value.217
c. Observations From these comments and others received during the course of this study, most investors and other users of financial reports who provided input indicated a view that fair value accounting transparently reflects, under current economic conditions, the value of assets and liabilities of the companies in which they invest. Most indicate that suspending fair value 215 Bridget Gandy, Dina Maher & Olu Sonola, Fair Value Accounting: Is It Helpful in Illiquid Markets?, Fitch Ratings Accounting Research Special Report, April 28, 2008. 216 Neri Bukspan, Ron Joas & Sue Harding, Is it Time to Write Off Fair Value?, Standard & Poor’s Ratings Direct, May 27, 2008. 217 Mark LaMonte, Wallace Enman, Wesley Smythe, Donald Robertson & Jason Cuomo, How the Global Credit and Economic Crises are Affecting Accounting and Financial Reporting Issues - An Overview of Key Implications From a Credit Perspective, Moody’s Global Credit Research, December 2008.

145
accounting would result in a loss of information and investor confidence. However, these comments also clearly indicate that fair value reporting can pose challenges, particularly in the absence of active markets. Users also express the need to supplement fair value accounting with robust disclosure of the underlying assumptions and sensitivities, particularly when fair value estimates are necessary in the absence of quoted prices. In addition, some question the usefulness of fair value reporting when management does not use internal fair value metrics to make operational decisions. Nonetheless, there is little evidence to suggest investors and other users generally believe an alternative to fair value, such as amortized cost, would be a superior approach.
2. Common Themes in Individual Analyst Reports on Fair Value Measurements
To supplement the summary of publicly stated investor and user views on fair value accounting, the Staff reviewed 106 individual analyst reports released between December 1, 2007 and December 1, 2008. These reports were obtained through a search of the Thomson ONE Banker database. Search parameters were selected to focus on reports of institutions in the financial services sector containing the expressions “fair value” or “mark-to-market.” The purpose of this review was to identify specific commentary in the analysts’ work product (i.e., the reports) regarding the impact of fair value accounting on the quality of information considered in the context of actual analysis by users of financial information. As a result of its review, the Staff observed the following common themes: • Several analysts provided commentary that fair value accounting for brokers tended to
accelerate the recognition of losses compared to banks and that, as a result, brokers were generally expected to outperform banks in the early stages of recovery.
• A large number of analysts predicted additional losses in future periods for assets subject to
fair value accounting. • Several analysts commented that while their analyses and conversations with company
management provided some comfort as to the reasonableness of certain fair value adjustments each period, they recognized the “softness” of fair value estimates means that financial statement users cannot independently confirm the accuracy of such figures.
• A number of analysts appeared to discount the value of gains recognized in income caused
by declines in a company’s own credit risk related to debt carried at fair value. One analyst characterized this as “an aggressive approach” because the gain wasn’t expected to be monetized at a future date, but it nonetheless had the effect of offsetting losses on the company’s investment portfolio.
• Some analysts appeared to use fair value information to benchmark particular companies
against their competitors, speculating on what differential valuation results say about the ultimate collection of results of comparable portfolios of financial assets.

146
• A limited number of analysts included summaries of proprietary valuations to support their ultimate investment recommendations. Certain valuation techniques reversed the current period’s income impact for non-cash gains and losses, including the effect of financial assets carried at fair value, in order to prepare a projection of future cash flows. The Staff understands analysts commonly incorporate estimates of future cash flows into valuation models to reflect the anticipated disposition of the financial asset or liability that generated the non-cash gain or loss. Alternatively, the current fair value of the financial asset or liability could be added to the result of the discounted cash flow analysis in lieu of estimating the cash received or paid at disposal.
Beyond these observations, there was generally no additional commentary on the impact of fair value on the quality of information available to the analysts. As a result, the Staff did not observe any significant or recurring inconsistencies between the publicly stated views noted above compared to individual analyst reports.
B. Views Presented by Participants at Recent SEC Fair Value Roundtables The SEC has hosted three public roundtables in 2008 on fair value accounting. The first was held on July 9, 2008, prior to the mandate for this study, to facilitate an open discussion of the benefits and potential challenges associated with existing fair value accounting and auditing standards. Two additional roundtables on fair value accounting were held in connection with this study, the first on October 29, 2008, and the second on November 21, 2008. These roundtables focused on several issues related to fair value accounting, including: the usefulness of fair value accounting to investors and regulators; the effects of fair value accounting on financial reporting by financial institutions; the potential market behavior effects from fair value accounting; and whether aspects of current accounting standards can be improved. Panelists at the roundtables included investors, issuers, auditors, academics, former regulators, and others with experience in financial institutions’ fair value accounting practices. The themes of each roundtable are summarized below.
1. July 9 Roundtable218
a. Usefulness of Fair Value and Related Disclosures in Current Market Conditions
Investors indicated that fair value is the most relevant measurement attribute for financial instruments in the current market environment. They recommended that disclosures related to fair value estimates be enhanced to include more information on the methods used, along with the significant assumptions and sensitivity around those assumptions. However, one preparer expressed concerns that more disclosure would result in “disclosure overload.” Additionally, both investors and preparers discussed the fact that fair value disclosures are scattered throughout financial statements and would be more useful if they were consolidated into one location. 218 See http://www.connectlive.com/events/secroundtable070908/ for archived webcast. See Appendix B for a listing of roundtable participants.

147
Preparers of financial statements held mixed views about the usefulness of fair value accounting in current market conditions. Preparers that manage their businesses based on fair values, such as investment banks and mutual funds, indicated that fair value for financial instruments is always the most relevant measure. Preparers whose business activities include managing financial assets based on a longer-term profit expectation, for instance insurance companies and commercial banks, questioned the relevance of measuring securities based on current illiquid prices when those prices do not reflect the company’s ultimate cash flow expectations.
b. Application of Fair Value Accounting Preparer views also varied as to the difficulty of developing fair value estimates in the current environment. One preparer indicated that measuring fair value simply requires additional effort when illiquid markets exist, while other preparers and auditors expressed the view that applying the concepts in SFAS No. 157 under current market conditions is challenging. Concerns were raised that SFAS No. 157 lacks sufficient application guidance. Specifically, some indicated that interpretive guidance would be useful to assist auditors and preparers in answering the following questions: • What is an active market? • What are the characteristics of illiquid markets? • How do you determine when a sale is distressed versus an orderly transaction? • What represents sufficient evidence for an auditor? Preparers also expressed concern over the use of third party service providers, such as brokers and pricing services, to develop estimates of fair value – specifically that they do not reflect the “true market price” of an asset and that the quotes may contain bias, and thus not fully reflect the views of market participants. Although not directly related to measuring fair value, panelists also discussed difficulties associated with determining when declines in fair value are other-than-temporary, which lead to impairment charges in the income statement. One preparer stated that current interpretations of how to analyze declines in the fair value of securities classified as “AFS” under SFAS No. 115 are overly burdensome. The same preparer expressed a belief that the guidelines for recognizing other-than-temporary losses are negatively affecting the ability of some insurance companies to properly manage their investment portfolios.
c. Market Behavior Effects of Fair Value Accounting Most of the panelists indicated that they do not share the view that fair value accounting is pro-cyclical. Panelists stressed the importance of accounting being neutral and its objective of reflecting economic reality in the marketplace. However, some preparers expressed concern that fair value accounting may influence management behavior. Specifically, preparers indicated that companies may avoid investing in certain types of assets if they anticipate difficulty in estimating the assets’ fair value in future periods.

148
d. Impact of Non-Performance Risk on Fair Value of Liabilities The panelists expressed a diversity of views as to whether including changes in a company’s own credit risk in fair value estimates for liabilities is consistent with the underlying economics. Some argued that decreases in a company’s liabilities stemming from its own credit standing do, in fact, reflect actual economics. As a result, they believe reporting an unrealized gain in the income statement is appropriate. However, when the same company’s assets are not measured at fair value each period, there are no offsetting losses recorded. Consequently, other panelists expressed concern that this lack of symmetry may confuse readers of financial statements. Some preparers expressed other concerns about using fair value to measure a liability when management does not intend to pay the entire principal until maturity. They questioned the usefulness of temporary gains related to declines in fair value because they are not ultimately realized in cash.
2. October 29 Roundtable219
a. Usefulness of Fair Value Accounting Those panelists who generally opposed the use of fair value accounting expressed a number of concerns regarding its use, including the view that fair value understates the “true economic value” of financial instruments when markets are depressed. Opponents also asserted that an inconsistency exists between the accounting model and the business model in some cases. For example, some community banks originate loans with the expectation of holding and servicing them until maturity. Consequently, these banks and their owners may find current values less relevant for loans they expect to hold for years. Others perceive a conflict between the exit price notion in SFAS No. 157 (i.e., the amount received upon sale of an asset) and the idea that the reporting entity is a going concern that expects to continue operations indefinitely. Additionally, one panelist indicated the consequences of fair value accounting were so negative that they impeded a planned acquisition of another bank. This panelist indicated that certain loans would have been valued at only 20% to 30% of par (the current fair value of the loans) in the acquisition, lowering the acquiring bank’s regulatory capital to an unacceptably low level. As a result, management decided not to pursue the transaction. Panelists who support fair value accounting indicated that it provides investors with the most relevant information about financial instruments and serves to increase both transparency and consistency in financial reporting. However, they also acknowledged challenges in its application.
219 See http://www.connectlive.com/events/secroundtable102908/ for archived webcast. See Appendix B for a listing of roundtable participants.

149
b. Market Behavior Effects of Fair Value Accounting Many panelists stated that they did not believe fair value accounting was the cause or a contributing factor to the current global economic crisis. These panelists noted that accounting information is intended to report economic activity, but does not cause it. Other panel members disagreed, stating their view that fair value accounting has significantly compounded the current global economic crisis and has served to unnecessarily diminish the regulatory capital of many financial institutions. They assert that when asset prices decline and liquidity is reduced, banks are forced to sell their investments or raise capital (due to the interaction of regulatory capital requirements that are based on the value of their assets). If bank portfolios are marked-to-market, their capital position deteriorates, which, in turn, causes more asset sales and further depresses asset prices. Selling creates a “liquidity spiral” which results in bank failures. As a result, banks are forced to tighten their lending practices, thus reducing the availability of credit generally. Aside from these disagreements, one general consensus was a belief that fair value information is relevant to investors and should be communicated in one fashion or another. However, panelists did not agree as to the best way to present this information. Some preferred disclosing fair value information only in the footnotes to the financial statements or in MD&A, while others indicated recording fair values in the financial statements themselves is more appropriate.
c. Application of Fair Value Accounting Panelists also discussed the role of judgment in determining fair value estimates, particularly in situations in which markets are illiquid or inactive. Some asserted that the prospect of “second-guessing” and potential legal exposure in many cases deter the use of judgment. These factors can also impede the increasingly comprehensive disclosures sought by some users (e.g., sensitivity analyses) including those suggested by the Staff in the “Dear CFO” letters that were issued in March and September of 2008.220 There was general agreement among participants that the exercise of judgment is required in order to appropriately estimate fair value, particularly when faced with inactive markets.
d. Interaction with Regulatory Capital Requirements Another topic that generated a significant amount of discussion was the interrelationship between regulatory capital requirements and accounting information generated by following U.S. GAAP. Panelists generally agreed that fair value standards used for the purpose of providing information to investors should not be suspended or overridden in an attempt to address liquidity or capital standards for bank regulatory purposes. Participants expressed the view that concerns about the impact of fair value accounting “requiring” an entity to sell assets and / or raise additional capital are inaccurate. A number of panelists observed that accounting standards are established to provide information (they are the “messenger”); they do not require an entity to sell assets or
220 See March 2008 letter available at http://www.sec.gov/divisions/corpfin/guidance/fairvalueltr0308.htm and September 2008 letter available at http://www.sec.gov/divisions/corpfin/guidance/fairvalueltr0908.htm.
150
raise additional capital. Capital adequacy standards are established by safety and soundness regulators. Thus, if concerns exist surrounding the use of fair value information for capital purposes, these participants suggested such concerns should not be addressed by changing the information provided to investors. e. Potential Changes to Financial Statement Presentation Lastly, panelists discussed possible changes to the presentation of fair value measurements in the financial statements. One alternative included presenting changes in fair value of investments in securities due to credit impairment separately from changes due to other factors, such as changes in liquidity. Under this approach, a company would only report changes in fair value caused by credit impairments in net income, with all other changes reported directly through equity (i.e., OCI) on the face of a statement of comprehensive income. While this alternative generated interest across the panel, one participant expressed significant operational concerns about the ability to disaggregate the components of a fair value measurement and envisioned future disagreements between preparers and auditors on this point.
3. November 21 Roundtable221
a. Usefulness of Fair Value Information Panelists generally agreed that fair value accounting under SFAS No. 157 is not the root cause of the current global economic crisis and that a suspension or repeal of fair value accounting would not strengthen investor confidence in the current environment. Panelists indicated that regulators should look beyond SFAS No. 157 to address any pro-cyclical effects on regulatory capital requirements for financial institutions. Most panelists agreed fair value accounting and regulatory capital rules are distinct issues that should be considered separately, echoing the comments of participants in the prior roundtables. In addition, the panel expressed strong support for independent standard-setting at the Boards, noting that the process needs to be free of political or regulatory intervention. However, most members of the panel also agreed on two related aspects of fair value accounting needing improvement: the application of existing accounting standards that address whether certain assets are impaired, and the preparation of fair value estimates in the absence of quoted prices in active markets.
b. Asset Impairment Guidance and Estimates of Fair Value Panelists generally agreed that standard-setters should revisit OTTI guidance under current U.S. GAAP. One suggestion was made to harmonize the guidance for impairment of investments in debt securities under SFAS No. 115 with the guidance for loan impairments under SFAS No. 114. A second idea was to distinguish the credit loss component of an impairment charge from other changes in fair value, such as the effect of liquidity discounts or premiums. Certain investors and auditors suggested an approach in which credit losses (either expected or incurred) on debt securities would be recognized each period in income, while other changes in the fair
221 See http://www.connectlive.com/events/secroundtable112108/ for archived webcast. See Appendix B for a listing of roundtable participants.
151
value of an investment would be recorded in equity (i.e., OCI).222 The credit loss could be calculated on the basis of changes in expected cash flows similar to the provisions of SFAS No. 114. As an alternative, a number of preparers also suggested that investments that are not held for trading purposes should be carried at amortized cost so that only losses associated with credit would reduce earnings per share. Supplemental information about the fair value of the investment could be disclosed in the notes to the financial statements.223 They indicated their view that charges in OCI caused by illiquid markets inappropriately distort equity. In turn, this impacts the capital levels of financial institutions.
c. Financial Statement Presentation Panelists agreed that improved income statement presentation of fair value measurements would enhance the transparency and usefulness of financial statements for investors and other users. Specifically, under today’s standards, the components of changes in fair value, including credit events and liquidity fluctuations, are not presented separately. It was noted that improved presentation is consistent with a current project under joint development between the Boards, which is scheduled to be completed by 2011.
d. Additional Disclosures Panelists generally agreed on the need for more comprehensive disclosures. Suggestions included sensitivity analyses for fair value estimates, forward-looking information related to the expected value of certain investments at future dates (e.g., maturity), as well as detailed discussions of the valuation techniques and inputs used by management. Certain panelists suggested that additional disclosure requirements should be enacted before 2008 year-end financial reporting is completed. These panelists also indicated that if the SEC and / or the FASB do not envision providing such guidance, then they should consider making their intentions known in order to manage the expectations of preparers and auditors.
C. Recent Advisory Committee Recommendations Related to Fair Value Measurements
Recently, two separate federal advisory committees commented on aspects of fair value accounting, providing recommendations on improving the usefulness of fair value for investors. Educational efforts were a common point among the recommendations in each committee’s report.
222 For example, assume a debt investment previously was carried at $100, but that management concluded it was impaired by $60. Of this amount, assume $10 is determined to represent credit losses (or losses where it is probable that cash flows will not be received), while the remaining $50 is attributed to other factors, including the effect of a general decline in liquidity. In this situation (ignoring taxes), the asset would be reduced to $40 on the balance sheet, income would be charged for $10, and equity (accumulated OCI) would be lessened by $50. 223 Adapting the previous example for this scenario, a $100 asset would be reduced to $90 on the balance sheet for the effect of credit losses, and income would be charged for $10. No other entries in the primary financial statements would be recorded. The footnotes would disclose the investment’s current fair value was only $40.
152
In October 2008, the Treasury Department’s Advisory Committee on the Auditing Profession (the “Treasury Committee”) issued its final report.224 In the context of higher education for accounting students, the Treasury Committee recommended changes to ensure that degree requirements and CPA exam content meet the challenges of ongoing market developments and investor needs. These included the increasing use of IFRS and expanded fair value measurements in financial reports. Similarly, the Treasury Committee recommended that organizations, such as the AICPA and the American Accounting Association, meet with commercial content providers and encourage them to update their materials promptly to reflect recent developments, again singling out the increasing use of IFRS and expanded fair value reporting as topical improvements. In August 2008, CIFiR issued its final report.225 CIFiR explored fair value accounting in some detail given CIFiR’s dual-mandate to improve the usefulness of financial reports for investors and also to reduce the complexity in financial reporting generally.226 This resulted in a number of recommendations related to the “mixed-attribute model” in U.S. GAAP, including educational improvements. CIFiR recommended a long-term goal for the FASB to develop a consistent approach for determining which measurement attribute should apply to different types of business activities. In particular, it should address whether and when fair value should be used. This concept is referred to as the “measurement framework.” CIFiR also advocated a number of steps in the near-term to improve the clarity of financial statements for investors. First, CIFiR recommended a “judicious approach” in expanding the use of fair value in financial reporting until a number of practice issues are better understood and resolved and the FASB completes its measurement framework. CIFiR identified a number of practical challenges to fair value reporting. These include: (1) the uncertainty of some estimates that are developed in the absence of quoted prices and attendant concerns about these estimates being “second-guessed;” (2) demands for ever-increasing detailed accounting guidance to develop such estimates; (3) the lack of a single set of authoritative generally accepted valuation standards like U.S. GAAP; and (4) the absence of a comprehensive system to ensure continuing professional education and certification requirements for valuation professionals.227 Next, CIFiR proposed a consistent presentation of amounts in the financial statements based on their distinct measurement attributes, grouped by meaningful categories.228 The intent was to 224 See Treasury Committee, Final Report, October 6, 2008. (available at: http://www.ustreas.gov/offices/domestic-finance/acap/docs/final-report.pdf) 225 See CIFiR Final Report. 226 It should be noted CIFiR did not take a position as a supporter or opponent of fair value accounting. It stated, “We did not attempt to resolve the ongoing debate about what should be accounted for at fair value versus some other basis. Rather, we have been focused on explaining better to investors the components of the mixed-attribute model.” (CIFiR Final Report, at page 29, footnote 55). 227 See CIFiR Final Report, at pages 28-29. 228 See CIFiR Final Report, at page 28. Meaningful categories might be, for instance, the operating, investing, and financing sections of financial statements.

153
make subtotals of individual line items in the statements more informative, and is consistent with a current project under joint development by the Boards.229 This project includes a reconciliation of the statements of income and cash flows by major classes of measurement attributes to help investors analyze income. A detailed example of this reconciliation, as proposed by CIFiR, is provided in Appendix C. In addition to recommending improvements to the presentation of financial statements, CIFiR also recommended enhancing the disclosure of different measurement attributes. Such disclosures should enable investors to better understand the related risks and uncertainties, such as sensitivity analyses to depict the volatility of fair value estimates. Lastly, CIFiR addressed the importance of education:
Before expanding the role of fair value in financial reporting, we believe standards-setters and regulators should develop and implement a plan to strengthen the infrastructure that supports its use. Specifically, educational seminars may be necessary to better inform investors about the characteristics of fair value reporting. Likewise, preparers and auditors would benefit from ongoing training in basic valuation matters to reduce dependence on valuation specialists. Finally, the curricula in undergraduate and graduate accounting programs, as well as the CPA exam, will need to incorporate concepts of valuation theory and practice. We recognize a plan like this (as well as its execution) will require a coordinated effort among all constituents because each party shares an interest in accurate and reliable financial reports. In other words, standards-setters, preparers, auditors, regulators, and investors all have a role in fair value reporting. As each party gains experience with fair value information, it should be shared and considered by others in the educational effort to facilitate system-wide improvement.230
In short, both the Treasury Committee and CIFiR recognized the importance of all financial reporting constituents becoming better acquainted with fair value theory and practice. Without necessarily supporting or opposing mark-to-market accounting, it appears the committees believed communication between companies and financial statement users could be enhanced by encouraging a shared understanding about fair value, the economic information it conveys about business transactions, and its limitations.
D. Prior Published Staff Views on Fair Value Accounting
Two previous Congressional studies by Staff that considered ways to improve the quality of financial reporting to investors addressed fair value accounting. In the 2005 study on off-balance sheet activity and special purpose entities, the Staff addressed fair value accounting as follows:
229 FASB Financial Accounting Series, No. 1630-100 (available at: http://fasb.org/draft/DP_Financial_Statement_Presentation.pdf); and IASB Preliminary Views on Financial Statement Presentation. (available at: http://www.iasb.org/NR/rdonlyres/92028667-6118-496E-B0FE-97F829858B5D/0/DPPrelViewsFinStmtPresentation.pdf ) 230 CIFiR Final Report, at page 21.

154
The Staff recommends the continued exploration of the feasibility of reporting all financial instruments at fair value. Supporters of greater use of fair values on the balance sheet argue that the most useful information is that which reflects the current values of assets and obligations. Fair value accounting for all financial instruments also would appear to have benefits in terms of reduced complexity (for example, by eliminating the need for hedge accounting and its attendant documentation and effectiveness testing requirements, in many instances), more understandability, and less motivation to structure transactions so as to achieve certain accounting treatments. Of course, some have expressed significant concerns with requiring fair value accounting for all financial instruments, such as the potential manipulability and degree of difficulty in auditing some fair values. However, in light of the potential benefits, the Staff believes that methods should be sought to eliminate the obstacles to this treatment.231
In addition, as part of its 2003 study on principles-based accounting standards, the Staff noted, “it appears likely that in moving to a more objectives-oriented regime, the FASB will issue more standards that rely on fair value as the measurement attribute. If so, it would be imperative that accounting professionals be trained in valuation theory and techniques.”232
E. Abstract of Available Academic Studies Addressing the Impact of Fair Value Accounting on the Quality of Information Available to Investors
In addition to the above survey of investor and user views and other input received, the Staff also undertook a review of academic studies that have evaluated the usefulness of fair value information to investors. Many of these academic studies use large-scale samples of firms or investors and, thus, may not be subject to any small sample bias that may exist from observing only publicly submitted individual views. However, consistent with the survey above, the results of this body of academic research support the view that fair value information increases the quality of information available to investors. In general, “value relevance” studies examine whether stock prices are associated with recognized fair value amounts and / or reported fair value disclosures. The results from these studies show that firms’ equity values are significantly associated with both recognized fair value amounts and fair value disclosures. Most of the studies conducted using U.S. data examine the association between stock prices and either recognized or disclosed fair values for financial instruments. These studies also tend to focus on samples of banks or insurance companies (e.g., the value relevance of fair value disclosures made under SFAS No. 107 for banks).233
231 Off-Balance Sheet Report. 232 Principles-Based Accounting Study. 233 See, e.g., Mary E. Barth, William H. Beaver & Wayne R. Landsman, Value-Relevance of Banks’ Fair Value Disclosures under SFAS No. 107, 71 The Accounting Review 4 (1996), 513-537; Elizabeth A. Eccher, K. E. Ramesh, S. Ramu & S. Thiagarajan, Fair Value Disclosures by Bank Holding Companies, 22 Journal of Accounting and Economics (1996), 79-117; and Karen Nelson, Fair Value Accounting for Commercial Banks: An Empirical Analysis of SFAS No. 107, 71 The Accounting Review 2 (1991), 161-182.
155
The evidence of these studies also indicates that different fair value amounts are not uniformly informative or useful to investors (potentially due to differences in the real or perceived reliability of the estimates). Evidence shows that fair values obtained from actively traded markets are more reliably associated with share prices than fair value estimates obtained from illiquid markets or internal model estimates. For example, research using data for commercial banks and property-casualty insurers indicates that fair values for equity investments in U.S. Treasury securities are related to share price, but fair values for securities with less liquid markets (e.g., corporate bonds) are not.234 Similarly, early evidence regarding the usefulness of fair value disclosures made under SFAS No. 157 indicates that while Level 1 and 2 estimates (i.e., reflecting quoted prices in active markets for the identical asset or liability, and other observable inputs for the asset or liability, respectively) are value relevant to investors, Level 3 estimates are much less value relevant to investors.235 The results of these “value relevance” studies also provide support for the view expressed by investors that additional disclosures would be most useful in the case of fair values derived from illiquid markets or model estimates.236 Specifically, the lower degree of “value relevance” of fair values derived from illiquid markets or model estimates supports the idea that additional disclosures would be most useful in the case of these types of fair values. While Level 3 estimates may be less reliable than Level 1 or 2 estimates, further disclosures regarding the nature of the assumptions underlying Level 3 fair value estimates may help lessen the degree to which Level 3 disclosures (as managerial estimates) are potentially less informative to investors than Level 1 or 2 disclosures.237
234 See, e.g., Mary E. Barth, Fair Value Accounting: Evidence from Investment Securities and the Market Valuations of Banks, 69 The Accounting Review 1 (1994), 1-25; and Kathy Petroni & James Wahlen, Fair Values of Equity and Debt Securities and Share Prices of Property-Liability Insurers, 62 Journal of Risk and Insurance 4 (1995), 719-737. 235 See Chang J. Song, Wayne Thomas & Han Yi, Value Relevance of FAS 157 Fair Value Hierarchy Information and the Impact of Corporate Governance Mechanisms. Draft manuscript, University of Oklahoma. (2008) (“Song, et al.”). (available at: http://ssrn.com/abstract=1198142) The evidence in this study is early in the sense that it is based upon data from the first to third quarters of 2007 and uses a sample of firms that chose to adopt SFAS 157 early. 236 See Stephen G. Ryan, Fair Value Accounting: Understanding the Issues Raised by the Credit Crunch (White Paper) Council of Institutional Investors (2008). 237 See Wayne Landsman, Is Fair Value Accounting Information Relevant and Reliable? Evidence from Capital Market Research, Accounting and Business Research (Special Issue) (2007), 19-30; and Stephen G. Ryan, Accounting in and for the Subprime Crisis, The Accounting Review, (Forthcoming) (2008).

156

157
V. Process Used by the FASB in Developing Accounting Standards
This section of the study discusses the FASB governance and processes that result in the accounting standards U.S. public companies apply. This portion of the study is primarily based on publicly available information from the FASB and its parent organization, the Financial Accounting Foundation (“FAF”).238 An accounting standard-setting process is the foundation of a financial reporting system. In turn, this system is essential to the efficient functioning of the economy because investors, creditors, and others rely on credible, transparent, and comparable financial information for purposes of providing and allocating capital.
A. Background and Mission As noted in Section I.B, the Commission in the 2003 Policy Statement recognized the financial accounting and reporting standards of the FASB as “generally accepted” for purposes of the federal securities laws. The 2003 Policy Statement also indicates that the Commission, in its oversight capacity, has determined that the FAF and the FASB satisfy the requirements in Section 108 of the Sarbanes-Oxley Act. Section 108 establishes criteria that must be met in order for the work product of an accounting standard-setting body to be recognized as “generally accepted.” Accordingly, the SEC may recognize a standard-setting body that: • is organized as a private entity; • has, for administrative and operational purposes, a board of trustees serving in the public
interest, the majority of whom are not, concurrent with their service on such board, and have not been during the two-year period preceding such service, associated persons of any registered public accounting firm;
• is funded as provided in Section 109 of the Sarbanes-Oxley Act; • has adopted procedures to ensure prompt consideration, by majority vote of its members, of
changes to accounting principles necessary to reflect emerging accounting issues and changing business practices; and
• considers, in adopting accounting principles, the need to keep standards current in order to
reflect changes in the business environment, the extent to which international convergence on high quality accounting standards is necessary or appropriate in the public interest and for the protection of investors.239
238 Unless otherwise indicated, the content in Section V is reproduced or adapted from the websites of the FASB (www.fasb.org) and the FAF (http://www.fasb.org/faf/index2.shtml). Further details about the FASB’s governance and process are available on these websites. 239 See Section 19(b)(1) of the Securities Act, as amended by Section 108 of the Sarbanes-Oxley Act.
158
The mission of the FASB is to establish and improve standards of financial accounting and reporting for the guidance and education of the public, including issuers, auditors, and users of financial information. The FASB develops broad accounting concepts as well as standards for financial reporting. It also provides guidance on implementation of standards. Concepts are useful in guiding the FASB in establishing standards and in providing a frame of reference, or conceptual framework, for resolving accounting issues. The FASB’s work on both concepts and standards is based on research aimed at gaining new insights and ideas. Research is conducted by the FASB staff and others, including foreign national and international accounting standard-setting bodies. The FASB’s activities are open to public participation and observation under the “due process” mandated by the Articles of Incorporation and By-Laws of the FAF and Rules of Procedure of the FASB. The FASB looks to the following precepts in the conduct of its activities: • To be objective in its decision-making and to ensure, insofar as possible, the neutrality of
information resulting from its standards; • To weigh carefully the views of its constituents in developing concepts and standards; • To promulgate standards only when the expected benefits exceed the perceived costs; • To bring about needed changes in ways that minimize disruption to the continuity of
reporting practice; • To review the effects of past decisions and interpret, amend or replace standards in a timely
fashion when such action is indicated; and • To follow an open, orderly process for standard-setting that precludes placing any particular
interest above the interests of the many who rely on financial information.
B. Governance and Structure The FASB is part of a structure that is independent of other business and professional organizations. However, the FASB is subject to oversight by the FAF, which is an independent, private-sector organization incorporated to operate exclusively for the charitable, educational, scientific, and literary purposes within the meaning of Section 501(c)(3) of the Internal Revenue Code. The FAF, subject to SEC oversight, is responsible for selecting the members of the FASB and its advisory council (see below) and exercises general oversight, with the exception of the FASB’s resolution of technical accounting issues. In addition, the FASB consults with the Financial Accounting Standards Advisory Council (“FASAC”) as to technical issues on the FASB’s agenda, project priorities, matters likely to require the attention of the FASB, selection and organization of task forces, and such other matters as may be requested by the FASB or its Chairman. At present, FASAC has more than 30 members who are broadly representative of preparers, auditors, and users of financial information.

159
Pursuant to the Sarbanes-Oxley Act, the FASB is independently funded by an “annual accounting support fee” assessed and collected against issuers to fund recoverable expenditures of the FASB.240 Details regarding individuals and organizations comprising the FASB and the FAF are available in Appendix D.
C. Standard-Setting Process Actions of the FASB have an impact on many organizations within its constituency. Accordingly, the FASB follows a due process that is open to public observation and participation. These procedures are used for major agenda projects, some of which may not be necessary for application and implementation projects. The primary outcome of the FASB’s work is authoritative standards of financial accounting and reporting, authoritative guidance on the implementation of those standards, and broad accounting concepts. Those standards are often referred to as generally accepted accounting principles, or GAAP. In addition to the effect of the 2003 Policy Statement, which recognizes the standards as “generally accepted” for purposes of the federal securities laws, the standards also are considered to be “generally accepted” by virtue of the procedures used to establish them (including extensive due process), not because they necessarily represent a consensus (or generally accepted) view of issuers, auditors, users, or any other constituent group. The procedures the FASB uses to establish U.S. GAAP are set out in several documents including the Certificate of Incorporation and By-Laws of the FAF, the Rules of Procedure of the FASB, and the FASB’s more detailed policy manual. Initially, the FASB receives requests or recommendations for possible projects and reconsideration of existing standards from various sources. The FASB staff then, after consultation with other members of the Board, summarizes the information it receives and discusses its findings with the FASB’s Chairman who decides whether to add the project to its agenda. If the project is undertaken, the FASB will deliberate the various issues identified and analyzed by the staff at one or more public meetings. To convey its views, the FASB will issue one or more due process documents, which may be an exposure draft of a proposed accounting standard or may be a more exploratory document such as a discussion paper. These initial due process documents are issued for public comment to obtain feedback on the direction of the project. Depending on the circumstances surrounding the project, the FASB may hold a public roundtable meeting on the due process document(s). Afterward, the staff analyzes comment letters, public roundtable discussion, and any other information in order for the FASB to redeliberate the proposed provisions at public meetings. Finally, the FASB may issue additional due process documents, proceed to issuing a SFAS or FASB Interpretation (“Interpretation”) by simple majority vote, or decide not to continue with the project. These steps are described in greater detail below. 240 See 15 U.S.C. 7219.

160
1. How Topics Are Added to the FASB’s Technical Agenda and Developed
The FASB receives many requests for action on various financial accounting and reporting topics from all segments of its constituency, including the SEC and its Staff.241 The auditing profession is sensitive to emerging trends in practice and, consequently, is a frequent source of requests. Requests for action include both new topics and suggested review or reconsideration of existing pronouncements. The FASB is alert to trends in financial reporting through observation of published reports, liaison with interested organizations, and discussions with the EITF (see below). In addition, the FASB staff receives many technical inquiries which often provide evidence that a particular topic, or aspect of an existing pronouncement, has become an issue. The FASB also is alert to changes in the financial reporting environment that may be brought about by new legislation or regulatory decisions. Along with FASAC, the FASB’s User Advisory Council and Small Business Advisory Committee also serve as resources to the FASB, both in formulating its technical agenda and in advising on specific agenda projects. Additionally, the ITAC is a standing resource to the FASB and its staff that provides technical accounting advice, from the investors’ perspective, on current projects. The ITAC also will identify critical accounting and financial reporting deficiencies that require the FASB’s attention and will propose new items to be added to the technical agenda, both major projects and technical application and implementation activities. The FASB also utilizes other organizations and groups for advice and information on various matters, including its agenda. Among the groups with which liaison is maintained are the Accounting Standards Executive Committee and the Auditing Standards Board of the AICPA, the PCAOB, the IASB, and the appropriate committees of such organizations as the CFA Institute, Financial Executives International, and Institute of Management Accountants. To aid in the decision-making process, the FASB has developed a list of factors that are the basis for evaluating agenda proposals:242 241 For example, the 2003 Policy Statement provides (footnotes omitted):
The FASB, in its role of “assist(ing) the Commission in fulfilling the requirements of the Securities Exchange Act,” should provide timely guidance to public companies, accounting firms, regulators and others on accounting issues that the Commission considers to be of immediate significance to investors. The Commission and its staff, however, do not prohibit the FASB from also addressing other topics, and do not dictate the direction or outcome of specific FASB projects so long as the conclusions reached by the FASB are in the interest of investor protection. We expect that the Commission staff will refer issues to the FASB or one of its affiliated organizations when those issues may warrant new, amendments to, or formal interpretations of, accounting standards. We also expect that the FASB will address such issues in a timely manner. On those occasions when the FASB may determine that consideration of the issue is not advisable or that the issue cannot be resolved within the time frame acceptable to the Commission, we expect that the FASB promptly will notify the Commission or its staff, provide us with its views regarding an appropriate resolution of the issue, and diligently work with us and our staff to ensure the protection of investors from misleading or inadequate accounting or disclosures.
242 In addition, as set forth the 2003 Policy Statement, the Commission expects the FASB to:
161
• Pervasiveness of the Issue – the extent to which an issue is troublesome to users, preparers,
auditors, or others; the extent to which there is diversity of practice; and the likely duration of the issue, i.e., whether transitory or likely to persist;
• Alternative Solutions – the extent to which one or more alternative solutions that will
improve financial reporting in terms of relevance, reliability, and comparability are likely to be developed;
• Technical Feasibility – the extent to which a technically sound solution can be developed or
whether the project under consideration should await completion of other projects; • Practical Consequences – the extent to which an improved accounting solution is likely to be
acceptable generally, and the extent to which addressing a particular subject (or not addressing it) might cause others to act (e.g., the SEC or Congress);
• Convergence Possibilities – the extent to which there is an opportunity to eliminate
significant differences in standards or practices between the U.S. and other countries with a resulting improvement in the quality of U.S. standards; the extent to which it is likely that a common solution can be reached; and the extent to which any significant impediments to convergence can be identified;
• Cooperative Opportunities – the extent to which there is international support by one or more
other standard-setters for undertaking the project jointly or through other cooperative means with the FASB; and
• Resources – the extent to which there are adequate resources and expertise available from the
FASB, the IASB, or another standard-setter to complete the project; and whether the FASB can leverage the resources of another standard-setter in addressing the issue, and thereby add the project at a relatively low incremental cost.
After considering these factors, consulting with other FASB members, and consulting with the FASB’s Technical Director (who also chairs the EITF), the Chairman decides whether to add an item to the FASB’s agenda.
• Consider, in adopting accounting principles, the extent to which international convergence on high quality
accounting standards is necessary or appropriate in the public interest and for the protection of investors, including consideration of moving towards greater reliance on principles-based accounting standards whenever it is reasonable to do so;
• Take reasonable steps to continue to improve the timeliness with which it completes its projects, while satisfying appropriate public notice and comment requirements; and
• Continue to be objective in its decision-making and to weigh carefully the views of its constituents and the expected benefits and perceived costs of each standard.
162
2. Accessibility of Meetings The FASB’s due process incorporates open decision-making meetings and exposure of proposed standards for public comment. All technical decisions are made in meetings (generally held at the FASB’s offices) that are open to public observation, although public observers do not participate in the meeting discussions. A live broadcast of such meetings is available on the FASB website. A “Summary of Decisions Reached” is typically available on the FASB’s website within a day of public meetings. The staff presents written material, including analysis and recommendations, to the FASB members in advance as the basis for discussion in a meeting. The written material is the result of research by the FASB staff, including a detailed review and analysis of all of the significant alternative views for each issue to be discussed at the meeting. The meeting format calls for oral presentation of a summary of the written materials by the FASB staff, followed by FASB discussion of each issue presented and questioning of the staff. The FASB may reach conclusions on one or more of the issues presented. Conclusions reached are tentative and may be changed at future FASB meetings.
3. Public Exposure of Standards Each proposed SFAS, Interpretation, or FSP is issued in exposure draft form for public comment. When the FASB has reached conclusions on the issues, it directs the staff to prepare a proposed exposure draft for its consideration. After further discussion and revisions, FASB members vote by written ballot to issue the exposure draft. A majority vote of the FASB is required to approve a document for issuance as an exposure draft. Alternative views, if any, are explained in the document and posted on the FASB website. The exposure draft sets forth the proposed standards of financial accounting and reporting, the proposed effective date and method of transition, background information, and an explanation of the basis for the FASB’s conclusions. At the end of the exposure period, which is determined at the discretion of the FASB and lasts typically 60-90 days and generally not less than 30 days (or 15 days in the case of an FSP), all comment letters and position papers are analyzed by the FASB staff to identify new information and / or persuasive arguments regarding the issue. In addition to studying this analysis, FASB members review the comment letters to help them in reaching conclusions.
4. Further Deliberation by the FASB After the comments have been analyzed and studied, the FASB typically redeliberates the issues in light of input received during the exposure period. As in earlier stages of the process, all FASB meetings are open to public observation. The FASB considers comments received on the exposure draft or other due process documents and often incorporates suggested changes in the final document. If substantial modifications are made, the FASB may decide to issue a revised due process document or exposure draft for additional public comment. When the FASB is satisfied that the analysis of the issue is complete and reasonable alternatives have been

163
considered adequately, the FASB staff is directed to draft a final document for consideration by the Board. A vote is taken on the final document, again by written ballot. A simple majority is required for adoption of a final pronouncement. If the input received by the FASB indicates that changes to existing standards are not required, the Chairman may decide to remove the project from the FASB’s agenda.
5. Statements of Financial Accounting Standards The final product of most technical projects is a SFAS. The SFAS sets forth the final standards, the effective date and method of transition, background information, a brief summary of research done on the project, and the basis for the FASB’s conclusions, including the reasons for rejecting significant alternative solutions. It also identifies members of the FASB voting for and against its issuance and includes reasons for any dissents.
6. Additional Due Process
a. Resource Groups For major projects, the FASB generally goes beyond the core due process described above. Soon after a major project is placed on the FASB’s technical agenda, a resource group may be formed, including preparers, auditors, and users of financial information who are knowledgeable about the subject matter. Experts from other disciplines (e.g., tax or valuation experts) also may be included. The resource group provides information and practical insights from constituents’ perspectives on FASB agenda projects. The FASB staff seeks information from resource group members as needed throughout the life of a project, for example, as it initially identifies issues to be addressed and as it develops its analysis of possible alternative approaches. Resource group members also are asked to perform external reviews of drafts of due process documents (see below) and final standards. During the development of SFAS No. 157, the FASB utilized the support of a resource group of investors, preparers, auditors, and valuation specialists. This group had significant experience in performing and reviewing valuations for financial reporting purposes. b. Other Due Process During development of a standard, usually prior to issuance of an exposure draft, the FASB may choose to conduct field visits or field tests for the purpose of assessing the costs and benefits of the proposed standard, and also to determine whether it is operational. Further, additional discussion papers may be issued for public review and comment. During the comment period of a due process document, the FASB also may conduct field tests of its provisions and seek the input of ITAC or other advisory groups. After a discussion document or an exposure draft is issued for public comment, the FASB often holds public roundtable meetings with interested constituents. Those meetings provide an
164
opportunity for the FASB and staff to solicit further input and ask questions about information and viewpoints offered by constituents who participated in the comment process.
7. Statements of Financial Accounting Concepts In addition to SFASs, the FASB also issues SFACs, which do not currently establish new standards or require any change in the application of existing accounting principles. Instead, they are intended to provide the FASB and constituents with a foundation for setting future standards. The framework defined in the SFACs helps the FASB identify the right questions to ask in structuring technical projects and contributes to a consistent approach over time. Because of their long-range importance, SFACs are developed under the same due process the FASB follows in developing SFASs on major topics. The FASB currently has a joint project with the IASB to improve the FASB’s conceptual framework.
8. Other Documents In addition to broad issues of financial accounting and reporting, the FASB considers narrower issues related to implementation of existing standards and other problems arising in practice. Depending on their nature, application and implementation problems may be dealt with by the FASB in SFASs, Interpretations, or FSPs. Implementation resource groups are also established concurrent with the issuance of certain FASB standards to assist the FASB staff in: (1) keeping abreast of issues that are currently being dealt with by preparers and auditors of financial statements related to the issuance and adoption of that standard, (2) identifying whether the understanding of that standard is being achieved, and (3) evaluating whether there are different interpretations of that standard that were not intended. As it relates to the issuance and adoption of SFAS No. 157, the FASB created the Valuation Resource Group (the “VRG”). The VRG is a collection of 20 valuation specialists, auditors, preparers, and investors that provides the FASB staff with information on implementation issues surrounding fair value measurements used for financial statement reporting purposes. The VRG meetings are closed to the public and minutes are not distributed. The FASB specifically designed the VRG to be a means to educate the FASB staff on valuation issues while not creating authoritative decisions. The VRG was formed in response to the FASB’s Invitation to Comment (“ITC”) on valuation guidance for financial statement reporting purposes, issued on January 15, 2007. The purpose of the ITC was to solicit information on the need for additional valuation guidance for financial reporting, whether the FASB should be responsible for providing such guidance, and what process should be used to issue valuation guidance for financial reporting. The ITC posed several broad questions aimed at understanding the role that the FASB and existing appraisal organizations should play in the development of valuation guidance for financial reporting and the process by which guidance should be provided. The FASB received approximately 80 comment letters on the ITC and held a subsequent roundtable with auditors, valuation specialists, trade association representatives, and appraisal organization representatives to discuss the participants’ views.
165
Since October 2007, the VRG has met five times and discussed over 30 issues relating to fair value measurements. The results of these discussions led, in part, to the FASB to propose additional guidance in the areas of measuring the fair value of liabilities, accounting for defensive-use intangible assets, disclosures about post-retirement benefit plan assets, and the deferral of the effective date of SFAS No. 157 for certain non-financial assets and liabilities.
9. Emerging Issues Task Force The EITF was formed in 1984 in response to the recommendations of the FASB’s task force on timely financial reporting guidance and an FASB Invitation to Comment on those recommendations. EITF members include representatives from public accounting firms, preparers, and users of financial statements. The Chief Accountant of the SEC, or his or her designee, attends EITF meetings as an observer with the privilege of the floor. The EITF meets at least four times a year. Meetings are open to the public and, generally, are attended by substantial numbers of observers; meetings are also broadcast on the FASB website. EITF agenda requests are received in a similar manner as FASB project requests. A subcommittee of EITF members, the SEC observer, FASB staff, and the FASB members discuss these requests. The FASB Chairman considers input from the agenda subcommittee and decides whether to add the request to the EITF’s agenda. Composition of the EITF is designed to include persons in a position to be aware of emerging issues before they become widespread and before divergent practices regarding them become entrenched. The EITF discusses the emerging issue and attempts to reach a consensus. A consensus is defined as an agreement, provided that no more than three of the 14 voting members object. A draft abstract, after ratification by at least a majority of the FASB members, is exposed for public comment as an EITF Consensus for Exposure. Comments are received on the Consensus for Exposure and any issues are addressed or reconsidered by the EITF. The final Consensus positions of the EITF must be ratified by at least a majority of the FASB members for the final consensus to become authoritative U.S. GAAP. If consensus is not possible, it may be an indication that action by the FASB is necessary.
10. Public Record Transcripts of public hearings, letters of comment and position papers, research reports, and other relevant materials on projects leading to issuance of pronouncements become part of the FASB’s public record. The public records on all projects are available for inspection in the public reference room at the FASB’s offices in Norwalk, Connecticut.
D. Recent Activities with Respect to FASB Governance and Process In February 2008, the FAF voted to adopt a number of changes proposed by a special committee it formed to review FAF oversight of the FASB, as well as elements of the FASB’s internal procedures.243 CIFiR’s Final Report also included a number of recommendations on the same 243 See “The Financial Accounting Foundation Board of Trustees Approves Changes to Oversight, Structure and Operations of FAF, FASB and GASB,” FAF Release (February 26, 2008). (available at:

166
general subjects.244 The more salient results of the FAF’s changes and CIFiR’s recommendations are summarized below. The FAF voted to: • Expand the breadth of individuals and organizations invited to submit nominations for the
Board of Trustees. Seeking additional nominating sources is intended to expand the population and diversity of qualified nominees, including those with investor experience, who possess the skills and experience that can be useful to the FAF.
• Change the term of service for Trustees (other than the Chairman) from two three-year terms
to one five-year term. The intent is to attract a larger number of qualified Trustees, while providing all Trustees with additional time to research and become familiar with FAF business, while reducing the relative portion of their terms spent doing so.
• Change the size of the Board of Trustees from 16 members to a range of 14 to 18 members.
The purpose is to efficiently adjust Trustee resources as FAF workloads fluctuate over time. • Reduce the size of the FASB from seven to five, primarily to enhance its ability to respond
nimbly and quickly to its agenda. • Retain the FASB simple majority voting requirement. • Affirm the need for investor participation on the FASB by broadening the current by-law
requirement that FASB members possess investment experience. • Provide the FASB Chairman with decision-making authority to set the FASB technical
agenda after appropriate consultation. This change was made to improve agenda-setting efficiency compared to the previous arrangement in which the full FASB voted on agenda matters.
• Strengthen FAF oversight of the FASB standard-setting process, such as by overseeing the
implementation of a formal process by which the FASB will retrospectively evaluate the effectiveness of its standards.
These changes were adopted and are currently part of FASB’s operations. CIFiR indicated that the design of the U.S. standard-setting process, including the process of issuing authoritative interpretive implementation guidance and the role played by each participant, works well and is generally appropriate.245 Further, CIFiR acknowledged some of its
http://www.fasb.org/faf/nr022608.pdf) Further, the FAF requested public comment on the proposals in December 2007. 244 See CIFiR Final Report, Chapter 2. 245 See CIFiR Final Report, at page 56.
167
recommendations may have been partially or substantially addressed by recent actions of the FAF, the FASB, and the SEC. Building on these efforts, CIFiR issued the following recommendations: • Enhance the investor’s perspective in standard-setting by increasing investor-representation
on the Board, the FASB staff and FASB’s advisory groups in order to meet the needs of those for whom financial reporting standards are primarily designed.
• Amend the FASB’s mission statement to make the objective of minimizing complexity in
accounting standards explicit; the FAF should also establish performance metrics to ensure key aspects of standard-setting meet the FASB’s stated goals and objectives.
• Clarify roles with the SEC regarding the issuance of interpretive and / or implementation
accounting guidance to avoid overlap and potential confusion by constituents. • Improve the standard-setting process by:
o Establishing an FRF that includes key constituents from the preparer, auditor, and investor and other user communities, to meet with representatives from the SEC, the FASB, and the PCAOB to discuss pressures in the financial reporting system overall, both immediate and long-term.
o Increasing the transparency and consistency of fieldwork during the development of
accounting standards. Fieldwork generally refers to constituent outreach, for instance soliciting preparer and investor input, as well as testing proposed accounting standards on the financial statements of volunteers (akin to a pilot program). Fieldwork is used to inform the FASB when making its cost-benefit assessments. By increasing the public visibility of field work and its consistent application across major projects, financial reporting standards should be improved.
o Conducting post-adoption reviews of major standards to identify unintended
consequences or other practice issues. The intent is to ensure new standards are conveying the intended information at an acceptable cost, within a reasonable range of differing interpretations across companies.
o Periodically assessing existing standards for continued relevance and acceptable cost-
benefit profiles in light of changing economic conditions. For instance, legacy accounting standards for capital-raising activity may not keep pace with marketplace developments or accurately convey their substance, such as accounting guidance for certain convertible securities and securitization transactions (“off-balance sheet” accounting).
It should be noted that CIFiR’s recommendations reflect its consideration of changes adopted by the FAF in February 2008.

168
E. FASB’s Interaction with the IASB The FASB’s objective for participating in international activities is to increase the international comparability and the quality of accounting standards used in the United States. This objective is consistent with the FASB’s responsibility to its domestic constituents, who benefit from comparability of information across national borders. The FASB pursues that objective in cooperation with the IASB and national standard-setters. As noted in Section I.C, in 2002, the Boards issued the Norwalk Agreement, in which each acknowledged their commitment to developing high quality, compatible accounting standards that could be used for both domestic and cross-border financial reporting. In that agreement, the Boards pledged to use their best efforts to: (1) make their existing financial reporting standards fully compatible as soon as is practicable and (2) co-ordinate their future work programs to ensure that once achieved, compatibility is maintained. In a 2006 Memorandum of Understanding, the Boards indicated that a common set of high-quality global standards remains their long-term strategic priority. As part of this commitment, the Boards set out a work plan covering several projects and coordinated agendas so that major projects that one board takes up may also be taken up by the other board. That plan covered specific long- and short-term projects for work into 2008. In November 2007, the Trustees of the IASB governing body reiterated their support for continuing the work program described in these memoranda, noting that future work is largely focused on areas in which the objective is to develop new world-class international standards. Most recently, in September 2008, the Boards issued a progress report and a timetable for the completion of joint major projects by 2011 in areas such as financial statement presentation, revenue recognition, lease accounting, liabilities and equity distinctions, consolidation accounting, and pension and post-retirement benefit accounting.

169
VI. Alternatives to Fair Value Accounting Standards This section of the study examines the potential impact of a suspension of SFAS No. 157 and recent proposals regarding alternative measurement attributes. Specifically, this section provides: • An analysis of the goals of SFAS No. 157, benchmarked against the state of fair value
measurements and disclosures prior to the issuance of the standard; • Consideration of alternative measurement bases and the concepts and themes underlying
recent proposals; and • A description of issues related to auditing practices that may warrant further consideration in
determining whether additional guidance for auditors would be helpful. This section of the study is based on publicly available information from the Boards and a review of applicable academic literature. Overall, suspending SFAS No. 157 would not eliminate fair value accounting. Instead, it would return practice to a state in which fair value accounting exists, but without a consistent framework for determining those measurements. As to alternatives to fair value accounting, while such alternative measurement bases exist, each alternative exhibits strengths and weaknesses, as well as implementation issues. Considering evidence regarding the usefulness of fair value information to investors, the suspension of fair value accounting to return to historical cost-based measures would likely increase investor uncertainty and adversely impact equity values by removing access to information at a time when that information is likely most useful to investors. However, given the significant challenges faced in implementing existing standards, additional actions to improve the application and understanding of fair value requirements are advisable.
A. Impact of a Suspension of SFAS No. 157 As noted in Section I.D of this study, SFAS No. 157 defines fair value, establishes a framework for measuring fair value in U.S. GAAP, and requires expanded disclosures about fair value measurements. SFAS No. 157 does not require any fair value accounting. Rather, SFAS No. 157 is applied when other specific GAAP pronouncements either require or permit fair value measurements.246 As such, suspending SFAS No. 157 will not, in and of itself, remove any requirements to apply fair value (or mark-to-market) accounting. Instead, the suspension or elimination of SFAS No. 157 would merely remove the application guidance on the measurement of fair value. Further, suspension of SFAS No. 157 would eliminate the requirement for expanded disclosures regarding fair values (including disclosures related to the fair value hierarchy).
246 See SFAS No. 157, paragraphs 1 and 2.
170
SFAS No. 157 was developed in response to the perceived need for increased consistency and comparability in fair value measurements (and for expanded disclosures about fair value measurements).247 That is, there was a perceived need for a common set of instructions for application in situations where U.S. GAAP (in this case, pre-existing U.S. GAAP) calls for or permits the use of fair value. Prior to the guidance and expanded disclosures provided in SFAS No. 157, different definitions of fair value existed in U.S. GAAP, having evolved in a piecemeal fashion over time. Limited guidance for applying those different definitions existed, and the guidance that did exist was dispersed among the many accounting pronouncements that referred to fair value.248 Differences in the definitions of and guidance about fair value were believed to create inconsistencies in the application of fair value measurement, which contributed to additional complexity in applying U.S. GAAP. Elimination of the potentially inconsistent application is consistent with the advice of CIFiR, which cited incomparability and inconsistency in the reporting of activities as one of the significant causes of complexity.249 With respect to fair value, and as noted in Section IV.C of this study, the final CIFiR report notes that “optimally, the FASB should develop a consistent approach to determine which measurement attribute should apply to different types of business activities (in particular, it should address whether and when fair value should be used).”250 As previously discussed, the final CIFiR report recommended that the FASB be judicious in requiring fair value measurement in additional circumstances until additional steps are taken.251 CIFiR also supported additional disclosure and presentation requirements. Several of the concepts within SFAS No. 157 were present to varying degrees in many of the amended standards. However, the standard clarified at least three main aspects of the fair value definition and provided additional disclosure and implementation guidance. For example, while much of the pre-SFAS No. 157 literature was consistent regarding the concept of fair value as a current sale price between a willing buyer and a willing seller, it was not clear in application whether exit prices or entry prices were used. SFAS No. 157 provided for a consistent approach by: • Explicitly defining fair value as an exit price concept; • Clarifying the use of market participants’ perspectives (rather than entity-specific
information) and the principal (or most advantageous) market to further define the market price; and
247 See SFAS No. 157, Summary and paragraph C4. 248 See SFAS No. 157 (as amended by FSP FAS 157-1, Application of FASB Statement No. 157 to FASB Statement No. 13 and Other Accounting Pronouncements That Address Fair Value Measurements for Purposes of Lease Classification or Measurement under Statement 13), Appendix D, which lists 59 previously issued APB and FASB pronouncements that refer to fair value, of which 27 were amended by SFAS No. 157, as outlined in SFAS No. 157, Appendix E. 249 See CIFiR Final Report, at page 19. 250 CIFiR Final Report, at page 27. 251 See CIFiR Final Report, at pages 27-28.

171
• Introducing a fair value hierarchy that differentiated between Level 2 and Level 3 inputs. While prior standards indicated a clear preference for observable market prices for identical assets or liabilities over both the prices of other similar assets or liabilities and model-based estimates, prior standards did not provide clear, uniform guidance on the relationship between prices of similar items and model estimates or that the valuation techniques used to measure fair value should maximize the use of observable inputs and minimize the use of unobservable inputs.252 Also absent from the prior standards were the uniform disclosure requirements (particularly for Level 3 estimates), the implementation guidance provided in Appendix A of SFAS No. 157 (which provides numerous examples of measurement applications and disclosures), and Appendix B of SFAS No. 157 (which provides additional clarification on the application of the present value techniques discussed in SFAC No. 7). However, there have been criticisms and concerns about how successful SFAS No. 157 was in applying a consistent measurement framework.253 For example, although SFAS No. 157 defines fair value in terms of exit values, some have suggested that several examples in the application guidance instead employ entry values or value-in-use. Further, although SFAS No. 157 excludes transaction costs from fair value estimates, some have suggested that examples often include transaction costs. To the extent that such inconsistencies exist, some level of incomparability in fair value estimation could remain. Such concerns, however, do not necessarily suggest that SFAS No. 157 should be suspended. A suspension of SFAS No. 157 would effectively remove the measurement and disclosure guidance (the common instruction manual) without removing the requirement (or, under some circumstances, the option) to apply fair value measurement embedded in numerous other standards. Such a suspension would be akin to a move from an objectives-based standard to a principles-only standard. That is, as other pre-existing standards require (or in some cases permit) the use of fair value, the elimination of SFAS No. 157 would not reduce fair value accounting requirements. Rather, it would result in less guidance related to how to comply with existing standards. The Staff has previously noted that a principles-only approach would often lack the guidance needed to reliably operationalize a principle, with a significant loss of comparability among reporting entities as a potential result.254 Instead, such concerns suggest that it is advisable to review the application of SFAS No. 157, including guidance provided in Appendix A of SFAS No. 157, to ensure that the application of the standard is consistent with the concepts of fair value in the standard. Further, as noted in Section VII.A, the need for additional implementation guidance has been recognized by both Boards, particularly in the area of determining fair value in inactive markets. Both Boards also have already begun to provide such guidance.
252 See SFAS No. 157, paragraph 21. 253 See, e.g., George J. Benston, The Shortcomings of Fair-Value Accounting Described in SFAS 157, 27 Journal of Accounting and Public Policy 2 (2008), 101–114. 254 See, e.g., Principles-Based Accounting Study, Section I.C.

172
In contrast, rather than suspending the disclosure guidance, some have suggested that additional disclosure would be appropriate, such as the assumptions used to arrive at Level 3 estimates and the sensitivities of Level 3 valuations to variations in these assumptions.255 Similarly, as noted in Section VII.A, the Division of Corporation Finance in March and September 2008 issued “Dear CFO” letters. These letters cover common themes in comment letters from the Division of Corporation Finance to registrants and identify current disclosure issues, including calling for additional disclosures regarding Level 3 estimates such as a discussion of how sensitive the fair value estimates for material assets or liabilities are to the significant inputs used in the valuation technique or model.256 Although companies did respond by enhancing some disclosures, the call for additional voluntary disclosure of sensitivity analyses has generally not been answered.257 The voluntary nature of the additional disclosures may have contributed to the lack of response. In particular, the desire to avoid the costs of potential litigation arising from inaccurate disclosure may reduce managers’ incentive to provide such additional disclosures on a voluntary basis, even where such additional disclosures would produce net benefits to the capital markets.
B. Recent Proposals Regarding Measurement Attributes From the various recent public dialogues over fair value accounting, one area of concern appears to be a possible lack of understanding surrounding the concept of “fair value” and its application in the accounting literature. For example, in addition to a misconception among some that SFAS No. 157 itself requires fair value accounting, other misconceptions are that the requirements in SFAS No. 157 apply only to instances where a market price cannot be determined, or that SFAS No. 157 requires preparers to use observable prices in inactive or disorderly markets, neither of which is accurate. SFAS No. 157 assigns the highest priority within the fair value hierarchy to quoted prices in active markets for identical assets or liabilities (i.e., Level 1), with multiple permissible valuation techniques (consistent with a market approach, income approach, or cost approach).258 Further, as discussed in Section VII.A, recent clarifications from the SEC’s Office of the Chief Accountant and the FASB, as well as guidance from the FASB and the IASB, have helped to provide additional clarity on the measurement of the fair value of a financial asset in inactive markets. Nevertheless, specific suggestions for alternate measurement methods have received recent attention in popular debate, including returning to a cost-based measurement method for particular financial instruments, using a “rolling average” of fair values, and using “fundamental value” methods.259 It appears likely that many of the recent calls from credible and experienced 255 See Stephen G. Ryan, Fair Value Accounting: Understanding the Issues Raised by the Credit Crunch (White Paper) Council of Institutional Investors (2008). 256 For the March 2008 letter, see http://www.sec.gov/divisions/corpfin/guidance/fairvalueltr0308.htm; for the September 2008 letter, see http://www.sec.gov/divisions/corpfin/guidance/fairvalueltr0908.htm. 257 See, e.g., Stephanie Hunsaker, Associate Chief Accountant, Division of Corporation Finance, SEC, Remarks Before the 2008 AICPA National Conference on Current SEC and PCAOB Developments, (December 9, 2008). 258 See SFAS No. 157, paragraph 18. 259 On cost-based variations, see letters from, e.g., Fischer, Cross (October 6 and October 17, 2008), Gorton, Isaac, and Vetter. On rolling average, see, e.g., Newt Gingrich, Commentary: Suspend Mark-to-Market Now!, September 29, 2008, Forbes.com, (available at http://www.forbes.com/opinions/2008/09/29/mark-to-market-oped-cx_ng_0929gingrich.html) and Thomas Seeberg, Michael Starkie & Carsten Zielke, Fair Value Move Could Break
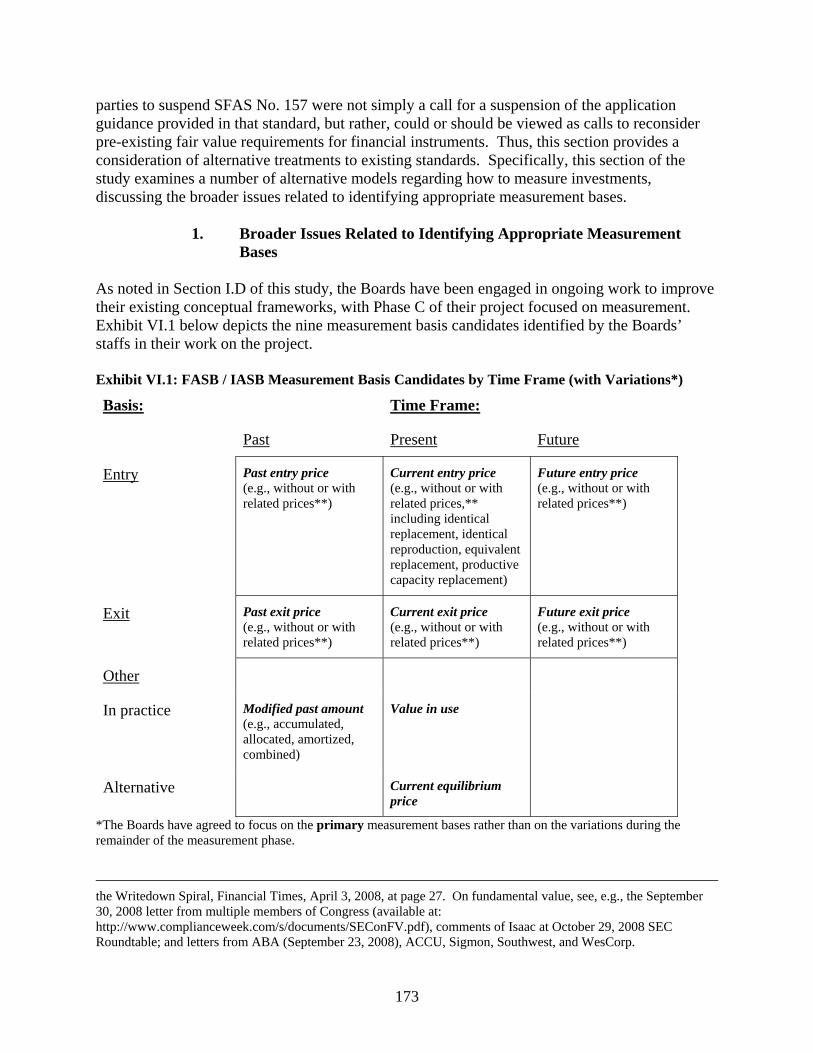
173
parties to suspend SFAS No. 157 were not simply a call for a suspension of the application guidance provided in that standard, but rather, could or should be viewed as calls to reconsider pre-existing fair value requirements for financial instruments. Thus, this section provides a consideration of alternative treatments to existing standards. Specifically, this section of the study examines a number of alternative models regarding how to measure investments, discussing the broader issues related to identifying appropriate measurement bases.
1. Broader Issues Related to Identifying Appropriate Measurement Bases
As noted in Section I.D of this study, the Boards have been engaged in ongoing work to improve their existing conceptual frameworks, with Phase C of their project focused on measurement. Exhibit VI.1 below depicts the nine measurement basis candidates identified by the Boards’ staffs in their work on the project. Exhibit VI.1: FASB / IASB Measurement Basis Candidates by Time Frame (with Variations*)
Basis: Time Frame:
Past Present Future
Entry Past entry price (e.g., without or with related prices**)
Current entry price (e.g., without or with related prices,** including identical replacement, identical reproduction, equivalent replacement, productive capacity replacement)
Future entry price (e.g., without or with related prices**)
Exit Past exit price (e.g., without or with related prices**)
Current exit price (e.g., without or with related prices**)
Future exit price (e.g., without or with related prices**)
Other
In practice Modified past amount (e.g., accumulated, allocated, amortized, combined)
Value in use
Alternative Current equilibrium price
*The Boards have agreed to focus on the primary measurement bases rather than on the variations during the remainder of the measurement phase.
the Writedown Spiral, Financial Times, April 3, 2008, at page 27. On fundamental value, see, e.g., the September 30, 2008 letter from multiple members of Congress (available at: http://www.complianceweek.com/s/documents/SEConFV.pdf), comments of Isaac at October 29, 2008 SEC Roundtable; and letters from ABA (September 23, 2008), ACCU, Sigmon, Southwest, and WesCorp.

174
**Related prices refer to acquisition- or incurrence-related goods or services (e.g., sales tax or VAT, delivery or shipping charges, brokerage fees, and underwriting costs). The Staff notes that the terms “historical cost” and “fair value” are noticeably absent from the list of measurement bases. The stated reason by the Boards for their absence is that there is little common understanding of these terms. The same general term can refer to a number of different bases (as well as to a number of potential application decisions within a measurement basis), with the speaker or the listener being potentially unaware of the need to distinguish among the different meanings. Accordingly, the use of the terms can lead to miscommunication and misunderstanding.260 In the list of measurement basis candidates, the general concept of “historical cost” is represented by measurements relating to the past (past entry price, past exit price, and modified past amount). Similarly, the general concept of “fair value” is represented by measurements relating to the present (current entry price, current exit price, current equilibrium price, and value in use). The list also includes measurement bases relating to the future (future entry price, future exit price). However, because such future values generally have not been suggested as part of the current debates over fair value, the Staff omits them from further discussion in this study. Fair value as implemented in SFAS No. 157 is best described as a current exit price at the measurement date. The FASB concluded that an exit price objective is appropriate because it embodies current expectations about the future inflows associated with the asset and the future outflows associated with the liability from the perspective of market participants.261 The IASB’s Discussion Paper on Fair Value Measurements identifies the explicit definition of fair value as an exit (selling) price as one of the key differences between SFAS No. 157 and fair value under IFRS, which does not explicitly define fair value as either an exit price or an entry (buying) price.262 Many respondents to the Fair Value Measurements Discussion Paper considered “fair value” to be a family of measurement bases, and as such recommended replacing the term “fair value” with more descriptive terms such as “current exit price” and “current entry price.”263
260 See Milestone I Summary Report. Some have also objected to the emotive use of the term “fair” value. See, e.g., comments of Isaac at October 29, 2008 SEC Roundtable. 261 The Basis for Conclusions in SFAS No. 157 notes (in paragraph C26) that the emphasis on inflows and outflows is consistent with the definitions of assets and liabilities in SFAC No. 6, but does not include any further discussion of the alternative bases explored. One criticism of fair value as implemented in SFAS No. 157 is that the application of a current exit value may be inappropriate when a company expects to continue its operations as an ongoing entity. This criticism is discussed further in Section VI.B.2.a. 262 See Fair Value Discussion Paper, paragraph 10. Paragraph 5 of SFAS No. 157 defines fair value as “the price that would be received to sell an asset or paid to transfer a liability in an orderly transaction between market participants at the measurement date.” As generally defined in IFRS, fair value is “the amount for which an asset could be exchanged, or a liability settled, between knowledgeable, willing parties in an arm’s length transaction.” However, slight variations exist across different IFRS in the precise wording used to describe fair value. 263 In the comment letters received by the IASB on the Fair Value Discussion Paper, many respondents also believed that the objectives of financial reporting need to be determined before commenting on whether an exit or an entry price is most appropriate. (IASB staff, Information for Observers, Board Meeting, October 17, 2007, Fair Value Measurement, Staff Analysis of Comment Letters (Agenda Paper 2C). See paragraphs 9, 14, and 19.) Nearly half of the respondents believe the fair value measurement project should not be completed before the completion of the conceptual framework project.
175
The Staff therefore applies two approaches in its analysis of measurement bases. First, the Staff focuses on the time orientation (i.e., comparing the concepts of past versus current values). Second, the Staff discusses measurement methods within time orientations.
a. Past versus Current Values Putting aside application issues associated with measurement, a pure historical cost accounting model would report a balance sheet with entirely past values, whereas a pure fair value accounting model would report a balance sheet with entirely current values.264 In contrast, U.S. GAAP and IFRS currently employ a mixed-attribute model, in which some items are measured at historical cost (or cost-based variations) and some items are measured at current values.265 Both pure models could serve to communicate information regarding company value to shareholders, albeit in somewhat different ways. Both pure models also face implementation issues. Under a pure fair value accounting model, the balance sheet would become the primary vehicle for conveying information about company current value to shareholders. This approach would appear consistent with the stated objectives of financial reporting discussed in SFAC No. 1, which is to “provide information about the economic resources of an enterprise, the claims to those resources (obligations of the enterprise to transfer resources to other entities and owners’ equity), and the effects of transactions, events, and circumstances that change resources and claims to those resources.”266 Income would, under a pure fair value approach, represent “economic income,” capturing the changes in the current balance sheet values. Implementation challenges under a pure fair value accounting model center around obtaining appropriate current values for the balance sheet items, including multiple valuation and judgment issues, particularly for long-lived assets where a market may not exist or a sale was not expected, such as property, plant, or equipment. Under a pure historical cost accounting model, the income statement would be a more primary vehicle for conveying information about “realized” income to shareholders. Income would not represent shareholders’ “economic income,” but rather the value added by buying inputs from suppliers, transforming them according to the company’s business model, and selling the resulting outputs to customers. Income would not represent “the (present) value of expected outcomes from the business plan [but rather], it [would] report on progress that has been made in executing the plan.”267 The balance sheet would not necessarily be a statement of values, but
264 See Stephen H. Penman, 37 Accounting and Business Research (Special Issue: International Accounting Policy Forum) (2007), at 33-44. 265 Many policy analyses of fair value seem to assume a “full fair value” approach. See, e.g., Treasury 1991 Bank Report; European Central Bank 2004. However, see International Monetary Fund, Global Financial Stability Report (October 2008) (“IMF GFSR”) (available at: http://www.imf.org/external/pubs/ft/gfsr/2008/02/index.htm) for a possible exception. As described in Section I.B and as documented in Section II.B, this is not the current system under U.S. GAAP. 266 SFAC No. 1, paragraph 40. 267 Stephen H. Penman, 37 Accounting and Business Research (Special Issue: International Accounting Policy Forum) (2007), at 36-37.

176
rather a by-product of a matching process between revenues (realized income) with expenses. Implementation challenges for valuation under a pure historical cost accounting system center around appropriate matching, forecasting, and estimation of a required rate of return (to discount future income). Within the accounting standards, multiple judgment issues would also exist (e.g., revenue recognition, accruals and deferrals, and allocations). With respect to financial institutions, for example, a critical estimate would be for their loan loss reserves. As noted, both models would serve to communicate information regarding a company to shareholders, albeit in different ways. A pure fair value approach may be viewed by some as focused on the balance sheet, whereas a pure historical cost approach is focused on matching historical costs with realized income in the income statement. This basic difference in approach contributes to an often-cited concern about fair value: that there is an inconsistency between the fair value accounting model and a typical company’s business model as an ongoing entity.268 There is also a perceived conflict between the company as a going concern and the need to capture current values for assets and liabilities using an exit price in particular. The difference in approach likely contributes to the persistence of the mixed-attribute model in both U.S. GAAP and IFRS. The use of mixed-attribute accounting can be viewed as consistent with the belief that “fair value is not appropriate when there is a top-line notion of a customer from whom value is received in an exit price, with value added over an input price” but “is appropriate when value comes from property rights and obligations, and value is added or lost (solely) from fluctuations in the market values of those rights and obligations.”269 This is, for example, one rationale for mark-to-market accounting requirements for derivatives and trading assets of financial institutions. Additional concerns also may exist to the extent that current values of individual assets and liabilities do not capture the synergies involved when those assets and liabilities are used in combination in the company’s ongoing operations.270 This difference in approach is a fundamental issue faced in accounting standard-setting. Accounting standard-setters appear to have determined their conceptual preference, with the FASB’s SFAC No. 6 and the IASB’s Framework for the Preparation and Presentation of
268 See, generally, discussion at October 29, 2008 SEC Roundtable. See also, e.g., letters from ACLI, Central (October 27, 2008), Cox, Roundtable, MBA, Smith, and Varley. Some might interpret this as a need to clarify the role of stewardship as an objective of financial reporting. (See, e.g., paragraph 32 in Summary Report of the Conceptual Framework Measurement Roundtables, Hong Kong, London, and Norwalk, January and February 2007). However, others might argue that both the pure fair value and the pure historical cost approaches can assist in the evaluation of management’s stewardship role, with the economic income provided by a pure fair value approach reporting the total value added for shareholders. See Stephen H. Penman, 37 Accounting and Business Research (Special Issue: International Accounting Policy Forum) (2007), at 33-44. 269 Stephen H. Penman, 37 Accounting and Business Research (Special Issue: International Accounting Policy Forum) (2007), at 39. Penman also notes in footnote 11 that “[t]he perspective is similar to that under Coase’s transactions cost theory of the firm. Firms exist because markets are not perfect and thus prices do not measure value under all conditions. Firms and their hierarchies are more efficient than markets in some respect, entrepreneurs exploit those efficiencies, and historical cost accounting reports the efficiency of firms in dealing with imperfect prices.” 270 Such concerns would also exist with the measurement of assets and liabilities at historical cost, but may be alleviated to some extent because the balance sheet under a pure historical cost system does not purport to capture the underlying value of the entity.

177
Financial Statements both implying that the balance sheet is primary. Both conceptual statements define assets and liabilities with respect to economic resources, whereas revenues and expenses tend to be defined with respect to changes in assets and liabilities. The continued use of current (fair) values is consistent with this conceptual preference,271 but to the extent that interested parties (e.g., users, preparers, or auditors) disagree,272 there will likely continue to be ongoing dissent as to the continued use of current values in financial reporting.
b. Measurement Methods Within Past or Current Values “Fair value” as implemented in SFAS No. 157 is best described as a current exit price at the measurement date. As it relates to accounting for investments of financial instruments, alternative current values could be implemented, including a current entry price (e.g., replacement value), a current equilibrium price (e.g., in a hypothetical arm’s-length transaction conducted in an efficient, complete, and perfect market), and a current value-in-use (e.g., based on discounted expected future cash flows, sometimes referred to as ‘fundamental value’ or ‘intrinsic value’). Some have noted a potential conflict between measuring value through current exit prices (as in SFAS No. 157) and the expectation that the reporting entity will continue its operations as a going concern. However, the alternative current values are not independent of one another. For example, the current exit price of an asset is the price that an entity would receive currently in exchange for selling its asset, but that transaction has a counterparty (albeit hypothetical) that is paying an amount in exchange for purchasing the asset (i.e., current entry price).273 Similarly, in considering the values bid or asked when buying or selling an asset, rational decision-makers should theoretically each be estimating the discounted expected future cash flows associated with the asset in question. Although differences in values may exist due to the competitive advantages of one party over another in using the related economic resources (and
271 For example, in SFAS No. 157, the FASB concluded that a current exit price objective for measuring fair value is appropriate because it embodies current expectations about the future inflows associated with the asset and the future outflows associated with the liability from the perspective of market participants (see prior footnotes). The IASB continues to support the use of fair value (in some variation) because “fair value seems to be the only measure that is appropriate for all types of financial instruments.” IASB Discussion Paper, Reducing Complexity in Reporting Financial Instruments (March 19, 2008). 272 For example, user-respondents appear to support the use of fair value for all financial instruments, whereas preparer and auditors tended not to support the use of fair value for all financial instruments, in part because of concerns about the appropriateness of fair value when the financial instruments were not held for trading purposes or managed on a fair-value basis. See Boards’ joint meeting, Education Session Handout for papers 8 and 8A: Accounting for Hedging Activities & Reducing Complexity in Reporting Financial Instruments, paragraph 8-9 (October 21, 2008). (available at: http://www.iasb.org/NR/rdonlyres/89672D67-1C26-4C8C-AEC1-88E33F2059AB/0/FI0810jointb08handoutobs.pdf) 273 Differences may exist in the related transaction costs for entry versus exit, and differences may also exist if the asset is reproduced (rather than purchased), if the asset is equivalent (but not identical), or if the productive capacity of the asset is replaced (rather than the asset itself). Nevertheless, the underlying economic values remain related to one another. Others have also noted that while entry prices and exit prices may differ, the transaction price will often equal the exit price and, therefore, represent the fair value of the asset or liability at its initial recognition. See SFAS No. 157, paragraphs 16 and 17.
178
due to genuine differences of opinion), at least in theory, the current exit, entry, equilibrium, and value-in-use estimates should remain associated with one another,274 and each would therefore likely face similar implementation concerns. For example, implementation of an equilibrium price concept would require companies and auditors to determine the price of an asset in a hypothetically “perfect” market, thus introducing the need for management to determine the extent to which current markets result in inefficient prices. In contrast, “historical cost” is often thought of as a past entry price, the price that an entity paid in exchange for purchasing an asset or was paid in exchange for incurring a liability as part of a past transaction. However, historical cost also faces measurement difficulties and uncertainties. Necessary judgments, include, for example, whether the recorded balance sheet values should capture prices paid for acquisition-related goods or services (e.g., sales tax, delivery and installation charges, broker commissions, underwriting costs, late fees), what should happen if the transactions occur over multiple periods of time, how to allocate a single transaction price to multiple individual assets and liabilities, how to assign some of the price to subsequent accounting periods (according to an accounting rule for amortization or depreciation), and what to do in circumstances when either a temporary or other-than-temporary change (e.g., an impairment) in value may have occurred.275 In practice, historical cost is not a pure past entry price, but variations on past entry prices adjusted by the application rules, conventions, and judgments for a number of potential events. Further, in practice, historical cost standards have, for decades, included various requirements to write down an asset where current value exceeds the historical cost measure. Thus, historic cost measures tend to result in a requirement to account for assets on a lower-of-cost-or-fair-value basis.
2. Concepts and Themes Underlying Recent Proposals The prior subsection summarized the possible measurement bases identified in the measurement phase of the Boards’ joint conceptual framework project, comparing and contrasting these measurements bases with “fair value” as defined in SFAS No. 157. This subsection addresses the concepts and themes underlying specific recent suggestions of alternatives to fair value as a measurement basis.
274 Under ideal market conditions, the entry price, exit price, and value-in-use of financial instruments should be identical. Specifically, the entry and exit prices should be identical if a financial instrument trades in perfect or frictionless markets (i.e., where there are zero transaction costs and deep liquidity). To the extent that ideal market conditions do not prevail and market frictions exist (e.g., with only a very small number of market participants who may behave strategically), entry and exit prices can diverge. See Guillaume Plantin, Haresh Sapra & Hyun Shin, Marking-to-Market: Panacea or Pandora’s Box?, 46 Journal of Accounting Research 2 (2008), at 435-460. Similarly, if the value to shareholders of a financial instrument is derived solely from the instrument itself, the value-in-use of the financial instrument should again be identical to the exit and entry price under ideal market conditions. However, to the extent that the value to shareholders from holding a financial instrument is derived from some other source (e.g., from hedging an underlying economic exposure or from an embedded intangible asset like “core deposit intangibles”), then value-in-use may deviate from exit and entry prices. See Stephen H. Penman, 37 Accounting and Business Research (Special Issue: International Accounting Policy Forum) (2007), at 33-44. See also, e.g., Treasury 1991 Bank Report at XI-18 and FASB Meeting Handout, Conceptual Framework, November 5, 2008, paragraph 5 (and paragraph 10 for discussion of when such optimal conditions might exist). 275 See additional discussion of OTTI in Section VII.A.
179
As noted above, recent suggestions have included recommendations to measure particular financial instruments at cost (or to use cost as a basis in the absence of quoted prices or where markets are illiquid), using a “rolling average” of fair values (rather than “current” fair values), or using “fundamental value” methods. Such suggestions vary around two main themes: (1) eliminate fair value measurement for some or all assets and liabilities, and (2) modify (or, in some proposals, eliminate) what is considered to be a current value measure to adjust for certain market conditions. Both themes relate to the broader question of an appropriate measurement basis.
a. Theme 1 – Modify Fair Value (For Example, Return to Historical Cost)
Challenges to fair value accounting have generally centered on four main concerns,276 as discussed below. First, that fair value accounting is potentially unreliable in the absence of quoted market prices, resulting in a reduction of comparability and reliability of financial statements.277 As discussed in Section IV, input received during the course of this study and the results of a large number of academic studies support the view that fair value information is useful to investors. However, some of these studies also provide evidence consistent with fair value estimates based on actively-traded markets being more reliably associated with share prices than fair value estimates based on illiquid markets or internal model estimates. More recently, academic research has examined the incremental value relevance of the fair value hierarchy levels under SFAS No. 157 using data from the first quarter to the third quarter of 2007,278 with results suggesting that disclosures under Level 1 and 2 of the fair value hierarchy (i.e., reflecting quoted prices in active markets for the identical asset or liability, and other observable inputs for the asset or liability, respectively) are value relevant to equity investors, while disclosures under Level 3 of the fair value hierarchy (i.e., reflecting unobservable inputs) are less value relevant.279
276 An additional potential concern has been suggested regarding whether the imposition of particular accounting requirements can affect economic decision-making (e.g., whether the imposition of fair value accounting may cause unforeseen negative consequences on economic decision-making, such as whether to enter into a business combination). See, e.g., comments of Maimbourg with respect to SFAS No. FAS 141R at the October 29, 2008 SEC Roundtable and letter from ABA (November 13, 2008). However, it has also been suggested that valuations of acquired assets (such as core deposit intangibles for depository institutions) are routinely undertaken when performing due diligence for prospective mergers and acquisitions. See, e.g., Treasury 1991 Bank Report at XI-17. 277 See, e.g., letters from ABA (September 23, 2008), ACCU, Roundtable, Tchingambu, Southwest, and WesCorp. 278 See Song, et al. 279 Data limitations can affect the ability to generalize from this research in several ways. For example, because SFAS No. 157 is effective for fiscal years beginning after November 15, 2007 (i.e., 2008 for firms with a calendar year end), the data from the first to third quarters of 2007 that is examined by Song, et al. is necessarily limited to the small sample (n=167) of companies that chose to adopt the standard early and therefore may not provide representative results for companies in general. As of December 1, 2008, the Staff has been unable to find any publicly available research based on data drawn from the current global economic crisis with the exception of Song, et al. However, as a draft manuscript, Song, et al. will be subject to revision as the manuscript proceeds through the publication peer-review process. While the current results of Song, et al. suggest that fair value information continued to be value relevant to investors during the current crisis, this issue could benefit from further study. As
180
Overall, while concerns exist regarding the reliability of fair value estimates under some conditions, research suggests investors view fair value information as relevant.280 Concerns over the estimates’ reliability generally do not appear to have prevented fair value estimates from being useful to investors, although supplemental disclosures may provide additional helpful information, especially in the case of Level 3 fair value estimates, as previously discussed. Whether investors view such supplemental fair value disclosures as being incrementally useful may still depend on investors’ level of comfort with respect to the reliability of the inputs to Level 3 fair value estimates.281 Concerns regarding comparability are often raised in the context of fair value accounting in the absence of quoted prices. However, others point out that historic cost accounting results in the potential for an even greater lack of comparability, as assets are valued based upon differing purchase prices, resulting in identical individual assets with different assigned values. Second, that fair value accounting will increase volatility in reported income.282 A number of academic studies have examined this issue as it relates to the impact of fair value accounting on banks. For example, using information on fair value disclosures, one study estimated banks’ income and regulatory capital using a computed proxy for full fair value accounting for investment securities, and found that the volatility of both banks’ income and regulatory capital is higher under fair value accounting.283 Another recent study examined the difference in the volatility of reported U.S. GAAP net income, reported U.S. GAAP comprehensive income, and a computed proxy for full fair value income for a sample of commercial banks.284 The full fair value proxy estimates what income would have been had fair value been applied even to financial instruments that are not otherwise measured at fair value in the published financial statements (e.g., items such as HTM investments are adjusted to be at fair value), with all unrealized fair value gains and losses taken into income. This study found that income volatility under the full fair value proxy is more than three times higher than the reported of December 1, 2008, the Staff has also been unable to find any publicly available research examining the potential change in the relative usefulness of Levels 1, 2, and 3 disclosures to investors during the global economic crisis. 280 See Section IV.E for a discussion of available academic studies addressing the impact of fair value accounting on the quality of information available to the investor; Stephen G. Ryan, Fair Value Accounting: Understanding the Issues Raised by the Credit Crunch (White Paper) Council of Institutional Investors; Stephen G. Ryan, Accounting in and for the Subprime Crisis, The Accounting Review, (Forthcoming) (2008); and Section IV.B discussion of SEC Roundtables. 281 Because of potential concerns over management biases, for example, Karl A. Muller, III. & Edward J. Riedl, External Monitoring of Property Appraisal Estimates and Information Asymmetry, 40 Journal of Accounting Research 3 (2002), at 865–881, find evidence for U.K. property firms consistent with investors viewing asset revaluation estimates based on external appraisals as more reliable than managerial estimates. 282 See, e.g., Mary E. Barth, Wayne R. Landsman & James M. Wahlen, Fair Value Accounting: Effects on Banks’ Earnings Volatility, Regulatory Capital, and Value of Contractual Cash Flows, 19 Journal of Banking and Finance 3−4 (1995), at 577-605. 283 See Ibid. 284 See Leslie D. Hodder, Patrick E. Hopkins & James M. Wahlen, Risk-relevance of Fair-Value Income Measures for Commercial Banks, 81 The Accounting Review 2 (2007), at 337-375.
181
volatility of then-current U.S. GAAP comprehensive income, and more than five times higher than the reported volatility of then-current U.S. GAAP net income. However, this study also found that the incremental volatility of income under the full fair value proxy (i.e., beyond volatility in net income and comprehensive income) is associated with various measures of market risk (namely, the volatility of stock returns, the sensitivity of stock returns to changes in the overall market, and the sensitivity of stock returns to changes in long-term interest rates), suggesting that the increased income volatility under the full fair value proxy reflects underlying economic risks. Third, that there is an inconsistency between measuring assets and liabilities at current values (especially at a current exit value) when it is expected that a company will continue its operations as an ongoing entity.285 For banks and insurance companies in particular, there is a concern regarding whether there is an inconsistency between the application of the fair value accounting model and their business model for particular assets and liabilities – for example, whether fair values bear sufficient relationship to contracted future cash flows when the investments are intended to be HTM, and whether fair value principles reflect properly the way in which banks manage their core business.286 Some have noted that, despite management’s intent, it remains management’s responsibility to assess the most productive uses of the company’s resources on a continuing basis, with the current market price representing the actual opportunity to convert an investment into cash to be used for other purposes.287 As previously discussed in Section VI.B.1.a, however, the relative emphasis on the balance sheet versus the income statement (and the resulting basic difference in approach) appears to be a fundamental question to be resolved in accounting standard-setting (leading to the mixed-attribute models inherent in both U.S. GAAP and IFRS). Disagreements surrounding the continued use of current values in financial reporting may be alleviated if accounting standard-setters are able to explicitly address the issues around the relative emphasis on the balance sheet versus the income statement. Such concerns are also consistent with CIFiR’s suggestion of judiciousness in requiring fair value measurement in additional circumstances until the FASB completes its measurement framework, as previously discussed. 285 See, e.g., letters from ACLI (October 30, 2008), Central (October 27, 2008), Cox, Roundtable, MBA, Smith, and Varley. 286 For example, the American Bankers Association notes on its website: “The ABA has strongly opposed fair value accounting for many years. Our position is that: fair value is appropriate for trading activities or if an institution is managed on a fair value basis; fair value is not the most relevant measurement for most financial institutions, since we are not managed on a fair value basis; fair value will actually mislead users of banks’ financial statements; it would be more appropriate for the FASB to study fair value accounting, determine whether fair value disclosures are being used and how they might be improved.” (available at: http://www.aba.com/Industry+Issues/GR_FASB_PUB.htm) See also comments of Isaac at October 29, 2008 SEC Roundtable. 287 See Treasury 1991 Bank Report at IX-10. The Treasury report also notes that:
Banking and thrift regulatory agencies recognize that prudential asset/liability management techniques may require the selling of investment securities prior to maturity as part of an overall business plan or to effectively manage liquidity and interest rate risk. Under these circumstances, the meaning of ‘intent and ability to hold to maturity’ is ambiguous, and the prospect that financial instruments are frequently sold prior to maturity substantially limits the usefulness of this concept.
182
Fourth, that fair value understates the “true economic value” of financial instruments when markets are depressed, leading to concerns regarding fair value accounting resulting in “pro-cyclicality.”288 For purposes of this study, the Staff refers to the term “pro-cyclicality” generally to mean the amplification of otherwise normal cyclical business fluctuations. In this context, the concern is that reinforcement mechanisms may operate through the financial system to intensify existing cyclical business fluctuations and, in turn, cause or exacerbate financial instability. Significant concerns have been raised that fair value accounting can induce a pro-cyclical downward pressure in asset prices, leading security prices and asset values to fall considerably below what some believe is their true “fundamental value.” Further, concerns have been expressed about the fact that, in order to offset the write-downs caused by the fair value accounting for their investment securities, financial institutions may have been compelled to sell securities in illiquid markets (despite the institutions’ original intentions to hold those assets until maturity or recovery) or raise capital in a challenging environment. In illiquid or distressed markets, these forced sales may further weaken the market for the securities and reduce the resulting price for the observed trades, compelling additional sales to raise capital. In such markets, otherwise non-distressed sellers would prefer to stay out of the market, leaving the market price to be determined based on forced sales, thus continuing to reduce prices and inhibiting other non-distressed sellers from entering the market. Some also hold the view that, in such markets, the unrealized losses recorded due to fair value accounting may create a loss of confidence in investors and analysts, adding uncertainty and a further decline to the market. In other words, “headline risks” from disclosure of “bad news” itself influences future behavior. Acknowledging these concerns, researchers have begun to apply mathematical models289 and simulations290 to assess the potential for a pro-cyclical effect of fair value accounting under varying sets of assumptions.291 Many others have, however, expressed the view that the concerns about pro-cyclicality arise from the use of financial reporting results for regulatory capital purposes. Those who express this view point out that regulatory capital standards, not accounting standards, are established to
288 See, e.g., comment letters from ABA, Cox, Etheridge, Roundtable (November 13, 2008), Highland, Isaac, C. Lane, MBA, Schryer, Steinmetz, Tchingambu, and Varley. 289 See, e.g., Franklin Allen & Elena Carletti, Mark-to-Market Accounting and Liquidity Pricing, 45 Journal of Accounting and Economics 2-3 (2008) at 358-378; Guillaume Plantin, Haresh Sapra & Hyun Shin, Marking-to-Market: Panacea or Pandora’s Box?, 46 Journal of Accounting Research 2 (2008), at 435-460; Haresh Sapra, Do Accounting Measurement Regimes Matter? A Discussion of Mark-to-Market Accounting and Liquidity Pricing, 45 Journal of Accounting and Economics 2-3 (2008), at 379-387. 290 See, e.g., IMF GFSR. 291 Although the Staff understands that a number of research projects are currently in progress, the Staff has been unable to find any publicly available research (as of December 1, 2008) that provides large-scale empirical evidence on the potential pro-cyclical effect of fair value accounting. Although there are papers that discuss whether financial institutions’ leverage decisions are pro-cyclical, or the potential existence of bubbles (or occasionally potholes) in market prices, the analyses in such papers generally tend not to be specific to the application of fair value accounting per se.
183
address capital adequacy of financial institutions. Accounting, rather, should provide accurate information for use by investors in capital allocation decisions. The objective of SFAS No. 157 and of existing fair value standards is to provide transparent, unbiased information about value. That is, the objectives of financial reporting as described in SFAC No. 1 “stem primarily from the needs of external users who lack the authority to prescribe the information they want and must rely on information management communicates to them,”292 as opposed to the needs of regulatory or oversight agencies. Specific goals regarding prudential oversight remain largely outside of the recognized purposes of financial reporting. To fulfill its informational role for the investor, financial reporting would generally need to provide neutral and unbiased information.293 In fact, as discussed in Section III.D, for prudential oversight purposes, regulatory capital requirements begin with financial information provided under U.S. GAAP, but are adjusted with the intention of better reflecting the solvency and safety and soundness of the institutions on an ongoing basis.294 Others have articulated the belief that fair value accounting is not the underlying cause of the current global economic crisis. For example, most of the panelists at the July 9 Roundtable indicated that they do not share the view that fair value accounting is pro-cyclical. A number of investors have expressed the view that the application of fair value drew greater attention to the deteriorating condition of certain financial instruments more quickly than historical cost would have.295 Rather, the pro-cyclicality, to the extent it exists, arises from the market effects of deleveraging, which is an economic decision. For example, in addition to record rates of poorly performing assets as a result of the bursting of the housing bubble, a market aversion developed to complex structured products, some of which may have been previously liquid, due to uncertainties about their continued performance and a flight to more conventional high-quality instruments. Further, institutions that were holding assets on an original short term basis with an intent to securitize found their holding duration increased due to the reduced demand for securitized products. Those who hold such views suggest that it is more appropriate to instead look at the underlying economic causes of the global economic crisis (which may include aspects of effective risk management, availability of liquidity, increasing volume of activities in largely unregulated financial instruments, and counter-party confidence).
292 SFAC No. 1, paragraph 28. 293 See SFAC No. 1, paragraph 33. 294 As discussed in Section III.D, the effects of fair value estimates are excluded for purposes of determining regulatory capital under many circumstances. However, losses on assets that are reflected in income and retained earnings under U.S. GAAP are generally recognized in regulatory capital. This implies, for example, that the unrealized gains and losses resulting from the fair value measurement of AFS debt securities (which are included in accumulated OCI) are excluded from regulatory capital, while any OTTI on those securities would not be excluded. OTTI on investments can occur, however, even when the investments are measured at amortized cost (as is the case with, for example, HTM debt securities). 295 See, e.g., letters from CAQ, CII, Credit Suisse, ICAEW, ICGN, ITAC, Markit, NASBA, PwC (October 1, 2008), as well as comments from Evans at the October 29, 2008 SEC Roundtable and Landsman at the November 21, 2008 SEC Roundtable.
184
Even among those who acknowledge potential pro-cyclical effects, some continue to believe that fair value accounting should be maintained.296 The Global Financial Stability Report recently published by the International Monetary Fund observed that, although there are weaknesses to fair value accounting that “may introduce unintended volatility and pro-cyclicality, thus requiring some enhancements, it is still the preferred accounting framework for financial institutions.”297 The report also concluded that “capital buffers, forward-looking provisioning, and more refined disclosures can help to mitigate the procyclicality of [fair value accounting].”298 Summary and discussion Considering the available evidence regarding the usefulness of fair value information to investors, the suspension of fair value to return to or introduce historical cost-based measures would likely increase investor uncertainty and reduce investor confidence. This greater uncertainty would likely adversely impact the values of debt and equity securities. In addition, this greater uncertainty would potentially increase the degree of information asymmetry among market participants, further adversely affecting market liquidity.299 With investors’ already heightened risk aversion and uncertainty, a current move to suspend fair value accounting information would remove useful information from investors at a time when this information continues to be (or may be more) useful to investors.300 In addition, a suspension of fair value accounting would not necessarily relieve companies from periodically considering (and recognizing) impairment losses relative to historic cost. If asset impairment tests were to be considered as part of a suspension of fair value accounting, then the effect would likely be to further increase the uncertainty and information asymmetry faced by investors in the face of known credit impairments. Instead, the emphasis of the accounting should focus on those acute areas where implementation in times of stress, such as inactive or disorderly markets, is challenging. Another approach that has been suggested is, instead of suspending fair value accounting, supplementing fair value measurements with disclosure. Further, because of the subjective nature of some fair value estimates, additional disclosures regarding key inputs and uncertainty could be expanded. For example, supplemental disclosures could be provided regarding the 296 See, e.g., Fair Value has a Friend in Paulson, The Deal.com, July 31, 2008 (available at: http://www.thedeal.com/dealscape/2008/07/fair_value_has_a_friend_in_pau.php) 297 IMF GFSR, Chapter 3 at page 109. 298 Ibid. 299 Prior studies find that firms that provide higher level of disclosure have lower levels of information asymmetry. For example, Stephen Brown, Stephen A. Hillegeist & Kin Lo, Conference Calls and Information Asymmetry, 37 Journal of Accounting and Economics 3 (2004), at 343-366, find that firms which choose to continuously host conference calls experience a significant sustained reduction in the level of information asymmetry in the equity market. Also Stephen Brown & Stephen A. Hillegeist, How Disclosure Quality Affects the Level of Information Asymmetry, 12 Review of Accounting Studies 2/3 (2007), at 443-477. 300 For example, the American Bankers Association clarified that it does “not support an immediate suspension of all forms of fair value, because it would result in confusion for both preparers and investors,” noting that an immediate suspension of all fair value would result in a lack of available accounting guidance (letter from ABA (November 13, 2008)). See also letters from CFA Institute (October 1, 2008) and Joint (November 14, 2008).

185
sensitivity of Level 3 fair value estimates to key model assumptions.301 Alternatively, companies could be required to provide the disclosures that were encouraged by the Division of Corporation Finance’s “Dear CFO” letters. However, by and large, this call for additional voluntary fair value disclosures has not been fully answered. Companies do occasionally provide voluntary disclosures in other settings,302 which raises the question of why companies might be reluctant to voluntarily provide additional information about their Level 2 and 3 fair value disclosures. Litigation risk may be one reason. Prior research suggests that litigation risk affects managers’ voluntary disclosure decisions, and that litigation risk can sometimes reduce managers’ incentive to provide additional disclosures, particularly of forward-looking information.303 This issue would benefit from further study as it specifically relates to voluntarily supplementing the current SFAS No. 157 disclosures. It is also unlikely that the market would continue to view the placement of fair value information in the footnotes and / or voluntary disclosures as equally informative and reliable as the recognized values or the mandatory disclosures that they would be replacing. In other words, “good disclosure doesn’t cure bad accounting.”304 For example, some studies that have directly compared how investors and analysts use recognized versus disclosed fair value information suggest individual market participants (including expert analysts) are more likely to integrate (or perhaps are likely to more fully integrate) the information into their judgments when the changes in fair value are more obvious (e.g., by the recognition and location within the financial statements).305 While some suggest that fair value measurements should be placed in the
301 See, e.g., Stephen G. Ryan, Fair Value Accounting: Understanding the Issues Raised by the Credit Crunch (White Paper) Council of Institutional Investors (2008). Several comment letters also acknowledged the need for improved disclosures surrounding the application of fair value accounting in the absence of liquid markets. See, e.g., letters from ITAC, Joint (November 14, 2008), and Credit Suisse. See comments of Evans at the October 29, 2008 SEC Roundtable for an alternative to recognizing fair values on the face of the financial statements, see letters from Waller and Hodge. 302 For example, some firms voluntarily choose to host a conference call to provide additional useful information to investors (Sarah C. Tasker, Bridging the Information Gap: Quarterly Conference Calls as a Medium for Voluntary Disclosure, 3 Review of Accounting Studies 1/2 (1998), at 137-167.), while some firms choose to voluntarily provide managerial forecasts of upcoming income that are seen to be useful to investors and analysts (Stephen J. Baginski, Edward J. Conrad & John M. Hassell, The Effect of Management Forecast Precision on Equity Pricing and on the Assessment of Uncertainty, 88 The Accounting Review 4 (1993), at 913-927). 303 See Stephen J. Baginski, John M. Hassell & Michael D. Kimbrough, The Effect of Legal Environment on Voluntary Disclosure: Evidence from Management Earnings Forecasts Issued in U.S. and Canadian Markets, 77 The Accounting Review 1 (2002), at 25-50; Paul M. Healy & Krishna G. Palepu, Information Asymmetry, Corporate Disclosure, and the Capital Markets: A Review of the Empirical Disclosure Literature, 31 Journal of Accounting and Economics 1-3 (2001), 405-440; and comments of Ball at the October 29, 2008 SEC Roundtable. 304 See Off-Balance Sheet Report, page 108, which attributes the quote to: Remarks by Michael H. Sutton, Chief Accountant, SEC, to American Institute of Certified Public Accountants 1996 Twenty-Fourth Annual National Conference on Current SEC Developments, December 10, 1996. See also Principles-Based Accounting Study. 305 See, e.g., D. Eric Hirst & Patrick E. Hopkins, Comprehensive Income Reporting and Analysts’ Valuation Judgments, 36 Journal of Accounting Research (Supplement) (1998), at 47-75; D. Eric Hirst, Patrick E. Hopkins & James M. Wahlen, Fair Values, Income Measurement, and Bank Analysts’ Risk and Valuation Judgments, 79 The Accounting Review 2 (2004), at 453-472; and Anwer S. Ahmed, Emre Kilic & Gerald J. Lobo, Does Recognition Versus Disclosure Matter? Evidence from Value-Relevance of Banks’ Recognized and Disclosed Derivative Financial Instruments, 81 The Accounting Review 3 (2006), at 567-588. Other research suggests that, following the

186
footnotes because they are less reliable, some suggest that the choice to disclose (rather than recognize) might also lead to further reductions in reliability.306 Therefore, investor uncertainty could be negatively affected, even if some companies continue to provide fair value disclosures.
b. Theme 2 – Modify What is Considered to be a Current Value Measure
Other recent suggestions have included using “fundamental value” accounting methods307 or using a “rolling average” of fair values rather than “current” fair values.308 In this section, the Staff identifies how variations of these two suggestions appear in current U.S. GAAP in various contexts. The Staff further considers the advisability and feasibility of related modifications to fair value accounting standards in Section VII. For purposes of this study, the Staff considers fundamental value (sometimes referred to as “value-in-use”) of an asset or liability to mean the measurement of an asset or liability based on the estimated future cash flows over its life. Thus, if there is no decline in the expected future cash flows over the life of a financial asset, there would be no decline in the asset’s fundamental value. However, there are challenges associated with the implementation of a fundamental value analysis that could move the concept closer to or further away from fair value under SFAS No. 157. For example, in implementing a fundamental value model based on an estimate of future cash flows, one must consider the rate to use in discounting cash flows. If the rate selected is a current market rate, fundamental value and current value will tend to converge. Further, in determining what cash flow estimates are reasonable, one must address whether cash flows should be based on management’s estimates or the assumption of cash flows implied in the market. To the extent cash flow estimates are based upon market assumptions, fundamental value will tend to converge with fair value. effective date of SFAS No. 130, investors are more likely to treat OCI items as transitory when reported in the statement of changes in equity, rather than in a statement of financial performance. See, e.g., Dennis Chambers, Thomas J. Linsmeier, Catherine Shakespeare & Theodore Sougiannis, An Evaluation of SFAS No. 130 Comprehensive Income Disclosures, 12 Review of Accounting Studies 4 (2007), at 557–593. 306 See Robert Libby, Mark W. Nelson & James E. Hunton, Recognition v. Disclosure, Auditor Tolerance for Misstatement, and the Reliability of Stock-Compensation and Lease Information, 44 Journal of Accounting Research 3 (2006), at 533-560. 307 See, e.g., the September 30, 2008 letter from multiple members of Congress (available at: http://www.complianceweek.com/s/documents/SEConFV.pdf); comments of Isaac at the October 29, 2008 SEC Roundtable; and letters from ABA (September 23, 2008), ACCU, Haslem, New World, Sigmon, Southwest, Tarasuk, and WesCorp. 308 See, e.g., Newt Gingrich, Commentary: Suspend Mark-to-Market Now!, September 29, 2008, Forbes.com, (available at http://www.forbes.com/opinions/2008/09/29/mark-to-market-oped-cx_ng_0929gingrich.html). See also Thomas Seeberg, Michael Starkie & Carsten Zielke, Fair Value Move Could Break the Writedown Spiral, Financial Times, April 3, 2008, at page 27:
Our view is that if assets are measured at fair value as at the reporting date, even if the requirements for a liquid and orderly financial market are no longer met, then this measurement reflects an erratic market price and not fair value. This erratic market price is damaging the economy. In order to escape from this vicious circle, and to remain fundamentally self-sufficient in terms of its financial position, Europe must move away from reporting date-based measurement of the market price and start measuring the average market price over a period.
187
Notwithstanding the stated preference for observable inputs, fair value under SFAS No. 157’s fair value hierarchy is not limited to use of market data to the exclusion of management estimates. Level 3 fair value estimates (sometimes referred to as “mark-to-model”) incorporate the concept of fundamental value and value-in-use, although based on the anticipated assumptions of market participants (i.e., not the company-specific value-in-use). Differences may exist, for example, to the extent that market participants’ expectations of the future cash flows differ from management’s own expectations. Differences may also exist regarding the appropriate discount rate to apply to the estimated future cash flows. For example, the computation of fundamental value for a loan loss impairment under SFAS No. 114 applies the rate of return implicit in the loan at the time of the loan’s origination or acquisition,309 whereas the computation of the Level 3 fair value estimate under SFAS No. 157 could reasonably be expected to change as the rate of return is adjusted for market participants’ changing risk assessments. Further, discussion of the use of management’s internal assumptions in the measurement of fair value, including expected future cash flows, was provided in the joint SEC Staff / FASB staff’s press release310 and FSP FAS 157-3. Basing a measurement on the concept of a “rolling average” of current prices would dampen the impact of value changes by smoothing changes (increases and decreases) into the measure over time. Those who support such a model often stress that values go both up and down over time and volatility in income is reduced. The concept of a rolling average is often applied in technical analysis in finance (albeit to identify trends in movement, not an underlying economic value per se).311 However, if implemented, questions would naturally arise about the appropriate length of the evaluation period, ranging from short periods covering a single day, longer periods covering 200 trading days, and suggestions for even longer periods covering three years.312 Similar concerns regarding the evaluation period appear to have arisen in the application of OTTI in the context of SFAS No. 115, with the corresponding application of judgment. Further, the resulting asset “value” on the balance sheet cannot be characterized as anything other than the average price and, thus, would likely result in a potential reduction in confidence in the usefulness of both income and the balance sheet. In addition, implementing these or other similar suggestions would oblige accounting standard-setters to mandate prescriptive rules when the FASB and SEC Staff (and others) have recognized the benefits of a move towards principles-based or objectives-oriented accounting standards,
309 As described in paragraph 14 of SFAS No. 114, unless the loan’s interest rate varies contractually with subsequent changes in an independent factor (such as an index or rate). 310 See “SEC Office of the Chief Accountant and FASB Staff Clarifications on Fair Value Accounting,” SEC Press Release No. 2008-234 (September 30, 2008). 311 Technical analysis is a series of techniques used to forecast future price movements based on the analysis of past market prices and market volumes using often relatively simple charts and tools, such as trendlines and moving averages. It is thought to be the original form of investment analysis, dating back to the 1800s, and coming into use before sufficient financial disclosures were required to allow for a more fundamental analysis. See, e.g., William Brock, Josef Lakonishok & Blake LeBaron, Simple Technical Trading Rules and the Stochastic Properties of Stock Returns, 47 Journal of Finance 5 (1992), at 1731-1764. 312 See, e.g., Ibid.
188
minimizing exceptions from the standard and avoiding the use of bright-lines.313 That said, the level of misunderstanding and misinterpretation surrounding these issues314 suggests that additional guidance and / or additional educational materials surrounding these issues would be useful.
C. Auditing Standards Issues related to the audit of fair value measurements have, to some extent, been present for many years.315 Notwithstanding the recent releases by the PCAOB,316 some views expressed in comment letters317 and during the public roundtables318 in conjunction with this study suggest that a further look at auditing fair value measurements may be warranted. The Staff understands that the PCAOB has begun standard-setting projects on auditing fair value measurements and disclosures, as well as auditing accounting estimates and using the work of specialists, among other projects.319 The Staff supports and encourages the PCAOB in its ongoing efforts to evaluate whether additional auditing standard-setting in this area is appropriate. Offering detailed recommendations for auditing standards remains outside of the scope of this study. However, the Staff notes, based on the previous discussion regarding the reliability of fair value estimates, that concerns about the verification of those values in audits may exist, particularly with the application of judgment in illiquid markets and / or regarding Level 3 measurements in the fair value hierarchy. Little research directly examines the verification and attestation of fair value measurements. Some researchers have outlined some potential policy considerations that may merit further consideration. First, because auditors generally have less training in valuation, specialists are often required to audit fair value measurements. Firms may need to re-evaluate the existing audit 313 See, e.g., Principles-Based Accounting Study. 314 See prior discussion at the beginning of Section VI.B. 315 See, e.g., Treasury 1991 Bank Report at XI-20-21; and Roger D. Martin, Jay S. Rich & T. Jeffrey Wilks, Auditing Fair Value Measurements: A Synthesis of Relevant Research, 20 Accounting Horizons 3 (2006), at 287–303. 316 Recent releases regarding fair value include: PCAOB Staff Audit Practice Alert No. 2, “Matters Related to Auditing Fair Value Measurements of Financial Instruments and the Use of Specialists” (December 10, 2007); and PCAOB Staff Audit Practice Alert No. 3, “Audit Considerations in the Current Economic Environment” (December 5, 2008). Other relevant auditing guidance includes PCAOB Interim Standard AU Section 328, Auditing Fair Value Measurements and Disclosures.
317 See, e.g., letters from Georgetown, CUNA, Roundtable, and S. Smith. 318 For example, during the July 9, 2008 SEC Roundtable, some preparers and auditors expressed the view that applying the concepts in SFAS No. 157 under current market conditions is challenging, stating that additional interpretive guidance would be helpful on, among other issues, what represents sufficient evidence for an auditor. During the October 29, 2008 SEC Roundtable, some expressed the view that auditors’ preferences for independent information may prevent companies from applying aspects of SFAS No. 157 that would require greater application of judgment. 319 See Thomas Ray, Chief Auditor and Director of Professional Standards, PCAOB, Remarks before the 2008 AICPA National Conference on Current SEC and PCAOB Developments (December 9, 2008). (available at: http://www.pcaob.org/News_and_Events/Events/2008/Speech/12-09_Ray.aspx)

189
team structures and incentives to assess whether the two are compatible with audits requiring increased application of specialized valuation knowledge. Second, the internal controls over fair value measurements may vary markedly from controls over typical exchange transactions, and fair value measurement methods, applications, and controls will likely continue to evolve. Auditors will therefore likely need to expend ongoing effort to update their understanding and to evaluate controls related to these measurements. Finally, auditors need to be aware of the sources of likely errors and biases that might affect preparers’ valuation judgments (such as management incentives and over-confidence in relatively limited information) and their own judgments when auditing valuation judgments (such as the tendency to search for corroborating rather than disconfirming information). These sources of likely errors and biases are not necessarily unique to fair value measurements, but are applicable to other accounting estimates as well; such applications of judgment would include (but not be limited to) impairment judgments, loan loss reserves, and even useful lives for depreciation purposes. As with the application of judgment throughout an audit, auditors would need to identify and test the reasonableness of key assumptions within the valuation process. Judgment is certainly not new to accounting or auditing, with the criteria for making and evaluating judgment having been a topic of discussion for many years.320 However, the use of fair value and the creation of complex financial instruments (as well as changes in the regulation of auditors, and a focus on more objectives-based standards) have extended the bounds of the judgments that investors must rely on and accountants and auditors must make. This is particularly true for Level 3 fair value measurements, where investors may lack confidence in the use of judgment, and preparers may have concerns regarding whether reasonable judgments are respected. In recognition of these concerns (along with the potential lack of agreement in principle on the criteria for evaluating judgments and concern over the increased use of principles-based accounting standards), CIFiR recommended that the SEC should issue a statement of policy articulating how it evaluates the reasonableness of accounting judgments and include factors that it considers when making this evaluation, as well as that the PCAOB should also adopt a similar approach with respect to auditing judgments.321
320 See CIFiR Final Report, at page 88. 321 See CIFiR Final Report, at page 93 (Recommendation 3.5).

190

191
VII. Advisability and Feasibility of Modifications to Fair Value Accounting Standards This section of the study summarizes existing actions taken and underway to address challenges in the application of fair value accounting. This section also provides recommendations on the advisability and feasibility of modifications to fair value accounting requirements. Specifically, this section provides: • An overview of the steps taken to date to address accounting issues in the current market
environment; • A description of current accounting standards projects addressing fair value and its
application in practice; and • Recommendations on the advisability and feasibility of modifications. Overall, as a result of the analyses in the preceding sections of this study, the Staff believes the suspension of fair value accounting (to implement historical cost-based or other alternative valuation measures) is not advisable. The suspension or elimination of current accounting fair value requirements would likely increase investor uncertainty and adversely impact investor confidence by removing access to information at a time when that information is likely most useful to investors. However, as a general principle, it is always advisable and feasible for accounting standards to be reviewed for any needed modifications, enhancements or improvements. The recent economic crisis has highlighted challenges in the application of accounting standards related to fair value and asset impairments. In response, the SEC and the Boards have engaged in extensive consultations with various constituents including investors, preparers, auditors, valuation specialists, and industry groups and have issued additional accounting guidance to assist application. While these important steps have addressed a number of the immediate challenges, the Staff has developed a number of recommendations that should be considered in order to improve accounting guidance for fair value measurements (and related asset impairments guidance). In addition, the global economic crisis has highlighted that our financial markets are becoming increasingly global and interconnected. In considering modifications to U.S. GAAP, coordinated efforts to the extent practicable should be made with the IASB. As noted in Section I.C, the SEC has long recognized that a widely-used single set of high quality globally accepted accounting standards could benefit both the global capital markets and investors. A single set of high quality accounting standards should continue to be the goal of standard-setters and regulators, including when considering modifications to existing accounting standards. Therefore, the FASB and the SEC should continue to work closely with the IASB as well as national and regional securities regulators towards this goal.
192
A. Financial Reporting Responses to Global Economic Crisis In an effort to address the most pressing issues related to the global economic crisis, the SEC, the FASB, and the IASB have taken a number of steps to provide additional guidance and clarification related to fair value accounting to marketplace participants. The following is a summary of the key actions undertaken related to fair value accounting.
1. SEC Division of Corporation Finance “Dear CFO” Letters In March 2008 and September 2008, the SEC’s Division of Corporation Finance issued illustrative letters to financial institutions to alert those institutions to disclosure issues relating to fair value measurements they may wish to consider in preparing their filings.322 The first letter focused on disclosures related to material unobservable inputs utilized by management in developing fair value estimates. The second letter expanded the examples by providing additional recommended disclosures related to financial instruments that are not actively traded. The purpose of the expanded disclosures was to provide investors with clearer and more transparent information regarding fair value measurements, particularly with regard to financial instruments that are not currently actively traded and whose effects have had, or are reasonably likely to have, a material effect on the financial condition or results of operations.
2. SEC / FASB Staff Clarifications on Fair Value Measurements The SEC’s Office of the Chief Accountant (“OCA”) and the FASB staff issued a joint release on September 30, 2008 providing clarifications on fair value accounting.323 Specifically, the guidance provided immediate responses to five frequently encountered challenges regarding fair value measurements in the current environment with the intention to help preparers, auditors, and investors. In addition, the FASB issued FSP FAS 157-3 on October 10, 2008 to provide additional real-time guidance on the measurement of the fair value of a financial asset in inactive markets.
3. IASB Expert Advisory Panel Consistent with recommendations of the Financial Stability Forum in April 2008, the IASB formed an Expert Advisory Panel consisting of preparers, auditors, users and regulators who have practical experience with the valuation of financial instruments in the current market environment. Based on the work of this expert panel, and after an exposure period for public comment, the IASB staff in October issued information and educational guidance for measuring and disclosing fair values.324 In addition, the IASB staff issued an accompanying document
322 See March 2008 letter available at http://www.sec.gov/divisions/corpfin/guidance/fairvalueltr0308.htm and September 2008 letter available at http://www.sec.gov/divisions/corpfin/guidance/fairvalueltr0908.htm. 323 See “SEC Office of the Chief Accountant and FASB Staff Clarifications on Fair Value Accounting” SEC Press Release No. 2008-234 (September 30, 2008). 324 See Measuring and Disclosing the Fair Value of Financial Instruments in Markets that are No Longer Active (IASB Expert Advisory Panel). (available at: http://www.iasb.org/NR/rdonlyres/0E37D59C-1C74-4D61-A984-8FAC61915010/0/IASB_Expert_Advisory_Panel_October_2008.pdf )

193
regarding the use of judgment in measuring fair value when markets become inactive. This shorter document covered four areas of fair value accounting where judgment needs to be applied in the current environment including: using prices from inactive markets, forced transactions, the use of broker quotes and pricing services, and the use of management assumptions.
4. IASB Fair Value Disclosures Also in October, the IASB proposed amendments to require companies applying IFRS to include additional disclosures similar to those already required by SFAS No. 157.325 Specifically, the exposure draft proposes that companies providing disclosures on the measurement of fair value for financial instruments include a three-level fair value hierarchy (similar to the disclosures required in SFAS No. 157). The IASB has proposed these amendments at the request of users of financial statements who have indicated that enhanced disclosures about fair value measurements are necessary, especially in light of the current market conditions. The exposure draft was open to comments until December 15, 2008, and the IASB is evaluating the comments to consider further actions as early as January 2009.
5. IASB Amendments to IAS 39 and IFRS 7 In October 2008, the IASB amended IAS 39, Financial Instruments: Recognition and Measurement, and IFRS 7, Financial Instruments: Disclosures.326 The amendments permit non-derivative financial assets held-for-trading and AFS financial assets to be reclassified in particular situations. The amendments permit an entity to reclassify non-derivative financial assets out of the fair value (through profit or loss) category in particular circumstances. The amendments also permit an entity to transfer from the AFS category to the loans and receivables category a financial asset that would have met the definition of loans and receivables (if the financial asset had not been designated as AFS), if the entity has the intention and ability to hold that financial asset. The IASB noted that the reclassification of securities and loans under U.S. GAAP is available in certain circumstances and that entities applying IFRS did not have that possibility for reclassification. The amendments issued bring IAS 39 more in line with U.S. GAAP, particularly SFAS No. 115 and SFAS No. 65. This amendment was effective retroactively back to July 1, 2008.
6. Other-than-Temporary Impairment On October 14, 2008, the SEC’s OCA, after consultation with and agreement by the FASB staff, provided additional guidance regarding OTTI in the context of perpetual preferred securities.327 325 See IASB Exposure Draft, Improving Disclosures about Financial Instruments (proposed amendment to IFRS 7). The exposure draft comment period ended on December 15, 2008. 326 See “IASB amendments permit reclassification of financial instruments,” IASB Press Release (October 13, 2008). (available at: http://www.iasb.org/News/Press+Releases/IASB+amendments+permit+reclassification+of+financial+instruments.htm) 327 See letter dated October 14, 2008, from Conrad Hewitt, Chief Accountant, SEC, to Robert H. Herz, Chairman, FASB. (available at: http://sec.gov/info/accountants/staffletters/fasb101408.pdf)

194
Specifically, the guidance indicated that given the hybrid nature of these instruments, the OCA staff would not object to an issuer applying an impairment model similar to debt securities. This guidance provided greater clarity to preparers who expressed concern that existing guidance indicated that the appropriate impairment model would lead one to treat perpetual preferred securities like equity. The guidance further indicated that the views of OCA staff should be considered an intermediate step in addressing urgent practice issues regarding OTTI, and the OCA staff has requested the FASB to expeditiously address those issues that have arisen in the application of the OTTI model under SFAS No. 115.
7. Advisory Group on Financial Reporting Issues Arising from Global Economic Crisis
The Boards also have formed the Financial Crisis Advisory Group (“FCAG”), comprised of senior leaders with broad international experience with financial markets, to help consider how improvements in financial reporting could help enhance investor confidence in financial markets. The group will meet several times during the first half of 2009 and expects to complete its work by late July. Issues identified during the roundtable discussions, as well as any other issues that may be identified by FCAG, will be given consideration by that group to assist the Boards in responding to the crisis in an internationally coordinated manner.328
8. G-20 Summit on Financial Markets and the World Economy329 The Leaders of the Group of Twenty (the “G-20”) met in Washington, D.C. on November 15, 2008 to discuss the serious challenges facing the world economy and the financial markets. At this summit, the leaders of the G-20 agreed that a broader policy response to the current economic crisis was needed. The goal of this broader response is based on closer macroeconomic cooperation to restore growth, avoid negative spillovers, and support emerging market economies and developing countries. As a result, the G-20 agreed upon some immediate action steps to achieve these objectives along with five additional reforms that will strengthen financial markets and regulatory regimes so as to avoid future crises. The list of additional reforms agreed upon by the G-20 included the goal of strengthening transparency and accountability within the financial markets. Specifically, the G-20 noted that global accounting standards bodies should work to enhance existing guidance on the valuation of complex securities in illiquid markets and expand the required disclosures for these assets.330
328 “IASB and FASB Create Advisory Group to Review Reporting Issues Related to Credit Crisis,” FASB Press Release (October 16, 2008). (available at: http://www.fasb.org/news/nr101608_2.shtml) 329 Declaration of the Summit on Financial Markets and the World Economy, November 15, 2008 (available at: http://www.whitehouse.gov/news/releases/2008/11/20081115-1.html) 330 The IASB issued a release after its December meetings on progress toward meeting the G-20 declarations. This release included a summary of actions previously discussed in this study, along with other actions taken by the Boards. See http://www.iasb.org/News/Press+Releases/IASB+provides+update+on+steps+taken+in+response+to+the+global+financial+crisis.htm.

195
9. FASB / IASB Roundtables on Global Financial Crisis The Boards jointly hosted roundtable meetings during 2008 in London (November 14), Norwalk, Connecticut (November 25) and Tokyo (December 3) to provide an opportunity for the members of the Boards to hear input from a wide range of stakeholders, including users and preparers of financial statements, governments, regulators, and others. The roundtables were intended to help the Boards identify accounting issues that may require the urgent and immediate attention of the Boards to improve financial reporting and help enhance investor confidence in financial markets. The Boards factored that input into their respective decisions to add separate and joint short-term projects on impairment to their agendas in December. The Boards also sought input from roundtable participants to identify broader financial reporting issues arising from the global economic crisis and considered that input in their decisions in December to add a comprehensive joint project to address complexity in existing standards of accounting and reporting of financial instruments.331
10. Proposed FASB Staff Position on Amendments to EITF Issue No. 99-20
On December 19, 2008, the FASB issued an exposure draft of FSP EITF 99-20-a, which would include targeted improvements to EITF Issue No. 99-20,332 including improvement to provide for the use of judgment in assessing whether an impairment loss is expected to be temporary. Specifically the FASB exposed an amendment to paragraphs 12b and 12a to eliminate the notion of “market participants” so the impairment requirements under EITF Issue No. 99-20 are more closely aligned with impairment requirements under paragraph 16 of SFAS No. 115. This exposure draft was issued with an accelerated due process so as to contemplate anticipated issuance of a final FSP on January 8, 2009 effective for reporting periods ending after December 15, 2008.
11. Project on Disclosures for Certain Financial Instruments The Boards are both proposing changes in disclosures to provide more transparency related to incurred losses.333 The potential disclosures would require the pro forma effects on pretax income as if AFS and HTM debt securities and loans were: (1) carried at fair value with changes in fair value through income, and (2) carried at amortized cost with measurement of incurred losses. The FASB exposure draft has a proposed effective date for reporting periods ending after December 15, 2008 and an anticipated issuance date no later than January 30, 2009.
331 See FASB, Summary of Board Decisions, December 15, 2008 Board Meeting. (available at http://www.fasb.org/action/sbd121508.shtml) 332 See FASB, Proposed FSP No. EITF 99-20-a, Amendments to the Impairment and Interest Income Measurement Guidance of EITF Issue No. 99-20. (available at: http://fasb.org/fasb_staff_positions/prop_fsp_eitf99-20-a.pdf) 333 See FASB, Proposed FSP No. FAS 107-a, Disclosures about Certain Financial Assets: An Amendment of FASB Statement No. 107. (available at http://www.fasb.org/fasb_staff_positions/prop_fsp_fas107-a.pdf). See also “IASB proposes additional disclosures for investments in debt instruments,” IASB Press Release, December 23, 2008. (available at: http://www.iasb.org/News/Press+Releases/IASB+proposes+additional+disclosures+for+investments+in+debt+instruments.htm)
196
12. FASB Project on Recoveries of Other-than-Temporary Impairments
(Reversals) On December 15, 2008, the FASB added a project to its agenda to issue an exposure draft to allow reversal of impairments for debt securities classified as HTM and AFS when sufficient evidence demonstrates recovery. The FASB will proceed with this project in conjunction with the IASB, and the FASB staff was commissioned to work in connection with efforts at the IASB, with an anticipated effective date for fiscal years beginning after December 15, 2008.
B. Current Projects In addition to these immediate actions to address the fair value accounting challenges faced in the current environment, the Boards have projects underway to address the role and future direction of fair value in financial reporting. Specifically, there are several standard-setting projects in process that involve fair value as a measurement attribute, including the following: FASB / IASB Joint Projects • Conceptual Framework Project • Financial Statement Presentation Project • Reducing Complexity in Reporting Financial Instruments • Insurance Contract Project IASB Projects • Fair Value Measurement Project These projects when completed may have a significant impact on the use and presentation of fair value accounting. A more detailed description of each project is described below.
1. Conceptual Framework Project The use of fair value as a measurement attribute in future accounting standards may be impacted by the results of the conceptual framework project. The purpose of this joint project is to develop an improved common conceptual framework that provides a sound foundation for developing future accounting standards. The Boards feel that such a framework is essential to fulfilling their goal of developing standards that are objectives-based, internally consistent, and internationally converged and that result in financial reporting that provides the information investors need to make decisions. The new framework will build on the existing IASB and FASB frameworks and consider developments subsequent to the issuance of those frameworks. The Boards are conducting this joint project in eight phases with measurement representing one of the early phases. Measurement is a critical aspect of financial reporting. However, it is also one of the most under-developed areas of the current conceptual frameworks. The overall objective of the new

197
measurement framework is to fill in the gaps in the existing frameworks so that standard-setters will have clear, up-to-date guidance to use in determining the measurement requirements for specific accounting standards. The scope of the measurement phase includes developing an inventory of possible measurement bases (as discussed in Section I.D), creating a common definition for identified measurement bases, evaluating the benefits and drawbacks of each measurement basis, and addressing practical measurement issues that occur during the development of standards. The goal of this process is to create a framework to assist the Boards in the selection of the appropriate measurement basis when developing an accounting standard and provide that a measurement basis is applied consistently across accounting standards. Furthermore, consideration will also be given to whether use of a single measurement basis (such as fair value) would satisfy the needs of financial statement users or if some combination of bases (such as fair value combined with amortized historical cost) is appropriate. This measurement framework will aid standard-setters as they consider improvements to existing accounting standards including the use of fair value as the measurement basis for certain assets and liabilities. Therefore, it would be advisable for the Boards to consider accelerating its work on this phase of the joint project and use those findings as they implement changes, if any, to expand upon existing fair value accounting requirements.
2. Financial Statement Presentation Project As previously discussed, the purpose of this joint project is to establish a standard that will guide the organization and presentation of information in the financial statements. The results of this project will directly affect how the management of an entity communicates financial information to users of financial statements and may alleviate some of the issues related to fair value accounting that have been noted by commenters. The Boards’ goal is to improve the usefulness of the information provided in an entity’s financial statements to help users make decisions in their capacity as capital providers. The Boards developed three objectives for financial statement presentation based on the objectives of financial reporting and the input the Boards received from users of financial statements and from members of their advisory groups. Those proposed objectives state that information should be presented in the financial statements in a manner that: • Portrays a cohesive financial picture of an entity’s activities; • Disaggregates information so that it is useful in predicting an entity’s future cash flows; and • Helps users assess an entity’s liquidity and financial flexibility. On October 16, 2008, both Boards published for public comment a discussion paper, Preliminary Views on Financial Statement Presentation.334 The discussion paper is the result of more than 334 See FASB Financial Accounting Series, No. 1630-100, Discussion Paper, Preliminary Views on Financial Statement Presentation (October 16, 2008) (available at: http://fasb.org/draft/DP_Financial_Statement_Presentation.pdf); and IASB Preliminary Views on Financial Statement Presentation (October 2008). (available at: http://www.iasb.org/NR/rdonlyres/92028667-6118-496E-B0FE-97F829858B5D/0/DPPrelViewsFinStmtPresentation.pdf )

198
two years of discussion by the Boards and consultation with the project’s two advisory groups and others on the issues related to financial statement presentation. The discussion paper proposes several significant changes to the existing financial statement presentation model.
a. Segregation of Activities
The discussion paper proposes a financial statement presentation model that requires an entity to present information about the way it creates value (its business activities) separately from information about the way it funds or finances those business activities (its financing activities). The presentation of assets and liabilities in the business and financing sections would communicate the net assets that management uses in its business and financing activities. That change in presentation, coupled with the separation of business and financing activities in the statements of comprehensive income and cash flows, could make it easier for users to calculate key financial ratios for an entity’s business activities or its financing activities.
b. Reconciliation of Cash Flow to Comprehensive Income
The proposed presentation model also would include a new schedule (to be included in the notes to the financial statements) that would reconcile cash flows to comprehensive income. This reconciliation schedule would disaggregate income into cash, accruals (other than remeasurements), and remeasurement components (e.g., fair value changes). The Boards believe that this disaggregation of comprehensive income would be helpful because users have asked for information to help them understand how components of accrual accounting affect an entity’s comprehensive income and future cash flows. The discussion paper particularly notes that this reconciliation schedule should provide more transparency about the use of fair value. Users have indicated that they believe it is difficult to evaluate fully fair value effects given the commingling of gains or losses from fair value remeasurements and other components of comprehensive income. The separate presentation of those income components in the reconciliation schedule should enable a more effective analysis.
c. Disaggregation of Assets / Liabilities Measured on Different Bases
Today, under both IFRS and U.S. GAAP, assets and liabilities are measured on several different bases, resulting in a mixed-attribute model. The Boards decided that presenting items in an entity’s statement of financial position separately according to the basis on which they are measured would be consistent with the disaggregation objective because the additional information will help users in assessing the amount, timing, and uncertainty of an entity’s future cash flows. Therefore, the Boards propose that an entity should not combine similar assets or similar liabilities measured on different bases into a single line item in the statement of financial position. For example, an entity should not aggregate investments in debt securities measured at amortized cost and investments in debt securities measured at fair value and present the total in a single line item. This disaggregation can enable investors to better understand the impact that fair value has on the financial position and future cash flow capability of a company.

199
3. Reducing Complexity in Reporting Financial Instruments
In 2008, the Boards issued for comment a discussion paper regarding reducing complexity in reporting financial instruments.335 The purpose of the discussion paper was to address concerns expressed by preparers, auditors, and users of financial statements that the reporting for financial instruments is too complex. The paper is designed to gather information to assist the Boards in deciding how to proceed in developing new standards that are more objectives-based and less complex than today’s requirements. This paper also discusses the main causes of complexity in reporting financial instruments along with possible intermediate and long-term approaches to improving financial reporting and reducing complexity. Overall, the document suggests that one long-term solution to address the complexity would be for the reporting of all types of financial instruments on a consistent basis. Further, the document states that fair value seems to be the appropriate measure for all types of financial instruments. However, there are challenges that necessarily need to be addressed by the Boards for such an expansion of fair value measurements. Many of the challenges to be addressed are highlighted in this study, and one of the key issues to be resolved is the development of an enhanced reporting model. The Boards will evaluate the need to complete further work on presentation and disclosure issues before introducing a general fair value measurement requirement for all financial instruments.
4. Insurance Contracts Project336 On August 2, 2007, the FASB issued an Invitation to Comment entitled Accounting for Insurance Contracts by Insurers and Policyholders. The Invitation to Comment included a discussion paper issued in May 2007 by the IASB that sets forth preliminary views on the main components of an accounting model for an issuer’s rights and obligations (assets and liabilities) under an insurance contract. The objective of this joint project is to develop a common, high-quality standard that would address recognition, measurement, presentation, and disclosure requirements for insurance contacts. Specifically, this project is intended to: • Improve and simplify the financial reporting requirements for insurance contracts; • Eliminate numerous pieces of current U.S. accounting literature that add to the complexity of
accounting for insurance contracts; and • Provide investors with more decision-useful information. 335 See Financial Accounting Series No. 1560-100, Invitation to Comment, Reducing Complexity in Reporting Financial Instruments (Including IASB Discussion Paper, Reducing Complexity in Reporting Financial Instruments) (March 28, 2008) (available at: http://www.fasb.org/draft/ITC_Financial_Instruments.pdf); and IASB Discussion Paper, Reducing Complexity in Reporting Financial Instruments (March 2008) (available at: http://www.iasb.org/NR/rdonlyres/A2534626-8D62-4B42-BE12-E3D14C15AD29/0/DPReducingComplexity_ReportingFinancialInstruments.pdf). 336 Information on the Invitation to Comment and project updates are available at: http://fasb.org/project/insurance_contracts.shtml.

200
The discussion paper also proposes that the measurement attribute for all insurance liabilities should be “current exit value” or the amount that the insurer would expect to pay at the reporting date to transfer its remaining contractual rights and obligations immediately to another party. While the IASB does not propose the use of fair value as the measurement attribute for insurance contracts, the definition of current exit value in the discussion paper is similar to the definition of fair value in SFAS No. 157.
5. IASB’s Fair Value Measurement Project337 The IASB is currently developing an exposure draft of an IFRS on fair value measurement guidance. The IASB plans to publish an exposure draft in the first half of 2009. The IASB is undertaking this project for the same reasons that the FASB issued SFAS No. 157. That is, IFRS require some assets, liabilities and equity instruments to be measured at fair value. However, guidance on measuring fair value has been added to IFRS on a standard-by-standard basis over several years as the IASB or its predecessor decided that fair value was the appropriate measurement basis in a particular situation. As a result, guidance on measuring fair value is dispersed across a number of standards and it is not always fully aligned. Furthermore, the current guidance does not provide a single, clearly articulated measurement objective (such as exit value under SFAS No. 157) and does not provide for a standardized measurement hierarchy. The IASB believes that this adds unnecessary complexity to IFRS and contributes to diversity in practice. In preparing an exposure draft, the IASB has indicated that it will consider the requirements of SFAS No. 157.
C. Recommendations and Related Key Findings
1. Recommendation – SFAS No. 157 Should Be Improved, but Not Suspended
While some have suggested that SFAS No.157 should be suspended, the Staff does not believe that the suspension of this standard is advisable. However, as discussed in other recommendations, the Staff believes that further improvements to the existing application of fair value are necessary. As discussed earlier in this study, SFAS No. 157 does not establish any requirements to account for assets or liabilities at fair value. Rather, SFAS No. 157 establishes a common definition of the term fair value for financial reporting and provides for expanded disclosures in cases where preexisting standards require (or in some cases permit) the use of fair value. Accordingly, a suspension of SFAS No. 157 would remove the standardized measurement and disclosure requirements without removing the requirement (or choice) to account for assets or liabilities at fair value. As a result, the suspension of SFAS No. 157 would not reduce the use of fair value as a measurement attribute in financial accounting.
337 Project updates are available at: http://www.iasb.org/Current+Projects/IASB+Projects/Fair+Value+Measurement/Fair+Value+Measurement.htm.
201
Without SFAS No. 157, issuers would return to practices that existed prior to the issuance of the standard. These practices were based on varying definitions of fair value throughout U.S. GAAP and relied upon the limited or conflicting guidance available for applying those definitions. Further, suspending SFAS No. 157 would reduce the comparability and consistency of fair value measurements currently being performed and therefore hinder investors’ ability to obtain decision-useful information on a consistent basis from financial statements. Further, the analysis in Section II.B indicates that SFAS No. 157 did not result in an increase in the use of fair value. For example, in 2006 (prior to the issuance of SFAS No. 157) financial institutions studied reported approximately 42% of assets at fair value in the balance sheet. In 2008, subsequent to the full adoption of SFAS No. 157, this sample group reported approximately 45% of assets at fair value on the balance sheet. While there is an increase of 3%, it is important to note that the Staff’s analysis indicated that the FVO in some circumstances appears to account for this expanded use of fair value as a measure. In analyzing the adoption of SFAS No. 157 as indicated in Section II.B, applying the common definition of fair value provided in SFAS No. 157 did not appear to result in a significant reporting impact in the financial statements upon adoption. Based on this study, 70% of issuers reported no impact upon adoption of SFAS No. 157, and no issuers in this study reported an impact greater than 5% of equity at the time of adoption. Further, disclosure of the prospective impact of SFAS No. 157 often was not provided in sufficient detail to determine whether there was an ongoing incremental impact, as such disclosure is generally provided only to the extent the impact is material. Accordingly, the absence of specific disclosure at the vast majority of institutions studied would indicate that the impact of adoption was not significant at those institutions.
2. Recommendation – Existing Fair Value and Mark-to-Market Requirements Should Not Be Suspended
The Staff does not believe that a suspension or elimination of existing fair value and mark-to-market accounting requirements is advisable. The existing fair value and mark-to-market requirements were developed over several decades, in some cases to specifically address perceived weaknesses identified as a result of prior challenging market conditions or events. These standards were subject to extensive due process. The abrupt elimination of fair value and mark-to-market requirements would erode investor confidence in financial reporting. Further, existing accounting standards generally require mark-to-market accounting only for certain derivatives and investments that financial institutions hold for “trading” purposes (those assets where management has indicated an intent to actively trade assets). Thus, mark-to-market accounting is often required for only a minority of investments. For the financial institutions analyzed, this study indicated that, on average, approximately 50% of broker-dealer, 22% of bank, 7% of GSE, 3% of insurance company, and 1% of credit institution assets are marked-to-market. Certain investments other than trading assets and derivatives (typically investments in securities that financial institutions do not have the intent and ability to hold to maturity) are required to be reported in the balance sheet at fair value.
202
Unrealized gains and losses on these securities are not recognized in the income statement unless the assets are sold or are determined to be impaired. Our detailed analysis of bank failures indicates that for substantially all failed banks studied, fair value accounting was applied to only a small minority of assets, and losses recorded as a result of applying fair value accounting did not have a significant impact on the banks’ capital. While the application of fair value varies among these banks (and is generally more extensive at larger institutions that engage in trading activities), in each case studied it does not appear that the application of fair value can be considered to have been a proximate cause of the failure. It is important to note that the role of accounting standards is to provide transparent information to investors as they make decisions. Accordingly, the primary factor to consider when evaluating the role of fair value accounting is the impact of such accounting on the information provided to investors. Based upon the analysis performed in Section IV (including the views obtained from investors during multiple roundtables, through comment letters and the consideration of existing academic research), investors generally have found existing fair value accounting standards, particularly as they relate to fair value accounting for financial instruments, to have increased the quality of information available to them. While certainly the views of investors are not monolithic, in general, investors have indicated that fair value provides more relevant information, reflecting current economic reality that should not be replaced by other alternative accounting measures. Many investors indicated that investor confidence is reinforced by providing transparency relating to the underlying asset value of their investments, and a removal of that information would, in fact, lead to additional financial instability. While investors have generally found fair value useful, they have also indicated a need to consider improvement to existing practice, including reconsideration of impairment standards, and the application of SFAS No. 157 to illiquid investments. Further, investors have acknowledged the need for additional measures related to assisting in the understanding of the impact of fair value through presentation and disclosure improvements.
3. Recommendation – Additional Measures Should Be Taken to Improve the Application of Existing Fair Value Requirements
While the Staff does not recommend a suspension of existing fair value standards, the Staff believes that a number of measures should be taken to improve the application and practice related to existing fair value requirements (particularly as they relate to both Level 2 and Level 3 estimates) including: • Considering the need for additional application guidance or best practices for determining
fair value in illiquid or inactive markets; • Enhancing existing disclosure and presentation requirements related to the effect of fair value
in the financial statements; • Educational efforts, including efforts to improve the application, where appropriate, of
reasonable judgment and analysis in the determination of fair value estimates;

203
• Examination by the FASB of the impact of liquidity in the measurement of fair value,
including whether additional application and / or disclosure guidance is warranted; and • Assessment by the FASB of whether the incorporation of a company’s own credit risk in the
measurement of liabilities provides decision-useful information to investors, including whether sufficient transparency is provided currently in practice.
In developing SFAS No. 157, the FASB set out to create an objectives-based standard that would allow for the use of judgment in determining fair value. The Staff found that issuers and auditors have faced challenges with the application of the standard in the current global economic crisis. As previously discussed, the Staff, the FASB, and the IASB have taken several steps to provide application guidance to alleviate confusion and to foster reasonable application of fair value measurements in the marketplace. However, the Staff believes additional assistance in the form of guidance, education, and training is warranted in several areas. Examples include further tools to make judgments regarding: • How to determine when markets become inactive • How to determine if a transaction or group of transactions is forced or distressed • How and when should illiquidity be considered in the valuation of an asset or liability • How should the impact of a change in credit risk on the value of an asset or liability be
estimated • When should observable market information be supplemented with and / or reliance placed
on unobservable information in the form of management estimates • How to confirm that assumptions utilized are those that would be used by market participants
and not just by a specific entity In determining how to address the above issues, the FASB should consider which issues could be resolved through a review of the objectives of SFAS No. 157 and which issues would be best addressed by the valuation community. It is noted that the FASB’s VRG and the IASB’s Expert Advisory Panel have already discussed many of these items and may be best equipped to recommend immediate guidance to the Boards on these issues. Further, the FASB should consider working with valuation and appraisal associations and organizations to develop additional valuation guidance and best practice documents to assist preparers and valuation specialists in performing valuations for financial reporting purposes. Further, the Staff recommends that the FASB consider whether changes to how the FASB uses the VRG, including whether the FASB should expand the role of the VRG to function more like the FASB’s EITF, the use of subcommittees for specific issues, and increasing the openness of the process through public meetings, would be beneficial in fostering a common understanding in practice of the challenging issues considered by the VRG.

204
The Staff also believes that it is advisable that the FASB continue efforts to address fair value measurement issues related to the valuation of liabilities. It is the Staff’s view that the current guidance regarding the measurement of liabilities at fair value has the potential to result in confusion in the marketplace and additional consideration in this area is warranted. For example, the application of SFAS No. 157 to liabilities has been a significant concern to certain constituents. Market participants have expressed concern regarding the recognition of a gain due to a decline in the creditworthiness of a debt issuer when the issuer has the intent and ability to continue to make all interest and principal payments. Further, constituents have indicated that there is diversity in interpretation of the language in the standard. On January 18, 2008, the FASB issued a Proposed FSP FAS 157-c, Measuring Liabilities under SFAS No. 157. This FSP indicated that in the absence of a quoted price for the identical liability in an active market, the reporting entity may measure the fair value of its liability at the amount that it would receive as proceeds if it were to issue that liability at the measurement date. Subsequent to the issuance of this draft FSP, the FASB received numerous comments from various constituents and is currently evaluating its next steps.
4. Recommendation – The Accounting for Financial Asset Impairments Should be Readdressed
The Staff recommends that the FASB reassess current impairment accounting models for financial instruments. The evaluation should consider the narrowing of the number of models that currently exist in U.S. GAAP. In conjunction with evaluating current impairment guidance, consideration should be given to increasing the prominence of OCI by requiring a separate statement or presentation on the face of the income statement. Further, the utility and consistency of information provided to investors should be improved, including the implementation of measures to provide investors with insight into management’s expectations of probable cash flow declines. During the course of our study, the accounting for impairment was identified as one of the most significant areas of necessary improvement. As noted earlier, as part of its guidance on perpetual preferred securities, the Staff requested the FASB expeditiously address issues that have arisen in the application of the impairment model in SFAS No. 115. This request was a response to challenges encountered in the application of existing OTTI guidance in the current market and the complexity created by multiple impairment models for financial instruments. One of the most significant concerns expressed in this area is the fact that under existing U.S. GAAP, there are multiple sets of impairment rules for financial instruments. The model applied often depends on the characteristics of the financial instrument at the date of acquisition, and the models are not always consistent with the reporting of impairments for other non-securitized investments (such as direct investments in mortgage loans). In the absence of uniform accounting treatment for impairments, investors are provided with information that is not recognized, calculated or reported on a comparable basis. Further, the treatment of impairments for investments under U.S. GAAP is not consistent with the reporting of impairments under IFRS. U.S. GAAP also requires that once an impairment is recorded, future increases in value (e.g., when the market price recovers) cannot be reported in income until the security is sold. IFRS currently requires, for certain investments, the recognition of increases in value in income
205
when prices recover. The Staff believes that a reconsideration of impairment standards should also include a reconsideration of this preclusion. Further, the Staff notes that the Boards have already initiated efforts to address this concern. The development of a single model addressing the accounting for impairments could reduce the complexity and increase the comparability of financial statements. The FASB should evaluate the need for modifications (or the elimination) of current OTTI guidance to provide for a more uniform system of impairment testing standards for financial instruments. While there are a number of alternative models that the FASB should consider, several commenters have suggested the development of a model that would require recognizing impairments through income related only to credit losses (calculated on an incurred loss basis consistent with impairments on loans), while the remaining decline in fair value of an investment (the portion that is not related to incurred losses) would be recognized in OCI. The Staff believes that this model has the potential to provide investors with both fair value information as well as transparent information regarding the cash flows management expects to receive by holding investments, rather than through accessing the market currently. That is, such a model would appear to help bridge the gap between the current fair value and the value expected from holding investment positions until markets return to normal liquidity levels. Other models, including the elimination of OTTI in favor of more prominent reporting of impairments in OCI, should also be evaluated. Further, in reassessing impairment the FASB should consider whether the “ability and intent to hold to recovery” test under SFAS No. 115 is sufficiently operational, including whether the operation of the model in practice is consistent with the notion of an AFS security.
5. Recommendation – Implement Further Guidance to Foster the Use of Sound Judgment
The Staff believes that it is advisable that the SEC and PCAOB consider whether statements of policy related to the application of judgment in making fair value measurements would be appropriate. As indicated in Section II.B, approximately 85% of assets reported at fair value by financial institutions studied are reported in Levels 2 and 3 (76% and 9%, respectively). The estimate of value for these assets is therefore not based solely on quoted market prices. Rather, information derived for observable inputs (in the case of Level 2) and significant unobservable inputs (in the case of Level 3) are incorporated into models in developing an estimate of value. Such estimation processes, by their nature, require exercise of significant judgment. For measurements of fair value, the relevance of historical information, if any, to an expectation of future performance can be difficult to determine. Without relevant current information, accountants are faced with challenges in evaluating expectations of future events based on uncertain forecasts. The use of judgment in accounting, auditing and regulation has increased due to the focus on more objectives-based standards (such as SFAS No. 157) and increased use of fair value estimates. Guidance regarding the application of judgment in connection with fair value measurements should keep pace with this increased use. In its final report, CIFiR recommended that the SEC issue a statement of policy articulating how it evaluates the reasonableness of

206
accounting judgments, including the factors that it considers when making this evaluation.338 Furthermore, this recommendation included a suggestion that the PCAOB should also adopt a similar approach with respect to auditing judgments.
6. Recommendation – Accounting Standards Should Continue to Be Established to Meet the Needs of Investors
Financial reporting is intended to meet the needs of investors. While financial reporting may serve as a starting point for other users, such as prudential regulators, the Staff recommends that U.S. GAAP should continue to be developed to satisfy the needs of investors. The objective of general purpose financial reporting is to provide decision-useful information to investors. That is, consistent with SFAC No. 1, the objective of financial statements is to provide information to external parties that do not have the ability to otherwise dictate the form and content of such information. This view was reinforced by CIFiR’s conclusions on the importance of investors to financial reporting. For example, CIFiR noted “most importantly, we believe that the financial reporting system would be best served by recognizing the pre-eminence of the perspectives of investors because they are the primary users of financial reports.”339 While financial reports prepared using U.S. GAAP are without a doubt valuable tools considered by other users of information, U.S. GAAP should not be established or modified to serve the needs of others at the expense of investors. This is particularly true in situations where the other users of financial information have the ability to dictate the form and content of such information. However, the Staff did not consider and therefore is not making any recommendations as to the appropriate form and content of information provided to other users, for example, prudential regulators. Lastly, to the extent that the interaction of fair value accounting and regulatory capital requirements has resulted in concerns about pro-cyclicality (including whether accounting standards are resulting in the sale of assets or the need to raise capital in down markets), such concerns should not be addressed through changes in accounting standards that would reduce investor confidence.
7. Recommendation –Additional Formal Measures to Address the Operation of Existing Accounting Standards in Practice Should Be Established
The Staff recommends that additional formal measures should be adopted to facilitate the identification and resolution of issues encountered in the application of existing accounting standards in practice, including: • Implementing CIFiR’s recommendation for an FRF; 338 See CIFiR Final Report, at page 13 (Recommendation 3.5). See also pages 88-96. 339 CIFiR Final Report, at page 4.
207
• The implementation by the FASB of a post-adoption review process; and • The establishment of a formal policy for standard-setting in circumstances that necessitate
near-immediate response. The accounting profession has always been associated with independence and neutrality. An occasionally-overlooked aspect of the independence of the accounting profession is the important role of the independent standard-setter. Standard-setting that solicits input and feedback from all interested parties, yet places the interests of no particular party above the needs of investors relying on the standards, is critical to investor confidence. While independence is a crucial aspect of the accounting standard-setting process, also important is the need for a process that addresses challenges identified in practice in applying such standards. Not only is it fundamentally important to support the critical independence of these bodies for investor confidence, that confidence also is dependent upon the standard-setters’ ability to respond timely to real world challenges. Similarly, investors must have confidence in those standards and the process used to establish the standards. Open due process, including thoughtfully considering the input and views of investors and the many others who participate and play a role in our capital markets, is critical to the Boards in fulfilling their mission of establishing and improving financial accounting and reporting standards. While the Staff believes that the FASB standard-setting process works well, the Staff notes that CIFiR has identified enhancements that, if adopted, could result in improvements to the process. The current market events and the financial reporting challenges faced by issuers have highlighted the need for further consideration of measures to strengthen communications between market participants dealing with financial reporting matters. Accordingly, the Staff believes that it is advisable to quickly move to implement CIFiR’s recommendation related to the creation of the FRF. CIFiR recommended that the FRF include key constituents from the preparer, auditor, and investor and other user communities, to meet with representatives from the SEC, the FASB, and the PCAOB to discuss issues in the financial reporting system overall, both immediate and long-term, and how individual constituents are meeting these challenges.340 Further, challenges encountered in the application of existing accounting standards have highlighted the advisability of formalizing a post-adoption review process for all major FASB standards. In that regard, CIFiR recommended that the FASB should conduct post-adoption reviews of major standards to identify unintended consequences or other practice issues.341 The purpose of the post-adoption review is to ensure new standards are conveying the intended information at an acceptable cost and within a reasonable range of differing interpretations across companies. CIFiR did not recommend a specified time period for conducting post-adoption effectiveness reviews, as it stated that the standard-setter and its advisory groups should evaluate the facts and circumstances surrounding each major project when making such determinations. 340 See CIFiR Final Report, at page 11 (Recommendation 2.3). 341 See Ibid.
208
Lastly, the Staff recommends that the FASB establish a formal policy for standard-setting in circumstances that necessitate near-immediate response. While the FASB has discretion to determine the period for which development-stage accounting literature is exposed for public comment, recent economic conditions prompted the FASB to alter its typical due process in order to provide timely guidance. These events suggest the FASB should consider establishing a formal policy for standard-setting in circumstances in which due process is expedited as such a policy would equip the FASB to respond to exigent circumstances that necessitate near-immediate standard-setting.
8. Recommendation – Address the Need to Simplify the Accounting for Investments in Financial Assets
The Staff recommends the continued joint work by the Boards to simplify the accounting for investments in financial instruments. Section I.B provides a brief summary of the existing accounting landscape for investments typically held by financial institutions. While the overview in that section is only a summary, it nonetheless illustrates the complexities of existing U.S. GAAP. While some of the complexity exists as a result of the complex nature of the underlying transactions, much of this complexity arises from the multiple models that exist, including the continued reliance on models to accommodate mixed-attribute accounting for financial instruments. A common theme at the SEC’s roundtables and in comment letters is that the accounting for financial instruments can be challenging and that current financial reporting standards for such investments are complex. The Staff also heard from investors that understanding the resulting financial reports also can be difficult. Such complexity is illustrated by the challenges faced by the Staff in assessing the impact of the mixed-attribute model on the balance sheet and income statement of financial institutions. Accordingly, the Staff believes that it is advisable for the Boards to work to simplify the accounting for investments in financial instruments, including the continued exploration of the feasibility of reporting all financial instruments at fair value. However, significant obstacles continue to exist related to such a move, including concerns about the degree of relevance and reliability, and concerns about how changes in fair value should be recognized in the income statement. That is, many continue to believe that holding gains and losses (unrealized items) have a different character than realized gains and losses. This appears to be particularly true during times when the value of securities is impacted significantly by declines in liquidity. The Staff believes that it is advisable to address these and other obstacles prior to any significant expansion to mandate the use of mark-to-market accounting for assets other than trading assets and derivatives. In order to address these challenges, the Boards should expedite their efforts around financial statement presentation and disclosure, particularly the joint presentation project that is scheduled to be completed by 2011. The joint project on the presentation of financial statements should serve to clarify for investors where, and how, fair value impacts a company’s financial condition and its operating performance by distinguishing changes in fair value from other components of income.

209
In this regard, the Boards should work closely with the Staff to explore the complete integration of interactive data as a tool to bridge the gap between historical cost measures and fair value. Moreover, sensitivity disclosures of fair value estimates – as well as appropriate supplemental measures that management could elect to provide, for instance HTM valuations of certain debt instruments – could position investors to make more informed decisions about capital allocation. In this regard, the Boards should work closely with the Staff to explore the complete integration of interactive data with respect to these disclosures. Lastly, as noted earlier, the Staff recommends that the Boards complete the measurement phase of the conceptual framework project in order to inform future decisions about appropriate measurement attributes in accounting standards.

210

211
Appendices
Index of Appendices A. Summary of Comment Letters Received as Input to this Study B. Participants in SEC Roundtables on Fair Value Accounting C. Illustration of Revised Financial Statement Presentation to Segregate Amounts by
Measurement Attributes, as Proposed by CIFiR D. FASB and FAF Members (2008)


A-1
Appendix A - Summary of Comment Letters Received as Input to this Study
I. Overview On October 8, 2008, the SEC requested public comment in connection with this study on fair value accounting applicable to financial institutions, including the effects of “mark-to-market” accounting, under the Act. In response, the Staff received 186 comment letters regarding fair value accounting in general, as well as specific areas of focus in this study on fair value accounting.342 In general, there were 56 commenters343 who expressed overall support for fair value accounting as a measurement basis used in financial reporting. However, 49 commenters,344 including some who were generally supportive, expressed specific concerns surrounding the use or application of fair value in financial reporting. Concerns expressed included, but were not limited to, the application of fair value for specific assets or liabilities, the role of fair value for purposes of measuring impairment as well as overall consistency in measuring fair value including measurements in inactive or illiquid markets. These observations, among others, are highlighted throughout this summary. In addition, a number of commenters345 expressed overall concern over the use of fair value as a measurement basis for financial reporting while other commenters346 expressed specific concerns over the use of fair value as a measurement basis for assets which do not trade in active markets.
342 This number reflects comments received through December 15, 2008. See Exhibit A.1 for a list of comment letters received. Full text of these comment letters is available at http://www.sec.gov/comments/4-573/4-573.shtml (file number 4-573). 343 See letters from Roundtable, Joint, Towers, ITAC, UN-L, BUSL Students, Credit Suisse, ICAEW, Fastiggi, Evans, ABA, Edgtton, Ryan, Morfesis, Hale, Montroy, Keating, King, Steinbacher, Phillips, Pigg, Petersen, Sleeping Bear, CFA, NASBA, IPS, ACLI, Evans, PwC, Corporate One, Younger, S. Smith, Benson, Gichini, Anonymous, Bucalo, AI/ASFMRA, CII, Gueye, New World, Houlihan, Georgetown, ICGN, Markit, MBIA, CAQ, Nationwide, Landsman, A. Hamilton, ICI, Rogers, Xylos, Schneider, O’Malley, BAI, and Pink OTC. 344 See letters from Roundtable, Towers, ITAC, UN-L, BUSL Students, Credit Suisse, Fastiggi, Spicer, Evans, ABA, Edgtton, Ryan, Morfesis, Hale, Montroy, Keating, King, Pigg, Petersen, Haslem, Members United, SunCorp, WesCorp, ACCU, Central, ACLI, Corporate One, Bachus, Saidens, Southwest, Anonymous, New World, Houlihan, Georgetown, ICGN, FHLBC, MBA, Citi, MBIA, CAQ, Nationwide, Levin, Rembert, FHLBA, Straka, Rogers, Xylos, O’Malley, and BAI. 345 See letters from Fischer, Hamilton, Waller, Steward, Etheridge, Carl, Sigmon, Vetter, Foster, Miller, Varley, Jeremiah, Viets, Smith, A. Anderson, Cox, Gorton, Cross, Piper, Olson, Owen, Armstrong, Walker, Davis, Harmon, Kent, Murray, Leavitt, Kleist, Knorr, Hodge, C. Lane, Eagle, Isaac, Highland, Grossman, IBAT, CBAI, MIBA, BankLogic, ICBA, Haley, Bucks County, Nguyen, Lofgreen, PACB, Square 1, IBC, and Anonymous II. 346 See letters from Tarasuk, Evans, Roundtable, Cannon, BridgePoint, Evans, Micheletti, IPS, Corporate One, Carmony, Partnership Consultants, Southwest, Highland, BNP, Quigley, Sconyers, and Risgaard.
A-2
II. Effects of Fair Value Accounting Standards on Financial Institutions’ Balance Sheets
Two commenters347 expressed a view that the application of SFAS No. 157 to assets and liabilities that are recognized and measured at fair value results in a distorted picture of a financial institution’s balance sheet and income. These commenters noted that when there is an illiquid or inactive market, the values become distorted since they are based on short-term market fluctuations, rather than on the true value of assets, particularly for those assets that are held for the long-term.
One commenter348 noted that the effects of fair value on the balance sheet will tend to reflect the different stages of the economic cycle and should be judged against the objective of the accounting standards, which is to provide relevant information to investors. This commenter expressed a belief that the debate over fair value accounting should be disconnected from the need for perhaps a different measurement basis, for purposes of determining regulatory capital adequacy. Another commenter349 provided general observations over the difficulties encountered when applying fair value accounting to assets held by financial institutions. More specifically, this commenter observed that the exit price concept in SFAS No. 157 may not be appropriate if the strategy of management is to hold the security in the near term. In addition, this commenter highlighted that fair value measurements are challenging when markets become less active or are inactive. Further, this commenter noted that the application of fair value accounting results in significant volatility to the balance sheet and contributes to higher volatility of reported income. III. Impact of Fair Value Accounting on Bank Failures in 2008 Some commenters350 expressed a general view that fair value accounting in distressed markets has had a significant impact on the recent financial crisis due to downward pressure created as investors are encouraged to sell sooner than they would otherwise which further depresses prices in illiquid or distressed markets. One commenter351 observed that the pro-cyclical effect resulting from the need to measure such assets based on the current market price, even though the market for such asset was inactive or distressed, causes short term market fluctuations for assets which are held for long-term investment purposes. These commenters expressed a belief that the resulting pro-cyclicality impacts the ability of companies to raise capital as investors, creditors and customers observe the decline in U.S. GAAP equity which, in turn, affects the safety and soundness of financial institutions.
347 See letters from Roundtable and Anonymous. 348 See letter from ICAEW. 349 See letter from MBA. 350 See letters from Roundtable, Etheridge, Varley, Schryer, Cox, Micheletti, C. Lane, Isaac, Highland, ABA, IBAT, CBAI, MIBA, Tchingambu, MBA, Bucks County, Viets, PACB, and IBC. 351 See letter from Roundtable.
A-3
Another commenter352 stated its belief that there is a fundamental misunderstanding of fair value accounting and that the views expressed by some who believe that fair value accounting led to certain bank failures stem more from an interest to shift the blame away from those who engaged in poor business and investment decision-making which led to the current crisis. Other commenters353 observed that fair value accounting reflects the effects of market conditions as well as risks associated with assets held, and generally alerts preparers and users of problems in the early stages. These commenters believed that significant losses recognized on these underperforming assets have very little to do with financial reporting and more to do with the need for effective stewardship. Rather than focusing on the effects of fair value, there is a greater need to look objectively and analytically at the root causes of the crisis as opposed to the accounting standard that revealed it. Concern over the use of fair value as a measurement basis is largely due to the impact on capital adequacy. As such, rather than suspend fair value, one focus could be on providing more flexibility in capital adequacy requirements in distressed markets. One commenter354 thought it would be helpful to ask the following fundamental question when evaluating the impact of fair value accounting: “Does FAS 157 Fair Value Measurements significantly contribute to the problem or instead, does it reveal an economic condition earlier than other systems, thereby aiding in averting a more serious crisis?” One commenter355 noted that in some of the recent failures, events leading to the failure were so rapid that fair value accounting reflected through quarterly financial reporting could not have played a significant role. One commenter356 expressed a view that while fair value accounting is not the cause of the current financial crisis, it certainly exacerbated the crisis. However, two commenters357 noted that they believe that suspension of fair value accounting would cause further confusion and distress in the markets resulting from a lack of confidence among investors. One commenter358 submitted a copy of a white paper prepared by Stephen G. Ryan, Professor of Accounting and Peat Marwick Faculty Fellow, Stern School of Business, New York University and highlighted the following three conclusions from that study: • There is no “convincing empirical evidence” that fair value accounting contributed to the
current global economic crisis and that the crisis is primarily the result of bad operating, investing, and financing decisions, poor risk management, and in some instances fraud.
352 See letter from ITAC. 353 See letters from ITAC, Credit Suisse, ICAEW, CFA, NASBA, Evans, PwC, Benson, Gichini, ICGN, Markit, CAQ, and Landsman. 354 See letter from NASBA. 355 See letter from ICAEW. 356 See letter from Anonymous. 357See letter from Anonymous and A. Hamilton. 358 See letter from CII.

A-4
• Fair value accounting for financial instruments provides investors with more informative
reporting, particularly during a global economic crisis, than other alternative accounting approaches.
• Fair value accounting for financial instruments, coupled with disclosure, reduces uncertainty
about values reported in the financial statements and therefore mitigates the duration of a global economic crisis.
IV. Impact of Fair Value Accounting on the Quality of Financial Information Available
to Investors Several commenters359 indicated that the current application of SFAS No. 157 in distressed markets leads to less relevant and reliable financial information due to the uncertainty of market pricing embedded in the fair value measurements reflected in the financial information disseminated among investors. One commenter360 suggested the use of management’s best estimate of economic value of the asset in the basic financial statements with supplemental disclosure of the assets’ market price.
One commenter361 observed that the application of fair value accounting effectively results in liquidation values which may be more appropriate for investment funds or entities with significant liquidity or going concern issues. As such, this commenter stated that while such a measurement basis has a place in financial reporting, standard-setters should consider other alternatives for measuring performance based upon a longer term investment value. One commenter362 noted that in the UK there is a strong view among investors that fair value accounting for financial instruments provides useful information and significantly increases the transparency in financial reporting. However, this commenter also notes that many financial instruments are not required to be measured at fair value and does not support a requirement for all financial instruments to be measured at fair value. Several commenters363 observed that fair value accounting provides insight to investors, creditors, and all other potential financial users in gathering information to make investment decisions since it provides an accurate assessment of the current market value. These commenters stated that investors are given additional insight into the risks to which the company may be exposed and the potential liquidity issues the company could face if it needed to sell securities rather than hold them for the long-term.
359 See letters from ABA, Roundtable, and Tchingambu. 360 See letter from Roundtable. 361 See letter from MBA. 362 See letter from ICAEW. 363 See letters from Gueye, CAQ, and Landsman.
A-5
One commenter364 observed that in order to achieve the maximum level of transparency and comparability, the concept of fair value accounting needs to be applied consistently across all institutions and products, and encourages joint work at the Boards on creating a consistent set of global standards. V. Process used by the Financial Accounting Standards Board in Developing
Accounting Standards As a general observation related to the accounting standard process, several commenters365 conveyed their continued support and emphasized the importance of the role of an independent accounting standard-setter to ensure the needs of investors are served and that any political intervention would not impede that standard-setter’s ability to promulgate and issue standards for financial reporting. One of these commenters366 further expressed support over the FASB’s role as the independent standard-setter and that the FASB continues to operate effectively, in cooperation with the SEC, in the interest of investors and other users of financial information. This commenter also provided an observation regarding the FASB’s recent expedited due process in the issuance of FASB Staff Position FAS 157-3, in consultation with the SEC, in which it considered there to be an immediate need for additional guidance on fair value measurements.
A. Development and Implementation of Accounting Standards
Two commenters367 suggested that the SEC adopt the recommendations made this past summer by CIFiR368 to reform the accounting standard-setting development and governance processes to test the real world implications of standards before they are implemented, as well as their effectiveness post-implementation. One commenter369 also called for an emergency review of fair value accounting standards and questioned whether some of the unintended consequences arising from the implementation of SFAS No. 157 could have been avoided if a comprehensive system was in place for accounting standard development and implementation, including an early warning system to allow for swift development of corrective measures to be taken before real adverse economic conditions impact the financial markets. This commenter noted that, in light of the current crisis in the financial markets, the standard-setting process should also involve consultation with the appropriate financial regulators to determine how the development of accounting standards may impact other rules and regulations, such as capital adequacy requirements. This commenter370 also expressed the need for the PCAOB to issue guidance for
364 See letter from Markit. 365 See letters from ITAC, Joint Letter, Credit Suisse, FAF, PwC, AICPA, CII, Markit, MBA, CFA, CAQ, Landsman, and ICI. 366 See letter from FAF. 367 See letters from CCMC and CAQ. 368 See CIFiR Final Report. 369 See letter from CCMC. 370 See Ibid.
A-6
auditors in evaluating and auditing fair value measurements, including evaluations of fair value in markets that are no longer active.
Another commenter371 cited the recommendations by CIFiR in its Final Report specifically related to recognizing the need to improve the accounting standard-setting process, as well as to increase investor representation on the FASB and the FAF. One commenter372 provided recommendations for the FASB to enhance the standard-setting process, including: (1) refrain from accelerated projects which stem from a reaction to a crisis, (2) implement pre and post testing of accounting standards, (3) allow for sufficient transition and extended exposure periods for the standard, (4) provide a more robust analysis of the comment letters considered and reasons why comments were rejected between the exposure draft and the final standard, and (5) conduct more study where standards are expected to result in significant changes to practice. One commenter373 believed that the standard-setters do not appreciate the difficulties encountered by small public or private entities when issuing standards. This commenter observed that the needs of a select group of users drive the standard-setting process, particularly as it relates to fair value accounting, and that a cost-benefit analysis should consider the impact on companies of all sizes, public or private. One commenter374 suggested that accounting principles affecting the financial system be approved by both the Federal Reserve and the FDIC and that the United States not cede authority of accounting standard-setting to the IASB.
B. Standard-Setting Process in Relation to Fair Value Accounting Standards
One commenter375 observed how fair value has evolved in accounting noting that, prior to the issuance of SFAS No. 157, fair value was applied in varying degrees as that measurement basis is required on a standard by standard basis. This commenter noted the importance of standardizing the definition of fair value, but that in doing so the FASB did not properly consider whether that definition still provided the appropriate measurement basis in all instances in U.S. GAAP. For instance, in the case of investments trading in inactive markets, this commenter did not believe that fair value under an exit value concept is the most appropriate basis. Further, this commenter stated that the current basic financial statements do not provide a framework for investors to properly understand the impact of fair value and to separate the effect of realized versus unrealized changes in fair value in income. As such, this commenter supported suspension of all new fair value requirements until the FASB determines the appropriateness of fair value as a measurement basis and until the FASB completes its ongoing financial statement presentation project. 371 See letter from ICGN. 372 See letter from MBA. 373 See letter from Steward. 374 See letter from Isaac. 375 See letter from Roundtable.
A-7
One commenter376 observed the need for the Boards to complete their joint conceptual framework project to address the mixed measurement basis used in current financial reporting. Another commenter377 recommended that any new standard requiring fair value, as well as the application of SFAS No. 157 to non-financial assets and liabilities (which was previously deferred by the FASB under FSP FAS 157-2, Effective Date of FASB Statement No. 157), be suspended until completion of the congressional review of the fair value study mandated by EESA. Another commenter378 expressed the need for such a suspension to allow for additional consideration of implementation issues identified by the Valuation Resource Group. The most immediate concern, expressed by one of the commenters,379 is the application of fair value for business combinations under SFAS No. 141R, which is effective for business combinations occurring on or after the first annual reporting period beginning on or after December 15, 2008. The commenter noted recent comments expressed during the SEC Roundtable on fair value accounting on October 29, 2008 regarding the undesirable impact of accounting for mergers under the guidance in SFAS No. 157 and SFAS No. 141R. The commenter expressed numerous implementation concerns over the application of SFAS No. 157’s definition of fair value to acquired loans as well as changes in the way acquired loans are recognized in a business combination. They believe that the use of fair value in SFAS No. 141R results in inconsistency in the treatment of loans on an institution’s books, which creates systems problems for tracking the various accounting methods and will result in difficulty when measuring or understanding credit risk for both regulators and management. One commenter,380 while supportive of the independent standard-setting process, expressed concern over the adequacy of due process surrounding the FASB’s issuance of FSP FAS 157-3. This commenter believed that too little time was given to collect and consider feedback as well as to investigate potential unintended consequences of that guidance.
One commenter381 expressed a need for the FASB to evaluate how the results of the SEC’s study on fair value accounting should be considered or applied to privately-held entities.
376 See letter from Ramin. 377 See letter from ABA. 378 See letter from LeGuyader. 379 See letter from ABA. 380 See letter from Markit. 381 See letter from AICPA.

A-8
VI. Alternatives to Fair Value Accounting Standards
A. Enhanced Disclosures of Fair Value Measurements
Several commenters382 acknowledged the need for improved disclosures surrounding the application of fair value accounting in the absence of liquid markets. One commenter383 recommended the creation of a sub-category within the fair value hierarchy for illiquid or dysfunctional market conditions. In such situations, financial instruments that meet certain criteria would continue to follow the appropriate balance sheet and income statement classifications with enhanced disclosures. The criteria would center on whether the market for such asset is dislocated or inactive and the entity has the ability and intent to hold the asset to maturity or recovery. However, a refined valuation methodology would be based upon the financial instrument’s expected future cash flows discounted at the instrument’s original effective interest rate which would result in a departure from the exit value concept currently in SFAS No. 157. This measurement would be coupled with qualitative disclosures such as why the market is dislocated or inactive, and a discussion of the effect of selling such securities in the market, including selling the security at a market price significantly below the carrying value of the security. This commenter believed the proposed approach will provide investors with valuations that consider both the market’s short-term pricing vagaries and the fundamental risk to the entity in holding these financial instruments for a longer period of time. Additionally, this commenter stated that the proposed solution will continue to support the underlying intent of SFAS No. 157, which is to provide transparency in a company’s accounting valuation process and consequently, emphasize the importance of disclosures in a company’s financial statements. Certain commenters384 recommended that the measurement basis of fair value be removed from the basic financial statements and that such a measurement basis should be communicated through robust footnote disclosures in order for investors to continue to receive critical information about current asset values while avoiding the suboptimal steps required of issuers to meet capital requirements during times of market distress. Another commenter385 suggested that such disclosure should be optional based on the particular needs of investors.
B. Financial Statement Presentation of Fair Value Measurements
Two commenters386 supported the use of fair value accounting as a measurement basis in financial reporting but did not support the use of that measurement basis in the reporting of current periodic income or loss. Rather, these commenters supported the use of fair value as a measurement basis in a separate financial statement which would provide useful information to investors and users to evaluate liquidity and solvency of the entity. 382 See the letters from Roundtable, ITAC, Joint Letter, Credit Suisse, Evans, Waller, Hodge, C. Lane, Eagle, Steward, and BAI. 383 See letter from Roundtable. 384 See letters from Waller, Hodge, C. Lane, and Eagle. 385 See letter from Steward. 386 See letters from Ryan and IPS.
A-9
One commenter387 recommended that the FASB consider separating the components of changes in fair value into (1) incurred credit losses and (2) all other changes in fair value (including, for example, liquidity discounts). In addition, this commenter stated that the guidance for reporting financial asset impairments could be converged by recognizing the incurred credit loss component in income and all other changes as part of OCI until the asset is sold or matures. This commenter believed that improvements to the current presentation requirements should be considered by modifying the income statement format to allow for visibility into the effects of fair value and inclusion of OCI on the face of the income statement. Other commenters388 provided support for this model which they believed puts the issue into perspective and removes the “noise” over the difficulty in applying fair value in the current dislocated market environment. Further, these commenters noted that such a modification would also align U.S. GAAP closer to IFRS.
C. Fair Value Measurements When Markets are Not Active
1. Guidance on Determining When a Market is No Longer Active Several commenters389 observed that there may be instances where a market is disrupted to the point that the concept of a “willing buyer-willing seller” no longer operates and that, in such circumstances where the bid-ask spreads widen, the market might be considered inactive leading to the use of alternative measures of fair value. Further, a number of commenters390 believed that additional guidance should be developed to assist preparers in determining when a market is no longer “active” as well as how to value assets in disorderly or inactive markets. One commenter391 observed that a distinction should be made between illiquid and distressed assets, or correspondingly between “volume illiquidity” and “funding illiquidity.” When measuring Level 3 assets, this commenter submits that it would be appropriate to include a volume liquidity premium when measuring the fair value of such assets. However, this commenter stated that funding illiquidity is driven by certain participants’ need for immediate capital and therefore is not an appropriate attribute of fair value. This commenter believed that there is a need for further education on the appropriate factors to consider when measuring Level 3 assets.
2. Application Concerns over the Issuance of FSP FAS 157-3
One commenter392 expressed operational concerns over the FASB’s recent clarification in FSP FAS 157-3 noting the onerous and costly exercise for preparers to be able to produce a strong 387 See letter from PwC. 388 See letters from Central, SunCorp, CAQ, and BAI. 389 See letters from Towers, ABA, Credit Suisse, and C. Lane. 390 See letters from Towers, Credit Suisse, LeGuyader, Urban, Houlihan, CAQ, and Nationwide. 391 See letter from Houlihan. 392 See letter from Steinmetz.

A-10
enough alternative analysis of fair value on a security-by-security basis to overcome the apparent market price obtained by reference to quotations in illiquid or inactive markets. Several commenters393 expressed a view that application of the exit price notion in SFAS No. 157 to financial instruments in inactive or illiquid markets results in an unrealistic downward bias that reduces transparency. These commenters noted that recent FSP FAS 157-3, allows for the use of judgment and allows for a more realistic use of observable and unobservable data rather than relying on forced liquidation sales as a measure of fair value. However, these commenters noted that the guidance also provides that expected cash flows include appropriate risk-adjusted discount rates to reflect credit and liquidity risk. These commenters observe that incorporating a severe liquidity risk assumption in the current market is representative of a distressed sale which is inconsistent with the objective in SFAS No. 157. Therefore, these commenters expressed a view that the guidance is circular. These commenters generally support expanded disclosure to provide investors with information on current exit prices. One of the commenters394 also noted that the guidance is too complicated and is not practical for both large and small banks to apply based on the volume of assets that would need to be evaluated. One commenter395 noted that rather than apply a liquidity risk premium inherent in the market, an appropriate liquidity risk premium should factor in the planned holding period of the security. Another commenter396 stated that the guidance in FSP FAS 157-3 puts excessive reliance on the importance of internal assumptions and that the guidance does not take into account the wealth of other observable data points that may be available and relevant. This commenter supported the current work of the IASB’s Expert Advisory Panel and summarized some of the statements by that panel on how to determine an accurate estimate of fair value in the current environment as follows: • For a financial product that is not actively traded the user should take into account all sources
of data. • The user cannot ignore a transaction that has taken place. While he might decide not to use
it, is should be included as part of this judgment process. • “For some products consensus pricing data might be the best source of pricing information.” • “Forced transactions” that could potentially be ignored are rare. The simple fact that a
product trades at a very low price, or prices are determined in a marketplace with more sellers than buyers, does not imply that the transaction was forced. It is worth noting that, even in today’s markets, most trades do take place in orderly transactions at prices that are agreed by a willing buyer and a willing seller.
393 See letters from ABA, WesCorp, ACCU, Central, ACLI, Southwest, MBA, and Straka. 394 See letter from ABA. 395See letter from Straka. 396 See letter from Markit.

A-11
• Judgment is required in deciding whether to use a certain source of data, or to assign a higher
weight to one source compared to others. One commenter397 observed that the objective of fair value is to reflect the price that would be received in an orderly transaction for the asset at the time of measurement. However, the commenter noted that the current application of this objective has resulted in inappropriate application of using “fire sale” prices to determine fair value. This commenter did not believe that the guidance provided by the FSP FAS 157-3 adds clarity. The commenter believed that there needs to be education to ensure there is a consistent understanding and application of fair value among financial statement preparers, auditing firms, analysts, examiners, and market participants. One commenter398 expressed the need for specific audit guidance from the PCAOB related to OTTI and fair value, in general, to allow for a more consistent approach when auditing fair value measurements and assessing OTTI.
3. Use of Fair Value as a Measurement Basis When Markets are Not Active
One commenter399 observed that the exit price objective of fair value is just as important to investors when markets are illiquid as in other times. This commenter expressed a belief that valuing financial instruments that are required to be measured at fair value using something other than an exit price objective would result in inconsistent measurements of fair value and would not provide users with the most transparent information. Several commenters400 believed, in general, that quoted market prices in inactive or illiquid markets do not reflect an accurate assessment of the current value of such assets. These commenters were generally comprised of two groups. The first group401 generally believed that fair value accounting should be suspended for assets which do not have a readily determinable price in active markets. The second group402 believed that alternative valuation methodologies should be employed in determining the fair value. In situations where fair value is suspended, one commenter403 expressed the need for management to provide more robust disclosure when assets are recorded at historical cost where an inactive or illiquid market exists, including the range of prices exchanged for such assets in the inactive or illiquid market. Another
397 See letter from ICBA. 398See letter from FHLBA. 399 See letter from CAQ. 400 See letters from UN-L, Miller, Tarasuk, Spicer, Evans, Micheletti, Petersen, Haslem, C. Lane, Carmony, Anonymous, and Xylos. 401 See letters from UN-L, Miller, Evans, C. Lane, Carmony, BNP, and Xylos. 402 See letters from Tarasuk, Spicer, Haslem, and Anonymous. 403 See letter from Evans.

A-12
commenter404 observed that in the current environment some “favored” financial institutions have access to federal assistance while others do not and may need to borrow from these favored institutions. These favored institutions may influence the fair value inputs faced by the disadvantaged financial institutions in a manner that further depresses market prices which are already at distressed levels. One commenter405 supported enhanced disclosures for financial instruments that do not trade in active markets and stated that such disclosures should be provided consistent with the guidance in Regulation S-K.
One commenter406 acknowledged that when markets are inactive, fair value measurements are less reliable and therefore less useful by comparison with measurements taken from active markets. However, this commenter did not believe that reverting to a historical cost accounting model for assets in inactive markets would be an improvement. Several commenters407 suggested that the FASB issue additional guidance that would allow for adjustments to current severe liquidity risk premiums to levels observed during periods of normal market activity when measuring fair value for impaired HTM securities as well as AFS securities where management has the intent and ability to hold to recovery. Some commenters408 referred to such a value as an intrinsic or economic value. These commenters noted that liquidity risk premiums may be appropriate for trading securities as well as AFS securities where management does not have the intent or ability to hold to recovery. One commenter409 stated that additional guidance is needed to clarify that a present value cash flow model should be based on expected cash flows adjusted by expected losses. This commenter stated that, in practice, discount rates are being applied to cash flows that are not adjusted for expected losses if HTM. Further, this commenter suggested that the discount rate should incorporate a credit risk premium that factors in any residual credit risk equivalent to the cost of capital for that residual credit risk.
D. Lower-of-Cost-or-Fair-Value One commenter410 observed that recent discussion surrounding fair value accounting has ignored the positive impact fair value accounting had on the financial institutions in periods leading up to the current crisis in the financial markets. Several commenters411 believed that the FASB should 404 See letter from UN-L. 405 See letter from Xylos. 406 See letter from ICAEW. 407 See letters from SunCorp, ACCU, Central, Corporate One, FHLBC, and MBA. 408 See letters from ABA and FHLBC. 409 See letters from Straka. 410 See letter from Fischer. 411 See letters from Fischer, Sigmon, Vetter, Varley, Viets, Cox, Gorton, Cross, Kleist, and Isaac.
A-13
move to a more prudent historical cost model. Where adjustments to amortized cost are required, one commenter412 suggested an approach based on a present value methodology using discounted cash flows and an appropriate historical risk premium, rather than relying on quotes from illiquid markets. Other commenters413 believed that subsequent adjustments below the carrying amount should only be recognized to the extent such losses are permanent or realized. In such cases, these commenters stated that fair value measurement could be useful to investors through expanded footnote disclosures of current selling prices.414 One commenter415 suggested that the appropriate measurement basis should depend on whether the asset is held for long-term or short-term investment purposes. Under this view, assets held for long-term investment purposes should be recognized at amortized cost and subsequently evaluated for permanent impairment even where quoted market prices in active markets are available. One commenter416 expressed a view that fair value should be suspended temporarily for a period of 12 to 18 months while the markets recover and U.S. housing prices stabilize. One commenter417 noted that fair value is more relevant to investors and financial statement users than amortized cost since it reflects the market’s current assessment of the value of the underlying asset. This commenter stated that fair value provides more comparable measures of value than amortized cost which is a function of the cost at inception or purchase and does not incorporate changes in the value over time.
E. Recognition of Changes in Fair Value over Time
Some commenters,418 although generally supportive of fair value accounting, recommended a principle for delayed recognition of unrealized gain or losses on changes in fair value as opposed to immediate recognition. These commenters generally believed that the current financial crisis is driven in large part by overvaluations during periods preceding the current crisis which is now resulting in a severe undervaluation of assets. One commenter419 supported the development of a classification system whereby assets are classified based on risk and an amortization technique is applied to each risk category. Under this system, fair value changes for higher risk assets will be recognized into income over an accelerated period compared to lower risk assets.
412 See letter from Sigmon. 413 See letters from Vetter, Varley, Smith, Cox, Gorton, Cross, and Isaac. 414 See letters from Cross, Isaac, and Nguyen. 415 See letter from Smith. 416 See letter from Bucks County. 417 See letter from ICI. 418 See letters from Edgtton, Keating, Harmon, and IPS. 419 See letter from IPS.
A-14
F. Other Fair Value Measurement Alternatives
Some commenters420 believed that the current exit price objective in SFAS No. 157 is a flawed objective. Certain commenters421 believed that fair value should provide information for what the holder believes the asset will be worth at the time of maturity or disposal. One commenter422 suggested that industry-specific guidance for determining fair value measurements in particular industries be provided. One commenter423 suggested an amendment to the fair value hierarchy in SFAS No. 157 to consider both quoted prices in active markets as well as discounted cash flows models, allowing for management to give appropriate weight to both methods when assigning fair value. One commenter424 believes that preparers should be able to develop estimates of fair value based on either market, historical, or model-based methods according to their judgment, so long as the asset values using other methods are also clearly disclosed in the footnotes to the financial statements. This commenter stated that the use of this method would allow for all available information to be used when coming up with the most precise estimate and multiple combinations would be allowed with weights used and the impact of alternative weightings clearly disclosed. One commenter425 recommended an approach based on the liquidity of the underlying asset. Under this approach, non-liquid assets would be valued based on applying a cash flow, replacement cost, and market condition analysis.
One commenter426 believed that there is a fundamental difference in determining the fair value for equity securities and mortgaged-backed securities. This commenter stated that mortgage-backed securities should be valued based on the present value of the expected cash flow streams from the underlying mortgage. Under this approach, the lack of liquidity associated with conditions in the financial markets can be acknowledged through the classification of the security as a long-term asset.
G. Simplify Guidance on Accounting for All Financial Instruments
One commenter427 observed the current mixed-attribute framework for measuring various financial instruments. This commenter suggested that the measurement basis for financial 420 See letters from Morfesis, Saidens, and O’Malley. 421 See letters from Morfesis, and O’Malley. 422 See letter from O’Malley. 423 See letter from New World. 424 See letter from Georgetown. 425 See letter from Rembert. 426 See letter from King. 427 See letter from Members United.
A-15
instruments should be simplified by requiring all financial instruments, except for trading, to be measured at amortized cost. Under this approach, financial instruments classified as trading would still be measured at fair value with an exit price objective and financial instruments, other than trading, that are considered impaired should be measured at their net realizable value rather than a liquidation or exit value. This commenter observed that debt securities backed by loans should be valued similar to HFI loans.
H. Expansion of Fair Value Measurement Requirements
One commenter428 believed that the current erosion of capital is driven by the mixed-attribute model assigned to assets and liabilities in the financial statements. This commenter suggested that fair value should be expanded as the measurement basis for liabilities which, during poor economic cycles, will result in a decline in the fair value of liabilities thereby increasing equity without the need to raise additional capital.
One commenter429 suggested that fair value, as a measurement basis in financial reporting, is appropriate if applied to all financial instruments rather than segmenting the application to certain items on the balance sheet. According to this commenter, the FASB’s issuance of SFAS No. 159 attempted to resolve this discrepancy but is only an option and, therefore, adds to the lack of comparability between financial institutions. One commenter430 expressed concern over expansion of fair value as a measurement basis in financial reporting beyond today’s scope until standard-setters, management, and other capital market participants reflect, analyze, and debate the use of fair value in financial reporting. This commenter stated that standard-setters need to establish a framework for determining when to use fair value in financial reporting and modify the presentation of financial statements to communicate the impact of fair value measurements and changes in fair value on the business.
I. Use of Judgment in Fair Value Measurements The use of judgment is required when developing an accurate assessment of an asset’s fair value. Several commenters431 observed that the use of judgment is required when developing an accurate assessment of an asset’s fair value and recommended additional guidance from the SEC and / or FASB that elaborates on the use of judgment when applying SFAS No. 157 in an inactive market beyond the guidance recently provided in FSP FAS 157-3. In addition, one commenter432 recommended that the PCAOB issue guidance for auditors that further clarifies that companies can utilize their judgment for price assessment in an inactive market.
428 See letter from Hale. 429 See letter from SunCorp. 430 See letter from PwC. 431 See letters from Roundtable, CCMC, Joint II, and Anonymous. 432 See letter from Roundtable.

A-16
J. Valuation Oversight Body
A concern expressed by some commenters433 pointed to the need for greater guidance on how valuations should be conducted. One commenter434 observed that SFAS No. 157 Level 3 valuations carry an inappropriate negative connotation which could be avoided by establishing consistent valuation standards to enhance the quality of the valuations. This commenter raised the need to established and recognize a professional organization that would develop standards of practice and provide oversight over those responsible for valuing “hard-to-value” financial instruments using Level 3 mark-to-model approaches. One commenter435 cited a concern expressed by CIFiR in its Final Report over the inadequate infrastructure in the U.S. to support valuations for financial reporting. This commenter expressed support for developing and maintaining standards for the reporting and disclosure of valuations and the need to develop a framework of guidance on best practices to allow for the consistent delivery of those standards. This commenter, while supportive of the content in the white paper recently published by the IASB’s Expert Advisory Panel, expressed concern over continued development of valuation guidance in isolation from “mainstream” valuation practice and that such guidance should be developed following a due process similar to the IASB’s own standards.
K. Improvements to Other-Than-Temporary Impairment Model Several commenters noted deficiencies in the current framework under U.S. GAAP for evaluating OTTI.436 Under a recommended approach, 437 securities classified as HTM and AFS under SFAS No. 115 would continue to be reported as described in that literature (HTM reported at amortized cost and AFS reported at fair value). However, under this approach, the OTTI model would be primarily focused on credit risk and the change in fair value due to changes in credit risk, rather than changes due to other variables such as interest rates. This alternative model would recognize OTTI if loss events provide objective evidence of credit impairment. Under this model, the impairment recognized would be calculated by comparing the carrying amount of the instrument with the present value of estimated future cash flows discounted at the financial asset’s original effective interest rate. One commenter438 suggested that the discount rate used for measuring impairment should be based on the original yield spread plus the current benchmark interest rate. Some commenters439 also suggested that subsequent recovery of fair value for previously impaired investments should be recorded as a realized gain or loss, as
433 See letters from Towers and IVSC. 434 See letter from Towers. 435 See letter from IVSC. 436 See letters from Roundtable, ABA, MassMutual, BUSL Students, Citi, CAQ, Nationwide, ACLI, WesCorp, ACCU, Corporate One, Southwest, FHLBC, FHLBA, Straka, and BAI. 437 See letters from Roundtable, ABA, MassMutual, Citi, CAQ, Nationwide, ACLI, Straka, and BAI. 438 See letter from Straka. 439 See letters from Roundtable, ABA, Nationwide, FHLBA, and BAI.
A-17
opposed to the current accretion or amortization model into net investment income. One commenter440 provided the following considerations as support for this model: • More reflective of the expected cash flows to be generated by the investor; • More consistent with the overall accounting models for AFS and HTM debt instruments; • Impairment measurement model for loans is well developed and more applicable to many
debt instruments; • Lack of reliable market prices for debt securities; and • Reduces complexity by measuring credit impairment for loans, HTM debt instruments and
AFS instruments. Another commenter441 believed that additional guidance should be provided for determining fair value in inactive or illiquid market and that more flexibility should be afforded to securities that trade in those markets to allow for use of pricing models incorporating market participant data, if available, in establishing the fair values. For securities classified as HTM under SFAS No. 115 which are other-than-temporarily impaired, this commenter suggested that credit losses be reflected through income while the other loss components of the fair value measurement be suspended temporarily for a period of one to two years.
Some commenters442 noted the disparate models of a mortgage-backed security under SFAS No. 115 and the underlying loan assets which are accounted for under SFAS No. 114. Specifically, some commenters443 noted that SFAS No. 114 requires impairments to be measured based on the present value of expected future cash flows discounted at the loan’s effective interest rate. These commenters generally support a net realizable value model when measuring OTTI, when an entity has the intent and ability to hold until recovery or maturity, noting that securitized loans should not be treated differently than un-securitized loans when the intent and ability to hold the investments is present in both cases and the underlying collateral is the same. Some commenters444 expressed a need to also harmonize the OTTI models in SFAS No. 115 and EITF Issue No. 99-20 and recommended an elimination of the “ability and intent to hold to recovery” test in SFAS No. 115 and Staff Accounting Bulletin Topic 5M, Accounting for Noncurrent Marketable Equity Securities, and replacing it with a requirement to recognize an impairment loss (based on fair value) when it becomes probable that an investor will sell an otherwise impaired security. Under these proposed changes, OTTI would be recognized only when there is credit loss impairment or when it becomes probable that an investor will sell an 440 See letter from Citi. 441 See letters from BUSL Students. 442 See letters from WesCorp, ACCU, Corporate One, Southwest, FHLBC, CAQ, FHLBA, and BAI. 443 See letters from FHLBC, CAQ, FHLBA, and BAI. 444 See letters from CAQ, ACLI, and BAI.
A-18
otherwise impaired security. Another commenter445 expressed a view to modify the scope of EITF Issue No. 99-20 to apply only to residual interest investments while other debt securities would follow SFAS No. 115. V. Other Areas of Comment Some commenters446 expressed concern over the use of fair value which is based on short-term market pricing when determining the value of certain long-term liabilities such as pensions. One commenter447 suggested that fair value, as used in SFAS No. 158, Employers’ Accounting for Defined Benefit Pension and Other Postretirement Plans, be temporarily suspended until the current economic situation stabilizes. In order to continue providing transparency to investors and other users, expanded footnote disclosure could reflect the funded status of plans based on a fair value measurement of the underlying plan assets. One commenter448 recommended changes to the incurred loss model when accounting for HFI loans. This commenter believed that loans with credit impairment or loans under default should continue to be reported at amortized cost until the point where the bank takes ownership of the foreclosed property, at which point the loan should be written down to the fair value of the real estate. One commenter449 provided an observation that a significant amount of the negative reaction and confusion concerning fair value accounting relates to a lack of education on the subject. This commenter recommended that the SEC or FASB issue a white paper to describe the model for determining fair value under SFAS No. 157, as well as when fair value is used as a measurement basis under U.S. GAAP. One commenter450 suggested that the SEC obtain formal views from the various U.S. depository institution regulators on the topic of fair value to evaluate the need to reconcile the SEC’s mandate for investor protection with the mandate that those regulators have to protect the safety and soundness of the U.S. financial system. One commenter451 provided a study over the application and use of fair value in financial reporting. This study highlighted five principles that may be helpful in determining when fair value accounting would be applicable. In addition, this study provided an example of different financial statement presentation formats to help communicate and distinguish the application of fair value accounting and historical transaction accounting. 445 See letter from Nationwide. 446 See letters from InFRE and Providence. 447 See letter from Providence. 448 See letter from Montroy. 449 See letter from LeGuyader. 450 See letter from AICPA. 451 See letter from Columbia.

A-19
One commenter452 expressed concern over several areas centered around fair value accounting and requested that the SEC Staff conduct a review of these areas in its study, including: (1) the interaction of OTTI and fair value, (2) how fair value accounting takes into account management’s intent to hold the asset until maturity, and (3) practices engaged by auditors in auditing fair value measurements. One commenter453 expressed concern over the FASB’s current project to improve and simplify the financial reporting of hedging activities. This commenter expressed a view that the elimination of the bifurcation-by-risk approach as contemplated in this project will act as a deterrent to an entity’s ability to manage its interest rate risk and requests that the SEC Staff considers this pending change as part of the fair value study. One commenter454 suggested that the SEC study include a survey of publicly-held financial institutions to specifically identify practice issues that remain in the application of SFAS No. 157 and the various areas in accounting where fair value is deployed. One commenter455 expressed concern over the requirement to value insured credit default swaps using a fair value measurement basis. The commenter notes that SFAS No. 133 exempts traditional financial guarantee insurance policies written by bond insurers from fair value accounting. This commenter pointed out that insured CDS contracts function nearly identical to traditional financial guarantee policies and that the form should not drive the different accounting treatment. This commenter suggested that SFAS No. 133 be amended to provide a scope exception for credit protection in credit derivative form that is written by bond insurers subject to Article 69 of the New York Insurance Law.
452 See letter from CUNA. 453 See letter from FHLBC. 454 See letter from MBA. 455 See letter from MBIA.

A-20
Exhibit A.1: List of Commenters
Commenter Affiliation Abbreviation Date Weblink
I. Members of Congress - This group includes members of Congress.
Bachus, Spencer
U.S. House of Representatives, Committee on Financial Services
Bachus Oct 14, 2008 http://sec.gov/comments/4-573/4573-68.pdf
II. Preparers - This group includes preparers, preparer-related professional organizations, and advisors to preparers. Association of Corporate Credit Unions ACCU Oct 28, 2008 http://sec.gov/comments/4-573/4573-87.pdf
BNP Paribas BNP Nov 13, 2008 http://sec.gov/comments/4-573/4573-148.pdf BridgePointe Advisors BridgePoint Nov 13, 2008 http://sec.gov/comments/4-573/4573-161.htm BridgePointe Advisors BridgePoint Nov 13, 2008 http://sec.gov/comments/4-573/4573-156.htm Cannon Company Cannon Nov 13, 2008 http://sec.gov/comments/4-573/4573-162.htm Citigroup Citi Nov 12, 2008 http://sec.gov/comments/4-573/4573-128.pdf Corporate One Federal Credit Union Corporate One Oct 28, 2008 http://sec.gov/comments/4-573/4573-91.pdf
Credit Suisse Group Credit Suisse Nov 13, 2008 http://sec.gov/comments/4-573/4573-165.pdf Eagle National Bank Eagle Oct 1, 2008 http://sec.gov/comments/4-573/4573-37.pdf Federal Home Loan Bank of Atlanta FHLBA Nov 26, 2008 http://sec.gov/comments/4-573/4573-180.pdf
Federal Home Loan Bank of Chicago FHLBC Nov 12, 2008 http://sec.gov/comments/4-573/4573-127.pdf
First Federal of Bucks County Bucks County Nov 10, 2008 http://sec.gov/comments/4-573/4573-178.pdf Highland Capital Management, LP Highland Oct 23, 2008 http://sec.gov/comments/4-573/4573-58.pdf
Houlihan Lokey Houlihan Nov 11, 2008 http://sec.gov/comments/4-573/4573-122.pdf Integrated Planning Strategies, LLC IPS Oct 30, 2008 http://sec.gov/comments/4-573/4573-104.pdf
Massachusetts Mutual Life Insurance Company MassMutual Nov 13, 2008 http://sec.gov/comments/4-573/4573-155.pdf
MBIA, Inc. MBIA Nov 13, 2008 http://sec.gov/comments/4-573/4573-167.pdf

A-21
Commenter Affiliation Abbreviation Date Weblink Members United Corporate Federal Credit Union Members United Oct 17, 2008 http://sec.gov/comments/4-573/4573-41.pdf
Nationwide Insurance Group Nationwide Nov 13, 2008 http://sec.gov/comments/4-573/4573-157.pdf Providence Health & Services Providence Nov 10, 2008 http://sec.gov/comments/4-573/4573-143.pdf Sleeping Bear Partners Sleeping Bear Oct 1, 2008 http://sec.gov/comments/4-573/4573-18.pdf Southwest Corporate Federal Credit Union Southwest Oct 24, 2008 http://sec.gov/comments/4-573/4573-74.pdf
Square 1 Bank Square 1 Oct 8, 2008 http://sec.gov/comments/4-573/4573-70.pdf SunCorp Corporate Credit Union SunCorp Oct 27, 2008 http://sec.gov/comments/4-573/4573-80.pdf SunCorp Corporate Credit Union SunCorp Nov 12, 2008 http://sec.gov/comments/4-573/4573-133.pdf U.S. Central Central Oct 27, 2008 http://sec.gov/comments/4-573/4573-78.pdf U.S. Central Central Nov 13, 2008 http://sec.gov/comments/4-573/4573-152.pdf Western Corporate Federal Credit Union WesCorp Oct 24, 2008 http://sec.gov/comments/4-573/4573-73.pdf
Western Reserve Capital Management Western Jul 25, 2008 http://sec.gov/comments/4-573/4573-171.pdf
Western Reserve Capital Management Western Sep 25, 2008 http://sec.gov/comments/4-573/4573-172.pdf
Xylos Corporation Xylos Dec 5, 2008 http://sec.gov/comments/4-573/4573-186.pdf III. Auditors - This group includes auditors. PricewatherhouseCoopers LLP PwC Oct 29, 2008 http://sec.gov/comments/4-573/4573-90.pdf PricewatherhouseCoopers LLP PwC Oct 1, 2008 http://sec.gov/comments/4-573/4573-1.pdf IV. Standard-Setters - This group includes standard-setters and related formal and informal advisory groups. Financial Accounting Foundation FAF Oct 2, 2008 http://sec.gov/comments/4-573/4573-84.pdf Financial Accounting Foundation FAF Oct 27, 2008 http://sec.gov/comments/4-573/4573-83.pdf International Valuation Standards Committee IVSC Nov 13, 2008 http://sec.gov/comments/4-573/4573-145.pdf
V. Academics - This group includes academics.
Angel, James J. Georgetown University, McDonough School of
Georgetown Nov 12, 2008 http://sec.gov/comments/4-573/4573-135.pdf
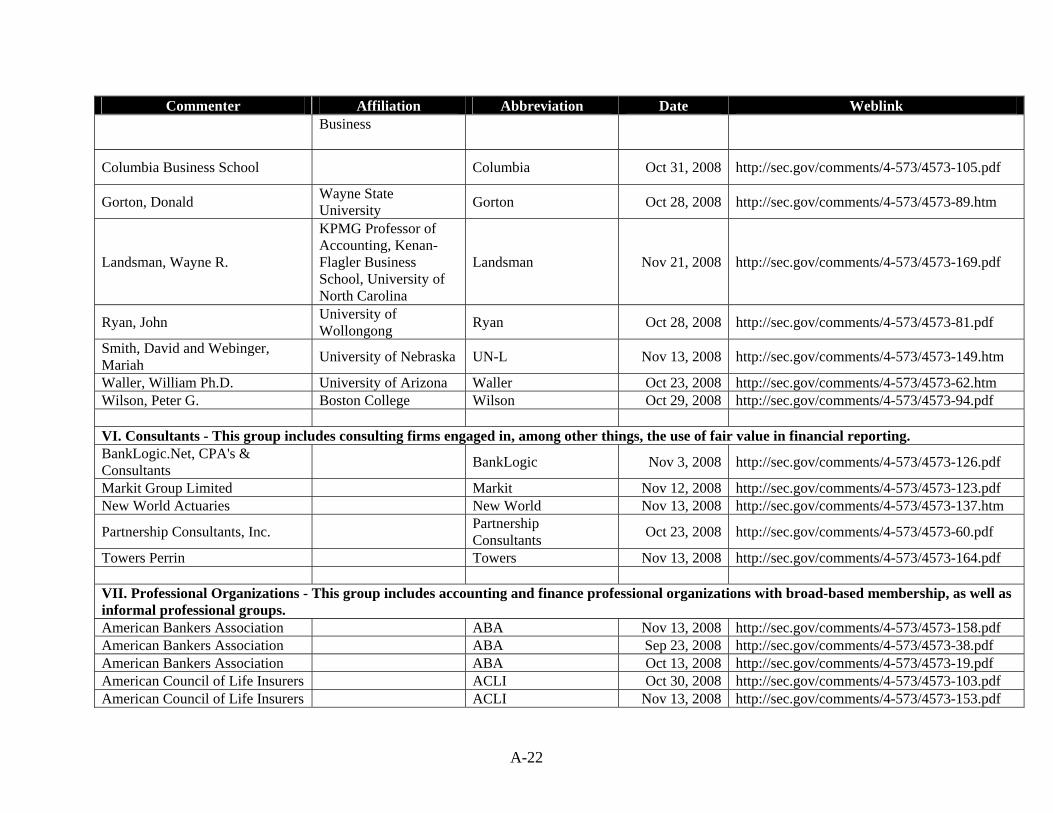
A-22
Commenter Affiliation Abbreviation Date Weblink Business
Columbia Business School Columbia Oct 31, 2008 http://sec.gov/comments/4-573/4573-105.pdf
Gorton, Donald Wayne State University Gorton Oct 28, 2008 http://sec.gov/comments/4-573/4573-89.htm
Landsman, Wayne R.
KPMG Professor of Accounting, Kenan-Flagler Business School, University of North Carolina
Landsman Nov 21, 2008 http://sec.gov/comments/4-573/4573-169.pdf
Ryan, John University of Wollongong Ryan Oct 28, 2008 http://sec.gov/comments/4-573/4573-81.pdf
Smith, David and Webinger, Mariah University of Nebraska UN-L Nov 13, 2008 http://sec.gov/comments/4-573/4573-149.htm
Waller, William Ph.D. University of Arizona Waller Oct 23, 2008 http://sec.gov/comments/4-573/4573-62.htm Wilson, Peter G. Boston College Wilson Oct 29, 2008 http://sec.gov/comments/4-573/4573-94.pdf VI. Consultants - This group includes consulting firms engaged in, among other things, the use of fair value in financial reporting. BankLogic.Net, CPA's & Consultants BankLogic Nov 3, 2008 http://sec.gov/comments/4-573/4573-126.pdf
Markit Group Limited Markit Nov 12, 2008 http://sec.gov/comments/4-573/4573-123.pdf New World Actuaries New World Nov 13, 2008 http://sec.gov/comments/4-573/4573-137.htm
Partnership Consultants, Inc. Partnership Consultants Oct 23, 2008 http://sec.gov/comments/4-573/4573-60.pdf
Towers Perrin Towers Nov 13, 2008 http://sec.gov/comments/4-573/4573-164.pdf VII. Professional Organizations - This group includes accounting and finance professional organizations with broad-based membership, as well as informal professional groups. American Bankers Association ABA Nov 13, 2008 http://sec.gov/comments/4-573/4573-158.pdf American Bankers Association ABA Sep 23, 2008 http://sec.gov/comments/4-573/4573-38.pdf American Bankers Association ABA Oct 13, 2008 http://sec.gov/comments/4-573/4573-19.pdf American Council of Life Insurers ACLI Oct 30, 2008 http://sec.gov/comments/4-573/4573-103.pdf American Council of Life Insurers ACLI Nov 13, 2008 http://sec.gov/comments/4-573/4573-153.pdf
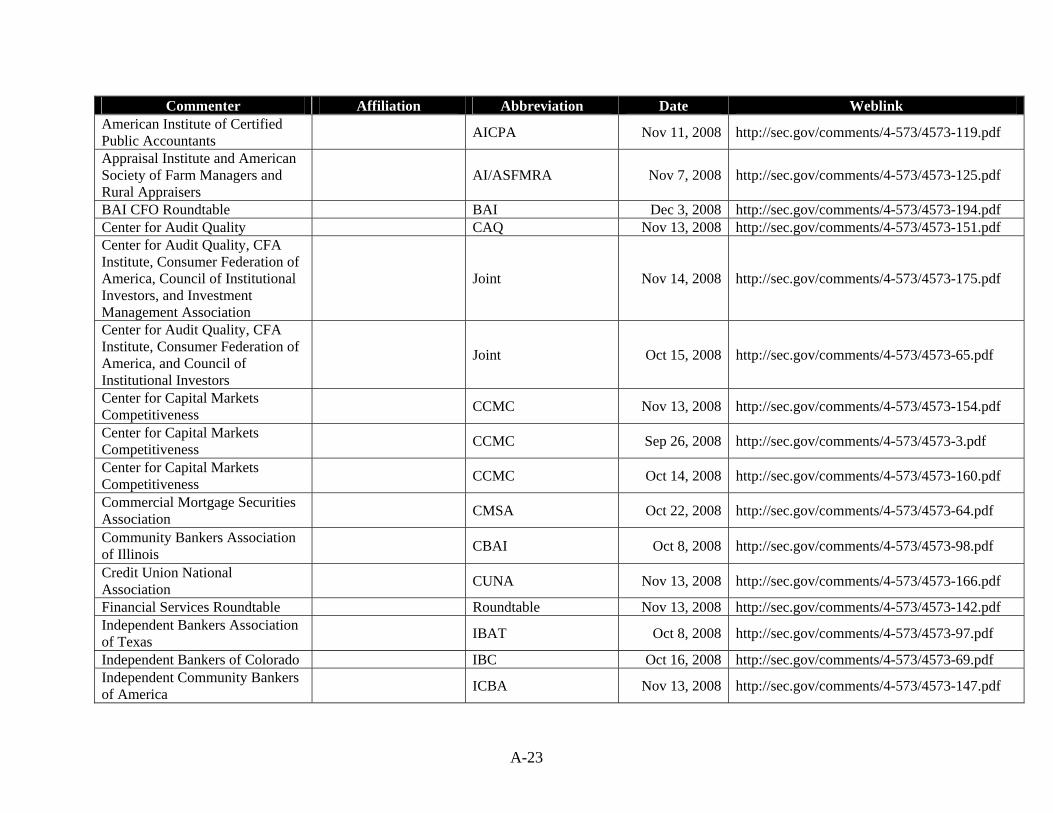
A-23
Commenter Affiliation Abbreviation Date Weblink American Institute of Certified Public Accountants AICPA Nov 11, 2008 http://sec.gov/comments/4-573/4573-119.pdf
Appraisal Institute and American Society of Farm Managers and Rural Appraisers
AI/ASFMRA Nov 7, 2008 http://sec.gov/comments/4-573/4573-125.pdf
BAI CFO Roundtable BAI Dec 3, 2008 http://sec.gov/comments/4-573/4573-194.pdf Center for Audit Quality CAQ Nov 13, 2008 http://sec.gov/comments/4-573/4573-151.pdf Center for Audit Quality, CFA Institute, Consumer Federation of America, Council of Institutional Investors, and Investment Management Association
Joint Nov 14, 2008 http://sec.gov/comments/4-573/4573-175.pdf
Center for Audit Quality, CFA Institute, Consumer Federation of America, and Council of Institutional Investors
Joint Oct 15, 2008 http://sec.gov/comments/4-573/4573-65.pdf
Center for Capital Markets Competitiveness CCMC Nov 13, 2008 http://sec.gov/comments/4-573/4573-154.pdf
Center for Capital Markets Competitiveness CCMC Sep 26, 2008 http://sec.gov/comments/4-573/4573-3.pdf
Center for Capital Markets Competitiveness CCMC Oct 14, 2008 http://sec.gov/comments/4-573/4573-160.pdf
Commercial Mortgage Securities Association CMSA Oct 22, 2008 http://sec.gov/comments/4-573/4573-64.pdf
Community Bankers Association of Illinois CBAI Oct 8, 2008 http://sec.gov/comments/4-573/4573-98.pdf
Credit Union National Association CUNA Nov 13, 2008 http://sec.gov/comments/4-573/4573-166.pdf
Financial Services Roundtable Roundtable Nov 13, 2008 http://sec.gov/comments/4-573/4573-142.pdf Independent Bankers Association of Texas IBAT Oct 8, 2008 http://sec.gov/comments/4-573/4573-97.pdf
Independent Bankers of Colorado IBC Oct 16, 2008 http://sec.gov/comments/4-573/4573-69.pdf Independent Community Bankers of America ICBA Nov 13, 2008 http://sec.gov/comments/4-573/4573-147.pdf
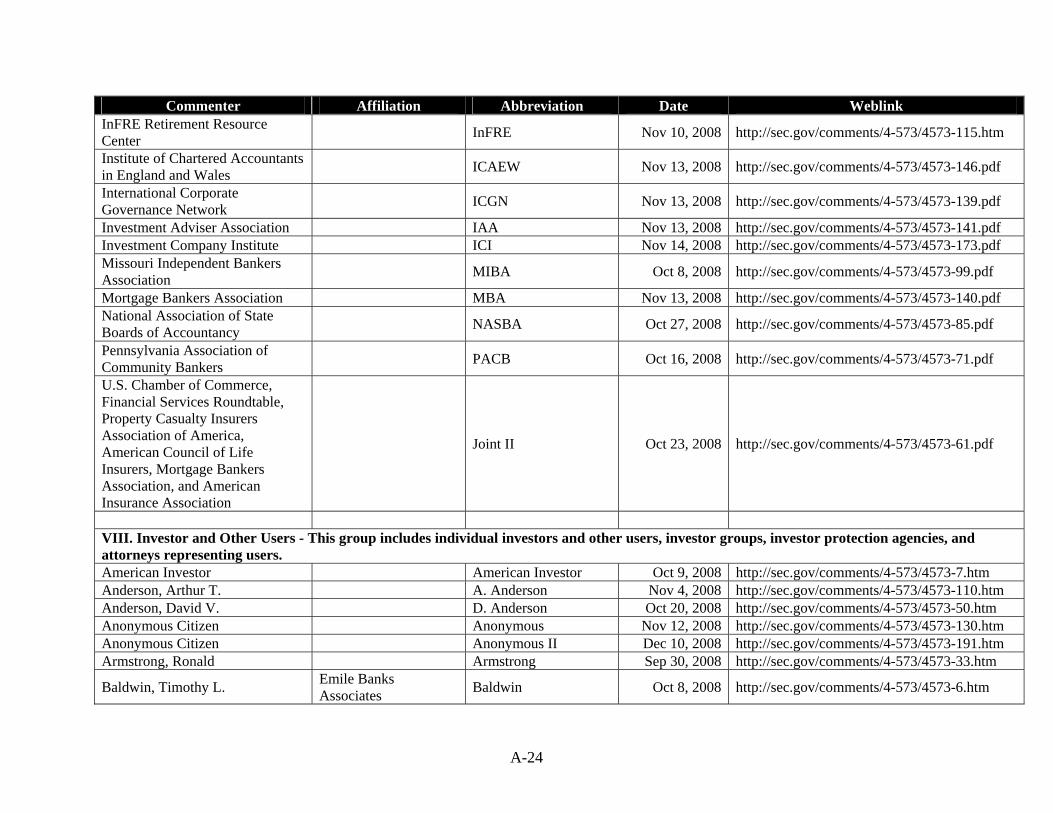
A-24
Commenter Affiliation Abbreviation Date Weblink InFRE Retirement Resource Center InFRE Nov 10, 2008 http://sec.gov/comments/4-573/4573-115.htm
Institute of Chartered Accountants in England and Wales ICAEW Nov 13, 2008 http://sec.gov/comments/4-573/4573-146.pdf
International Corporate Governance Network ICGN Nov 13, 2008 http://sec.gov/comments/4-573/4573-139.pdf
Investment Adviser Association IAA Nov 13, 2008 http://sec.gov/comments/4-573/4573-141.pdf Investment Company Institute ICI Nov 14, 2008 http://sec.gov/comments/4-573/4573-173.pdf Missouri Independent Bankers Association MIBA Oct 8, 2008 http://sec.gov/comments/4-573/4573-99.pdf
Mortgage Bankers Association MBA Nov 13, 2008 http://sec.gov/comments/4-573/4573-140.pdf National Association of State Boards of Accountancy NASBA Oct 27, 2008 http://sec.gov/comments/4-573/4573-85.pdf
Pennsylvania Association of Community Bankers PACB Oct 16, 2008 http://sec.gov/comments/4-573/4573-71.pdf
U.S. Chamber of Commerce, Financial Services Roundtable, Property Casualty Insurers Association of America, American Council of Life Insurers, Mortgage Bankers Association, and American Insurance Association
Joint II Oct 23, 2008 http://sec.gov/comments/4-573/4573-61.pdf
VIII. Investor and Other Users - This group includes individual investors and other users, investor groups, investor protection agencies, and attorneys representing users. American Investor American Investor Oct 9, 2008 http://sec.gov/comments/4-573/4573-7.htm Anderson, Arthur T. A. Anderson Nov 4, 2008 http://sec.gov/comments/4-573/4573-110.htm Anderson, David V. D. Anderson Oct 20, 2008 http://sec.gov/comments/4-573/4573-50.htm Anonymous Citizen Anonymous Nov 12, 2008 http://sec.gov/comments/4-573/4573-130.htm Anonymous Citizen Anonymous II Dec 10, 2008 http://sec.gov/comments/4-573/4573-191.htm Armstrong, Ronald Armstrong Sep 30, 2008 http://sec.gov/comments/4-573/4573-33.htm
Baldwin, Timothy L. Emile Banks Associates Baldwin Oct 8, 2008 http://sec.gov/comments/4-573/4573-6.htm
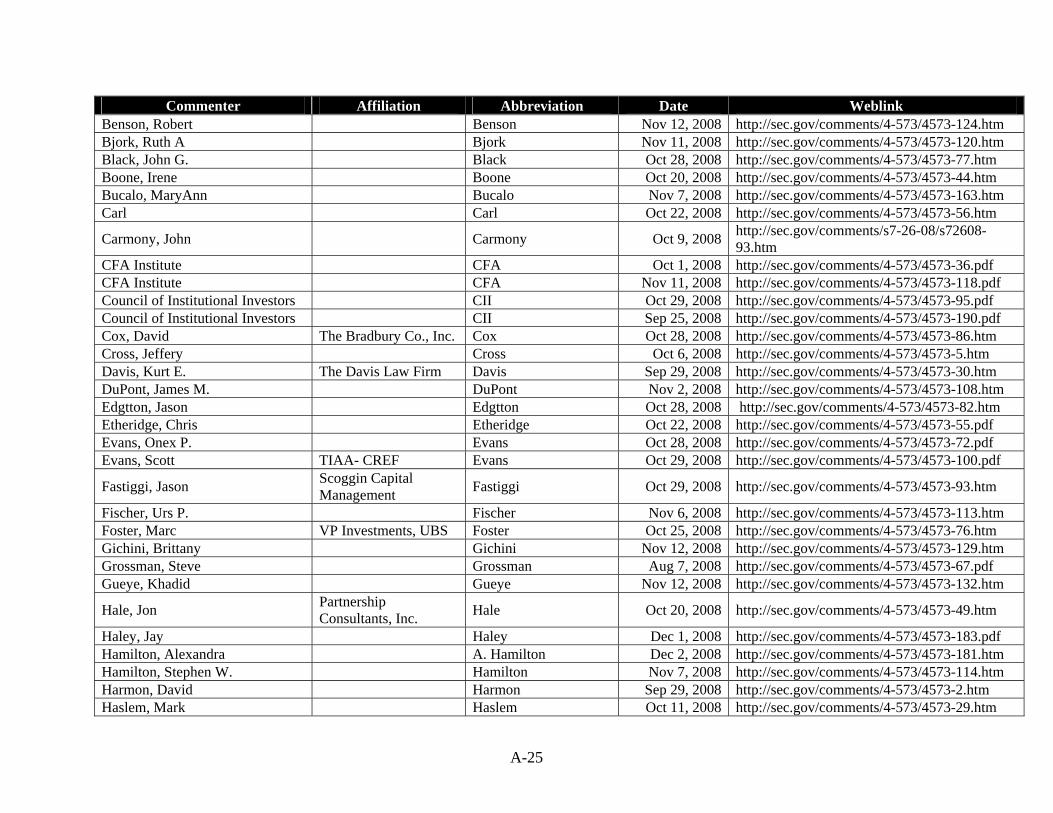
A-25
Commenter Affiliation Abbreviation Date Weblink Benson, Robert Benson Nov 12, 2008 http://sec.gov/comments/4-573/4573-124.htm Bjork, Ruth A Bjork Nov 11, 2008 http://sec.gov/comments/4-573/4573-120.htm Black, John G. Black Oct 28, 2008 http://sec.gov/comments/4-573/4573-77.htm Boone, Irene Boone Oct 20, 2008 http://sec.gov/comments/4-573/4573-44.htm Bucalo, MaryAnn Bucalo Nov 7, 2008 http://sec.gov/comments/4-573/4573-163.htm Carl Carl Oct 22, 2008 http://sec.gov/comments/4-573/4573-56.htm
Carmony, John Carmony Oct 9, 2008 http://sec.gov/comments/s7-26-08/s72608-93.htm
CFA Institute CFA Oct 1, 2008 http://sec.gov/comments/4-573/4573-36.pdf CFA Institute CFA Nov 11, 2008 http://sec.gov/comments/4-573/4573-118.pdf Council of Institutional Investors CII Oct 29, 2008 http://sec.gov/comments/4-573/4573-95.pdf Council of Institutional Investors CII Sep 25, 2008 http://sec.gov/comments/4-573/4573-190.pdf Cox, David The Bradbury Co., Inc. Cox Oct 28, 2008 http://sec.gov/comments/4-573/4573-86.htm Cross, Jeffery Cross Oct 6, 2008 http://sec.gov/comments/4-573/4573-5.htm Davis, Kurt E. The Davis Law Firm Davis Sep 29, 2008 http://sec.gov/comments/4-573/4573-30.htm DuPont, James M. DuPont Nov 2, 2008 http://sec.gov/comments/4-573/4573-108.htm Edgtton, Jason Edgtton Oct 28, 2008 http://sec.gov/comments/4-573/4573-82.htm Etheridge, Chris Etheridge Oct 22, 2008 http://sec.gov/comments/4-573/4573-55.pdf Evans, Onex P. Evans Oct 28, 2008 http://sec.gov/comments/4-573/4573-72.pdf Evans, Scott TIAA- CREF Evans Oct 29, 2008 http://sec.gov/comments/4-573/4573-100.pdf
Fastiggi, Jason Scoggin Capital Management Fastiggi Oct 29, 2008 http://sec.gov/comments/4-573/4573-93.htm
Fischer, Urs P. Fischer Nov 6, 2008 http://sec.gov/comments/4-573/4573-113.htm Foster, Marc VP Investments, UBS Foster Oct 25, 2008 http://sec.gov/comments/4-573/4573-76.htm Gichini, Brittany Gichini Nov 12, 2008 http://sec.gov/comments/4-573/4573-129.htm Grossman, Steve Grossman Aug 7, 2008 http://sec.gov/comments/4-573/4573-67.pdf Gueye, Khadid Gueye Nov 12, 2008 http://sec.gov/comments/4-573/4573-132.htm
Hale, Jon Partnership Consultants, Inc. Hale Oct 20, 2008 http://sec.gov/comments/4-573/4573-49.htm
Haley, Jay Haley Dec 1, 2008 http://sec.gov/comments/4-573/4573-183.pdf Hamilton, Alexandra A. Hamilton Dec 2, 2008 http://sec.gov/comments/4-573/4573-181.htm Hamilton, Stephen W. Hamilton Nov 7, 2008 http://sec.gov/comments/4-573/4573-114.htm Harmon, David Harmon Sep 29, 2008 http://sec.gov/comments/4-573/4573-2.htm Haslem, Mark Haslem Oct 11, 2008 http://sec.gov/comments/4-573/4573-29.htm

A-26
Commenter Affiliation Abbreviation Date Weblink Hazen, Steven Hazen Nov 12, 2008 http://sec.gov/comments/4-573/4573-136.pdf
Hodge, David Gimbal Capital Management Hodge Oct 9, 2008 http://sec.gov/comments/4-573/4573-9.htm
Investors Technical Advisory Committee ITAC Nov 13, 2008 http://sec.gov/comments/4-573/4573-159.pdf Isaac, William M. Secura Group of LECG Isaac Oct 29, 2008 http://sec.gov/comments/4-573/4573-79.pdf Jeremiah, Roger W. Jeremiah Oct 30, 2008 http://sec.gov/comments/4-573/4573-101.htm Keating, Patrick Keating Sep 30, 2008 http://sec.gov/comments/4-573/4573-35.htm
Kent, David W. Member of Association of Cost Engineers International
Kent Oct 11, 2008 http://sec.gov/comments/4-573/4573-15.htm
King, William King Oct 13, 2008 http://sec.gov/comments/4-573/4573-16.htm Knorr, Thomas L. Knorr Oct 9, 2008 http://sec.gov/comments/4-573/4573-8.htm Lane, Chris C. Lane Oct 9, 2008 http://sec.gov/comments/4-573/4573-11.htm Lane, Fred F. Lane Nov 9, 2008 http://sec.gov/comments/4-573/4573-116.htm Leavitt, Barbara Leavitt Oct 20, 2008 http://sec.gov/comments/4-573/4573-47.htm LeGuyader, Louis LeGuyader Oct 9, 2008 http://sec.gov/comments/4-573/4573-27.htm LeGuyader, Louis LeGuyader Sep 28, 2008 http://sec.gov/comments/4-573/4573-31.htm Levin, Douglas K. Levin Hu, LLP Levin Nov 17, 2008 http://sec.gov/comments/4-573/4573-168.htm Lofgreen, Shad Lofgreen Nov 21, 2008 http://sec.gov/comments/4-573/4573-174.htm Massey, Zara Massey Oct 25, 2008 http://sec.gov/comments/4-573/4573-75.htm McAllister, Teresa T. McAllister Nov 10, 2008 http://sec.gov/comments/4-573/4573-117.htm McAllister, Willis C. W. McAllister Oct 9, 2008 http://sec.gov/comments/4-573/4573-66.pdf Micheletti, Art Micheletti Oct 15, 2008 http://sec.gov/comments/4-573/4573-21.htm Miller, Jeffrey A. Miller Oct 28, 2008 http://sec.gov/comments/4-573/4573-92.htm Montroy, Vernon Montroy Oct 24, 2008 http://sec.gov/comments/4-573/4573-57.htm
Morfesis, Alex G. Trusted Capital Solutions, LLC Morfesis Oct 28, 2008 http://sec.gov/comments/4-573/4573-88.htm
Murray, Lewis Murray Oct 14, 2008 http://sec.gov/comments/4-573/4573-20.htm Nguyen, Dan J. Nguyen Nov 23, 2008 http://sec.gov/comments/4-573/4573-177.htm Oh, Lottie Oh Oct 23, 2008 http://sec.gov/comments/4-573/4573-59.htm Olson, Sue Olson Oct 10, 2008 http://sec.gov/comments/4-573/4573-28.htm
O’Malley, Niall H. Blue Point Investment Management, LLC O'Malley Dec 12, 2008 http://sec.gov/comments/4-573/4573-192.pdf
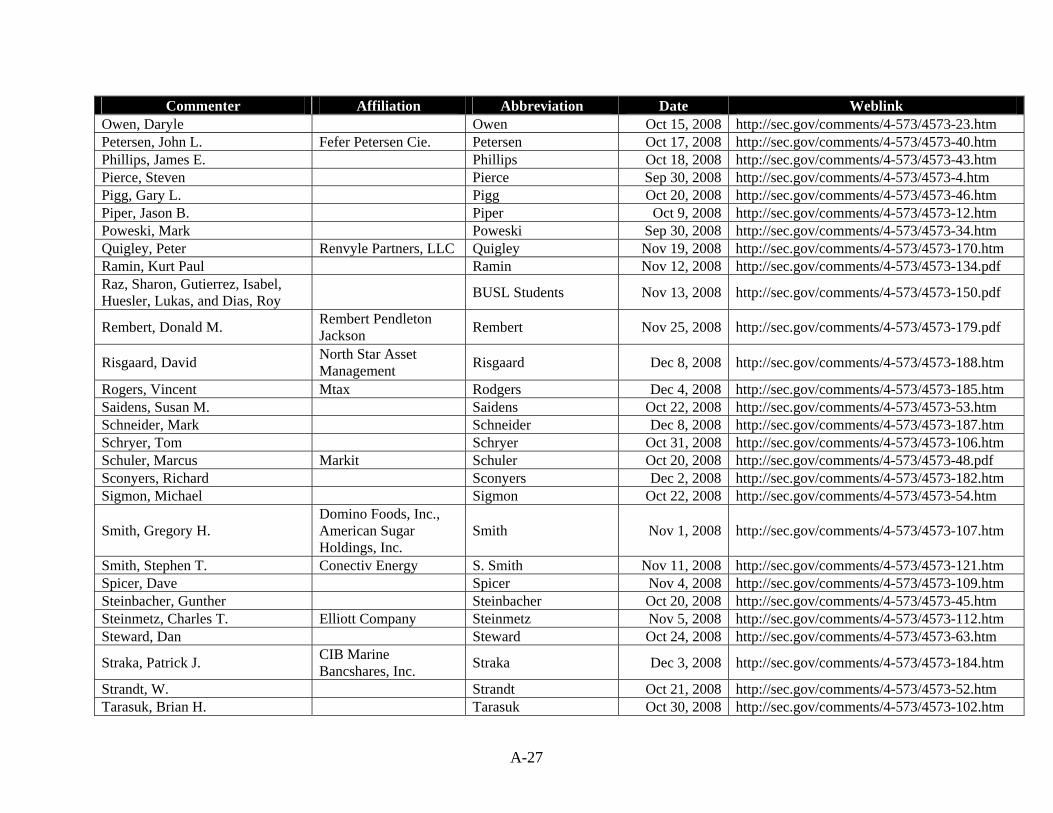
A-27
Commenter Affiliation Abbreviation Date Weblink Owen, Daryle Owen Oct 15, 2008 http://sec.gov/comments/4-573/4573-23.htm Petersen, John L. Fefer Petersen Cie. Petersen Oct 17, 2008 http://sec.gov/comments/4-573/4573-40.htm Phillips, James E. Phillips Oct 18, 2008 http://sec.gov/comments/4-573/4573-43.htm Pierce, Steven Pierce Sep 30, 2008 http://sec.gov/comments/4-573/4573-4.htm Pigg, Gary L. Pigg Oct 20, 2008 http://sec.gov/comments/4-573/4573-46.htm Piper, Jason B. Piper Oct 9, 2008 http://sec.gov/comments/4-573/4573-12.htm Poweski, Mark Poweski Sep 30, 2008 http://sec.gov/comments/4-573/4573-34.htm Quigley, Peter Renvyle Partners, LLC Quigley Nov 19, 2008 http://sec.gov/comments/4-573/4573-170.htm Ramin, Kurt Paul Ramin Nov 12, 2008 http://sec.gov/comments/4-573/4573-134.pdf Raz, Sharon, Gutierrez, Isabel, Huesler, Lukas, and Dias, Roy BUSL Students Nov 13, 2008 http://sec.gov/comments/4-573/4573-150.pdf
Rembert, Donald M. Rembert Pendleton Jackson Rembert Nov 25, 2008 http://sec.gov/comments/4-573/4573-179.pdf
Risgaard, David North Star Asset Management Risgaard Dec 8, 2008 http://sec.gov/comments/4-573/4573-188.htm
Rogers, Vincent Mtax Rodgers Dec 4, 2008 http://sec.gov/comments/4-573/4573-185.htm Saidens, Susan M. Saidens Oct 22, 2008 http://sec.gov/comments/4-573/4573-53.htm Schneider, Mark Schneider Dec 8, 2008 http://sec.gov/comments/4-573/4573-187.htm Schryer, Tom Schryer Oct 31, 2008 http://sec.gov/comments/4-573/4573-106.htm Schuler, Marcus Markit Schuler Oct 20, 2008 http://sec.gov/comments/4-573/4573-48.pdf Sconyers, Richard Sconyers Dec 2, 2008 http://sec.gov/comments/4-573/4573-182.htm Sigmon, Michael Sigmon Oct 22, 2008 http://sec.gov/comments/4-573/4573-54.htm
Smith, Gregory H. Domino Foods, Inc., American Sugar Holdings, Inc.
Smith Nov 1, 2008 http://sec.gov/comments/4-573/4573-107.htm
Smith, Stephen T. Conectiv Energy S. Smith Nov 11, 2008 http://sec.gov/comments/4-573/4573-121.htm Spicer, Dave Spicer Nov 4, 2008 http://sec.gov/comments/4-573/4573-109.htm Steinbacher, Gunther Steinbacher Oct 20, 2008 http://sec.gov/comments/4-573/4573-45.htm Steinmetz, Charles T. Elliott Company Steinmetz Nov 5, 2008 http://sec.gov/comments/4-573/4573-112.htm Steward, Dan Steward Oct 24, 2008 http://sec.gov/comments/4-573/4573-63.htm
Straka, Patrick J. CIB Marine Bancshares, Inc. Straka Dec 3, 2008 http://sec.gov/comments/4-573/4573-184.htm
Strandt, W. Strandt Oct 21, 2008 http://sec.gov/comments/4-573/4573-52.htm Tarasuk, Brian H. Tarasuk Oct 30, 2008 http://sec.gov/comments/4-573/4573-102.htm
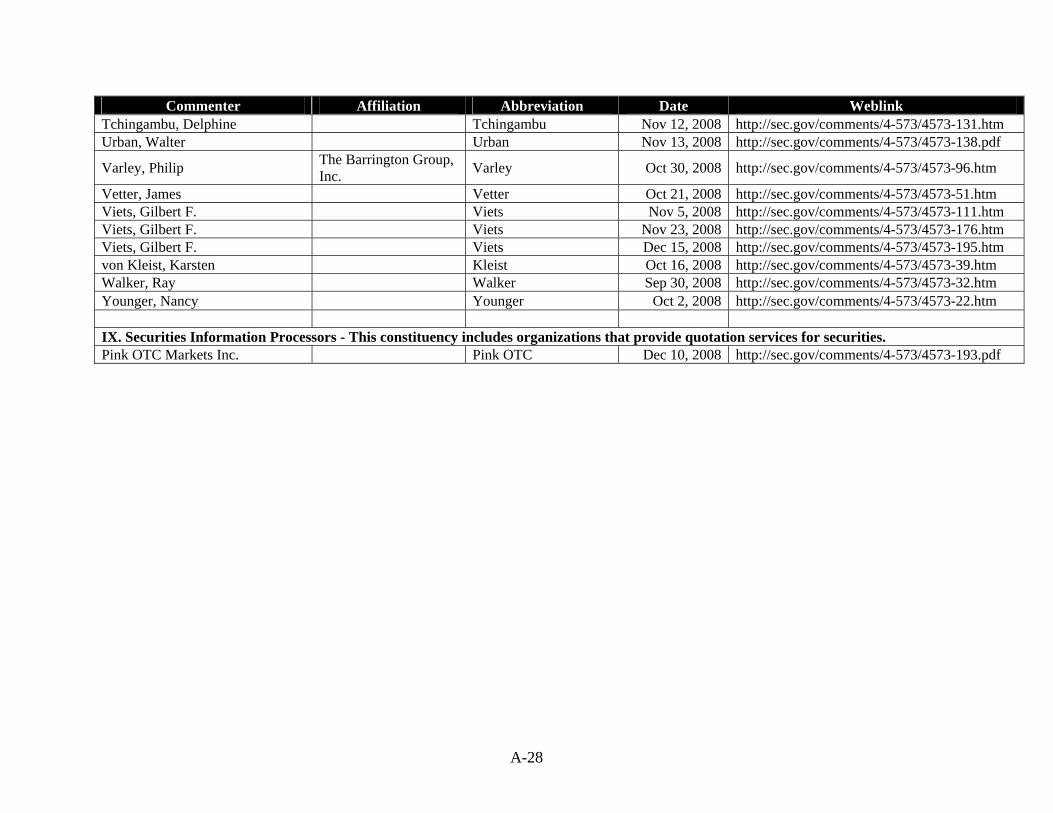
A-28
Commenter Affiliation Abbreviation Date Weblink Tchingambu, Delphine Tchingambu Nov 12, 2008 http://sec.gov/comments/4-573/4573-131.htm Urban, Walter Urban Nov 13, 2008 http://sec.gov/comments/4-573/4573-138.pdf
Varley, Philip The Barrington Group, Inc. Varley Oct 30, 2008 http://sec.gov/comments/4-573/4573-96.htm
Vetter, James Vetter Oct 21, 2008 http://sec.gov/comments/4-573/4573-51.htm Viets, Gilbert F. Viets Nov 5, 2008 http://sec.gov/comments/4-573/4573-111.htm Viets, Gilbert F. Viets Nov 23, 2008 http://sec.gov/comments/4-573/4573-176.htm Viets, Gilbert F. Viets Dec 15, 2008 http://sec.gov/comments/4-573/4573-195.htm von Kleist, Karsten Kleist Oct 16, 2008 http://sec.gov/comments/4-573/4573-39.htm Walker, Ray Walker Sep 30, 2008 http://sec.gov/comments/4-573/4573-32.htm Younger, Nancy Younger Oct 2, 2008 http://sec.gov/comments/4-573/4573-22.htm IX. Securities Information Processors - This constituency includes organizations that provide quotation services for securities. Pink OTC Markets Inc. Pink OTC Dec 10, 2008 http://sec.gov/comments/4-573/4573-193.pdf

B-1
Appendix B - Participants in SEC Roundtables on Fair Value Accounting
I. July 9, 2008 Panel One – Larger Financial Institutions Jane B. Adams Managing Director Maverick Capital Russell B. Mallett, III Partner – National Professional Practice PricewaterhouseCoopers LLP Kathy Petroni Professor of Accounting Michigan State University Joe L. Price Chief Financial Officer Bank of America Corporation Kurt N. Schacht Managing Director CFA Institute Centre for Financial Market Integrity Matthew L. Schroeder Managing Director Goldman Sachs James S. Tisch President and CEO Loews Corporation
Panel Two – Other Public Companies Leonard W. Cotton Vice Chairman Centerline Capital Group Sam Gutterman American Academy of Actuaries Charles Holm Chief Accountant Federal Reserve Board’s Division of Banking Supervision and Regulation Gary R. Kabureck Corporate Vice President, Chief Accounting Officer Xerox Corporation Kenneth B. Robins President and Treasurer Fidelity Investments — Equity and High Income Funds R. Harold Schroeder Director of Relative Value Arbitrage Carlson Capital Wes Williams Executive — Assurance Professional Practice Crowe Chizek and Company LLC John B. Wojcik Executive Vice President and Chief Financial Officer Bank of the West
B-2
II. October 29, 2008 Panel One – Mark-to-Market Accounting for Financial Institutions Ray Ball University of Chicago Vincent Colman PricewaterhouseCoopers LLP Scott Evans TIAA-CREF William Isaac Former Chairman, FDIC Richard Murray SwissRe Aubrey Patterson Bancorp South Damon Silvers AFL-CIO
Panel Two – Potential Improvements to the Current Accounting Model Randy Ferrell Fauquier Bankshares, Inc. Patrick Finnegan CFA Institute Bradley Hunkler Western Southern Life Lisa Lindsley CtW Investment Group Cindy Ma Houlihan Lokey Howard & Zukin Chuck Maimbourg Key Bank Richard Ramsden Goldman Sachs Russell Wieman Grant Thornton LLP
III. November 21, 2008 James Gilleran Jay Hanson Former Director, OTS McGladrey & Pullen, LLP Richard Jones Wayne Landsman Dechert LLP University of North Carolina David Larsen Dane Mott Duff and Phelps LLC JP Morgan Chase Donald Nicolaisen Samuel Ranzilla Former Chief Accountant of the SEC KPMG LLP

B-3
David Runkle Kevin Spataro Trilogy Global Advisors The Allstate Corporation Mark Thresher Bob Traficanti Nationwide Financial Citigroup

B-4
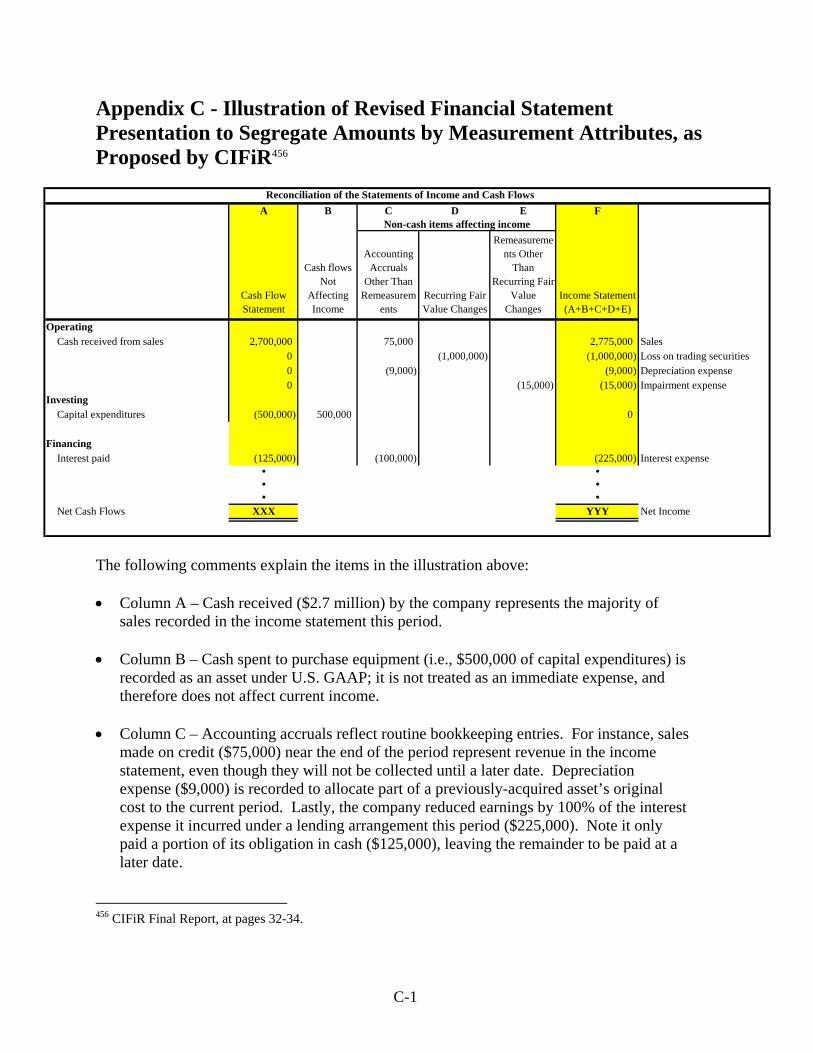
C-1
Appendix C - Illustration of Revised Financial Statement Presentation to Segregate Amounts by Measurement Attributes, as Proposed by CIFiR456
The following comments explain the items in the illustration above: • Column A – Cash received ($2.7 million) by the company represents the majority of
sales recorded in the income statement this period. • Column B – Cash spent to purchase equipment (i.e., $500,000 of capital expenditures) is
recorded as an asset under U.S. GAAP; it is not treated as an immediate expense, and therefore does not affect current income.
• Column C – Accounting accruals reflect routine bookkeeping entries. For instance, sales
made on credit ($75,000) near the end of the period represent revenue in the income statement, even though they will not be collected until a later date. Depreciation expense ($9,000) is recorded to allocate part of a previously-acquired asset’s original cost to the current period. Lastly, the company reduced earnings by 100% of the interest expense it incurred under a lending arrangement this period ($225,000). Note it only paid a portion of its obligation in cash ($125,000), leaving the remainder to be paid at a later date.
456 CIFiR Final Report, at pages 32-34.
A B C D E F
Cash Flow Statement
Cash flows Not
Affecting Income
Accounting Accruals
Other Than Remeasurem
entsRecurring Fair Value Changes
Remeasurements Other
Than Recurring Fair
Value Changes
Income Statement (A+B+C+D+E)
OperatingCash received from sales 2,700,000 75,000 2,775,000 Sales
0 (1,000,000) (1,000,000) Loss on trading securities0 (9,000) (9,000) Depreciation expense0 (15,000) (15,000) Impairment expense
InvestingCapital expenditures (500,000) 500,000 0
FinancingInterest paid (125,000) (100,000) (225,000) Interest expense. .
. .
. .Net Cash Flows XXX YYY Net Income
Reconciliation of the Statements of Income and Cash Flows
Non-cash items affecting income
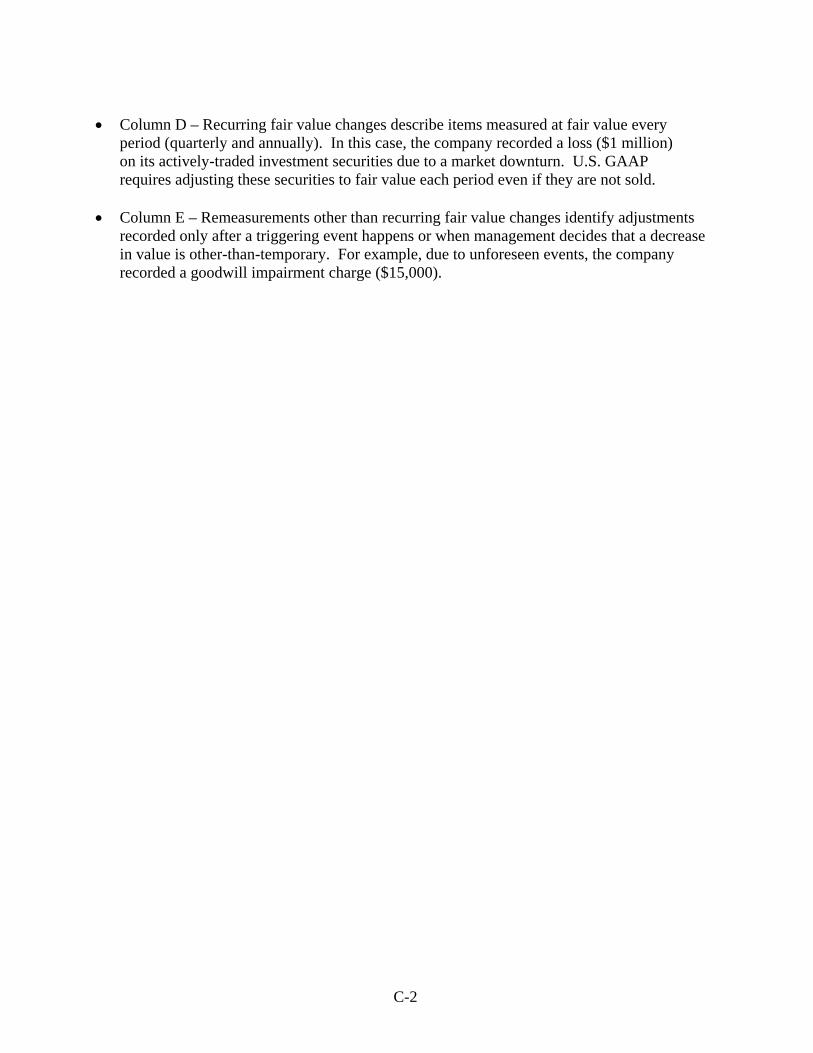
C-2
• Column D – Recurring fair value changes describe items measured at fair value every
period (quarterly and annually). In this case, the company recorded a loss ($1 million) on its actively-traded investment securities due to a market downturn. U.S. GAAP requires adjusting these securities to fair value each period even if they are not sold.
• Column E – Remeasurements other than recurring fair value changes identify adjustments
recorded only after a triggering event happens or when management decides that a decrease in value is other-than-temporary. For example, due to unforeseen events, the company recorded a goodwill impairment charge ($15,000).
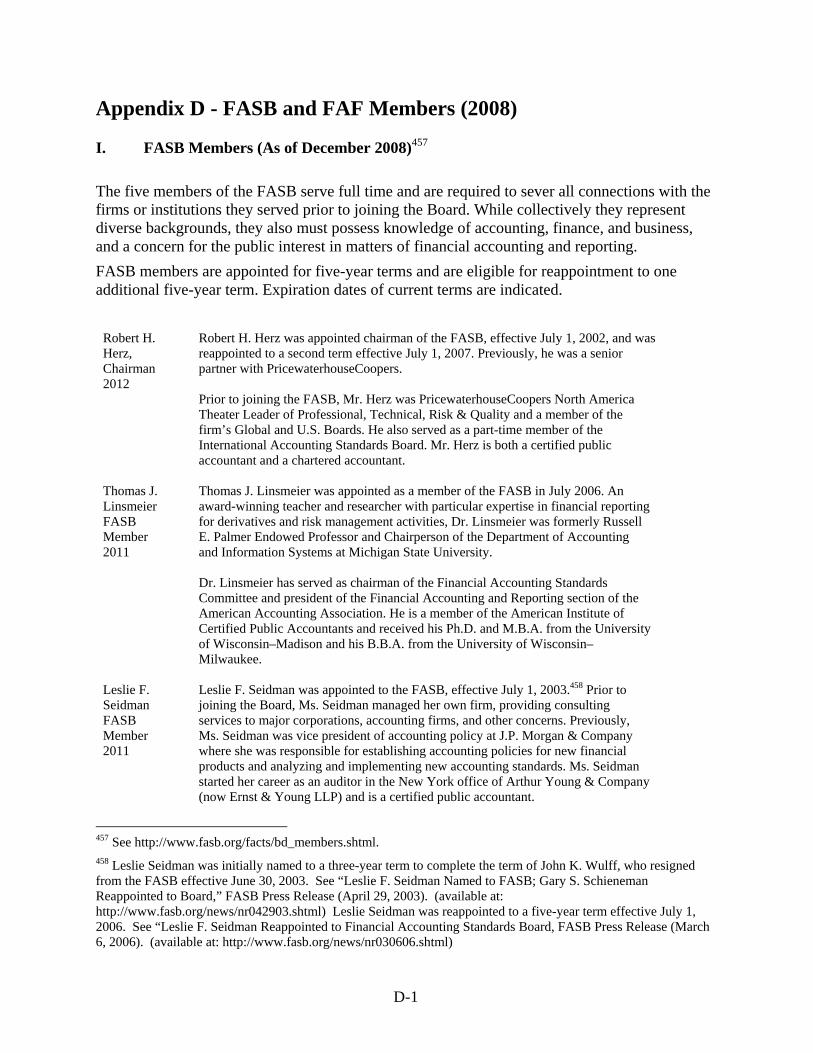
D-1
Appendix D - FASB and FAF Members (2008) I. FASB Members (As of December 2008)457 The five members of the FASB serve full time and are required to sever all connections with the firms or institutions they served prior to joining the Board. While collectively they represent diverse backgrounds, they also must possess knowledge of accounting, finance, and business, and a concern for the public interest in matters of financial accounting and reporting. FASB members are appointed for five-year terms and are eligible for reappointment to one additional five-year term. Expiration dates of current terms are indicated.
Robert H. Herz, Chairman 2012
Robert H. Herz was appointed chairman of the FASB, effective July 1, 2002, and was reappointed to a second term effective July 1, 2007. Previously, he was a senior partner with PricewaterhouseCoopers. Prior to joining the FASB, Mr. Herz was PricewaterhouseCoopers North America Theater Leader of Professional, Technical, Risk & Quality and a member of the firm’s Global and U.S. Boards. He also served as a part-time member of the International Accounting Standards Board. Mr. Herz is both a certified public accountant and a chartered accountant.
Thomas J. Linsmeier FASB Member 2011
Thomas J. Linsmeier was appointed as a member of the FASB in July 2006. An award-winning teacher and researcher with particular expertise in financial reporting for derivatives and risk management activities, Dr. Linsmeier was formerly Russell E. Palmer Endowed Professor and Chairperson of the Department of Accounting and Information Systems at Michigan State University. Dr. Linsmeier has served as chairman of the Financial Accounting Standards Committee and president of the Financial Accounting and Reporting section of the American Accounting Association. He is a member of the American Institute of Certified Public Accountants and received his Ph.D. and M.B.A. from the University of Wisconsin–Madison and his B.B.A. from the University of Wisconsin–Milwaukee.
Leslie F. Seidman FASB Member 2011
Leslie F. Seidman was appointed to the FASB, effective July 1, 2003.458 Prior to joining the Board, Ms. Seidman managed her own firm, providing consulting services to major corporations, accounting firms, and other concerns. Previously, Ms. Seidman was vice president of accounting policy at J.P. Morgan & Company where she was responsible for establishing accounting policies for new financial products and analyzing and implementing new accounting standards. Ms. Seidman started her career as an auditor in the New York office of Arthur Young & Company (now Ernst & Young LLP) and is a certified public accountant.
457 See http://www.fasb.org/facts/bd_members.shtml. 458 Leslie Seidman was initially named to a three-year term to complete the term of John K. Wulff, who resigned from the FASB effective June 30, 2003. See “Leslie F. Seidman Named to FASB; Gary S. Schieneman Reappointed to Board,” FASB Press Release (April 29, 2003). (available at: http://www.fasb.org/news/nr042903.shtml) Leslie Seidman was reappointed to a five-year term effective July 1, 2006. See “Leslie F. Seidman Reappointed to Financial Accounting Standards Board, FASB Press Release (March 6, 2006). (available at: http://www.fasb.org/news/nr030606.shtml)
D-2
Prior to launching her consulting practice, Ms. Seidman served the FASB in various capacities, most recently as assistant director of implementation and practice issues, but also as industry fellow and project manager.
Marc A. Siegel, FASB Member 2013
Marc A. Siegel was appointed to the FASB effective October 20, 2008, which term extends until June 30, 2013. Prior to his appointment, Mr. Siegel led the Accounting Research and Analysis team at the RiskMetrics Group in Rockville, Maryland. Mr. Siegel was appointed to the FASB Investor Technical Advisory Committee (ITAC) in January 2007 and is a frequent guest on CNBC and other financial TV programs, often speaking on various accounting issues in the news. He graduated Magna Cum Laude from the Wharton School of Business with a B.S. in economics in 1991.
Lawrence W. Smith, FASB Member 2012
Lawrence W. Smith was appointed to the FASB for a five-year term beginning on July 1, 2007. As part of the five-member FASB he is responsible for advancing the Board’s mission to establish and improve financial accounting and reporting standards to increase transparency for users of financial reports and increasing investor confidence in the capital markets. Prior to his appointment, Mr. Smith spent five years as FASB Director–Technical Application and Implementation Activities. In this role, he managed FASB activities related to application and implementation issues and served as chairman of its Emerging Issues Task Force (EITF). Mr. Smith joined the FASB staff in 2002 after a distinguished 25-year career at KPMG. He was a partner with KPMG from 1988 to 2002, headquartered most recently at its Stamford, Connecticut office. From 1992 to 1996 he served as a partner in the firm’s Department of Professional Practice in New York. Mr. Smith earned his Master of Science degree in accounting from Northeastern University.

D-3
II. FAF (As of December 2008)459 Officers Robert E. Denham, Chairman Robert T. Blakely, Vice Chairman Teresa S. Polley, President and Chief Operating Officer Douglas R. Ellsworth, Vice President, Secretary, & Treasurer Ronald P. Guerrette, Vice President Board of Trustees
W. Steve Albrecht Associate Dean and Professor Marriott School of Management Brigham Young University
John J. Perrell Retired Vice President—Global Policies American Express Company
Rick Anderson Chairman Moss Adams LLP
Susan M. Phillips Dean - The George Washington University School of Business
Frank H. Brod Corporate Vice President Finance and Administration & CAO Microsoft
Lee N. Price President and Chief Executive Officer Price Performance Measurement Systems, Inc.
Ellyn L. Brown Principal Brown & Associates
James H. Quigley Chief Executive Officer Deloitte & Touche Tohmatsu
Timothy P. Flynn Chairman and Chief Executive Officer KPMG LLP
John J. Radford Oregon State Controller State Controller Division
Edward M. Harrington General Manager San Francisco Public Utilities Commission
Paul C. Wirth Global Controller Morgan Stanley
Duncan M. McFarland Former Chairman and Chief Executive Officer Wellington Management Company
459 See http://www.fasb.org/faf/faf_officers&trustees.shtml.