study the growth and instability in lathyrus sativus ... dhamtari 4 durg 5 rajnandgaon 6 kawardha 7...
TRANSCRIPT
Study the Growth
Production o
D. K. Gupta,Division of Agronomy, IGKV, RMD College of Agriculture and Research Station, Ambikapur (C.G.)
Corresponding Author
Abstract: Lathyrus sativus (grass pea) is a high
drought-resistant legume consumed as a food in northern
india. Its development into an important food legume, and is
thought of as an 'insurance crop' as it produces reliable
yields when all other crops fail. However, has b
by the presence of the neurotoxin (beta
which cause irreversible paralysis. Recently, some low
lines have been developed that may prove safe for both
animal and human foods. In Chhattisgarh it is grown in large
area ,To review closer relationship of
production ,area & productivity ,we tested average growth
rate model for lathyrus production ,area & productivity for
secondary collected time series data of Chhattisgarh and
found that average growth rate o
productivity for Chhattisgarh during last three decade is
0.98,3.2 & 0.56% in 1974 to1986, 5.33, 0.24 & 5.09%
during1987 to 1999 and 5.39,3.52 & 2.29 % during 2001 to
2013, respectively .The overall growth rate of lathyrus
production , area & productivity in Chhattisgarh during
1974 to 2013 was 0.94,0.75 & 1.08 %, which is good growth
rate for the last 37 years. The highest lathyrus produced
period is 1990 to1999 & lowest for 1984 to1988 for
Chhattisgarh, and for districts of Chhatt
coefficient of variation is 69%,66% & 63% for area,
production & productivity in Jagdalpur respectively and
minimum coefficient of variation for area, production &
productivity is 11 & 23% for Bilaspur, and 19% for
Rajnandgaon respectively. These is indicate that Jagdalpur is
less consistent or stable district for area, production &
productivity of lathyrus crop and Bilaspur , Rajnandgaon
are highly stable for lathyrus crop.
Keywords: Lathyrus, Tiwara, Lathyrus Area, Production,
Productivity, Yield Etc.
I. INTRODUCTION
Lathyrus sativus (grass pea) is a high
resistant legume consumed as a food in Northern India. Its
development into an important food legume, and is
thought of as an 'insurance crop' as it produces reliable
yields when all other crops fail. However, has b
hindered by the presence of the neurotoxin (beta
in seeds which cause irreversible paralysis. Recently, some
low-toxin lines have been developed that may prove safe
for both animal and human foods.
Seed yields of grass pea crops range from 900
per hectare; while crops sown from inoculated seeds
yielded up to 2,000 kg ha-1 in the United States (Kay,
1979; Duke, 1981). "Yields are proportional to the seeding
rates used. An average crop at a seeding rate of 40 kg per
hectare yields about 925 kg per hectare of pulse and 3.2
metric tons per hectare of forage in India. At the seeding
Copyright © 2015 IJAIR, All right reserved
1297
International Journal of Agriculture Innovations and Research
Volume 3, Issue
he Growth and Instability in Lathyrus Sativus
Production of Chhattisgarh
, Neelam Chouksey, A. K. Sinha and Rajesh Chouksey
Division of Agronomy, IGKV, RMD College of Agriculture and Research Station, Ambikapur (C.G.)
Corresponding Author email: [email protected]
(grass pea) is a high-yielding,
resistant legume consumed as a food in northern
india. Its development into an important food legume, and is
thought of as an 'insurance crop' as it produces reliable
yields when all other crops fail. However, has been hindered
by the presence of the neurotoxin (beta-ODAP) in seeds
which cause irreversible paralysis. Recently, some low-toxin
lines have been developed that may prove safe for both
animal and human foods. In Chhattisgarh it is grown in large
view closer relationship of lathyrus sativus
production ,area & productivity ,we tested average growth
rate model for lathyrus production ,area & productivity for
secondary collected time series data of Chhattisgarh and
found that average growth rate of production ,area &
productivity for Chhattisgarh during last three decade is
0.98,3.2 & 0.56% in 1974 to1986, 5.33, 0.24 & 5.09%
during1987 to 1999 and 5.39,3.52 & 2.29 % during 2001 to
2013, respectively .The overall growth rate of lathyrus
, area & productivity in Chhattisgarh during
1974 to 2013 was 0.94,0.75 & 1.08 %, which is good growth
rate for the last 37 years. The highest lathyrus produced
period is 1990 to1999 & lowest for 1984 to1988 for
Chhattisgarh, and for districts of Chhattisgarh maximum
coefficient of variation is 69%,66% & 63% for area,
production & productivity in Jagdalpur respectively and
minimum coefficient of variation for area, production &
productivity is 11 & 23% for Bilaspur, and 19% for
These is indicate that Jagdalpur is
less consistent or stable district for area, production &
productivity of lathyrus crop and Bilaspur , Rajnandgaon
, Tiwara, Lathyrus Area, Production,
NTRODUCTION
(grass pea) is a high-yielding, drought-
resistant legume consumed as a food in Northern India. Its
development into an important food legume, and is
thought of as an 'insurance crop' as it produces reliable
yields when all other crops fail. However, has been
hindered by the presence of the neurotoxin (beta-ODAP)
in seeds which cause irreversible paralysis. Recently, some
toxin lines have been developed that may prove safe
Seed yields of grass pea crops range from 900-1,500 kg
per hectare; while crops sown from inoculated seeds
in the United States (Kay,
1979; Duke, 1981). "Yields are proportional to the seeding
rates used. An average crop at a seeding rate of 40 kg per
5 kg per hectare of pulse and 3.2
metric tons per hectare of forage in India. At the seeding
rate of about 14 kg per hectare in mixed cultivation, yield
per hectare is about 300 kg of pulse and 0.5 metric tons of
straw. Ukrainian experiments with sewage ir
yields of 3120 kg seeds per hectare. The sewage irrigation
slightly decreased the 1,000
increased seed N, P, and K concentrations and nutritive
values of fresh forage and hay. In India, grass pea
occupies about 4% of the total pulse crop and constitutes
about 0.3% of the total pulse production, with about 1.6
million hectares, producing about 0.5 million metric tons
of seeds" (Duke, 1981). With the identification of high
yielding and low ODAP lines, production is expe
increase in the future" (Smart
pea growing states in India are Madhya Pradesh,
Maharashtra, Bihar, Orissa, West Bengal and Eastern
Uttar Pradesh. It is grown on an area of approximately 1.5
million hectares with the an
tonnes. Nearly two-thirds of national acreage under grass
pea is in southeastern Madhya Pradesh and in the
Vidarbha region of Maharashtra.
II. MATERIALS
The study was mainly based on the secondary data.
Time series were collected for the period from the
financial year 1973-74 to 2012
gram crop production, area, productivity and support price
were collected from various governme
Coefficient of Variation: Time series data on production, area and productivity of
lathyrus crop were analyzed to estimate their Co
of Variation by using the following formula:
�. �. �
Where σ = standard deviatio
X = Arithmetic Mean
Growth Rate Model: Time series data on production, area and productivity of
lathyrus crop were analyzed to estimate their growth rate
by using the following growth model:
gx = ( X
Where:
gx =Average Growth rate
X0 =Initial value of variable X
XT =Final value of variable X
0 = Base year
Manuscript Processing Details (dd/mm/yyyy) :
Received : 12/02/2015 | Accepted on : 2
Journal of Agriculture Innovations and Research
Volume 3, Issue 5, ISSN (Online) 2319-1473
in Lathyrus Sativus
Chhattisgarh
Sinha and Rajesh Chouksey Division of Agronomy, IGKV, RMD College of Agriculture and Research Station, Ambikapur (C.G.)-497001
rate of about 14 kg per hectare in mixed cultivation, yield
per hectare is about 300 kg of pulse and 0.5 metric tons of
straw. Ukrainian experiments with sewage irrigation gave
yields of 3120 kg seeds per hectare. The sewage irrigation
slightly decreased the 1,000-seed weight, but markedly
increased seed N, P, and K concentrations and nutritive
values of fresh forage and hay. In India, grass pea
the total pulse crop and constitutes
about 0.3% of the total pulse production, with about 1.6
million hectares, producing about 0.5 million metric tons
of seeds" (Duke, 1981). With the identification of high
yielding and low ODAP lines, production is expected to
increase in the future" (Smart et al., 1994).The major grass
pea growing states in India are Madhya Pradesh,
Maharashtra, Bihar, Orissa, West Bengal and Eastern
Uttar Pradesh. It is grown on an area of approximately 1.5
million hectares with the annual production of 0.8 million
thirds of national acreage under grass
pea is in southeastern Madhya Pradesh and in the
Vidarbha region of Maharashtra.
ATERIALS AND METHODS
The study was mainly based on the secondary data.
Time series were collected for the period from the
74 to 2012-13. For this period, data on
gram crop production, area, productivity and support price
were collected from various government publications.
Coefficient of Variation: Time series data on production, area and productivity of
lathyrus crop were analyzed to estimate their Co-efficient
of Variation by using the following formula:
��
�� 100
= standard deviation
X = Arithmetic Mean
Time series data on production, area and productivity of
lathyrus crop were analyzed to estimate their growth rate
by using the following growth model:
T/XO )1/T
-- 1
=Initial value of variable X
=Final value of variable X
Manuscript Processing Details (dd/mm/yyyy) :
| Accepted on : 21/02/2015 | Published : 07/03/2015
T = Final year
III. RESULT AND DISCUSSION
This study presents pattern of production, area,
productivity & effect of growth and instability in
sativus production of Chhattisgarh. Production, area and
productivity of lathyrus crop in Chhattisgarh are showed
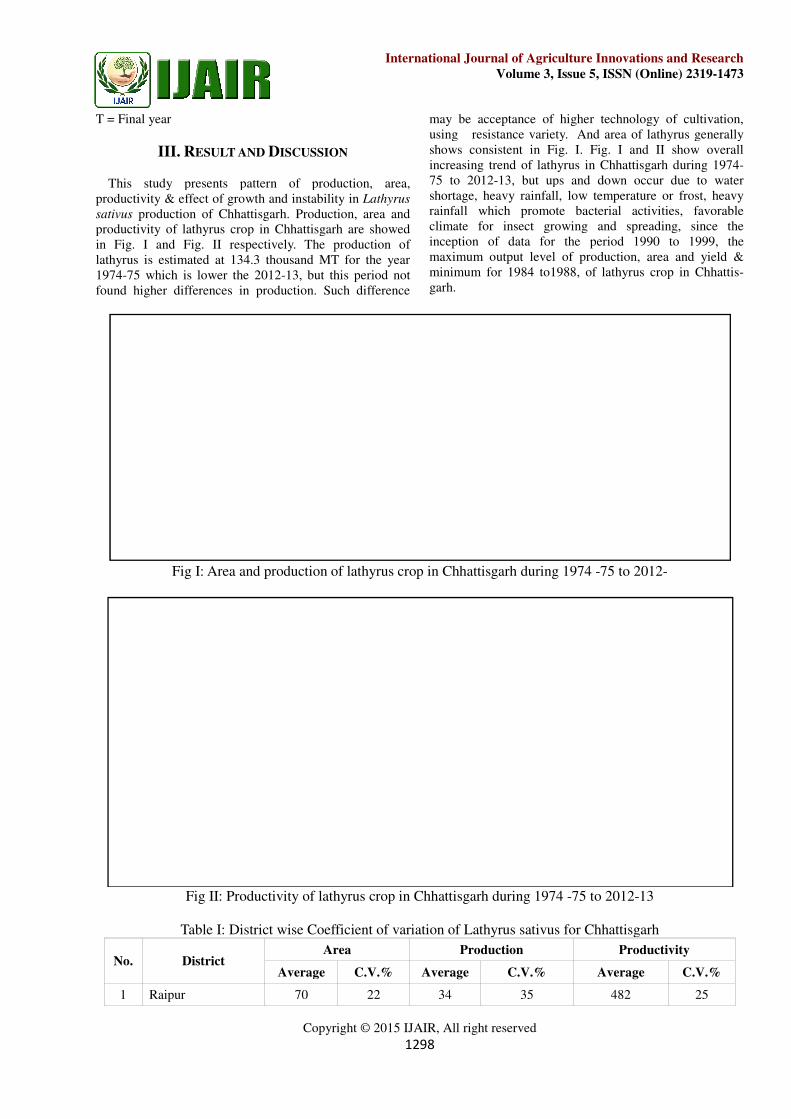
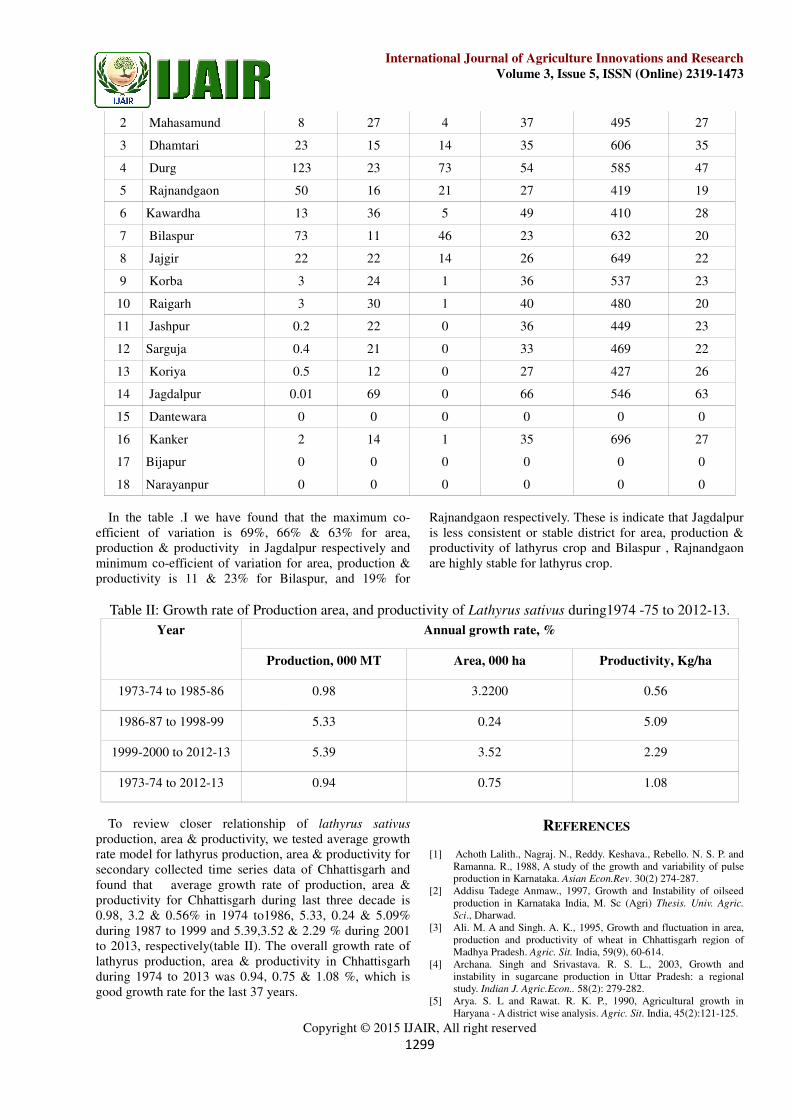
in Fig. I and Fig. II respectively. The production of
lathyrus is estimated at 134.3 thousand MT for the year
1974-75 which is lower the 2012-13, but this period not
found higher differences in production. Such difference
Fig I: Area and production of lathyrus crop in
Fig II: Productivity of lathyrus crop in Chhattisgarh during 1974
Table I: District wise Coefficient of variation of Lathyrus sativus for Chhattisgarh
No. District Average
1 Raipur
Copyright © 2015 IJAIR, All right reserved
1298
International Journal of Agriculture Innovations and Research
Volume 3, Issue
ISCUSSION
This study presents pattern of production, area,
productivity & effect of growth and instability in Lathyrus
production of Chhattisgarh. Production, area and
productivity of lathyrus crop in Chhattisgarh are showed
in Fig. I and Fig. II respectively. The production of
lathyrus is estimated at 134.3 thousand MT for the year
13, but this period not
found higher differences in production. Such difference
may be acceptance of higher technology of cultivation,
using resistance variety. And area of lathyrus generally
shows consistent in Fig. I. Fig. I and II show overa
increasing trend of lathyrus in Chhattisgarh during 1974
75 to 2012-13, but ups and down occur due to water
shortage, heavy rainfall, low temperature or frost, heavy
rainfall which promote bacterial activities, favorable
climate for insect growing and s
inception of data for the period 1990 to 1999, the
maximum output level of production, area and yield &
minimum for 1984 to1988, of lathyrus crop in Chhattis
garh.
Fig I: Area and production of lathyrus crop in Chhattisgarh during 1974
Fig II: Productivity of lathyrus crop in Chhattisgarh during 1974 -75 to 2012
Table I: District wise Coefficient of variation of Lathyrus sativus for Chhattisgarh
Area Production
Average C.V.% Average C.V.%
70 22 34 35
Journal of Agriculture Innovations and Research
Volume 3, Issue 5, ISSN (Online) 2319-1473
may be acceptance of higher technology of cultivation,
using resistance variety. And area of lathyrus generally
shows consistent in Fig. I. Fig. I and II show overall
increasing trend of lathyrus in Chhattisgarh during 1974-
13, but ups and down occur due to water
shortage, heavy rainfall, low temperature or frost, heavy
rainfall which promote bacterial activities, favorable
climate for insect growing and spreading, since the
inception of data for the period 1990 to 1999, the
maximum output level of production, area and yield &
minimum for 1984 to1988, of lathyrus crop in Chhattis-
Chhattisgarh during 1974 -75 to 2012-
75 to 2012-13
Table I: District wise Coefficient of variation of Lathyrus sativus for Chhattisgarh
Productivity
Average C.V.%
482 25
2 Mahasamund
3 Dhamtari
4 Durg
5 Rajnandgaon
6 Kawardha
7 Bilaspur
8 Jajgir
9 Korba
10 Raigarh
11 Jashpur
12 Sarguja
13 Koriya
14 Jagdalpur
15 Dantewara
16 Kanker
17 Bijapur
18 Narayanpur
In the table .I we have found that the maximum co
efficient of variation is 69%, 66% & 63% for area,
production & productivity in Jagdalpur respectively and
minimum co-efficient of variation for area, production &
productivity is 11 & 23% for Bilaspur, and 19% for
Table II: Growth rate of Production area, and productivity of
Year
Production, 000 MT
1973-74 to 1985-86
1986-87 to 1998-99
1999-2000 to 2012-13
1973-74 to 2012-13
To review closer relationship of
production, area & productivity, we tested average growth
rate model for lathyrus production, area & productivity for
secondary collected time series data of Chhattisgarh and
found that average growth rate of production, area &
productivity for Chhattisgarh during last three decade is
0.98, 3.2 & 0.56% in 1974 to1986, 5.33, 0.24 & 5.09%
during 1987 to 1999 and 5.39,3.52 & 2.29 % during 2001
to 2013, respectively(table II). The overall growth rate of
lathyrus production, area & productivity in Chhattisgarh
during 1974 to 2013 was 0.94, 0.75 & 1.08 %, which is
good growth rate for the last 37 years.
Copyright © 2015 IJAIR, All right reserved
1299
International Journal of Agriculture Innovations and Research
Volume 3, Issue
8 27 4 37
23 15 14 35
123 23 73 54
50 16 21 27
13 36 5 49
73 11 46 23
22 22 14 26
3 24 1 36
3 30 1 40
0.2 22 0 36
0.4 21 0 33
0.5 12 0 27
0.01 69 0 66
0 0 0 0
2 14 1 35
0 0 0 0
0 0 0 0
In the table .I we have found that the maximum co-
efficient of variation is 69%, 66% & 63% for area,
productivity in Jagdalpur respectively and
efficient of variation for area, production &
productivity is 11 & 23% for Bilaspur, and 19% for
Rajnandgaon respectively. These is indicate that Jagdalpur
is less consistent or stable district for ar
productivity of lathyrus crop and Bilaspur , Rajnandgaon
are highly stable for lathyrus crop.
Table II: Growth rate of Production area, and productivity of Lathyrus sativus during1974
Annual growth rate, %
Production, 000 MT Area, 000 ha
0.98 3.2200
5.33 0.24
5.39 3.52
0.94 0.75
To review closer relationship of lathyrus sativus
production, area & productivity, we tested average growth
rate model for lathyrus production, area & productivity for
secondary collected time series data of Chhattisgarh and
e of production, area &
productivity for Chhattisgarh during last three decade is
0.98, 3.2 & 0.56% in 1974 to1986, 5.33, 0.24 & 5.09%
during 1987 to 1999 and 5.39,3.52 & 2.29 % during 2001
to 2013, respectively(table II). The overall growth rate of
us production, area & productivity in Chhattisgarh
during 1974 to 2013 was 0.94, 0.75 & 1.08 %, which is
good growth rate for the last 37 years.
REFERENCES
[1] Achoth Lalith., Nagraj. N., Reddy. Keshava., Rebello. N. S. P. and
Ramanna. R., 1988, A study of the growth and variability of pulse
production in Karnataka. Asian Econ.Rev
[2] Addisu Tadege Anmaw., 1997, Growth and Instability of oilseed
production in Karnataka India, M. Sc (Agri)
Sci., Dharwad.
[3] Ali. M. A and Singh. A. K., 1995, Growth and fluctuation in area,
production and productivity of wheat in Chhattisgarh region of
Madhya Pradesh. Agric. Sit.
[4] Archana. Singh and Srivastava. R. S. L., 2003, Growth and
instability in sugarcane production in Uttar Pradesh: a regional
study. Indian J. Agric.Econ..
[5] Arya. S. L and Rawat. R. K. P., 1990, Agricultural growth in
Haryana - A district wise analysis.
Journal of Agriculture Innovations and Research
Volume 3, Issue 5, ISSN (Online) 2319-1473
495 27
606 35
585 47
419 19
410 28
632 20
649 22
537 23
480 20
449 23
469 22
427 26
546 63
0 0
696 27
0 0
0 0
Rajnandgaon respectively. These is indicate that Jagdalpur
is less consistent or stable district for area, production &
productivity of lathyrus crop and Bilaspur , Rajnandgaon
are highly stable for lathyrus crop.
during1974 -75 to 2012-13.
Productivity, Kg/ha
0.56
5.09
2.29
1.08
EFERENCES
Achoth Lalith., Nagraj. N., Reddy. Keshava., Rebello. N. S. P. and
Ramanna. R., 1988, A study of the growth and variability of pulse
Asian Econ.Rev. 30(2) 274-287.
Addisu Tadege Anmaw., 1997, Growth and Instability of oilseed
production in Karnataka India, M. Sc (Agri) Thesis. Univ. Agric.
Ali. M. A and Singh. A. K., 1995, Growth and fluctuation in area,
production and productivity of wheat in Chhattisgarh region of
Agric. Sit. India, 59(9), 60-614.
Archana. Singh and Srivastava. R. S. L., 2003, Growth and
instability in sugarcane production in Uttar Pradesh: a regional
Indian J. Agric.Econ.. 58(2): 279-282.
Arya. S. L and Rawat. R. K. P., 1990, Agricultural growth in
A district wise analysis. Agric. Sit. India, 45(2):121-125.
[6] Billore, S. D. and Joshi, O. P., 1998, Growth in area, production and
productivity of soybean in India. Agric. Sit
[7] Borthakur, N. and Krishnamoorthy, S., 1997, S
instability in the production of rapeseed
Sit. India, 54(1):17-19.
[8] Cauvery. R., 1993, Implications of inter
growth of groundnut in Tamil Nadu.
[9] Chengappa, P. G., 1981, Growth rates of area, production and
productivity of coffee. Indian J. Coffee Res
[10] Dhindsa. K. K. and Sharma. A., 1996, Growth of agricultural
production and productivity in Punjab 1970
component analysis. Anvesak. 26(1): 51
[11] Gaddi. G. M., Koppad, M. B., Gummagolmath. K. C. and Naik. A.
D., 1999, An economic analysis of growth performance of oilseed
crops in India. Karnataka J. Agric. Sci.,12(1/4): 93
[12] Gautam. D. S and Verma. O. P., 1993, Growth and ins
rapeseed and mustard production: districts of Gird region.
Res. J. 27(1): 77-81.
Copyright © 2015 IJAIR, All right reserved
1300
International Journal of Agriculture Innovations and Research
Volume 3, Issue
Billore, S. D. and Joshi, O. P., 1998, Growth in area, production and
Agric. Sit. India, 55(8): 495-499.
Borthakur, N. and Krishnamoorthy, S., 1997, Sources of growth and
instability in the production of rapeseed-mustard in Assam. Agric.
Cauvery. R., 1993, Implications of inter-district variations in the
rates of area, production and
Indian J. Coffee Res., 11(2): 19-26.
[10] Dhindsa. K. K. and Sharma. A., 1996, Growth of agricultural
production and productivity in Punjab 1970-73 through 1990-93 - a
): 51-61.
Gaddi. G. M., Koppad, M. B., Gummagolmath. K. C. and Naik. A.
D., 1999, An economic analysis of growth performance of oilseed
.,12(1/4): 93-98.
Gautam. D. S and Verma. O. P., 1993, Growth and instability of
rapeseed and mustard production: districts of Gird region. JNKVV
Journal of Agriculture Innovations and Research
Volume 3, Issue 5, ISSN (Online) 2319-1473