study the impact of compliance and best practices
TRANSCRIPT

STUDY THE IMPACT OF COMPLIANCE AND BEST PRACTICES MANAGEMENT ON IT OUTSOURCING
SPECIFIC TO LIFE SCIENCES – INFORMATION TECHNOLOGY
INDUSTRIES IN INDIA
Thesis Submitted to Padmashree Dr. D. Y. Patil University Department of Business Management
in partial fulfillment of the requirements for the award of the Degree of
DOCTOR OF PHILOSOPHY
In BUSINESS MANAGEMENT
Submitted by
Mr. DAMODAR C RAO
(Enrollment No. DYP-PhD 09005)
Research Guide Dr. R. GOPAL
DIRECTOR, DEAN & HEAD OF DEPARTMENT
PADMASHREE DR. D.Y. PATIL UNIVERSITY DEPARTMENT OF BUSINESS MANAGEMENT
Sector 4, Plot No. 10, CBD Belapur, Navi Mumbai – 400 614
August 2012


i
DECLARATION
I hereby declare that the thesis entitled “Study the Impact of
Compliance and Best Practices Management on IT Outsourcing –
Specific Reference to Life Sciences – IT Industries in India”
submitted for the Award of Doctor of Philosophy in Business
Management at Padmashree Dr. D.Y. Patil University Department of
Business Management is my original work and the thesis has not
formed the basis for the award previously of any degree, associate
ship, fellowship or any other similar titles.
Place: Navi Mumbai
Date:
Signature of Guide Signature of Signature of Student
Head of Dept.

ii
CERTIFICATE
This is to certify that the thesis entitled “Study the Impact of Compliance
and Best Practices Management on IT Outsourcing – Specific
Reference to Life Sciences – IT Industries” and submitted by Mr.
Damodar C Rao is a bonafide research work for the award of the Doctor
of Philosophy in Business Management at Padmashree Dr. D. Y. Patil
University Department of Business Management in partial fulfillment of
the requirements for the award of the Degree of Doctor of Philosophy
in Business Management and that the thesis has not formed the basis
for the award previously of any degree, diploma, associate ship,
fellowship or any other similar title of any University or Institution.
Also it is certified that the thesis represents an independent work on the
part of the candidate.
Place: Navi Mumbai
Date:
Signature of the Signature of the Guide Head of Department

iii
ACKNOWLEDGEMENT
I am greatly indebted to Padmashree Dr. D.Y. Patil University,
Department of Business Management which has accepted me for the
Doctoral Program and provided me with an excellent opportunity to
carry out the present research work.
I am grateful to my guide, mentor, philosopher Dr. R. Gopal for having
guided me throughout the research span of time and for providing his
constructive criticism which made me bring my best. I would also like to
thank Sir for being approachable at any point of time without considering
his own precious personal time.
I thank Ms. Simpoo Singh for motivating me to pursue PhD and my
spouse Mrs. Sreedevi Rao (Devi) for her support in my research work. I
also thank my friends Giridhar Rao, Srihari Reddy and Venkat Reddy for
helping me reach industry contacts. I would be failing in my duty if I did not
thank IBM and my Managers for helping me throughout the research work.
Lastly, I thank all my near and dear ones who have been directly and
indirectly instrumental in the completion of my dissertation.
I convey many thanks to everyone who has been influential and
supportive in this research work.
Place: Mumbai Date: Signature of the student

iv
TABLE OF CONTENTS DECLARATION ............................................................................................................... i
CERTIFICATE................................................................................................................. ii
ACKNOWLEDGEMENT............................................................................................... iii
LIST OF TABLES.......................................................................................................... vii
LIST OF FIGURES....................................................................................................... viii
LIST OF ABBREVIATIONS ......................................................................................... ix
EXECUTIVE SUMMARY ........................................................................................... xiii
CHAPTER 1...................................................................................................................... 1
Introduction – Outsourcing Definitions and Practices.................................................. 1
1.1 Outsourcing – Origin of Concept.......................................................................... 3
1.2 Outsourcing and Offshoring – How Close and How Far?.................................... 7
1.3 Concepts of Outsourcing....................................................................................... 8
1.4 Outsourcing Evolution in India........................................................................... 11
1.5 Theories on Outsourcing..................................................................................... 12
1.6 Outsourcing Strategies ........................................................................................ 15
1.6.1 Size and Nature of Companies......................................................................... 15
1.6.2 Outsourcing Determinants ............................................................................... 17
1.6.3 What are Life Sciences Companies looking for?............................................. 25
1.6.4 How Life Sciences Companies are building up? ............................................. 27
1.6.5 India and China Contest................................................................................... 31
1.6.6 Gaps in Capabilities ......................................................................................... 35
1.7 Skills to Develop................................................................................................. 37
CHAPTER 2.................................................................................................................... 43
Review of Literature....................................................................................................... 43
2.1 Western Research on Outsourcing...................................................................... 51
2.2 India and China Research on Outsourcing.......................................................... 53
2.3 Studies on Life Sciences Companies Behavior .................................................. 63
2.4 Studies on Information Technology Companies Behavior................................. 65

v
2.5 Research Gap Analysis ....................................................................................... 67
CHAPTER 3.................................................................................................................... 69
Statement of the Problem and Research Methodology ............................................... 69
3.1 Statement of the Problem / Scope of the Study .................................................. 69
3.2 Objectives of the Study....................................................................................... 70
3.3 Hypothesis........................................................................................................... 71
3.4 Pre-study ............................................................................................................. 72
3.5 Primary and Secondary Data .............................................................................. 72
3.6 Instruments for Survey........................................................................................ 74
3.7 Selection of Samples........................................................................................... 75
3.8 Pre Testing Phase................................................................................................ 76
3.9 Tabulation and Statistical Analysis of Data........................................................ 76
3.10 Interpretation and Report Writing..................................................................... 77
3.11 Limitations of the Study.................................................................................... 77
3.12 Significance of the Study.................................................................................. 78
CHAPTER 4.................................................................................................................... 79
Data Interpretations and Findings................................................................................ 79
4.1 Data Analysis – Life Sciences (LS) Questionnaire Responses........................... 79
4.2 Data Analysis – Information Technology (IT) Questionnaire Responses ........ 113
CHAPTER 5.................................................................................................................. 138
Conclusion ..................................................................................................................... 138
CHAPTER 6.................................................................................................................. 149
Recommendations and Suggestions ............................................................................ 149
BIBLIOGRAPHY......................................................................................................... 160
REFERENCE SECTION............................................................................................. 181
Annex I – Objectives of the Study, Problem Statement, Research Gap, Hypothesis
and Survey Questions Mapping................................................................................... 182
Annex II – Offshore Outsourcing Destinations in India ........................................... 183
Annex III – List of Offshore Outsourcing Companies .............................................. 189
Annexure IV – List of BPO Companies...................................................................... 200

vi
Annex V – Companies Included in the Research....................................................... 205
Life Sciences Companies........................................................................................ 205
Information Technology Companies ...................................................................... 206
Annex VI – Research Questionnaires ......................................................................... 207
Life Sciences - IT Outsourcing (Survey-1)............................................................. 207
Life Sciences - IT Outsourcing (Survey-2)............................................................. 213
Annex VII – Statistical Tables of SPSS Analysis ....................................................... 219

vii
LIST OF TABLES
Section No.
Table No. Table Description Page
No.
1.6.2 1 Outsourcing Motivators and Models 20
1.6.2 2 Vendor Evaluation Parameters 21
1.6.2 3 Cultural Compatibility While Choosing Vendors 23
1.6.4 4 Parameters to Consider While Managing and Evaluating Contracts
24, 25
1.6.4 5 Ownership Structure in Companies 27
3.7 6 Selection of Samples 75
6.0 7 Matrix Analysis – Work Sheet 1 158
6.0 8 Matrix Analysis – Work Sheet 2 159
Annex I 9 Mapping of Objectives, Problem Statement, Research Gap, Hypothesis and Survey Questions
182

viii
LIST OF FIGURES
Section
No. Figure
No. Figure Description Page No.
1.1 1 List of Top 10 Pharmaceutical Companies 6
1.4 2 Outsourcing Evolution in India 11
1.5 3 Outsourcing Process 13
1.5 4 Leadership Thinking on Outsourcing Services 14
1.6.2 5 Outsourcing Profiles of Top 10 Life Sciences Companies 17
1.6.2 6 CIOs Perspectives on Blending Roles 18
1.6.4 7 Offshore Outsourcing Drivers 29
1.6.4 8 Priorities for European Companies Considering Offshoring 30
1.6.4 9 Savings Due to Offshore Outsourcing 31
1.6.5 10 IT Locations in India and Categorization 35
1.6.6 11 Gaps in Capabilities between Clients and Vendors – Demand 36
1.6.6 12 Gaps in Capabilities between Clients and Vendors - Supply 36
1.7 13 TPI Service Management Operating Model Framework 42

ix
LIST OF ABBREVIATIONS
AD - Application Development
AMS - Application Maintenance Services
APAC - Asia Pacific Region
BFSI - Banking, Financial Services and Insurance
BOT - Build-Operate-Transfer
BPO - Business Process Outsourcing
CDE - Center for Drug Evaluation, Taiwan
CDM - Clinical Data Management
CDSCO - Central Drugs Standard Control Organization, India
CEO - Chief Executive Officer
CHMP - Committee for Human Medicinal Products
CIO - Chief Information Officer
CMO - Contract Manufacturing Organizations
COBOL - Common Business Oriented Language
CRO - Clinical Research Organization
DAV - Drug Administration of Vietnam, Vietnam
EMA / EMEA - European Medicines Agency
EMR - Electronic Medical Record
ER - Electronic Record
ERP - Enterprise Resource Planning
ES - Electronic Signature
EU - European Union

x
FDA - Food and Drug Administration of United States of America
FP - Fixed Price
FSI - Floor Space Index
FTE - Full Time Equivalent
FY - Financial Year
GE - General Electric Company
GIE - Globally Integrated Enterprise
GSK - GlaxoSmithKline
GxP - Good Practices (where ‘x’ is a variable with C-Clinical, M-
Manufacturing, L-Laboratory, D-Distribution)
HAS - Health Sciences Authority, Singapore
HCL - Fast Growing India’s IT Services Company
IBM - World’s Leading IT Services Company
ICH - International Conference on Harmonization
ICT - Information and Communication Technologies Regulation
IP - Intellectual Property
ISO - International Standards Organization
IT - Information Technology
ITeS / ITES - Information Technology Enabled Services
ITO - Information Technology Outsourcing
JV - Joint Venture
KPI - Key Performance Indicator
KPMG - Consulting and Research Oriented Company

xi
KPO - Knowledge Process Outsourcing
LS - Life Sciences
M&A - Merger and Acquisition
MedDRA - Medical Directory for Regulatory Activities
MedSafe - Medicine and Medical Devices Safety Authority, New
Zealand
MSA - Master Services Agreement
NASSCOM - National Association of Software and Services Companies
NCE - New Chemical Entity
NCI - National Cancer Institute
NCR - National Capital Region
NEC - Consulting Services Company
NPCB - National Life Sciences Control Bureau, Malaysia
NTT Data - Consulting Services Company
ODC - Offshore Delivery Center
PAT - Process Analytical Technology
PC - Personal Computer
PDMA - Life Sciences and Medical Devices Agency, Japan
PMO - Project Management Office
POC / PoC - Proof Of Concept
PWC - Price Waterhouse Coopers
QbD - Quality by Design
QC/QA - Quality Control and Quality Assurance

xii
R&D - Research and Development
ROI - Return On Investment
SCM - Supply Chain Management
SEI CMM - Software Engineering Institute - Capability Maturity Model
SEZ - Special Economic Zone
SFDA - State Food and Drug Administration, China
SLA - Service Level Agreement
SM&G - Service Management and Governance
SMB - Small and Medium Business
SME - Subject Matter Expert
SOW - Statement of Work
TARP - Troubled Asset Relief Program
T&M - Time and Material
TCS - Indian based IT Services Company
TCV - Total Contract Value
TGA - Therapeutic Drug Administration, Australia
TPI - Strategic Consulting Services Company
UK - United Kingdom
UNCTAD - United Nations Conference on Trade and Development
US - United States of America
USD - United States Dollar
VMT - Vendor Management Team
Y-o-Y - Year-on-Year

xiii
EXECUTIVE SUMMARY
The advent of Information Technology (IT) has slowly spread into the Life
Sciences (LS) industry and India has been playing a vital role in this
metamorphosis. It is still believed, there is a lot of head-room for Life Sciences
companies to consider more and more offshore outsourcing of their business
functions. However, Life Sciences companies happen to be late starters in
outsourcing world. The primary reasons for this sluggish phenomenon can be
attributed to the ‘highly regulated industry’ and thereby the ‘conservative
behavior of key decision makers’, besides some of the ‘data privacy
implications’. This study is conducted to understand and explore these ‘more’
options and alternatives that both Life Sciences and Information Technology
companies could adopt and develop respectively and leverage benefits in the
tough world of patent expiries, reducing profit margins and lack of depth in the
product pipeline. Not to forget the dearth of the block buster drugs.
Life Sciences industry, until early 1990’s, was considered to be hesitant in
adopting cutting-edge solutions and technologies due to its intrinsic
conservative nature. Reasons such as failure in regulatory compliance and
audits, loss of intellectual property, problems in training, leakage of sensitive
information, made even large companies skeptical for adopting and using
contemporary systems. But the situation has changed considerably at present,

xiv
and there is a heavy focus on innovative operational models along with some
risk-based approaches.
Today, there is hardly any aspect of Supply Chain Management (SCM) left
untouched by IT, which collectively reduces the time-to-discover and time-to-
market of a drug. Given the thrust from regulatory agencies to adopt innovative
technologies, some of the global companies have already reached certain
scales of maturity and excellence. Areas where IT is being deployed extensively
are;
§ Pre-clinical (Drug Discovery & Development), Clinical Trials Research
and Development
§ Manufacturing Planning, Execution and Intelligence
§ Quality Assurance and Quality Control
§ Material and Demand Management
§ Warehouse, Distribution and
§ Global Trade Management
Increased application of IT in the Life Sciences industry has propelled lead
agencies to work on developing new guidance and regulations based on the
latest science of risk management and quality assurance using automation
techniques.

xv
Fuel-to-fire
It is a critical time, rewarding and exciting time, to be in a Life Sciences-IT
environment. Following are the elements enforcing this situation;
• First, the challenges facing in promoting and protecting the public health
are greater than ever with stringent regulatory focus.
• Second, with the advent of new technologies, the opportunities to
provide significant benefits to the public have never been greater. New
standards are being designed to encourage cost-reduction and
precision-enhancing innovation in manufacturing processes and
technology.
• With the increasing number of generic drug approvals, its becoming
extremely difficult for innovator companies to maintain their Research &
Development (R&D) spend Year-on-Year (Y-o-Y) and produce block-
buster drugs anymore.
Under the above mentioned circumstances, it is important to study the impact of
compliance and best practices adopted by Information Technology companies.
As part of the literature review, 250 research publications, articles, news letters,
and other thought process documents were reviewed. The primary sources of
the information were internet with public domain access and University
Journals. From the literature review, it is observed that several researches have
been conducted on role of Information Technology in Life Sciences, and IT

xvi
playing as a catalyst in Life Sciences processes. However, literature review did
not reveal the impact of regulations on the overall offshore outsourcing strategy.
The above mentioned gaps in literature review influenced the type and nature of
questions for this research study. The research questions were inclined towards
following parameters;
ü General Information about Respondent
ü Information related to Type of Company
ü Information related to Organizational Structure
ü Information related to Regulatory Compliance Adherence
ü Information related to Best Practices Adopted
ü Information related to Risks & Strategy
ü Information related to Operational Principles / Delivery Excellence
ü Information related to Growth Initiatives
ü Information related to Training and Knowledge Building
ü Information related to Geographical Reach
ü Information related to Organizational Perception towards Outsourcing
ü Information related to Organizational Perception towards Services
This study includes – new processes and operations that could be considered
for offshore outsourcing, highlighting regulatory implications and over all cost

xvii
maintenance and of course benefits. Based on the research questions, the
following were the research objectives;
1. To understand dynamic compliance and best practices adopted by
organizations in IT outsourcing
2. To analyze the impact of compliance and best practices management on
IT outsourcing strategy
3. Identify other bottlenecks in IT outsourcing business management
4. To explore future avenues in IT outsourcing
5. To provide recommendations to both Life Sciences and Information
Technology companies on smarter compliant offshore outsourcing
Methodology Adopted
The study concentrated both on primary and secondary data. The secondary
data provided information on the state of affairs in the Life Sciences –
Information Technology offshore outsourcing world. The primary survey was a
critical component of the study, as it yielded crucial data on the impact of
compliance on outsourcing and kind of services provided.
The local of study was India, China, Denmark and USA and employees from 33
Life Sciences companies and 27 Information Technology companies were
selected using stratified random sampling and 755 employees in various roles
and departments were interviewed.

xviii
FINDINGS OF THE STUDY
Size of Organization:
1. From the study it was found that big Life Sciences companies proactively
engage IT service providers in supporting business operations.
2. Also, it was found from the study that the age and maturity of the Life
Sciences companies will have a dependency on choosing whether or not to
engage an IT service provider.
3. Life Sciences companies that run on heavy automation are more likely to
engage IT service provider for support.
Outsourcing Strategy:
1. The primary reasons to engage service provider were - To seek expert
guidance and Cost benefits.
2. IT companies have started building specific industry capabilities to align and
get closer to Life Sciences industry value chain. The various methods that
are leveraged are - To hire industry professionals, Internal workshops /
training and Understand client pain-points and prepare suitable solutions.
3. Organizations do hire and retain core Subject Matter Experts (SMEs) while
catering to Life Sciences clients.
4. Interestingly, the requirements from Life Sciences companies like need for
Innovative business models, Streamlining IT enables operations, and
Managing IT regulatory compliance better is driving these companies to
reach out to IT companies.

xix
5. It was found that Cost barriers could be one of the reasons for not going the
outsourcing way.
6. Life Sciences companies that are running since more than 30 years are
more willing to embrace the FDA newer technologies initiatives and
outsource their processes.
Regulatory Impact:
1. From the study it was found that a majority of the manufacturing companies
engage in Process Analytical Technology (PAT) initiatives as recommended
by FDA.
2. It was found that IT companies who have the expertise to support the Life
Sciences companies during regulatory audits and inspections have an edge
over other service providers
3. From the study it was found that manufacturing departments with less than
70% automated processes within Life Sciences companies are front runners
in adopting newer technologies recommended by Food & Drug
Administration (FDA). In the same companies, where there is more than
70.0% of automation enabled, Quality Control & Quality Assurance (QC/QA)
functions have shown much keenness in embracing newer technologies.
4. Life Sciences companies that are less than 20 years old with strong
regulatory expertise are ahead in adopting newer technologies
recommended by FDA.

xx
5. It was found that a majority of Life Sciences companies were strongly
confident in adopting IT enabled processes and comply to impending
regulations and clearing audits smoothly.
Smarter Outsourcing:
1. From the study it was found that Life Sciences companies with 30 – 50%
automation, struggle with Cost barriers and are reluctant to engage an
external service provider. It is found that these companies have limited
allotted budgets for automation. Hence, they prefer to manage with
internally available knowledge and expertise to a larger extent.
2. Indian based Life Sciences companies which did not have multinational
sites, were managing IT themselves.
3. It was found from the study that more the automation levels in a
company, the company has shown higher interest levels in embracing
newer technologies recommended by FDA like the PAT.
4. It was found that manufacturing and QC/QA verticals are amongst the
leading departments in moving from manual to automated processes.
5. Companies that have operations in more than one country are more
likely to automate their processes.
6. Amongst the Life Sciences companies that host’s central IT infrastructure
in India, there is high interest in moving from manual to automated
processes.

xxi
7. It was found that there was a same level of response on primary need for
automation from respondents from various departments. They opine
Efficiency, Productivity, Accuracy and Monitoring are the primary drivers
for outsourcing.
8. It was found that IT service providers when they were engaged in Clinical
research followed by R&D, Manufacturing and QC/QA functions were
able to engage in higher percentage with Life Sciences companies. And
primary reason that was driving Life Sciences companies towards
service providers was – Requirement of Innovative business models.
Recommendations
1. Life Sciences (LS) companies need to consider the globalization path and
effectively adopt the IT integration path.
2. LS companies can start off with outsourcing some of their no-core, non-
critical operations, and gradually consider other core and critical operations
for outsourcing. This will allow them to develop and get familiarized with the
process of outsourcing and understand risks better.
3. It is found from the research, that LS companies which have strong
regulatory departments are front-runners in outsourcing. So companies can
focus on improving their expertise levels in regulatory departments and
consider outsourcing for a strategic advantage.

xxii
4. Information Technology (IT) companies need to understand the complexity
and regulatory governance of the LS industry and accordingly provide
business specific solutions.
5. For new initiatives, IT companies could consider prototype or Proof-of-
Concepts (POC) before actually working on the large business operations.
This will allow both client and service provider to understand the challenges
/ risks and accordingly prepare corrective actions and remediation plans for
the big play. (Details on POC model are provided in Chapter 8,
Recommendations and Suggestions).
6. IT companies could train their staff and hire industry experts who can work
with their LS clients and provide business specific solutions which are
regulatory compliant and consistently meets quality attributes.
In addition to the above points and based on wide industry experience,
worksheets were tabulated using Matrix Analysis and are presented in the
Conclusion section of this study.

1
CHAPTER 1
Introduction – Outsourcing Definitions and Practices
The industry trend is that more and more Life Sciences companies are exploring
opportunities to offshore or outsource their processes. This trend is fast catching
up for obvious benefits that can be achieved by deploying such a model. This
research study relates to the integration of technological and managerial
considerations from both Life Sciences and Information Technology into
exploring further opportunities in the likelihood of outsourcing and offshoring
critical processes and activities in the life sciences industry.
Dearth of block buster drugs is forcing Life Sciences companies to explore ‘more’
options and alternatives that can be adopted and leverage benefits in the tough
world of patent expiries, reducing profit margins and lack of depth in the product
pipeline. Life Sciences industry needs to catch up with developments in
information technology. It has been lagging behind. It is not that a company hates
outsourcing Information Technology, but people don’t like outsourcing, when they
have to suffer. What does this mean? This means, a company would love
outsourcing, if it is a pleasant experience for them.
Outsourcing in today’s world is considered to be more of a strategic initiative and
a key management option rather than considering it as a mere cost cutting

2
operation. It has proven to the companies in achieving their business objectives
through operational excellence and better market positioning. Most, if not all,
major Life Sciences companies have been outsourcing, or are evaluating the
benefits of outsourcing, one or more of their noncore business functions to a
third-party service provider. Over the last seven years, Life Sciences companies
have been primarily outsourcing all or part of their back-office Information
Technology (IT) infrastructure, such as the mainframe, mid-range, desktop, or
application maintenance functions. Recently, Life Sciences companies have
become more and more innovative in the types of business functions that they
consider ripe for outsourcing. Functions that are being considered include human
resources (operations or payroll), financial transaction processing (particularly
accounts payable), procurement, distribution, logistics and clinical data
management.
The Pharma industry – buffeted by the possibility of price controls, declining drug-development productivity (higher costs, fewer drugs), stricter regulatory scrutiny, and competition from a growing number of “me-too” drugs-is, in a state of turbulence. This instability is putting financial pressure on all the industry players, not just the weaker ones; earnings of the sector‘s top companies have fallen by 25 percent since 2002. Meanwhile, companies must rethink core business processes (such as drug development and commercialization) and seek new ways to increase their yield and productivity.
Source – Adapted from McKinsey Report, January 2006
Definition of Offshoring – Offshoring describes the relocation of a business
process by a company from one country to another—typically an operational
process, such as manufacturing, or supporting processes, such as accounting.
The term used in several distinct but closely related ways. It is sometimes used
broadly to include substitution of a service from any foreign source for a service

3
formerly produced internally to the firm. In other cases, only imported services
from subsidiaries or other closely related suppliers are included. A further
complication is that intermediate goods, such as partially completed computers,
are not consistently included in the scope of the term. Offshoring can be seen in
the context of either production offshoring or services offshoring. In this study,
focus is on services offshoring and outsourcing.
Though the concept of offshoring is on the rise in the Life Sciences industry,
there is a tremendous pressure on companies towards innovating more effective
and swift processes and also reduce the overall costs in R&D, manufacturing,
supply chain and regulatory compliance.
Life Sciences Industry comprises of three main categories i.e. Pharmaceutical,
Medical Devices and Biologics. In this research, there is more focus and deep
dive on the Pharmaceutical Industry but referred to as Life Sciences.
1.1 Outsourcing – Origin of Concept
Outsourcing could be defined as the shifting or delegating a company's day to
day operations or business process to an external service provider, done in
anticipation of a better quality, lower rates and in a sense of getting an edge over
one's competitors. When a company's operations or business processes are
outsourced to firms in foreign countries, often to take advantage of cheap skilled

4
labor, it is referred to as Offshore outsourcing or Offshoring. In this arrangement,
functions previously performed by an organization are supplied under contract
from a third party. While outsourcing is not exactly a new innovation, the shifts
that have occurred recently in this space are worth noting.
Some Other Definitions of Outsourcing;
§ The concept of taking internal company functions and paying an outside firm
to handle them is called Outsourcing. Outsourcing is done to save money,
improve quality, or free company resources for other activities. Outsourcing
was first done in the data-processing industry and has spread to areas,
including tele-messaging and call centers.
§ A long-term, results-oriented relationship with an external service provider for
activities traditionally performed within the company. Outsourcing usually
applies to a complete business process. It implies a degree of managerial
control and risk on the part of the provider.
§ The transfer of components or large segments of an organization's internal IT
infrastructure, staff, processes or applications to an external resource such as
an Application Service Provider
Advantages of Outsourcing
Proponents of outsourcing cite a variety of reasons for "letting others do it".
Some of the notable advantages in outsourcing are listed in the following page;

5
Cost savings - By outsourcing functions that were previously performed in house,
companies are often able to reduce their employee levels and related costs, such
as recruitment, supervision, salary and benefits. By outsourcing a capital
intensive function, a company can also reduce the costs of equipment
obsolescence and depreciation. A portion of company’s cost savings will go to
the outsourcer, but outsourcing vendors have a tighter control of fringe benefits
and run leaner overhead structures.
Quality of service - Because the company is the outsourcer's customer, teams
are more likely to experience a "can-do attitude," which may not always be
exhibited by an in-house staff.
More capital funds - Outsourcing reduces the need to invest capital in non-core
business functions, thereby freeing capital to invest in profit-making aspects of
the business.
State-of-the-art technology - Outsourcers have to spend time and money on the
most current equipment and on employee training to remain competitive. By
outsourcing certain areas, you are assured of receiving the most efficient
services and the latest technological advances within that particular function.
Price stability - By signing a contract to outsource, you will likely be able to obtain
stable pricing, eliminating the future need to shop around. Stable pricing allows
the company to budget operating expenses and capital purchases more
accurately, while potentially preventing the likelihood of surprise expenses.

6
New business partners - Outsourcers clearly wish to be viewed as business
partner. And as a business partner, they share in the desire to keep service
provider operating at its maximum potential. Through this business partner
arrangement, outsourcers are eager to introduce service provider to other
outsourcers to assist in that goal.
More time to focus on core business activities – This is another intangible benefit
of outsourcing. If a company is to be successful and profitable, management is
needed to spend time planning and directing the company's business strategies
and not wasting time worrying about managing certain administrative or ancillary
functions.
List of Top 10 Pharmaceutical Companies as per May 2010 report is provided
below;
2010 Rank (2009 rank)
Company & Headquarters
2009 Rx Sales (millions in USD)
2009 R&D Spend (millions in USD)
2009 Top Selling Drugs
1 (1) Pfizer $ 45.4 $ 7845 Lipitor, Lyrica, Celebrex
2 (3) Sanofi-Aventis $ 42.0 $ 6567 Lantus, Lovonox, Plavix
3 (4) Novartis $ 38.4 $ 6308 Dionov, Gleevec, Zemeta
4 (2) GlaxoSmithKline $ 37.8 $ 6286 Seretide/Advair, Valtex
5 (8) Roche $ 37.6 $ 8570 Avastin, Rituxan, Herceptin
6 (6) AstraZeneca $ 32.8 $ 4409 Nexium, Seroquel, Crestor
7 (7) Merck $ 25.2 $ 5845 Singulair, Hyzaar, Januvla
8 (6) Johnson & Johnson $ 22.5 $ 4591 Remicade, Eprex, Floxin
9 (9) Eli Lilly $ 21.2 $ 4300 Zyprexa, Cymbalta, Humalog
10 (11) Bristol-Myers Squibb $ 18.8 $ 3647 Plavix, Abilify, Reyataz
Source – Adapted from The Pharma Exec 50, May 2010, www.pharmaexec.com
Figure 1

7
1.2 Outsourcing and Offshoring – How Close and How Far?
Outsourcing is – to put it plain and simply – subcontracting. The phrase “IT
Outsourcing services,” refers to merely subcontracting IT work to a third party or
Service Provider. Outsourcing, contrary to popular belief, does not necessarily
refer to sending work overseas. A company in New Jersey could “outsource”
work to a company in Indianapolis. One of the most common examples of
outsourcing is telephone sales and call center services. While many companies
used to employ their own in-house call centers, these services are now usually
subcontracted through a third party company.
Offshoring – merely refers to any company, service, or client that is based
overseas. Offshore outsourcing means that you are subcontracting work to
overseas companies. If a company based in Texas has subcontracted a
company in India to develop their website or provide their call center services,
that Texas company has outsourced offshore. Offshore outsourcing does not,
however, refer to hiring employees from overseas to work at your company in-
house.
Benefits of outsourcing within the same Country versus Outsourcing
overseas
Outsourcing Offshore – Outsourcing offshore or offshore outsourcing is one of
the best strategies for a company to get work done without breaking the bank; as

8
in, offshore outsourcing allows companies to accomplish necessary tasks (such
as creating efficient websites or call centers) without having to hire new talent in-
house for things like IT application development, product development and rich
internet application development. Offshore outsourcing also allows companies to
access an entirely new talent pool, and allows access to brilliant new technology.
Outsourcing Domestically – Domestic outsourcing usually happens for two
reasons: Either a company is subcontracting another company for work they
cannot do in-house, or, a company is seeking cheap call center services.
Typically, outsourcing offshore is more lucrative. Not only is it usually far more
cost efficient, but it also allows companies to access quality professionals and
technologies that are not widely found in a particular host country.
1.3 Concepts of Outsourcing
Offshore outsourcing services can be mainly divided into Technology Services
Outsourcing, Business Process Outsourcing (BPO), Software R&D and
Knowledge Process Outsourcing (KPO).
Technology Services Outsourcing
Companies that utilize technology require sophisticated, quick-responding
computer systems and software that are flexible enough to respond to the
increasing capabilities of technology and the rapid changes in business models.

9
Selecting the right technology partner is an integral part of many successful
ventures. Following are the specific types of technology services.
· Electronic Commerce (eCommerce)
· Infrastructure (Networks)
· Software (Applications)
· Telecommunications
· Website Development & Hosting
Business Process Outsourcing (BPO)
With globalization, enterprises have been challenged to find the niches where
they add the greatest economic value to the world's economy. As a result,
enterprises have looked for ways to avoid making investments in employees and
infrastructures that do not have a high yield. As service providers witnessed this
development, they began to create whole enterprises based on narrow business
processes. The term "BPO" (Business Process Outsourcing") was coined in
about 1995 and became popular a few years later, accelerated by the explosion
of Internet business in the field of;
· Customer Contact (Customer Relations Management)
· Equipment
· Finance / Accounting
· Human Resources
· Logistics

10
· Procurement / Supply Chain Management
· Security
Software R&D
Offshore Software R&D is a provision of software development services by an
external supplier positioned in a country that is geographically remote from the
client enterprise; a type of offshore outsourcing. In this context, it refers to the
offshore development phase of software. The main reason behind the companies
to use offshore software development services is the higher development cost of
the local service providers. The global software R&D services market as
contrasted to Information Technology Outsourcing (ITO) and BPO is rather
young and currently is at early stages of its development. Apparently, India is
leading the world in this field.
Knowledge Process Outsourcing (KPO)
Knowledge Process Outsourcing (KPO) describes the outsourcing of core
business activities, which often are competitively important or form an integral
part of a company's value chain. Therefore KPO requires advanced analytical
and technical skills as well as a high degree of proprietary domain expertise.
Reasons behind KPO include an increase in specialized knowledge and
expertise, additional value creation, the potential for cost reductions, and a
shortage of skilled labor.

11
1.4 Outsourcing Evolution in India
Three decades back, the concept of outsourcing started in India with companies
looking for some backend operations support as call center and payroll
management. With the advent of internet and other technological advancements,
companies are considering more and more operations for outsourcing. The
NASSCOM 2020 report published demonstrates the overall revenue from India
Outsourcing business can be in-tune of USD 1500 billion. The key contributors
for this mammoth potential are that new verticals in developed countries are
considered for outsourcing to BRIC nations. And also creation of new customer
segments in the Small and Medium Business units. The figure below represents
the growth areas in outsourcing market and evolution in India.
New growth areas will drive 80% of incremental growth in Global Sourcing
market in the next decade
Source – Perspective NASSCOM 2020, Published in 2010
Figure 2

12
1.5 Theories on Outsourcing
The government agencies in the USA define outsourcing as “the movement of
work that was formerly conducted in-house by employees directly paid by a
company to a different company” (Brown and Siegel, 2005). The company
outsourcee might be located in the country (onshore outsourcing) or in another
country (offshore outsourcing) (Brown and Siegel, 2005). The notion of in-
sourcing is implied if the company carries out the activity independently in the
country of its origin (Gião et al., 2008). It is clear from the definitions that the
major difference between outsourcing and in-sourcing is who carries the
responsibility about the activity.
John (2006) describes four categories of outsourcing:
1. “Commodity-like”. It is a cost-driven type with no innovation required.
2. “Customized-activities”. The outsourcer demands the outsourcee is being
involved in internal processes deeper.
3. “Business Process Outsourcing”. Outsourcee has to work in close
cooperation with outsourcer and to be well aware about its strategy.
4. “Strategic outsourcing”. The degree of integration between parties is very
high as it includes outsourcing of the core competency. Responsibility is
shared between parties. Innovation is a requirement. Outsourcing of R&D
falls down into this category.

13
Theories Driving Outsourcing
Economies of Scale and Scope – Odagiri (2003) applies this theory because the
firm cannot achieve high utilization rate of equipment and decrease costs
associated with a product if it does not produce high volume. Hence, he
proposes to outsource that activity.
The Transaction-Cost Theory – Jonson et al. (2008) argue that the activity should
be remained in-house if the firm’s transaction costs in its control are lower than
relying on transactions in the market. Odagiri (2003) describes intellectual right
for the invention as an appropriate transaction cost for R&D.
The Capability Theory – Developing of the capability is a time-consuming
process.
Source – Outsourcing Process, Adapted, Kumar et al. (2007)
Figure 3

14
Therefore, it might be quicker and cheaper to find a partner who already has
certain capability (Odagiri, 2003). Odagiri (2003) provides an example of
collaboration with universities and creating alliances with specialist firms in R&D.
Key Benefits of offshoring
So far the key drivers for the majority of offshore engagements have been the
desire to reduce costs and improve the service quality. Using offshore locations
with a lower cost base is clearly an attractive option in the search for cost
reductions. As per IBM CEO Study 2010, CEOs across the industries need to
think differently and avoiding complexity is not an option, instead the choice
comes in how they respond to it.
Source – Leadership Thinking from IBM CEO Study, January 2010
Figure 4

15
1.6 Outsourcing Strategies
1.6.1 Size and Nature of Companies
In the Life Sciences industry, adoption of outsourcing and offshoring their
processes has come more as a compulsion to meet the growing cost and
expansion of business across countries. This is unlike in other industries.
Companies in other industries want to consider outsourcing to stay ahead of
competition by providing faster, easier and efficient products to the consumers.
Same phenomenon is applicable to the service industry too.
Big Life Sciences companies cannot stay away from outsourcing for long due to
the diversification of the business channels and geographical spread. To add to
this is the challenge of growing staff and increasing number of products and
pipeline. Also to manage and harmonize the processes, product lines, and
distribution channels consistently across countries with varied time zones and
then deliver in a standard manner is challenging. Also, when the staff is absorbed
onto company’s rolls, provident fund, medical benefits and insurance, and other
compensatory benefits have to be arranged as per country labour laws. If a
company intends to overcome this challenge and set-up teams to operate in
various time zones, the overheads will be blowing up the costs phenomenally.
Though these big companies have significant number of IT staff on board, the
muscle power needed to perform global implementations and ensuring 24x7

16
support in a long run is difficult to achieve. Apparently, outsourcing for these big
companies becomes more of a necessity rather than an option.
On the other hand, small and medium sized companies can afford to consider
outsourcing as an option, rather than a necessity. They are in an advantageous
position due to the lesser complexities in their supply chain, manufacturing
verticals and managing staff. Usually these companies have staff located in few
locations in a specific country or one more country outside base. The factors like
time zone difference, 24x7 availability and diversified product lines do not arise.
So the smaller companies opt to outsourcing model in smaller steps by
considering only small portions of business processes to be outsourced at a time.
They do not opt for a big-bang approach. These companies set-up their own IT
teams who can work and turn-around the IT pieces as and when needed. Due to
lesser volume of tasks and type of work, these are manageable internally.
There are some companies which are relatively much smaller in the industry and
manufacturing certain niche products in low volume that yield high value. These
companies are going away from the trend, show much keenness in moving with
the growing technology and consider outsourcing options easily. Such
companies are few and tend to have a competitive advantage over other players
in the same league.

17
1.6.2 Outsourcing Determinants
Further to explanation provided in the earlier section on how size and nature of
the company is driving the outsourcing decisions, it is further understood that
there are some determinants which serve as driving points in making outsourcing
decisions. The figure below demonstrates the outsourcing profiles of ten of the
top twenty pharmaceutical companies. It shows the pervasive use of managed
services in Infrastructure and AMS, regardless of which service provider has
been providing the service.
Across Life Sciences, most companies have outsourcing services positions
Source – IBM CIO Study, 2009, www.ibm.com
Figure 5

18
A successful outsourcing project is only possible if the outsourcing decision has
taken into consideration all known costs and benefits associated with the project.
It is also important that the contract be effectively negotiated and managed in a
manner it will be beneficial and keep the stakeholders satisfied with the decision
made.
Successful CIOs blend three pairs of roles that seem contradictory, but are actually complementary
Source – IBM CIO Study, October 2009, www.ibm.com
Figure 6
Though there are some standard outsourcing determinants, it is not possible to
provide a simple criteria template for an outsourcing versus insourcing cost-
benefit analysis. Each organization must determine its priorities, criteria, and
weight for each project depending on its individual capabilities. Though an option
might seem quantifiably more expensive, it could be the most effective choice for
meeting the company's needs. A successful project would require constant

19
information, true cost and benefit estimates and should also have specific goals
to achieve.
Moving Outsourcing Relationships Up the Value Chain
Many outsourcing relationships begin with optimism and mutual amiability. Both
sides profess the need for the client to focus on its core-competencies while the
outsourcer's commitment should be in leveraging its technical expertise to deliver
strategic value. Outsourcing alliances are generally based on certain key
business drivers, as exhibited in the following table that details a comparative-
grid that should be used while deciding on outsourcing strategy. While
transactional-alliances are dictated with outsourcing motivators for building
strategic alliances, a four-step model is detailed in the following paragraphs.
An outsourcing alliance begins with the outsourcer exhibiting its specialized
qualities. At the time the contract is signed, the outsourcer projects excellent
performance capabilities. Due to lack of quality and delivery excellence,
problems arise very soon. Subsequent problems arise during periodic
performance reviews and assessments. The client's objectives of becoming more
focused are hindered. Cost reductions and efficiency enhancements are not up
to the mark. The outsourcer struggles to address the clients’ obscure business
objectives, meet aggressive performance targets and also focus on its own profit
margins.

20
Business Driver Outsourcing Motivators Suggested Outsourcing Model /Strategy to be pursued
Reduce and Control Operating Costs
Free up capacity Reduce Cost Capture benefits quickly
Outsource large sustenance assignments that consume a large proportion of resources. Capitalize on vendors economies of scale to do the job more cost effectively
Lack of employee resources
Increased capacity Speedy ramp up of resources Building knowledge repository
Outsource specific skills (such as systems maintenance which are resource-demanding) that are less critical to future development and value creation Refocus on strategic core-competencies
Technology Expertise
Access to world-class capabilities, best practices, new technology tools etc Shrink product’s time-to-market
Outsource major development efforts demanding state-of-the-art technology expertise. Outsource to a vendor specializing in the requisite technology domain, ensuring the availability of ‘ready-resources’ and capitalizing on ‘first-mover’ advantage
Share Risk Share risks in terms of technology transitioning or launching new products
Outsource technology assignments that do not conform to explicitly defined scope, specification and implementation plans. Go in for a time and material execution model for such projects that are difficult to complete in time.
Source – Adapted from Outsourcing: A Decision of Trust, April 2002, Hughes Software Systems
Table 1
Selecting the Vendor
Every Life Sciences company will have a Vendor Selection Process with well
defined criteria based on the type of the services procured from the vendor /
service provider. Depending on the complexity and criticality of the project, the
prospective service provider has to be classified accordingly and evaluated
against the set parameters. Some outsourcing companies believe that an

21
outsider cannot provide the same attention as the in-house team. Therefore, a
thorough vendor scrutiny becomes vital before assigning critical technical
roadmaps and confidential information to them. Understanding the emphasis of a
service provider's business, or what it is that drives the service provider, is
essential while choosing the appropriate service provider to meet specific needs.
A service provider selection team should be developed that would recognize
business areas for a project. The service provider selection team should
comprise senior management, legal staff with contract expertise, technical staff,
end users and financial staff.
1. Experience and Expertise · Experience with similar projects? · Offering Outsourcing services (in years)?
2. Strong Track Record · Past performance history / reputation? · In-house facilities to meet agency’s business needs?
3. Ability in handling technology transitions?
4. Financial Stability
5. Resources · Employee Strength · Hiring Process · Employee Demographics · Retaining / Training Policy
6. Flexibility · Business Model Flexibility · Scalability for ramp-up / ramp-down
7. Confidentiality Comfort · Well-defined Security Policies · IPR Protection norms · Business Continuity Plan · Quality Standards
Source – Adapted from Outsourcing: A Decision of Trust, April 2002, Hughes Software Systems
Table 2

22
It should be acknowledged that somewhere the external service providers would
be making money on the outsourcing agreement otherwise they would not be
willing to enter into an agreement. Signing a contract in haste could lead to
working with a service provider who is not responsive to company's needs and
who sticks precisely to the contract letter, charging the agency for any additional
services provided.
Cultural Compatibility
Besides the maturity of companies and thought process on Outsourcing, the
impact of Culture influences some of the decisions made. For an outsourcer, it
becomes imperative to look at this cultural dimension as well to develop a
synergized relationship with prospective service providers. Each company is
culturally different and every company has a need to have their cultural fitment
identification methods. Here are some of the standard questions that can be
considered while evaluating the cultural fitment of service providers.

23
Source – Forrester Research, Inc. October 2008
Table 3
It should be borne in mind that a service provider's business goals are always
different from those of the client. The client and the service provider must be
prepared to identify and resolve the differences that might arise. History suggests
relationships which did not have good cultural fit do not last for long. This
resulted despite the client and the service provider being mature with good
delivery capabilities.

24
Managing and Evaluating Contracts
Once a project has been outsourced to a single or multiple service providers, the
agency is not absolved of the responsibility for the service/process and its
success. Many organizations experiencing offshore outsourcing complications
have not paid enough attention to managing the contract. More so in case the
project is logically separated and different work streams are outsourced to
various service providers. Contract management requires the ongoing
participation of internal staff in the outsourced project. Areas of involvement
include strategic planning, quality assurance, phase containment, change
management, and defining and monitoring the measurements.
The following nine factors should be considered in the course of managing and
evaluating and outsourcing contract.
In-house resources to manage the contract Regardless of how large or small the outsourcing effort is, internal
resources must always be assigned to manage the contract. A large, more comprehensive contract, such as one for outsourcing development projects or an overall Network Management, requires more in-house oversight because of the specialized measures involved, and the importance of strategic planning to the success of these efforts. The in-house outsourcing project team should be experienced in legal issues, finance, organization processed, and technical domains.
Communication In managing outsourcing relationships, communication with the vendor is of utmost importance during the life of the contract. Internal staff must be available to identify problems and work with the vendor to resolve them. While selecting a vendor, it should be kept in mind to zero-down on a vendor whose business / functional culture aligns with that of the organization, so that a communication is fostered and developed to support the effort.
Documentation All correspondence and communication with the vendor regarding problems, proposed changes, or the implementation of the outsourcing effort should be kept documented in order to resolve disputes or identify areas of strengths and weaknesses that might arise

25
Escalation Mechanisms
The vendor should have a well-defined Escalation Process to help customers escalate the problem to next level of management if required. There should be well-framed matrix for critical and non-critical issues with defined escalation-levels based on plan slippage.
An ongoing review process Reviews of the outsourcing engagement should take place regularly on
a scheduled basis to ensure the monitoring of the project and to identify potential problems or issues early. The schedule may be driven by event, date, product, or issue, depending on the needs of the engagement.
Performance Reviews The performance review process should be kept separate from operational meetings. Performance reviews must focus specifically on success and performance issues, rather than the ongoing operational functions.
Regular Steering Group Interactions
It is always advisable to plan for a platform where a senior management interaction from both sides can be encouraged. The objective for such a forum is to explore further opportunities and discuss other issues.
Manage project requirements During a project, a vendor could interact with the agency and use
resources to identify additional requirements and build a case for increasing the project’s scope. In the same way, internal resources could add requirements not identified in the contract and cause price increases.
Plan for an exit strategy
Committing an organization to one firm could result in a loss of negotiation power. Most outsourcing contracts would come to an end at some point in time and the better prepared the organization is to negotiate with other vendors or to take the project back in-house, the better off the organization will be. Planning for unscheduled contract termination is equally as important as managing the scheduled end of an outsourcing arrangement.
Source – Adapted from Outsourcing: A Decision of Trust, April 2002, Hughes Software Systems
Table 4
1.6.3 What are Life Sciences Companies looking for?
Offshore outsourcing clients continue to feel the pain of service providers’
resource constraints and escalating costs, more so in India. Due to this reason,
clients are more inclined than in the past to switch service providers. Although
this is never an easy option, there are ways to protect a company from the worst

26
ravages of engagement failures. Some of the best practices are provided below
safely disengaging an underperforming provider.
Previously Minor performances Have Become More Significant
In the past, when Indian providers failed to perform, the impact was minimal for
most companies. Today, however, failures are more expensive and more
commonplace for the following reasons:
Providers are working on more critical projects - In large part due to their prior
successes with Indian service providers, clients are asking their offshore firms to
take on more critical projects than they did in the 1990s. Failures in these
projects can be painful and embarrassing to stakeholders and potentially can
have a significant financial impact on the business.
Failure or underperformance is now more prevalent - As resource constraints
and skyrocketing growth handicap service providers, the quality of resources
deployed to projects and the quality of account and project management is
bound to suffer. The result is that more projects seem to be failing or
“underperforming.” And there seems to be a perception in clients that the service
providers appear less concerned about these failures than they did in the past.
Costs have gone up - Hourly rates have increased; overhead costs have gone
up; and the dollar has been volatile against the rupee. Adding to this, the service
providers sometimes are paid for rework now and are charging for every single
hour of staff work, even if it’s to redo something that wasn’t done properly the first

27
time. Previously, clients were willing to deal with substandard work because the
labor rate and free rework made it acceptable, but as offshore rates and other
costs climb, client tolerance for poor work has dropped dramatically.
1.6.4 How Life Sciences Companies are building up?
In order to remain competitive, it is crucial for a firm to articulate its offshoring
strategy around the usual competitiveness drivers: costs, quality, and risk
management, that is, proper management control of offshored operations. A 2x2
matrix presented in the following page, captures the different management
possibilities, with the ownership structure on the horizontal axis and the
localization on the vertical axis.
The focus is on the bottom cells, as globalization, liberalization and new
Information and Communication Technologies (ICT) affect management
possibilities and allow a real choice of management structure. Clearly, the matrix
is overly simplified as other forms of ownership with different levels of
management control are possible.
Ownership Internalized (Activities performed
In-house Externalized (External Suppliers)
Outsourcing
At Home Company performs the activities at home Suppliers in home country
Foreign Countries Own subsidiary in foreign country (intra-firm [captive] offshoring)
Suppliers in foreign countries (offshore outsourcing)
Source: Pyndt and Pedersen (2006), p.12
Table 5

28
COST REDUCTION
Service businesses are influenced significantly by the cost factor when deciding
to offshore some of their activities. As mentioned previously, competitive
pressures to reduce costs and improve productivity force many companies to
restructure and reorganize the way they perform their activities. Offshoring
appears to be a good alternative for many service activities as developing
nations now offer comparable services at lower cost.
The cost-influenced move to offshore some activities is first motivated by the
disparity between salaries and wages. The workforce in developing nations such
as India now offers a vast variety of services that is quite comparable in quality to
those available in industrialized countries but at a much lower cost. Thus,
offshoring can give companies a major competitive advantage in terms of cost
effectiveness.
Two surveys confirm that cost reduction is the main motive for offshore
outsourcing. The first survey, conducted jointly by Duke University and Archstone
Consulting, draws its results from 102 mostly American corporations of different
sizes.

29
Source – Duke University CIBER/Archstone Consulting (2005) White Paper
Figure 7
The reason why cost is the top priority is that cost may be a convenient metric
when comparing locations or providers, especially when savings can be high.
Increased competition, both at local and global levels, forces a firm to reduce
costs and offshore outsourcing allows the firm to achieve this goal.
The competitive pressures may be so high that one firm proceeding with
offshoring is enough to drag all the others in a given industry (domino effect).
Moreover, surveys may not capture the fact that companies evolving in a
competitive market often tend to follow the leader and are thus more disposed to
proceed to offshore operations if the leader or leaders proceed with such a
strategy. Managers are thus constrained to either make better use of
technologies and/or to proceed with re-engineering the labour force, two

30
concepts that can be complementary and simultaneously feasible when the firm
opts for an offshoring strategy; a possible result can be higher-quality goods and
services at lower costs.
European companies have similar priorities as the survey conducted jointly by
United Nations Conference on Trade and Development (UNCTAD) and Roland
Berger Strategic Consultants shown below. Since services are typically labour
intensive, this study makes a distinction between two types of costs, where
labour costs should be defined as the ratio of wage over productivity.
Source – Roland Berger Strategic Consultants (2004) White Paper
Figure 8
The different categories of cost may be more relevant for a company establishing
a new internal offshore operation, for instance, a captive call centre (insourcing).
As for offshore outsourcing, some of these costs may already be incurred by the
provider and included in the price charged. There are other types of costs, such

31
as searching for a suitable supplier, as well as transactions costs such as
negotiation and contract enforcement costs, which must be taken into account.
Source – Robinson and Kalakota (2004), p.17
Figure 9
1.6.5 India and China Contest
Like in many other businesses and industries China and India are spearheading
the Offshore outsourcing business. Both are located in Asia and the most
populated countries in the world. Both are still developing countries with low
wages for most workers in most industries. However, there are also significant
differences between these two countries in the areas related to Life Sciences
industry. Each country possesses its own features and characteristics.
In general, China is better equipped in industry infrastructure than India. Chinese
Life Sciences market is also much bigger than India’s. However, the business

32
operation style and philosophy in Indian companies are closer to the Westerner
than in Chinese companies. Indian companies are also more familiar with the
Western regulations than Chinese companies. They also have broader global
presence than Chinese companies. China is better in education of biology than
India. The biotechnology industry in China is also more advanced than in India.
However, Indian Life Sciences companies have invested more in R&D and have
a much broader product scope than Chinese companies.
In traditional Life Sciences sector, Chinese companies are still limited to
manufacturing of traditional products which are marketed in limited number of
Countries. But, in the biotech sector, Chinese companies possess much stronger
capabilities in R&D and manufacturing of macro compounds than Indian
companies. In professional outsourcing service, the two countries provide close
service scopes and possess close service capabilities. However, there are still
differences in each service sector between these two countries. In discovery
service, Chinese companies and Indian companies possess close skills and offer
similar services and qualities.
However, in target identification and validation as well as those related areas
such as research in genomics and proteomics, Chinese companies possess
stronger service capabilities than Indian companies; whereas in small molecule
drug R&D, Indian companies are more capable than Chinese companies.

33
In preclinical research service, Chinese CROs possess better service capabilities
than Indian CROs; whereas in clinical research service, it is just opposite. In
process R&D and scale-up synthesis, both countries possess similar capabilities.
However, Indian companies possess better skills and capabilities than Chinese
companies in formulation, manufacturing and marketing of generic drugs. Major
pharma and biotech companies play different strategies in these two countries. In
India, they tend to form more close collaborations such as risk-sharing
outsourcing with an Indian company to co-develop drug candidates, but very few
of them are willing to permanently set up a decent size of R&D center or
manufacturing facility in the country. In stark contrast, almost all major pharma
and biotech companies have invested hundreds of millions of dollars in China to
establish their wholly owned R&D centers and large scale manufacturing and
marketing facilities. Many of their China R&D centers have already reached
decent sizes and gained strong capabilities. They are ready to conduct full-scale
research independently.
At present, India is better than China in small molecule drug R&D and
manufacturing. But China is superior over India in biotechnologies including the
R&D and manufacturing of macro compounds. India offers better product quality
but China has more cost reduction advantage. In terms of investment
opportunities, China seems to present more attractions than India as its industry
infrastructure and biotechnologies are more advanced. The mature life sciences

34
markets in the United States, Europe and Japan are expected to grow in low
single digits for the foreseeable future. In addition, we see life sciences
companies established within the emerging markets focusing their growth plans
on these mature markets, which will put the existing players under even more
pressure. While mature markets still represent the bulk of the profits, there is
general agreement that growth will come from the emerging markets. It is less
clear how best to capture that growth and create a sustainable global model that
could potentially benefit both mature and emerging markets.
In India, almost 3 decades ago, Bangalore was considered as the hub for any IT
company for both Indian companies as well as the foreign based multi-nationals
who were planning to invest in India. After Bangalore, companies have started
moving to other cities like Hyderabad and Pune. Over the years and with benefits
from state and central governments, many other cities have come up as IT hubs
in India.
India started its growth path by providing basic level of IT support functions in the
Banking and Finance sector and then gradually moving onto other industries.
With growing availability of more skilled personnel in IT knowledge both on
technical, functional and consulting, companies have started to explore other
niche areas of business that could be offshored. Based on the stage of

35
development for IT-BPO, the locations can be categorized into four groups, viz,
Leader, Challenger, Follower and Aspirants as represented in the following page.
Source – NASSCOM Report, Jun 2009, www.nasscom.in
Figure 10
1.6.6 Gaps in Capabilities
To be successful in new evolving market, IT Organizations and Suppliers need to
be more agile, innovative and move up the Global value chain and need to
develop wider ‘Global Capability Leadership and Talent Pool’.
The Life Sciences industry has tended to be skeptical about the value of large
scale spending on computing. But in November 2010, 250 or more senior
executives from many of the sector's largest companies have travelled to the

36
World Pharma IT Congress in London to find out what their peers - heads of IT,
knowledge management, informatics, e-business are doing to remain competitive
in the market. Louisa Carson, conference organiser for Oxford International, said
interest in the meeting was strong. 'Pharma needs to catch up with developments
in information technology. It has been lagging behind.'
Source - “INDIA: Outsourcing moves up the value chain”, Apr 2007, from Oxford Analytica Daily Brief
Figure 11
Source - “INDIA: Outsourcing moves up the value chain”, Apr 2007, from Oxford Analytica Daily Brief
Figure 12

37
1.7 Skills to Develop
The role of the Chief Information Officer (CIO) — and consequently the role of
the Information Technology (IT) department as a whole — has changed
significantly over the years, especially as the use of internal and external IT
service providers has become commonplace. Today’s IT organizations are
expected to demonstrate excellence in the management of cost, capability and
capacity. These skills are always in demand, but never more so than in the
current challenging economic conditions where organizations are looking to
control costs while simultaneously increasing flexibility and positioning
themselves for the business upturn. With this pressure on IT departments set to
increase, how well are they responding is a factor based on which the
capabilities are assessed.
It is critical to understand the role of IT Service Management & Governance
(SM&G) — the capabilities required to enable successful end-to-end
management of internally and externally sourced services? Is SM&G seen as an
enabler or a sticking point? In answer to these questions, in April 2009 TPI
carried out a survey of European CIOs to ask them, “Are You Ready for the IT
SM&G Challenges Ahead?”
The TPI research uncovered a number of interesting revelations about the
difficulties of modern SM&G and the evolving role of the IT department as an

38
architect of business change and success. The research reveals that many IT
departments have put SM&G at the heart of their operations to enable successful
end-to-end management of internally and externally sourced services.
Furthermore, they have become far more closely aligned with the business, and
the majority enjoys the support of their company’s most senior executives.
However, despite a strong start, it is hard to find SM&G structures that operate at
best-in-class levels where business processes are defined, successfully
implemented, regularly measured and improved over time. After years of denial,
SM&G has finally moved up the executive agenda; but there remains lots of room
for improvement in SM&G excellence. The next generation of SM&G is looking to
thrive instead of merely survive. In all, research concluded with following findings;
Finding # 1: The customer is king – more than ever. More than half of the
respondents identified the close working relationship with their internal customers
as critical to their success. Future focus and alignment to the business are the
main concerns of IT today, yet the challenge of on-time delivery of business
based projects is still a problem for more than two-thirds of CIOs.
Finding # 2: Change is the only constant. Organizational change is a top priority
for most organizations. More than 90 percent of the CIO survey respondents
anticipate major change. At the top of the priorities list is the consolidation of
applications and service providers as organizations look to improve performance

39
and reduce costs and complexity by increasing standardisation across the
organization. CIOs are also concerned with the performance of their own
departments. About one third of those surveyed are currently restructuring their
own IT or SM&G organizations to address gaps or low-performance issues.
Finding # 3: Broad communication is a missing change enabler. Though the
CIOs surveyed believed strongly that their IT SM&G organization was closely
aligned with the rest of the organization — and most were confident that they had
the backing of their organization’s most senior executives — they were less
confident about whether all company employees actually knew and understood
this strategy. Change management and communication across internal
organizations remains an issue.
Finding # 4: Centralized versus local IT decision making power must remain in
balance. European CIOs reported consensus on the balance between
centralized and local decision making power, which is difficult to achieve in highly
federated IT organizations. This high level of consensus when it comes to
decision-making has not always been the case and indicates a growing capability
in this area.
Finding # 5: Organizational size and skill benchmarks are needed for maturity
assessment. Although most CIOs are dissatisfied with the sizing of their

40
organization, there is a degree of confusion about how best to address this issue.
Most CIOs surveyed have experienced organic growth in their SM&G
departments as the services matured, with attendant cost ramifications and no
means to benchmark their organization sizing against market best practice.
Although most CIOs surveyed were confident that their employees had the right
business, technical and relationship skills to deliver excellence, they also
reported that access to the right skills was their greatest delivery challenge.
Finding # 6: End-to-end business processes are key for integrated IT services.
The CIOs were aware that service delivery for IT organizations must meet
business needs and be defined in business terms. They highlighted two business
processes that remain an issue: consolidated business demand management
and an integrated request-to-pay process that covers an integrated IT services
catalogue, order system, invoicing and chargeback.
Finding # 7: Value creation comes to the fore. Nearly 90 percent of the CIO’s
customers expect high-quality services to be delivered at the right cost. More
than half want complete cost transparency, and three-quarters expect a strong
relationship with the SM&G team. However, less than 12 percent of respondents
believe that their internal relationships were working as well as they should and
that customers are frequently happy with the service they receive.

41
Finding # 8: Customers are difficult to delight. Just one in 10 CIOs believes their
business stakeholder relationships are working very well – and more than one-
fifth noted they faced significant difficulties with stakeholder satisfaction. Being
‘good enough’ does not meet the forward-thinking business model that these
CIOs strive for.
Finding # 9: There is still room for improvement in service provider management.
Relationships with external service providers are also rated by CIOs as merely
satisfactory. More than half of respondents feel that their service providers purely
deliver to contractual obligations, with only very few service providers exceeding
expectations. Of those surveyed, more than one- fifth stated that they are looking
to renegotiate their current arrangements.
Finding # 10: Managing costs before they occur is the nirvana for all IT
organizations. The management of customer demand with on time requirements
supported by accurate cost information and forecasting is clearly seen as a
burning platform — and current management practices do not give the kind of
visibility to the CIO that is needed.
CIOs are now more likely than ever expected to play a direct role in setting
business strategy. This requires the CIO to be in greater control of the entire IT
sourcing life cycle than ever before - and this need for excellence in management

42
extends into every aspect of the IT organization. Skills, processes, overall
performance measurement, financial management, understanding the
mechanisms of innovation, and heightened awareness in every IT member are
critical to address the challenges ahead, especially in times of uncertain
economic conditions. TPI service management operating model framework is
presented below;
Source - “Are you ready for the IT service management & governance challenges ahead?” by Andrea Spiegelhoff from TPI, July 2009
Figure 13

43
CHAPTER 2
Review of Literature
More than 200 reference papers, research articles, industry journals and industry
reports have been screened as part of literature review. For the research topic,
“To study the Impact of Compliance and Best Practices Management on IT
Outsourcing”, it was observed that specific information was unavailable in
university libraries as there are not many books published on the subject. Hence,
internet with priviledged access to knowledge and thought leadership websites
such as Forrestor, ProQuest, IDC Health Insights, IBM Market Insights and
Gartner were chosen as primary sources of information.
While reviewing literature, it was observed that several big Life Sciences
companies are actively considering offshore outsourcing as a means for
managing the cost and time pressures better. Due to dynamic regulations and
data privacy restrictions, some companies are still uncomfortable in outsourcing
core processes. It will more appropriate to look at this relatively new model of
outsourcing as an engine to achieve operational excellence by partnering with
external IT service providers. However, with new outsourcing business models,
there will be impending regulatory compliance mandates which could potentially
be the bottlenecks, and at the same time cannot be ignored.

44
Even big companies who are into outsourcing business since many years are still
following standard industry defined models of Application Maintenance Services
(AMS) and Application Development (AD) outsourcing. For these companies, to
remain competitive with costs and time savings, it will be ideal to think beyond
conventional models of execution and explore more aggressive outsourcing
opportunities.
Top Executives in various companies struggle to get their teams adopt new
measures of Quality and thereby lack in enhancing efficiency and accuracy in the
production line. In the thought paper published by Harvard Business Review
(May/June 1988), it is depicted that how tough it is to develop an organization
capable of absorbing elegant ideas. Also, the book mentions that the principle
benefit of House of Quality is “Quality In-house”. It gets people thinking in right
directions and thinking together. Besides quality attributes, one other important
aspect that needs to be focused upon is the – core competencies. Core
competencies vary from industry to industry and company to company depending
on the company’s vision and business reach. In the knowledge article written by
C.K. Prahalad and Gary Hamel (Jan 1990), they provided thoughts on how the
firms focused on core competencies create unique, integrated systems that
reinforce fit among a firm’s diverse production and technology skills – systematic
advantage competitors can’t copy.

45
Following the concept of quality attributes and core competencies with integrated
systems that can reinforce fit among a firm’s diverse production and technology
skills, Rhône-Poulenc Forms Network To Develop Gene and Cell Therapies
(Jan 1995), newsletter mentions how the company has creatively formed a new
division, RPR Gencell, dedicated to the discovery, development, and
commercialization of cell and gene therapy products. To accelerate such
discoveries, the company has also created a biotechnology network comprising
14 biotech companies and academic research centers. When going through
further literature, it was found that in the abstract of the book, written by Clayton
M. Chrsitensen (Jun 1997), explains the radical position that great companies
can fail precisely because they do everything right. It demonstrates why
outstanding companies lose their market leadership when confronted with
disruptive technology--and it explains how to avoid a similar fate in Information
Technology and Life Sciences industries. This guidance and thoughts shared in
the abstract can help the companies in driving things in the right way with a
calculated risk approach.
When it comes to the scenario of outsourced world i.e. IT service providers
should develop flexible models that are suitable to the client’s business models.
In the white paper published by HUGHES Software Systems (April 2002),
stresses that outsourcing decisions should be based on a solid business case of
alternatives. The paper enumerates the basic elements that need to be

46
considered to move outsourcing agreements beyond transaction based
relationships to value-added strategic partnerships and what additional
dimensions Service Providers should develop? The benefit of developing such
flexible alternate approaches will help the service providers in better positioning
in market sense and reach clients easier with solutions. This is supported by the
research paper published by IT NASSCOM-Mckinsey Manpower Profile of
India – KPMG (Jan 2003), emphasizing on the prospective demand pipeline in
IT export services (Consulting, Integration, Installation, IT Development,
Outsourced IT Support, Training and Education) and IT enabled services
(Customer care, Finance, Human Resource, Payment, Administration Services
and Content development).
Life Sciences industry has been a late starter in adopting outsourcing. There are
various reasons for this and some of the important ones are – highly regulated
industry, risks of failure being too high, stringent checks on quality that are
required at various levels and cost barriers. However, in the last two decades,
companies are showing higher interest levels in outsourcing and the article Big
Pharma learns how to love information technology (Apr 2003), focuses on
providing smarter and better integration of existing data and whether considering
the latest technology or simple rules for company, information technology must
serve the wider business. Also, the article, Changing Trends in Life Sciences
Outsourcing: The Allure of Emerging Markets (June 2004), emphasizes on
trends in Life Sciences outsourcing business. The future of Life Sciences

47
outsourcing and growth in outsourcing will continue to be fuelled principally by
the demand for R&D enabled technologies such as genomics, high-throughput
screening and proteomics all of which facilitate the need for more and more
targets thus enabling more outsourcing.
Following the statement made on cost barriers in the above paragraph,
companies are considering innovative approaches to reduce costs where
possible and divert these savings into other areas that can be considered to be
done in a new manner. These generally lead to Green-Field projects and First-
Of-A-Kind (FOAK) Projects. In the article written by Joe Flower, Cost
Management (Nov/Dec 2004), the author has highlighted various steps that
healthcare managers can consider to have a check on the healthcare cost
pressures and also some pointers that can help in increasing the productivity
significantly. One way of managing the costs better is to have skilled labor at
lower costs. This idea has forced companies in the West to consider moving
some of their operations to Emerging nations. In the article written by Lisa
Jarvis, Chemical Market Reporter (Mar 2005), the author explained how big
Pharma is now weighing the risks and rewards of taking some of its more
complex, important molecules to India and China.
The concept of outsourcing has started with outsourcing non-core, non-critical
operations and then gradually to outsourcing the core and critical operations too.

48
More and more business functions have started to be outsourced to India and in
the report, published by Oxford Analytica Daily Brief Service (Apr 2007), talks
about how the BPO sector has been growing in India and the way in which this
has moved into the KPO services offering by the Indian companies, either to
compliment the BPO services or as distinct specialties. Not restricting to India
BPO business alone, Life Sciences companies have started to consider
outsourcing operations on clinical research and generics. In the newsletter
written by Kudrat Bhatia (Nov 2007), the author has demonstrated key points of
Indian generic makers and how they are playing an important role in the global
consolidation process and are augmenting their market presence across
regulated as well as semi-regulated markets. The concept of outsourcing has
picked-up pace and more companies from the west started to invest in India and
China to make drugs reach the market sooner and also yield dollar benefits.
In the article written by written by Pete Engardio, Arlene Weintraub, Nandini
Lakshman (Sep 2008), the authors have highlighted how the Western
executives have been flocking to India’s hastily built science parks, looking for
allies in the never-ending quest to develop blockbuster treatments. The era of
service providers has been gradually fading away and the era of service partners
was emerging. On one side there are many good things about outsourcing, on
the other side there is some amount of risk involved as well. In the Emerging
nations, India and China are considered the leading countries in hosting
outsourcing services to the world. The lack of stringent regulations and not much

49
quality oriented business mindset could be a challenge while companies
considering outsourcing in these nations.
In the research work compiled by Jim J. Zhang (July 2009), the researcher
included company profiles of top 50 best outsourcing services providers in China
and India. It is a valuable report to drug regulatory agencies and other
government agencies that are involved in strategic planning for development of
Life Sciences industry in their own countries. Also, the global economy crisis
added some turbulence to the outsourcing world and the Outlook for the Global
Outsourcing Industry (2009), article emphasizes on the current global
economic crises, their effects of the financial uncertainty and concerns regarding
India-based outsourcing that are likely to be felt across the global outsourcing
industry.
Life Sciences industry is the highly regulated industry in the world and different
countries have various guidance and regulations around drug research,
development, manufacturing and distribution areas. Amongst the global
regulations, US FDA is considered to be the most mature and thought leader in
promoting and protecting public health with best of the breed practices. FDA has
provided guidance on building quality into product from the design stages and it
called as Quality by Design (QbD). In the article written by Patricia Van Arnum
(Jan 2010), the author explained how the United States Food and Drug

50
Administration’s Quality-by-Design (QbD) initiative, a science and risk-based
approach to manufacturing, adds another layer to the relationship between
sponsor companies and contract manufacturers. NASSCOM research report
(Feb 2010), from NASSCOM research report forecasts and brings out some
interesting numbers in the IT-BPO industry and several contributors or favorable
factors that helped in this growth.
The key to grow the business is to be innovative and creative with calculated
risks taken logically. The research report published by Inc research (Jun 2010),
emphasizes the point that Life Sciences companies should start shifting their
drug development initiatives to performance-based clinical delivery alliances at
the earliest. There has been assurance and encouragement provided by the
regulatory agencies and help companies adopt newer technologies. The latest
FDA guidance (Feb 2012), demonstrates best available science to keep pace
with scientific advances and make decisions that both support innovation and
protect and promote public health. Despite the support extended by the
regulatory agencies, some of the companies were still lacking behind in adopting
outsourcing options. Researcher T.R. Ramanathan (Jun 2010) in his research
publication seeks to understand the nature of organizational change with respect
to offshore outsourcing of informational technology services and to examine the
effectiveness of approaches used to manage this change so that lessons may be
drawn from these experiences.

51
2.1 Western Research on Outsourcing
Outsourcing of Life Sciences functions traditionally has taken the form of
outsourcing drug development and manufacturing to contract research
organizations (CROs) and contract manufacturing organizations (CMOs).
Research, development and marketing were kept in-house as those were core
competencies and critical success factors. Today, some of the research and
development is also being outsourced globally in the light of proliferation of new
technologies and new knowledge (Doshi, 2004, pp. 125-127). The cost of
developing one new product increased from $131 million in 1987 to $802 million
in 2001 and the average successful launch of a new drug is $250 million.
Meanwhile, in 2000-2002, only one of thirteen discovered and clinically trialed
drug makes it to market, compared to one out of eight in 1995-2000 (Gilbert,
Preston, & Singh, 2003, p. 4). This huge and costly decline in R&D productivity
has increased global Life Sciences outsourcing opportunities to $40 billion per
year.
Information technology is in the forefront of the R&D outsourcing phenomenon.
First, Information Technology has always been a part of the R&D process
(Komninos, 2004). For instance in software engineering, changing from the
awkward machine language to the “easy to use” fifth generation programming
language is based on R&D efforts. Second, Information Technology also serves

52
as an enabler for R&D (Nambisan, 2003). The aggressive implementation of
information technology in the product development arena will reshape innovation.
Unlike existing innovation processes which are passive, the IT enabled
innovation processes are active, directly supporting innovation activities.
Considering Real options - is an alternative valuation method for capturing
managerial flexibility that is inherent in R&D projects (Lewis, Enke, & Spurlock,
2004). In there study, a multi-stage vendor selection was studied and issued
information technology outsourcing using real options analysis. They used the
example of outsourcing the development of supply chain management
information systems for a logistics firm and found real options to be a viable
project valuation technique for R&D outsourcing.
The review of literature reveals by and large, comprehensive and focus study
on outsourcing in general, applicable across the Life Scinces industry
and the way in which Information Technology companies are shaping
their offerings and services. Generic approach is gathered irrespective of
the size and nature of the Life Sciences companies. However, given the
high rigor of compliance and regulations in the Life Sciences industry,
the manner in which Information Tehnology companies are aligning and
meeting the impending regulations in the newer business model is to be
understood. Hence, there is a wide scope to study the impact of
compliance and best practices management on IT outsourcing in the Life

53
Sciences industry.
During the process of reviewing the literature, it is also observed, IT
companies in India and China are moving fast in attracting global Life
Sciences companies. The advantages for Indian and Chinese companies,
trends in winning more outsourcing businesses are presented in the
following sections.
2.2 India and China Research on Outsourcing
According to NASSCOM, the coming years are going to represent a significant
shift in terms of business models, service lines, customers and talent structure
and there will be increased focus on higher end offerings such as system
integration, consulting, business intelligence, knowledge services and vertical
specific BPO services.
In addition, the industry is expected to generate an increasing share of revenues
from the untapped Small and Medium Business (SMB) segment through
improved pay per use business models and platform solutions. Industry is
expected to continue to be a net hirer with direct employment expected to grow
by 4% and cross 2.3 million with over 90,000 jobs added in FY09-10, Nasscom
said.

54
In an industry conference in 2009, Som Mittal, President of NASSCOM, said: “It’s
a historic moment for the Indian IT-BPO industry as it touches the $50bn
landmark. The growth was led by domestic market buoyed by increased
government spending in IT. In addition, new areas such as engineering services
and product development displayed phenomenal momentum clocking combined
revenue of over $10bn.”
“The growth was led by the domestic market, buoyed by increased government
spending on Information Technology (IT). In addition, new areas like engineering
services and product development displayed phenomenal momentum, clocking a
combined revenue of over $10 billion (over Rs. 46,000 crore),” Nasscom
President Som Mittal said, while releasing the industry’s performance report card
and next-year projections.
In the same industry conference in 2009, Pramod Bhasin, Chairman of Nasscom,
said: “The performance of the industry in this year is far stronger than what is
reflected through the growth numbers. The industry has reinvented itself by
increasing its cost efficiencies, utilisation rates, diversification into new verticals
and markets and new business and pricing models. In the process, it was also
able to turn itself into a business transformation enabler for its clients.”

55
As per NASSCOM study, the industry growth rate has come down from 32
percent four years ago to single digits now. In fact, with BPOs moving up the
value chain to provide such high-end services as business analytics and
knowledge-based services through a mix of re-engineering skills, technology-
enabled platforms, new operating models and increased depth of services, BPO
exports are estimated to grow 6 percent to $12.4 billion (over Rs. 57,000 crore).
“The penetration in BPOs is still very low. But BPO, along with cloud computing
and remote infrastructure management, are expected to drive growth,” said
Pramod Bhasin.

56
Global Sourcing Trends
Worldwide technology products and related services spend crossed USD 1.6
trillion in 2008, a growth of 5.6 per cent over 2007. Worldwide BPO spending in
2008 grew by 12 per cent, which was the highest among all the segments. BPO
today is an integral part of the global delivery chain and is increasingly involved
in mission critical applications. Global sourcing market size has increased
threefold since 2004, to reach USD 89-93 billion in 2008. Offshore IT-BPO
service providers continue to build their global delivery footprint, expanding
service lines and also growing inorganically by acquiring firms in the US and
Europe to build skills and “nearshore” delivery capabilities. Therefore, though the
established players dominated the market, Indian heritage service providers
gained ground and market share.
Total IT-BPO industry to reach USD 71.7 billion accounting for 5.8% of India’s
GDP; software and services revenues aggregated to about USD 60 billion
Software and Services export revenues estimated to grow over 16-17% to reach
USD 47 billion. Direct employment expected to reach nearly 2.23 million, an
addition of 226,000 employees, while indirect job creation estimated at ~8 million.
India’s fundamental advantages—abundant talent and cost—are sustainable
over the long term. With a young demographic profile and over 3.5 million
graduates and postgraduates that are added annually to the talent base, no other
country offers a similar mix and scale of human resources.

57
Seven Indian cities account for 95 per cent of export revenues; focus is on
developing 43 new locations to emerge as IT-BPO hubs for higher growth in
European/Asian market.
IT Services, Engineering Services, R&D and Software Products IT Services
IT Services involves a full range of engagement types that include consulting,
systems integration, IT outsourcing/managed services/hosting services, training
and support/maintenance. IT services (excluding BPO, Engineering Services,
R&D and Software products), contributing to 57 per cent of the total software and
services exports, remains the dominant segment and is estimated at USD 26.9
billion, a growth of nearly 16.5 per cent in FY2009. Domestic IT services spends
grew at over 43 per cent in FY2008, showing strong signs of increasing
sophistication as building enterprise IT infrastructures and applications,
networking and communication became key priorities for India Inc.
Engineering Services, R&D and Software Products
The engineering, R&D, and software products exports segment is expected to
grow by 14.4 per cent in the current fiscal, to touch USD 7.3 billion, which
highlights the strong impetus and renewed focus on improving IP driven service
capabilities in India. Indian software product companies revenues accounted for
21 per cent of total software product revenues in FY2009, up from 20.6 per cent
in FY2008. The market grew exponentially driven by an increasing number of

58
start-up software product businesses as well as a rapid growth of existing
businesses.
BPO Market
BPO services exports, up 18 per cent, was the fastest growing segment across
software and services exports driven by scale as well as scope. BPO service
portfolio was strengthened by vertical specialization and global delivery
capabilities. Emergence of domestic BPO is the key highlight for FY2009
recording a growth of above 40 per cent in Indian Rupee (INR) terms. The growth
is led by the Banking, Financial Services and Insurance (BFSI), Telecom and
Airline industries and a greater vendor focus with specific service offering.
Horizontal BPO, accounting for more than 80 per cent of Indian BPO exports,
represents the larger and relatively more established set of services being
delivered from India. Other aspects of Indian BPO, besides the growing breadth
and depth of the service portfolio, that reflect its increasing maturity include the
increasing global delivery footprint and continuous emphasis on enhancing
service delivery efficiency and productivity.
Hardware Market
Despite the declining trends in pricing observed across key categories,
increasing volumes have ensured that the domestic hardware revenue aggregate
continues to grow. While hardware exports remained steady, domestic hardware

59
segment remains the largest segment to grow at 17 per cent in INR terms during
FY 2009. PC adoption is growing at more than 30 per cent incase of SMBs.
India’s IT-BPO Value Proposition
Strong fundamentals, a robust enabling environment, and enhanced value
delivery capability are the hallmarks of the Indian IT-BPO industry. India enjoys a
cost advantage of around 60-70 per cent as compared to source markets.
Additional productivity improvements and the development of tier 2/3 cities as
future delivery centers, is expected to enhance India’s cost competitiveness.
Timely government policies and increased public-private participation have
played a key role in developing an enabling business environment for the Indian
IT-BPO industry. The Government’s focus on education has helped create the
large talent base from where the industry draws its workforce. The Government’s
proactive approach towards the IT-BPO industry was further highlighted in 2008
through actions such as the IT Act Amendment, extension of tax incentives by a
year, removal of the SEZ Act anomalies and the introduction of progressive
telecom policies that focus on work from home.
Indian companies are now trying to adopt a culture that encourages innovation,
embrace new trends such as Green IT, and deliver solutions that are focused on
re-engineering and transformation. India is emerging as a leading Innovation hub
with increasing number of patents being filed and granted from India. The silver

60
lining of the economic downturn is the opportunity for the industry to enhance its
overall efficiency. Companies are increasingly looking inwards and focusing on
process benchmarking, enhanced utilization of infrastructure and talent,
increasing productivity and greater customer engagement
Future Outlook
According to India’s trade organization, National Association of Software and
Services Companies (NASSCOM), the country’s IT and BPO services
outsourcing market is expected to grow nearly five times in the next ten years.
That amounts to $225 billion in terms of sales by the year 2020. Som Mittal,
president of NASSCOM said in a statement, although short-term challenges are
real, the industry’s potential is still tremendous. This IT and business outsourcing
sector will not be constrained by demand, he added.
Several businesses in the U.S. and Europe outsource a segment of their
business, i.e. tech functions to India in attempts to slash costs amid a global
recession. The end result also achieves a spike in productivity and extension of
global footprint for these Western firms. Although President Obama indicated to
keeping more jobs in-shore within the U.S., no measures have been
implemented to inhibit offshoring in the first nine months of his administration.
NASSCOM has indicated that Indian outsourcers will need to look beyond
established IT hubs like Hyderabad, Bangalore and Delhi to open up second-tier

61
hubs in Kolkata. This would provide more room for growth within the industry,
officials pointed out. Mittal outlined that constructing an ecosystem is crucial for
growth within the outsourcing industry. The sector is also required to concentrate
on security, trade relations and talent development so that growth can be
sustained.
Total outsourcing sales tagged at $58.8 billion in the financial year 2010-11.
Incidentally, $46.3 billion emanated from sales to customers abroad, reported
NASSCOM. Moreover, exports are projected to add 4% - 7% in the present
financial year, and are expected to hit double digits in the following fiscal year.
Nearly all of the growth is expected to stem from sectors that have yet to
discover the benefits of offshore outsourcing, said Mittal, adding that 80 percent
of growth is likely to be spurred by opportunities external to core markets,
customer segments, and verticals.
Industries, i.e. manufacturing, technology and financial services are forerunners
in the outsourcing realm, while healthcare and transportation have been
untapped by Indian outsourcers. The key players in the global outsourcing
market are industrial giants like Infosys, Wipro, and TCS along with several mid-
tier players, and following are some more predictions on future outlook.
§ Despite the unprecedented economic downturn the industry will witness
sustainable growth

62
§ The global technology related spending is expected to grow from 2010
onwards led by growth in outsourcing adoption
§ Greater focus on cost and operational efficiencies in the recessionary
environment is expected to enhance global sourcing
§ India Inc would remain focused on tactical measures to achieve cost
savings and greater productivity
§ Services and software segments are estimated to cross USD 1.2 trillion by
end of 2012. This is more than the 5.2 per cent growth expected in the
total IT spending.
§ The huge potential for global sourcing is further highlighted by an
addressable market size of USD 500 billion in 2008, which is more than
five times bigger than the current market
§ The industry will continue to diversify in terms of geographies, verticals
and service lines
§ SMBs are expected to emerge as a significant opportunity due to lower IT
adoption currently
§ Lack of working age population in the developed economies and a
significant long term cost arbitrage indicates India’s sustained cost
competitiveness
§ Service providers are expected to enhance focus to domestic market to
de-risk business and tap into the local growth opportunities

63
2.3 Studies on Life Sciences Companies Behavior
The nature of impending regulatory implications and Data Security / privacy
requirements were could be common determinants that would come in the way of
outsourcing. Following is a summary of behavioral steps that are widely common
across the group:
* For those firms using outsourcing, it is critical to do an in-depth review of firms
in order to obtain a good fit relative to goals and business practices. Several
firms have changed or expanded the number of local outsourcing firms being
used.
* All firms used workflow management tools. The tools were internally developed
for this function or were modified from other tools already in place within the firm.
* Quality of staff and work performance is found to be a major issue. A wide
range of commentary on quality, which was generally seen to be below the levels
delivered within the U.S. and the U.K. This has an impact on the amount and the
complexity of work that can be assigned. Further, it appears common that local
staff have a higher perception of their value than their U.S. management
believes. This leads to problems with local staff accepting work assignments that
are beyond their capabilities. As a consequence, results can be below-standard.
Most firms noted that they continually monitor quality.
* Local staff needs more attention, reinforcement, and reward motivation than
staff in the U.S. or U.K. There are many cultural issues that become factors in
64
assignment of work, the quality of work, and the required level of supervision and
management.
* Staff attrition is well above that within the U.S. and U.K. The average term of
employment was 9-18 months. There was one exception-where a firm has its
own staff and limited hours of operations that mirror U.S. hours, the attrition rate
was in the 2-year range.
* Level of management involvement and support was a major topic of
conversation, both at the local level and in the U.S. and U.K. It was unanimous
that there were greater requirements for U.S. management than what was
anticipated. This needs to be considered when doing cost/benefit analyses.
* There are numerous issues with support for infrastructure, including problems
with power grids, internet connectivity, and telephones. These problems were
encountered less with firms that had their own buildings and staff.
* Content usage and vendor management is a key area of concern. About half of
the firms negotiated with their vendors for offshore usage, others were of the
mind-set that they could fit this usage within existing contracts. Some of the
vendors are more difficult than others when discussing this issue.
Some of the aspects that need to be considered while outsourcing to India are;
1. Operating costs in India are rising sharply; salaries are increasing by 12% to
20% per annum, as well as a general upswing in other operating costs.

65
2. Management and administrative costs are much higher than initially
projected.
3. It can be very difficult to capture all associated and soft costs, which, if fully
accounted for, would further reduce any savings.
One of the research studies mentioned that there was a wide difference of
opinion in savings and ROI between the senior management and/or partners and
middle/administrative/operational management who are actively involved in over
seeing offshore operations. It is observed that, more senior the person in the
organization role, the higher their perception that outsourcing was effective and
resulting in cost reduction. Interestingly, one middle manager told that it would be
a career damaging act to oppose outsourcing, even though she had financial
information that clearly showed that it would not meet the cost reduction goals of
her firm. Her statement was, "This is what senior management wants, and either
I get on the bandwagon with them, or someone else will."
2.4 Studies on Information Technology Companies Behavior
IT Companies have been moving fast in grabbing the opportunities available in
the market. The behaviour of IT companies has to be looked into from two
different perspectives i.e. global players and pure players. Companies like IBM,
Accenture, CapGemini, GE et al are amongst the global players. The Indian
companies like TCS, Infosys, Cognizant, HCL, Wipro et al are considered as the
pure players.

66
Global Players
Global players have been part of the outsourcing business much earlier than the
pure players. These companies are geographically more diversified with broad
delivery capabilities in multiple areas. These companies spend a significant
amount of time on research work and thought leadership material that could
serve as value adds to the work that can be delivered to their clients. Often this
work is industry oriented and relevant to a particular topic prevailing in the
industry. Global players have a tendency to hunt for big contracts i.e. deal worth
USD 10 million and more. Lesser preference is given to smaller deals. Also from
a resource point, these companies hire in Subject Matter Experts and Industry
Professionals to be part of the project teams who can play the advisory roles and
connect better with clients. This will help in seamless integration with technical
and functional teams during project execution and builds clients confidence in
knowing the business.
Pure Players
Pure players have entered the outsourcing world later and have been focusing
on specialized niche services and areas to begin with. As the clientele expanded
they adopted a cautious approach in growing the number of practitioners and
opening new delivery centers. These companies even today work on a model
that is targeted solutions for targeted customers. These companies do not set

67
preferences on the size of the deal like the global players. However, a most
optimum cost case is submitted to their prospective clients. For these companies
every project, no matter of the dollar value is critical and important. In fact, most
of these companies, inject one or two good practitioners to perform clients work
and then expand the business with the foothold established. This is a common
strategy with pure players.
Some times, clients look for additional hands that can help them in getting on
with some of their tasks. So these pure players provide people to the client on a
fixed price contract for a particular duration, and this is called as Staff
Augmentation service. Pure players do not focus on retaining Subject Matter
Experts and Industry Professionals for a longer duration on their company roles.
When need arises, they reach out and seek help from industry Contractors. The
time and effort spent on thought leadership is much lesser when compared to
global players.
2.5 Research Gap Analysis
Based on the review of literature, the following gaps were identified;
1. The strategies adopted by IT players with respect to compliance and best
practices and thereby win outsourcing opportunities was missing.
2. There is no reference to the impact of compliance mandates imposed by
Food and Drug Administration authorities on Outsourcing business. In the

68
literature, the best practices management adopted by IT companies was
addressed only at a high level, and further study is essential for details.
3. There is no study relevant to both Life Sciences and IT industries in
tandem, detailing the kind of challenges that exist while considering
outsourcing models was missing.
4. Besides some forecast studies and companies annual performance
reports, the considerations on what avenues the Indian IT service
providers could explore to expand the outsourcing business was not
provided in detail.

69
CHAPTER 3
Statement of the Problem and Research Methodology
3.1 Statement of the Problem / Scope of the Study
1. Over the years, it is observed that more and more companies across
industries have moved towards offshoring. Life Sciences companies
happen to be a late starter in this phenomenon. One of the reasons could
be – regulations are dynamic and fear of compliance failure when
outsourced to external service providers.
2. Though IT companies are very good in technology areas and fast-tracking
processes and timelines, they are weak in meeting Food and Drug
Administration standards of quality and compliance, besides some of the
data privacy implications.
3. In the last 15 years, due to tremendous pressure on innovation of more
effective and swift processes, the concept of offshoring is on the rise in
Life Sciences industry. While considering these new strategies,
companies attract newer challenges and bottlenecks that cannot be
ignored to remain compliant.

70
4. There is a definite need to relook at traditional processes and explore
what can be outsourced for cost and time benefits, as time is a critical
factor for both innovator and generic companies.
IT companies could serve as enablers in saving costs and time for the Life
Sciences companies. To achieve this, IT companies need to step up and
customize their processes and delivery models to the needs of the Life
Sciences industry. This study includes – new processes and operations that
could be considered for offshore outsourcing, regulatory compliance
implications and overall benefits.
3.2 Objectives of the Study
Based on the secondary survey data, literature review and gaps were identified,
and the objectives of the study were framed. The following are the objectives of
the research;
1. To study dynamic compliance and best practices adopted by
organizations in IT outsourcing
2. To study the impact of compliance and best practices management on IT
outsourcing strategies
3. To study and identify other bottlenecks in IT outsourcing business
management

71
4. To study further opportunities and avenues in IT outsourcing
5. Provide relevant suggestions and recommendations
3.3 Hypothesis
In alignment with the desired objectives, five hypothesis parameters were set for
evaluation. The following hypothesis was initiated;
H01: Big Pharma companies are not front runners in building and
executing compliant offshore outsourcing strategies
H11: Big Pharma companies are front runners in building and executing
efficient offshore outsourcing strategies
H02: FDA encouragement is not necessary in building innovative
outsourcing strategies
H12: FDA encouragement is necessary in building innovative
outsourcing strategies
H03: There is no benefit to Life Sciences companies by choosing IT
outsourcing business models
H13: There is benefit to Life Sciences companies by choosing IT
outsourcing business models

72
H04: There is no more headroom for expansion of the outsourcing
processes in Pharma IT
H14: There is more headroom for expansion of the outsourcing
processes in Pharma IT
H05: India based IT companies have no edge over other outsourcing
companies in the world
H15: India based IT companies have edge over other outsourcing
companies in the world
3.4 Pre-study
Discussions were conducted with professionals and leaders from both industries
i.e. Life Sciences and IT to understand their view points on Outsourcing and
Offshoring. There were mixed responses to some of the general questions and
these responses could not lead to a conclusion. This research topic was chosen
based on the industry exposure and experience and with a keenness to explore
further. Several books and industry newsletters were referred to understand the
details.
3.5 Primary and Secondary Data
For primary data collection, two separate questionnaires were prepared from the
context of offshore outsourcing i.e. from a User company and service provider

73
perspectives. Survey Questionnaire – 1 was prepared in view of the Life
Sciences industry and was subject to seek responses from Life Sciences industry
professionals. Survey Questionnaire – 2 was prepared for IT industry and was
subject to seek responses from IT industry professionals. Responses were
captured in these questionnaires in personal interviews and further taken up for
statistical analysis. The findings from this exercise are considered in the final
research report preparation and conclusion.
For secondary data collection, detailed literature review was conducted by
gathering information from various sources - internet, libraries, books, journals
and other public domain avenues. A thorough review/study of these collaterals
was done to bring out the current As-Is model and the standard practices across
the industry.
· Journal Articles
· Books
· Newspapaer Articles
· Websites and
· Additional References (where the author names was not found)
Secondary data was collected with the help of the following;
1. Detailed literature review by gathering information from – journal articles,
books, newspaper articles, websites and other public domain avenues. A

74
thorough review/study of these collateral to bring out the current As-Is
model and the standard practices across the industry.
2. More than 400 reference papers, research journals and thought process
collaterals were reviewed
3. Sources – Gartner, Forrester, IDC, ProQuest, NASSCOM, etc.
3.6 Instruments for Survey
Research Instruments for Primary data collection are;
1. Interviews using Industry specific Questionnaire
2. Emphasis on Findings – What, When, Where and How
3. Enablers – LinkedIn Groups, Gmail and Other Social Site Contacts
The questionnaires capture information related to;
ü General Information about Respondent and Company
ü Information related to Organizational Structure
ü Information related to Regulatory Compliance Adherence
ü Information related to Best Practices Adopted and Growth Initiatives
ü Information related to Risks and Strategy
ü Information related to Operational Principles / Delivery Excellence
ü Information related to Training and Knowledge Building
ü Information related to Geographical Reach
ü Information related to Organizational Perception towards Outsourcing

75
ü Information related to Organizational Perception towards Services
3.7 Selection of Samples
The total population of Life Sciences-IT companies relevant to the study was
more than 500 and the total employees’ headcount in these companies was
more than 20 lakh. z-test was used for calculating the sample size of the people
interviewed. According to the formula, sample size of population for each industry
is approximately 384. Subsequently, 325 people from 33 Life Sciences
companies were interviewed followed by 430 people from 27 IT companies. The
actual population sample of people interviewed is 755 from 60 companies.
z-test formula; _
X - µ z = ----------- σ / √¯n
Total population of companies is approximately 12% of total population of
interviews conducted. While it might have been appropriate to increase the
number of companies from 60 to 100, it was observed that collecting data from
these companies has been extremely difficult. Some of the known reasons that
have attributed to this challenge are – conservative nature of Life Sciences
companies, highly regulated nature of the industry, restrictions due to process
patents and copy rights. From IT companies’ perspective, stiff competition and
companies eagerness to become niche service market leaders were bottlenecks
in data collection.

76
Industry Total Sample of Companies
Total Population Sample Interviewed
Life Sciences 33 325
Information Technology 27 430
Total 60 755
Table 6
3.8 Pre Testing Phase
The first survey was done on a pilot scale considering 10 companies each
from Life Sciences and IT industries and interviewing 50 people. After getting
adequate responses, the questionnaire was modified to include the changes
and then administered on respondents from all other companies and
personnel.
3.9 Tabulation and Statistical Analysis of Data
The responses observed from each of the questions in the questionnaire were
scored and tabulated into a master sheet using SPSS package. The statistical
tools included to draw logical conclusions were;
§ Pearson Chi-square
§ Likelihood Ratio and
§ Linear-by-Linear association

77
In addition, based on industry consulting experience, worksheets were tabulated
using Matrix Analysis. As part of this method, two key variables were selected
that could impact desired outcome. A two-dimensional matrix was prepared,
labeled one axis with first variable and the other axis with second variable. Along
each axis, all possible subtopics for each variable were listed. Drew lines from
each axis so that “cubes” are formed, representing the combination of one
variable from each axis. Then each variable was subdivided into elements. From
each cube of the matrix, considered how elements could be combined and
contributed to an innovative solution.
3.10 Interpretation and Report Writing
The analyzed data was finally interpreted using SPSS package to draw the
conclusions and reported with alignment to the objectives and hypothesis of the
study.
3.11 Limitations of the Study
1. This study being sensitive to both Life Sciences and IT companies, data
collection has been difficult. Some of the known reasons that have attributed
to this challenge are;
§ conservative nature in information sharing
§ restrictions due to process patents and copy rights
§ highly regulated nature of the industry

78
§ stiff competition and
§ companies eagerness to become nivhe service market leaders
2. This study is limited to the Life Sciences industry spanning from Research
and Development, Clinical Trails, Manufacturing, Quality Control and
Assurance, Regulatory Submissions and Distribution.
3. Study is relevant to IT and ITeS business areas and does not deep dive into
Contract Manufacturing Organizations (CMOs) and Contract Research
Organizations (CROs).
3.12 Significance of the Study
Findings of the research will be beneficial to;
1. Enhance Life Sciences companies decision making, by considering the
dynamic compliance mandates and adopting best practices
2. Enable Life Sciences companies and IT service providers to assess the
impact of compliance on particular scope of outsourced engagement
3. Enable Life Sciences companies to consider core processes for
outsourcing
4. IT service providers will gain knowledge in expanding into niche service
areas of managing clients core processes

79
CHAPTER 4
Data Interpretations and Findings
4.1 Data Analysis – Life Sciences (LS) Questionnaire Responses
An all India survey was conducted to study the impact of compliance and best
practices on IT outsourcing business. Also, the study questionnaire included
questions to assess which companies are front-runners in outsourcing business,
role of regulatory agencies viz. FDA in outsourcing, benefits in outsourcing,
exisiting and explorable opportunities in outsurcing and advantage for Indian IT
companies. Out of the 755 interviews conducted from 60 different companies,
approximately 14% of them were Senior Management staffs who are in decision
making roles. The responses observed from each of the items in the
questionnaire were scored and tabulated into a master sheet. Techniques used
were Chi- square and T-test to draw logical conclusions. The analysis was done
using SPSS Version 20. The analyzed data was finally interpreted to draw the
conclusions and reported with the objectives of the study in view.

80
The hypothesis for the study tested;
H01: Big Pharma companies are not front runners in building and
executing efficient offshore outsourcing strategies
H11: Big Pharma companies are front runners in building and
executing efficient offshore outsourcing strategies

81
Does your organization engage any IT service provider to help your company in business operations? * Your Organization in the current business since? (SPSS Table 34) Your Organization in the current business since? Total
Less than 5 5 – 10 10 – 20 20 – 30 More
than 30 No Count 0 12 6 6 5 29 % within Your Organization in the
current business since? .0% 32.4% 5.6% 6.3% 12.2% 9.9%
Yes Count 12 25 101 90 36 264
Does your organization engage any IT service provider to help your company in business operations? % within Your Organization in the
current business since? 100.0% 67.6% 94.4% 93.8% 87.8% 90.1%
Total Count 12 37 107 96 41 293 % within Your Organization in the
current business since? 100.0% 100.0
% 100.0% 100.0% 100.0% 100.0
% Chi-Square Tests
Value df Asymp. Sig. (2-sided) Pearson Chi-Square 26.270(a) 4 .000 Likelihood Ratio 21.027 4 .000 Linear-by-Linear Association 2.153 1 .142 N of Valid Cases 293
a 3 cells (30.0%) have expected count less than 5. The minimum expected count is 1.19.
Interestingly, it is observed that that companies that are less than 5 years old are keener in engaging IT service provider.
Also, companies that are in the industry since 10 – 20 years and 20 – 30 years also responded their keenness to engage
service providers with (94.4%) and (93.8%) respectively followed by companies that are more than 30 years old, (87.8%).
(32.4%) of respondents from companies in the age group of 5 – 10 years have said they don’t intend to engage IT service
provider.
Chi-square = 26.270; P<0.001 (Significant)

82
Therefore, it can the concluded that there is a significant relationship between age and size of the organization
and organization engaging IT service provider.

83
Does your organization engage in any of the Process Analytical Technology (PAT) initiatives as recommended by FDA? * What is the keenness of your organization and/or department in moving from manual operations o automated processes of critical business operations? (SPSS Table 46)
What is the keenness of your organization and/or department in moving from manual
operations to automated processes of critical business operations? Total
Highly
Interested Interested Not
Interested Shall Consider
Later No Count 24 42 4 10 80 % within What is the keenness of your organization and/or
department in moving from manual operations to automated processes of critical business operations?
24.0% 26.6% 66.7% 66.7% 28.7%
Yes Count 76 116 2 5 199
Does your organization engage in any of the Process Analytical Technology (PAT) initiatives as recommended by FDA?
% within What is the keenness of your organization and/or department in moving from manual operations to automated processes of critical business operations?
76.0% 73.4% 33.3% 33.3% 71.3%
Total Count 100 158 6 15 279 % within What is the keenness of your organization and/or
department in moving from manual operations to automated processes of critical business operations?
100.0% 100.0% 100.0% 100.0% 100.0%
Chi-Square Tests Value df Asymp. Sig. (2-sided) Pearson Chi-Square 16.227(a) 3 .001 Likelihood Ratio 14.424 3 .002 Linear-by-Linear Association 10.843 1 .001 N of Valid Cases 279
a 3 cells (37.5%) have expected count less than 5. The minimum expected count is 1.72.
71.3% of respondents opined that they are keen in adopting PAT technologies and were interested in moving from
manual to automated processes.
Chi-square = 16.227; P=0.001 (Not Significant)
Therefore, it can be concluded that big companies are willing to adopt PAT technologies and keen in moving
from manual to automated processes.

84
Which department/operations are leading adopters of automation/IT enablement in your organization? * FDA is encouraging companies to adopt newer technologies in making the drugs arrive in market sooner. Which business unit in your organization is rapidly moving ahead in embracing these technologies? (SPSS Table 54)
FDA is encouraging companies to adopt newer technologies in making the drugs arrive in market sooner. Which business
unit in your organization is rapidly moving ahead in embracing these technologies? Total
R&D Manufacturing QC/QA
Regulatory
Marketing, Sales &
Distribution Othe
r R&D Count 16 2 3 0 0 1 22 % within FDA is encouraging companies to adopt newer technologies
in making the drugs arrive in market sooner. Which business unit in your organization is rapidly moving ahead in embracing these technologies?
30.8% 1.7% 4.8% .0% .0% 20.0% 7.6%
Manufacturing Count 11 92 9 4 13 0 129 % within FDA is encouraging companies to adopt newer technologies
in making the drugs arrive in market sooner. Which business unit in your organization is rapidly moving ahead in embracing these technologies?
21.2% 77.3% 14.5% 44.4% 29.5% .0% 44.3%
QC/QA Count 18 15 44 3 13 0 93 % within FDA is encouraging companies to adopt newer technologies
in making the drugs arrive in market sooner. Which business unit in your organization is rapidly moving ahead in embracing these technologies?
34.6% 12.6% 71.0% 33.3% 29.5% .0% 32.0%
Regulatory Count 3 5 2 2 2 0 14 % within FDA is encouraging companies to adopt newer technologies
in making the drugs arrive in market sooner. Which business unit in your organization is rapidly moving ahead in embracing these technologies?
5.8% 4.2% 3.2% 22.2% 4.5% .0% 4.8%
Count 4 4 3 0 15 1 27 Marketing, Sales & Distribution
% within FDA is encouraging companies to adopt newer technologies in making the drugs arrive in market sooner. Which business unit in your organization is rapidly moving ahead in embracing these technologies?
7.7% 3.4% 4.8% .0% 34.1% 20.0% 9.3%
Other Count 0 1 1 0 1 3 6
Which department/operations are leading adopters of automation/IT enablement in your organization?
% within FDA is encouraging companies to adopt newer technologies in making the drugs arrive in market sooner. Which business unit in your organization is rapidly moving ahead in embracing these technologies?
.0% .8% 1.6% .0% 2.3% 60.0%
2.1%
Total Count 52 119 62 9 44 5 291 % within FDA is encouraging companies to adopt newer technologies
in making the drugs arrive in market sooner. Which business unit in your organization is rapidly moving ahead in embracing these technologies?
100.0%
100.0%
100.0%
100.0%
100.0% 100.0%
100.0%

85
Chi-Square Tests
Value df Asymp. Sig. (2-sided) Pearson Chi-Square 272.338(a) 25 .000 Likelihood Ratio 186.197 25 .000 Linear-by-Linear Association 49.645 1 .000 N of Valid Cases
291
a 24 cells (66.7%) have expected count less than 5. The minimum expected count is .10.
In Life Sciences companies it is observed, Manufacturing department (44.3%) followed by QC/QA departments (32.0%)
are moving ahead when compared to other department and are embracing newer technologies.
Chi-square = 272.338; P<0.001 (Significant)
Therefore it can be concluded that the type of business processes within a department of a large company has a
definite dependency on the overall maturity in embracing newer technologies. This is inline with FDA philosophy
of making pharmaceuticals products cheaper and arrives into market sooner.

86
If yes, what is the primary reason to engage an IT Service provider? * What is the keenness of your organization and/or department in moving from manual operations to automated processes of critical business operations? (SPSS Table 59)
What is the keenness of your organization and/or department in moving from manual
operations to automated processes of critical business operations? Total
Highly
Interested Interested Not
Interested
Shall Consider
Later Lack of man-power in your Organization
Count 8 15 1 1 25
% within What is the keenness of your organization and/or department in moving from manual operations to automated processes of critical business operations? 7.7% 8.9% 16.7% 6.7% 8.5%
Lack of specific skills in your Organization
Count 6 11 0 2 19
% within What is the keenness of your organization and/or department in moving from manual operations to automated processes of critical business operations?
5.8% 6.5% .0% 13.3% 6.5%
To seek expert guidance
Count 48 85 1 1 135
% within What is the keenness of your organization and/or department in moving from manual operations to automated processes of critical business operations? 46.2% 50.6% 16.7% 6.7% 46.1%
For cost benefits
Count 36 35 0 6 77
% within What is the keenness of your organization and/or department in moving from manual operations to automated processes of critical business operations?
34.6% 20.8% .0% 40.0% 26.3%
Other Count 6 22 4 5 37
If yes, what is the primary reason to engage an IT Service provider?
% within What is the keenness of your organization and/or department in moving from manual operations to automated processes of critical business operations?
5.8% 13.1% 66.7% 33.3% 12.6%
Total Count 104 168 6 15 293 % within What is the keenness of your organization and/or department in moving
from manual operations to automated processes of critical business operations? 100.0% 100.0% 100.0% 100.0% 100.0
% Chi-Square Tests
Value Df Asymp. Sig. (2-sided) Pearson Chi-Square 39.296(a) 12 .000 Likelihood Ratio 36.249 12 .000 Linear-by-Linear Association 3.128 1 .077 N of Valid Cases 293
a 9 cells (45.0%) have expected count less than 5. The minimum expected count is .39.

87
A majority of respondents (46.1%) opine to be interested in engaging IT Service Provider to seek expert guidance,
followed (26.3%) respondents think it is for cost benefit advantages. Also, there is a relationship between reasons to
choose external support from IT Service Provider and the organizations keenness in moving from manual to automated
processes.
Chi-square = 39.396; P<0.001 (Significant)
Therefore, it can be concluded when companies are thinking to accelerate and move from manual to automated
processes they are keener in seeking support from external IT service providers.

88
If yes, what has been your overall satisfaction with the chosen service provider(s) performance? * What is the keenness of your organization and/or department in moving from manual operations to automated processes of critical business operations? (SPSS Table 60)
What is the keenness of your organization and/or department in moving from manual
operations to automated processes of critical business operations? Total
Highly
Interested Interested Not
Interested
Shall Consider
Later Very Satisfactory
Count 40 7 0 1 48
% within What is the keenness of your organization and/or department in moving from manual operations to automated processes of critical business operations?
38.1% 4.1% .0% 6.7% 16.3%
Satisfactory Count 48 109 4 11 172 % within What is the keenness of your organization and/or department in moving
from manual operations to automated processes of critical business operations? 45.7% 64.5% 66.7% 73.3% 58.3%
Could have done better
Count 17 50 2 1 70
% within What is the keenness of your organization and/or department in moving from manual operations to automated processes of critical business operations? 16.2% 29.6% 33.3% 6.7% 23.7%
Below Satisfactory
Count 0 3 0 2 5
If yes, what has been your overall satisfaction with the chosen service provider(s) performance?
% within What is the keenness of your organization and/or department in moving from manual operations to automated processes of critical business operations?
.0% 1.8% .0% 13.3% 1.7%
Total Count 105 169 6 15 295 % within What is the keenness of your organization and/or department in moving
from manual operations to automated processes of critical business operations? 100.0% 100.0% 100.0% 100.0% 100.0
% Chi-Square Tests Value df Asymp. Sig. (2-sided) Pearson Chi-Square 73.368(a) 9 .000 Likelihood Ratio 68.293 9 .000 Linear-by-Linear Association 23.130 1 .000 N of Valid Cases
295
a 9 cells (56.3%) have expected count less than 5. The minimum expected count is .10.
A majority of respondents were found to be satisfactory and very satisfied with the service they got from the service
providers. 23.7% of respondents felt that the Service Providers could have done a better job than what they got. Also,

89
there is a relationship between overall satisfaction levels from the Service Providers delivery and the organizations
keenness in moving from manual to automated processes.
Chi-square = 73.368; P<0.001 (Significant)
Therefore, it can be concluded that the past delivery experience of Life Sciences companies from IT Service
providers plays a critical role in further outsourcing decisions.

90
Further it is observed from the analysis that companies with more than 50000
employees hire and retain specific industry Subject Matter Experts as observed
from the (93.8%) responses in (SPSS Table 118 – Annex VII). Organizations
which are more than 30 years old hire and retain core SMEs and industry
professionals catering to specific Life Sciences industry. Over a period of time,
these companies gain the wealth of knowledge and experience in managing best
practices for complex engagements and understand the impending compliance
mandates better.
Since P<0.001, the percentages in four out of five categories is same, it can
be concluded that percentage of people agree are more than those who do
not.
Hence, the null hypothesis (H01) was rejected, proving that big Pharma
companies are indeed front runners in building and executing efficient
offshore outsourcing strategies.

91
The hypothesis for the study tested;
H02: FDA encouragement is not necessary for building innovative
strategies to make processes, robust and faster
H12: FDA encouragement is necessary for building innovative
strategies to make processes, robust and faster

92
FDA is encouraging companies to adopt newer technologies in making the drugs arrive in market sooner. Which business unit in your organization is rapidly moving ahead in embracing these technologies? * Your Organization in the current business since? (SPSS Table 38)
Your Organization in the current business since? Total
Less than 5 5 – 10 10 – 20 20 – 30 More than
30 R&D Count 1 11 19 8 13 52 % within Your Organization in the current business since? 9.1% 29.7% 16.7% 8.7% 33.3% 17.7% Manufacturing Count 0 12 21 74 11 118 % within Your Organization in the current business since? .0% 32.4% 18.4% 80.4% 28.2% 40.3% QC/QA Count 2 7 46 2 7 64 % within Your Organization in the current business since? 18.2% 18.9% 40.4% 2.2% 17.9% 21.8% Regulatory Count 0 1 6 0 1 8 % within Your Organization in the current business since? .0% 2.7% 5.3% .0% 2.6% 2.7% Marketing, Sales & Distribution
Count 8 5 21 7 5 46
% within Your Organization in the current business since? 72.7% 13.5% 18.4% 7.6% 12.8% 15.7% Other Count 0 1 1 1 2 5
FDA is encouraging companies to adopt newer technologies in making the drugs arrive in market sooner. Which business unit in your organization is rapidly moving ahead in embracing these technologies?
% within Your Organization in the current business since? .0% 2.7% .9% 1.1% 5.1% 1.7% Total Count 11 37 114 92 39 293 % within Your Organization in the current business since? 100.0% 100.0% 100.0% 100.0% 100.0% 100.0
% Chi-Square Tests
Value Df Asymp. Sig. (2-sided) Pearson Chi-Square 141.261(a) 20 .000 Likelihood Ratio 139.228 20 .000 Linear-by-Linear Association 12.575 1 .000 N of Valid Cases 293
a 14 cells (46.7%) have expected count less than 5. The minimum expected count is .19.
It is observed that manufacturing vertical is the leading department in embracing newer technologies (40.3%) followed
QC/QA (21.8%). Companies that are less than 5 year old mentioned that Marketing, Sales & Distribution was ahead in
embracing newer technologies (72.7%).
Chi-square = 141.261; P<0.001 (Significant) Therefore, it can be concluded, age of the company plays a role in adoption of newer technologies as per FDA.

93
Does your organization engage in any of the Process Analytical Technology (PAT) initiatives as recommended by FDA? * Your Organization in the current business since? (SPSS Table 39)
Your Organization in the current business since? Total
Less
than 5 5 – 10 10 – 20 20 – 30 More
than 30 No Count 1 16 26 12 25 80 % within Your Organization in the current
business since? 9.1% 43.2% 23.4% 13.6% 67.6% 28.2%
Yes Count 10 21 85 76 12 204
Does your organization engage in any of the Process Analytical Technology (PAT) initiatives as recommended by FDA? % within Your Organization in the current
business since? 90.9% 56.8% 76.6% 86.4% 32.4% 71.8%
Total Count 11 37 111 88 37 284 % within Your Organization in the current
business since? 100.0
% 100.0
% 100.0% 100.0% 100.0% 100.0
% Chi-Square Tests Value df Asymp. Sig. (2-sided) Pearson Chi-Square 44.939(a) 4 .000 Likelihood Ratio 42.811 4 .000 Linear-by-Linear Association 3.955 1 .047 N of Valid Cases 284
a 1 cells (10.0%) have expected count less than 5. The minimum expected count is 3.10.
Companies that are less than 5 year old are aggressive in adopting PAT techniques (90.9%), and the companies that
are more than 30 years are the slowest to embrace PAT technologies i.e. only (32.4%) have shown interest.
Chi-square = 44.939; P<0.001 (Significant) Therefore it can be concluded that age of the company has a dependency on engaging into successful PAT
initiatives as recommended by the FDA.

94
Organization's confidence in adopting IT enabled processes and complying to impending regulations and clearing audits smoothly? * FDA is encouraging companies to adopt newer technologies in making the drugs arrive in market sooner. Which business unit in your organization is rapidly moving ahead in embracing these technologies? (SPSS Table 56)
FDA is encouraging companies to adopt newer technologies in making the drugs arrive in market sooner. Which business unit in
your organization is rapidly moving ahead in embracing these technologies? Total
R&D Manufact
uring QC/QA Regula
tory
Marketing, Sales &
Distribution Other Strong Confidence Count 41 51 52 7 25 4 180 % within FDA is encouraging companies to adopt newer
technologies in making the drugs arrive in market sooner. Which business unit in your organization is rapidly moving ahead in embracing these technologies?
78.8% 43.6% 88.1% 77.8% 55.6% 80.0% 62.7%
Weak Confidence Count 3 18 4 0 7 0 32 % within FDA is encouraging companies to adopt newer
technologies in making the drugs arrive in market sooner. Which business unit in your organization is rapidly moving ahead in embracing these technologies?
5.8% 15.4% .8% .0% 15.6% .0% 11.1%
Same as in Manual Processes
Count 8 48 3 2 13 1 75
Organization's confidence in adopting IT enabled processes and complying to impending regulations and clearing audits smoothly?
% within FDA is encouraging companies to adopt newer technologies in making the drugs arrive in market sooner. Which business unit in your organization is rapidly moving ahead in embracing these technologies?
15.4% 41.0% 5.1% 22.2% 28.9% 20.0% 26.1%
Total Count 52 117 59 9 45 5 287 % within FDA is encouraging companies to adopt newer
technologies in making the drugs arrive in market sooner. Which business unit in your organization is rapidly moving ahead in embracing these technologies?
100.0%
100.0% 100.0%
100.0%
100.0% 100.0%
100.0%
Chi-Square Tests
Value df Asymp. Sig. (2-sided) Pearson Chi-Square 45.065(a) 10 .000 Likelihood Ratio 50.679 10 .000 Linear-by-Linear Association .169 1 .681 N of Valid Cases 287
a 5 cells (27.8%) have expected count less than 5. The minimum expected count is .56.
QC/QA followed by R&D and Regulatory are found to be strongly confident in meeting requirements of audit even with

95
automation. Manufacturing department is on the weaker confidence side. Overall confidence in sailing through IT related
regulatory audits has a dependency on the keenness of the organization in embracing newer technologies.
Chi-square = 45.065; P<0.001 (Significant) Therefore, it can be concluded that Life Sciences companies have grown upto the maturity in automation and
ready to engage service providers. However, even the service providers need to gear up and match the
standards and thereby meet applicable statutory regulatoy requirements.

96
Primary need for enabling automation? * FDA is encouraging companies to adopt newer technologies in making the drugs arrive in market sooner. Which business unit in your organization is rapidly moving ahead in embracing these technologies? (SPSS Table 55)
FDA is encouraging companies to adopt newer technologies in making the drugs arrive in market
sooner. Which business unit in your organization is rapidly moving ahead in embracing these technologies? Total
R&D Manufact
uring QC/QA Regula
tory
Marketing, Sales &
Distribution Other
Efficiency Count 9 7 4 2 8 1 31 % within FDA is encouraging companies to adopt newer
technologies in making the drugs arrive in market sooner. Which business unit in your organization is rapidly moving ahead in embracing these technologies?
17.6% 5.9% 6.5% 22.2% 17.0% 20.0% 10.6%
Productivity Count 4 10 3 1 8 0 26 % within FDA is encouraging companies to adopt newer
technologies in making the drugs arrive in market sooner. Which business unit in your organization is rapidly moving ahead in embracing these technologies?
7.8%
8.5% 4.8% 11.1% 17.0% .0% 8.9%
Accuracy Count 9 7 28 2 5 0 51 % within FDA is encouraging companies to adopt newer
technologies in making the drugs arrive in market sooner. Which business unit in your organization is rapidly moving ahead in embracing these technologies?
17.6% 5.9% 45.2% 22.2% 10.6% .0% 17.5%
Monitoring Count 7 9 3 1 2 0 22 % within FDA is encouraging companies to adopt newer
technologies in making the drugs arrive in market sooner. Which business unit in your organization is rapidly moving ahead in embracing these technologies?
13.7% 7.6% 4.8% 11.1% 4.3% .0% 7.5%
Count 22 85 24 3 24 4 162
Primary need for enabling automation?
All of the Above
% within FDA is encouraging companies to adopt newer technologies in making the drugs arrive in market sooner. Which business unit in your organization is rapidly moving ahead in embracing these technologies?
43.1% 72.0% 38.7% 33.3% 51.1% 80.0% 55.5%
Total Count 51 118 62 9 47 5 292 % within FDA is encouraging companies to adopt newer
technologies in making the drugs arrive in market sooner. Which business unit in your organization is rapidly moving ahead in embracing these technologies?
100.0% 100.0% 100.0
% 100.0
% 100.0% 100.0%
100.0%

97
Chi-Square Tests
Value df Asymp. Sig. (2-sided) Pearson Chi-Square 69.141(a) 20 .000 Likelihood Ratio 64.596 20 .000 Linear-by-Linear Association 2.408 1 .121 N of Valid Cases 292
a 16 cells (53.3%) have expected count less than 5. The minimum expected count is .38.
A majority of the respondents (55.5%) opined that efficiency, productivity, accuracy and monitoring are the main reasons
for considering automation.
Chi-square = 69.141; P<0.001 (Significant) Therefore, it can be concluded that automation if planned and executed well can act as driving engine for the
success of the company and align with FDA expectations better.

98
Does your organization have manufacturing operations outside India i.e. in more than one base country? * Does your organization engage any IT service provider to help your company in business operations? (SPSS Table 61)
Does your organization engage any IT service provider
to help your company in business operations? Total No Yes
No Count 15 52 67 % within Does your organization engage any IT service
provider to help your company in business operations? 55.6% 19.9% 23.3%
Yes Count 12 209 221
Does your organization have manufacturing operations outside India i.e. in more than one base country?
% within Does your organization engage any IT service provider to help your company in business operations? 44.4% 80.1% 76.7%
Total Count 27 261 288 % within Does your organization engage any IT service
provider to help your company in business operations? 100.0% 100.0% 100.0%
Chi-Square Tests
Value df Asymp. Sig. (2-sided) Pearson Chi-Square 17.403(b) 1 .000 Continuity Correction(a) 15.464 1 .000 Likelihood Ratio 14.698 1 .000 Fisher's Exact Test Linear-by-Linear Association 17.342 1 .000 N of Valid Cases 288
a Computed only for a 2x2 table b 0 cells (.0%) have expected count less than 5. The minimum expected count is 6.28.
It is observed that organizations that have manufacturing operations in more than one country tend to engage more IT
Service Providers for help in business operations. There is a definite dependency of number of manufacturing locations
and diversity of the company on IT Service Providers involvement for providing support.
Chi-square = 17.403; P<0.001 (Significant)

99
Therefore it can be concluded that companies having manufacturing locations in more than one country where
FDA and other country specific regulations impact more, then these companies tend to engage IT service
providers more.

100
During the questionnaire interviews, a majority of respondents (85.0%) as shown
in (SPSS Table 62) agreed to have engaged the same Service Provider for
support during regulatory inspections. Also, there is a definite relationship
between IT Service Provider capabilities in providing audit support and the
organizations keenness in moving from manual to automated processes.
Companies that have automation enabled intend to engage an IT service
provider for two main reasons i.e. to seek expert guidance (45.9%) followed by
cost benefits (25.7%), as shown in (SPSS Table 35 – Annex VII).
While the Service Provider was managing project activities, client has roped in
another third-party Service Provider and was given the responsibilities of taking
care of compliance attributes. A total of respondents (72.0%) have shared similar
experience as shown in (SPSS Table 147 – Annex VII).
From the study, it is observed that companies are more willing to consider
outsourcing, when a matured service provider is ready to partner with them
during regulatory audits and inspections, also continuously deliver projects in a
regulatory compliant manner. Subsequently, regulatory agencies like FDA’s
encouragement to both Pharma and IT companies will act as a catalyst in
building newer models of outsourcing.

101
Since P<0.001, the percentages in all five categories is same, it can be
concluded that percentage of people agree are more than those who do
not.
Hence, null hypothesis (H02) was rejected, proving that FDA encouragement
is necessary for building innovative strategies to make processes, robust
and faster.

102
The hypotheses for the study tested;
H03: There is no benefit to Life Sciences companies by choosing IT
outsourcing business models
H13: There is benefit to Life Sciences companies by choosing IT
outsourcing business models

103
What is the primary reason to engage an IT Service provider? * Approximate percentage of automation enabled in your organization? (SPSS Table 40)
Approximate percentage of automation enabled in your
organization? Total
Less than 10% 10 – 30% 30 – 50% 50 – 70% More
than 70% Lack of man-power in your Organization
Count 1 3 11 6 4 25
% within Approximate percentage of automation enabled in your organization? 5.6% 3.1% 9.0% 15.0% 17.4% 8.4%
Lack of specific skills in your Organization
Count 1 5 8 1 3 18
% within Approximate percentage of automation enabled in your organization?
5.6% 5.2% 6.6% 2.5% 13.0% 6.0%
To seek expert guidance
Count 9 63 39 19 6 136
% within Approximate percentage of automation enabled in your organization?
50.0% 65.6% 32.0% 47.5% 26.1% 45.5%
For cost benefits Count 4 14 50 7 5 80 % within Approximate percentage of automation
enabled in your organization? 22.2% 14.6% 41.0% 17.5% 21.7% 26.8%
Other Count 3 11 14 7 5 40
If yes, what is the primary reason to engage an IT Service provider?
% within Approximate percentage of automation enabled in your organization?
16.7% 11.5% 11.5% 17.5% 21.7% 13.4%
Total Count 18 96 122 40 23 299 % within Approximate percentage of automation
enabled in your organization? 100.0% 100.0% 100.0% 100.0% 100.0% 100.0%
Chi-Square Tests Value df Asymp. Sig. (2-sided) Pearson Chi-Square 44.723(a) 16 .000 Likelihood Ratio 44.185 16 .000 Linear-by-Linear Association .241 1 .623 N of Valid Cases 299
a 9 cells (36.0%) have expected count less than 5. The minimum expected count is 1.08.
Companies that have automation enabled intend to engage an IT service provider for two main reasons i.e. to seek expert
guidance (45.5%) followed by cost benefits (26.8%).
Chi-square = 44.723; P<0.001 (Significant)

104
Therefore it can be concluded that companies which are heavily automated engage IT Service providers and
thereby get expert guidance and also achieve overall cost reduction.

105
What has been your overall satisfaction with the chosen service provider(s) performance? * Approximate percentage of automation enabled in your organization? (SPSS Table 41)
Approximate percentage of automation enabled in your
organization? Total
Less than
10% 10 – 30%
30 – 50%
50 – 70%
More than 70%
Very Satisfactory Count 2 4 33 6 4 49 % within Approximate percentage of automation
enabled in your organization? 11.1% 4.2% 26.8% 15.4% 16.7% 16.3%
Satisfactory Count 10 44 81 27 16 178 % within Approximate percentage of automation
enabled in your organization? 55.6% 45.8% 65.9% 69.2% 66.7% 59.3%
Could have done better Count 5 46 8 6 4 69 % within Approximate percentage of automation
enabled in your organization? 27.8% 47.9% 6.5% 15.4% 16.7% 23.0%
Below Satisfactory Count 1 2 1 0 0 4
If yes, what has been your overall satisfaction with the chosen service provider(s) performance?
% within Approximate percentage of automation enabled in your organization? 5.6% 2.1% .8% .0% .0% 1.3%
Total Count 18 96 123 39 24 300 % within Approximate percentage of automation
enabled in your organization? 100.0% 100.0% 100.0%
100.0%
100.0% 100.0%
Chi-Square Tests
Value df Asymp. Sig. (2-sided) Pearson Chi-Square 68.003(a) 12 .000 Likelihood Ratio 70.097 12 .000 Linear-by-Linear Association 20.612 1 .000 N of Valid Cases 300
a 8 cells (40.0%) have expected count less than 5. The minimum expected count is .24.
Organizations which are automated and leveraged IT Service Provider support have shown satisfactory levels at (59.3%)
with companies in 30 – 50% and 50 – 70% automation shown maximum satisfactory levels with (65.9%) and (69.2%)
responses respectively.
Chi-square = 68.003; P<0.001 (Significant)

106
Therefore it can be concluded that companies which are heavily automated are more inclined towards engaging
IT Service providers and are well satisfied with the performance of the engaged service providers.

107
FDA is encouraging companies to adopt newer technologies in making the drugs arrive in market sooner. Which business unit in your organization is rapidly moving ahead in embracing these technologies? * Approximate percentage of automation enabled in your organization? (SPSS Table 43)
Approximate percentage of automation enabled
in your organization? Total
Less than 10%
10 – 30%
30 – 50%
50 – 70%
More than 70%
R&D Count 1 10 25 9 6 51 % within Approximate % of automation enabled in your organization? 5.9% 10.8% 20.7% 23.7% 28.6% 17.6% Manufacturing Count 8 66 29 12 1 116 % within Approximate % of automation enabled in your organization? 47.1% 71.0% 24.0% 31.6% 4.8% 40.0% QC/QA Count 6 6 30 10 11 63 % within Approximate % of automation enabled in your organization? 35.3% 6.5% 24.8% 26.3% 52.4% 21.7% Regulatory Count 0 1 6 1 1 9 % within Approximate % of automation enabled in your organization? .0% 1.1% 5.0% 2.6% 4.8% 3.1%
Count 1 10 30 4 2 47 Marketing, Sales & Distribution
% within Approximate % of automation enabled in your organization? 5.9% 10.8% 24.8% 10.5% 9.5% 16.2%
Other Count 1 0 1 2 0 4
FDA is encouraging companies to adopt newer technologies in making the drugs arrive in market sooner. Which business unit in your organization is rapidly moving ahead in embracing these technologies? % within Approximate % of automation enabled in your organization? 5.9% .0% .8% 5.3% .0% 1.4% Total Count 17 93 121 38 21 290 % within Approximate % of automation enabled in your organization? 100.0
% 100.0
% 100.0
% 100.0
% 100.0
% 100.0
%
Chi-Square Tests
Value df Asymp. Sig. (2-sided) Pearson Chi-Square 87.047(a) 20 .000 Likelihood Ratio 89.195 20 .000 Linear-by-Linear Association 1.515 1 .218 N of Valid Cases 290
a 16 cells (53.3%) have expected count less than 5. The minimum expected count is .23.
Manufacturing vertical happens to be the leading department in embracing newer technologies across all types of
organizations. Companies with 10 – 30% automation enabled are leading in embracing these newer technologies with
(71.0%) responses.

108
Chi-square = 87.047; P<0.001 (Significant)
Therefore it can be concluded that companies which have well automated manufacturing systems and support
from service providers find it much easier to align with FDA expectations on faster and cheaper medicines.

109
Does your organization engage in any of the Process Analytical Technology (PAT) initiatives as recommended by FDA? * Approximate percentage of automation enabled in your organization? (SPSS Table 44)
Approximate percentage of automation enabled
in your organization? Total
Less than 10%
10 – 30%
30 – 50%
50 – 70%
More than 70%
No Count 7 18 24 20 9 78 % within Approximate percentage of
automation enabled in your organization?
38.9% 19.8% 20.5% 57.1% 47.4% 27.9%
Yes Count 11 73 93 15 10 202
Does your organization engage in any of the Process Analytical Technology (PAT) initiatives as recommended by FDA?
% within Approximate percentage of automation enabled in your organization?
61.1% 80.2% 79.5% 42.9% 52.6% 72.1%
Total Count 18 91 117 35 19 280 % within Approximate percentage of
automation enabled in your organization?
100.0%
100.0%
100.0%
100.0%
100.0%
100.0%
Chi-Square Tests Value df Asymp. Sig. (2-sided) Pearson Chi-Square 25.720(a) 4 .000 Likelihood Ratio 23.893 4 .000 Linear-by-Linear Association 8.329 1 .004 N of Valid Cases 280
a 0 cells (.0%) have expected count less than 5. The minimum expected count is 5.01.
In continuation to the earlier finding, organizations in 10 – 30% and 30 – 50% automation enabled are responding
favorably to FDA’s PAT initiatives.
Chi-square = 25.720; P<0.001 (Significant)
Therefore it can be concluded that the percentage of automation helps companies in successful PAT initiatives
for faster processes and better control on quality.

110
For the IT enablement or the automation of certain business processes, did your organization engage the same service provider for support during regulatory inspections? * Does your organization engage any IT service provider to help your company in business operations? (SPSS Table 62)
Does your organization engage any IT service provider to help your company in business
operations? Total No Yes
No Count 12 38 50 % within Does your organization engage any IT service provider to help your
company in business operations? 50.0% 15.0% 18.1%
Yes Count 12 215 227
For the IT enablement for the automation of certain business processes, did your organization engage the same service provider for support during regulatory inspections? % within Does your organization engage any IT service provider to help your
company in business operations? 50.0% 85.0% 81.9%
Total Count 24 253 277 % within Does your organization engage any IT service provider to help your
company in business operations? 100.0% 100.0% 100.0%
Chi-Square Tests
Value df Asymp. Sig. (2-sided) Pearson Chi-Square 18.133(b) 1 .000 Continuity Correction(a) 15.845 1 .000 Likelihood Ratio 14.241 1 .000 Fisher's Exact Test Linear-by-Linear Association 18.067 1 .000 N of Valid Cases 277
a Computed only for a 2x2 table b 1 cells (25.0%) have expected count less than 5. The minimum expected count is 4.33.
A majority of respondents (85.0%) agreed to have engaged the same Service Provider for support during regulatory
inspections. Also, there is a definite relationship between IT Service Provider capabilities in providing audit support and
the organizations keenness in moving from manual to automated processes.
Chi-square = 18.133; P<0.001 (Significant)

111
Therefore it can be concluded that Life Sciences companies when they engage service providers, can also get
support from them during regulatory audits.

112
From the study, it is observed that companies when they partner with the right
service provider derive overall benefits interms of robust and quicker process,
regulatory support and cost benefits.
Since P<0.001, the percentages in all five categories is same, it can be
concluded that percentage of people agree are more than those who do
not.
Hence, the null hypothesis (H03) was rejected, proving that there is benefit
to Life Sciences companies when they choose IT outsourcing business
models

113
4.2 Data Analysis – Information Technology (IT) Questionnaire Responses
The hypothesis for the study tested;
H04: There is no more headroom for expansion of the outsourcing
processes in Pharma IT
H14: There is more headroom for expansion of the outsourcing
processes in Pharma IT

114
If no service provider(s) was engaged so far, what is the primary reason not to engage with any IT Service provider? * Your Organization in the current business since? (SPSS Table 37)
Your Organization in the current business since? Total
Less than 5 5 – 10 10 – 20 20 – 30 More
than 30 Lack of confidence in service providers
Count 1 2 21 10 2 36
% within Your Organization in the current business since? 8.3% 7.4% 18.9% 20.0% 5.0% 15.0% Lack of specific service providers
Count 4 4 4 1 1 14
% within Your Organization in the current business since? 33.3% 14.8% 3.6% 2.0% 2.5% 5.8% Impending additional Regulatory Risks
Count 0 4 15 4 1 24
% within Your Organization in the current business since? .0% 14.8% 13.5% 8.0% 2.5% 10.0% Cost barriers Count 6 15 68 27 24 140 % within Your Organization in the current business since? 50.0% 55.6% 61.3% 54.0% 60.0% 58.3% Other Count 1 2 3 8 12 26
If no service provider(s) was engaged so far, what is the primary reason not to engage with any IT Service provider?
% within Your Organization in the current business since? 8.3% 7.4% 2.7% 16.0% 30.0% 10.8% Total Count 12 27 111 50 40 240 % within Your Organization in the current business since? 100.0% 100.0
% 100.0% 100.0% 100.0% 100.0
% Chi-Square Tests
Value df Asymp. Sig. (2-sided) Pearson Chi-Square 56.387(a) 16 .000 Likelihood Ratio 49.282 16 .000 Linear-by-Linear Association 8.773 1 .003 N of Valid Cases 240
a 12 cells (48.0%) have expected count less than 5. The minimum expected count is .70.
A majority of the respondents replied that cost barriers have been one of the prime reasons not to engage external service
providers, overall (58.3%). A total respondents of (33.3%) working in companies that are less than 5 years old have
mentioned the reason as lack of specific service providers for not being able to engage any service provider. Companies
in 10 – 20, 20 – 30 year groups responded that lack of confidence in service providers did not allow them to engage them,
(38.9%).

115
Chi-square = 56.387; P<0.001 (Significant) Therefore it can be concluded that, IT service providers if they can come up with niche solutions that are scalable
and also economical can be offered easily to the Life Sciences companies.

116
During the course of engagements with clients, how tough was meeting the regulatory compliance mandates? * Organization in the current business? (SPSS Table 107)
Organization in the current business? Total
Less than 5 years
5 – 10 years
10 – 20 years
20 – 30 years
More than 30 years
No impact Count 2 4 8 1 135 150 % within Organization in the current business?
11.8% 16.7% 28.6% 8.3% 43.5% 38.4%
Could have done better Count 9 13 14 6 110 152 % within Organization in the current business?
52.9% 54.2% 50.0% 50.0% 35.5% 38.9%
Tough Count 6 7 6 5 65 89
During the course of engagements with clients, how tough was meeting the regulatory compliance mandates?
% within Organization in the current business? 35.3% 29.2% 21.4% 41.7% 21.0% 22.8%
Total Count 17 24 28 12 310 391 % within Organization in the current business?
100.0% 100.0% 100.0% 100.0% 100.0% 100.0%
Chi-Square Tests Value df Asymp. Sig. (2-sided) Pearson Chi-Square 20.222(a) 8 .010 Likelihood Ratio 22.617 8 .004 Linear-by-Linear Association 11.188 1 .001 N of Valid Cases 391
a 4 cells (26.7%) have expected count less than 5. The minimum expected count is 2.73.
A majority of respondents opine that they could have done better in terms of meeting and adhering to regulatory
requirements (38.9%). High number of respondents contributing to this response was from companies that are less than
10 year old. 38.4% respondents felt that there was no impact on delivery due to additional regulatory compliance
mandates. 22.8% respondents observed that it was tough during project execution to meet the impending regulatory
expectations.

117
Chi-square = 20.222; P>0.001 (Not Significant) Therefore it can be concluded that, more number of years an IT service provider has spent in the industry does
not imply that they can manage dynamic regulatory mandates easily.

118
Has your organization build any industry specific solutions as part of the regulatory agencies requirements e.g. Promotional Spend Compliance (PSC), Process Analytical Technology (PAT) or is in the process of building them? * Organization in the current business? (SPSS Table 108)
Organization in the current business? Total
Less than 5 years
5 – 10 years
10 – 20 years
20 – 30 years
More than 30 years
No Count 8 5 6 6 53 78 % within Organization in the
current business? 47.1% 21.7% 23.1% 50.0% 17.8% 20.7%
Yes Count 9 18 20 6 245 298
Has your organization build any industry specific solutions as part of the regulatory agencies requirements e.g. Promotional Spend Compliance (PSC), Process Analytical Technology (PAT) or is in the process of building them?
% within Organization in the current business? 52.9% 78.3% 76.9% 50.0% 82.2% 79.3%
Total Count 17 23 26 12 298 376 % within Organization in the
current business? 100.0% 100.0% 100.0% 100.0% 100.0% 100.0%
Chi-Square Tests
Value Df Asymp. Sig. (2-sided) Pearson Chi-Square 15.094(a) 4 .005 Likelihood Ratio 12.617 4 .013 Linear-by-Linear Association 6.756 1 .009 N of Valid Cases
376
a 3 cells (30.0%) have expected count less than 5. The minimum expected count is 2.49.
A total of (79.3%) respondents believe that their company has built industry specific solutions as part of regulatory
agencies requirements. Also, there is a relationship between industry specific solutions development and the
organization’s age. It is observed that companies who have been since more than 20 years intend to develop industry
solutions for strategic advantages.
Chi-square = 15.094; P>0.001 (Not Significant)

119
Therefore it can be concluded that, IT service providers who have spent more time in the industry need not be
the only ones to think of industry specific solutions. The smaller and new players can also build solutions for
certain niche and target markets.

120
Approximately, what has been your organization involvement in engaging with the client in the above projects? * Total head count in your organization? (SPSS Table 109) Total head count in your organization? Total
Less
than 500 500 – 5000
5000 – 20000
20000 – 50000
More than 50000
Less than 10% Count 5 2 0 0 9 16 % within Total head count in your
organization? 25.0% 13.3% .0% .0% 2.6% 4.0%
10 – 30% Count 8 4 1 0 25 38 % within Total head count in your
organization? 40.0% 26.7% 9.1% .0% 7.3% 9.5%
30 – 50% Count 0 2 2 3 26 33 % within Total head count in your
organization? .0% 13.3% 18.2% 25.0% 7.6% 8.3%
50 – 70% Count 3 2 3 2 67 77 % within Total head count in your
organization? 15.0% 13.3% 27.3% 16.7% 19.6% 19.3%
More than 70% Count 4 5 5 7 214 235
Approximately, what has been your organization involvement in engaging with the client in the above projects?
% within Total head count in your organization? 20.0% 33.3% 45.5% 58.3% 62.8% 58.9%
Total Count 20 15 11 12 341 399 % within Total head count in your
organization? 100.0% 100.0% 100.0% 100.0% 100.0% 100.0%
Chi-Square Tests Value df Asymp. Sig. (2-sided) Pearson Chi-Square 71.301(a) 16 .000 Likelihood Ratio 52.082 16 .000 Linear-by-Linear Association 44.692 1 .000 N of Valid Cases
399
a 16 cells (64.0%) have expected count less than 5. The minimum expected count is .44.
Companies that had more number of people were able to provide larger portfolio of services to clients. There is a definite
dependency of percentage involvement of clients’ projects and total head count in the company.
Chi-square = 71.301; P<0.001 (Significant)

121
Therefore it can be concluded that, bigger IT service providers, with large resource pool availability have the
potential to look beyond convential way of outsourcing business.

122
What is driving industry clients to reach out to your organization? * Which department/operations in the industry have been primarily associated? (SPSS Table 152)
Which department/operations in the industry have been primarily
associated? Total
R&D, Manufacturing,
QC/QA Sales &
Distribution Clinical
Research Product
Development Other Count 38 20 8 18 23 107 Requirement of
Innovative Business Models
% within Which department/operations in the industry have been primarily associated? 38.0% 31.3% 57.1% 26.9% 24.7% 31.7%
Count 20 16 3 16 20 75 Streamlining IT Enabled Operations
% within Which department/operations in the industry have been primarily associated? 20.0% 25.0% 21.4% 23.9% 21.5% 22.2%
Count 26 8 2 10 10 56 Managing IT Regulatory Compliance Better
% within Which department/operations in the industry have been primarily associated? 26.0% 12.5% 14.3% 14.9% 10.8% 16.6%
Count 12 15 1 16 14 58 Cost Benefits % within Which department/operations in the
industry have been primarily associated? 12.0% 23.4% 7.1% 23.9% 15.1% 17.2%
Count 4 5 0 7 26 42
What is driving industry clients to reach out to your organization?
Other % within Which department/operations in the
industry have been primarily associated? 4.0% 7.8% .0% 10.4% 28.0% 12.4%
Total Count 100 64 14 67 93 338 % within Which department/operations in the
industry have been primarily associated? 100.0% 100.0% 100.0% 100.0% 100.0
% 100.0%
Chi-Square Tests Value df Asymp. Sig. (2-sided) Pearson Chi-Square 47.313(a) 16 .000 Likelihood Ratio 45.650 16 .000 Linear-by-Linear Association 13.699 1 .000 N of Valid Cases 338
a 5 cells (20.0%) have expected count less than 5. The minimum expected count is 1.74.
Requirement of innovative business models (31.7%) is the primary reason that is driving industry clients to reach out to
Service Providers followed by streamlining IT enabled operations (22.2%), Cost benefits (17.2%), and managing IT

123
regulatory compliance better (16.6%). Also, there is a definite relationship between what the clients’ are looking for and
what the IT Service Providers are offering specific to department/operations within the Life Sciences value chain.
Chi-square = 47.313; P<0.001 (Significant) Therefore it can be concluded that, IT service providers who can customize their solutions based on the clients
requirements will have a definite advantage over other providers.

124
During the questionnaire interviews, it was observed that all four challenges i.e.
patents related regulations, price controls, weak infrastructure and forex
movements and political risks come in way of offshoring/outsourcing for
companies in the emerging markets (SPSS Table 129 – Annex VII). A majority of
respondents felt that winning and managing new customized product
development followed by strategic consulting projects were difficult with 36.6%
and 29.0% responses respectively as shown in (SPSS Table 140). It was
observed under (SPSS Table 141), 51.9% of respondents believe that the
projects they managed had an impact on client’s release of products and
remaining 48.1% felt that there was no impact on product release.
Also, (SPSS Table 142 – Annex VII) depicts, 57.7% of respondents believe that
the projects they managed had an impact on clients’ core business operations
and remaining 42.3% felt that there was no impact on core business operations.
A majority of respondents opine that they could have done better in terms of
meeting and adhering to regulatory requirements (39.8%). 38.7% respondents
felt that there was no impact on delivery due to additional regulatory compliance
mandates. 21.5% respondents observed that it was tough during project
execution to meet the impending regulatory expectations. Also there is definite
relationship between expertise in managing regulatory expectations and the type
of industry vertical the service provider caters to. This is shown in (SPSS Table
112) & (SPSS Table 143 – Annex VII).

125
Based on the observations, it was understood that there are more avenues to
explore within reach of both Life Sciences and IT companies in the outsourcing
business. Nevertheless, the overall maturity and global reach of IT service
providers play a critical role in shaping the strategies.
Since P<0.001, the percentage is same in majority of categories, it can be
concluded that percentage of people agree are more than those who do
not.
Hence, the null hypothesis (H04) was rejected, proving there is more
headroom for expansion of the offshore outsourcing processes in Pharma
IT business.

126
The hypothesis for the study tested;
H05: India based IT companies have no edge over other
outsourcing companies in the world
H15: India based IT companies have edge over other outsourcing
companies in the world

127
Where do you position your organization in your service capabilities? * Organization in the current business? (SPSS Table 106)
Organization in the current business? Total
Less than 5 years
5 – 10 years
10 – 20 years
20 – 30 years
More than 30 years
Level 1 – Business Specific Solutions Count 6 8 10 1 68 93 % within Organization in the
current business? 37.5% 32.0% 35.7% 7.7% 21.4% 23.3%
Level 2 – Solutions to Integrate Multiple Functional Areas
Count 0 8 10 2 50 70
% within Organization in the current business? .0% 32.0% 35.7% 15.4% 15.7% 17.5%
Level 3 – Well Integrated Enterprise Applications viz. Business Intelligence
Count 8 3 0 2 61 74
% within Organization in the current business?
50.0% 12.0% .0% 15.4% 19.2% 18.5%
Level 4 – IT Setup to Automate Entire Organization
Count 1 6 8 7 125 147
% within Organization in the current business?
6.3% 24.0% 28.6% 53.8% 39.3% 36.8%
Other Count 1 0 0 1 14 16
Where do you position your organization in your service capabilities?
% within Organization in the current business?
6.3% .0% .0% 7.7% 4.4% 4.0%
Total Count 16 25 28 13 318 400 % within Organization in the
current business? 100.0% 100.0% 100.0% 100.0% 100.0% 100.0%
Chi-Square Tests Value df Asymp. Sig. (2-sided) Pearson Chi-Square 42.281(a) 16 .000 Likelihood Ratio 49.907 16 .000 Linear-by-Linear Association 9.939 1 .002 N of Valid Cases 400
a 14 cells (56.0%) have expected count less than 5. The minimum expected count is .52.
There is a definite relationship between overall years of Service Providers in the industry and organization maturity level in
service capabilities.
Chi-square = 42.281; P<0.001 (Significant)

128
Therefore, it can be concluded that, more the number of years a service provider spends in the industry, they
tend to develop enhanced features and capabilities over a period of time.

129
Approximately, what has been your organization involvement in engaging with the client in the above projects? * Total head count in your organization? (SPSS Table 109) Total head count in your organization? Total
Less
than 500 500 – 5000
5000 – 20000
20000 – 50000
More than 50000
Less than 10% Count 5 2 0 0 9 16 % within Total head count in your
organization? 25.0% 13.3% .0% .0% 2.6% 4.0%
10 – 30% Count 8 4 1 0 25 38 % within Total head count in your
organization? 40.0% 26.7% 9.1% .0% 7.3% 9.5%
30 – 50% Count 0 2 2 3 26 33 % within Total head count in your
organization? .0% 13.3% 18.2% 25.0% 7.6% 8.3%
50 – 70% Count 3 2 3 2 67 77 % within Total head count in your
organization? 15.0% 13.3% 27.3% 16.7% 19.6% 19.3%
More than 70% Count 4 5 5 7 214 235
Approximately, what has been your organization involvement in engaging with the client in the above projects?
% within Total head count in your organization? 20.0% 33.3% 45.5% 58.3% 62.8% 58.9%
Total Count 20 15 11 12 341 399 % within Total head count in your
organization? 100.0% 100.0% 100.0% 100.0% 100.0% 100.0%
Chi-Square Tests Value df Asymp. Sig. (2-sided) Pearson Chi-Square 71.301(a) 16 .000 Likelihood Ratio 52.082 16 .000 Linear-by-Linear Association 44.692 1 .000 N of Valid Cases
399
a 16 cells (64.0%) have expected count less than 5. The minimum expected count is .44.
It is observed that companies with more number of employees were able to provide larger portfolio of services to clients.
There is a definite dependency of percentage involvement of clients’ projects and total head count in the company.
Chi-square = 71.301; P<0.001 (Significant)

130
Therefore it can be concluded that, big IT service providers in India with large resource pool availability (more
than 50,000 employees) have an edge over the competition from other parts of the world.

131
What is driving industry clients to reach out to your organization? * Which department/operations in the industry have been primarily associated? (SPSS Table 115)
Which department/operations in the industry have been primarily
associated? Total
R&D, Manufacturin
g, QC/QA Sales &
Distribution
Clinical Researc
h Product
Development Other Count 38 20 8 18 23 107 Requirement of
Innovative Business Models
% within Which department/operations in the industry have been primarily associated?
38.0% 31.3% 57.1% 26.9% 24.7% 31.7%
Count 20 16 3 16 20 75 Streamlining IT Enabled Operations
% within Which department/operations in the industry have been primarily associated?
20.0% 25.0% 21.4% 23.9% 21.5% 22.2%
Count 26 8 2 10 10 56 Managing IT Regulatory Compliance Better
% within Which department/operations in the industry have been primarily associated?
26.0% 12.5% 14.3% 14.9% 10.8% 16.6%
Count 12 15 1 16 14 58 Cost Benefits % within Which department/operations
in the industry have been primarily associated?
12.0% 23.4% 7.1% 23.9% 15.1% 17.2%
Count 4 5 0 7 26 42
What is driving industry clients to reach out to your organization?
Other % within Which department/operations
in the industry have been primarily associated?
4.0% 7.8% .0% 10.4% 28.0% 12.4%
Total Count 100 64 14 67 93 338 % within Which department/operations
in the industry have been primarily associated?
100.0% 100.0% 100.0% 100.0% 100.0% 100.0%
Chi-Square Tests Value df Asymp. Sig. (2-sided) Pearson Chi-Square 47.313(a) 16 .000 Likelihood Ratio 45.650 16 .000 Linear-by-Linear Association 13.699 1 .000 N of Valid Cases 338
a 5 cells (20.0%) have expected count less than 5. The minimum expected count is 1.74.

132
Requirement of innovative business models is the primary reason that is driving industry clients to reach out to Service
Providers followed by streamlining IT enabled operations, Cost benefits, and managing IT regulatory compliance better.
Also, there is a definite relationship between what the clients’ are looking for and what the IT Service Providers are
offering specific to department/operations within the Life Sciences value chain.
Chi-square = 47.313; P<0.001 (Significant) Therefore, it can be concluded that, service providers who come up with customized solutions have an
advantage over competition.

133
Approximately, what has been your organization involvement in engaging with the client in the above projects? * Organization in the current business? (SPSS Table 122) Organization in the current business? Total
Less than 5 years
5 – 10 years
10 – 20 years
20 – 30 years
More than 30 years
Less than 10% Count 1 4 1 0 11 17 % within Organization in the current business? 6.3% 15.4% 3.6% .0% 3.5% 4.3% 10 – 30% Count 4 4 5 0 25 38 % within Organization in the current business? 25.0% 15.4% 17.9% .0% 7.9% 9.5% 30 – 50% Count 2 1 4 1 26 34 % within Organization in the current business? 12.5% 3.8% 14.3% 7.7% 8.3% 8.5% 50 – 70% Count 5 4 3 5 59 76 % within Organization in the current business? 31.3% 15.4% 10.7% 38.5% 18.7% 19.1% More than 70%
Count 4 13 15 7 194 233
Approximately, what has been your organization involvement in engaging with the client in the above projects? % within Organization in the current business? 25.0% 50.0% 53.6% 53.8% 61.6% 58.5% Total Count 16 26 28 13 315 398 % within Organization in the current business? 100.0% 100.0
% 100.0% 100.0% 100.0% 100.0%
Chi-Square Tests
Value df Asymp. Sig. (2-sided) Pearson Chi-Square 28.934(a) 16 .024 Likelihood Ratio 26.185 16 .051 Linear-by-Linear Association 13.056 1 .000 N of Valid Cases 398
a 15 cells (60.0%) have expected count less than 5. The minimum expected count is .56.
Based on the responses, it is observed that companies that have spent more than 30 years as Service Providers in
specific area were engaged with clients and managed their IT projects with 61.6% involvement.
Chi-square = 28.934; P>0.001 (Not Significant)
Therefore, it can be concluded that, more the number of years a service provider spends in the industry need not
be the only ones to grab maximum outsourcing share within a company.

134
Where do you position your organization in your service capabilities? * Total head count in your organization? (SPSS Table 133)
Total head count in your organization? Total
Less than
500 500 – 5000 5000 – 20000
20000 – 50000
More than 50000
Level 1 – Business Specific Solutions
Count 7 5 3 3 75 93
% within Total head count in your organization? 35.0% 33.3% 27.3% 25.0% 21.9% 23.3%
Level 2 – Solutions to Integrate Multiple Functional Areas
Count 6 4 3 4 53 70
% within Total head count in your organization? 30.0% 26.7% 27.3% 33.3% 15.5% 17.5%
Level 3 – Well Integrated Enterprise Applications viz. Business Intelligence
Count 2 4 4 3 62 75
% within Total head count in your organization?
10.0% 26.7% 36.4% 25.0% 18.1% 18.8%
Level 4 – IT Setup to Automate Entire Organization
Count 5 0 1 2 138 146
% within Total head count in your organization?
25.0% .0% 9.1% 16.7% 40.4% 36.5%
Other Count 0 2 0 0 14 16
Where do you position your organization in your service capabilities?
% within Total head count in your organization?
.0% 13.3% .0% .0% 4.1% 4.0%
Total Count 20 15 11 12 342 400 % within Total head count in your
organization? 100.0% 100.0% 100.0% 100.0% 100.0% 100.0
% Chi-Square Tests
Value df Asymp. Sig. (2-sided) Pearson Chi-Square 27.401(a) 16 .037 Likelihood Ratio 33.320 16 .007 Linear-by-Linear Association 9.638 1 .002 N of Valid Cases 400
a 18 cells (72.0%) have expected count less than 5. The minimum expected count is .44.
Majority of respondents from companies with more than 50000 employees onboard responded that their company falls in
Level 4 – IT Setup to automate entire organization (36.5%) followed by Level 1 – Business specific solutions (23.3%).
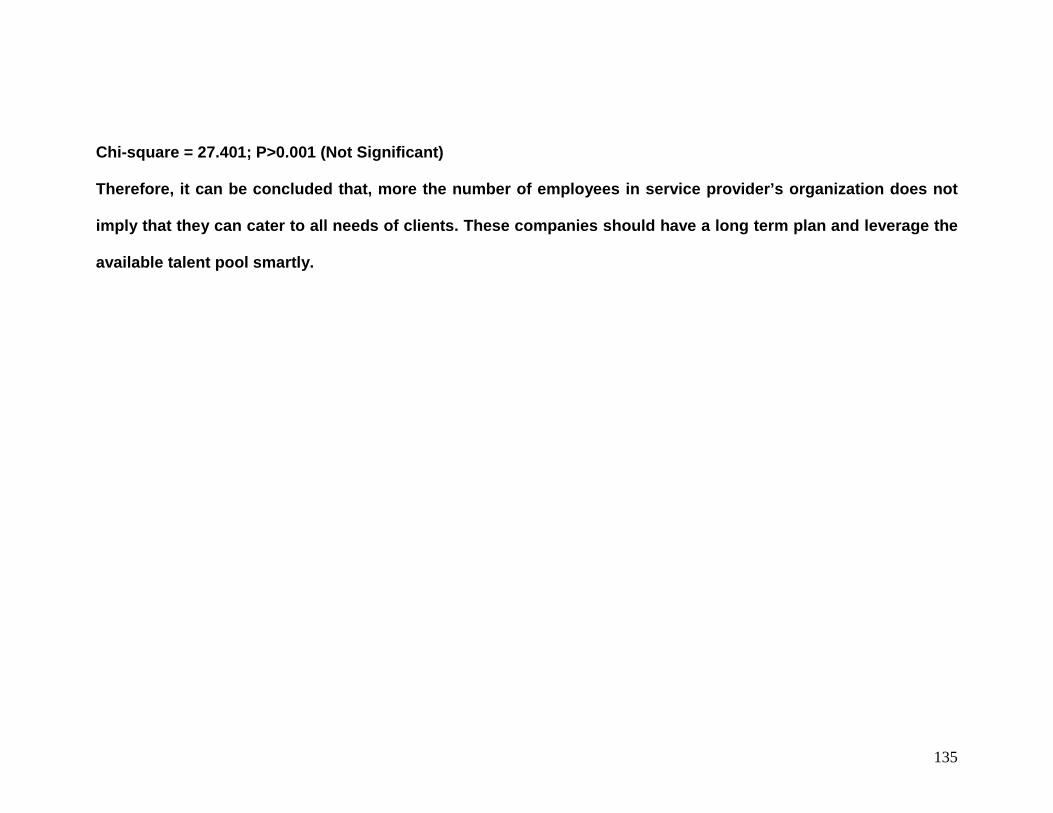
135
Chi-square = 27.401; P>0.001 (Not Significant)
Therefore, it can be concluded that, more the number of employees in service provider’s organization does not
imply that they can cater to all needs of clients. These companies should have a long term plan and leverage the
available talent pool smartly.

136
As observed in (SPSS Table 134 – Annex VII), building client confidence for
effective delivery (51.9%) is the biggest challenge for Service Provider
companies in approaching client, followed by clients conservativeness towards
offshore/outsourcing (16.7%) and ensure consistency in meeting impending
regulations (16.1%) are the second level challenges faced by service providers.
Majority of the respondents were from companies that hosted the IT
infrastructure in India. During the interviews, it was observed and shown in
(SPSS Table 128 – Annex VII), building client confidence for effective delivery if
the biggest challenge all companies perceive while approaching Life Sciences
companies. Interestingly this happens to be the trend for well matured Service
Provider companies who have been providing services for more than 20 years.
Leading Indian based IT companies who have been in the industry for more than
two decades have the potential to demonstrate and execute effective delivery
mechanisms.
Since P<0.001, the percentage is same in majority of categories, it can be
concluded that percentage of people agree are more than those who do
not.
Hence, the null hypothesis (H05) was rejected, proving that India based IT
companies have an edge over other service provider companies in the
world.

137
The study indicates, based on the above statistical analysis that two or more
parameters influence offshore outsourcing decision making process. It is
observed that the certain parameters have strong dependency on each other and
exhibit a significant relationship in outsourcing decision making process.
In addition to the objectives, based on the data interpretation, research
hypothesis designed can be further confirmed as below;
H11: Big Pharma companies are front runners in building and
executing efficient offshore outsourcing strategies
H12: FDA encouragement is necessary in building innovative
outsourcing strategies
H13: There is benefit to Life Sciences companies by choosing IT
outsourcing business models
H14: There is more headroom for expansion of the outsourcing
processes in Pharma IT
H15: India based IT companies have edge over other outsourcing
companies in the world
For all the five hypothesis parameters set, it is observed that the null hypothesis
(H01, H02, H03, H04, and H05) is proven to be incorrect or inappropriate. Hence
rejected the above five null hypothesis parameters, and thereby establishing a
relationship between variables as described in previous pages.

138
CHAPTER 5
Conclusion
Outsourcing can encompass a wide range of services, from a particular to a
technical domain to all activities. Each situation requires a different
understanding of the priorities, measures, costs, and the benefits involved.
Outsourcing decisions should be based on a solid business case analysis
considering various alternatives. The business case is always unique to the
project under consideration and to the organization. It is ideally not possible to
provide a simple criteria template for an outsourcing versus insourcing cost-
benefit analysis and Return-On-Investment (ROI). Each organization must
determine its priorities, criteria, and weight for each project depending on its
individual capabilities.
Though Life Sciences companies are looking at offshore outsourcing favorably,
there are some of the road blocks that still need to overcome, as listed below.
Both clients and Service Providers have roles to play in overcoming these blocks.
1. Highly Conservative Industry
2. Fear of Failure
3. Ready to Go Away with non-GxP Applications
4. High Internal Costs
5. Can’t Give Away Complete Job to Service Provider

139
6. Delivery Excellence and Quality
7. Time Factor
To overcome the industry conservativeness, Service Providers should bring in
FDA and other regulatory agencies thought process in adopting newer
technologies. Proven expertise in effectively managing these initiatives with
adequate level of training will add value. The other factors that will help in
overcoming the conservativeness are by demonstrating the proven methods and
processes and by providing fixed duration commitments for key roles.
Fear of failure is another aspect that worries Life Sciences companies. If Service
Providers can demonstrate the right expertise relevant to the scope of projects
under discussion and adopting a systematic risk-based approach will be a good
value add. Challenge for the Service Providers will be to understand the client’s
business challenges. If the Service Providers can influence clients by
demonstrating deep domain capabilities by having adequately trained staff on
board and availability of SMEs is ideal.
As on today, many clients are ready to apply offshore / outsourcing concepts for
non-GxP applications and projects. For GxP projects, it will be ideal to conduct
pilot studies in a phase wise manner adhering to the impending regulations and
compliance mandates. Approaching in systematic manner and taking up

140
assignments based on experience and growing relationship is the key. Service
Providers can start with managing single stand alone project and then eventually
manage end-to-end portfolio. Periodic monitoring of the Service Providers
performance and skills upgrade is essential.
Every company is faced with managing internal costs better like never before.
Even when it comes to offshoring, Service Providers should be able to
demonstrate a clear value add in terms of dollar savings to the clients. Reusable
assets prove to be very handy and help in reducing costs to a great extent.
Another aspect to consider will be to share the compliance costs and providing
resources to clients and these resources perform client specific roles.
Timely delivery with proven delivery excellence is the ultimate measure to
achieve success in a Client-Service Provider relationship. Service Provider
should be flexible in aligning to clients’ expectations and quality management
system and also be able to ramp-up and ramp-down the project staff as per the
project needs.
India Context
Just as the Gulf has its natural resources in crude oil and South Africa in
diamonds, India's natural resource lie in its abundant technically skilled
manpower. India is the world's second largest exporter of software (after the

141
U.S.), and is the source of management and technical talent for over 40 per cent
of new start-ups in Silicon Valley. Key enablers for India’s story are, its large
English-speaking scientific and higher education institutions, specialist computer
institutes, and low costs of software talent, India has more software companies
with ISO 9000 certification than any other country in the world.
There is more than enough evidence of the superlative role that Indians play in
the progress of the Net. The impact of India's success abroad is also being felt.
The stars of the Indian Internet industry are the Web solutions and Webware
companies, many of whom have made the transition from offshore turnkey and
services companies to full-fledged e-commerce service providers and Web
strategy consultants. IT heavyweights like Microsoft, Intel, Cisco and Compaq
always have been featuring India prominently in their itineraries.
Benefits of Outsourcing in India
· As per NASSCOM report, India offers many advantages that make it the
favorite of 82 percent of US software export market
· Large pool of computer literate and English speaking professionals
· Well recognized Information technology skills
· Wide gap between personnel costs in India and developed countries.
· Work practices largely comply with ISO and SEI CMM standards. Three
out of every four SEI-CMM 5 companies worldwide are located in India.

142
· Quality standards meet the approval of the world. India exports software to
more than 95 countries.
· India has a stable political environment and pro-IT government.
· Reliable satellite and submarine communication links facilitate good
broadband connectivity with the rest of the world.
According to the National Association of Software & Service Companies
(NASSCOM), the Indian software industry lobby, almost half the Fortune 500
companies now use Indian Software services. With over 4 million highly trained
English speaking technical personnel (second only to the USA), heavy
government support and leading world class software companies, India is set to
become the software giant of the new Millennium. Furthermore, a World Bank
funded study in the United States confirmed that vendors rated India as their
number one choice for outsourcing. Other industry sectors have benefited greatly
from their decision to outsource to India: The U.S. and India have an average 12-
hour time zone difference, but this kind of use of datacom can provide a virtual
24-hour office to a client in the U.S. Lately, this concept has worked wonders for
large projects and also for projects involving remote software maintenance using
video conferencing. Offshore projects mean immense time and cost savings.
The need for cost savings and long-term efficiency benefits has prompted a
broad cross section of companies to pursue outsourcing arrangements as a way

143
of gaining a competitive edge in an increasingly challenging global marketplace.
Outsourcing relationships are becoming smaller, shorter, more numerous and
more complex. Clients are increasingly using multiple service providers, and IT
departments are taking an ever-more challenging role in coordinating the work of
these multiple providers with the needs of internal customers to deliver timely
and cost-effective provision of services. These complex relationships require
mature and professional SM&G — and most organizations are not yet at the
point where they can claim to demonstrate excellence in SM&G. Many
organizations have made a start along this road, but they are truly at the
beginning of their SM&G journeys. The issues with organization sizing, skills
management and delivery highlighted by our survey clearly demonstrate that
there is much focused work to be done before companies achieve the very best
in provision of services, management of costs and return on investment. This
involves all aspects of an SM&G operating model, including the drive to support
the business, the organizational structure and sizing, the skills and capabilities of
the IT team members (whether performing in-house IT work or managing
providers), working processes that support the governance requirements and the
ITIL or operational imperatives and clear financial measurement.
The establishment of a strong and supported SM&G operating model framework
ensures that the CIO can cover all the aspects that will bring the IT organization
and governance capability to its highest level. CIOs can call upon help from the

144
market to help them establish workable SM&G models, build effective SM&G
teams and benchmark skills against market best practices. A skilled and
appropriately resourced team will ensure that costs are reduced, maximum value
is achieved and customer needs are met in a timely and professional manner.
SM&G is truly no longer a side function of the IT department. It is central to the
ongoing success of the whole organization.
IT–BPO sector in India has grown rapidly over last few years and the IT-BPO
industry revenues (Software and Services) for 2008 are estimated to be over
USD 50 billion. At the same time, growth has been focused on a few leading
cities. Currently, of the total direct employment of about two million in the IT-BPO
industry, over 90 per cent is captured by the seven leading locations of
Bangalore, Mumbai, NCR, Hyderabad, Pune, Chennai and Kolkata. Apart from
employment, these cities have realised significant benefits in terms of improved
branding and visibility, consumption led economic growth, improvements in social
infrastructure, etc.
Several other locations in the country are looking to realise the gains that have
led to the transformation of cities like Bangalore, Hyderabad, Gurgaon and
Noida, by attracting IT-BPO investments. At the same time, rapid growth has led
to current IT-BPO hubs facing rising real estate costs, increased attrition and

145
saturated infrastructure, forcing companies to look beyond these ‘Leader’
locations.
From a social perspective too, it is important to strive for a more balanced growth
of IT-BPO services. This will lead to sharing of benefits across the country, lower
migration across cities, while, reducing the burden on infrastructure of the current
hubs. Industry too will benefit through access to a larger talent pool that will be
available with increased awareness and proximity of employment opportunities in
the sector.
The opportunity for Indian IT industry over the next decade is huge. The
employment in the sector grew at over 25 per cent per annum over the last
decade. Over the next decade, even a conservative 15 per cent growth rate of
employment in IT-BPO industry will lead direct employment in the sector to about
eight million by 2018, an increase of about six million. In addition, if a direct to
indirect employment ratio of 1:3 is assumed, this translates to incremental
indirect employment of 18 million.
It is believed, over the next decade, share of the sectoral employment in the top
seven locations will decline to around 60-75 per cent with total direct employment
in these locations will grow to about five to six million.

146
Absorbing this growth will pose a significant challenge to the physical and social
infrastructure in various locations across India. At the same time newer locations
have an opportunity to capture a share of about two to three million direct IT-BPO
jobs that will be added in non-leading locations – this is more than the total
current employment in the sector.
It is critical for various locations to pursue the right approach so that they best
position themselves to exploit this opportunity. It is also important for the industry
to be aware of the advantages and challenges offered by various locations.
Accordingly, NASSCOM and A.T. Kearney have taken up a joint effort to help
India reach next level of IT and ITeS services as given below;
§ Assess the potential and attractiveness of 50 locations across the country
for IT-BPO sector; and
§ Develop a roadmap for sustainable and balanced development of the
sector across these locations.
§ Over the last decade, much of the growth of IT-BPO sector has been
focused on a set of seven to ten locations, owing to various factors like
infrastructure, access to a large talent pool, developed policies, etc.
However, with maturing of the industry, it is important for IT-BPO growth to
expand across more locations. A more balanced development across the
country will evenly redistribute and even reduce migration of population to

147
the top few locations and hence, spur development of a much larger
subset of cities. With continued growth in IT-BPO sector, the opportunity
for many locations to transform themselves over the next decade is huge.
While, Leader locations need to align the growth to available
infrastructure, other locations need to enhance their attractiveness.
Locations that are able to move quickly to address the issues and set in
place the required enablers will be more successful in realising the
potential. Decongestion of growth at a macro level and enhancing the
attractiveness at a location level will require each IT-BPO industry
stakeholder to play a proactive role in creating the ecosystem for the
sector:
§ Develop the right vision for IT-BPO sector development at a location –
take a holistic view of IT, international and domestic BPO, each of which
offers a large opportunity
§ Aggressive focus on enhancing the quantity of talent pool available at a
location and address issues related to talent suitability, e.g., curriculum,
finishing schools, faculty capabilities
§ Enhance awareness of international and domestic BPO careers amongst
the stakeholders – government, students, faculty and society
§ Improve and develop physical infrastructure and urban environment –
critical not just for IT-BPO companies to establish presence, but also to
attract the workforce to move to and live in a city

148
§ Visible and sustained government commitment and responsiveness to
drive IT-BPO growth
§ Long-term focus on improving the perception and overall business
environment of the location to drive broad-based growth

149
CHAPTER 6
Recommendations and Suggestions
It will be ideal to look into the world of offshore outsourcing from two dimensions
i.e. ‘What are Life Sciences companies looking for?’ and ‘What are Service
Providers offering?’ It has been observed from the research study that ‘size’ and
the ‘age’ of the company play a vital role in decision making on whether a
company could consider outsourcing. To understand the granular details, Life
Sciences companies were classified into three categories depending on the size
as Small, Medium and Large companies.
Small Sized Company - An enterprise with an investment in plant and machinery
is more than Rs. 25 Lakh but does not exceed Rs. 10 crore.
Medium Sized Company - An enterprise with an investment in plant and
machinery is more than Rs. 10 crore but does not exceed Rs. 50 crore.
Large Sized Company – An enterprise with an investment in plant and machinery
is more than Rs. 50 crore.
Small Sized Companies
These companies have very limited budgets and operate within stringent
timelines. These companies usually run on instincts and single business owner
decisions like the CEO or the CMD of the company. Staffs who can handle and

150
manage multiple tasks at the same time are the preferred candidates and such
people are absorbed quickly into the company. The focus is always on delivery
and meeting the timelines rather than operational excellence in these companies.
Continuing with the trend, these companies will look up to the Service Providers,
for quick turn around applications and/or support in implementation at the lowest
rate possible. Mostly, these projects are performed by the Service Providers in
clients locations i.e. Onsite.
Given the slim budgets and stringent timelines with small sized companies, IT
Service Providers should consider the ‘Cost Effective and Time Saving’ elements
to strike a win-win situation.
Wherever possible, it is advisable to show the dollar value to clients on how that
will help the client’s organization in short, medium and long term. Also, risks
should be highlighted to the organization and the possible issues to consider for
remedy check or fixed on a concurrent basis. Further to the dollar value, it will be
ideal to propose rates for project work which are highly competitive. Competitive
rate per consultant, minimizing the travel plans by roping in local talent nearest to
clients’ offices, and other austerity methods could be adopted to arrive at the
lowest quote possible.

151
Small sized companies will find it much easier to consider a proposal that has a
fixed price. So instead of opting for a Time and Material (T&M) pricing model, it is
advisable to consider the Fixed Price (FP) model i.e. fixed price for fixed time.
This model helps both the client and service provider to consider right-size
approach and not to over do anything more or compromise on relevant tasks.
Medium Sized Companies
Medium sized companies are the companies who have grown a level up from
their startup days, and looking at the big picture to get into the top league of
companies. These companies have well defined methodologies, tried and tested
models and rely less on what others have been doing in various operational
aspects. Investment budgets up to certain limits is not an issue for these
companies, provided they see a real value add for both short and long term
objectives. These companies have a well planned organization structure with
defined roles and responsibilities for each personnel they onboard. Specialists’
roles will be earmarked and assigned to specialists within the company. The
primary focus of these companies is on timely delivery but more importantly
operational excellence is desired from the projects. The philosophy that blends
well with these type of companies is high quality delivery along with long term
benefits for smoother audits and inspections by providing necessary
documentation and tools. Companies look at options with a mix of offshoring and
outsourcing i.e. to transfer all the support work to Service Provider delivery

152
centers and retain the development and implementation work in their sites and
offices but will be performed by the Service Provider personnel.
Medium sized companies understand the concepts of operational excellence and
attached benefits it will bring to the project and the company in the long run. So it
is imperative for the Service Provider to approach the clients accordingly.
In addition to Cost Effectiveness and Time Saving, the following elements should
be considered while approaching medium sized companies;
ü Reliable / Quality
ü Matured Service
ü Expert Support and
ü Audit Readiness
Service Provider should be able to demonstrate proven expertise with high
quality output in the project under discussion. Needless to say, majority of the
Life Sciences projects will have an impact on the Safety, Integrity, Strength,
Purity, and Quality of the final products. So an adequate regulatory compliant
framework to execute the project steps in a compliant manner is needed. This
should be covered from the planning phase to project hand-over with 24 x 7
support. Experts and skilled personnel should be put on the job to work on key
activities within the projects.

153
One important aspect of building an effective relationship with any type of client
is to understand client’s pain-points, complexities and challenges. Service
Providers should consider these road blocks and suggest suitable scalable
solutions in a time bound manner. In order to demonstrate the expertise, it will be
worthy if the Service Provider can opt for a Proof of Concept (PoC). In a PoC, the
Service Provider will leverage the site, equipment and machinery of the client
and processes but will not charge back to the client for the service provided. In
fact the final deliverable will be shared with the client as a value add for process
improvement or considering next generation of technology. On the pricing front, it
is recommended to be flexible and opt for Fixed Price (FP) or Time-and-Material
(T&M) based on the nature of the project / contract and the diversity involved.
In case there is a lack of maturity in the client’s company on a certain segment of
work, Service Providers should be able understand the criticality of the situation
and be able to drive the initiatives to closure. This will not help maintain the
project timelines but also will enhance Service Providers credibility in managing
such complex stages within the projects. However, based on experience in
managing such events, it is highly recommended that Subject Matter Experts
(SMEs) should be made available for complex and challenging areas. These
roles need not be available full time in the project, but fractional or partial
involvement in advisory role should be good for the health of the project.

154
It is a fact that, regulatory inspections are one of the operational tasks that could
make or break the growth of the Life Sciences Company. As the industry is highly
regulated, and fear of failure could lead to loss of reputation to the company has
made the industry a conservative and not so friendly to adoption of new
technology easily. If Service Providers can prove and assure confidence to the
clients in audit support services like – preparing for the audit by sharing lessons
learnt from other such audits and inspections, being part of the actual audit
support team and responding to the audit queries will give immense support to
the client in moving more freely and trying to embrace newer technologies,
thereby thinking innovative. There are several Service Provider firms who are
focusing now purely on Audit Services and cater to Life Sciences companies in
this channel only.
Large Sized Companies
It is observed from the study, most of the large sized companies are much
matured and are willing to experiment with new models of project execution.
These companies are forced to look at the smarter initiatives due to growing
manufacturing costs, first to market competition of products and effective
managing overall Return on Investments (ROI). The expectation of these
companies will be to have Service Providers more as partners who will work with
them in developing smarter technologies rather than providing mere support and
execution. These companies have dedicated R&D budgets and budgets

155
sanctioned for considering thought leadership and organization growth initiatives.
Some of these companies are trend setters rather than trend followers in specific
areas. They look for offerings and niche solutions from the IT as enablers.
Experts from these companies participate in industry conferences and events to
brain storm on cutting edge technologies and suggest best of the breed practices
for better healthcare medicines and products.
Service Providers should be able to demonstrate the entire spectrum of
capabilities and maturity while offering services to these companies. The
spectrum includes;
ü Being a Partner than a Supplier
ü Reliable / Quality
ü Matured Service
ü Cost Effectiveness
ü Time Saving
ü Expert Support and
ü Audit Readiness
Service Provider companies should focus on all the recommendations as
provided in the Medium sized companies section. For being a partner rather than
a mere supplier, the Service Provider should proactively lead and support client’s
initiatives as and when need arises. Also, it will be wiser to attract maximum work

156
in the engagement and leave only the core approvals and business review
segments to client leadership teams. Along with regular delivery, the Service
Provider should frequently share the process improvements and key
performance indicators (KPIs). Solutions that will help in improving the Go-to-
Market strategies and lean, six sigma initiatives will help the clients immensely.
For long term contracts, Give-back policy can be adopted. Give-back policy
implies - for every dollar value that is proved as a saving to the client company, a
particular share will be transferred onto the Service Provider. This will help the
Service Provider to demonstrate leaner concepts in a time bound manner and
also help the client with substantial savings that are easily quantifiable.
Some other recommendations from the research study are provided below;
1. Life Sciences (LS) companies need to consider the globalization path and
effectively adopt the IT integration path.
2. LS companies can start off with outsourcing some of their non-core, non-
critical operations, and gradually consider other core and critical
operations for outsourcing. This will allow them to develop and get
familiarized with the process of outsourcing and understand risks better.
3. It is found from the research, that LS companies which have strong
regulatory departments are front-runners in outsourcing. So companies

157
can focus on improving their expertise levels in regulatory departments
and consider outsourcing for a strategic advantage.
4. Information Technology (IT) companies need to understand the complexity
and regulatory governance of the LS industry and accordingly provide
business specific solutions.
5. For new initiatives, IT companies could consider prototype or Proof-of-
Concepts (POC) before actually working on the large business operations.
This will allow both client and service provider to understand the
challenges / risks and accordingly prepare corrective actions and
remediation plans for the big play.
6. IT companies could train their staff and hire industry experts who can work
with their LS clients and provide business specific solutions which are
regulatory compliant and consistently meets quality attributes.
7. Employees Re-badge i.e. transferring some of the staff members from
clients payroll to service providers payroll and thereby suggesting a cost-
effective model is another option that companies can consider.
In addition to the above points and based on wide industry experience,
worksheets were tabulated using Matrix Analysis as provided in following pages.
Each of these cubes provides a detailed plan and outlook for futuristic approach
for both LS and IT companies.

158
MATRIX ANALYSIS – WORKSHEET 1
Variables
Impact of Compliance, Best Practices Management on IT Outsourcing Strategy
What are Life Sciences Companies looking for?
Elements
Reliable / Quality Cost Effective Matured Service Partner than a Supplier
Expert Support Audit Readiness Save Time
Standard AMS/AD Work
Proven expertise and high quality
output
Adoption of "Give-Back" policy
To understand client's
complexity / challenges
Proactive thoughts and delivery
Leading and supporting as need
be
Extend beyond pure delivery
Solutions to improve Go-To-Market timelines
Niche Solutions
Regulatory Compliant
Show $ Value Proven expertise Majority work executed by SPs
SME guidance Team involvement from SPs
Fixed price for fixed time
Talent Pool (Internal and/or External)
Individuals expertise
Competitive rate per consultant Reasonable cost
Process improvements and
KPIs
Availability of SMEs
Step into client's shoes during audits
Lean / Six sigma initiatives
Compliance as Add-On Value
24 x 7 compliant Shared cost of compliance
Do a Proof of Concept if need
arises X Business specific
SME suggestions X Right-sized approach
Wh
at a
re S
ervi
ces
Pro
vid
ers
off
erin
g?
FP / T&M Models
X Choose appropriate model
Flexible approach X
Inject fractional SME roles as need
be
Work on FP for audit preparations and actual audit
Timely completion
Source – Self Exploratory through Industry Experience
Table 7

159
MATRIX ANALYSIS – WORKSHEET 2
Variables
Compliance, Best Practices Adopted and Bottlenecks in IT Outsourcing Business Management
Life Sciences Companies - IT Compliance Handling
Elements
Highly Conservative
Fear of Failure Ready to Go-
Away with non-GxP
High Internal Costs Can't Give-Away Complete Job
Quality Time Factor
Standard AMS/AD Work
Talk about FDA encouragement
Demonstrate experience X Show $ value when
outsourced
End-to-end portfolio
management
Periodic reviews and monitoring
Timely completion
Niche Solutions
Proven expertise Risk-based approach
Pilot studies for GxP
Reusable assets Frequent status calls
Stringent Controls FP model
Talent Pool (Internal and/or External)
Effective training Do not understand client's business
Phase-wise approach to
handling GxP
Competitive rate card
Systematic skills upgrade
Adequately defined quality parameters
and metrics
Effective ramp-up/down
Compliance as Add-On Value
Proven methods / processes
Domain depth / capability X Shared compliance
cost
Phase wise approach
depending on SP maturity
Ramp-up during audits X
IT C
om
plia
nce
Ou
tso
urc
ing
/ O
ffsh
ori
ng
Knowledge / Resource Retention
Duration commitment for
key roles
Adequately trained staff
Experience based role assignment
Share resources to be part of Client's
company and perform client roles
X On/Offboard controls
Staffing / Resource
mobilization
Source – Self Exploratory through Industry Experience
Table 8

160
BIBLIOGRAPHY
Journal Articles 1. Alan S. Louie, (May 2010). Accelrys Biological Registration: Mastering
Biological R & D at its Roots. Retrieved October 28, 2010, from
https://cas.idc.com/login?site=hi&service=http%3A%2F%2Fwww.idc-
hi.com%2Fj_spring_cas_security_check
2. Alan S. Louie, (June 2010). Best Practices: Actionable Analytics Expands
Beyond Formal BI in the Life Science Industry. Retrieved October 28, 2010,
from https://cas.idc.com/login?site=hi&service=http%3A%2F%2Fwww.idc-
hi.com%2Fj_spring_cas_security_check
3. Alan S. Louie, (July 2010). Notable News in the Life Science: 2Q10.
Retrieved October 28, 2010, from
https://cas.idc.com/login?site=hi&service=http%3A%2F%2Fwww.idc-
hi.com%2Fj_spring_cas_security_check
4. Ali Zaidi, (July 2010). COMPETITIVE ANALYSIS Worldwide and U.S. IT
Consulting 2009 Vendor Shares: IDC’s Top 10 Vendors for 2009. Retrieved
October 28, 2010, from
https://cas.idc.com/login?site=hi&service=http%3A%2F%2Fwww.idc-
hi.com%2Fj_spring_cas_security_check
5. Andrea Spiegelhoff, (July 2009). Are you ready for the IT service
management & governance challenges ahead? Retrieved September 26,
2010 from http://www.isg-one.com/web/research-insights/.

161
6. Andrew H.Bartels, (December 4, 2009). Smart Computing Drives The New
Era Of IT Growth. Retrieved October 21, 2010 from
http://www.forrester.com/home
7. Benjamin Friedman, (June 2011). Cognizant’s Manufacturing Strategy.
Retrieved August 10, 2011 from
https://cas.idc.com/login?site=hi&service=http%3A%2F%2Fwww.idc-
hi.com%2Fj_spring_cas_security_check
8. Bernie Monegain, (April 25, 2005). Accenture Boosts Healthcare Practice
with Capgemini Acquisition. Retrieved October 21, 2010 from
http://www.healthcareitnews.com/news/accenture-boosts-healthcare-
practice-capgemini-acquisition
9. Bill Martorelli, (July 11, 2008). Identifying Opportunities For Managed
Applications Outsourcing Engagements. Retrieved October 21, 2010 from
http://www.forrester.com/home.
10. Bill Martorelli, (September 5, 2008). Resilient Applications Outsourcing
Demand Will Constrain Buyer’s Supplier Options. Retrieved October 21,
2010 http://www.forrester.com/home.
11. Bill Martorelli, (August 17, 2009). Creating Improvement Incentives In
Application Outsourcing Contracts. Retrieved October 21, 2010 from
Http://www.forrester.com/home.
12. Brad Bortner, (July 1 2009). A Simple B2B Segmentation To Increase
Revenue. Retrieved October 21, 2010 from http://www.forrester.com/home

162
13. C. K. Prahalad and Gary Hamel, (January 1990). Product 6528, The Core
Competence of Corporation. Retrieved on October, 20, 2010 from
http://www1.ximb.ac.in/users/fac/Amar/amarnayak.nsf/23e5e39594c064ee8
52564ae004fa010/456e5a8383adcf07652576a0004d9ba5/$FILE/CoreComp
etence.pdf
14. Carey Schwaber, (February 28, 2006). Performance-Driven Software
Development. Retrieved October 21, 2010 from
http://www.forrester.com/home.
15. Carlton A.Doty, (June 24, 2009). Social Tools Help Pharma Marketers Build
Customer Intelligence. Retrieved October 21, 2010 from
http://www.forrester.com/home.
16. Carol Ginsburg, (August 2008). Investigating Outsourcing and Offshoring
Research. Retrieved October 19, 2010 from http://www.igi-
global.com/article/information-resources-management-journal-irmj/1332.
17. Chenxi Wang, (October 24, 2008). Handling IP Protection with Chinese
Outsourcing Vendors. Retrieved October 21, 2010 from
http://www.forrester.com/home.
18. Chris Andrews, (June 22, 2009 updated: July 16, 2009). SWOT: The
Evolution Of IT Service Providers To Business Technology Competitors.
Retrieved October 21, 2010 from http://www.forrester.com/home.
19. Christine Ferrusi Ross, October 19, 2007; “IT Services Outsourcing
Satisfaction, 2007”, Http://www.forrester.com/home.

163
20. Christopher Andrews, (March 17, 2010 updated: May 10, 2010). SWOT: The
Evolution Of Indian IT Service Providers Into Business Technology
Competitors. Retrieved October 20, 2010 from
http://www.forrester.com/home.
21. Christopher Mines, (April 24, 2009). Market Overview: Green IT Services.
Retrieved October 21, 2010 from http://www.forrester.com/home.
22. Christopher Mines, (July 16, 2009). Market Overview: The Recession Dents
Green IT’s Global Momentum. Retrieved October 21, 2010 from
http://www.forrester.com/home.
23. Clayton M. Christensen, (June 1997). The Innovators Dilemma: When New
Technologies Cause Great Firms to Fail. Retrieved October 19, 2010 from
http://www.hbs.edu/faculty/Pages/search.aspx?cnt=15&ct=Cases&sort=Des
cending&df=1
24. Daiel Krauss and Thomas Mendel, (December 19, 2008). Innovating
Strategic Management Paradigms and Models to Thrive Amid Global
Change. Retrieved October 21, 2010 from http://www.forrester.com/home.
25. Daniel Krauss, (May 29, 2009). Innovating Corporate Strategy Services.
Retrieved October 21, 2010 from http://www.forrester.com/home.
26. Daniel Krauss, (August 7, 2009). Market Momentum: Corporate Strategy
Services Market, H1 2009. Retrieved October 21, 2010 from
http://www.forrester.com/home.
27. Daniel Krauss, (October 6, 2009). Trends In Innovation Consulting.
Retrieved October 21, 2010 from http://www.forrester.com/home.

164
28. Daniel Krauss and Pascal Matzke, (October 6, 2009). Tata Consultancy
Services: Using The Downturn To Reposition IT M&A Services. Retrieved
October 21, 2010 from http://www.forrester.com/home.
29. Devendra Pratap Singh, (24 May 2010). Identifying Mega Deals Prospects
in Pharma Vertical in India. Retrieved October 19, 2010 from https://www-
304.ibm.com/partnerworld/wps/servlet/ContentHandler/pw_ben_ben_market
_insights/lc=en_ALL_ZZ
30. Diego Lo Giudice and Stephanie Moore, (February 1, 2008). Assessing
Which Applications To Offshore. Retrieved October 21, 2010 from
http://www.forrester.com/home.
31. Dimitrios F.Kallivroussis, (March 18, 2010). Capitalizing on Shifts in the
Pharmaceutical Industry. Retrieved October 19, 2010 from https://www-
304.ibm.com/partnerworld/wps/servlet/ContentHandler/pw_ben_ben_market
_insights/lc=en_ALL_ZZ
32. Dr. Michael Quirmbach, (September 16, 2009); “Accelerating Early Drug
Development- Reality or Wishful Thinking?” retrieved October 20, 2010 from
http://www.solvias.com/english/news-
events/downloads/publications/publications.html
33. Dr. Vilas H. Dahanukar, (August 21, 2009). Life Sciences Outsourcing to
India. Retrieved October 21, 2010 from
http://www.powershow.com/view/52603-
YWQzZ/Pharmaceutical_Outsourcing_to_India_powerpoint_ppt_presentation

165
34. Dr.Vilas H Dahanukar, (August 21, 2009). Pharmaceutical Outsourcing to
India. Retrieved October 21, 2010 from
http://www.powershow.com/view/52603-
YWQzZ/Pharmaceutical_Outsourcing_to_India_powerpoint_ppt_presentation
35. Elizabeth W. Boehm, (December 27, 2001). Pharma Must Bridge The Sales
And Marketing Chasm. Retrieved October 19, 2010 from
http://www.forrester.com/home.
36. Elizabeth W. Boehm, (October 19, 2004). Best Practices eDetailing Breaks
Pharma’s Marketing Boundaries. Retrieved October 19, 2010 from
http://www.forrester.com/home.
37. Ellen Daley, (August 7, 2009). Enterprise Buying Influences In Emerging
Markets, 2009. Retrieved October 19, 2010 from
http://www.forrester.com/home.
38. Ellen Daley, (August 7, 2009). Virtualization Trends In Emerging Markets.
Retrieved October 19, 2010 from http://www.forrester.com/home.
39. Emilia Narni, (October 23, 2009). Outsourcing share under threat”,
Retrieved October 10, 2010 from http://www.proquest.co.uk/en-UK/.
Retrieved October 21, 2010 from http://www.accessmylibrary.com/article-
1G1-210423728/outsourcing-share-under-threat.html
40. Eric Newmark, (July 2010). Vendor Assessment: Life Science Buyers Guide
to Manufacturing and Supply Chain IT Outsourcing. Retrieved August 10,
2011 from

166
https://cas.idc.com/login?site=hi&service=http%3A%2F%2Fwww.idc-
hi.com%2Fj_spring_cas_security_check
41. George Lawrie, (December 28, 2009). Industry Essential: Consumer
Packaged Goods Industry. Retrieved October 19, 2010 from
http://www.forrester.com/home.
42. Greg Blount, (2008). Proceed With Caution When Considering Large-Scale
ADM Outsourcing in China. Retrieved October 18, 2010 from http://www.isg-
one.com/web/research-insights/.
43. Henry Peyret, (April 28, 2009). Pharmaceutical Industry Trends Drive EA.
Retrieved October 19, 2010 from http://www.forrester.com/home.
44. Henry Peyret, (April 6, 2010). Sample Business Capability Map:
Pharmaceutical Firms. Retrieved October 19, 2010 from
http://www.forrester.com/home.
45. Jacob Cherian, NASSCOM, (October 29, 2009). India’s Outsourcing
Potential to Grow Fivefold by 2020. retrieved October 18, 2010 from
http://outsourceportfolio.com/research-articles/
46. Jay Heiser, (28 July 2010). Hype Cycle for Governance, Risk and
Compliance Technologies, 2010. Retrieved October 19, 2010 from
http://www.gartner.com/technology/core/products/research/topics/outsourcin
g.jsp.
47. Jean-Pierre Garbani, (March 9, 2009). Future Trends In The Enterprise
Software Market. Retrieved October 19, 2010 from
http://www.forrester.com/home.

167
48. Jennifer Belissent, (July 17, 2009). How The Economic Crisis Is Affecting
Global IT Spend. Retrieved October 19, 2010 from
http://www.forrester.com/home.
49. Jennifer Belissent, (November 18, 2009). The State Of Global Enterprise IT
Budgets: 2009 To 2010. Retrieved October 19, 2010 from
http://www.forrester.com/home.
50. Jennifer Belissent, (November 30, 2009). Global Firms’ Decision-Makers For
Emerging Technologies,in 2009. Retrieved October 19, 2010 from
http://www.forrester.com/home.
51. Jennifer Belissent, (November 30, 2009). Global Firms’ IT Budgets And
Spending, 2009. Retrieved October 19, 2010 from
http://www.forrester.com/home.
52. Jennifer Belissent, (February 18, 2010). Do B2B Tech Marketers Localize
As They Globalize? Retrieved October 19, 2010 from
http://www.forrester.com/home.
53. Jim Miller, (August 2008). Clinical Outsourcing Steams Ahead. Retrieved
October 10, 2010 from http://www.proquest.co.uk/en-UK/
54. Jim Miller, (January 2010). The year ahead. Retrieved October 10, 2010
from http://www.proquest.co.uk/en-UK/
55. Joe Flower, (Nov/Dec 2004). The Healthcare Cost Crisis: What Must Be
Done. Retrieved October 10, 2010 from http://www.proquest.co.uk/en-UK/

168
56. John C. McCarthy, (January 29, 2010). Platform BPO: Process Outsourcers
Take A New Approach To Traditional BPO. Retrieved October 19, 2010
from http://www.forrester.com/home.
57. Julie Giera and Andrew Parker, (January 12, 2009). Adaptive Sourcing:
Outsourcing’s New Paradigm. Retrieved October 19, 2010 from
http://www.forrester.com/home.
58. Karen E Thuermer (April/May 2007). Pharmaceuticals: Outsourcing –
Outward bound. Retrieved October 10, 2010 from
http://www.proquest.co.uk/en-UK/
59. Karin Goh, Joyce, Shandy and Xiaolian, (Jan 2010). EMEA IT Outsourcing
Deals. Retrieved October 18, 2010 from
http://www.morganlewis.com/index.cfm/nodeID/7d99071d-20d4-4388-910b-
8e93e45f732e/practiceAreaID/6cc022c1-f131-41d2-a0fa-
f7cc37463a7f/fuseaction/practiceArea.showPublications
60. Kathleen Goolsby, (July 7, 2010). Trends in Outsourced Pharmaceutical
Services-The Shift to Functional Service Providers. Outsourcing Buzz.
61. Kudrat Bhatia and McClatchy, (Nov 2, 2007). India geared up to tap $31
billion drug outsourcing industry. Retrieved October 18, 2010 from Tribune
Business News. Washington: Nov 2, 2007.
62. Laura Converso, (May 2010). COMPETITIVE ANALYSIS Top 10 Service
Providers in Western Europe, 2009. Retrieved October 10, 2010 from
https://cas.idc.com/login?site=hi&service=http%3A%2F%2Fwww.idc-
hi.com%2Fj_spring_cas_security_check

169
63. Laura Ramos, (September 21, 2005). Pharma Won’t Meet ePedigree
Deadlines. Retrieved October 15, 2010 from http://www.forrester.com/home.
64. Laura Ramos, (March 8, 2006). Pharma Takes Custom App Development
Offshore. Retrieved October 15, 2010 from http://www.forrester.com/home.
65. Laura Ramos, (April 13, 2006). Pharma CIOs Are Missing At The Executive
Table. Retrieved October 15, 2010 from http://www.forrester.com/home.
66. Lisa Knight, (March 5, 2010). The New Value Integrator. Retrieved October
19, 2010 from https://www-
304.ibm.com/partnerworld/wps/servlet/ContentHandler/pw_ben_ben_market
_insights/lc=en_ALL_ZZ
67. Liz Herbert, (November 10, 2009). Looking Beyond Global Providers For
SAP Services. Retrieved October 18, 2010 from
http://www.forrester.com/home.
68. Lynn Kesterson-Townes, (July 2010). Cloud Market Factbook. Retrieved
October 19, 2010 from https://www-
304.ibm.com/partnerworld/wps/servlet/ContentHandler/pw_ben_ben_market
_insights/lc=en_ALL_ZZ
69. M Amiti & S J Wei, (October 2004). Fear of Services Outsourcing. Retrieved
October 18, 2010 from http://www.nber.org/papers/w10808
70. Marc Cecere, (July 26, 2004). Best Practices Functions To Retain When
Outsourcing. Retrieved October 19, 2010 from
http://www.forrester.com/home.

170
71. Marcel Boyer, Université de Montréal (January1, 2007). The Design of an
Efficient Offshoring Strategy: Some Reflections and Links to SNC-Lavalin.
Retrieved October 20, 2010 from
http://papers.ssrn.com/sol3/papers.cfm?abstract_id=1095428
72. Mary Beth Kemp, (June 11, 2010). Define Your Marketing innovation
Strategy. Retrieved October 19, 2010 from http://www.forrester.com/home.
73. Michael Rasmussen, (August 7, 2006). Overcoming Risk And Compliance
Myopia. Retrieved October 19, 2010 from http://www.forrester.com/home.
74. Michele Pelino, (March 28, 2008). IBM Is Poised To Attack The NGOSS
Market. Retrieved October 19, 2010 from http://www.forrester.com/home.
75. Michelle Hoffman, (2008). The State of the Market. Retrieved October 10,
2010 from http://www.proquest.co.uk/en-UK/
76. Mike Slavin, (June 2007). Equipping and Empowering Corporate Strategic
Sourcing organizations for the Complexities of Outsourcing and Offshoring.
Retrieved October 18, 2010 from http://www.isg-one.com/web/research-
insights/
77. Navi Radjou, (May 18, 2007). How IT Consultants Can Finally Profit From
Clients’ Business Innovation Demands. Retrieved October 18, 2010 from
http://www.forrester.com/home.
78. Navi Radjou, (March 3, 2008). Innovation Management Services Take Off.
Retrieved October 18, 2010 from http://www.forrester.com/home.
79. Nick Taylor, (Mar 18, 2010). Outsourcing to Asia is a Strategic Imperative.
Quiniiles Inc. Retrieved October 19, 2010 from http://www.outsourcing-

171
pharma.com/Preclinical-Research/Outsourcing-to-Asia-is-a-strategic-
imperative-Quintiles
80. Nick Taylor, (11 Aug 2009). India will take Large share of outsourcing
market; report. Retrieved October 18, 2010 from https://www.outsourcing-
pharma.com.
81. Nick Taylor, (18 Sep 2009). Completely Outsourcing Drug Discovery
“Probably Valid”; report. Retrieved October 18, 2010 from
https://www.outsourcing-pharma.com.
82. Oxford Analytica Daily Brief Service, (April 07, 2008). INDIA: Outsourcing
moves up the value chain. Retrieved October 10, 2010 from
http://www.proquest.co.uk/en-UK/
83. Pankaj Mishra, (August 12, 2010). Cognizant in sniffing distance of TCS,
Infosys and Wipro. Retrieved October 19, 2010 from
http://articles.economictimes.indiatimes.com/2010-08-
12/news/27570475_1_cognizant-s-ceo-infosys-and-wipro-third-largest-
software-exporter
84. Pascal Matzke, (March 30, 2009). EMEA IT Outsourcing Deals: 2008
Review. Retrieved October 17, 2010 from http://www.forrester.com/home.
85. Pascal Matzke, (June 7, 2010). EMEA IT Outsourcing Deals: 2009 Review.
Retrieved October 17, 2010 from http://www.forrester.com/home.
86. Pascal Matzke and Daniel Krauss, (August 12, 2008). TCS Pushes On
NGOSS To Drive Telecom-Sector Growth. Retrieved October 17, 2010 from
http://www.forrester.com/home.

172
87. Paul Duckham, (2009). TARP Participation and Rising Unemployment:
Implications for Outsourcing and Offshoring in the Global Economy.
Retrieved October 18, 2010 from http://www.isg-one.com/web/research-
insights/
88. Paul Roehrig, (June 9, 2009). Market Overview Of Cloud Service Strategies
From Global IT Providers. Retrieved October 18, 2010 from
http://www.forrester.com/home.
89. Paul Roehrig, (June 29, 2009). Major Hurdles Remain In Enterprise Cloud
Services. Retrieved October 18, 2010 from http://www.forrester.com/home.
90. Peter O’Neill, (December 16, 2008). Medium-Size And Small ISVs Can
Expand Via Partnerships. Retrieved October 18, 2010 from
http://www.forrester.com/home.
91. Peter O’Neill and Stefan Ried, (August 5, 2008 updated August 6, 2008).
Internationalization: The Vendor Escape Hatch From The Economic
Downturn. Retrieved October 18, 2010 from http://www.forrester.com/home.
92. Peter Rees, (July/August 2003). Big Pharma learns how to love information
technology. Retrieved October 20, 2010 from http://www.scientific-
computing.com/features/feature.php?feature_id=111
93. Phil Murphy, (October 26, 2009). Global Workforce Planning Through 2016:
How Population Shifts Will Affect The Supply Of IT Skills. Retrieved October
18, 2010 from http://www.forrester.com/home.

173
94. Prashant Halari, Patni Technologies, (September 2005). Transformational
Offshoring: Why and How? Retrieved October 20, 2010 from
http://www.igate.com/jp/it_outsourcing/pdf/index/transformational.pdf
95. Ray Wang, (August 13, 2007). Competition Intensifies For The SMB ERP
Customer. Retrieved October 18, 2010 from http://www.forrester.com/home.
96. Ray Wang, (November 27, 2007). Why You Need A Long-Term Apps
Strategy. Retrieved October 18, 2010 from http://www.forrester.com/home.
97. Raza Imam, (2008), Offshore Outsourcing: Five Lessons your Peers
Learned the Hard Way. Retrieved October 19, 2010 from
http://ezinearticles.com/?Offshore-Outsourcing---5-Lessons-Your-Peers-
Learned-the-Hard-Way&id=775742
98. Rodney Steel, (Jan/Feb 2010). Outsourcing on the Up. Retrieved October
10, 2010 from http://www.proquest.co.uk/en-UK/
99. Rona Shuchat, (July 2009). Competitive Analysis. Retrieved September 10,
2011 from
https://cas.idc.com/login?site=hi&service=http%3A%2F%2Fwww.idc-
hi.com%2Fj_spring_cas_security_check
100. Samuel J.Palmisano, (06 Oct 2009). A Prescription for smarter
healthcare. Retrieved October 19, 2010 from https://www-
304.ibm.com/partnerworld/wps/servlet/ContentHandler/pw_ben_ben_market
_insights/lc=en_ALL_ZZ.
101. Saurabh Pandey, (15 March 2010). India: Pharma Industry – Strategic
Intent. Retrieved October 19, 2010 from https://www-

174
304.ibm.com/partnerworld/wps/servlet/ContentHandler/pw_ben_ben_market
_insights/lc=en_ALL_ZZ
102. Sean Silverthorne, Harvard Business School, (September 24, 2007). The
FDA: What Will the Next 100 Years Bring? Retrieved October 19, 2010 from
http://hbswk.hbs.edu/item/5753.html
103. Staff Reporter, NewStatesman (February 04, 2010). India IT-BPO
exports to reach $50bn. Retrieved October 19, 2010 from
http://www.newstatesman.com/technology/2010/02/bpo-industry-nasscom-
expected
104. Stefan Ried, (July 13, 2009). Platform-As-A-Service Market Sizing.
Retrieved October 19, 2010 from http://www.forrester.com/home.
105. Stefan Ried, (July 30, 2009). Yet Another Cloud. Retrieved October 19,
2010 from http://www.forrester.com/home.
106. Stefan Ried, (January 19, 2010). Case Study: Siemens IT Solutions And
Services Successfully Positions A Community Cloud. Retrieved October 19,
2010 from http://www.forrester.com/home.
107. Stephanie Moore, (April 5, 2005). Offshore SAP Implementation,
Upgrades, And Support: What You Need To Know. Retrieved October 19,
2010 from http://www.forrester.com/home.
108. Stephanie Moore, (October 15, 2008). Offshore Outsourcing: Things To
Consider When Firing Your Provider. Retrieved October 19, 2010 from
http://www.forrester.com/home.

175
109. Stephanie Moore and John C.McCarthy, (September 24, 2007). Topic
Overview: Offshore Services. Retrieved October 19, 2010 from
http://www.forrester.com/home.
110. Sudin Apte, (October 29, 2007). Solution Accelerators Will Disrupt The IT
Services Landscape. Retrieved October 19, 2010 from
http://www.forrester.com/home.
111. Sudin Apte, (August 5, 2008). Surviving The Offshore Vendor
Polarization Puzzle. Retrieved October 19, 2010 from
http://www.forrester.com/home.
112. Sudin Apte, (August 11, 2008). Evaluating Your Service Provider’s
Packaged Intellectual Property. Retrieved October 19, 2010 from
http://www.forrester.com/home.
113. Sudin Apte, (October 30, 2008). Evaluation An Offshore Provider’s
Cultural Compatibility. Retrieved October 19, 2010 from
http://www.forrester.com/home.
114. Sudin Apte, (January 23, 2009). Can Your Offshore Providers Deliver
Business Innovation. Retrieved October 19, 2010 from
http://www.forrester.com/home.
115. Sudin Apte, (November 4, 2009). Top Strategies To Ensure Continued
Value From Offshore Services. Retrieved October 19, 2010 from
http://www.forrester.com/home.

176
116. Sudin Apte, (February 3, 2010). European Satisfaction With IT Services
Firms Indicates The Obstacles Facing Offshore Providers. Retrieved
October 19, 2010 from http://www.forrester.com/home.
117. T.R. Ramanathan, (March 1, 2009). The Role of Organizational Change
Management in Offshore Outsourcing of Information Technology Services.
Retrieved October 22, 2010 from http://www.amazon.com/Organisational-
Management-Outsourcing-Information-Technology/dp/1599427095
118. Ted Dangson, Giuliana Folco, Renato Troya, Gary Koch, Thomas Dyer,
and Pavel Roland, (January 2010). PIVOT TABLE Worldwide Vertical
Markets IT Spending 2008-2013 Forecast: 3Q09. Retrieved September 10,
2011 from
https://cas.idc.com/login?site=hi&service=http%3A%2F%2Fwww.idc-
hi.com%2Fj_spring_cas_security_check.
119. Thomas Mendel and Daniel Kraliss, (December 22, 2008). Leveraging
Forrester’s Research And Models For Strategic Advantage. Retrieved
October 20, 2010 from http://www.forrester.com/home.
120. Tirthankar Sen, (May 01, 2009). ChanSat India 2009 - The Voice of
India’s IT Channel Community. Retrieved October 22, 2010 from
http://www.forrester.com/Tirthankar-
Sen/research?N=10001+52719&range=504005&access=0&sort=3&source=
hub#/ChanSat+India+2009+The+Voice+Of+Indias+IT+Channel+Community
/fulltext/-/E-RES59491

177
121. TJ Keitt, (May 19, 2009). Demand Insights: The Global Collaboration
Markets Flat. Retrieved October 10, 2011 from
http://www.forrester.com/home.
122. Urch, (June 04, 2004). Changing Trends in Pharmaceutical Outsourcing:
The Allure of Emerging Markets. Retrieved October 22, 2010 from
http://www.urchpublishing.com/articles/changing_trends_in_pharmaceutical
_outsourcing_the_allure_of_emerging_markets.html
123. Yvonne Genovese, (August 3, 2010). Hype Cycle for pattern-Based
Strategy, 2010. Retrieved October 19, 2010 from
http://www.gartner.com/technology/core/products/research/topics/outsourcin
g.jsp
Books
124. Joe Flower. (Nov/dec 2004). In Cost Management. The Healthcare Costs
Crisis: What Must Be Done (Vol. 18, Iss. 6, p.23). Boston, US
125. Lisa Jarvis. (2005). In Chemical Market Reporter. Big Pharma Mulls
Deeper Outsourcing with China and India Front and Center (Vol 267, Iss.12,
p. 8). New York, US
Newspaper Artciles
126. Pete Engardio, Arlene Weintraub, Nandini Lakshman. (2008, September
15). Outsourcing the Drug Industry. Business Week (New York), Iss. 4099,
p. 48-52. Retrieved October 19, 2010 from Business Week database.

178
127. Patricia Van Arnum, (2010, January 14). Quality by Design: Adding
Another Dimension to Outsourcing. Life Sciences Technology (Cleveland),
Vol. 34, Iss. 1, p. 40, 42, 44 (3pp.). Retrieved October 20, 2010 from Life
Sciences Technology database.
Websites
128. Comparison of Pharma Outsourcing between China and India. Retrieved
October 18, 2010 from http://www.jzmedi.com/industry-reports.html
129. Guide to Pharmaceutical Outsourcing in China. Retrieved October 18,
2010 from http://www.jzmedi.com/industry-reports.html
130. China’s Attraction and Strategies to Work with It. Retrieved October 18,
2010 from http://www.jzmedi.com/industry-reports.html
131. China Pharma Outsourcing Market By 2015. Retrieved October 18, 2010
from http://www.jzmedi.com/industry-reports.html
132. Comparison of Pharma Outsourcing between China and India. Retrieved
October 18, 2010 from http://www.jzmedi.com/industry-reports.html.
133. Top 100 Best Pharmaceutical Outsourcing Service Providers in China
and India. Retrieved October 18, 2010 from http://www.jzmedi.com/industry-
reports.html
Additional References
134. Anonymous, (2009). Clinical Development Strategy and Tech. Retrieved
September 10, 2011 from

179
https://cas.idc.com/login?site=hi&service=http%3A%2F%2Fwww.idc-
hi.com%2Fj_spring_cas_security_check
135. Anonymous, (2009). India Information Technology Report. London:
Second Quarter, Retrieved October 10, 2010 from
http://www.proquest.co.uk/en-UK/.
136. Anonymous, (2009). India Information Technology Report. London: Third
Quarter, Retrieved October 10, 2010 from http://www.proquest.co.uk/en-
UK/.
137. Anonymous, (2009). India Information Technology Report. London:
Fourth Quarter, Retrieved October 10, 2010 from
http://www.proquest.co.uk/en-UK/.
138. Anonymous, (2009). Life Science Business Systems Strategy. Retrieved
September 10, 2011 from
https://cas.idc.com/login?site=hi&service=http%3A%2F%2Fwww.idc-
hi.com%2Fj_spring_cas_security_check
139. Anonymous, (January 19, 2007). Quality by Design: Adding Another
Dimension to Outsourcing. Retrieved October 10, 2010 from
http://www.proquest.co.uk/en-UK/
140. Anonymous, (2005). The metamorphosis of manufacturing. Retrieved
October 19, 2010 from https://www-
304.ibm.com/partnerworld/wps/servlet/ContentHandler/pw_ben_ben_market
_insights/lc=en_ALL_ZZ

180
141. Anonymous, (2005). Transforming Industrialization. Retrieved October
19, 2010 from https://www-
304.ibm.com/partnerworld/wps/servlet/ContentHandler/pw_ben_ben_market
_insights/lc=en_ALL_ZZ
142. Anonymous, (2007). US Online Pharmaceutical Executive Survey.
Retrieved October 10, 2011 from http://www.forrester.com/home.
143. Anonymous, NASSCOM ATKEARNEY, (2006). Location Roadmap for
IT-BPO Growth. Retrieved October 22, 2010 from
http://www.nasscom.org/sites/default/files/researchreports/Executive_Summ
ary_5.pdf

181
REFERENCE SECTION

182
Annex I – Objectives of the Study, Problem Statement,
Research Gap, Hypothesis and Survey Questions
Mapping
Objective #
Problem Statement
#
Research Gap #
Hypothesis #
SPSS Table # LS Survey Question #s
IT Survey Question #s
1 1 1 1 34, 46, 54, 59, 60 10, 11, 19, 20,
21 10, 11, 13
2 2 2 2 38, 39, 55, 56, 61 13, 15, 16, 18 18, 21, 23,
3 3 3 3 40, 41, 43, 44, 62 14, 24 7, 8, 12, 15, 16, 17, 19
4 4 4 4 37, 107, 108, 109, 152 22, 23 14, 20, 24, 25
5 -- -- 5 106, 109, 115, 122, 133 12, 17 9, 20, 22,
Table 9

183
Annex II – Offshore Outsourcing Destinations in India
India continues to be the most attractive destination for offshoring of services
such as information technology, business processes and call centers, a global
management-consulting firm has said. It remains the best offshore destination
by a wide margin even if wage inflation and the mergence of lower-cost
countries decreased its overall lead, the annual ranking by consulting firm A T
Kearney has said. The main Offshoring Destinations in India are:
Ahmedabad
According to the profile of the ITES companies operating in the city,
Ahmedabad is strong in Web site services and Web applications, call / contact
centers and back-office operations. In other services, such as database
management /development, data processing / management and network
management/remote maintenance, the city is relatively weak, though it has the
telecom infrastructure to support these services. This shows that the manpower
available in the city is best suited for call / contact centers and back-office
operations. The public transport and the cost of power which is one of the
highest in the country reduces the competitiveness of products and services
coming out of the city Another problem is that despite good educational
infrastructure, many students migrate to Mumbai each year in search of better
prospects. This drain needs to be stanched to retain local talent

184
Bangalore
Though Bangalore has many ITES companies, it seems to be stronger in the
call / contact center, transcription, and back-office operations services. But,
perhaps because of its IT-orientation, the city has also been able to attract a
reasonable number of companies into database management / development,
data processing / management and engineering, design, and GIS services.
Given this, it should still be able to attract other forms of ITES companies.
However some of the issues that need to be looked into are power and telecom
infrastructure that are not keeping pace with the IT expansion. While the
government promises uninterrupted power supply, these seem hollow claims
and many ITES firms have to maintain their own back-up systems, which
cranks up costs. The city's public transport infrastructure too is very weak and
this has resulted in many people buying their own vehicle. There is a lack of a
neutral accent among the local populace which necessitates training for call
center services. Though real estate is not a problem, property costs in
Bangalore are higher than in Chennai.
Chennai
Chennai, despite a relatively sturdy infrastructure, hasn't been able to attract as
many ITES firms as Bangalore. The profile of the companies operating in the
city indicates that the city is strong in call / contact center, content management
/ development & animation, data processing / management / digitisation and
Web site services / Web applications. The city loses out to the likes of Delhi and

185
Bangalore in the 'perception game.' It is perceived to be conservative and
lacking in infrastructure. Accordingly, the study reveals that it would help if the
government found a way to highlight the success stories of companies based in
Chennai. .
Hyderabad
Though the city scores high on infrastructure and policy, it has been able to
attract only certain kinds of ITES companies. The current ITES population in the
city is favourable towards engineering, design, GIS, and data processing /
management / digitisation and seems to lag in the contact center and
transcription businesses. The Andhra Pradesh government is aggressively
marketing Hyderabad as a choice destination for ITES companies. So there
needs to be a greater emphasis on the infrastructure. The city's public transport,
for one, needs improvement. The state's ITES policy is perhaps one of the best
in the country and puts a lot of emphasis on quality manpower. The government
must now deliver on those intentions and support institutes that train manpower
suitable for ITES. Accent is a major problem that needs to be addressed
through training support.
Kochi
Kochi is an upcoming city in Kerala and is aggressively being promoted by the
state government as an IT destination. Though it doesn't have any ITES

186
companies of significance yet, it holds a lot of potential to attract many. But the
city needs to address the following infrastructure issues: Though it has the
lowest power tariff among all the cities surveyed, it still experiences some
power cuts. Like most cities in India, Kochi lacks a decent public transport
infrastructure Compared to the larger cities, Kochi has only a few colleges. As
ITES companies would mainly hire graduates, the state needs to ensure
abundant supply of trained manpower. Kochi too loses out in the perception
game. The government needs to ensure that the city moves up this scale to
start attracting new businesses.
Kolkata
The profile of the ITES companies in Kolkata suggests that it is relatively strong
in data processing / management / digitisation and back-office operations.
However, in other areas, the city has not been able to attract many companies.
The main issue that needs to be tackled to place Kolkata firmly on the ITES
map is perception. Although the state government is aggressively promoting
Kolkata as a destination for ITES firms, it needs to do more. Offering more
incentives - possibly following the Andhra model - and showcasing the success
stories coming out of the city could be the first step toward achieving this. The
state also needs to increase its tele-density, improve the city's public transport
and the quality of the road network. .

187
Mumbai
Next only to the Delhi-Gurgaon-Noida belt as the preferred choice of destination
for ITES firms, Mumbai is strong in call / contact centers, back-office operations,
and data processing / management. However, it seems to be quite weak in
transcription services and network management / maintenance. Mumbai is
plagued by high real estate rates, too. Even a depressed real estate market has
failed to bring down the prices on par with the other metros. Though Mumbai
has adequate trained manpower, the cost is among the highest in the country.
The public transport infrastructure while best in the country is offset by the poor
quality of the roads.
Delhi, Noida and Gurgaon (NCR)
By far the leader in ITES in the country, NCR, unlike Bangalore, has not been
able to attract every type of ITES company. For instance, from the profile of the
companies operating in the region, it seems to be particularly strong in call /
contact center, back-office operations, Web site services / Web applications,
and data processing / management / digitisation, with call /contact centers
leading the way. The physical infrastructure needs to be worked upon
immediately. Delhi's intermittent power supply needs to be redressed as it
necessitates back-up power systems at companies, thus increasing costs. The
inadequate public transport infrastructure also adds to the companies'
operational costs and thus renders it as a cost ineffective destination. Like in

188
many other parts of the country, the lack of a neutral accent may be a problem
for some ITES firms, especially those in the call center business.
Pune
Though Pune has not managed to attract many ITES companies, those that are
there seem to be evenly distributed between the call/contact center, data
processing/ management / digitization, and back-office businesses. But the
other services are conspicuous by their absence. Infrastructure tops the list of
concerns. A reliable and continuous power supply needs to be provided.
Currently, ITES companies need to have their own back-up power systems to
supplement the utility's supply. A rickety public transport system forces firms to
spend on transportation. Despite the government's sops for ITES units on the
FSI norms, real estate rates in Pune are not very low.

189
Annex III – List of Offshore Outsourcing Companies
(as in April 2012)
Company Name Specialization City
Interactive Agency Dubai Internet Technologies,Search Engine Optimization,Software Development,Testing and Development,Web Based Solutions
*ecreeds web solutions Application Architecture and Design mumbai
A G Technologies Pvt Ltd Application Maintenance,Research and Development Mumbai
A3Logics Application Architecture and Design Jaipur
Aalpha Information Systems India Pvt. Ltd. Internet Technologies Hubli
Access Technology India Web Based Solutions New Delhi
ACG Infotech Limited Web Based Solutions New Delhi
Acumen Software Software Development Delhi
Adit Microsys Pvt. Ltd. Web Based Solutions Ahmedabad
AES Technologies (India) Pvt. Ltd. Web Based Solutions Coimbatore
Agilent Technologies (International) Pvt Ltd Consulting New Delhi
AgreeYa Solutions (India) Pvt Ltd Consulting Noida
Aims High Technologies Software Development Thane
AIT India Software Development Ahmedabad
Alakmalak Technologies Web Based Solutions Ahmedabad
AllQuickFix Software Development Chennai
Amdocs Development Centre India Pvt Ltd Consulting Pune
APEX Creation Research and Development Ahmedabad
AppLabs Technologies Pvt Ltd Testing and Development Hyderabad
Artech Infosystems Pvt Ltd Consulting Noida
ASDc Back Office Services,Internet Technologies,Online Application Development Ghaziabad
AshnaTech Web Based Solutions chennai
Asia Webmedia Web Based Solutions Mumbai
Aspire Software Consultancy Software Development Bangalore
Aspire Systems (India) Pvt. Ltd. Research and Development,Software Development Chennai
ATI Web Design India Web Based Solutions New Delhi
Axmor Software Software Development Novosibirsk
Bebo Technologies Pvt Ltd Testing and Development Chandigarh
Beyond Key Systems Pvt. Ltd. Web Based Solutions Indore
Bigbyte Solutions Pvt. Ltd. Software Development New Delhi
Bitscape Software Development Ahmedabad
BrickRed Technologies Pvt Ltd Research and Development Noida
Calibrainz Technologies Pvt. Ltd.
Application Architecture and Design,Internet Technologies,Software Development,Web Based Solutions Bangalore
California Software Labs Accounting and Reconciliation Services Pleasanton

190
Company Name Specialization City
Caresoft Inc. India Consulting Bhopal
CashTech Solutions India Pvt Ltd Research and Development Pune
Centronics Web Systems Web Based Solutions Chandigarh
CES Pvt Ltd Consulting Hyderabad
Chimera Technologies Pv.t Ltd. Software Development Bangalore
Chimera Technologies Pvt. Ltd.
Internet Technologies,Online Application Development,Software Development,Web Based Solutions Bangalore
Chrisranjana Software Development Saidapet,
CISTEMS (Software) Ltd Research and Development Jaipur
Computer Generated Solutions, India Web Based Solutions Hyderabad
Conceptinfoway Web Based Solutions Ahmedabad
Concordsoftech Pvt Ltd Application Re-engineering
Concordsoftech Pvt Ltd Customizations
Congruent Solutions Pvt. Ltd Research and Development Chennai
Continuum Systems Pvt Ltd Testing and Development Gurgaon
ControlCase Consulting,Internet Technologies,Product / Application Support,Research and Development,Software Development,Web Based Solutions Mumbai
Convensys Infotech Pvt Ltd Product / Application Support KOCHI
Covient, Inc. Software Development Andheri East
Curans IT India Software Development Chennai
Cygnet Infotech Pvt Ltd. Accounting and Reconciliation Services Ahmedabad
Daffodil Software Ltd Database Management Tools Gurgaon
Damco Solutions (P) Ltd Consulting Faridabad
Dassnagar Infosystems Web Based Solutions Howrah
Datacons Pvt. Ltd Research and Development Bangalore
Datamatics Limited Application Prototyping,Application Re-engineering Mumbai
DataPrompt International Data Processing / Data Management,Knowledge Management Services,Market Research Chennai
Decatrend Technologies Accounting and Reconciliation Services,Back Office Services,Internet Technologies,Payroll Processing,Search Engine Optimization Chennai
Decos Software Development Pvt Ltd Web Based Solutions PUNE
Descon Ltd Mobile Application Development Kolkata
Development India Web Based Solutions Mumbai
Digital Illusion Ind Pvt Ltd Application Maintenance,Application Prototyping,Application Re-engineering,Customizations Chennai
Digital Mesh Softech India (P)Limited Software Development Cochin
Direction Software Solutions Internet Technologies Mumbai
DreaMarT Interactive Search Engine Optimization,Web Based Solutions Bangalore
Durlabh Computers Pvt. Ltd. Application Architecture and Design New Delhi
e-con Systems Consulting,Product / Application Support,Software Development Chennai
e-Zest Solutions Ltd. Application Maintenance,Banking Solutions,Consulting,Mobile Application Development,Software Development,Testing and Development Pune
e-Zest Solutions Pvt. Ltd. Consulting Pune

191
Company Name Specialization City
ebusinessware India Pvt Ltd Application Architecture and Design Gurgaon
eDimensions Business Support Web Based Solutions
eFORCE India Pvt Ltd Consulting Kolkata
Elegant MicroWeb Consulting Ahmedabad
Elix Software Solutions Pvt. Ltd.,
Application Architecture and Design,Application Maintenance,Application Prototyping,Application Re-engineering,Customizations,Internet Technologies,Online Application Development,Search Engine Optimization,Software Development,Web Based Solutions
Bangalore
Elixir Web Solutions Web Based Solutions New Delhi
En Interactive Technologies Pvt. Ltd. Software Development Borivali (W)
Encodex Technologies Application Architecture and Design,Internet Technologies,Migration and Porting,Software Development,Testing and Development Pune
Encodex Technologies India Software Development Pune
Entente Global Info Solutions Pvt Ltd Mobile Application Development New Delhi
ePeaksoft Software Ltd. Accounting and Reconciliation Services,Application Maintenance,Application Re-engineering,Mobile Application Development,Online Application Development,Software Development
beijing
Epicor Software Development Irvine
Esai Software Private Limited
Application Architecture and Design,Application Maintenance,Consulting,Database Management Tools,Internet Technologies,Migration and Porting,Online Application Development,Research and Development,Software Development,Testing and Development,Web Based Solutions
Alkapuri
eScape Software Development Limerick
eServices Symphony Private Limited Software Development Hyderabad
Etisbew.com Pvt Ltd Back Office Services
Exalt Integral Solutions Pvt. Ltd. Web Based Solutions Trivandrum
Feedlot Solutions Ltd. Software Development
Fidelity Business Services India Private Limited Software Development Gurgaon
Final Quadrant Solutions Ltd Consulting,Help Desk New Delhi
FlexOrbits Web Solutions Pvt Ltd
Application Maintenance,Application Prototyping,Application Re-engineering Chennai
Fomax Information Technologies (P) Ltd. Software Development Bangalore
FORTUNE3 Corporation Software Development Doral
Fusion Informatics Software Development Ahmedabad
G-Net Solutions Coimbatore Private Limited Software Development Coimbatore
Gateway TechnoLabs Software Development Ahmedabad
Gausa India Ltd Consulting New delhi
Global Infovision Pvt Ltd Back Office Services Hyderabad
Globallogic (formely Induslogic) Software Development Noida
Globsyn Technologies Ltd Research and Development Kolkata

192
Company Name Specialization City
Hanu Software Solutions Software Development Gurgaon
Hidden Brains Software Development Ahmedabad
HINODE Technologies (P) Ltd Consulting Delhi
Hudda Consulting Internet Technologies Hyderabad
Human Base India Inc. Consulting,Software Development Bangalore
HyTech Professionals Software Development NOIDA
i-Strat Software Pvt Ltd Search Engine Optimization,Web Based Solutions New Delhi
iBilt Technologies Limited Application Architecture and Design,Application Maintenance,Internet Technologies,Migration and Porting,Software Development,Testing and Development,Web Based Solutions
London
Icreon Software Development Noida
IDS Logic Pvt. Ltd. Internet Technologies,Online Application Development,Search Engine Optimization,Software Development,Web Based Solutions Noida
IIS Technologies Application Architecture and Design,Back Office Services,Mobile Application Development,Search Engine Optimization,Software Development New Delhi
Imajinsoft Solutions Software Development navi mumbai
India Comnet International Pvt Ltd Consulting Chennai
India Designers Web Based Solutions Delhi
India NIC Infotech Ltd. Software Development Ahmedabad
India Software Group - ISG Application Architecture and Design,Application Maintenance,Application Re-engineering,Software Development Chennai
India Web Developers Software Development Bangalore
Indusa Infotech Services Pvt. Ltd.
Application Architecture and Design,Application Maintenance,Application Re-engineering,Consulting Ahmedabad
Inforlinx Solutions Private Limited Consulting,Customizations Hyderabad
Infosys Technologies Ltd. Software Development Bangalore
Infotech Enterprises Ltd Banking Solutions Hyderabad
Infotheek Computers Application Architecture and Design,Application Maintenance,Online Application Development,Software Development,Web Based Solutions New Delhi
Inkorus Software Development Pune
Intel Soft Solutions Software Development Ahmedabad
Intelenet Global Services Ltd Back Office Services,Banking Solutions,Call Center Services,Consulting,Transaction Processing Mumbai
Intellicom Contact Centers Banking Solutions,Call Center Services New Delhi
Intellisoft-Services Software Development Delhi
International Legal and Business Services Group Legal Process Outsourcing Hyderabad
IonIdea Enterprise Solutions Pvt Ltd Consulting,Product / Application Support,Software Development Bangalore
IONSoftnet Application Architecture and Design
IQ international e-services Consulting,Data Processing / Data Management,Legal Process Outsourcing Chennai
ISDCG Software Development New Delhi
Ivant Technologies Software Development Pasig city
IVL India Pvt Ltd Application Maintenance,Consulting,Software Development Trivandrum
Kaavian Systems Pvt Ltd Consulting Chennai
Kale Consultants Limited Back Office Services,Call Center Services,Internet Technologies,ITeS / BPO,Migration and Porting,Proof of Concept Development,Software Thane

193
Company Name Specialization City
Development,Testing and Development,Transaction Processing,Web Based Solutions
Kasshku Information Technologies Pvt Ltd Consulting Bangalore
Konquer Technologies Data Processing / Data Management,ITeS / BPO,Software Development,Transaction Processing,Web Based Solutions
Krish Inc. Web Based Solutions Ahmedabad
Krish India Web Site Design Web Based Solutions Delhi
Lakhani Developers Internet Technologies,Online Application Development,Software Development,Web Based Solutions Kolkata
Larsen & Toubro Infotech Limited Research and Development Mumbai
Lauren Software Pvt. Ltd. Software Development Mumbai
Leeway Hertz Web Based Solutions New Delhi
Leeway Hertz Corporation Web Based Solutions New Delhi
Leo Technosoft Application Architecture and Design,Application Re-engineering,Consulting,Software Development,Web Based Solutions Pune
Leo Technosoft PVT LTD Application Architecture and Design,Internet Technologies,Online Application Development,Software Development,Web Based Solutions Pune
Lexsite.com Limited Legal Process Outsourcing Mumbai
Lion Bridge Software Development MA
Logica Synectics Pvt Ltd (LogicaCMG)
Application Architecture and Design,Call Center Services,ITeS / BPO,Product / Application Support Bangalore
Long Circle Inc Consulting,Customizations,Mobile Application Development,Product / Application Support,Quality Assurance and Testing,Research and Development,Software Development,Testing and Development
Shanghai
MachroTech (India) Pvt. Ltd. Software Development Pune
Macronimous web solutions Application Maintenance,Internet Technologies,Mobile Application Development,Search Engine Optimization,Web Based Solutions Coimbatore
MAG Studios Software Development Delhi
Manjushree Infotech Software Development Kolkata
Maq India Pvt Ltd Consulting,Mobile Application Development,Software Development,Testing and Development Mumbai
MARS & Partners, International Legal Consultants
Legal Process Outsourcing Delhi
Mascon Global Ltd Application Maintenance New Delhi
MDI Datanet India Pvt Ltd Web Based Solutions Trivandrum
Medusind Solutions Transcription Services CA
Megasoft Limited Consulting Chennai
Melonic Software Development BRENTFORD
Melstar Information Technologies Ltd Application Maintenance Mumbai
MetaSys Software Software Development Mumbai
Metexim Technologies Software Development Chennai
Microland Limited Consulting,Data Processing / Data Management,Help Desk,Migration and Porting Bangalore
MindCraft Software Pvt Ltd Consulting,Software Development Mumbai
MindRiver Information Technologies Pvt Ltd Consulting,Software Development Bangalore

194
Company Name Specialization City
Mistral Software Pvt Ltd Software Development,Testing and Development Bangalore
Momentum India Private Limited (Formerly MsourcE) Software Development Noida
MphasiS BPO Services Application Maintenance,ITeS / BPO,Testing and Development Bangalore
Mycos Technologies: Software Outsourcing Services
Software Development Muang
Myspacein Software Development Gurgaon
NAGSOFT Solutions Private Limited Software Development,Web Based Solutions New Delhi
Ness Technologies (India) Ltd Research and Development,Software Development Mumbai
Net Solutions Web Based Solutions Chandigarh
NetCreativeMind Solutions Private Limited
Application Architecture and Design,Application Maintenance,Application Re-engineering,Back Office Services,Software Development,Web Based Solutions New Delhi
NetEdge Application Maintenance,Internet Technologies,Knowledge Management Services,Market Research,Software Development,Web Based Solutions NOIDA
netGuru Ltd. Application Architecture and Design,Application Maintenance,Application Re-engineering,Internet Technologies,Software Development,Web Based Solutions
Kolkata
Netlink Digital Energy Pvt Ltd Search Engine Optimization,Web Based Solutions Gurgaon
NetMonastery Network Security Pvt Ltd Consulting,ITeS / BPO Mumbai
Neuronimbus Web Based Solutions Janak Puri
Nexus Incorporation Software Development Rajkot
Nexus Web Solution Web Based Solutions Ahmedabad
Niteo Technologies (P) Ltd Consulting Chennai
Nitscape Accounting and Reconciliation Services Ahmedabad
NIX Solutions Ltd. Software Development Ukraine
Nixel Software Development Mumbai
Notetech Software Software Development Kochi
Nous Infosystems Pvt Ltd Database Management Tools,Software Development Bangalore
NTrust Infotech Pvt Ltd Back Office Services,Consulting,Data Processing / Data Management Chennai
Nyros Technologies Web Based Solutions Kakinada
Offshore custom software development company iTechArt
Internet Technologies,Software Development,Testing and Development Minsk
Offshore Outsourcing India Software Development Ahmedabad
Offsourcing, Inc. Application Architecture and Design,Consulting,Customizations,Proof of Concept Development,Software Development,Web Based Solutions Los Angeles
Ontrack Systems Limited ITeS / BPO,Mobile Application Development,Software Development Kolkata
Outsource Website Development Web Based Solutions Bangalore
Oxagile Application Architecture and Design,Application Maintenance,Application Re-engineering,Research and Development,Software Development,Web Based Solutions
Minsk
PARASOFT SOFTWARE PVT., LTD. Software Development Bangalore
Patni Computer Systems Application Architecture and Design,Application Maintenance,Application Re-engineering,Database Management Tools,Internet Technologies,Research and Development,Software Development,Web Based Solutions
Boston

195
Company Name Specialization City
Pawan Technology Web Based Solutions Uttaranchal
Persistent Systems Mobile Application Development,Product / Application Support,Quality Assurance and Testing,Research and Development,Testing and Development
Pie Computer & Investments Pvt Ltd
Consulting Mumbai
pratham software pvt. ltd Web Based Solutions Jaipur
PricewaterhouseCoopers Pvt Ltd Consulting Bangalore
Primetech Software Online Application Development,Search Engine Optimization,Software Development,Web Based Solutions Mumbai
Primetech Software Online Application Development Mumbai
Priya Softweb Solutions Data Processing / Data Management,Quality Assurance and Testing,Search Engine Optimization,Software Development,Testing and Development,Web Based Solutions
Ahmedabad
Pro Data Doctor Pvt. Ltd. Software Development Ghaziabad
ProcSys - Processor Systems India - PSI
Application Architecture and Design,Application Maintenance,Mobile Application Development,Research and Development,Software Development,Testing and Development
Bangalore
ProteusAdvisors Consulting Mumbai
QualSoft Services Software Development Pune
Qualsoft Services Application Architecture and Design,Application Re-engineering,Internet Technologies,Migration and Porting,Software Development,Testing and Development,Web Based Solutions
Pune
Quexst Solutions Pvt Ltd Consulting,Software Development,Testing and Development Pune
Radiant Software Software Development Hubli
Radix Software Development Ahmedabad
Radixweb Software Development Ahmedabad
Rajasri Systems P L Application Maintenance,Banking Solutions,Internet Technologies,Online Application Development,Software Development,Web Based Solutions Chennai
Ranosoft Technologies Software Development Ahmedabad
Rave Technologies (India) Pvt Ltd Application Architecture and Design,Consulting,Research and Development Mumbai
RCMS Pvt Ltd., Consulting Hyderabad
Real IT Experts Software Development Noida
Real Soft (Intl) Pvt Ltd Consulting Bangalore
Red Alkemi Search Engine Optimization
Redix Web Web Based Solutions Ahmedabad
Reservation Data Maintenance (India) Pvt Ltd
Application Architecture and Design,Application Re-engineering,Data Processing / Data Management Haryana
Revinfotech Pvt Ltd Application Maintenance,Back Office Services,Consulting,Data Processing / Data Management,ITeS / BPO,Software Development,Web Based Solutions Ludhiana
RG Infotech Web Based Solutions New Delhi
Rightway Solution (India) Pvt LTD Web Based Solutions Ahmedabad
Rishabh Software Pvt Ltd Application Architecture and Design,Application Maintenance,ITeS / BPO,Payroll Processing,Product / Application Support,Web Based Solutions Vadodara
Roars Incorporation Software Development,Web Based Solutions Ahmedabad
Root Info Solutions Software Development New Delhi
Rose I.T. Solutions (P) Ltd Application Architecture and Design,ITeS / BPO,Knowledge Management Services New Delhi

196
Company Name Specialization City
Rovaaris InfoTech India Pvt Ltd
Back Office Services,Call Center Services,Data Processing / Data Management,Help Desk,ITeS / BPO,Legal Process Outsourcing,Transcription Services,Web Based Solutions
Coimbatore
Royal Datamatics Pvt. Ltd. Software Development New Delhi
RSB Systems Pvt Ltd Accounting and Reconciliation Services,Data Processing / Data Management,Internet Technologies,ITeS / BPO,Software Development,Transcription Services,Web Based Solutions
Gurgaon
Saama Technologies (India) Pvt. Ltd. Data Processing / Data Management,Software Development Pune
Sai Softek Services Pvt Ltd Software Development Pune
Saigun Technologies Pvt Ltd Application Architecture and Design,Software Development Noida
Satisnet Web Based Solutions Ahmedabad
SDD Global Solutions Pvt. Ltd. Legal Process Outsourcing Mysore
Searchune: SEO/SEM Firm India Search Engine Optimization Cochin, India
Semaphore Infotech Pvt. Ltd. Software Development Ahmedabad
Semaphore Softwares Application Architecture and Design,Application Re-engineering,Internet Technologies,Mobile Application Development,Search Engine Optimization,Software Development,Web Based Solutions
Ahmedabad
SHAR Technologies Consulting Chennai
Shreyas Business Solutions Pvt Ltd Banking Solutions,ITeS / BPO Mumbai
Sierra Atlantic Software Services Limited Application Architecture and Design,Software Development Hyderabad
Silicon Valley Infomedia Pvt Ltd Software Development Ahmedabad,
SMARTBridge Solutions Pvt. Ltd
Accounting and Reconciliation Services,Application Maintenance,Back Office Services,Consulting,ITeS / BPO,Knowledge Management Services,Product / Application Support,Software Development,Transaction Processing
Hyderabad
Smile Multimedia Pvt Ltd Consulting,ITeS / BPO New Delhi
Soft Solutions Software Development Chandigarh (U.T.)
Softcell Systems Pvt Ltd Application Architecture and Design,Web Based Solutions New Delhi
Softheme LLC Software Development Kiev
softscripts Application Architecture and Design,Application Maintenance,Data Processing / Data Management,Internet Technologies,Online Application Development,Web Based Solutions
visakhapatnam
Software AG India Pvt Ltd Application Architecture and Design,ITeS / BPO Pune
Software Data (India) Ltd Consulting New Delhi
Software Outsourcing - TatvaSoft Software Development Ahmedabad
Software Quality Center Pvt Ltd Software Development Bangalore
Softweb Solutions Inc. Application Maintenance,Internet Technologies,Online Application Development,Search Engine Optimization,Software Development,Web Based Solutions
Chicago
Solutions Infosystems Pvt Ltd Data Processing / Data Management,ITeS / BPO New Delhi
Sonata Software Limited Application Maintenance Bangalore
Source Paradigm Limited Consulting,Market Research Northamptonshire
Source Quest AP sulting Pvt Back Office Services,Call Center Services,Payroll Processing,Software Pune

197
Company Name Specialization City
Ltd Development
SourceEdge Software Technologies Ltd Software Development Bangalore
SourceEdge Software Technologies Pvt. Ltd.
Application Architecture and Design,Application Maintenance,Consulting,Internet Technologies,Mobile Application Development,Software Development,Web Based Solutions
Bangalore
Sparrow Interactive Pvt. Ltd. Web Based Solutions New Delhi
Sphinx Worldbiz Limited Research and Development NOIDA
Srijan Technologies Pvt Ltd Application Architecture and Design,Internet Technologies,Migration and Porting,Research and Development,Software Development,Web Based Solutions
New Delhi
Stylus Systems Pvt. Ltd. Software Development Bangalore
Sunbelt Business Solutions Accounting and Reconciliation Services,Back Office Services,Help Desk,Online Application Development,Payroll Processing,Search Engine Optimization,Software Development
Ahmedabad
Sunsoft Infoway Accounting and Reconciliation Services Coimbatore
Symbiosys Technologies Application Re-engineering,Internet Technologies,Online Application Development Vizag
Symphisis Consulting Consulting New Delhi
Syngress Software Development Navi Mumbai
Syntax Soft-Tech India Pvt Ltd Software Development,Testing and Development Bangalore
Systime Computer Systems (I) Pvt. Ltd Software Development Mumbai
Take Solutions Ltd ITeS / BPO,Software Development Chennai
Talash Infosoft Pvt. Ltd Software Development Ahmedabad
Tandon Information Solutions Pvt. Ltd. Software Development Mumbai
Tata Infotech Ltd. ITeS / BPO,Software Development Mumbai
Tatvasoft Software Development Ahmedabad
TatvaSoft Software Development Ahmedabad
Tatvasoft Development Software Development Ahmedabad
Tavant Technologies India Pvt Ltd Application Architecture and Design,Testing and Development Bangalore
Techno Software Solutions Application Architecture and Design,Application Maintenance,Consulting,Internet Technologies,Software Development New Delhi
Techno Softwares Internet Technologies Jaipur
TejaSoft Innovations Pvt. Ltd. Consulting,Internet Technologies,Product / Application Support,Software Development,Testing and Development,Web Based Solutions
Bangalore
Telserra India Pvt Ltd Mobile Application Development Gurgaon
Thinking Minds.com (I) Pvt. Ltd. Consulting Nasik
Thirdware Solution Ltd. Software Development Mumbai
TIS India Business Consultants Pvt Ltd Search Engine Optimization Delhi
TMA Solutions Software Development Ho Chi Minh City
Torry Harris Application Architecture and Design,Application Maintenance,Quality Assurance and Testing,Testing and Development,Web Based Solutions Bangalore
Trianz Consulting Pvt Ltd Application Architecture and Design,Software Development Bangalore
Trident Web Infoservices Pvt. Ltd. Software Development Aundh, Pune

198
Company Name Specialization City
Trisoft Systems (P) Ltd Application Architecture and Design,Software Development,Testing and Development New Delhi
TUV Rheinland (India) Pvt Ltd Consulting,Product / Application Support,Quality Assurance and Testing Bangalore
UBICS Technologies Pvt Ltd Consulting Pune
Unitforce Technologies Consulting Pvt. Pvt.,
Back Office Services,Data Processing / Data Management,ITeS / BPO,Web Based Solutions Bangalore
US Technology International Pvt Ltd Consulting,ITeS / BPO Trivandrum
V2Solutions Back Office Services,Data Processing / Data Management,ITeS / BPO,Quality Assurance and Testing,Research and Development,Software Development,Web Based Solutions
Mumbai
Valdel Xtent Outsourcing Solutions Pvt Ltd Banking Solutions,Consulting Bangalore
ValueMomentum Software Services Pvt Ltd Ltd Data Processing / Data Management,Software Development Hyderabad
vCustomer.com Consulting,ITeS / BPO,Knowledge Management Services,Search Engine Optimization Kirkland
Venire IT Ltd ITeS / BPO,Software Development Gurgaon
Verilog Networks Pvt Ltd Quality Assurance and Testing,Software Development,Testing and Development,Web Based Solutions chennai
VInCom Technologies India Pvt. Ltd.
Application Maintenance,Back Office Services,Data Processing / Data Management,ITeS / BPO,Software Development,Web Based Solutions Coimbatore
VishwaTech Web Based Solutions Bhopal
Vision Tech Solutions Software Development
Web developer India Web Based Solutions Bhopal
Web Development India Web Based Solutions Coimbatore
WebExcel Solutions Pvt Ltd Data Processing / Data Management,Internet Technologies,Search Engine Optimization,Software Development,Testing and Development,Web Based Solutions
New Delhi
Website Design India Pvt. Ltd Web Based Solutions New Delhi
WebWingz ITeS / BPO,Mobile Application Development,Online Application Development,Search Engine Optimization,Software Development,Web Based Solutions
Pune
Winfoware Technologies Pvt Ltd
Application Architecture and Design,Application Maintenance,Application Prototyping,Application Re-engineering Bangalore
World Class Outsourcing Software Development New York,
WOX Systems Knowledge Management Services Coimbatore
Xavient Informaion Systems Testing and Development Noida
Xebia IT Architects Application Architecture and Design,Application Maintenance,Application Prototyping,Application Re-engineering,Search Engine Optimization,Software Development,Web Based Solutions
Gurgaon
Xoriant Solutions Pvt Ltd Software Development Mumbai
Xpanxion International Pvt Ltd Application Architecture and Design,Application Maintenance,Consulting,Testing and Development Pune
XSYSYS Technologies Pvt Ltd Consulting,Software Development Bangalore
ZANSYS TECHNOLOGIES Software Development New Delhi
ZealousWeb Technologies Accounting and Reconciliation Services Gujarat
Zerone Consulting Consulting Kochi
ZETA SOFTECH PVT.LTD Back Office Services,Data Processing / Data Management,ITeS / NAGPUR

199
Company Name Specialization City
BPO,Knowledge Management Services,Legal Process Outsourcing,Online Application Development,Software Development,Web Based Solutions
zeuscoder Application Maintenance,Internet Technologies nashik
Zylog Systems Software Development London

200
Annexure IV – List of BPO Companies
(as in April 2012)
Company Name Specialization City
247Analyst Help Desk,ITeS / BPO,Knowledge Management Services,Legal Process Outsourcing,Market Research Cochin
Accord Legal Services Legal Process Outsourcing Cochin
Adept Legal Solutions Legal Process Outsourcing Cochin
Aditya Birla Minacs Application Maintenance,Back Office Services,Call Center Services,ITeS / BPO,Knowledge Management Services,Research and Development,Web Based Solutions
Mumbai
Adventity BPO India Pvt Ltd Accounting and Reconciliation Services,Back Office Services,Call Center Services,Consulting,Data Processing / Data Management,ITeS / BPO,Knowledge Management Services,Transaction Processing
Mumbai
Aegis BPO Services, Pvt. Ltd. Back Office Services,Call Center Services,ITeS / BPO,Transcription Services Bangalore
Aheads E-Solution Pvt Ltd Banking Solutions,Call Center Services,Help Desk,ITeS / BPO,Knowledge Management Services,Legal Process Outsourcing,Market Research,Payroll Processing,Quality Assurance and Testing
Chennai
Allsec Technologies Ltd Call Center Services,Help Desk,Market Research,Payroll Processing Chennai
Allzone Management Solutions, Inc ITeS / BPO Chennai
Altosys Software Technologies Ltd Back Office Services,Help Desk,ITeS / BPO Chennai
Amadeus India Pvt Ltd Help Desk,ITeS / BPO New Delhi
Aries Infotech Pvt. Ltd. Back Office Services,Data Processing / Data Management,ITeS / BPO,Quality Assurance and Testing,Testing and Development Nagpur
ARINOS INFOSLUTIONS (P) LIMITED
Application Maintenance,Back Office Services,Call Center Services,Data Processing / Data Management,ITeS / BPO,Mobile Application Development,Online Application Development,Payroll Processing,Software Development,Transaction Processing
Chennai
Asesoftware ltda Application Architecture and Design,Application Maintenance,Application Prototyping,Back Office Services,Software Development,Testing and Development
Bogota DC
Axiom BPM PVT LTD ITeS / BPO
Bitscape ITeS / BPO Ahmedabad
Bluekans Information Systems Pvt. Ltd.
Back Office Services,Consulting,Data Processing / Data Management,Knowledge Management Services,Legal Process Outsourcing,Transaction Processing
noida
Books to taxes Accounting and Reconciliation Services EKm
Brigade Corporation India Pvt Ltd Call Center Services,ITeS / BPO Hyderabad
Call Centers India Call Center Services Seattle
Carbonon Tech Pvt Ltd ITeS / BPO Chennai
Cheers Interactive Accounting and Reconciliation Services,Back Office Services,Call Center Services,Data Processing / Data Management,Knowledge Management Services
Mahape, Navi Mumbai
Cheers Interactive India Pvt Ltd
Accounting and Reconciliation Services,Data Processing / Data Management,Database Management Tools,Knowledge Management Services,Legal Process Outsourcing,Market Research,Research and Development
Mahape

201
Company Name Specialization City
Cherrytec Solutions Limited Banking Solutions,Data Processing / Data Management,ITeS / BPO Chennai
CI.COM (P) Ltd ITeS / BPO,Quality Assurance and Testing Chennai
Cipher Dynamics Accounting and Reconciliation Services,Back Office Services,Call Center Services,ITeS / BPO,Knowledge Management Services,Software Development,Testing and Development,Transaction Processing
Delhi
CLI3L e-Services Limited Back Office Services,Call Center Services,ITeS / BPO,Transaction Processing Bangalore
CMG Technologies Consulting,Data Processing / Data Management,Internet Technologies,Research and Development,Search Engine Optimization,Software Development,Web Based Solutions
Chandigarh
Cogent E Services Pvt. Ltd. Call Center Services Noida
Colwell & Salmon Communications (India) Ltd Back Office Services,Market Research
Compass Business Process Outsourcing Pvt Ltd ITeS / BPO Mumbai
Concen Tek Pvt Ltd Call Center Services,ITeS / BPO Hyderabad
Continuum Systems Pvt Ltd Application Architecture and Design,Application Maintenance,Application Re-engineering,Data Processing / Data Management,ITeS / BPO,Web Based Solutions
Gurgaon
Convergys India Services Call Center Services,ITeS / BPO Hyderabad
Corbus (India) Private Limited Application Architecture and Design,Data Processing / Data Management,ITeS / BPO,Quality Assurance and Testing
Noida
Creative Mediapulse Technologies pvt.ltd Search Engine Optimization bangalore
Cybelink Accounting and Reconciliation Services Inver Grove Heights
Daksh e-Services Call Center Services,ITeS / BPO,Transaction Processing,Web Based Solutions
Data Services Technology Accounting and Reconciliation Services,Call Center Services,Data Processing / Data Management,ITeS / BPO,Software Development Bangalore
DecisionCraft Analytics Limited Data Processing / Data Management,ITeS / BPO Ahmedabad
Dharmesh Acharya Software Development Ahmedabad
Eclat Bpo Solutions Accounting and Reconciliation Services,Back Office Services,Call Center Services,Data Processing / Data Management,ITeS / BPO,Payroll Processing,Transcription Services
Coimbatore
eJyothi Services Private Limited Back Office Services Kochi
Electronica Finsmart Solutions Pvt. Ltd. Accounting and Reconciliation Services,Payroll Processing Pune
Emphasize Outsourcing Data Processing / Data Management,Database Management Tools,ITeS / BPO,Market Research,Research and Development
Coimbatore
Epicenter technologies Pvt. Ltd. Back Office Services,Banking Solutions,Call Center Services,ITeS / BPO,Transaction Processing Mumbai
Equinox Global Services Pvt Ltd Banking Solutions,ITeS / BPO Gurgaon
Exevo India Limited Data Processing / Data Management,Knowledge Management Services,Web Based Solutions New Delhi
EXL Services Banking Solutions,Call Center Services,ITeS / BPO Noida
Gausa India Ltd Application Architecture and Design,Application Maintenance,ITeS / BPO,Legal Process Outsourcing,Quality Assurance and Testing New Delhi
GAVS Information Services Private Limited
Application Architecture and Design,Application Maintenance,Data Processing / Data Management,ITeS / BPO Chennai
Global Business Technology Services Pvt Ltd Data Processing / Data Management,ITeS / BPO Chennai
Global Sky Call Center Services Pasig

202
Company Name Specialization City
Griha Software Technologies Data Processing / Data Management Bangalore
GRSC Infotech Private Limited
Accounting and Reconciliation Services,Application Architecture and Design,Application Maintenance,Application Prototyping,Application Re-engineering,Back Office Services,Banking Solutions,Call Center Services,Consulting,Customizations,Data Processing / Data Management,Database Management Tools,Help Desk,Internet Technologies,ITeS / BPO,Knowledge Management Services,Legal Process Outsourcing
Mumbai
HCL Technologies BPO Services Call Center Services,Market Research
Whitefield Industrial Area, Bangalore
Hexaware Technologies Limited Application Architecture and Design,Banking Solutions,ITeS / BPO Mahape
Hinduja TMT ITeS / BPO,Transaction Processing Bangalore
HTC Global Services (India) Pvt Ltd Back Office Services,ITeS / BPO,Quality Assurance and Testing Chennai
ibm daksh ITeS / BPO lucknow
iBridge Solutinon ITeS / BPO Pune
ICICI OneSource Limited Call Center Services,Market Research,Transaction Processing Malad West
iGATE Global Solutions Ltd Banking Solutions,ITeS / BPO Bangalore
IndusFusion Call Center Services,Consulting,Knowledge Management Services Phoenix
Infosys Technologies Ltd. Banking Solutions,ITeS / BPO,Knowledge Management Services Bangalore
Interglobe Technologies Pvt Ltd Application Maintenance,Call Center Services,Consulting,ITeS / BPO,Quality Assurance and Testing Gurgaon
iSmart International Limited Back Office Services,Call Center Services,ITeS / BPO Andheri (east), Mumbai
ITC Infotech India Ltd Consulting,ITeS / BPO Bangalore
itCube Solutions Pvt Ltd Call Center Services,Market Research Bibwewadi, Pune
ITMatchOnline ITeS / BPO Ahmedabad
IVL India Pvt Ltd Application Maintenance,Consulting,Data Processing / Data Management,Knowledge Management Services Trivandrum
IVY INFORMATICS ITeS / BPO Coimbatore
Kailash Media Back Office Services,Data Processing / Data Management,ITeS / BPO,Knowledge Management Services,Legal Process Outsourcing Secunderabad
Lancet Worldwide Software Development Ottawa
Lasermed Outsource Solutions Legal Process Outsourcing Pasig
Legal Outsource Solutions, Inc Data Processing / Data Management,Transcription Services Chennai
Lighthouse Systems Pvt. Ltd. Data Processing / Data Management,ITeS / BPO Nagpur
Litigation Outsource Solutions, Inc ITeS / BPO,Legal Process Outsourcing Chennai
Logica Synectics Pvt Ltd (LogicaCMG)
Application Architecture and Design,Application Re-engineering,Call Center Services,ITeS / BPO Bangalore
Lpoindia ITeS / BPO Ahmedabad
Manjushree Infotech ITeS / BPO Kolkata
Mindscreen IT Solutions Data Processing / Data Management,ITeS / BPO,Software Development,Transcription Services,Web Based Solutions KOLKATA
Motif, Inc. Accounting and Reconciliation Services,Back Office Services,Call Center Services,ITeS / BPO,Payroll Processing,Transaction Processing,Web Based Solutions
Ahmedabad
MphasiS BPO Services Application Maintenance,ITeS / BPO,Quality Assurance and Testing Bangalore

203
Company Name Specialization City
(Formerly MsourcE)
Myspacein Back Office Services,Call Center Services,Data Processing / Data Management,Help Desk,ITeS / BPO,Software Development,Web Based Solutions
Gurgaon
Naashree Associates, Advocates Legal Process Outsourcing New Delhi
Newgen Software Technologies Ltd Banking Solutions,Data Processing / Data Management,ITeS / BPO New Delhi
NIIT Technologies Ltd Application Architecture and Design,ITeS / BPO New Delhi
Nipuna Services Accounting and Reconciliation Services,Application Re-engineering,Banking Solutions,Data Processing / Data Management,Help Desk,Product / Application Support,Research and Development,Transaction Processing
Hyderabad
NomKa Call Center Back Office Services,Call Center Services Placentia
Nous Infosystems Call Center Services,Consulting,Data Processing / Data Management,ITeS / BPO,Quality Assurance and Testing Bangalore
OKS Span Tech Pvt Ltd Call Center Services,Data Processing / Data Management,Knowledge Management Services,Legal Process Outsourcing New Delhi
Ontrack Systems Limited ITeS / BPO,Mobile Application Development Kolkata
orange consultancy Knowledge Management Services coimbatore
P B Tech Impact Solutions Pvt. Ltd.
Accounting and Reconciliation Services New Delhi
Perfect Technologies Data Processing / Data Management Shimoga
PHi Business Solutions Ltd Application Architecture and Design,ITeS / BPO Chandigarh
PVSPL Data Processing / Data Management,ITeS / BPO,Software Development,Web Based Solutions Chennai
Quest Informatics ITeS / BPO Bangalore
Rel N Pro ITeS Software Development Secunderabad
Revelation BPO Accounting and Reconciliation Services,Back Office Services,Consulting,Knowledge Management Services,Payroll Processing Bangalore
RICO Auto Industries Ltd Call Center Services,Data Processing / Data Management,Knowledge Management Services,Transaction Processing Gurgaon
RICOM ITeS / BPO Hyderabad
Rishi Infotech Pvt Ltd. Accounting and Reconciliation Services,Data Processing / Data Management,Online Application Development,Payroll Processing,Web Based Solutions
Baroda
Sai BPO Services(UK) Ltd
Accounting and Reconciliation Services,Application Re-engineering,Back Office Services,Data Processing / Data Management,ITeS / BPO,Knowledge Management Services,Legal Process Outsourcing,Software Development,Transcription Services
Barking
Salient Business Solutions Accounting and Reconciliation Services,Call Center Services,ITeS / BPO,Knowledge Management Services Gurgaon
Sampoorna Matchjobs.com Pvt Ltd ITeS / BPO Mumbai
SOFOS Back Office Services,Call Center Services,Data Processing / Data Management,ITeS / BPO,Market Research,Research and Development,Transcription Services,Web Based Solutions
Coimbatore
SoftProjex (India) Ltd Application Architecture and Design,Application Maintenance,Call Center Services,ITeS / BPO,Quality Assurance and Testing Hyderabad
SPI Technologies India Pvt Ltd ITeS / BPO,Legal Process Outsourcing,Transaction Processing Chennai
Suma Soft Pvt Ltd ITeS / BPO,Transaction Processing Pune
Surlin Solutions Limited Back Office Services,Banking Solutions,Call Center Services,Consulting,Data Dehradun

204
Company Name Specialization City
Processing / Data Management,ITeS / BPO,Knowledge Management Services,Legal Process Outsourcing,Quality Assurance and Testing,Research and Development,Search Engine Optimization,Software Development
Sutherland Global Services Pvt Ltd
Back Office Services,Call Center Services,ITeS / BPO Chennai
Synclair Medi Solutions Data Processing / Data Management,ITeS / BPO,Transcription Services Vizag
Tandem Consulting Pvt Ltd Accounting and Reconciliation Services,Payroll Processing,Transaction Processing Chennai
Tata Consultancy Services Ltd Banking Solutions,Data Processing / Data Management,ITeS / BPO,Legal Process Outsourcing Mumbai
TeleTech Services (India) Ltd Call Center Services,ITeS / BPO Gurgaon
TopSource Infotech Solutions Pvt Ltd
Accounting and Reconciliation Services,Data Processing / Data Management,Payroll Processing Pune
Tracmail Group Call Center Services,ITeS / BPO Mumbai
UGAM Solutions Pvt Ltd ITeS / BPO,Market Research Mumbai
vCustomer Call Center Services,Data Processing / Data Management,Help Desk,ITeS / BPO Pune
Vee Technologies Pvt Ltd
Accounting and Reconciliation Services,Application Architecture and Design,Back Office Services,Banking Solutions,Data Processing / Data Management,ITeS / BPO,Knowledge Management Services,Legal Process Outsourcing,Payroll Processing,Transaction Processing,Transcription Services
Bangalore
Versatile Solutions Application Architecture and Design,Back Office Services,Call Center Services,Data Processing / Data Management,ITeS / BPO Ahmedabad
Vital Link Outsourcing Accounting and Reconciliation Services,Back Office Services,Data Processing / Data Management,ITeS / BPO,Legal Process Outsourcing,Market Research,Payroll Processing,Transaction Processing
Pune
Wipro Spectramind Accounting and Reconciliation Services,Call Center Services,Help Desk,Knowledge Management Services New Delhi
WNS Global Services ITeS / BPO Mumbai
Xceed Back Office Services,Call Center Services,Data Processing / Data Management,Help Desk,ITeS / BPO Cairo
Zenta Technologies Accounting and Reconciliation Services,ITeS / BPO Mumbai
Zeta Softech Pvt.Ltd Data Processing / Data Management,ITeS / BPO,Knowledge Management Services,Legal Process Outsourcing,Software Development,Transcription Services,Web Based Solutions
Nagpur
Zycarian Accounting and Reconciliation Services,Back Office Services,Data Processing / Data Management,ITeS / BPO,Knowledge Management Services Fremont

205
Annex V – Companies Included in the Research
Total 60 companies (including Life Sciences and Information Technology) were
included in the research.
Life Sciences Companies

206
Information Technology Companies

207
Annex VI – Research Questionnaires
Life Sciences - IT Outsourcing (Survey-1)
Dear Professional, I am currently working on a research work in Life Sciences-Information Technology Outsourcing. This small survey questionnaire below contains 25 multiple choice questions relating to the same subject. I appreciate your valuable feedback, and choosing answers should not take more than 15 minutes of your time. The details provided will be USED FOR EDUCATIONAL AND ACADEMIC RESEARCH PURPOSES ONLY. Your firm name and other sensitive information will be held STRICTLY CONFIDENTIAL. I strongly believe - it helps to learn and know from individuals who run the business like yours’. Your answers will help immensely in my research to better understand the industry. At a long shot, the outcome of this work could help your organization in embracing newer concepts and enable smarter work across industry. Please note that an 'Executive Summary' of the research findings will be shared with you for being a valuable respondent. This summary could help you understand and provide recommendations, also could help you identify your organization's position amongst other participating companies from the industry. Many Thanks to participants already responded. Thank you for your time and appreciate your support. Best Regards, Damodar Rao (damu), +919819799948 Linkedin Public Profile - http://in.linkedin.com/in/damodarrao [email protected], [email protected]
NAME
EMAIL ID
ORGANIZATION Role
Research Associate / Chemist / QA Analyst / Production Chemist
Senior Research Associate / Executive / Supervisor / Manager
Senior Manager / Consultant / Architect
Department Head / General Manager / Chief Architect
Business Unit Head / Partner
CXO
Other: Tenure in current organization
0 – 2 years
3 – 5 years
6 -10 years
Over 10 years Overall Life Sciences Experience

208
0 – 2 years
3 – 5 years
5 – 8 years
8 – 12 years
Over 12 years 1. Your primary job specialization?
R&D
Manufacturing
QC/QA
Regulatory
Marketing, Sales & Distribution
Other: 2. Primary nature of your company business?
Manufacturer
Distributor
Importer
Retailer
Trader
Other: 3. Core market areas that your business focuses upon?
India Only
India, US, EU
India and ASEAN Countries
Global
Other: 4. Your Organization in the current business since?
Less than 5 years
5 – 10 years
10 – 20 years
20 – 30 years
More than 30 years

209
5. Approximate percentage of automation enabled in your organization?
Less than 10%
10 – 30%
30 – 50%
50 – 70%
More than 70% 6. Approximate percentage of automation enabled in your work department and/or operations?
Less than 10%
10 – 30%
30 – 50%
50 – 70%
More than 70% 7. Which department/operations are leading adopters of automation/IT enablement in your organization?
R&D
Manufacturing
QC/QA
Regulatory
Marketing, Sales & Distribution
Other: 8. Primary need for enabling automation?
Efficiency
Productivity
Accuracy
Monitoring
All of the Above 9. How does your organization and/or department remain abreast with ever changing compliance requirements?
Internal Training and Development
Robust Best Practices Frameworks
Align to Clients Methodologies
All 3 above

210
Other: 10. Does your company follow Good Automated Manufacturing Practice (GAMP) or any other industry guidance for automation and IT enabled systems?
Yes
No 11. Do you perform analytical methods and manufacturing process validations using IT enable systems without much manual intervention?
Yes
No 12. Do you have automation and/or IT systems in place to meet to 21 CFR Part 11 requirements i.e. Electronic records (ER) / Electronic signatures (ES) and FDA requirements?
Yes
No 13. Organization’s confidence in adopting IT enabled processes and complying to impending regulations and clearing audits smoothly?
Strong Confidence
Weak Confidence
Same as in Manual Processes 14. What is the keenness of your organization and/or department in moving from manual operations to automated processes of critical business operations?
Highly Interested
Interested
Not Interested
Shall Consider Later 15. Does your organization engage any IT service provider to help your company in business operations?
Yes
No 16. If yes, what is the primary reason to engage an IT Service provider?
Lack of man-power in your Organization
Lack of specific skills in your Organization
To seek expert guidance

211
For cost benefits
Other: 17. If yes, what has been your overall satisfaction with the chosen service provider(s) performance?
Very Satisfactory
Satisfactory
Could have done better
Below Satisfactory 18. If no service provider(s) was engaged so far, what is the primary reason not to engage with any IT Service provider?
Lack of confidence in service providers
Lack of specific service providers
Impending additional Regulatory Risks
Cost barriers
Other: 19. FDA is encouraging companies to adopt newer technologies in making the drugs arrive in market sooner. Which business unit in your organization is rapidly moving ahead in embracing these technologies?
R&D
Manufacturing
QC/QA
Regulatory
Marketing, Sales & Distribution
Other: 20. Does your organization engage in any of the Process Analytical Technology (PAT) initiatives as recommended by FDA?
Yes
No 21. Is any of your business process fully automated with minimum manual intervention? If yes, which business unit does the process belong to?
R&D
Manufacturing
QC/QA
Regulatory

212
Marketing, Sales & Distribution
Other: 22. Does your organization have manufacturing operations outside India i.e. in more than one base country?
Yes
No 23. Which country hosts your central IT infrastructure and support team?
India as a Base
Other base Country
Non-base Country i.e. a Country where no manufacturing operations exist hosts IT setup 24. For the IT enablement or the automation of certain business processes, did your organization engage the same service provider for support during regulatory inspections?
Yes
No 25. In your current organization and/or department landscape, which business area of operations is that you intend to offshore/outsource immediately to a trusted service provider?
Any other thoughts you may want to add on the subject – Life Sciences - IT Outsourcing?

213
Life Sciences - IT Outsourcing (Survey-2)
Dear Professional, I am currently working on a research work in Life Sciences-Information Technology Outsourcing. This small survey questionnaire below contains 25 multiple choice questions relating to the same subject. I appreciate your valuable feedback, and choosing answers should not take more than 15 minutes of your time. The details provided will be USED FOR EDUCATIONAL AND ACADEMIC RESEARCH PURPOSES ONLY. Your firm name and other sensitive information will be held STRICTLY CONFIDENTIAL. I strongly believe - it helps to learn and know from individuals who run the business like yours’. Your answers will help immensely in my research to better understand the industry. At a long shot, the outcome of this work could help your organization in embracing newer concepts and enable smarter work across industry. Please note that an 'Executive Summary' of the research findings will be shared with you for being a valuable respondent. This summary could help you understand and provide recommendations, also could help you identify your organization's position amongst other participating companies from the industry. Many Thanks to participants already responded. Thank you for your time and appreciate your support. Best Regards, Damodar Rao (damu), +91 9819799948 Linkedin Public Profile - http://in.linkedin.com/in/damodarrao [email protected], [email protected]
NAME
EMAIL ID
ORGANIZATION Role
Developer / Team Member / Business Analyst
Senior Developer / Consultant / Senior Business Analyst
Account Manager / Project Manager / Managing Consultant / SME / Architect
Account Executive / Program Manager / Senior Managing Consultant / Chief Architect
Business Unit Head / Partner
CXO
Other: Tenure in current organization
0 – 2 years
3 – 5 years
6 -10 years
Over 10 years Overall IT Experience
0 – 2 years
3 – 5 years

214
5 – 8 years
8 – 12 years
Over 12 years 1. Primary nature of your company business?
IT and IT Enabled Services
BPO / KPO
Consulting
Product Development
Other: 2. Core market areas that your business focuses upon?
India Only
India, US, EU
India and ASEAN Countries
Global
Other: 3. Your Organization in the current business since?
Less than 5 years
5 – 10 years
10 – 20 years
20 – 30 years
More than 30 years 4. Which industry does your organization’s primarily focus upon?
Life Sciences
Medical Devices
Healthcare
Government and Medical Institutions
Clinical Research
Other: 5. Number of projects completed successfully in the above mentioned industry?
Less than 10
10 – 30

215
30 – 50
50 – 70
More than 70 6. Total head count in your organization?
Less than 500
500 – 5000
5000 – 20000
20000 – 50000
More than 50000 7. As a service provider, approximately what has been your organization's involvement in engaging with the client in projects?
Less than 10%
10 – 30%
30 – 50%
50 – 70%
More than 70% 8. Which department/operations in the industry have been primarily associated?
R&D, Manufacturing, QC/QA
Sales & Distribution
Clinical Research
Product Development
Other: 9. Where do you position your organization in service capabilities?
Level 1 – Business Specific Solutions
Level 2 – Solutions to Integrate Multiple Functional Areas
Level 3 – Well Integrated Enterprise Applications viz. Business Intelligence
Level 4 – IT Setup to Automate Entire Organization
Other: 10. How does your organization and/or department build specific industry capabilities to align and get closer to industry value chain?
To Hire Industry Professionals
Internal Workshops / Training

216
Understand pain-points from clients and prepare suitable solutions
All 3 above
Other: 11. Does your organization hire and retain core Subject Matter Experts catering to specific industry?
Yes
No 12. From your experience, what kinds of projects were difficult to win and manage?
Application Development
Application Maintenance
Strategic Consulting
New Customized Product Development
Other: 13. Where do you differentiate your organization from the competition in IT industry?
Thought Leadership
Research & Innovation Based Solutions
People Skills Availability
Global Reach
Business and Industry Expertise 14. As per you, what is driving industry clients to reach out to your organization for additional support and improve upon their operations?
Requirement of Innovative Business Models
Streamlining IT Enabled Operations
Managing IT Regulatory Compliance Better
Cost Benefits
Other: 15. Does the offshore/outsource model adopted by your organization impact client’s customer care?
Yes
No 16. Does the offshore/outsource model adopted by your organization impact client’s product release?
Yes
No

217
17. Does the offshore/outsource model adopted by your organization impact client’s core business operations?
Yes
No 18. During the course of engagements with clients, how tough was it to be regulatory compliant and meet client's mandates?
No impact
Could have done better
Tough 19. What is the biggest challenge your organization perceives while approaching clients in specific industry?
Conservativeness towards offshore/outsourcing
Ensure consistency in meeting impending regulations
Switch over to automation is perceived to be tough by clients
Building client confidence for effective delivery
Other: 20. What do you hear the most from your clients while adopting IT enablement and automation?
Innovation
Globalization Efforts
Cost and Revenue Pressure
Regulatory and Societal Pressures Intensifying
Other: 21. Were there cases, wherein your organization and/or department was engaged in Support and Development projects and compliance attributes were managed by either client and/or other third party?
Yes
No 22. As per you, what are the primary challenges that need to overcome by clients in emerging markets?
Patents and Related Regulations
Price Controls
Weak Infrastructure
Forex Movements & Political Risks
All of the above

218
23. FDA is encouraging clients to adopt newer technologies in making the drugs arrive in market sooner and improve healthcare efficiency. Did your organization directly involve in any of these initiatives and/or supported your clients?
Yes
No 24. Does your organization partner with other Third-Party Service Providers to provide niche services to your clients?
Yes
No 25. Has your organization developed any industry specific solutions as part of the regulatory agencies requirements e.g. Promotional Spend Compliance (PSC), Process Analytical Technology (PAT) or is in the process of building them?
Yes
No Any other thoughts you may want to add on the subject – Life Sciences-IT Outsourcing?

219
Annex VII – Statistical Tables of SPSS Analysis
Frequency Tables – Life Sciences
The below findings attempt to draw socio-demographic profile of respondents
covered in the study. It includes Profile of the respondents and their thought
process along with their decision making activities towards offshore
outsourcing.
Role of Respondent (SPSS Table 1)
Frequency Percent Research Associate / Chemist / QA Analyst / Production Chemist 108 35.1 Senior Research Associate / Executive / Supervisor / Manager 140 45.5 Senior Manager / Consultant / Architect 25 8.1 Department Head / General Manager / Chief Architect 23 7.5
Business Unit Head / Partner 2 .6
CXO 0 0
Other 0 0 Total 298 96.8 Missing System 10 3.2
Total 308 100.0
Role of respondents has been used to determine aspect of ‘The role they
perform in an Organization. The frequency and percentage distribution
for role show that the highest percentage (45.5%) is in the group of Senior
Research Associate / Executive / Supervisor / Manager followed by Research
Associate / Chemist / QA Analyst / Production Chemist which is (35.1%).

220
Tenure in current organization (SPSS Table 2) Frequency Percent
0 – 2 years 115 37.3 3 – 5 years 114 37.0 6 -10 years 42 13.6 Over 10 years 33 10.7
Total 304 98.7 Missing System 4 1.3 Total 308 100.0
Tenure of respondents has been used to determine aspect of ‘Time spent in
a particular Organization’. The frequency and percentage distribution for
tenure in current organization show that the highest percentage (37.3%) is in
the year group of 0 – 2 years followed by 3 – 5 yea rs which is (37.0%).
Respondents who have spent more than 10 years were 10.7%.
Overall Life Sciences Experience (SPSS Table 3) Frequency Percent
0 – 2 years 72 23.4 3 – 5 years 69 22.4 5 – 8 years 49 15.9 8 – 12 years 40 13.0 Over 12 years 76 24.7
Total 306 99.4 Missing System 2 .6 Total 308 100.0
Following the tenure of respondents, the overall experience in the Life
Sciences industry has been used to determine aspect of ‘Overall Life
Sciences Experience’. The frequency and percentage distribution for
overall Life Sciences experience in the industry show that the highest
percentage (24.7%) is in the year group of more than 12 years followed
by 0 – 2 yea rs which is (23.4%) and 3 – 5 years (22.4%). Respondents who
have spent 8 – 12 years were in the least with 13.0%.

221
Your primary job specialization? (SPSS Table 4)
Frequency Percent R&D 24 7.8 Manufacturing 74 24.0 QC/QA 132 42.9 Regulatory 16 5.2 Marketing, Sales & Distribution 29 9.4 Other 32 10.4
Total 307 99.7 Missing System 1 .3 Total 308 100.0
The respondents’ job specialization has been used to determine aspect of
‘Primary Job Specialization’. The frequency and percentage distribution
for primary job specialization show that the highest percentage (42.9%) is in
the QC/QA group followed by Manufacturing which is (24.0%).
Respondents in the regulatory departments were least with 5.2%.
Primary nature of your company business? (SPSS Table 5) Frequency Percent
Manufacturer 295 95.8 Distributor 3 1.0 Importer 1 .3 Retailer 0 0 Trader 1 .3 Other 6 1.9
Total 306 99.4 Missing System 2 .6 Total 308 100.0
The type of organization the respondent worked in has been used to determine
aspect of ‘Primary Nature of Company Business’. The frequency and
percentage distribution for primary nature of company business show that
the highest percentage (95.8%) is into Manufacturing of pharmaceutical
products for the global market followed by least number of respondents from
Retailing and Trading at 0.3% each.

222
The tables in the following pages reveal the correlation between two
parameters and their mutual dependency that influences the offshore
outsourcing decision making process.
Role (SPSS Table 6) Frequency Percent
Research Associate / Chemist / QA Analyst / Production Chemist 108 35.1
Senior Research Associate / Executive / Supervisor / Manager 140 45.5
Senior Manager / Consultant / Architect 25 8.1
Department Head / General Manager / Chief Architect 23 7.5
Business Unit Head / Partner 2 .6
CXO 0 0
Other 0 0
Total 298 96.8 Missing System 10 3.2
Total 308 100.0 Tenure in current organization (SPSS Table 7)
Frequency Percent 0 – 2 years 115 37.3 3 – 5 years 114 37.0 6 -10 years 42 13.6 Over 10 years 33 10.7
Total 304 98.7 Missing System 4 1.3 Total 308 100.0
Overall Life Sciences Experience (SPSS Table 8) Frequency Percent
0 – 2 years 72 23.4 3 – 5 years 69 22.4 5 – 8 years 49 15.9 8 – 12 years 40 13.0 Over 12 years 76 24.7
Total 306 99.4 Missing System 2 .6 Total 308 100.0

223
Your primary job specialization? (SPSS Table 9)
Frequency Percent R&D 24 7.8 Manufacturing 74 24.0 QC/QA 132 42.9 Regulatory 16 5.2 Marketing, Sales & Distribution 29 9.4 Other 32 10.4
Total 307 99.7 Missing System 1 .3 Total 308 100.0
Primary nature of your company business? (SPSS Table 10) Frequency Percent
Manufacturer 295 95.8 Distributor 3 1.0 Importer 1 .3 Retailer 0 0 Trader 1 .3 Other 6 1.9
Total 306 99.4 Missing System 2 .6 Total 308 100.0
Core market areas that your business focuses upon? (SPSS Table 11) Frequency Percent
India Only 12 3.9 India, US, EU 57 18.5 India and ASEAN Countries 37 12.0 Global 201 65.3
Total 307 99.7 Missing System 1 .3 Total 308 100.0
Your Organization in the current business since? (SPSS Table 12)
Frequency Percent Less than 5 12 3.9 5 – 10 39 12.7 10 – 20 115 37.3 20 – 30 98 31.8 More than 30 41 13.3
Total 305 99.0 Missing System 3 1.0 Total 308 100.0

224
Approximate percentage of automation enabled in your organization? (SPSS Table 13) Frequency Percent
Less than 10% 18 5.8 10 – 30% 96 31.2 30 – 50% 123 39.9 50 – 70% 40 13.0 More than 70% 24 7.8
Total 301 97.7 Missing System 7 2.3 Total 308 100.0
Approximate percentage of automation enabled in your work department and/or operations? (SPSS Table 14)
Frequency Percent Less than 10% 58 18.8 10 – 30% 66 21.4 30 – 50% 117 38.0 50 – 70% 45 14.6 More than 70% 18 5.8
Total 304 98.7 Missing System 4 1.3 Total 308 100.0
Which department/operations are leading adopters of automation/IT enablement in your organization? (SPSS Table 15) Frequency Percent
R&D 23 7.5 Manufacturing 137 44.5 QC/QA 94 30.5 Regulatory 14 4.5 Marketing, Sales & Distribution 28 9.1 Other 6 1.9
Total 302 98.1 Missing System 6 1.9 Total 308 100.0
Primary need for enabling automation? (SPSS Table 16) Frequency Percent
Efficiency 32 10.4 Productivity 26 8.4 Accuracy 51 16.6 Monitoring 22 7.1 All of the Above 173 56.2
Total 304 98.7 Missing System 4 1.3 Total 308 100.0

225
How does your organization and/or department remain abreast with ever changing compliance requirements? (SPSS Table 17) Frequency Percent
Internal Training and Development 100 32.5 Robust Best Practices Frameworks 8 2.6 Align to Clients Methodologies 8 2.6 All 3 above 183 59.4 Other 0 0
Total 299 97.1 Missing System 9 2.9 Total 308 100.0
Does your company follow Good Automated Manufacturing Practice (GAMP) or any other industry guidance for automation and IT enabled systems? (SPSS Table 18) Frequency Percent
No 68 22.1 Yes 229 74.4
Total 297 96.4 Missing System 11 3.6 Total 308 100.0
Do you perform analytical methods and manufacturing process validations using IT enabled systems without much manual intervention? (SPSS Table 19) Frequency Percent
No 78 25.3 Yes 219 71.1
Total 297 96.4 Missing System 11 3.6 Total 308 100.0
Do you have automation and/or IT systems in place to meet to 21 CFR Part 11 requirements i.e. Electronic records (ER) / Electronic signatures (ES) and FDA requirements? (SPSS Table 20) Frequency Percent
No 65 21.1 Yes 229 74.4
Total 294 95.5 Missing System 14 4.5 Total 308 100.0
Organization's confidence in adopting IT enabled processes and complying to impending regulations and clearing audits smoothly? (SPSS Table 21)
Frequency Percent Strong Confidence 185 60.1 Weak Confidence 33 10.7 Same as in Manual Processes 76 24.7
Total 294 95.5 Missing System 14 4.5 Total 308 100.0

226
What is the keenness of your organization and/or department in moving from manual operations to automated processes of critical business operations? (SPSS Table 22)
Frequency Percent Highly Interested 105 34.1 Interested 169 54.9 Not Interested 6 1.9 Shall Consider Later 15 4.9
Total 295 95.8 Missing System 13 4.2 Total 308 100.0
Does your organization engage any IT service provider to help your company in business operations? (SPSS Table 23)
Frequency Percent No 29 9.4 Yes 267 86.7
Total 296 96.1 Missing System 12 3.9 Total 308 100.0
If yes, what is the primary reason to engage an IT Service provider? (SPSS Table 24)
Frequency Percent Lack of man-power in your Organization 25 8.1 Lack of specific skills in your Organization 19 6.2 To seek expert guidance 140 45.5 For cost benefits 80 26.0 Other 42 13.6
Total 306 99.4 Missing System 2 .6 Total 308 100.0
If yes, what has been your overall satisfaction with the chosen service provider(s) performance? (SPSS Table 25) Frequency Percent
Very Satisfactory 49 15.9 Satisfactory 182 59.1 Could have done better 71 23.1 Below Satisfactory 5 1.6
Total 307 99.7 Missing System 1 .3 Total 308 100.0

227
If no service provider(s) was engaged so far, what is the primary reason not to engage with any IT Service provider? (SPSS Table 26)
Frequency Percent Lack of confidence in service providers 36 11.7 Lack of specific service providers 14 4.5 Impending additional Regulatory Risks 25 8.1 Cost barriers 141 45.8 Other 26 8.4
Total 242 78.6 Missing System 66 21.4 Total 308 100.0
FDA is encouraging companies to adopt newer technologies in making the drugs arrive in market sooner. Which business unit in your organization is rapidly moving ahead in embracing these technologies? (SPSS Table 27) Frequency Percent
R&D 52 16.9 Manufacturing 119 38.6 QC/QA 64 20.8 Regulatory 9 2.9 Marketing, Sales & Distribution 47 15.3 Other 5 1.6
Total 296 96.1 Missing System 12 3.9 Total 308 100.0
Does your organization engage in any of the Process Analytical Technology (PAT) initiatives as recommended by FDA? (SPSS Table 28) Frequency Percent
No 80 26.0 Yes 207 67.2
Total 287 93.2 Missing System 21 6.8 Total 308 100.0
Is any of your business process fully automated with minimum manual intervention? If yes, which business unit does the process belong to? (SPSS Table 29) Frequency Percent
R&D 30 9.7 Manufacturing 141 45.7 QC/QA 51 16.6 Regulatory 11 3.6 Marketing, Sales & Distribution 34 11.0 Other 6 1.9
Total 273 88.6 Missing System 35 11.4 Total 308 100.0

228
Does your organization have manufacturing operations outside India i.e. in more than one base country? (SPSS Table 30) Frequency Percent
No 70 22.7 Yes 225 73.1
Total 295 95.8 Missing System 13 4.2 Total 308 100.0
Which country hosts your central IT infrastructure and support team? (SPSS Table 31) Frequency Percent
India as a Base 267 86.7 Other base Country 22 7.1 Non-base Country i.e. a Country where no manufacturing operations exist hosts IT setup 3 1.0
Total 292 94.8 Missing System 16 5.2 Total 308 100.0
For the IT enablement or the automation of certain business processes, did your organization engage the same service provider for support during regulatory inspections? (SPSS Table 32) Frequency Percent
No 52 16.9 Yes 231 75.0 No 1 .3
Total 284 92.2 Missing System 24 7.8 Total 308 100.0

229
Chi-Square Correlation Tables FDA is encouraging companies to adopt newer technologies in making the drugs arrive in market sooner. Which business unit in your organization is rapidly moving ahead in embracing these technologies? * Primary nature of your company business? (SPSS Table 33)
Primary nature of your company business? Total
Manufacturer Distributor Importer Trader Other R&D Count 49 0 1 0 1 51 % within Primary nature of your company business? 17.3% .0% 100.0% .0% 20.0% 17.3% Manufacturing Count 116 0 0 1 1 118 % within Primary nature of your company business? 40.8% .0% .0% 100.0% 20.0% 40.1% QC/QA Count 63 1 0 0 0 64 % within Primary nature of your company business? 22.2% 33.3% .0% .0% .0% 21.8% Regulatory Count 9 0 0 0 0 9 % within Primary nature of your company business? 3.2% .0% .0% .0% .0% 3.1% Marketing, Sales & Distribution
Count 45 1 0 0 1 47
% within Primary nature of your company business? 15.8% 33.3% .0% .0% 20.0% 16.0% Other Count 2 1 0 0 2 5
FDA is encouraging companies to adopt newer technologies in making the drugs arrive in market sooner. Which business unit in your organization is rapidly moving ahead in embracing these technologies? % within Primary nature of your company business? .7% 33.3% .0% .0% 40.0% 1.7% Total Count 284 3 1 1 5 294 % within Primary nature of your company business? 100.0% 100.0% 100.0% 100.0% 100.0
% 100.0%
Chi-Square Tests
Value Df Asymp. Sig. (2-sided) Pearson Chi-Square 73.147(a) 20 .000 Likelihood Ratio 27.779 20 .115 Linear-by-Linear Association 4.394 1 .036 N of Valid Cases 294
a 25 cells (83.3%) have expected count less than 5. The minimum expected count is .02.
40.1% respondents believe that Manufacturing vertical is the quickest to embrace newer technologies followed by QC/QA
functions with 21.8% responses, R&D at 17.3% and Marketing, Sales and Distribution at 16.0%.

230
If yes, what is the primary reason to engage an IT Service provider? * Your Organization in the current business since? (SPSS Table 35) Your Organization in the current business since? Total
Less
than 5 5 – 10 10 – 20 20 – 30 More
than 30 Lack of man-power in your Organization
Count 0 4 19 1 1 25
% within Your Organization in the current business since? .0% 10.5% 16.7% 1.0% 2.4% 8.3% Lack of specific skills in your Organization
Count 0 1 10 6 2 19
% within Your Organization in the current business since? .0% 2.6% 8.8% 6.1% 4.9% 6.3% To seek expert guidance Count 4 13 24 71 27 139 % within Your Organization in the current business since? 33.3% 34.2% 21.1% 72.4% 65.9% 45.9% For cost benefits Count 7 8 49 9 5 78 % within Your Organization in the current business since? 58.3% 21.1% 43.0% 9.2% 12.2% 25.7% Other Count 1 12 12 11 6 42
If yes, what is the primary reason to engage an IT Service provider?
% within Your Organization in the current business since? 8.3% 31.6% 10.5% 11.2% 14.6% 13.9% Total Count 12 38 114 98 41 303 % within Your Organization in the current business since? 100.0
% 100.0
% 100.0% 100.0% 100.0% 100.0
% Chi-Square Tests
Value Df Asymp. Sig. (2-sided) Pearson Chi-Square 99.322(a) 16 .000 Likelihood Ratio 103.174 16 .000 Linear-by-Linear Association 2.366 1 .124 N of Valid Cases 303
a 8 cells (32.0%) have expected count less than 5. The minimum expected count is .75.
Companies that less than 5 years olds want to engage an IT service provider for cost benefits i.e. 58.3%. on the other
hand a majority of companies that more than 20 years old intend to engage IT service providers – to seek expert
guidance.

231
If yes, what has been your overall satisfaction with the chosen service provider(s) performance? * Your Organization in the current business since? (SPSS Table 36)
Your Organization in the current business since? Total
Less
than 5 5 – 10 10 – 20 20 – 30 More
than 30 Very Satisfactory Count 2 5 30 4 7 48 % within Your Organization in the
current business since? 16.7% 12.8% 26.3% 4.1% 17.1% 15.8%
Satisfactory Count 9 22 71 50 29 181 % within Your Organization in the
current business since? 75.0% 56.4% 62.3% 51.0% 70.7% 59.5%
Could have done better Count 0 12 11 43 4 70 % within Your Organization in the
current business since? .0% 30.8% 9.6% 43.9% 9.8% 23.0%
Below Satisfactory Count 1 0 2 1 1 5
If yes, what has been your overall satisfaction with the chosen service provider(s) performance?
% within Your Organization in the current business since? 8.3% .0% 1.8% 1.0% 2.4% 1.6%
Total Count 12 39 114 98 41 304 % within Your Organization in the
current business since? 100.0% 100.0% 100.0% 100.0% 100.0% 100.0
% Chi-Square Tests Value df Asymp. Sig. (2-sided) Pearson Chi-Square 58.102(a) 12 .000 Likelihood Ratio 61.514 12 .000 Linear-by-Linear Association 2.869 1 .090 N of Valid Cases 304
a 7 cells (35.0%) have expected count less than 5. The minimum expected count is .20.
Companies that are less than 5 year old and companies that are more than 30 year old seem to be satisfied with the
Service Providers performance with 75.0% and 70.7%. Respondents from the companies that are in the year group of 10
– 20 years were found to very satisfactory and satisfied with 26.3% and 62.3% sores respectively.

232
If no service provider(s) was engaged so far, what is the primary reason not to engage with any IT Service provider? * Approximate percentage of automation enabled in your organization? (SPSS Table 42)
Approximate percentage of automation enabled in your
organization? Total
Less than
10% 10 – 30% 30 – 50% 50 – 70% More
than 70% Lack of confidence in service providers
Count 0 10 12 6 7 35
% within Approximate percentage of automation enabled in your organization?
.0% 17.9% 10.2% 18.8% 36.8% 14.8%
Lack of specific service providers
Count 0 3 8 2 0 13
% within Approximate percentage of automation enabled in your organization? .0% 5.4% 6.8% 6.3% .0% 5.5%
Impending additional Regulatory Risks
Count 4 3 13 3 0 23
% within Approximate percentage of automation enabled in your organization?
33.3% 5.4% 11.0% 9.4% .0% 9.7%
Cost barriers Count 6 30 77 18 9 140 % within Approximate percentage of automation
enabled in your organization? 50.0% 53.6% 65.3% 56.3% 47.4% 59.1%
Other Count 2 10 8 3 3 26
If no service provider(s) was engaged so far, what is the primary reason not to engage with any IT Service provider?
% within Approximate percentage of automation enabled in your organization?
16.7% 17.9% 6.8% 9.4% 15.8% 11.0%
Total Count 12 56 118 32 19 237 % within Approximate percentage of automation
enabled in your organization? 100.0% 100.0% 100.0% 100.0% 100.0% 100.0%
Chi-Square Tests
Value df Asymp. Sig. (2-sided) Pearson Chi-Square 29.427(a) 16 .021 Likelihood Ratio 30.361 16 .016 Linear-by-Linear Association 2.972 1 .085 N of Valid Cases 237
a 13 cells (52.0%) have expected count less than 5. The minimum expected count is .66.
59.1% of organizations responded, cost barrier is one of the primary reasons for not engaging any IT Service Provider.
This is an observed trend across all organizations irrespective of the level of automation enabled in the organization.

233
FDA is encouraging companies to adopt newer technologies in making the drugs arrive in market sooner. Which business unit in your organization is rapidly moving ahead in embracing these technologies? * What is the keenness of your organization and/or department in moving from manual operations to automated processes of critical business operations? (SPSS Table 45)
What is the keenness of your organization and/or department in moving from manual operations to
automated processes of critical business operations? Total
Highly
Interested Interested Not
Interested Shall Consider
Later R&D Count 16 26 2 5 49 % within What is the keenness of your organization and/or
department in moving from manual operations to automated processes of critical business operations?
15.5% 16.0% 33.3% 33.3% 17.1%
Manufacturing Count 40 77 0 1 118 % within What is the keenness of your organization and/or
department in moving from manual operations to automated processes of critical business operations?
38.8% 47.2% .0% 6.7% 41.1%
QC/QA Count 26 32 1 3 62 % within What is the keenness of your organization and/or
department in moving from manual operations to automated processes of critical business operations?
25.2% 19.6% 16.7% 20.0% 21.6%
Regulatory Count 2 5 0 1 8 % within What is the keenness of your organization and/or
department in moving from manual operations to automated processes of critical business operations?
1.9% 3.1% .0% 6.7% 2.8%
Marketing, Sales & Distribution
Count 17 21 2 5 45
% within What is the keenness of your organization and/or department in moving from manual operations to automated processes of critical business operations?
16.5% 12.9% 33.3% 33.3% 15.7%
Other Count 2 2 1 0 5
FDA is encouraging companies to adopt newer technologies in making the drugs arrive in market sooner. Which business unit in your organization is rapidly moving ahead in embracing these technologies?
% within What is the keenness of your organization and/or department in moving from manual operations to automated processes of critical business operations?
1.9% 1.2% 16.7% .0% 1.7%
Total Count 103 163 6 15 287 % within What is the keenness of your organization and/or
department in moving from manual operations to automated processes of critical business operations?
100.0% 100.0% 100.0% 100.0% 100.0%

234
Chi-Square Tests
Value df Asymp. Sig. (2-sided) Pearson Chi-Square 27.462(a) 15 .025 Likelihood Ratio 25.839 15 .040 Linear-by-Linear Association .293 1 .588 N of Valid Cases 287
a 15 cells (62.5%) have expected count less than 5. The minimum expected count is .10.
As observed in the earlier tables, it is found that manufacturing vertical is leading in embracing newer technologies and it
the manufacturing department is keener in moving from manual to fully automated processes. 47.2% responded as
Interested and 38.8% responded as highly interested.

235
Is any of your business process fully automated with minimum manual intervention? If yes, which business unit does the process belong to? * What is the keenness of your organization and/or department in moving from manual operations to automated processes of critical business operations? (SPSS Table 47)
What is the keenness of your organization and/or department in moving from manual operations to
automated processes of critical business operations? Total
Highly
Interested Interested Not
Interested
Shall Consider
Later R&D Count 8 20 1 0 29 % within What is the keenness of your organization and/or department in moving
from manual operations to automated processes of critical business operations? 8.2% 13.2% 20.0% .0% 10.9
% Manufacturing Count 43 89 0 6 138 % within What is the keenness of your organization and/or department in moving
from manual operations to automated processes of critical business operations? 44.3% 58.9% .0% 42.9% 51.7
% QC/QA Count 22 22 3 3 50 % within What is the keenness of your organization and/or department in moving
from manual operations to automated processes of critical business operations? 22.7% 14.6% 60.0% 21.4% 18.7
% Regulatory Count 7 3 0 0 10 % within What is the keenness of your organization and/or department in moving
from manual operations to automated processes of critical business operations? 7.2% 2.0% .0% .0% 3.7%
Marketing, Sales & Distribution
Count 15 15 0 4 34
% within What is the keenness of your organization and/or department in moving from manual operations to automated processes of critical business operations?
15.5% 9.9% .0% 28.6% 12.7%
Other Count 2 2 1 1 6
Is any of your business process fully automated with minimum manual intervention? If yes, which business unit does the process belong to?
% within What is the keenness of your organization and/or department in moving from manual operations to automated processes of critical business operations?
2.1% 1.3% 20.0% 7.1% 2.2%
Total Count 97 151 5 14 267 % within What is the keenness of your organization and/or department in moving
from manual operations to automated processes of critical business operations? 100.0% 100.0% 100.0% 100.0% 100.
0% Chi-Square Tests
Value df Asymp. Sig. (2-sided) Pearson Chi-Square 34.523(a) 15 .003 Likelihood Ratio 32.308 15 .006 Linear-by-Linear Association .041 1 .839 N of Valid Cases 267
a 14 cells (58.3%) have expected count less than 5. The minimum expected count is .11.
There is a relationship between keenness in moving from manual operations to automated processes and level of
automation in an organization.

236
Does your organization have manufacturing operations outside India i.e. in more than one base country? * What is the keenness of your organization and/or department in moving from manual operations to automated processes of critical business operations? (SPSS Table 48)
What is the keenness of your organization and/or department in moving from manual
operations to automated processes of critical business operations? Total
Highly
Interested Interested Not
Interested
Shall Consider
Later No Count 17 42 3 7 69 % within What is the keenness of your organization and/or
department in moving from manual operations to automated processes of critical business operations?
16.7% 25.6% 50.0% 50.0% 24.1%
Yes Count 85 122 3 7 217
Does your organization have manufacturing operations outside India i.e. in more than one base country? % within What is the keenness of your organization and/or
department in moving from manual operations to automated processes of critical business operations?
83.3% 74.4% 50.0% 50.0% 75.9%
Total Count 102 164 6 14 286 % within What is the keenness of your organization and/or
department in moving from manual operations to automated processes of critical business operations?
100.0% 100.0% 100.0% 100.0% 100.0%
Chi-Square Tests Value df Asymp. Sig. (2-sided) Pearson Chi-Square 10.612(a) 3 .014 Likelihood Ratio 9.794 3 .020 Linear-by-Linear Association 9.911 1 .002 N of Valid Cases 286
a 3 cells (37.5%) have expected count less than 5. The minimum expected count is 1.45.
There is a relationship between the number of manufacturing locations of an organization and keenness in moving from
manual to automated processes. 83.3% respondents have shown high interest followed by 74.4% was interested moving
from manual to automated processes. Interestingly 50.0% respondents were either not interested or said they shall
consider automation later.

237
Which country hosts your central IT infrastructure and support team? * What is the keenness of your organization and/or department in moving from manual operations to automated processes of critical business operations? (SPSS Table 49)
What is the keenness of your organization and/or department in moving from manual
operations to automated processes of critical business operations? Total
Highly
Interested Interested Not
Interested
Shall Consider
Later India as a Base Count 97 148 3 14 262 % within What is the keenness of your organization and/or
department in moving from manual operations to automated processes of critical business operations?
94.2% 90.8% 50.0% 93.3% 91.3%
Other base Country Count 5 14 2 1 22 % within What is the keenness of your organization and/or
department in moving from manual operations to automated processes of critical business operations?
4.9% 8.6% 33.3% 6.7% 7.7%
Count 1 1 1 0 3
Which country hosts your central IT infrastructure and support team?
Non-base Country i.e. a Country where no manufacturing operations exist hosts IT setup
% within What is the keenness of your organization and/or department in moving from manual operations to automated processes of critical business operations?
1.0% .6% 16.7% .0% 1.0%
Total Count 103 163 6 15 287 % within What is the keenness of your organization and/or
department in moving from manual operations to automated processes of critical business operations?
100.0% 100.0% 100.0% 100.0% 100.0%
Chi-Square Tests
Value df Asymp. Sig. (2-sided) Pearson Chi-Square 22.105(a) 6 .001 Likelihood Ratio 9.988 6 .125 Linear-by-Linear Association 1.828 1 .176 N of Valid Cases 287
a 6 cells (50.0%) have expected count less than 5. The minimum expected count is .06.
Majority of the respondents were from the companies that hosted the IT infrastructure in India. 94.2% have responded as
highly interested and 90.8% have shown interest in moving from manual to automated processes. 93.3% of respondents
have said they would consider the automation later but the number of responses is less at 14.

238
For the IT enablement or the automation of certain business processes, did your organization engage the same service provider for support during regulatory inspections? * What is the keenness of your organization and/or department in moving from manual operations to automated processes of critical business operations? (SPSS Table 50)
What is the keenness of your organization and/or department in moving from manual
operations to automated processes of critical business operations? Total
Highly
Interested Interested Not
Interested
Shall Consider
Later No Count 10 33 1 7 51 % within What is the keenness of your
organization and/or department in moving from manual operations to automated processes of critical business operations?
9.9% 21.2% 20.0% 50.0% 18.5%
Yes Count 91 123 4 7 225
For the IT enablement or the automation of certain business processes, did your organization engage the same service provider for support during regulatory inspections? % within What is the keenness of your
organization and/or department in moving from manual operations to automated processes of critical business operations?
90.1% 78.8% 80.0% 50.0% 81.5%
Total Count 101 156 5 14 276 % within What is the keenness of your
organization and/or department in moving from manual operations to automated processes of critical business operations?
100.0% 100.0% 100.0% 100.0% 100.0%
Chi-Square Tests Value df Asymp. Sig. (2-sided) Pearson Chi-Square 14.916(a) 3 .002 Likelihood Ratio 13.543 3 .004 Linear-by-Linear Association 14.050 1 .000 N of Valid Cases 276
a 3 cells (37.5%) have expected count less than 5. The minimum expected count is .92.
There is a relationship between the Service Providers expertise in audit support and the keenness of the organization to
partner with these service providers by the Life Sciences companies. 90.1% followed by 78.8% have shown good interest
levels whereas few respondents think that they shall consider audit support from their providers later.

239
Primary nature of your company business? * FDA is encouraging companies to adopt newer technologies in making the drugs arrive in market sooner. Which business unit in your organization is rapidly moving ahead in embracing these technologies? (SPSS Table 51)
FDA is encouraging companies to adopt newer technologies in making the drugs arrive in market sooner. Which business unit in your organization is
rapidly moving ahead in embracing these technologies? Total
R&D Manufacturing QC/QA Regulatory
Marketing, Sales &
Distribution Other Manufacturer Count 49 116 63 9 45 2 284 % within FDA is encouraging companies to adopt newer
technologies in making the drugs arrive in market sooner. Which business unit in your organization is rapidly moving ahead in embracing these technologies?
96.1% 98.3% 98.4% 100.0% 95.7% 40.0% 96.6%
Distributor Count 0 0 1 0 1 1 3 % within FDA is encouraging companies to adopt newer
technologies in making the drugs arrive in market sooner. Which business unit in your organization is rapidly moving ahead in embracing these technologies?
.0% .0% 1.6% .0% 2.1% 20.0% 1.0%
Importer Count 1 0 0 0 0 0 1 % within FDA is encouraging companies to adopt newer
technologies in making the drugs arrive in market sooner. Which business unit in your organization is rapidly moving ahead in embracing these technologies?
2.0% .0% .0% .0% .0% .0% .3%
Trader Count 0 1 0 0 0 0 1 % within FDA is encouraging companies to adopt newer
technologies in making the drugs arrive in market sooner. Which business unit in your organization is rapidly moving ahead in embracing these technologies?
.0% .8% .0% .0% .0% .0% .3%
Other Count 1 1 0 0 1 2 5
Primary nature of your company business?
% within FDA is encouraging companies to adopt newer technologies in making the drugs arrive in market sooner. Which business unit in your organization is rapidly moving ahead in embracing these technologies?
2.0% .8% .0% .0% 2.1% 40.0% 1.7%
Total Count 51 118 64 9 47 5 294 % within FDA is encouraging companies to adopt newer
technologies in making the drugs arrive in market sooner. Which business unit in your organization is rapidly moving ahead in embracing these technologies?
100.0% 100.0% 100.0
% 100.0% 100.0% 100.0% 100.0%

240
Chi-Square Tests
Value df Asymp. Sig. (2-sided) Pearson Chi-Square 73.147(a) 20 .000 Likelihood Ratio 27.779 20 .115 Linear-by-Linear Association 4.394 1 .036 N of Valid Cases 294
a 25 cells (83.3%) have expected count less than 5. The minimum expected count is .02.
Majority of the respondents were from the companies that involved in manufacturing of Life Sciences products. Depending
on the primary nature of the company’s business, it is observed that Regulatory, QC/QA and Manufacturing departments
are front runners in embracing newer technologies in the manufacturing of Life Sciences products.

241
Your Organization in the current business since? * FDA is encouraging companies to adopt newer technologies in making the drugs arrive in market sooner. Which business unit in your organization is rapidly moving ahead in embracing these technologies? (SPSS Table 52)
FDA is encouraging companies to adopt newer technologies in making the drugs arrive in market sooner. Which business unit in your
organization is rapidly moving ahead in embracing these technologies? Total
R&D Manufact
uring QC/QA Regulatory
Marketing, Sales &
Distribution Other Less than 5 Count 1 0 2 0 8 0 11 % within FDA is encouraging companies to adopt newer
technologies in making the drugs arrive in market sooner. Which business unit in your organization is rapidly moving ahead in embracing these technologies?
1.9% .0% 3.1% .0% 17.4% .0% 3.8%
5 – 10 Count 11 12 7 1 5 1 37 % within FDA is encouraging companies to adopt newer
technologies in making the drugs arrive in market sooner. Which business unit in your organization is rapidly moving ahead in embracing these technologies?
21.2% 10.2% 10.9% 12.5% 10.9% 20.0% 12.6%
10 – 20 Count 19 21 46 6 21 1 114 % within FDA is encouraging companies to adopt newer
technologies in making the drugs arrive in market sooner. Which business unit in your organization is rapidly moving ahead in embracing these technologies?
36.5% 17.8% 71.9% 75.0% 45.7% 20.0% 38.9%
20 – 30 Count 8 74 2 0 7 1 92 % within FDA is encouraging companies to adopt newer
technologies in making the drugs arrive in market sooner. Which business unit in your organization is rapidly moving ahead in embracing these technologies?
15.4% 62.7% 3.1% .0% 15.2% 20.0% 31.4%
More than 30
Count 13 11 7 1 5 2 39
Your Organization in the current business since?
% within FDA is encouraging companies to adopt newer technologies in making the drugs arrive in market sooner. Which business unit in your organization is rapidly moving ahead in embracing these technologies?
25.0% 9.3% 10.9% 12.5% 10.9% 40.0% 13.3%
Total Count 52 118 64 8 46 5 293 % within FDA is encouraging companies to adopt newer
technologies in making the drugs arrive in market sooner. Which business unit in your organization is rapidly moving ahead in embracing these technologies?
100.0% 100.0% 100.0% 100.0% 100.0% 100.0
% 100.0
%

242
Chi-Square Tests
Value df Asymp. Sig. (2-sided) Pearson Chi-Square 141.261(a) 20 .000 Likelihood Ratio 139.228 20 .000 Linear-by-Linear Association 12.575 1 .000 N of Valid Cases 293
a 14 cells (46.7%) have expected count less than 5. The minimum expected count is .19.
It is observed that the age of the company has a definite relationship on aligning to the FDA expectations better.
Companies that are in the age group of 10 – 30 years have shown maximum interest.

243
Approximate percentage of automation enabled in your organization? * FDA is encouraging companies to adopt newer technologies in making the drugs arrive in market sooner. Which business unit in your organization is rapidly moving ahead in embracing these technologies? (SPSS Table 53)
FDA is encouraging companies to adopt newer technologies in making the drugs arrive in market sooner. Which business unit
in your organization is rapidly moving ahead in embracing these technologies? Total
R&D Manufacturing QC/QA
Regulatory
Marketing, Sales &
Distribution Other Less than 10%
Count 1 8 6 0 1 1 17
% within FDA is encouraging companies to adopt newer technologies in making the drugs arrive in market sooner. Which business unit in your organization is rapidly moving ahead in embracing these technologies?
2.0% 6.9% 9.5% .0% 2.1% 25.0% 5.9%
10 – 30% Count 10 66 6 1 10 0 93 % within FDA is encouraging companies to adopt newer technologies in
making the drugs arrive in market sooner. Which business unit in your organization is rapidly moving ahead in embracing these technologies?
19.6% 56.9% 9.5% 11.1% 21.3% .0% 32.1%
30 – 50% Count 25 29 30 6 30 1 121 % within FDA is encouraging companies to adopt newer technologies in
making the drugs arrive in market sooner. Which business unit in your organization is rapidly moving ahead in embracing these technologies?
49.0% 25.0% 47.6% 66.7% 63.8% 25.0% 41.7%
50 – 70% Count 9 12 10 1 4 2 38 % within FDA is encouraging companies to adopt newer technologies in
making the drugs arrive in market sooner. Which business unit in your organization is rapidly moving ahead in embracing these technologies?
17.6% 10.3% 15.9% 11.1% 8.5% 50.0% 13.1%
More than 70%
Count 6 1 11 1 2 0 21
Approximate percentage of automation enabled in your organization?
% within FDA is encouraging companies to adopt newer technologies in making the drugs arrive in market sooner. Which business unit in your organization is rapidly moving ahead in embracing these technologies?
11.8% .9% 17.5% 11.1% 4.3% .0% 7.2%
Total Count 51 116 63 9 47 4 290 % within FDA is encouraging companies to adopt newer technologies in
making the drugs arrive in market sooner. Which business unit in your organization is rapidly moving ahead in embracing these technologies?
100.0%
100.0%
100.0%
100.0%
100.0% 100.0%
100.0%

244
Chi-Square Tests
Value df Asymp. Sig. (2-sided) Pearson Chi-Square 87.047(a) 20 .000 Likelihood Ratio 89.195 20 .000 Linear-by-Linear Association 1.515 1 .218 N of Valid Cases 290
a 16 cells (53.3%) have expected count less than 5. The minimum expected count is .23.
It is observed that the percentage of automation enabled in an organization is dependent on the overall maturity of the
organization in embracing newer technologies.

245
Does your organization engage any IT service provider to help your company in business operations? * FDA is encouraging companies to adopt newer technologies in making the drugs arrive in market sooner. Which business unit in your organization is rapidly moving ahead in embracing these technologies? (SPSS Table 57)
FDA is encouraging companies to adopt newer technologies in making the drugs arrive in market sooner. Which business unit
in your organization is rapidly moving ahead in embracing these technologies? Total
R&D Manufacturing QC/QA
Regulatory
Marketing, Sales &
Distribution Other No Count 6 6 8 2 2 3 27 % within FDA is encouraging companies to adopt newer technologies in making
the drugs arrive in market sooner. Which business unit in your organization is rapidly moving ahead in embracing these technologies?
12.2% 5.1% 12.5% 22.2% 4.5% 60.0% 9.4%
Yes Count 43 111 56 7 42 2 261
Does your organization engage any IT service provider to help your company in business operations?
% within FDA is encouraging companies to adopt newer technologies in making the drugs arrive in market sooner. Which business unit in your organization is rapidly moving ahead in embracing these technologies? 87.8% 94.9% 87.5% 77.8% 95.5% 40.0% 90.6%
Total Count 49 117 64 9 44 5 288 % within FDA is encouraging companies to adopt newer technologies in making
the drugs arrive in market sooner. Which business unit in your organization is rapidly moving ahead in embracing these technologies?
100.0%
100.0%
100.0%
100.0%
100.0% 100.0%
100.0%
Chi-Square Tests Value df Asymp. Sig. (2-sided) Pearson Chi-Square 21.733(a) 5 .001 Likelihood Ratio 14.681 5 .012 Linear-by-Linear Association 1.027 1 .311 N of Valid Cases
288
a 5 cells (41.7%) have expected count less than 5. The minimum expected count is .47.
Overall 90.6% of respondents agreed that their organization engages IT Service Providers for help in their business
operations. Also, there is a relationship between external support from IT Service Provider and the organizations maturity
in embracing newer technologies.

246
Does your organization engage any IT service provider to help your company in business operations? * What is the keenness of your organization and/or department in moving from manual operations to automated processes of critical business operations? (SPSS Table 58)
What is the keenness of your organization and/or department in moving from manual operations to
automated processes of critical business operations? Total
Highly
Interested Interested Not
Interested
Shall Consider
Later No Count 8 14 2 5 29 % within What is the keenness of your organization and/or
department in moving from manual operations to automated processes of critical business operations?
7.8% 8.4% 40.0% 33.3% 10.1%
Yes Count 94 152 3 10 259
Does your organization engage any IT service provider to help your company in business operations?
% within What is the keenness of your organization and/or department in moving from manual operations to automated processes of critical business operations?
92.2% 91.6% 60.0% 66.7% 89.9%
Total Count 102 166 5 15 288 % within What is the keenness of your organization and/or
department in moving from manual operations to automated processes of critical business operations?
100.0% 100.0% 100.0% 100.0% 100.0%
Chi-Square Tests Value df Asymp. Sig. (2-sided) Pearson Chi-Square 14.960(a) 3 .002 Likelihood Ratio 10.189 3 .017 Linear-by-Linear Association 8.394 1 .004 N of Valid Cases
288
a 3 cells (37.5%) have expected count less than 5. The minimum expected count is .50.
Overall 89.9% of respondents agreed that their organization engages IT Service Providers for help in their business
operations. Also, there is a relationship between external support from IT Service Provider and the organizations
keenness in moving from manual to automated processes.

247
FDA is encouraging companies to adopt newer technologies in making the drugs arrive in market sooner. Which business unit in your organization is rapidly moving ahead in embracing these technologies? * Approximate percentage of automation enabled in your organization? (SPSS Table 63)
Approximate percentage of automation enabled in your
organization? Total
Less than
10% 10 – 30% 30 – 50% 50 – 70% More
than 70% R&D Count 1 10 25 9 6 51 % within Approximate percentage of automation
enabled in your organization? 5.9% 10.8% 20.7% 23.7% 28.6% 17.6%
Manufacturing Count 8 66 29 12 1 116 % within Approximate percentage of automation
enabled in your organization? 47.1% 71.0% 24.0% 31.6% 4.8% 40.0%
QC/QA Count 6 6 30 10 11 63 % within Approximate percentage of automation
enabled in your organization? 35.3% 6.5% 24.8% 26.3% 52.4% 21.7%
Regulatory Count 0 1 6 1 1 9 % within Approximate percentage of automation
enabled in your organization? .0% 1.1% 5.0% 2.6% 4.8% 3.1%
Marketing, Sales & Distribution Count 1 10 30 4 2 47 % within Approximate percentage of automation
enabled in your organization? 5.9% 10.8% 24.8% 10.5% 9.5% 16.2%
Other Count 1 0 1 2 0 4
FDA is encouraging companies to adopt newer technologies in making the drugs arrive in market sooner. Which business unit in your organization is rapidly moving ahead in embracing these technologies?
% within Approximate percentage of automation enabled in your organization?
5.9% .0% .8% 5.3% .0% 1.4%
Total Count 17 93 121 38 21 290 % within Approximate percentage of automation
enabled in your organization? 100.0% 100.0% 100.0% 100.0% 100.0% 100.0
% Chi-Square Tests
Value df Asymp. Sig. (2-sided) Pearson Chi-Square 87.047(a) 20 .000 Likelihood Ratio 89.195 20 .000 Linear-by-Linear Association 1.515 1 .218 N of Valid Cases 290
a 16 cells (53.3%) have expected count less than 5. The minimum expected count is .23.
Manufacturing department is the quickest in embracing newer technologies.

248
Does your organization engage any IT service provider to help your company in business operations? * Primary nature of your company business? (SPSS Table 64)
Primary nature of your company business? Total
Manufacturer Distributor Importer Trader Other Does your organization engage any IT service provider to help your company in business operations?
No Count
26 0 0 0 3 29
% within Primary nature of your company business? 9.2% .0% .0% .0% 50.0% 9.9%
Yes Count 257 3 1 1 3 265 % within Primary nature of
your company business? 90.8% 100.0% 100.0% 100.0% 50.0% 90.1%
Total Count 283 3 1 1 6 294 % within Primary nature of
your company business? 100.0% 100.0% 100.0% 100.0% 100.0% 100.0%
Chi-Square Tests
Value df Asymp. Sig. (2-sided) Pearson Chi-Square 11.564(a) 4 .021 Likelihood Ratio 7.390 4 .117 Linear-by-Linear Association
8.308 1 .004
N of Valid Cases 294
a 7 cells (70.0%) have expected count less than 5. The minimum expected count is .10.
Primary nature of a company’s business was used to determine aspect of their company’s engagement with a third-party
IT service provider’. The frequency and percentage distribution shows that the high percentage (90.8%) is in the
Manufacturing group.

249
If yes, what is the primary reason to engage an IT Service provider? * Primary nature of your company business? (SPSS Table 65) Primary nature of your company business? Total Manufacturer Distributor Importer Trader Other
Lack of man-power in your Organization
Count 25 0 0 0 0 25
% within Primary nature of your company business? 8.5% .0% .0% .0% .0% 8.2% Lack of specific skills in your Organization
Count 19 0 0 0 0 19
% within Primary nature of your company business? 6.5% .0% .0% .0% .0% 6.3% To seek expert guidance
Count 137 0 0 0 1 138
% within Primary nature of your company business? 46.8% .0% .0% .0% 16.7% 45.4% For cost benefits Count 74 3 1 1 1 80 % within Primary nature of your company business? 25.3% 100.0% 100.0% 100.0% 16.7% 26.3% Other Count 38 0 0 0 4 42
If yes, what is the primary reason to engage an IT Service provider?
% within Primary nature of your company business? 13.0% .0% .0% .0% 66.7% 13.8% Total Count 293 3 1 1 6 304 % within Primary nature of your company business? 100.0% 100.0% 100.0% 100.0% 100.0
% 100.0%
Chi-Square Tests
Value df Asymp. Sig. (2-sided) Pearson Chi-Square 28.759(a) 16 .026 Likelihood Ratio 23.483 16 .101 Linear-by-Linear Association 9.348 1 .002 N of Valid Cases 304
a 20 cells (80.0%) have expected count less than 5. The minimum expected count is .06.
A majority of the respondents i.e. 45.4% of respondents say that the primary reason to engage an external IT service
provider is - to seek expert guidance, followed by 26.3% for cost benefits. 6.3% respondents feel they engage with external
IT service providers due to lack of specific skills in their own organization.

250
If yes, what has been your overall satisfaction with the chosen service provider(s) performance? * Primary nature of your company business? (SPSS Table 66)
Primary nature of your company business? Total
Manufacturer Distributor Importer Trader Other Very Satisfactory Count 45 2 1 0 1 49 % within Primary nature of your company business? 15.3% 66.7% 100.0% .0% 16.7% 16.1% Satisfactory Count 174 1 0 1 5 181 % within Primary nature of your company business? 59.2% 33.3% .0% 100.0% 83.3% 59.3% Could have done better
Count 70 0 0 0 0 70
% within Primary nature of your company business? 23.8% .0% .0% .0% .0% 23.0% Below Satisfactory Count 5 0 0 0 0 5
If yes, what has been your overall satisfaction with the chosen service provider(s) performance?
% within Primary nature of your company business? 1.7% .0% .0% .0% .0% 1.6%
Total Count 294 3 1 1 6 305 % within Primary nature of your company business? 100.0% 100.0% 100.0% 100.0% 100.0
% 100.0%
Chi-Square Tests Value df Asymp. Sig. (2-sided) Pearson Chi-Square 14.037(a) 12 .298 Likelihood Ratio 12.916 12 .375 Linear-by-Linear Association 2.238 1 .135 N of Valid Cases 305
a 17 cells (85.0%) have expected count less than 5. The minimum expected count is .02.
Primary nature of a company’s business was used to determine aspect of satisfaction levels with the external IT
Service providers engaged. The frequency and percentage distribution shows that the high percentage (59.3%) was
satisfied with the service providers’ performance followed by 16.1% being very satisfied. A good 23.0% of respondents felt
that the service provider could have done a better job and 1.6% respondents rate the performance as below satisfactory.

251
If no service provider(s) was engaged so far, what is the primary reason not to engage with any IT Service provider? * Primary nature of your company business? (SPSS Table 67)
Primary nature of your company business? Total
Manufacturer Distributor Importer Trader Other Lack of confidence in service providers
Count 34 1 0 1 0 36
% within Primary nature of your company business? 14.8% 33.3% .0% 100.0% .0% 15.0% Lack of specific service providers
Count 13 0 0 0 1 14
% within Primary nature of your company business? 5.7% .0% .0% .0% 16.7% 5.8% Impending additional Regulatory Risks
Count 24 0 0 0 0 24
% within Primary nature of your company business? 10.5% .0% .0% .0% .0% 10.0% Cost barriers Count 136 1 0 0 3 140 % within Primary nature of your company business? 59.4% 33.3% .0% .0% 50.0% 58.3% Other Count 22 1 1 0 2 26
If no service provider(s) was engaged so far, what is the primary reason not to engage with any IT Service provider? % within Primary nature of your company business? 9.6% 33.3% 100.0% .0% 33.3% 10.8% Total Count 229 3 1 1 6 240 % within Primary nature of your company business? 100.0% 100.0% 100.0% 100.0% 100.0
% 100.0%
Chi-Square Tests
Value df Asymp. Sig. (2-sided) Pearson Chi-Square 22.778(a) 16 .120 Likelihood Ratio 17.075 16 .381 Linear-by-Linear Association .386 1 .535 N of Valid Cases 240
a 20 cells (80.0%) have expected count less than 5. The minimum expected count is .06.
58.3% of respondents opine that Cost barriers have been a factor for not engaging with external service provider(s) so far
followed by lack of confidence in service provider’s capabilities with 15.0% response. This demonstrates that the service
providers should have strong capabilities that can be demonstrated with references and be cost effective at the same
time.

252
Does your organization engage in any of the Process Analytical Technology (PAT) initiatives as recommended by FDA? * Primary nature of your company business? (SPSS Table 68)
Primary nature of your company business? Total
Manufacturer Distributor Importer Trader Other No Count 74 1 0 1 4 80 % within Primary nature of
your company business? 26.9% 33.3% .0% 100.0% 80.0% 28.1%
Yes Count 201 2 1 0 1 205
Does your organization engage in any of the Process Analytical Technology (PAT) initiatives as recommended by FDA?
% within Primary nature of your company business? 73.1% 66.7% 100.0% .0% 20.0% 71.9%
Total Count 275 3 1 1 5 285 % within Primary nature of
your company business? 100.0% 100.0% 100.0% 100.0% 100.0% 100.0%
Chi-Square Tests
Value df Asymp. Sig. (2-sided) Pearson Chi-Square 9.856(a) 4 .043 Likelihood Ratio 9.243 4 .055 Linear-by-Linear Association 8.191 1 .004 N of Valid Cases 285
a 8 cells (80.0%) have expected count less than 5. The minimum expected count is .28.
When asked on the participation of PAT initiatives, 73.1% of respondents from manufacturing companies have responded
positively and 26.9% have responded as no active participation.

253
Does your organization engage any IT service provider to help your company in business operations? * Approximate percentage of automation enabled in your organization? (SPSS Table 69)
Approximate percentage of automation enabled in your
organization? Total
Less than
10% 10 – 30%
30 – 50%
50 – 70%
More than 70%
No Count 3 9 8 4 4 28 % within Approximate percentage
of automation enabled in your organization?
16.7% 9.7% 6.7% 10.5% 17.4% 9.6%
Yes Count 15 84 111 34 19 263
Does your organization engage any IT service provider to help your company in business operations? % within Approximate percentage
of automation enabled in your organization?
83.3% 90.3% 93.3% 89.5% 82.6% 90.4%
Total Count 18 93 119 38 23 291 % within Approximate percentage
of automation enabled in your organization?
100.0% 100.0% 100.0% 100.0% 100.0% 100.0%
Chi-Square Tests
Value df Asymp. Sig. (2-sided) Pearson Chi-Square 3.810(a) 4 .432 Likelihood Ratio 3.489 4 .480 Linear-by-Linear Association .070 1 .791 N of Valid Cases 291
a 3 cells (30.0%) have expected count less than 5. The minimum expected count is 1.73.
It should be noted that companies that have more than 10 – 70% automation are very keen in engaging IT service
provider to help their business operations.

254
How does your organization and/or department remain abreast with ever changing compliance requirements? * FDA is encouraging companies to adopt newer technologies in making the drugs arrive in market sooner. Which business unit in your organization is rapidly moving ahead in embracing these technologies? (SPSS Table 70)
FDA is encouraging companies to adopt newer technologies in making the drugs arrive in market sooner. Which business unit in
your organization is rapidly moving ahead in embracing these technologies? Total
R&D Manufact
uring QC/QA Regula
tory
Marketing, Sales &
Distribution Other Internal Training and Development
Count 12 59 15 2 9 2 99
% within FDA is encouraging companies to adopt newer technologies in making the drugs arrive in market sooner. Which business unit in your organization is rapidly moving ahead in embracing these technologies?
25.0% 50.0% 23.8% 22.2% 20.0% 40.0% 34.4%
Robust Best Practices Frameworks
Count 2 1 3 0 2 0 8
% within FDA is encouraging companies to adopt newer technologies in making the drugs arrive in market sooner. Which business unit in your organization is rapidly moving ahead in embracing these technologies?
4.2% .8% 4.8% .0% 4.4% .0% 2.8%
Align to Clients Methodologies
Count 1 2 2 0 2 0 7
% within FDA is encouraging companies to adopt newer technologies in making the drugs arrive in market sooner. Which business unit in your organization is rapidly moving ahead in embracing these technologies?
2.1% 1.7% 3.2% .0% 4.4% .0% 2.4%
All 3 above Count 33 56 43 7 32 3 174
How does your organization and/or department remain abreast with ever changing compliance requirements?
% within FDA is encouraging companies to adopt newer technologies in making the drugs arrive in market sooner. Which business unit in your organization is rapidly moving ahead in embracing these technologies?
68.8% 47.5% 68.3% 77.8% 71.1% 60.0% 60.4%
Total Count 48 118 63 9 45 5 288 % within FDA is encouraging companies to adopt newer
technologies in making the drugs arrive in market sooner. Which business unit in your organization is rapidly moving ahead in embracing these technologies?
100.0%
100.0% 100.0%
100.0%
100.0% 100.0%
100.0%

255
Chi-Square Tests
Value df Asymp. Sig. (2-sided) Pearson Chi-Square 25.734(a) 15 .041 Likelihood Ratio 26.663 15 .032 Linear-by-Linear Association 3.758 1 .053 N of Valid Cases
288
a 15 cells (62.5%) have expected count less than 5. The minimum expected count is .12.
Life Sciences companies remain abreast with ever changing regulations by leveraging internal training and development,
robust best practices frameworks and align to proven methodologies. On expected lines, regulatory department is the
front runner in embracing newer technologies in being abreast with industry regulations.

256
If no service provider(s) was engaged so far, what is the primary reason not to engage with any IT Service provider? * What is the keenness of your organization and/or department in moving from manual operations to automated processes of critical business operations? (SPSS Table 71)
What is the keenness of your organization and/or department in moving from manual
operations to automated processes of critical business operations? Total
Highly
Interested Interes
ted
Not Interest
ed
Shall Consider
Later Lack of confidence in service providers
Count 15 19 0 1 35
% within What is the keenness of your organization and/or department in moving from manual operations to automated processes of critical business operations?
16.0% 16.0% .0% 7.1% 15.0%
Lack of specific service providers
Count 3 8 0 2 13
% within What is the keenness of your organization and/or department in moving from manual operations to automated processes of critical business operations? 3.2% 6.7% .0% 14.3% 5.6%
Impending additional Regulatory Risks
Count 9 13 0 2 24
% within What is the keenness of your organization and/or department in moving from manual operations to automated processes of critical business operations?
9.6% 10.9% .0% 14.3% 10.3%
Cost barriers Count 60 66 4 6 136 % within What is the keenness of your organization and/or department in moving
from manual operations to automated processes of critical business operations? 63.8% 55.5% 66.7% 42.9% 58.4%
Other Count 7 13 2 3 25
If no service provider(s) was engaged so far, what is the primary reason not to engage with any IT Service provider? % within What is the keenness of your organization and/or department in moving
from manual operations to automated processes of critical business operations? 7.4% 10.9% 33.3% 21.4% 10.7%
Total Count 94 119 6 14 233 % within What is the keenness of your organization and/or department in moving
from manual operations to automated processes of critical business operations? 100.0% 100.0%
100.0% 100.0% 100.0%
Chi-Square Tests Value df Asymp. Sig. (2-sided) Pearson Chi-Square 12.608(a) 12 .398 Likelihood Ratio 12.943 12 .373 Linear-by-Linear Association .436 1 .509 N of Valid Cases 233
a 9 cells (45.0%) have expected count less than 5. The minimum expected count is .33.
Cost barrier is one of the primary reasons not to engage any external Service Provider. 58.4% respondents provided
agreement to the same understanding.

257
Frequency Tables – Information Technology Role (SPSS Table 72)
Frequency Percent Developer / Team Member / Business Analyst 151 35.6 Senior Developer / Consultant / Senior Business Analyst 196 46.2 Account Manager / Project Manager / Managing Consultant /
SME / Architect 47 11.1
Account Executive / Program Manager / Senior Managing Consultant / Chief Architect 15 3.5
Business Unit Head / Partner 6 1.4 CXO 0 0
Other 0 0 Total 415 97.9 Missing System 9 2.1 Total 424 100.0
Tenure in current organization (SPSS Table 73)
Frequency Percent 0 – 2 years 279 65.8 3 – 5 years 89 21.0 6 -10 years 41 9.7 Over 10 years 10 2.4
Total 419 98.8 Missing System 5 1.2 Total 424 100.0
Overall IT Experience (SPSS Table 74)
Frequency Percent 0 – 2 years 75 17.7 3 – 5 years 141 33.3 5 – 8 years 114 26.9 8 – 12 years 53 12.5 Over 12 years 32 7.5
Total 415 97.9 Missing System 9 2.1 Total 424 100.0

258
Primary nature of your company business? (SPSS Table 75)
Frequency Percent IT and IT Enabled Services 339 80.0
BPO / KPO 8 1.9 Consulting 56 13.2 Product Development 6 1.4 Other 2 .5
Total 411 96.9 Missing System 13 3.1 Total 424 100.0
Core market areas that your business focuses upon? (SPSS Table 76)
Frequency Percent India Only 4 .9 India, US, EU 44 10.4 India and ASEAN Countries 2 .5 Global 366 86.3
Total 416 98.1 Missing System 8 1.9 Total 424 100.0
Organization in the current business? (SPSS Table 77)
Frequency Percent Less than 5 years 18 4.2 5 – 10 years 26 6.1 10 – 20 years 28 6.6 20 – 30 years 13 3.1 More than 30 years 333 78.5
Total 418 98.6 Missing System 6 1.4 Total 424 100.0

259
Which industry does your organization’s primarily focus upon in the below list? (SPSS Table 78)
Frequency Percent Life Sciences 148 34.9 Medical Devices 4 .9 Healthcare 0 0 Government and Medical Institutions 7 1.7 Clinical Research 2 .5 Other 223 52.6
Total 384 90.6 Missing System 40 9.4 Total 424 100.0
Number of projects completed successfully in the above mentioned industry? (SPSS Table 79)
Frequency Percent Less than 10 111 26.2 10 – 30 46 10.8 30 – 50 18 4.2 50 – 70 9 2.1 More than 70 227 53.5
Total 411 96.9 Missing System 13 3.1 Total 424 100.0
Total head count in your organization? (SPSS Table 80)
Frequency Percent Less than 500 21 5.0 500 – 5000 15 3.5 5000 – 20000 11 2.6 20000 – 50000 12 2.8 More than 50000 357 84.2
Total 416 98.1 Missing System 8 1.9 Total 424 100.0

260
Approximately, what has been your organization involvement in engaging with the client in the above projects? (SPSS Table 81)
Frequency Percent Less than 10% 17 4.0 10 – 30% 38 9.0 30 – 50% 34 8.0 50 – 70% 77 18.2 More than 70% 235 55.4
Total 401 94.6 Missing System 23 5.4 Total 424 100.0
Which department/operations in the industry have been primarily associated? (SPSS Table 82) Frequency Percent
R&D, Manufacturing, QC/QA 107 25.2 Sales & Distribution 67 15.8 Clinical Research 16 3.8 Product Development 71 16.7 Other 101 23.8
Total 362 85.4 Missing System 62 14.6 Total 424 100.0
Where do you position your organization in your service capabilities? (SPSS Table 83)
Frequency Percent Level 1 – Business Specific Solutions 94 22.2 Level 2 – Solutions to Integrate Multiple Functional Areas 71 16.7 Level 3 – Well Integrated Enterprise Applications viz. Business Intelligence 75 17.7
Level 4 – IT Setup to Automate Entire Organization 148 34.9 Other 16 3.8
Total 404 95.3 Missing System 20 4.7 Total 424 100.0

261
Majorly clients in which geography have been associated with? (SPSS Table 84)
Frequency Percent To Hire Industry Professionals 21 5.0 Internal Workshops / Training 16 3.8 Understand pain-points from clients and prepare suitable solutions 15 3.5 All 3 above 352 83.0 Other 1 .2
Total 405 95.5 Missing System 19 4.5 Total 424 100.0
Does your organization hire and retain core Subject Matter Experts and Industry professionals catering to that specific industry? (SPSS Table 85)
Frequency Percent No 30 7.1 Yes 372 87.7
Total 402 94.8 Missing System 22 5.2 Total 424 100.0
Based on your experience, what kinds of projects were difficult to win and manage? (SPSS Table 86)
Frequency Percent Application Development 57 13.4 Application Maintenance 59 13.9 Strategic Consulting 101 23.8 New Customized Product Development 129 30.4 Other 8 1.9
Total 354 83.5 Missing System 70 16.5 Total 424 100.0
Where do you differentiate your organization from the competition in IT industry? (SPSS Table 87)
Frequency Percent Thought Leadership 57 13.4 Research & Innovation Based Solutions 122 28.8 People Skills Availability 48 11.3 Global Reach 102 24.1 Business and Industry Expertise 75 17.7
Total 404 95.3 Missing System 20 4.7 Total 424 100.0

262
What is driving industry clients to reach out to your organization? (SPSS Table 88)
Frequency Percent Requirement of Innovative Business Models 115 27.1 Streamlining IT Enabled Operations 87 20.5 Managing IT Regulatory Compliance Better 71 16.7 Cost Benefits 63 14.9 Other 47 11.1
Total 383 90.3 Missing System 41 9.7 Total 424 100.0
Does the offshore/outsource model adopted by your organization impact client’s customer care? (SPSS Table 89)
Frequency Percent No 165 38.9 Yes 238 56.1
Total 403 95.0 Missing System 21 5.0 Total 424 100.0
Does the offshore/outsource model adopted by your organization impact client’s product release? (SPSS Table 90)
Frequency Percent No 193 45.5 Yes 209 49.3
Total 402 94.8 Missing System 22 5.2 Total 424 100.0
Does the offshore/outsource model adopted by your organization impact client’s core business operations? (SPSS Table 91)
Frequency Percent No 168 39.6 Yes 230 54.2
Total 398 93.9 Missing System 26 6.1 Total 424 100.0

263
During the course of engagements with clients, how tough was meeting the regulatory compliance mandates? (SPSS Table 92)
Frequency Percent No impact 152 35.8 Could have done better 154 36.3 Tough 89 21.0
Total 395 93.2 Missing System 29 6.8 Total 424 100.0
What is the biggest challenge your organization perceives while approaching clients in specific industry? (SPSS Table 93)
Frequency Percent Conservativeness towards offshore/outsourcing 63 14.9 Ensure consistency in meeting impending regulations 60 14.2 Switch over to automation is perceived to be tough by clients 45 10.6 Building client confidence for effective delivery 191 45.0 Other 11 2.6
Total 370 87.3 Missing System 54 12.7 Total 424 100.0
What do you hear the most from your clients while adopting IT automation? (SPSS Table 94)
Frequency Percent Innovation 122 28.8 Globalization Efforts 90 21.2 Cost and Revenue Pressure 128 30.2 Regulatory and Societal Pressures Intensifying 32 7.5 Other 15 3.5
Total 387 91.3 Missing System 37 8.7 Total 424 100.0
Were there cases, wherein your organization and/or department was engaged in Support and Development projects and compliance attributes were managed by either client and/or other third party? (SPSS Table 95)
Frequency Percent No 108 25.5 Yes 276 65.1
Total 384 90.6 Missing System 40 9.4 Total 424 100.0

264
What are the primary challenges which need to be overcome by clients in emerging markets? (SPSS Table 96)
Frequency Percent Patents and Related Regulations 54 12.7 Price Controls 58 13.7 Weak Infrastructure 24 5.7 Forex Movements & Political Risks 10 2.4 All of the above 244 57.5
Total 390 92.0 Missing System 34 8.0 Total 424 100.0
FDA is encouraging clients to adopt newer technologies in making the drugs arrive in market sooner and improve healthcare efficiency. Did your organization directly involve in any of these initiatives and supported your esteemed clients? (SPSS Table 97)
Frequency Percent No 125 29.5 Yes 247 58.3
Total 372 87.7 Missing System 52 12.3 Total 424 100.0
Does your organization partner with other Third-Party Service Providers to provide niche services to your clients? (SPSS Table 98)
Frequency Percent No 90 21.2 Yes 298 70.3
Total 388 91.5 Missing System 36 8.5 Total 424 100.0
Has your organization build any industry specific solutions as part of the regulatory agencies requirements e.g. Promotional Spend Compliance (PSC), Process Analytical Technology (PAT) or is in the process of building them? (SPSS Table 99)
Frequency Percent No 79 18.6 Yes 301 71.0
Total 380 89.6 Missing System 44 10.4 Total 424 100.0

265
The below findings attempt to draw socio-demographic profile of respondents
covered in the study. It includes Profile of the respondents and their thought
process along with their decision making activities towards approaching offshore
outsourcing.
Role of Respondent (SPSS Table 100) Frequency Percent Developer / Team Member / Business Analyst 151 35.6 Senior Developer / Consultant / Senior Business Analyst 196 46.2 Account Manager / Project Manager / Managing Consultant /
SME / Architect 47 11.1
Account Executive / Program Manager / Senior Managing Consultant / Chief Architect 15 3.5
Business Unit Head / Partner 6 1.4 CXO 0 0
Other 0 0 Total 415 97.9 Missing System 9 2.1 Total 424 100.0
Role of respondents has been used to determine aspect of ‘The role they
perform in an Organization. The frequency and percentage distribution for role
show that the highest percentage (46.2%) is in the group of Senior Developer /
Consultant / Senior Business Analyst followed by Developer / Team Member /
Business Analyst which is (35.6%). Account Manager / Project Manager /
Managing Consultant / SME / Architect category who are considered to be in the
middle management and offshore outsourcing influencers have responded with
11.1%.
Tenure in current organization (SPSS Table 101) Frequency Percent
0 – 2 years 279 65.8 3 – 5 years 89 21.0 6 -10 years 41 9.7 Over 10 years 10 2.4
Total 419 98.8 Missing System 5 1.2 Total 424 100.0

266
Tenure of respondents has been used to determine aspect of ‘Time spent in a
particular Organization’. The frequency and percentage distribution for
tenure in current organization show that the highest percentage (65.8%) is in
the year group of 0 – 2 years followed by 3 – 5 years which is (21.0%).
Respondents who have spent more than 6 – 10 years were 9.7%, followed by
more than 10 years with 2.4%.
Overall IT Experience (SPSS Table 102) Frequency Percent
0 – 2 years 75 17.7 3 – 5 years 141 33.3 5 – 8 years 114 26.9 8 – 12 years 53 12.5 Over 12 years 32 7.5
Total 415 97.9 Missing System 9 2.1 Total 424 100.0
Following the tenure of respondents, the overall experience in the Information
Technology industry has been used to determine aspect of ‘Overall IT
Experience’. The frequency and percentage distribution for overall IT
experience in the industry show that the highest percentage (33.3%) is in the
year group of more than 3 – 5 years followed by 5 – 8 years which is
(26.9%) and 8 – 12 years (12.5%). Respondents who have experienced with
more than 12 years were in with 7.5%.
Primary nature of your company business? (SPSS Table 103) Frequency Percent
IT and IT Enabled Services 339 80.0
BPO / KPO 8 1.9 Consulting 56 13.2 Product Development 6 1.4 Other 2 .5
Total 411 96.9 Missing System 13 3.1 Total 424 100.0

267
The type of organization the respondent worked in has been used to determine
aspect of ‘Primary Nature of Company Business’. The frequency and
percentage distribution for primary nature of company business show that the
highest percentage (80.0%) is into IT and IT enabled services for the
global market followed by least number of respondents from Product
Development at 1.4% each.
The tables in the following pages reveal the correlation between two parameters
and their mutual dependency that influences the offshore outsourcing decision
making process.

268
Where do you position your organization in your service capabilities? * Total head count in your organization? (SPSS Table 104)
Total head count in your organization? Total
Less than
500 500 – 5000
5000 – 20000
20000 – 50000
More than 50000
Level 1 – Business Specific Solutions
Count 7 5 3 3 75 93
% within Total head count in your organization? 35.0% 33.3% 27.3% 25.0% 21.9% 23.3% Level 2 – Solutions to Integrate Multiple Functional Areas
Count 6 4 3 4 53 70
% within Total head count in your organization? 30.0% 26.7% 27.3% 33.3% 15.5% 17.5% Level 3 – Well Integrated Enterprise Applications viz. Business Intelligence
Count 2 4 4 3 62 75
% within Total head count in your organization? 10.0% 26.7% 36.4% 25.0% 18.1% 18.8% Level 4 – IT Setup to Automate Entire Organization
Count 5 0 1 2 138 146
% within Total head count in your organization? 25.0% .0% 9.1% 16.7% 40.4% 36.5% Other Count 0 2 0 0 14 16
Where do you position your organization in your service capabilities?
% within Total head count in your organization? .0% 13.3% .0% .0% 4.1% 4.0% Total Count 20 15 11 12 342 400 % within Total head count in your organization? 100.0% 100.0% 100.0% 100.0% 100.0% 100.0%
Chi-Square Tests Value df Asymp. Sig. (2-sided) Pearson Chi-Square 27.401(a) 16 .037 Likelihood Ratio 33.320 16 .007 Linear-by-Linear Association 9.638 1 .002 N of Valid Cases 400
a 18 cells (72.0%) have expected count less than 5. The minimum expecte=d count is .44.
40.4% IT Companies with more than 50000 employees onboard considered themselves in capability Level 4 – IT Setup to
automate entire organization, followed by Level 1, 3 and 2.

269
Approximately, what has been your organization involvement in engaging with the client in the above projects? * Organization in the current business? (SPSS Table 105)
Organization in the current business? Total
Less than 5 years
5 – 10 years
10 – 20 years
20 – 30 years
More than 30 years
Less than 10% Count 1 4 1 0 11 17 % within Organization in the current business? 6.3% 15.4% 3.6% .0% 3.5% 4.3% 10 – 30% Count 4 4 5 0 25 38 % within Organization in the current business? 25.0% 15.4% 17.9% .0% 7.9% 9.5% 30 – 50% Count 2 1 4 1 26 34 % within Organization in the current business? 12.5% 3.8% 14.3% 7.7% 8.3% 8.5% 50 – 70% Count 5 4 3 5 59 76 % within Organization in the current business? 31.3% 15.4% 10.7% 38.5% 18.7% 19.1% More than 70%
Count 4 13 15 7 194 233
Approximately, what has been your organization involvement in engaging with the client in the above projects? % within Organization in the current business? 25.0% 50.0% 53.6% 53.8% 61.6% 58.5% Total Count 16 26 28 13 315 398 % within Organization in the current business? 100.0% 100.0
% 100.0% 100.0% 100.0% 100.0%
Chi-Square Tests
Value df Asymp. Sig. (2-sided) Pearson Chi-Square 28.934(a) 16 .024 Likelihood Ratio 26.185 16 .051 Linear-by-Linear Association 13.056 1 .000 N of Valid Cases 398
a 15 cells (60.0%) have expected count less than 5. The minimum expected count is .56.
It is observed that companies that have spent more than 30 years as Service Providers were engaged with clients and
managed their IT projects with 61.6% involvement.

270
Where do you position your organization in your service capabilities? * Total head count in your organization? (SPSS Table 110)
Total head count in your organization? Total
Less than
500 500 – 5000 5000 – 20000
20000 – 50000
More than 50000
Level 1 – Business Specific Solutions
Count 7 5 3 3 75 93
% within Total head count in your organization? 35.0% 33.3% 27.3% 25.0% 21.9% 23.3%
Level 2 – Solutions to Integrate Multiple Functional Areas
Count 6 4 3 4 53 70
% within Total head count in your organization? 30.0% 26.7% 27.3% 33.3% 15.5% 17.5%
Level 3 – Well Integrated Enterprise Applications viz. Business Intelligence
Count 2 4 4 3 62 75
% within Total head count in your organization?
10.0% 26.7% 36.4% 25.0% 18.1% 18.8%
Level 4 – IT Setup to Automate Entire Organization
Count 5 0 1 2 138 146
% within Total head count in your organization? 25.0% .0% 9.1% 16.7% 40.4% 36.5%
Other Count 0 2 0 0 14 16
Where do you position your organization in your service capabilities?
% within Total head count in your organization? .0% 13.3% .0% .0% 4.1% 4.0%
Total Count 20 15 11 12 342 400 % within Total head count in your
organization? 100.0% 100.0% 100.0% 100.0% 100.0% 100.0%
Chi-Square Tests Value df Asymp. Sig. (2-sided) Pearson Chi-Square 27.401(a) 16 .037 Likelihood Ratio 33.320 16 .007 Linear-by-Linear Association 9.638 1 .002 N of Valid Cases 400
a 18 cells (72.0%) have expected count less than 5. The minimum expected count is .44.
Majority of respondents from companies with more than 50000 employees onboard responded that their company falls in
Level 4 – IT Setup to automate entire organization (36.5%) followed by Level 1 – Business specific solutions (23.3%).

271
Has your organization build any industry specific solutions as part of the regulatory agencies requirements e.g. Promotional Spend Compliance (PSC), Process Analytical Technology (PAT) or is in the process of building them? * Total head count in your organization? (SPSS Table 111)
Total head count in your organization? Total
Less than
500 500 – 5000
5000 – 20000
20000 – 50000
More than
50000 No Count
7 3 5 6 58 79
% within Total head count in your organization? 33.3% 21.4% 45.5% 60.0% 18.1% 21.0%
Yes Count 14 11 6 4 262 297
Has your organization build any industry specific solutions as part of the regulatory agencies requirements e.g. Promotional Spend Compliance (PSC), Process Analytical Technology (PAT) or is in the process of building them?
% within Total head count in your organization? 66.7% 78.6% 54.5% 40.0% 81.9% 79.0%
Total Count 21 14 11 10 320 376 % within Total head count in your
organization? 100.0% 100.0% 100.0% 100.0% 100.0% 100.0%
Chi-Square Tests
Value df Asymp. Sig. (2-sided) Pearson Chi-Square 16.649(a) 4 .002 Likelihood Ratio 13.800 4 .008 Linear-by-Linear Association 5.242 1 .022 N of Valid Cases 376
a 4 cells (40.0%) have expected count less than 5. The minimum expected count is 2.10.
79.0% of respondents believe that their company has built industry specific solutions as part of regulatory agencies
requirements. Also, there is a relationship between industry specific solutions development and total headcount in the
organization. It is observed that companies with more staff intend to develop industry solutions for strategic advantages.

272
During the course of engagements with clients, how tough was meeting the regulatory compliance mandates? * Which department/operations in the industry have been primarily associated? (SPSS Table 112)
Which department/operations in the industry have been primarily associated? Total
R&D, Manufacturing,
QC/QA Sales &
Distribution Clinical
Research Product
Development Other No impact Count 30 15 8 30 50 133 % within Which department/operations in the
industry have been primarily associated? 29.4% 23.8% 53.3% 43.5% 52.6% 38.7%
Could have done better
Count 44 35 4 28 26 137
% within Which department/operations in the industry have been primarily associated?
43.1% 55.6% 26.7% 40.6% 27.4% 39.8%
Tough Count 28 13 3 11 19 74
During the course of engagements with clients, how tough was meeting the regulatory compliance mandates?
% within Which department/operations in the industry have been primarily associated? 27.5% 20.6% 20.0% 15.9% 20.0% 21.5%
Total Count 102 63 15 69 95 344 % within Which department/operations in the
industry have been primarily associated? 100.0% 100.0% 100.0% 100.0% 100.0% 100.0%
Chi-Square Tests
Value df Asymp. Sig. (2-sided) Pearson Chi-Square 23.262(a) 8 .003 Likelihood Ratio 23.521 8 .003 Linear-by-Linear Association 11.047 1 .001 N of Valid Cases 344
a 1 cells (6.7%) have expected count less than 5. The minimum expected count is 3.23.
A majority of respondents opine that they could have done better in terms of meeting and adhering to regulatory
requirements (39.8%). 38.7% respondents felt that there was no impact on delivery due to additional regulatory
compliance mandates. 21.5% respondents observed that it was tough during project execution to meet the impending
regulatory expectations. Also there is definite relationship between expertise in managing regulatory expectations and the
type of industry vertical the service provider caters to.

273
What do you hear the most from your clients while adopting IT automation? * During the course of engagements with clients, how tough was meeting the regulatory compliance mandates? (SPSS Table 113)
During the course of engagements with clients, how tough was meeting the regulatory compliance mandates? Total
No impact Could have done better Tough
Innovation Count 52 42 26 120 % within During the course of engagements with clients, how tough was meeting
the regulatory compliance mandates? 36.4% 28.2% 30.6% 31.8%
Globalization Efforts Count 37 42 9 88 % within During the course of engagements with clients, how tough was meeting
the regulatory compliance mandates? 25.9% 28.2% 10.6% 23.3%
Cost and Revenue Pressure
Count 40 47 37 124
% within During the course of engagements with clients, how tough was meeting the regulatory compliance mandates? 28.0% 31.5% 43.5% 32.9%
Count 8 14 10 32 Regulatory and Societal Pressures Intensifying
% within During the course of engagements with clients, how tough was meeting the regulatory compliance mandates? 5.6% 9.4% 11.8% 8.5%
Other Count 6 4 3 13
What do you hear the most from your clients while adopting IT automation?
% within During the course of engagements with clients, how tough was meeting the regulatory compliance mandates?
4.2% 2.7% 3.5% 3.4%
Total Count 143 149 85 377 % within During the course of engagements with clients, how tough was meeting
the regulatory compliance mandates? 100.0% 100.0% 100.0% 100.0%
Chi-Square Tests
Value Df Asymp. Sig. (2-sided) Pearson Chi-Square 16.575(a) 8 .035 Likelihood Ratio 17.846 8 .022 Linear-by-Linear Association 4.444 1 .035 N of Valid Cases
377
a 2 cells (13.3%) have expected count less than 5. The minimum expected count is 2.93.
Cost and revenue pressure (32.9%) followed by innovation (31.8%) are the top requirements of Life Sciences clients as
heard by the IT Service Providers. Interestingly, regulatory and societal pressures intensifying is not heard much from

274
clients thus demonstrating that if Service Providers are able to demonstrate right level of capabilities then the Life
Sciences companies is willing to seek this service providers’ support. This is also proved by the Pearson Chi-Square
value of 0.035.

275
Does your organization partner with other Third-Party Service Providers to provide niche services to your clients? * During the course of engagements with clients, how tough was meeting the regulatory compliance mandates? (SPSS Table 114)
During the course of engagements with clients, how tough was meeting
the regulatory compliance mandates? Total
No impact Could have done better Tough
No Count 43 23 22 88 % within During the course of engagements with clients, how tough
was meeting the regulatory compliance mandates? 30.1% 15.4% 25.3% 23.2%
Yes Count 100 126 65 291
Does your organization partner with other Third-Party Service Providers to provide niche services to your clients?
% within During the course of engagements with clients, how tough was meeting the regulatory compliance mandates? 69.9% 84.6% 74.7% 76.8%
Total Count 143 149 87 379 % within During the course of engagements with clients, how tough
was meeting the regulatory compliance mandates? 100.0% 100.0% 100.0% 100.0%
Chi-Square Tests Value Df Asymp. Sig. (2-sided) Pearson Chi-Square 9.036(a) 2 .011 Likelihood Ratio 9.299 2 .010 Linear-by-Linear Association 1.614 1 .204 N of Valid Cases 379
a 0 cells (.0%) have expected count less than 5. The minimum expected count is 20.20.
It is observed that IT Service Providers further engage with other third-party providers for including niche skills into their
portfolio and approach clients together with wider skills and capabilities. Also, there is a relationship between the option of
seeking another service providers help based on the past experience of managing regulatory compliance mandates.

276
Where do you position your organization in your service capabilities? * Total head count in your organization? (SPSS Table 116)
Total head count in your organization? Total
Less than
500 500 – 5000
5000 – 20000
20000 – 50000
More than 50000
Level 1 – Business Specific Solutions
Count 7 5 3 3 75 93
% within Total head count in your organization? 35.0% 33.3% 27.3% 25.0% 21.9% 23.3% Level 2 – Solutions to Integrate Multiple Functional Areas
Count 6 4 3 4 53 70
% within Total head count in your organization? 30.0% 26.7% 27.3% 33.3% 15.5% 17.5% Level 3 – Well Integrated Enterprise Applications viz. Business Intelligence
Count 2 4 4 3 62 75
% within Total head count in your organization? 10.0% 26.7% 36.4% 25.0% 18.1% 18.8% Level 4 – IT Setup to Automate Entire Organization
Count 5 0 1 2 138 146
% within Total head count in your organization? 25.0% .0% 9.1% 16.7% 40.4% 36.5% Other Count 0 2 0 0 14 16
Where do you position your organization in your service capabilities?
% within Total head count in your organization? .0% 13.3% .0% .0% 4.1% 4.0% Total Count 20 15 11 12 342 400 % within Total head count in your organization? 100.0% 100.0% 100.0% 100.0% 100.0% 100.0%
Chi-Square Tests Value df Asymp. Sig. (2-sided) Pearson Chi-Square 27.401(a) 16 .037 Likelihood Ratio 33.320 16 .007 Linear-by-Linear Association 9.638 1 .002 N of Valid Cases 400
a 18 cells (72.0%) have expected count less than 5. The minimum expected count is .44.
40.4% IT Companies with more than 50000 employees onboard considered themselves in capability Level 4 – IT Setup to
automate entire organization, followed by Level 1, 3 and 2.

277
How does your organization and/or department build specific industry capabilities to align and get closer to industry value chain? * Total head count in your organization? (SPSS Table 117)
Total head count in your organization? Total
Less than
500 500 – 5000
5000 – 20000
20000 – 50000
More than
50000 To Hire Industry Professionals Count 2 2 0 0 15 19 % within Total head count in your organization? 10.5% 13.3% .0% .0% 4.4% 4.7% Internal Workshops / Training Count 2 0 1 1 12 16 % within Total head count in your organization? 10.5% .0% 9.1% 8.3% 3.5% 4.0%
Understand pain-points from clients and prepare suitable solutions
Count 1 2 0 1 11 15
% within Total head count in your organization? 5.3% 13.3% .0% 8.3% 3.2% 3.7% All 3 above Count 14 11 10 10 305 350 % within Total head count in your organization? 73.7% 73.3% 90.9% 83.3% 88.7% 87.3% Other Count 0 0 0 0 1 1
How does your organization and/or department build specific industry capabilities to align and get closer to industry value chain? % within Total head count in your organization? .0% .0% .0% .0% .3% .2% Total Count 19 15 11 12 344 401 % within Total head count in your organization? 100.0% 100.0% 100.0% 100.0% 100.0% 100.0
% Chi-Square Tests
Value df Asymp. Sig. (2-sided) Pearson Chi-Square 15.193(a) 16 .511 Likelihood Ratio 13.732 16 .619 Linear-by-Linear Association 5.069 1 .024 N of Valid Cases 401
a 17 cells (68.0%) have expected count less than 5. The minimum expected count is .03.
In a process to come closer to industry value chain, a majority of respondents (87.3%) opine to build specific industry
capabilities by hiring industry professionals, conducting internal workshops/training and understanding clients’ pain-points
and accordingly preparing suitable solutions.

278
Does your organization hire and retain core Subject Matter Experts and Industry professionals catering to that specific industry? * Total head count in your organization? (SPSS Table 118)
Total head count in your organization? Total
Less
than 500 500 – 5000
5000 – 20000
20000 – 50000
More than
50000 No Count 3 2 2 2 21 30 % within Total head count in your organization? 15.0% 13.3% 18.2% 16.7% 6.2% 7.5%
Yes Count 17 13 9 10 320 369
Does your organization hire and retain core Subject Matter Experts and Industry professionals catering to that specific industry?
% within Total head count in your organization? 85.0% 86.7% 81.8% 83.3% 93.8% 92.5%
Total Count 20 15 11 12 341 399 % within Total head count in your organization?
100.0% 100.0% 100.0% 100.0% 100.0% 100.0%
Chi-Square Tests
Value df Asymp. Sig. (2-sided) Pearson Chi-Square 6.490(a) 4 .165 Likelihood Ratio 5.270 4 .261 Linear-by-Linear Association 4.649 1 .031 N of Valid Cases 399
a 4 cells (40.0%) have expected count less than 5. The minimum expected count is .83.
Companies with more than 50000 employees hire and retain specific industry Subject Matter Experts as observed from
the 93.8% responses.

279
Where do you differentiate your organization from the competition in IT industry? * Total head count in your organization? (SPSS Table 119)
Total head count in your organization? Total
Less than
500 500 – 5000
5000 – 20000
20000 – 50000
More than
50000 Thought Leadership Count 1 1 0 2 50 54 % within Total head count in your organization? 5.0% 6.7% .0% 16.7% 14.6% 13.5% Research & Innovation Based Solutions
Count 4 4 2 1 111 122
% within Total head count in your organization? 20.0% 26.7% 18.2% 8.3% 32.5% 30.5% People Skills Availability Count 4 5 2 3 34 48 % within Total head count in your organization? 20.0% 33.3% 18.2% 25.0% 9.9% 12.0% Global Reach Count 7 2 3 4 85 101 % within Total head count in your organization? 35.0% 13.3% 27.3% 33.3% 24.9% 25.3% Business and Industry Expertise Count 4 3 4 2 62 75
Where do you differentiate your organization from the competition in IT industry?
% within Total head count in your organization? 20.0% 20.0% 36.4% 16.7% 18.1% 18.8% Total Count 20 15 11 12 342 400 % within Total head count in your organization? 100.0% 100.0% 100.0% 100.0% 100.0% 100.0
%
Chi-Square Tests
Value df Asymp. Sig. (2-sided) Pearson Chi-Square 21.083(a) 16 .175 Likelihood Ratio 21.238 16 .170 Linear-by-Linear Association 3.607 1 .058 N of Valid Cases 400
a 18 cells (72.0%) have expected count less than 5. The minimum expected count is 1.32.
Research and innovative business solutions followed by global reach are two primary differentiators between IT
companies followed by business and industry expertise and thought leadership.

280
What is driving industry clients to reach out to your organization? * Total head count in your organization? (SPSS Table 120)
Total head count in your organization? Total
Less than
500 500 – 5000
5000 – 20000
20000 – 50000
More than 50000
Requirement of Innovative Business Models
Count 8 5 4 3 94 114
% within Total head count in your organization? 44.4% 35.7% 36.4% 25.0% 28.9% 30.0% Streamlining IT Enabled Operations
Count 3 4 2 2 75 86
% within Total head count in your organization? 16.7% 28.6% 18.2% 16.7% 23.1% 22.6%
Managing IT Regulatory Compliance Better
Count 5 3 2 2 59 71
% within Total head count in your organization? 27.8% 21.4% 18.2% 16.7% 18.2% 18.7%
Cost Benefits Count 2 2 3 5 50 62
% within Total head count in your organization? 11.1% 14.3% 27.3% 41.7% 15.4% 16.3% Other Count 0 0 0 0 47 47
What is driving industry clients to reach out to your organization?
% within Total head count in your organization? .0% .0% .0% .0% 14.5% 12.4% Total Count 18 14 11 12 325 380 % within Total head count in your organization? 100.0% 100.0% 100.0% 100.0% 100.0% 100.0%
Chi-Square Tests Value df Asymp. Sig. (2-sided) Pearson Chi-Square 17.520(a) 16 .353 Likelihood Ratio 22.491 16 .128 Linear-by-Linear Association 4.474 1 .034 N of Valid Cases 380
a 19 cells (76.0%) have expected count less than 5. The minimum expected count is 1.36.
Requirement of innovative business models is the primary reason that is driving industry clients to reach out to Service
Providers followed by streamlining IT enabled operations, managing IT regulatory compliance better. The parameter with
least response was for cost benefits, which means that the clients are well aware that seeking external support may or
may not help in saving costs.

281
What are the primary challenges which need to be overcome by clients in emerging markets? * Total head count in your organization? (SPSS Table 121)
Total head count in your organization? Total
Less than
500 500 – 5000
5000 – 20000
20000 – 50000
More than
50000 Patents and Related Regulations Count 1 5 0 2 45 53 % within Total head count in your organization? 5.0% 33.3% .0% 18.2% 13.7% 13.7% Price Controls Count 4 2 0 2 49 57 % within Total head count in your organization? 20.0% 13.3% .0% 18.2% 14.9% 14.8% Weak Infrastructure Count 0 1 1 1 21 24 % within Total head count in your organization? .0% 6.7% 9.1% 9.1% 6.4% 6.2% Forex Movements & Political Risks Count 2 0 0 0 8 10 % within Total head count in your organization? 10.0% .0% .0% .0% 2.4% 2.6% All of the above Count 13 7 10 6 206 242
What are the primary challenges which need to be overcome by clients in emerging markets?
% within Total head count in your organization? 65.0% 46.7% 90.9% 54.5% 62.6% 62.7% Total Count 20 15 11 11 329 386 % within Total head count in your organization? 100.0% 100.0% 100.0% 100.0% 100.0% 100.0
%
Chi-Square Tests
Value df Asymp. Sig. (2-sided) Pearson Chi-Square 18.014(a) 16 .323 Likelihood Ratio 20.503 16 .198 Linear-by-Linear Association .018 1 .892 N of Valid Cases 386
a 16 cells (64.0%) have expected count less than 5. The minimum expected count is .28.
It is observed that all four challenges i.e. patents related regulations, price controls, weak infrastructure and forex
movements and political risks come in way of offshoring/outsourcing for companies in the emerging markets.

282
Where do you position your organization in your service capabilities? * Organization in the current business? (SPSS Table 123)
Organization in the current business? Total
Less than 5 years
5 – 10 years
10 – 20 years
20 – 30 years
More than 30 years
Level 1 – Business Specific Solutions Count 6 8 10 1 68 93 % within Organization in the
current business? 37.5% 32.0% 35.7% 7.7% 21.4% 23.3%
Level 2 – Solutions to Integrate Multiple Functional Areas
Count 0 8 10 2 50 70
% within Organization in the current business?
.0% 32.0% 35.7% 15.4% 15.7% 17.5%
Level 3 – Well Integrated Enterprise Applications viz. Business Intelligence
Count 8 3 0 2 61 74
% within Organization in the current business? 50.0% 12.0% .0% 15.4% 19.2% 18.5%
Level 4 – IT Setup to Automate Entire Organization
Count 1 6 8 7 125 147
% within Organization in the current business?
6.3% 24.0% 28.6% 53.8% 39.3% 36.8%
Other Count 1 0 0 1 14 16
Where do you position your organization in your service capabilities?
% within Organization in the current business?
6.3% .0% .0% 7.7% 4.4% 4.0%
Total Count 16 25 28 13 318 400 % within Organization in the
current business? 100.0% 100.0% 100.0% 100.0% 100.0% 100.0%
Chi-Square Tests Value df Asymp. Sig. (2-sided) Pearson Chi-Square 42.281(a) 16 .000 Likelihood Ratio 49.907 16 .000 Linear-by-Linear Association 9.939 1 .002 N of Valid Cases 400
a 14 cells (56.0%) have expected count less than 5. The minimum expected count is .52.
There is a definite relationship between overall years of Service Providers in the industry and organization maturity level in
service capabilities. The more the number of years in the industry, the enhanced features and capabilities each of these
service providers will develop over a period of time.

283
How does your organization and/or department build specific industry capabilities to align and get closer to industry value chain? * Organization in the current business? (SPSS Table 124)
Organization in the current business? Total
Less than 5
years 5 – 10 years 10 – 20 years
20 – 30 years
More than 30 years
To Hire Industry Professionals Count 1 1 3 0 16 21 % within Organization in the current business? 5.9% 4.0% 11.5% .0% 5.0% 5.2% Internal Workshops / Training Count 1 2 3 1 9 16 % within Organization in the current business? 5.9% 8.0% 11.5% 8.3% 2.8% 4.0%
Understand pain-points from clients and prepare suitable solutions
Count 1 2 0 0 11 14
% within Organization in the current business? 5.9% 8.0% .0% .0% 3.4% 3.5% All 3 above Count 14 20 20 11 284 349 % within Organization in the current business? 82.4% 80.0% 76.9% 91.7% 88.5% 87.0% Other Count 0 0 0 0 1 1
How does your organization and/or department build specific industry capabilities to align and get closer to industry value chain?
% within Organization in the current business? .0% .0% .0% .0% .3% .2% Total Count 17 25 26 12 321 401 % within Organization in the current business? 100.0% 100.0% 100.0% 100.0% 100.0% 100.0
%
Chi-Square Tests
Value Df Asymp. Sig. (2-sided) Pearson Chi-Square 13.208(a) 16 .657 Likelihood Ratio 12.912 16 .679 Linear-by-Linear Association 2.456 1 .117 N of Valid Cases 401
a 17 cells (68.0%) have expected count less than 5. The minimum expected count is .03.

284
Does your organization hire and retain core Subject Matter Experts and Industry professionals catering to that specific industry? * Organization in the current business? (SPSS Table 125)
Organization in the current business? Total
Less than 5 years
5 – 10 years
10 – 20 years
20 – 30 years
More than 30 years
No Count 2 2 3 2 20 29 % within Organization in the current
business? 12.5% 8.0% 11.1% 15.4% 6.3% 7.3%
Yes Count 14 23 24 11 297 369
Does your organization hire and retain core Subject Matter Experts and Industry professionals catering to that specific industry?
% within Organization in the current business? 87.5% 92.0% 88.9% 84.6% 93.7% 92.7%
Total Count 16 25 27 13 317 398 % within Organization in the current
business? 100.0% 100.0% 100.0% 100.0% 100.0% 100.0%
Chi-Square Tests
Value df Asymp. Sig. (2-sided) Pearson Chi-Square 2.957(a) 4 .565 Likelihood Ratio 2.513 4 .642 Linear-by-Linear Association 1.456 1 .228 N of Valid Cases
398
a 4 cells (40.0%) have expected count less than 5. The minimum expected count is .95.
Organizations which are more than 30 years old hire and retain core SMEs and industry professionals catering to a
specific industry.

285
During the course of engagements with clients, how tough was meeting the regulatory compliance mandates? * Organization in the current business? (SPSS Table 126)
Organization in the current business? Total
Less than 5 years
5 – 10 years
10 – 20 years
20 – 30 years
More than 30 years
No impact Count 2 4 8 1 135 150 % within Organization in the current business?
11.8% 16.7% 28.6% 8.3% 43.5% 38.4%
Could have done better Count 9 13 14 6 110 152 % within Organization in the current business?
52.9% 54.2% 50.0% 50.0% 35.5% 38.9%
Tough Count 6 7 6 5 65 89
During the course of engagements with clients, how tough was meeting the regulatory compliance mandates?
% within Organization in the current business? 35.3% 29.2% 21.4% 41.7% 21.0% 22.8%
Total Count 17 24 28 12 310 391 % within Organization in the current business?
100.0% 100.0% 100.0% 100.0% 100.0% 100.0%
Chi-Square Tests Value df Asymp. Sig. (2-sided) Pearson Chi-Square 20.222(a) 8 .010 Likelihood Ratio 22.617 8 .004 Linear-by-Linear Association 11.188 1 .001 N of Valid Cases 391
a 4 cells (26.7%) have expected count less than 5. The minimum expected count is 2.73.
A majority of respondents opine that they could have done better in terms of meeting and adhering to regulatory
requirements (38.9%). High number of respondents contributing to this response was from companies that are less than
10 year old. 38.4% respondents felt that there was no impact on delivery due to additional regulatory compliance
mandates. 22.8% respondents observed that it was tough during project execution to meet the impending regulatory
expectations.

286
What is the biggest challenge your organization perceives while approaching clients in specific industry? * Organization in the current business? (SPSS Table 127)
Organization in the current business? Total
Less than 5 years
5 – 10 years
10 – 20 years
20 – 30 years
More than 30 years
Conservativeness towards offshore/outsourcing
Count 2 4 9 1 46 62
% within Organization in the current business? 11.8% 17.4% 40.9% 8.3% 15.8% 16.9% Ensure consistency in meeting impending regulations
Count 4 5 3 0 46 58
% within Organization in the current business? 23.5% 21.7% 13.6% .0% 15.8% 15.8% Switch over to automation is perceived to be tough by clients
Count 1 4 1 0 39 45
% within Organization in the current business? 5.9% 17.4% 4.5% .0% 13.4% 12.3% Building client confidence for effective delivery
Count 10 10 9 11 150 190
% within Organization in the current business? 58.8% 43.5% 40.9% 91.7% 51.4% 51.9% Other Count 0 0 0 0 11 11
What is the biggest challenge your organization perceives while approaching clients in specific industry?
% within Organization in the current business? .0% .0% .0% .0% 3.8% 3.0% Total Count 17 23 22 12 292 366 % within Organization in the current business? 100.0% 100.0% 100.0% 100.0
% 100.0% 100.0%
Chi-Square Tests Value df Asymp. Sig. (2-sided) Pearson Chi-Square 22.922(a) 16 .116 Likelihood Ratio 26.158 16 .052 Linear-by-Linear Association 1.441 1 .230 N of Valid Cases 366
a 16 cells (64.0%) have expected count less than 5. The minimum expected count is .36.
Building client confidence for effective delivery if the biggest challenge all companies perceive while approaching Life
Sciences companies. Interestingly this happens to be the trend for well matured Service Provider companies who have
been providing services for more than 20 years.

287
What do you hear the most from your clients while adopting IT automation? * Organization in the current business? (SPSS Table 128) Organization in the current business? Total
Less than 5 years
5 – 10 years
10 – 20 years
20 – 30 years
More than 30 years
Innovation Count 8 8 8 2 93 119 % within Organization in the current business? 47.1% 33.3% 29.6% 15.4% 30.8% 31.1% Globalization Efforts Count 4 7 6 3 70 90 % within Organization in the current business? 23.5% 29.2% 22.2% 23.1% 23.2% 23.5% Cost and Revenue Pressure Count 5 6 10 6 100 127
% within Organization in the current business? 29.4% 25.0% 37.0% 46.2% 33.1% 33.2% Regulatory and Societal Pressures Intensifying
Count 0 2 3 2 25 32
% within Organization in the current business? .0% 8.3% 11.1% 15.4% 8.3% 8.4% Other Count 0 1 0 0 14 15
What do you hear the most from your clients while adopting IT automation? % within Organization in the current business? .0% 4.2% .0% .0% 4.6% 3.9% Total Count 17 24 27 13 302 383 % within Organization in the current business?
100.0% 100.0% 100.0% 100.0% 100.0% 100.0%
Chi-Square Tests Value df Asymp. Sig. (2-sided) Pearson Chi-Square 9.265(a) 16 .902 Likelihood Ratio 12.709 16 .694 Linear-by-Linear Association 2.132 1 .144 N of Valid Cases 383
a 12 cells (48.0%) have expected count less than 5. The minimum expected count is .51.
Cost and revenue pressure (33.2%) followed by innovation (31.1%) are the top requirements from Life Sciences clients as
heard by the IT Service Providers. Interestingly, regulatory and societal pressures intensifying is not heard much from
clients thus demonstrating that if Service Providers are able to demonstrate right level of capabilities then the Life
Sciences companies is willing to seek this service providers’ support.

288
What are the primary challenges which need to be overcome by clients in emerging markets? * Organization in the current business? (SPSS Table 129)
Organization in the current business? Total
Less than 5 years
5 – 10 years
10 – 20 years
20 – 30 years
More than 30 years
Patents and Related Regulations
Count 1 3 2 1 46 53
% within Organization in the current business? 5.9% 12.0% 8.0% 8.3% 15.0% 13.7% Price Controls Count 1 6 5 2 43 57 % within Organization in the current business? 5.9% 24.0% 20.0% 16.7% 14.0% 14.8% Weak Infrastructure Count 0 1 3 1 19 24 % within Organization in the current business? .0% 4.0% 12.0% 8.3% 6.2% 6.2% Forex Movements & Political Risks
Count 1 0 1 0 8 10
% within Organization in the current business? 5.9% .0% 4.0% .0% 2.6% 2.6% All of the above Count 14 15 14 8 191 242
What are the primary challenges which need to be overcome by clients in emerging markets?
% within Organization in the current business? 82.4% 60.0% 56.0% 66.7% 62.2% 62.7% Total Count 17 25 25 12 307 386 % within Organization in the current business? 100.0% 100.0% 100.0% 100.0% 100.0% 100.0%
Chi-Square Tests
Value df Asymp. Sig. (2-sided) Pearson Chi-Square 10.830(a) 16 .820 Likelihood Ratio 12.615 16 .701 Linear-by-Linear Association .935 1 .333 N of Valid Cases 386
a 16 cells (64.0%) have expected count less than 5. The minimum expected count is .31.
Patents and related regulations, price controls, weak infrastructure and forex movements including political risks are the
primary challenges that need to be overcome by clients in emerging markets. 62.7% respondents agreed with the same.

289
FDA is encouraging clients to adopt newer technologies in making the drugs arrive in market sooner and improve healthcare efficiency. Did your organization directly involve in any of these initiatives and supported your esteemed clients? * Organization in the current business? (SPSS Table 130)
Organization in the current business? Total
Less than 5 years
5 – 10 years
10 – 20 years
20 – 30 years
More than 30 years
No Count 10 8 10 6 89 123 % within Organization in the
current business? 58.8% 34.8% 38.5% 50.0% 30.7% 33.4%
Yes Count 7 15 16 6 201 245
FDA is encouraging clients to adopt newer technologies in making the drugs arrive in market sooner and improve healthcare efficiency. Did your organization directly involve in any of these initiatives and supported your esteemed clients?
% within Organization in the current business? 41.2% 65.2% 61.5% 50.0% 69.3% 66.6%
Total Count 17 23 26 12 290 368 % within Organization in the
current business? 100.0% 100.0% 100.0% 100.0% 100.0% 100.0%
Chi-Square Tests
Value df Asymp. Sig. (2-sided) Pearson Chi-Square 7.700(a) 4 .103 Likelihood Ratio 7.273 4 .122 Linear-by-Linear Association 4.809 1 .028 N of Valid Cases 368
a 1 cells (10.0%) have expected count less than 5. The minimum expected count is 4.01.
Service Provider companies that are more than 30 years old have more experience of working with clients in working on
newer technologies as recommended by FDA. This implies that the Life Sciences companies definitely look at the maturity
and years in similar business while choosing a service provider for critical operations.

290
Does your organization partner with other Third-Party Service Providers to provide niche services to your clients? * Organization in the current business? (SPSS Table 131)
Organization in the current business? Total
Less than 5 years
5 – 10 years
10 – 20 years
20 – 30 years
More than 30 years
No Count 5 4 5 5 69 88 % within Organization in the current business? 29.4% 18.2% 18.5% 41.7% 22.5% 22.9
% Yes Count 12 18 22 7 237 296
Does your organization partner with other Third-Party Service Providers to provide niche services to your clients?
% within Organization in the current business? 70.6% 81.8% 81.5% 58.3% 77.5% 77.1%
Total Count 17 22 27 12 306 384 % within Organization in the current business? 100.0% 100.0% 100.0% 100.0% 100.0% 100.0
% Chi-Square Tests
Value df Asymp. Sig. (2-sided) Pearson Chi-Square 3.392(a) 4 .494 Likelihood Ratio 3.088 4 .543 Linear-by-Linear Association .016 1 .900 N of Valid Cases 384
a 2 cells (20.0%) have expected count less than 5. The minimum expected count is 2.75.
It is observed that IT Service Providers further engage with other third-party providers for including niche skills into their
portfolio and approach clients together with wider skills and capabilities.

291
Has your organization build any industry specific solutions as part of the regulatory agencies requirements e.g. Promotional Spend Compliance (PSC), Process Analytical Technology (PAT) or is in the process of building them? * Organization in the current business? (SPSS Table 132)
Organization in the current business? Total
Less than 5 years
5 – 10 years
10 – 20 years
20 – 30 years
More than 30 years
No Count 8 5 6 6 53 78 % within Organization in the
current business? 47.1% 21.7% 23.1% 50.0% 17.8% 20.7%
Yes Count 9 18 20 6 245 298
Has your organization build any industry specific solutions as part of the regulatory agencies requirements e.g. Promotional Spend Compliance (PSC), Process Analytical Technology (PAT) or is in the process of building them?
% within Organization in the current business? 52.9% 78.3% 76.9% 50.0% 82.2% 79.3%
Total Count 17 23 26 12 298 376 % within Organization in the
current business? 100.0% 100.0% 100.0% 100.0% 100.0% 100.0%
Chi-Square Tests
Value df Asymp. Sig. (2-sided) Pearson Chi-Square 15.094(a) 4 .005 Likelihood Ratio 12.617 4 .013 Linear-by-Linear Association 6.756 1 .009 N of Valid Cases
376
a 3 cells (30.0%) have expected count less than 5. The minimum expected count is 2.49.
79.3% of respondents believe that their company has built industry specific solutions as part of regulatory agencies
requirements. Also, there is a relationship between industry specific solutions development and the organization’s age. It
is observed that companies who have been since more than 20 years intend to developing industry solutions for strategic
advantages.

292
What is the biggest challenge your organization perceives while approaching clients in specific industry? * Total head count in your organization? (SPSS Table 134)
Total head count in your organization? Total
Less than
500 500 – 5000 5000 – 20000
20000 – 50000
More than 50000
Conservativeness towards offshore/outsourcing
Count 4 3 1 3 50 61
% within Total head count in your organization? 21.1% 23.1% 10.0% 30.0% 15.9% 16.7% Ensure consistency in meeting impending regulations
Count 2 4 3 0 50 59
% within Total head count in your organization? 10.5% 30.8% 30.0% .0% 15.9% 16.1%
Switch over to automation is perceived to be tough by clients
Count 2 0 0 0 43 45
% within Total head count in your organization? 10.5% .0% .0% .0% 13.7% 12.3% Building client confidence for effective delivery
Count 11 6 6 7 160 190
% within Total head count in your organization? 57.9% 46.2% 60.0% 70.0% 51.0% 51.9% Other Count 0 0 0 0 11 11
What is the biggest challenge your organization perceives while approaching clients in specific industry? % within Total head count in your organization? .0% .0% .0% .0% 3.5% 3.0% Total Count 19 13 10 10 314 366 % within Total head count in your organization? 100.0% 100.0% 100.0% 100.0% 100.0% 100.0%
Chi-Square Tests Value df Asymp. Sig. (2-sided) Pearson Chi-Square 14.344(a) 16 .573 Likelihood Ratio 20.706 16 .190 Linear-by-Linear Association .493 1 .482 N of Valid Cases 366
a 16 cells (64.0%) have expected count less than 5. The minimum expected count is .30.
Building client confidence for effective delivery (51.9%) is the biggest challenge for Service Provider companies in
approaching client followed by clients conservativeness towards offshore/outsourcing (16.7%) and ensure consistency in
meeting impending regulations (16.1%) are the second level challenges faced by service providers.

293
What do you hear the most from your clients while adopting IT automation? * Total head count in your organization? (SPSS Table 135) Total head count in your organization? Total
Less than
500 500 – 5000
5000 – 20000
20000 – 50000
More than 50000
Innovation Count 8 8 2 4 97 119 % within Total head count in your organization? 40.0% 53.3% 18.2% 40.0% 29.7% 31.1% Globalization Efforts Count 2 6 5 2 75 90 % within Total head count in your organization? 10.0% 40.0% 45.5% 20.0% 22.9% 23.5% Cost and Revenue Pressure
Count 6 1 4 3 113 127
% within Total head count in your organization? 30.0% 6.7% 36.4% 30.0% 34.6% 33.2% Regulatory and Societal Pressures Intensifying
Count 4 0 0 1 27 32
% within Total head count in your organization? 20.0% .0% .0% 10.0% 8.3% 8.4% Other Count 0 0 0 0 15 15
What do you hear the most from your clients while adopting IT automation?
% within Total head count in your organization? .0% .0% .0% .0% 4.6% 3.9%
Total Count 20 15 11 10 327 383 % within Total head count in your organization? 100.0% 100.0% 100.0% 100.0% 100.0% 100.0%
Chi-Square Tests Value df Asymp. Sig. (2-sided) Pearson Chi-Square 21.116(a) 16 .174 Likelihood Ratio 25.358 16 .064 Linear-by-Linear Association 2.899 1 .089 N of Valid Cases
383
a 18 cells (72.0%) have expected count less than 5. The minimum expected count is .39.
Cost and revenue pressure (33.2%) followed by innovation (31.1%) are the top requirements from Life Sciences clients as
heard by the IT Service Providers. Interestingly, regulatory and societal pressures intensifying is not heard much from
clients thus demonstrating that if Service Providers are able to demonstrate right level of capabilities then the Life
Sciences companies is willing to seek this service providers’ support.

294
What are the primary challenges which need to be overcome by clients in emerging markets? * Total head count in your organization? (SPSS Table 136) Total head count in your organization? Total
Less than
500 500 – 5000
5000 – 20000
20000 – 50000
More than 50000
Patents and Related Regulations Count 1 5 0 2 45 53 % within Total head count in your organization? 5.0% 33.3% .0% 18.2% 13.7% 13.7% Price Controls Count 4 2 0 2 49 57 % within Total head count in your organization? 20.0% 13.3% .0% 18.2% 14.9% 14.8% Weak Infrastructure Count 0 1 1 1 21 24 % within Total head count in your organization? .0% 6.7% 9.1% 9.1% 6.4% 6.2% Forex Movements & Political Risks Count 2 0 0 0 8 10 % within Total head count in your organization? 10.0% .0% .0% .0% 2.4% 2.6% All of the above Count 13 7 10 6 206 242
What are the primary challenges which need to be overcome by clients in emerging markets? % within Total head count in your organization? 65.0% 46.7% 90.9% 54.5% 62.6% 62.7% Total Count 20 15 11 11 329 386 % within Total head count in your organization? 100.0% 100.0% 100.0% 100.0% 100.0% 100.0
% Chi-Square Tests
Value df Asymp. Sig. (2-sided) Pearson Chi-Square 18.014(a) 16 .323 Likelihood Ratio 20.503 16 .198 Linear-by-Linear Association .018 1 .892 N of Valid Cases 386
a 16 cells (64.0%) have expected count less than 5. The minimum expected count is .28.
It is observed that all four challenges i.e. patents related regulations, price controls, weak infrastructure and forex
movements and political risks come in way of offshoring/outsourcing for companies in the emerging markets.

295
FDA is encouraging clients to adopt newer technologies in making the drugs arrive in market sooner and improve healthcare efficiency. Did your organization directly involve in any of these initiatives and supported your esteemed clients? * Total head count in your organization? (SPSS Table 137)
Total head count in your organization? Total
Less than
500 500 – 5000
5000 – 20000
20000 – 50000
More than 50000
No Count 10 6 6 6 96 124
% within Total head count in your organization? 50.0% 42.9% 54.5% 60.0% 30.7% 33.7% Yes Count
10 8 5 4 217 244
FDA is encouraging clients to adopt newer technologies in making the drugs arrive in market sooner and improve healthcare efficiency. Did your organization directly involve in any of these initiatives and supported your esteemed clients?
% within Total head count in your organization? 50.0% 57.1% 45.5% 40.0% 69.3% 66.3%
Total Count 20 14 11 10 313 368 % within Total head count in your organization? 100.0% 100.0% 100.0% 100.0% 100.0% 100.0%
Chi-Square Tests Value df Asymp. Sig. (2-sided) Pearson Chi-Square 9.425(a) 4 .051 Likelihood Ratio 8.942 4 .063 Linear-by-Linear Association 5.957 1 .015 N of Valid Cases 368
a 3 cells (30.0%) have expected count less than 5. The minimum expected count is 3.37.
Service Provider companies that are more than 30 years old have more experience of working with clients in working on
newer technologies as recommended by FDA. This implies that the Life Sciences companies definitely look at the maturity
and years in similar business while choosing a service provider for critical operations.

296
Does your organization partner with other Third-Party Service Providers to provide niche services to your clients? * Total head count in your organization? (SPSS Table 138) Total head count in your organization? Total
Less
than 500 500 – 5000
5000 – 20000
20000 – 50000
More than 50000
No Count 7 4 0 1 78 90 % within Total head count in your
organization? 33.3% 28.6% .0% 10.0% 23.7% 23.4%
Yes Count 14 10 10 9 251 294
Does your organization partner with other Third-Party Service Providers to provide niche services to your clients? % within Total head count in your
organization? 66.7% 71.4% 100.0% 90.0% 76.3% 76.6%
Total Count 21 14 10 10 329 384 % within Total head count in your
organization? 100.0% 100.0% 100.0% 100.0% 100.0% 100.0%
Chi-Square Tests Value df Asymp. Sig. (2-sided) Pearson Chi-Square 5.433(a) 4 .246 Likelihood Ratio 7.814 4 .099 Linear-by-Linear Association .244 1 .621 N of Valid Cases 384
a 4 cells (40.0%) have expected count less than 5. The minimum expected count is 2.34.
It is observed that IT Service Providers further engage with other third-party providers for including niche skills into their
portfolio and approach clients together with wider skills and capabilities.

297
Has your organization build any industry specific solutions as part of the regulatory agencies requirements e.g. Promotional Spend Compliance (PSC), Process Analytical Technology (PAT) or is in the process of building them? * Total head count in your organization? (SPSS Table 139)
Total head count in your organization? Total
Less than
500 500 – 5000
5000 – 20000
20000 – 50000
More than
50000 No Count
7 3 5 6 58 79
% within Total head count in your organization? 33.3% 21.4% 45.5% 60.0% 18.1% 21.0%
Yes Count 14 11 6 4 262 297
Has your organization build any industry specific solutions as part of the regulatory agencies requirements e.g. Promotional Spend Compliance (PSC), Process Analytical Technology (PAT) or is in the process of building them?
% within Total head count in your organization? 66.7% 78.6% 54.5% 40.0% 81.9% 79.0%
Total Count 21 14 11 10 320 376 % within Total head count in your organization? 100.0% 100.0% 100.0% 100.0% 100.0% 100.0%
Chi-Square Tests
Value df Asymp. Sig. (2-sided) Pearson Chi-Square 16.649(a) 4 .002 Likelihood Ratio 13.800 4 .008 Linear-by-Linear Association 5.242 1 .022 N of Valid Cases 376
a 4 cells (40.0%) have expected count less than 5. The minimum expected count is 2.10.
79.0% of respondents believe that their company has built industry specific solutions as part of regulatory agencies
requirements. Also, there is a relationship between industry specific solutions development and total headcount in the
organization. It is observed that companies with more staff intend to develop industry solutions for strategic advantages.

298
Based on your experience, what kinds of projects were difficult to win and manage? * Which department/operations in the industry have been primarily associated? (SPSS Table 140)
Which department/operations in the industry have been primarily
associated? Total
R&D, Manufacturing,
QC/QA Sales &
Distribution Clinical
Research Product
Development Other Application Development Count 18 7 3 12 11 51 % within Which department/operations in the
industry have been primarily associated? 18.9% 11.7% 23.1% 18.5% 13.6% 16.2%
Application Maintenance Count 15 12 1 12 10 50 % within Which department/operations in the
industry have been primarily associated? 15.8% 20.0% 7.7% 18.5% 12.3% 15.9%
Strategic Consulting Count 27 17 5 18 24 91 % within Which department/operations in the
industry have been primarily associated? 28.4% 28.3% 38.5% 27.7% 29.6% 29.0%
New Customized Product Development
Count 34 24 4 23 30 115
% within Which department/operations in the industry have been primarily associated? 35.8% 40.0% 30.8% 35.4% 37.0% 36.6%
Other Count 1 0 0 0 6 7
Based on your experience, what kinds of projects were difficult to win and manage?
% within Which department/operations in the industry have been primarily associated? 1.1% .0% .0% .0% 7.4% 2.2%
Total Count 95 60 13 65 81 314 % within Which department/operations in the
industry have been primarily associated? 100.0% 100.0% 100.0% 100.0% 100.0% 100.0%
Chi-Square Tests
Value df Asymp. Sig. (2-sided) Pearson Chi-Square 18.458(a) 16 .298 Likelihood Ratio 18.081 16 .319 Linear-by-Linear Association 1.333 1 .248 N of Valid Cases 314
a 9 cells (36.0%) have expected count less than 5. The minimum expected count is .29.
A majority of respondents felt that winning and managing new customized product development followed by strategic
consulting projects were difficult with 36.6% and 29.0% responses respectively.

299
Does the offshore/outsource model adopted by your organization impact client’s product release? * Which department/operations in the industry have been primarily associated? (SPSS Table 141)
Which department/operations in the industry have been primarily
associated? Total
R&D, Manufacturing,
QC/QA Sales &
Distribution Clinical
Research Product
Development Other No Count 49 31 6 32 50 168 % within Which department/operations in the
industry have been primarily associated? 47.1% 47.7% 42.9% 46.4% 51.5% 48.1%
Yes Count 55 34 8 37 47 181
Does the offshore/outsource model adopted by your organization impact client’s product release? % within Which department/operations in the
industry have been primarily associated? 52.9% 52.3% 57.1% 53.6% 48.5% 51.9%
Total Count 104 65 14 69 97 349 % within Which department/operations in the
industry have been primarily associated? 100.0% 100.0% 100.0% 100.0% 100.0% 100.0%
Chi-Square Tests
Value df Asymp. Sig. (2-sided) Pearson Chi-Square .742(a) 4 .946 Likelihood Ratio .743 4 .946 Linear-by-Linear Association .260 1 .610 N of Valid Cases 349
a 0 cells (.0%) have expected count less than 5. The minimum expected count is 6.74.
51.9% of respondents believe that the projects they managed had an impact on client’s product release of products and
remaining 48.1% felt that there was no impact on product release.

300
Does the offshore/outsource model adopted by your organization impact client’s core business operations? * Which department/operations in the industry have been primarily associated? (SPSS Table 142)
Which department/operations in the industry have been primarily
associated? Total
R&D, Manufacturing,
QC/QA Sales &
Distribution Clinical
Research Product
Development Other No Count 44 22 3 31 46 146 % within Which department/operations in the
industry have been primarily associated? 42.7% 34.4% 20.0% 46.3% 47.9% 42.3%
Yes Count 59 42 12 36 50 199
Does the offshore/outsource model adopted by your organization impact client’s core business operations?
% within Which department/operations in the industry have been primarily associated?
57.3% 65.6% 80.0% 53.7% 52.1% 57.7%
Total Count 103 64 15 67 96 345 % within Which department/operations in the
industry have been primarily associated? 100.0% 100.0% 100.0% 100.0% 100.0% 100.0%
Chi-Square Tests
Value df Asymp. Sig. (2-sided) Pearson Chi-Square 6.383(a) 4 .172 Likelihood Ratio 6.696 4 .153 Linear-by-Linear Association 1.374 1 .241 N of Valid Cases 345
a 0 cells (.0%) have expected count less than 5. The minimum expected count is 6.35.
57.7% of respondents believe that the projects they managed had an impact on clients’ core business operations and
remaining 42.3% felt that there was no impact on core business operations.

301
During the course of engagements with clients, how tough was meeting the regulatory compliance mandates? * Which department/operations in the industry have been primarily associated? (SPSS Table 143)
Which department/operations in the industry have been primarily associated? Total
R&D, Manufacturing,
QC/QA Sales &
Distribution Clinical
Research Product
Development Other No impact Count 30 15 8 30 50 133 % within Which department/operations in the
industry have been primarily associated? 29.4% 23.8% 53.3% 43.5% 52.6% 38.7%
Could have done better
Count 44 35 4 28 26 137
% within Which department/operations in the industry have been primarily associated?
43.1% 55.6% 26.7% 40.6% 27.4% 39.8%
Tough Count 28 13 3 11 19 74
During the course of engagements with clients, how tough was meeting the regulatory compliance mandates?
% within Which department/operations in the industry have been primarily associated? 27.5% 20.6% 20.0% 15.9% 20.0% 21.5%
Total Count 102 63 15 69 95 344 % within Which department/operations in the
industry have been primarily associated? 100.0% 100.0% 100.0% 100.0% 100.0% 100.0%
Chi-Square Tests
Value df Asymp. Sig. (2-sided) Pearson Chi-Square 23.262(a) 8 .003 Likelihood Ratio 23.521 8 .003 Linear-by-Linear Association 11.047 1 .001 N of Valid Cases 344
a 1 cells (6.7%) have expected count less than 5. The minimum expected count is 3.23.
A majority of respondents opine that they could have done better in terms of meeting and adhering to regulatory
requirements (39.8%). 38.7% respondents felt that there was no impact on delivery due to additional regulatory
compliance mandates. 21.5% respondents observed that it was tough during project execution to meet the impending
regulatory expectations. Also there is definite relationship between expertise in managing regulatory expectations and the
type of industry vertical the service provider caters to.

302
What is the biggest challenge your organization perceives while approaching clients in specific industry? * Which department/operations in the industry have been primarily associated? (SPSS Table 144)
Which department/operations in the industry have been primarily associated? Total
R&D, Manufacturing,
QC/QA Sales &
Distribution Clinical
Research Product
Development Other Count 16 14 3 7 13 53 Conservativeness
towards offshore/outsourcing
% within Which department/operations in the industry have been primarily associated? 16.2% 22.6% 20.0% 10.6% 15.1% 16.2%
Count 22 7 3 10 12 54 Ensure consistency in meeting impending regulations
% within Which department/operations in the industry have been primarily associated? 22.2% 11.3% 20.0% 15.2% 14.0% 16.5%
Count 12 9 1 6 14 42 Switch over to automation is perceived to be tough by clients
% within Which department/operations in the industry have been primarily associated? 12.1% 14.5% 6.7% 9.1% 16.3% 12.8%
Count 49 29 7 41 42 168 Building client confidence for effective delivery
% within Which department/operations in the industry have been primarily associated? 49.5% 46.8% 46.7% 62.1% 48.8% 51.2%
Count 0 3 1 2 5 11
What is the biggest challenge your organization perceives while approaching clients in specific industry?
Other % within Which department/operations in the
industry have been primarily associated? .0% 4.8% 6.7% 3.0% 5.8% 3.4%
Total Count 99 62 15 66 86 328 % within Which department/operations in the
industry have been primarily associated? 100.0% 100.0% 100.0% 100.0% 100.0% 100.0%
Chi-Square Tests
Value df Asymp. Sig. (2-sided) Pearson Chi-Square 16.467(a) 16 .421 Likelihood Ratio 19.296 16 .254 Linear-by-Linear Association 2.956 1 .086 N of Valid Cases 328
a 8 cells (32.0%) have expected count less than 5. The minimum expected count is .50.
Building client confidence for effective delivery (51.2%) is the biggest challenge for Service Provider companies in
approaching clients.

303
Were there cases, wherein your organization and/or department was engaged in Support and Development projects and compliance attributes were managed by either client and/or other third party? * Which department/operations in the industry have been primarily associated? (SPSS Table 145)
Which department/operations in the industry have been primarily associated? Total
R&D, Manufacturing,
QC/QA Sales &
Distribution Clinical
Research Product
Development Other No Count 29 18 4 14 29 94 % within Which department/operations in
the industry have been primarily associated?
29.0% 28.6% 26.7% 20.9% 31.2% 27.8%
Yes Count 71 45 11 53 64 244
Were there cases, wherein your organization and/or department was engaged in Support and Development projects and compliance attributes were managed by either client and/or other third party?
% within Which department/operations in the industry have been primarily associated?
71.0% 71.4% 73.3% 79.1% 68.8% 72.2%
Total Count 100 63 15 67 93 338 % within Which department/operations in
the industry have been primarily associated?
100.0% 100.0% 100.0% 100.0% 100.0% 100.0%
Chi-Square Tests
Value df Asymp. Sig. (2-sided) Pearson Chi-Square 2.221(a) 4 .695 Likelihood Ratio 2.304 4 .680 Linear-by-Linear Association .008 1 .928 N of Valid Cases 338
a 1 cells (10.0%) have expected count less than 5. The minimum expected count is 4.17.
While the Service Provider was managing project activities, client has roped in another third-party Service Provider and
was given the responsibilities of taking care of compliance attributes. 72.2% of respondents have shared similar
experience.

304
What do you hear the most from your clients while adopting IT automation? * During the course of engagements with clients, how tough was meeting the regulatory compliance mandates? (SPSS Table 146)
During the course of engagements with clients, how tough was meeting the regulatory compliance mandates? Total
No impact Could have done better Tough
Innovation Count 52 42 26 120 % within During the course of engagements with clients, how
tough was meeting the regulatory compliance mandates? 36.4% 28.2% 30.6% 31.8%
Globalization Efforts Count 37 42 9 88 % within During the course of engagements with clients, how
tough was meeting the regulatory compliance mandates? 25.9% 28.2% 10.6% 23.3%
Cost and Revenue Pressure
Count 40 47 37 124
% within During the course of engagements with clients, how tough was meeting the regulatory compliance mandates? 28.0% 31.5% 43.5% 32.9%
Count 8 14 10 32 Regulatory and Societal Pressures Intensifying
% within During the course of engagements with clients, how tough was meeting the regulatory compliance mandates? 5.6% 9.4% 11.8% 8.5%
Other Count 6 4 3 13
What do you hear the most from your clients while adopting IT automation?
% within During the course of engagements with clients, how tough was meeting the regulatory compliance mandates?
4.2% 2.7% 3.5% 3.4%
Total Count 143 149 85 377 % within During the course of engagements with clients, how
tough was meeting the regulatory compliance mandates? 100.0% 100.0% 100.0% 100.0%
Chi-Square Tests Value df Asymp. Sig. (2-sided) Pearson Chi-Square 16.575(a) 8 .035 Likelihood Ratio 17.846 8 .022 Linear-by-Linear Association 4.444 1 .035 N of Valid Cases
377
a 2 cells (13.3%) have expected count less than 5. The minimum expected count is 2.93.
Cost and revenue pressure (32.9%) followed by innovation (31.8%) are the top requirements of Life Sciences clients as
heard by the IT Service Providers. Interestingly, regulatory and societal pressures intensifying is not heard much from

305
clients thus demonstrating that if Service Providers are able to demonstrate right level of capabilities then the Life
Sciences companies is willing to seek this service providers’ support. This is also proved by the Pearson Chi-Square
value of 0.035.

306
Were there cases, wherein your organization and/or department was engaged in Support and Development projects and compliance attributes were managed by either client and/or other third party? * During the course of engagements with clients, how tough was meeting the regulatory compliance mandates? (SPSS Table 147)
During the course of engagements with clients, how tough was meeting
the regulatory compliance mandates? Total
No impact Could have done better Tough
No Count 49 32 25 106 % within During the course of engagements with clients, how
tough was meeting the regulatory compliance mandates? 33.3% 21.6% 30.1% 28.0%
Yes Count 98 116 58 272
Were there cases, wherein your organization and/or department was engaged in Support and Development projects and compliance attributes were managed by either client and/or other third party?
% within During the course of engagements with clients, how tough was meeting the regulatory compliance mandates? 66.7% 78.4% 69.9% 72.0%
Total Count 147 148 83 378 % within During the course of engagements with clients, how
tough was meeting the regulatory compliance mandates? 100.0% 100.0% 100.0% 100.0%
Chi-Square Tests
Value df Asymp. Sig. (2-sided) Pearson Chi-Square 5.241(a) 2 .073 Likelihood Ratio 5.332 2 .070 Linear-by-Linear Association .826 1 .363 N of Valid Cases 378
a 0 cells (.0%) have expected count less than 5. The minimum expected count is 23.28.
While the Service Provider was managing project activities, client has roped in another third-party Service Provider and
was given the responsibilities of taking care of compliance attributes. 72.0% of respondents have shared similar
experience.

307
What are the primary challenges which need to be overcome by clients in emerging markets? * During the course of engagements with clients, how tough was meeting the regulatory compliance mandates? (SPSS Table 148)
During the course of engagements with clients, how tough was meeting the regulatory compliance mandates? Total
No
impact Could have done better Tough
Patents and Related Regulations
Count 23 26 4 53
% within During the course of engagements with clients, how tough was meeting the regulatory compliance mandates? 15.8% 17.2% 4.8% 13.9%
Price Controls Count 27 17 13 57 % within During the course of engagements with clients, how tough
was meeting the regulatory compliance mandates? 18.5% 11.3% 15.7% 15.0%
Weak Infrastructure Count 7 12 5 24 % within During the course of engagements with clients, how tough
was meeting the regulatory compliance mandates? 4.8% 7.9% 6.0% 6.3%
Forex Movements & Political Risks
Count 4 2 4 10
% within During the course of engagements with clients, how tough was meeting the regulatory compliance mandates?
2.7% 1.3% 4.8% 2.6%
All of the above Count 85 94 57 236
What are the primary challenges which need to be overcome by clients in emerging markets?
% within During the course of engagements with clients, how tough was meeting the regulatory compliance mandates?
58.2% 62.3% 68.7% 62.1%
Total Count 146 151 83 380 % within During the course of engagements with clients, how tough
was meeting the regulatory compliance mandates? 100.0% 100.0% 100.0% 100.0%
Chi-Square Tests
Value df Asymp. Sig. (2-sided) Pearson Chi-Square 13.691(a) 8 .090 Likelihood Ratio 15.249 8 .054 Linear-by-Linear Association 4.339 1 .037 N of Valid Cases 380
a 3 cells (20.0%) have expected count less than 5. The minimum expected count is 2.18.
It is observed that all four challenges i.e. patents related regulations, price controls, weak infrastructure and forex
movements and political risks come in way of offshoring/outsourcing for companies in the emerging markets.

308
FDA is encouraging clients to adopt newer technologies in making the drugs arrive in market sooner and improve healthcare efficiency. Did your organization directly involve in any of these initiatives and supported your esteemed clients? * During the course of engagements with clients, how tough was meeting the regulatory compliance mandates? (SPSS Table 149)
During the course of engagements with clients, how tough was meeting
the regulatory compliance mandates? Total
No
impact Could have done better Tough
No Count 53 43 28 124 % within During the course of engagements with clients, how
tough was meeting the regulatory compliance mandates? 37.3% 29.7% 34.1% 33.6%
Yes Count 89 102 54 245
FDA is encouraging clients to adopt newer technologies in making the drugs arrive in market sooner and improve healthcare efficiency. Did your organization directly involve in any of these initiatives and supported your esteemed clients?
% within During the course of engagements with clients, how tough was meeting the regulatory compliance mandates? 62.7% 70.3% 65.9% 66.4%
Total Count 142 145 82 369 % within During the course of engagements with clients, how
tough was meeting the regulatory compliance mandates? 100.0% 100.0% 100.0% 100.0%
Chi-Square Tests Value df Asymp. Sig. (2-sided) Pearson Chi-Square 1.905(a) 2 .386 Likelihood Ratio 1.912 2 .385 Linear-by-Linear Association .488 1 .485 N of Valid Cases 369
a 0 cells (.0%) have expected count less than 5. The minimum expected count is 27.56.
66.4% of respondents opined that they were involved in supporting their clients with newer technologies as recommended
by FDA. Remaining 33.6% of respondents said they were not involved in such work in the past.

309
Does your organization partner with other Third-Party Service Providers to provide niche services to your clients? * During the course of engagements with clients, how tough was meeting the regulatory compliance mandates? (SPSS Table 150)
During the course of engagements with clients, how tough was meeting
the regulatory compliance mandates? Total
No impact Could have done better Tough
No Count 43 23 22 88 % within During the course of engagements with clients, how tough
was meeting the regulatory compliance mandates? 30.1% 15.4% 25.3% 23.2%
Yes Count 100 126 65 291
Does your organization partner with other Third-Party Service Providers to provide niche services to your clients?
% within During the course of engagements with clients, how tough was meeting the regulatory compliance mandates? 69.9% 84.6% 74.7% 76.8%
Total Count 143 149 87 379 % within During the course of engagements with clients, how tough
was meeting the regulatory compliance mandates? 100.0% 100.0% 100.0% 100.0%
Chi-Square Tests Value df Asymp. Sig. (2-sided) Pearson Chi-Square 9.036(a) 2 .011 Likelihood Ratio 9.299 2 .010 Linear-by-Linear Association 1.614 1 .204 N of Valid Cases 379
a 0 cells (.0%) have expected count less than 5. The minimum expected count is 20.20.
It is observed that IT Service Providers further engage with other third-party providers for including niche skills into their
portfolio and approach clients together with wider skills and capabilities. Also, there is a relationship between the option of
seeking another service providers help based on the past experience of managing regulatory compliance mandates.

310
Has your organization build any industry specific solutions as part of the regulatory agencies requirements e.g. Promotional Spend Compliance (PSC), Process Analytical Technology (PAT) or is in the process of building them? * During the course of engagements with clients, how tough was meeting the regulatory compliance mandates? (SPSS Table 151)
During the course of engagements with clients, how tough was meeting the regulatory compliance mandates? Total
No impact Could have done better Tough
No Count 27 28 23 78 % within During the course of engagements with
clients, how tough was meeting the regulatory compliance mandates?
19.4% 18.7% 26.7% 20.8%
Yes Count 112 122 63 297
Has your organization build any industry specific solutions as part of the regulatory agencies requirements e.g. Promotional Spend Compliance (PSC), Process Analytical Technology (PAT) or is in the process of building them?
% within During the course of engagements with clients, how tough was meeting the regulatory compliance mandates?
80.6% 81.3% 73.3% 79.2%
Total Count 139 150 86 375 % within During the course of engagements with
clients, how tough was meeting the regulatory compliance mandates?
100.0% 100.0% 100.0% 100.0%
Chi-Square Tests
Value df Asymp. Sig. (2-sided) Pearson Chi-Square 2.419(a) 2 .298 Likelihood Ratio 2.320 2 .313 Linear-by-Linear Association 1.373 1 .241 N of Valid Cases 375
a 0 cells (.0%) have expected count less than 5. The minimum expected count is 17.89.
79.2% of respondents responded saying that their company built industry specific solutions and during the course of this
development it was tough meeting the impending regulatory mandates.

311
Does the offshore/outsource model adopted by your organization impact client’s customer care? * Which department/operations in the industry have been primarily associated? (SPSS Table 153)
Which department/operations in the industry have been primarily
associated? Total
R&D, Manufacturing,
QC/QA Sales &
Distribution Clinical
Research Product
Development Other No Count 41 19 7 30 45 142 % within Which department/operations in the
industry have been primarily associated? 39.8% 29.2% 46.7% 43.5% 46.4% 40.7%
Yes Count 62 46 8 39 52 207
Does the offshore/outsource model adopted by your organization impact client’s customer care? % within Which department/operations in the
industry have been primarily associated? 60.2% 70.8% 53.3% 56.5% 53.6% 59.3%
Total Count 103 65 15 69 97 349 % within Which department/operations in the
industry have been primarily associated? 100.0% 100.0% 100.0% 100.0% 100.0% 100.0%
Chi-Square Tests Value df Asymp. Sig. (2-sided) Pearson Chi-Square 5.321(a) 4 .256 Likelihood Ratio 5.447 4 .244 Linear-by-Linear Association 2.191 1 .139 N of Valid Cases
349
a 0 cells (.0%) have expected count less than 5. The minimum expected count is 6.10.
59.3% of respondents agreed that the project activities they manage have an impact on clients’ customer care. Remaining
40.7% disagreed.