stumbling blocks to increasing market discipline in the...
TRANSCRIPT

Stumbling Blocks to IncreasingMarket Discipline in the BankingSector: A Note on Bond Pricing andFunding Strategy Prior to Failure
Julapa Jagtiani
Catharine Lemieux
Emerging Issues SeriesSupervision and RegulationDepartmentFederal Reserve Bank of ChicagoApril 2000 (S&R-99-8R)
1
Stumbling Blocks to Increasing Market Discipline in the Banking Sector:A Note on Bond Pricing and Funding Strategy Prior to Failure
Julapa Jagtiani
Federal Reserve Bank of Chicago
Catharine Lemieux
Federal Reserve Bank of Chicago
Current Draft: April 12, 2000
Abstract
This paper examines pricing behavior for bonds and certificates of deposit issued by bankholding companies (BHCs) and their subsidiary banks in the period prior to failure. It is evidentthat strong market discipline exists in the market for BHC bonds, but there is little or no evidenceof market discipline in the uninsured CD market. We also observe a significant increase in thebanking firm’s reliance on insured deposits as the organization’s financial condition deterioratesprior to failure and following a Moody’s downgrade. These results have several implications forbank supervision and regulation. First, bond spreads could potentially be useful to banksupervisors as a warning signal from the financial markets. Second, proposals to increase marketdiscipline at the BHC level through the bond market would likely be effective. However, BHCstend to avoid market discipline by replacing uninsured debt with insured deposits as the spreadson uninsured debt rise – thus, transferring the responsibility of disciplining the organization fromthe market to bank supervisors. Finally, our investigation suggests that market information suchas bond spreads and changes in Moody's ratings may not add value over and above informationalready collected in the supervisory process.
Direct correspondence to Julapa Jagtiani, Supervision and Regulation, Federal Reserve Bank ofChicago, 230 South LaSalle Street, Chicago, IL 60604-1413. Phone 312-322-5798, Fax 312-322-5894, E-mail: [email protected]. Requests for additional copies should bedirected to the Public Information Center, Federal Reserve Bank of Chicago, P.O. Box 834,Chicago, Illinois 60690-0834, or telephone (312) 322-5111. The Emerging Issues SeriesWorking Papers are located on the Federal Reserve Bank of Chicago's Web site at:http://www.chicagofed.org/publications/workingpapers/emergingissues.cfm
The authors thank Mark Flannery, Myron Kwast, and the referees for their helpful comments andsuggestions. Thanks also to James Nelson for the research idea and Loretta Kujawa for herdedicated research assistance. The opinions expressed in this paper are those of the authors and

2
do not necessarily represent those of the Federal Reserve Bank of Chicago or the FederalReserve System.
Stumbling Blocks to Increasing Market Discipline in the Banking Sector:A Note on Bond Pricing and Funding Strategy Prior to Failure
I. Introduction
Banking deregulation or re-regulation has been an ongoing process since the 1970s.
Many of the restrictions placed on banking as a result of banking panics in the 1920s have been
either lifted or modified by supervisory or legislative action. Geographic barriers and many
product restrictions have been eased. Financial market globalization, product innovations, new
technologies, and consolidation, along with supervisory and regulatory changes, are causing
banks and bank supervisors to reconsider how they do business. Supervisors must balance their
need for information with the burden their presence causes the regulated entities.
An important consideration is how to minimize regulatory burden without compromising
the oversight of the safety and soundness of the organization. This objective can be achieved by
increasing market discipline and the use of market information. Market discipline may be
enhanced by increasing the incentives for debt holders to monitor bank management – thus
complimenting the work of bank supervision. Debt holders can provide bank management with
incentives to limit their risky activities through loan covenants and by demanding a larger risk
premium on bond spreads. In addition, the use of market information in bank supervision can
potentially allow bank supervisors to spend less of their scarce resources collecting information
from bank management – thus reducing regulatory burden and the cost of supervision without
compromising the safety and soundness of the banking system.
Previous studies have examined the role of debt holders in disciplining bank management
and have shown that pricing in the debt market is sensitive to the risk profile of the issuing
banking firms -- Flannery and Sorescu (1996) and Jagtiani, Kaufman, and Lemieux (1999).

3
However, the literature sheds little light on whether debt holders can effectively monitor banking
firms during the period prior to bank failure; i.e., whether market discipline exists when it is
most needed. We attempt to answer this important question by examining whether banks’ and
BHCs’ liabilities are sensitive to the risk of the issuing organization as it approaches failure
(where the federal safety net subsidy is most critical). Understanding the behavior of banks
prior to failure is a critical element of maintaining the stability of the financial system.
The analysis in this paper is divided into two sub-sections. First, we examine the
existence of market discipline imposed on failed banks during the period just prior to failure.
Second, we examine whether the sample failed banks attempted to avoid market discipline by
shifting their funding towards insured deposits. Our results provide implications for proposals
that 1) attempt to utilize debt holders to compliment bank supervision, 2) advocate the use of
bond spreads in bank supervision, and 3) advocate limitations on banks’ organizational structure
in order to contain the federal safety net subsidy. 1
The rest of the paper is organized as follows. Section II describes the data and presents
summary statistics of the data. Section III discusses the empirical methodology and results from
the analysis of market discipline using the pricing of bonds issued by the parent BHCs. Section
IV investigates the changes in the banking firm’s sources of financing during this stress period.
The analysis on certificates of deposit (CDs) issued by failed banks and the shift in their funding
sources during the period just prior to failure are discussed in Section V. Section VI discusses
policy implications of our results for bank supervisory process, and Section VII concludes.
II. The Data
1 See, for example, Evanoff (1993) and Haubrich (1998).

4
Our sample consists of banks that failed during the period 1980 to 1995, whose parent
bank holding company had publicly traded bonds outstanding during the recent quarters prior to
failure. We started with 185 failed banks (104 bank holding companies) during the sample
period. Several of the failed banks were associated with the same bank holding companies, for
example, 28 bank subsidiaries of First Republic Bank Corporation, 20 bank subsidiaries of
Mcorp, 16 bank subsidiaries of First City Bancorp of Texas, and 12 bank subsidiaries of Texas
American Bancshares Inc. Most of the banks on our initial list were eliminated because of the
lack of bond data. None of the banks in our sample had outstanding publicly-traded debt during
the recent quarters prior to their failure. The parent holding companies of five of these failed
banks had outstanding bonds. Our final sample includes the five banks which failed during the
period 1980 to 1995 whose parent holding companies had outstanding bonds as of their fail
date.2 These banks are Continental Bank, MBank, Southeast Bank N.A., Bank of New England,
and Maine Savings Bank. Their parent holding companies are Continental Illinois Corp.,
MCorp, Southeast Bank Corp., Bank of New England Corp., and One Bancorp, respectively. All
of the bonds in our sample are straight bonds, which are not convertible, callable, or putable.3
Bonds issued by Continental Illinois Corp. and MCorp are senior notes, and the rest are
subordinated notes.
Of all the outstanding bonds issued by each of these five parent bank holding companies,
we select the bond that had the most price observations. Our sample period varies, depending on
when the bond was issued and the date of bank failure. For each banking organization, the
sample period starts either twelve quarters prior to failure or when the bond was first traded in
2 A portion of our analysis includes all failed banks in the sample. The results are presented inTable 6.3 Including bonds with a put or a call option will not increase our sample size, because all of thefailed banks or their holding companies which had outstanding callable or puttable bonds alsohad straight bonds outstanding.

5
the secondary market. All the prices (end-of-quarter) used in this paper are secondary market
prices collected from the Moody’s Bond Record and Standard and Poor’s Bond Guide.4 The
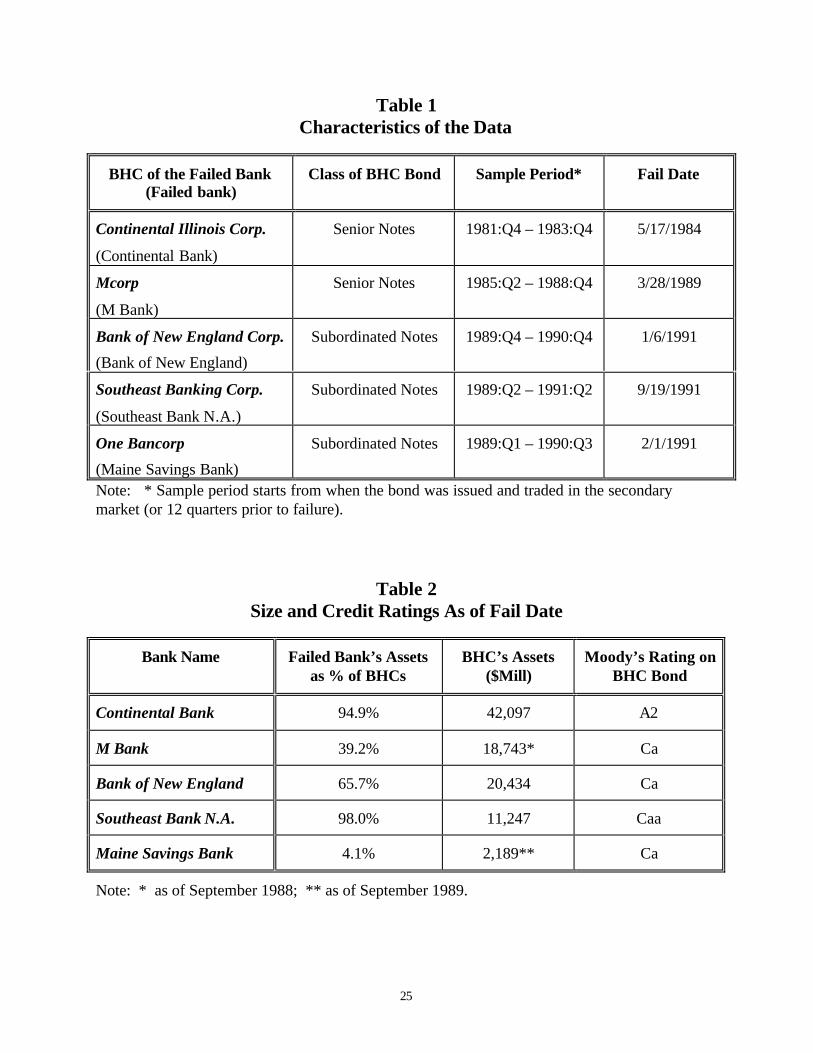
sample banks and their parent holding companies, the date of bank failure, and the sample
periods are listed in Table 1.
The accounting risk characteristics used in this study are collected from the quarterly
Reports of Condition and Income (Call Reports) for banks and from quarterly Y-9 Reports for
bank holding companies. Moody’s historical bond ratings at the end of each quarter are
collected from the monthly Moody’s Bond Record. BOPEC and CAMEL ratings (rated by bank
regulators) are collected from the National Examination Database (NED). In addition to the
limitation on bond data, our study is also limited by availability of the accounting and credit
rating information. For bank holding companies, the accounting data from Y-9 Reports was only
available semi-annually (rather than quarterly) until 1986. For subsidiary banks, the necessary
information for calculating insured deposits was reported only annually (in June) until mid-1991.
In addition, non-performing loan information was reported only semi-annually (in June and
December) until mid-1985. Moreover, the credit ratings by regulators (BOPEC or CAMEL),
which were developed in 1982, are not available on the NED until 1986. Because of these
limitations, our sample observations are significantly reduced in the analysis that involves
insured deposits, bad loans, or BOPEC/CAMEL ratings.
Market capitalization for bank holding companies is calculated from the Standard and
Poor’s Stock Guide. Interest rates on certificates of deposit issued by the sample banks prior to
failure are collected from Bank Rate Monitor. These are weekly averages of 6-month CD rates
for those CDs issued in the last week of the quarter. These CD rates are not available for two
4 It is unlikely, but possible, that some parent holding companies of other failed banks may alsohave had outstanding bonds that meet the requirements to be included in this study. However,

6
banks in our sample: Southeast Bank and Maine Savings Bank. Historical Treasury yields,
which are used in calculating interest rate spreads, are collected from Bloomberg Data Services
and from the Federal Reserve Statistical Release H.15 Selected Interest Rates.
Total consolidated asset size, size of the failed banks (as a porportion of BHCs’ assets),
and the Moody’s rating prior to failure are listed in Table 2. Continental Bank and Southeast
Bank are the primary subsidiaries of their parent BHCs -- comprising approximately 95 percent
of their parent BHC’s assets. Bank of New England and MBank are 66 percent and 39 percent,
respectively, of their parent BHC’s assets. Unlike the rest of the sample, Maine Savings Bank is
only a small fraction (about 4 percent) of One Bancorp, which is the smallest BHC in the sample.
III. Pricing Behavior of Bonds Issued by Parent Bank Holding Companies Prior toFailure of the Subsidiary Banks
Since the critical time when market discipline is most needed is the period prior to
failure, we focus our analysis on the bond pricing behavior during the twelve quarters prior to
failure of the subsidiary banks. We examine whether the bonds issued by BHCs are priced
according to risk and how the pricing behavior changes as failure approaches. This may be
considered an extension of two earlier studies by Jagtiani, Kaufman, and Lemieux (1999) and
Flannery and Sorescu (1996). Jagtiani, Kaufman, and Lemieux (1999) examine the pricing of
bonds issued by 39 large BHCs during the period 1992 to 1997 (post-FDICIA period). Flannery
and Sorescu (1996) examine pricing behavior of BHC bonds during the pre-FDICIA period.
Both studies find some degree of market discipline in the market for bonds issued by BHCs.
However, there has been no study that investigates pricing behavior when banking organizations
are facing financial difficulties.
their prices are not recorded in Moody's Bond Record or Standard and Poor's Bond Guide or theBloomberg Data Services.

7
We examine the relationship between bond spreads and the risk characteristics of the
issuing BHCs. Six different credit risk measures are specified in the model: 1) the issuer’s ratio
of bad loans to total assets; 2) return on assets; 3) percent of insured to total deposits; 4) the
issuer’s leverage ratio; 5) bank regulators’ ratings; and 6) Moody’s bond rating. In addition, a
number of control variables are specified in the model. The control variables include asset size,
a dummy variable that differentiates senior debt from subordinated debt, and bank dummies
identifying each of the sample banks in the fixed-effect equation, as shown in equations (1), (1)',
(2), and (3) below. 5 In order to avoid multicollinearity, the intercept, asset size (LOGTA), and
class of debt dummy (DUMSUB) are excluded from the estimation in equation (1)' when the
bank dummies (DUMConti, DUMSE, DUMNE, DUMOne, and DUMMCorp) are included in the
model. The definition of the variables are given below and summarized in Table 3.
5 Our use of the current values of the variables rather than their lags implicitly assumes that themarket is efficient so that all available information is immediately incorporated into the price ofthe bonds. The previous study by Jagtiani, Kaufman, and Lemieux (1999) reports that using lagvariables when estimating a similar specified equation (spread as of January 31 and accountingvariables as of December 31) does not change the results.
)1.(..............................................................................................................DUMSUBß
ROAßBADLOANßMKTLEVßLOGTAßaSPREAD
i5
it4it3ti2it1it
+
++++=
)2.........(......................................................................eDUM?DUM?DUM?DUM?DUM?MOODY?SPREAD
itMCorp6One5
NE4SE3Conti2it1it
++++++=
)3.......(................................................................................eDUMdDUMd
DUMdDUMdDUMdBOPECdSPREAD
itMCorp6One5
NE4SE3Conti2it1it
++
+++=
)'1(....................eDUMµDUMµDUMµDUMµDUMµ
ROAµBADLOANµMKTLEVµSPREAD
itMCorp8One7NE6SE5Conti4
it3it2ti1it
++++++
++=

8
The dependent variable (SPREAD) is calculated by subtracting the estimated yield on
U.S. Treasury securities with the same term to maturity from the yield on the observed BHC
bond. The Treasury yield is obtained from yield curves as of each quarter-end estimated by
straight-line extrapolation from quarter-end market yields reported by Bloomberg for 3, 6, and 9-
month and 1, 2, and 3-year Treasury securities. Historical rates on Treasury securities are taken
from the Federal Reserve Statistical Release H.15 Selected Interest Rates when not available
from the Bloomberg.
BADLOAN is the ratio of the sum of non-performing and defaulted bank loans plus other
real estate owned, which represents collateral obtained through foreclosure, to total on-balance-
sheet assets (consolidated across all subsidiary banks). BADLOAN includes loans past due over
ninety days that may be accruing or non-accruing. The larger the bad loan ratio is, the greater
the likelihood of loss, and the larger the bond spread. Therefore, a positive coefficient is
expected.
ROA is the ratio of the BHC’s quarterly net income to its quarter-end, on-balance-sheet
assets. The more profitable the BHC is, the less likely it is to default, and the smaller the bond
spread. Therefore, a negative coefficient is expected.
MKTLEV is the leverage ratio measured by the ratio of the book value of total liabilities
to the market value of the BHC’s common stock plus the book value of its perpetual preferred
stocks. This is also the definition used in Jagtiani, Kaufman, and Lemieux (1999) and Flannery
and Sorescu (1996). The higher the leverage is, the more likely bondholders will incur losses,
and the larger the bond spreads. Therefore, a positive coefficient is expected.
MOODY is a cardinalized credit rating for the sampled bonds assigned by Moody’s as of
the end of quarter. The cardinalization is based on Ronn and Verma (1987), ranging from 1 to 9
as shown in the Appendix. The larger numerical ratings indicate poorer credit quality, so a
9
positive coefficient is expected. Below-investment grade bonds are assigned a number larger
than 4.6
BOPEC is the regulator’s credit rating assigned to BHCs based on the examination
results performed by the Federal Reserve. The ratings range from a high of 1 to a low of 5 and
are assigned for each of the components (B=Bank, O=Others, P=Parent, E=Earnings, and
C=Capital) as well as a composite overall rating. This rating system was adopted in 1982,
however, the ratings are available on the NED much later, for example, June 1987 for Mcorp.
These ratings are not available for Continental, which failed in 1984. The BOPEC rating for
Bank of New England was available from December 1987.7 Continental is dropped from the
sample in our analysis when BOPEC/CAMEL ratings are included.
Unlike Moody’s ratings, which may be adjusted continuously, BOPEC is assigned
approximately every twelve to eighteen months. In addition, BOPEC ratings are not assigned on
the same date across the sampled BHCs. BOPEC ratings are subject to an aging problem, which
has been recognized in previous studies. Following previous studies, we attempt to deal with
this problem by taking into account the amount of time that has passed since the rating was
assigned. This is particularly important for those banking firms whose BOPEC was
downgraded. Thus, our measure of the BOPEC rating is a weighted-average of the rating that
was assigned immediately prior to and immediately after the associated observation date. The
weight is time, and more weight is given to the rating that is closer to the relevant date.
6 The cardinalization imposes an implicit assumption that a one-notch deterioration in the ratingis linearly related to the risk profile of the firm. For example, a rating deterioration from Aaa toAa1 (from 1 to 1.66) and from A1 to A2 (from 2.66 to 3.0) are equally bad. In reality, theMoody's rating may not represent a linear progression of the firm's creditworthiness. Jagtiani,Kaufman, and Lemieux (1999) permit nonlinearity by using dummy variables to group thesample bonds, and find that the linearity assumption has no significant effect on the results.7 The last rating available on the NED was assigned in December 1989, and the bank failed inJanuary 1991.
10
In addition to the aging problem, the overall composite BOPEC ratings tend to vary little
across our sample BHCs. This may be due to the deteriorating financial condition of the banking
organization in our sample. It is important to point out that these composite BOPEC ratings are
relatively subjective, and are not obtained through a mathematical formula based on the
individual components (B,O,P,E,C). Unlike the composite rating, the rating of the individual
components tends to vary significantly across failed banks, reflecting the varying condition of
the components across these banks, and through time. Our measure of BOPEC is an average of
each component’s weighted-average rating.
Several control variables are included in the model. LOGTA is the log of total
consolidated assets. DUMSUB is a dummy variable which is equal to one for subordinated debt
(Bank of New England Corp., Southeast Bank Corp., and One Bancorp) and zero for senior debt
(Continental Illinois Corp. and MCorp). Finally, DUMConti, DUMSE, DUMNE, DUMMCorp, and
DUMOne are bank dummies, which take the value of one for Continental Illinois Corp., Southeast
Bank Corp., Bank of New England Corp., MCorp, and One Bancorp, respectively, and zero
otherwise. As mentioned earlier, these bank dummies are included to capture the fixed-effect
when LOGTA and DUMSUB are not in the model. The empirical results are presented in Table
4 and in Figures I and II.8
From Table 4 (column 1), estimated based on equation (1), all but one of the variables are
significant with the expected signs. BHCs with more bad loans (BADLOAN) and BHCs that are
less profitable (PROFIT) are required to pay a larger spread. DUMSUB is also significantly
positive as expected, indicating that subordinated notes are subject to a larger risk premium than
senior notes. The leverage ratio (MKTLEV) is not significant. We have also examined the
various interactive terms of MKTLEV with bad loans and profitability, but they are also not

11
significant.9 The results suggest that the market does not view leverage to be important in
determining the spread required to hold bonds issued by BHCs during the period prior to failure
of the subsidiary bank. This is consistent with Peek and Rosengren (1997a and 1997b).10 Our
accounting risk factors overall explain about 66 percent of the variation in spread during this
stress period. The results suggest that there is strong market discipline in the market for BHC
bonds during the period prior to failure.
The regression in Table 4 (column 1'), estimated based on equation (1)', uses a model that allows
each BHC to have a different intercept capturing the effect of firm-specific variables not being
included in the model. The intercept, asset size, and DUMSUB, which are included in column 1
are not included here to avoid multicolinearity. When individual bank variations are considered,
the results remain consistent with those reported in column 1. The coefficients of BADLOAN
and PROFIT remain unchanged in terms of sign and magnitude, although the significance of
PROFIT declines from the 1 percent level to 11 percent. Overall, the general results hold that
BHCs with more bad loans and BHCs that are less profitable pay a larger bond spread. The
regressions in columns 2 and 3 of Table 4 show that both MOODY and BOPEC credit ratings
are significantly positive as expected. MOODY and BOPEC, along with the firm-specific
dummies, explain approximately 73 percent and 64 percent, respectively, of the variation in
spreads across firms and through time. It is interesting that, unlike in the MOODY equation (2),
8 Because of the collinearity between the size and debt seniority dummies and the institutiondummies, they are not simultaneously included in our estimation.9 However, Jagtiani, Kaufman, and Lemieux (1999) find that, under normal financial conditions,less-capitalized banks are penalized more than better-capitalized ones for each additional unit ofincreased risk as measured by these ratios.10 Peek and Rosengren (1997a and 1997b) report that several banks were classified as well-capitalized by bank regulators until a few quarters or even one quarter prior to failure during theNew England banking crisis. They also find that for one-third of those failed banks, the leverageratio declined by more than 5 percentage points in a single quarter, enough to wipe out the entirecapital of any bank below the well-capitalized threshold.
12
in the BOPEC equation (3), only the DUMNE variable is significant, implying that regulators'
ratings capture a bank's firm-specific characteristics more completely than the ratings assigned
by credit rating agencies. Again, market discipline exists during this most critical period.
The results here are consistent with our earlier work (Jagtiani, Kaufman, and Lemieux
1999), which examines the pricing of BHC bonds under normal financial conditions. Comparing
these results with Jagtiani, Kaufman, and Lemieux (1999) shows that, at the BHC level, market
discipline is stronger when it is most needed; i.e., when the subsidiary bank is in real financial
difficulties. From Figure I, bond spreads range widely from under 1 percent to extremely large
spreads prior to failure -- just under 20 percent for Mcorp. and 30 percent for Southeast. For
Bank of New England, the spread was about 70 percent two quarters prior to failure, and up to
100 percent just before its failure. In contrast, Jagtiani, Kaufman, and Lemieux (1999) report a
very small range of bond spreads (less than 1 percent) in the normal environment.
It is obvious from Figure I that the market penalizes the banks by charging dramatically
larger spreads starting approximately five or six quarters prior to failures, particularly for Bank
of New England Corp., MCorp, and Southeast Bank Corp. The spread did not change very much
for One Bancorp, probably because its failed subsidiary bank, Maine Savings Bank, was only a
small fraction of the overall BHC (about 4 percent of the BHC’s assets), as reported in Table 2.
In the case of Continental Illinois Corp., the spread also did not increase much, although the
failed bank was about 65 percent of the BHC’s assets. This is quite unusual, and may be
explained by the fact that the market and the credit rating agencies at that time seemed to believe
that actions taken by Continental Bank’s management to restructure its liabilities would resolve
the bank’s financial problems.11 As shown in Figure II, the Moody’s rating for Continental
11 Continental Bank was forced to take a $61 million write-off in the third quarter of 1982 as aresult of its financial relationship with Penn Square, a bank in Oklahoma which failed on July 5,1982. To counter the loss in investor confidence which forced the bank out of the Fed Funds and
13
Illinois Corp. did not deteriorate as much as the other sampled BHCs. The rating on
Continental’s bonds remained at A2 until the bank actually failed, compared with Caa and Ca for
other sample BHCs. Overall, the credit ratings fell below investment grade around eight quarters
prior to failure.
Our results in this section provide two important policy implications for bank
supervision. First, since BHC bonds are priced according to risk, requiring banking
organizations to issue debt in greater volume and frequency will likely enhance market discipline
in the banking system, due to the increased oversight of bank management by concerned
bondholders. Second, since spreads on BHC bonds rise sharply as the subsidiary banks’
financial health deteriorates, regulators may be able to augment supervisory information with
market information on spreads on publicly traded debt issued by banking organizations.
Whether or not this market information adds to information already collected in the supervisory
process is discussed in further detail in Section VI.
IV. Changes in Funding Sources During the Period Prior to Failure of the SubsidiaryBanks
The previous section demonstrates that market discipline exists. This section examines
whether the banking firms can avoid market discipline by shifting their funding sources when
their credit ratings deteriorate prior to failure. As mentioned earlier, we are subject to data
limitations in that the information on insured deposits was reported only annually until mid-
1986. Therefore, our measure of INSURED for Continental (failed in 1984) and MCorp (failed
domestic CD markets and into the Eurodollar interbank market, the bank began to downsize --reducing its total assets by about 50 percent. As seen in the improvement in the Moody's ratings,the market seemed to feel that these actions would take care of Contintental's financialdifficulties.
14
in March 1989) was obtained through a straight-line extrapolation of existing data for the
missing quarters when possible.
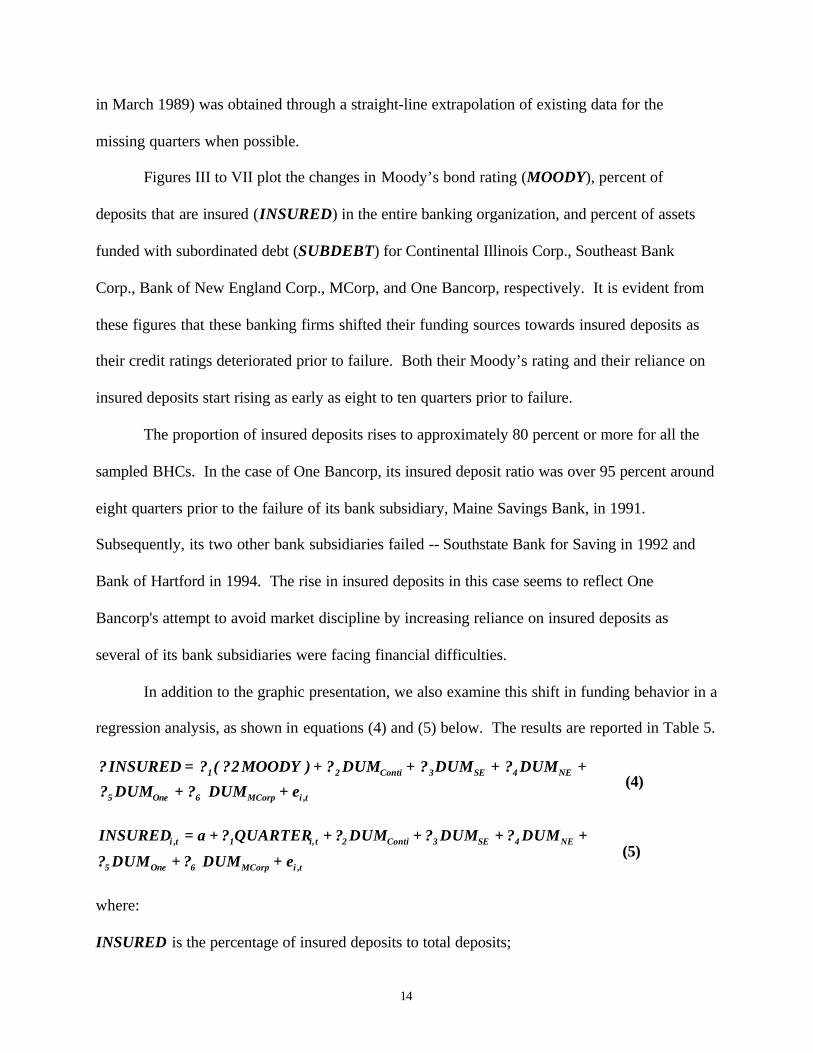
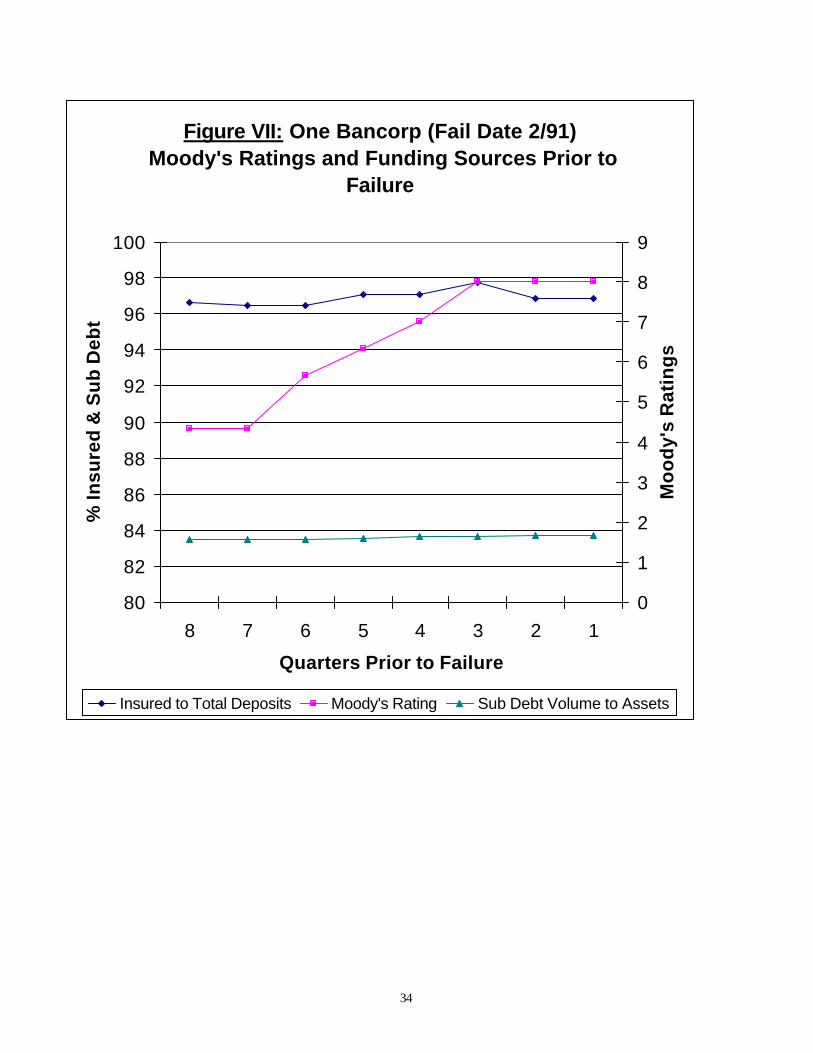
Figures III to VII plot the changes in Moody’s bond rating (MOODY), percent of
deposits that are insured (INSURED) in the entire banking organization, and percent of assets
funded with subordinated debt (SUBDEBT) for Continental Illinois Corp., Southeast Bank
Corp., Bank of New England Corp., MCorp, and One Bancorp, respectively. It is evident from
these figures that these banking firms shifted their funding sources towards insured deposits as
their credit ratings deteriorated prior to failure. Both their Moody’s rating and their reliance on
insured deposits start rising as early as eight to ten quarters prior to failure.
The proportion of insured deposits rises to approximately 80 percent or more for all the
sampled BHCs. In the case of One Bancorp, its insured deposit ratio was over 95 percent around
eight quarters prior to the failure of its bank subsidiary, Maine Savings Bank, in 1991.
Subsequently, its two other bank subsidiaries failed -- Southstate Bank for Saving in 1992 and
Bank of Hartford in 1994. The rise in insured deposits in this case seems to reflect One
Bancorp's attempt to avoid market discipline by increasing reliance on insured deposits as
several of its bank subsidiaries were facing financial difficulties.
In addition to the graphic presentation, we also examine this shift in funding behavior in a
regression analysis, as shown in equations (4) and (5) below. The results are reported in Table 5.
t,iMCorp6One5
NE4SE3Conti21
eDUM?DUM?
DUM?DUM?DUM?)MOODY2?(?INSURED?
++
++++= (4)
t,iMCorp6One5
NE4SE3Conti2t,i1t,i
eDUM?DUM?
DUM?DUM?DUM?QUARTER?aINSURED
++
+++++=(5)
where:
INSURED is the percentage of insured deposits to total deposits;

15
QUARTER is the number of quarters prior to the fail date;
? INSURED is the change in INSURED from the previous quarter (INSUREDt minus
INSURED t-1);
2? MOODY is the change in the Moody's rating between the previous two quarters and the
previous quarter (MOODYt-1 minus MOODYt-2).
From Table 5 (Column 1), the coefficient of 2? MOODY is significantly positive,
indicating that a Moody’s downgrade causes banking firms to increase their portion of insured
deposit funding in the next quarter. Changes in Moody’s bond rating along with the firm-
specific dummies explain approximately 93 percent of the variation in changes in insured deposit
funding.12 From column 2, the coefficient of QUARTER is significantly negative, indicating
that our sampled failed banks increased their reliance on insured deposits as they approached
failure. The results are consistent with our earlier findings that these failed banks tend to shift
their funding towards insured deposits to take advantage of the federal safety net prior to failure.
To summarize, we find that a Moody’s downgrade of BHC bonds causes the BHC’s
subsidiary banks to increase their reliance on insured deposits as a source of funding in order to
avoid being penalized by the market (as the price of uninsured funds rises). Our results concur
with those of Billet, Garfinkel, and O’Neal (1998), suggesting that the federal safety net subsidy
may be maximized by the banking firms through their increased use of insured deposits as their
financial condition deteriorates. These results also provide important implications for bank
supervision and regulation. Bank supervisors can minimize this risk in several ways -- for
example, by limiting the amount of time available for the funding shift, by restricting access to
insured deposit funding by monitoring interest rates paid on insured funds, or by limiting risky
12 Our analysis suggest that there is no auto-correlation problem in our data. The results remainunchanged when the White's correction for auto-correlation was performed.

16
activities undertaken by insured institutions.13 It is important to note that these results indicate
that insured deposit funding at the bank may be used to replace uninsured funding at the
consolidated BHCs.
V. Examination of Pricing of CDs Issued by the Failed Banks and the Shift in TheirFunding Sources Prior to Failure
We would ideally like to examine the pricing of publicly traded bonds issued by our
sample of failed banks in the quarters prior to failure. Because this data is not available, our
analysis focuses on the spreads on certificates of deposit (rather than bond spreads) issued by the
sample banks. Two sets of CD rates are used – 1) CD rates reported in the weekly publication
Bank Rate Monitor, and 2) imputed CD rates calculated from the bank’s quarterly Call Report
data. The rates reported by Bank Rate Monitor have the advantage of listing a specific maturity,
but they are rates on regular, fixed-rate CDs (not uninsured). The rates calculated from the Call
Report data are based on uninsured CDs (those more than $100,000), but they do not have a
specific associated maturity reported. The spreads for these uninsured CDs are calculated under
the assumption that the average maturity is 6 months; thus, 6-month Treasury rates are used in
the spread calculation.
From Figure VIII, spreads on insured CDs (as reported in Bank Rate Monitor) fluctuate
with no clear pattern as the fail date approaches. Some of these CD rates are below the matching
Treasury rates (negative spreads) even one quarter prior to failure (for Continental Bank). The
results suggest that market discipline does not exist in the market for certificates of deposit. This
is not surprising because of the federal deposit guarantee provided to insured depositors.
13 Many of these restrictions are incorporated in the discretionary and mandatory provisionsunder Prompt Corrective Action.

17
Figure IX attempts to investigate the spreads on uninsured CDs. Although they are not
explicitly insured by the FDIC, the market may perceive the FDIC insurance to be extended to
cover uninsured CDs as well. These uninsured CD rates are defined as the percentage of interest
expenses on CDs larger than $100,000 to total outstanding jumbo CDs at the end of quarter.14
We observe no clear pattern of rising uninsured CD spreads as the fail date approaches. The
spreads rise as the fail date approaches for Bank of New England and Maine Savings Bank.
However, the spreads decline sharply for Continental Bank and decline slightly for Southeast
Bank and MBank as the fail date approaches. It is not clear that market discipline exists in the
market for uninsured CDs. Uninsured CDs may be perceived by the market to be implicitly
protected by the federal safety net. It should be noted, however, that our conclusion here is
based on data for banks that failed prior to FDICIA (December 1991). FDICIA made significant
changes in the supervision and resolution of problem banking organizations, and may have
changed the market’s perception of the extension of the federal safety net.15
For a rigorous testing, we expand our analysis to include all the failed banks whether or
not they or their holding companies may have had outstanding bonds. Specifically, our sample
for this section of the study includes other 166 commercial banks (with no outstanding bonds),
which were larger than $1 million as of failure and failed during the period 1985 to 1994.16 We
investigate the changes in their funding strategy for the period between twelve quarters prior to
14 The quarterly interest expenses are annualized prior to subtracting the matching Treasuryrates.15 Baer and Brewer (1986) and Hannan and Hanweck (1988) find market discipline exists foruninsured deposits during the normal environment. Their data is also for the pre-FDICIA period.The measure of uninsured CD rates used in Baer and Brewer is the same measure as thst beingused in this paper (based on the quarterly Call Report).16 Of these 166 failed banks with more than $100 million in total assets, 151 of them (93percent) are smaller than $2 billion in assets, and all of them are smaller than $15 billion. Whilethere are total of 1,270 commercial banks that failed during the period 1985-1994, we excludethose small community banks smaller than $100 million in our extension since they tend to relyon insured deposits regardless of whether or not they approach failure.

18
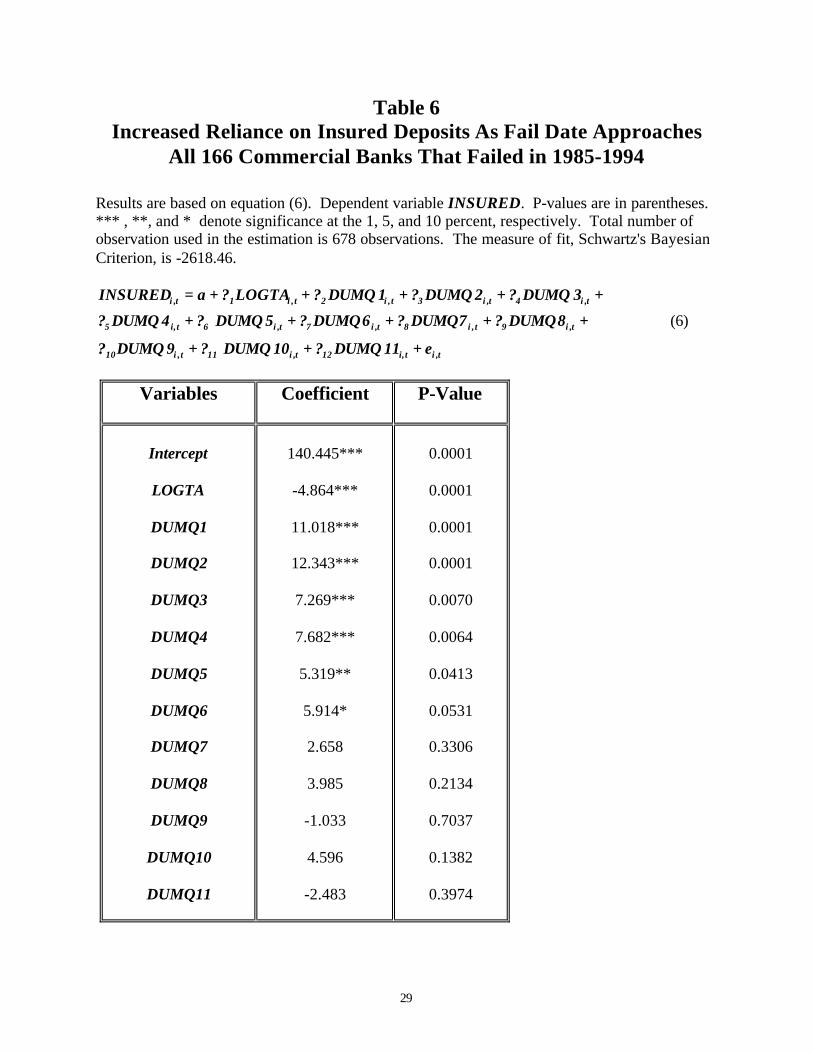
failure and the fail date. We estimate the model, as written in equation (6), using a time-series
cross-sectional regression analysis.
t,it,i12t,i11t,i10
t,i9t,i8t,i7t,i6t,i5
t,i4t,i3t,i2t,i1t,i
e11DUMQ?10DUMQ?9DUMQ?
8DUMQ?7DUMQ?6DUMQ?5DUMQ?4DUMQ?
3DUMQ?2DUMQ?1DUMQ?LOGTA?aINSURED
+++
+++++
+++++=
(6)
The explanatory variables include log of total asset size (LOGTA) and eleven dummy
variables representing the number of quarters prior to failure, where:
DUMQ1 is a dummy equal to 1 for the period one quarter prior to failure and zero otherwise;
DUMQ2 is equal to 1 for the period two quarters prior to failure, and zero otherwise; …..
DUMQ11 is equal to 1 for the period eleven quarters prior to failure, and zero otherwise. All the
eleven dummy variables take the value of zero in the period twelve quarters prior to failure. The
results, presented in Table 6, indicate that the coefficients of DUMQ1, DUMQ2, DUMQ3,
DUMQ4, DUMQ5, and DUMQ6 are significantly positive, while the coefficients of DUMQ7 to
DUMQ11 are not significant. In addition, the magnitude of the coefficients seem to increase
continuously from DUMQ6 to DUMQ2, indicating larger coefficients as the failure approaches.
Thus, the overall results suggest that the sample failed banks started increasing their insured
deposits funding around six quarters prior to failure, and that their reliance on insured deposits
continued to rise and started to flatten out at around two quarters prior to failure. The results,
again, confirm our earlier findings regarding the attempts by failed banks to rely more on insured
deposits as a funding source as they approach failure as a way to avoid market discipline.
VI. Did the Market (Bondholders) Know More Than Bank Regulators Prior to Failure?
Our results reported in the previous sections indicate that market information (i.e. bond
spreads and Moody's ratings) about the trouble banking institutions was conveyed approximately

19
six quarters prior to failure. The results imply that regulators may be able to augment market
information in the supervisory process. However, it is arguable that this information may not
add value to the supervisory process if bank regulators have already obtained the information
prior to it being conveyed through the market in terms of changes in bond spreads and credit
ratings. Our discussion in this section aims to shed some light on this important issue.
It should be pointed out here that regulators’ knowledge is not necessarily completely
embodied in the BOPEC ratings. As a bank’s condition deteriorates, regulators tend to focus on
capital levels, loan losses, and management oversight, rather than revising the BOPEC ratings.
We investigate regulators' action prior to the failure, particularly to see whether these actions
were taken prior to the changes in bond spread or Moody's ratings. Each of the five BHCs in our
analysis is disussed below:
Continental Illinois (failed in May 1984): Problems became evident in July 1982, when
news of the failure of Penn Square Bank broke, and nonperforming assets increased sharply.
Moody's downgraded Continental’s unsecured long-term debt to Aa3 in July 1982. Prior to that,
an examination of the Continental Corp. conducted in April 1982 by the OCC exposed the
weakened condition of the BHC, and the subsequent report outlined the areas needing
improvement and proposed a program of enhanced supervisory oversight. This three-month lag
between market reaction and regulator reaction implies that regulator had superior information
than the market. In addition, Continental's bond spreads did not respond strongly to the
deteriorating condition, and Moody’s also responded slowly to the developing situation. 17
Bank of New England (failed in January 1991): The bank's troubles became obvious to
the market in November 1989 (about five quarters prior to failure) when it announced a
17 Moody's later downgraded Continental’s unsecured long-term debt again to A2 in October of1982; and to A3 in February 1984. The ratings never reached those typical of a failinginstitution (i.e., Caa or Ca).

20
“substantial” loss in the fourth quarter. Bond spreads also started to rise sharply. The Federal
Reserve and the OCC responded to the news by conducting a joint special examination on
liquidity, capital position and credit quality in December 1989. The examination resulted in a
consent order between the BHC and the federal regulators to develop a plan to get the BHC back
on track. Moody’s also started to downgrade Bank of New England’s subordinated debt around
the same time (in December 1989).18 In this case, both market information and supervisory
information seem to be equally timely. 19
One Bancorp (failed in February 1991): Problems started in April 1989 when a
“substantial increase” in nonperforming real estate loans was reported. The examination
conducted by the FDIC in June 1989 (slightly more than six quarters prior to failure) resulted in
the filing of a Cease and Desist order on the basis of poor asset quality, excessive concentration
of real estate development credits, inadequate equity capital, and other violations in January
1990. Moody’s also responded promptly to the news of initial problems in April 1989 by
downgrading One Bancorp’s subordinated debt to B1. However, Moody's was slow in its
subsequent downgrades and did not downgrade to Ca until after One Bancorp publicly
announced the orders handed down by the FDIC. In addition, there was no strong reaction from
bondholders, thus, keeping the spreads relatively flat until failure. This presents another example
of superior supervisory information compared to market.
Southeast Bank Corp. (failed in September 1991): In this case, regulator information is
clearly superior to market information. The problem became known because the federal
18 Moody's downdraded the bank's subordinated debt to Ba3 in December 1989; to Caa inJanuary 1990; and finally to Ca in April 1990.
19 Randall (1993) documents that the seriousness of the problems at New England banks"became apparent to supervisors only gradually…. There were numerous instances of two- or

21
regulators announced a special investigation into the bank's credit quality in March 1990. Later,
the bank's own action to cut its quarterly dividend in June 1990 aggravated the situation.
Moody’s downgraded Southeast’s subordinated debt promptly in March 1990 (six quarters prior
to failure) and again in June 1990. In July 1990, regulators (the OCC and the Federal Reserve
Bank of Atlanta) negotiated an agreement with Southeast to boost its capital and strengthen its
credit-related policies. This action by regulators (slightly less restrictive than a cease and desist
order) took place about five quarters prior to failure. Moody's, however, was slow in their
subsequent downgrades, and failed to downgrade Southeast’s debt to Caa until April 1991 (less
than two quarters before failure), and never downgraded it to Ca.
MCorp (failed in March 1989): MCorp’s difficulties first became public in January 1986,
when bad loans linked to the energy sector doubled in the fourth quarter of 1985. Unlike the
other four cases, where regulators intervened promptly when the first warning signs became
public, in this case the federal regulators did not take aggressive supervisory action. The market,
on the other hand, acted much more promptly. MCorp's debt was downgraded by Moody's to
below-investment grade approximately eight quarters prior to failure, and bond spreads started to
shoot up between five and six quarters prior to failure.20
Overall, our investigation of the warning signs that led to the failures of the five BHCs
under study suggests that market information, such as changes in bond spreads and credit rating
by rating agencies, do not seem to add value over and above information already collected in the
supervisory process. The federal regulators intervened in an attempt to prevent failure prior to
the ratings agencies severely downgraded the institutions’ debt in four of the five cases (Mcorp
three-step drops in bank ratings, and infrequent examinations appear to have contributed to thisto some extent."20 Moody's did not downgrade MCorp to Caa until July 1988 (less than three quarters prior tofailure) since the agency believed that MCorp provided debtholders with numerous protectionincluding adequate capitalization and a well-structured funding base.
22
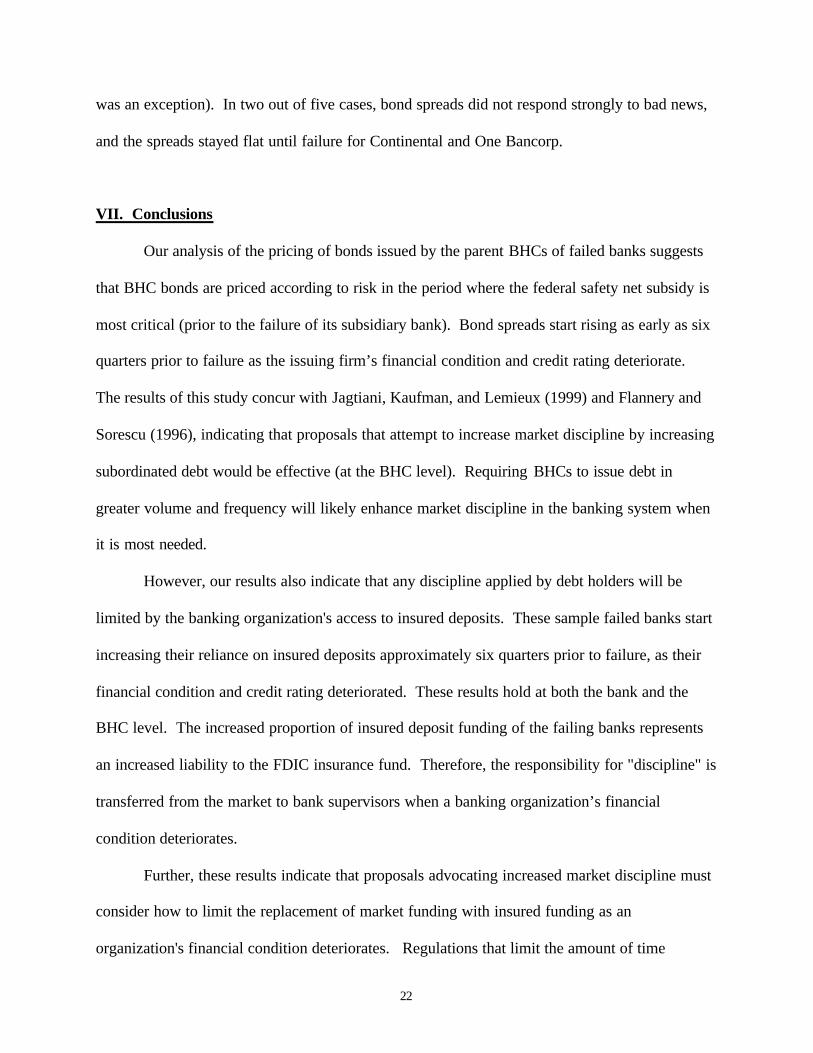
was an exception). In two out of five cases, bond spreads did not respond strongly to bad news,
and the spreads stayed flat until failure for Continental and One Bancorp.
VII. Conclusions
Our analysis of the pricing of bonds issued by the parent BHCs of failed banks suggests
that BHC bonds are priced according to risk in the period where the federal safety net subsidy is
most critical (prior to the failure of its subsidiary bank). Bond spreads start rising as early as six
quarters prior to failure as the issuing firm’s financial condition and credit rating deteriorate.
The results of this study concur with Jagtiani, Kaufman, and Lemieux (1999) and Flannery and
Sorescu (1996), indicating that proposals that attempt to increase market discipline by increasing
subordinated debt would be effective (at the BHC level). Requiring BHCs to issue debt in
greater volume and frequency will likely enhance market discipline in the banking system when
it is most needed.
However, our results also indicate that any discipline applied by debt holders will be
limited by the banking organization's access to insured deposits. These sample failed banks start
increasing their reliance on insured deposits approximately six quarters prior to failure, as their
financial condition and credit rating deteriorated. These results hold at both the bank and the
BHC level. The increased proportion of insured deposit funding of the failing banks represents
an increased liability to the FDIC insurance fund. Therefore, the responsibility for "discipline" is
transferred from the market to bank supervisors when a banking organization’s financial
condition deteriorates.
Further, these results indicate that proposals advocating increased market discipline must
consider how to limit the replacement of market funding with insured funding as an
organization's financial condition deteriorates. Regulations that limit the amount of time

23
available for the funding shift, restrict access to insured deposit funding by monitoring interest
rate offered to insured depositors, or limit risky activities will enhance the ability of proposals
that advocate issuing debt in greater volume and frequency to increase market discipline.
Again, the results indicate that the market price of debt is related to the financial
condition of the issuer, and that credit rating agencies recognize the deteriorating financial
condition as early as six quarters prior to failure. While previous studies of bond spreads for
healthy BHCs find spreads range of several basis points across BHCs, we find that spreads for
troubled banking organizations are many times those of healthy BHCs. However, this market
information may not add value over and above information already collected in the supervisory
process.
24
References
Baer, Herbert and Elijah Brewer, “Uninsured Depositors as a Source of Market Discipline:Some New Evidence,” Federal Reserve Bank of Chicago: Economic Perspectives,September/October 1986, 23-31.
Billett, Matthew, Jon Garfinkel, and Edward O’Neal, “The Cost of Market Versus RegulatoryDiscipline in Banking,” Journal of Financial Economics 48, Number 3, June 1998, 333-353.
Evanoff, Douglas, “Preferred Sources of Market Discipline,” Yale Journal on Regulation,Summer 1993, 347-362.
Flannery, Mark and Sorin Sorescu, “Evidence of Bank Market Discipline in SubordinatedDebenture Yields: 1983-1991,” Journal of Finance, September 1996, 1347-1377.
Hannan, Timothy and Gerald Hanweck, “Bank Insolvency Risk and the Market for LargeCertificates of Deposit,” Journal of Money, Credit, and Banking 20, 1988, 203-212.
Haubrich, Joseph, “Subordinated Debt: Tough Love for Banks?” Federal Reserve Bank ofCleveland: Economic Commentary, December 1998.
Jagtiani, Julapa, George Kaufman, and Catharine Lemieux, “Do Market Discipline Banks andBank Holding Companies? Evidence From Debt pricing, ” Working paper # S&R-99-3R,Emerging Issues Series, Federal Reserve Bank of Chicago, June 1999.
Peek, Joe and Eric Rosengren, “Will Legislated Early Intervention Prevent the Next BankingCrisis?” Southern Economic Journal, July 1997a, 268-280.
------------, “How well Capitalized Are Well-Capitalized Banks?” New England EconomicsReview, Federal Reserve Bank of Boston, September/October 1997b, 41-50.
Randall, Richard, "Lessons from New England Bank Failures," New England EconomicReview, Federal Reserve Bank of Boston, May/June 1993, 13-38.
Ronn, Ehud and Avinash Verma, “A Multi-Attribute Comparative Evaluation of Relative Riskfor a Sample of Banks” Journal of Banking and Finance 11, 1987, 499-523.
25
Table 1Characteristics of the Data
BHC of the Failed Bank(Failed bank)
Class of BHC Bond Sample Period* Fail Date
Continental Illinois Corp.
(Continental Bank)
Senior Notes 1981:Q4 – 1983:Q4 5/17/1984
Mcorp
(M Bank)
Senior Notes 1985:Q2 – 1988:Q4 3/28/1989
Bank of New England Corp.
(Bank of New England)
Subordinated Notes 1989:Q4 – 1990:Q4 1/6/1991
Southeast Banking Corp.
(Southeast Bank N.A.)
Subordinated Notes 1989:Q2 – 1991:Q2 9/19/1991
One Bancorp
(Maine Savings Bank)
Subordinated Notes 1989:Q1 – 1990:Q3 2/1/1991
Note: * Sample period starts from when the bond was issued and traded in the secondarymarket (or 12 quarters prior to failure).
Table 2Size and Credit Ratings As of Fail Date
Bank Name Failed Bank’s Assetsas % of BHCs
BHC’s Assets($Mill)
Moody’s Rating onBHC Bond
Continental Bank 94.9% 42,097 A2
M Bank 39.2% 18,743* Ca
Bank of New England 65.7% 20,434 Ca
Southeast Bank N.A. 98.0% 11,247 Caa
Maine Savings Bank 4.1% 2,189** Ca
Note: * as of September 1988; ** as of September 1989.

26
Table 3Summary of Variable Definitions
Variables Definition
SPREAD
LOGTA
MKTLEV
BADLOAN
PROFIT
INSURED
LAG(INSURED)
MOODY
LAG(MOODY)
BOPEC
CAMEL
DUMSUB
SUBDEBT
DUMConti
DUMMCorp
DUMOne
DUMSE
DUMNE
Bond yield minus maturity-matched Treasury rate (%)
Log of total on-balance-sheet assets
Book value of total liabilities divided by market value of equity plus bookvalue of perpetual preferred stock
Loans past due over 90 days (accruing and non-accruing) plus OREO to totalassets (%)
Net income to total assets (%)
Insured deposits to total deposits (%)
Insured deposits to total deposits in the previous quarter (%)
Cardinalized Moody’s bond rating (larger number for poorer rating)
Cardinalized Moody’s bond rating in the previous quarter
Average of the weighted-average (aging) of B, O, P, E, and C
Average of the weighted-average (aging) of C, A, M, E, and L
Dummy variable equals to 1 for subordinated debt, zero for senior debt
Total subordinated debt outstanding to total assets (%)
Dummy variable that equals 1 for Continental Illinois Corp., zero otherwise
Dummy variable that equals 1 for MCorp, zero otherwise
Dummy variable that equals 1 for One Bancorp, zero otherwise
Dummy variable that equals 1 for Southeast Banking Corp., zero otherwise
Dummy variable that equals 1 for Bank of New England, zero otherwise

27
Table 4Spread on Bonds Issued by BHCs whose Bank Subsidiary Failed
Important Factors that Determine SPREAD in the Period Prior to Failure
Dependent variable is SPREAD. P-values are in parentheses. *** and ** denote significance atthe 1 and 5 percent level respectively.
Variable (1) (1)' (2) (3)
Intercept -322.1658***(0.00001)
LOGTA 17.6782***(0.0001)
BADLOAN 4.0076***(0.0001)
2.7321***(0.0038)
MKTLEV 0.0107(0.5259)
0.0129(0.3974)
PROFIT -1.9546***(0.0004)
-0.6775(0.1100)
DUMSUB 24.8696***(0.0001)
DUMMCorp -13.3348**(0.0440)
-17.8162**(0.0210)
-22.9837(0.2442)
DUMConti 2.5507(0.6878)
7.6908(0.2677)
DUMSE 11.9194**(0.0355)
1.6996(0.7285)
5.1278(0.5208)
DUMNE 37.5698***(0.0001)
39.3841***(0.0001)
42.9477***(0.0001)
DUMONE -12.7728**(0.0453)
-11.9285**(0.0480)
0.0869(0.9920)
BOPEC 7.4822*(0.0890)
MOODY 4.9280***(0.0001)
Adjusted R2 0.6629 0.7270 0.7311 0.6384
N 39 39 39 28

28
Table 5Increased Reliance on Insured Deposits Following Moody’s Downgrade
And As the Fail Date Approaches
Results are based on equations (4) and (5). Dependent variable in equation (4) is ? INSURED,which is the change in proportion of insured deposits from the previous quarter, and defined asINSURED t minus INSUREDt-1. The variable 2? MOODY is the change in the Moody's ratingbetween the previous two quarters and the previous quarter, and defined as MOODYt-1 minusMOODYt-2. P-values are in parentheses. *** , **, and * denote significance at the 1, 5, and 10percent, respectively.
Dependent Variable= ? (INSURED)
DependentVariable =INSURED
Equation (4) Equation (5)
2? (MOODY) 0.6279**(0.0145)
QUARTER -0.5939***(0.0019)
DUMConti 5.8575***(0.0001)
-9.0943***(0.0001)
DUMSE 1.9054***(0.0001)
-3.8206***(0.0077)
DUMNE 1.0957*(0.0772)
3.8281*(0.0529)
DUMONE -0.1719(0.5441)
17.0576***(0.0001)
DUMMcorp -0.2133(0.2518)
82.8892***(0.0001)
Adjusted R2
(N)0.9351(N=24)
0.9171(N=33)
29
Table 6Increased Reliance on Insured Deposits As Fail Date Approaches
All 166 Commercial Banks That Failed in 1985-1994
Results are based on equation (6). Dependent variable INSURED. P-values are in parentheses.*** , **, and * denote significance at the 1, 5, and 10 percent, respectively. Total number ofobservation used in the estimation is 678 observations. The measure of fit, Schwartz's BayesianCriterion, is -2618.46.
t,it,i12t,i11t,i10
t,i9t,i8t,i7t,i6t,i5
t,i4t,i3t,i2t,i1t,i
e11DUMQ?10DUMQ?9DUMQ?
8DUMQ?7DUMQ?6DUMQ?5DUMQ?4DUMQ?
3DUMQ?2DUMQ?1DUMQ?LOGTA?aINSURED
+++
+++++
+++++=
(6)
Variables Coefficient P-Value
Intercept
LOGTA
DUMQ1
DUMQ2
DUMQ3
DUMQ4
DUMQ5
DUMQ6
DUMQ7
DUMQ8
DUMQ9
DUMQ10
DUMQ11
140.445***
-4.864***
11.018***
12.343***
7.269***
7.682***
5.319**
5.914*
2.658
3.985
-1.033
4.596
-2.483
0.0001
0.0001
0.0001
0.0001
0.0070
0.0064
0.0413
0.0531
0.3306
0.2134
0.7037
0.1382
0.3974

30
Appendix
Cardinalization Table of Moody’s Rating Based on Ronn and Verma (1987)
Moody’s Bond Rating Cardinalization
Aaa 1.00 Aa1 1.66
Aa2 2.00 Aa3 2.33
A1 2.66 A2 3.00 A3 3.33
Baa1 3.66 Baa2 4.00 Baa3 4.33
Ba1 4.66 Ba2 5.00 Ba3 5.33
B1 5.66 B2 6.00 B3 6.33
Caa 7.00 Ca 8.00 C 9.00

31
Figure I: Monthly Bond Spreads Prior to Failure
0102030405060708090
100110
10 9 8 7 6 5 4 3 2 1
Quarters Prior to Failure
Sp
read
(%)
Continental (5/84)Southeast (9/91)MCorp (3/89)Bank of NE (1/91)One Bancorp (2/91)
Figure II: Monthly Moody's Ratings Prior to Failure
0
2
4
6
8
10
10 6 2
Quarters Prior to Failure
Mo
od
y's
Rat
ing
s (c
ard
inal
ized
)
Continental (5/84)Southeast (9/91)MCorp (3/89)Bank of NE (1/91)One Bancorp (2/91)

32
Figure III: Continental Illinois Corp (Fail Date 5/84) Moody's Ratings and Funding Sources Prior to Failure
55
60
65
70
75
80
9 8 7 6 5 4 3 2 1
Quarters Prior to Failure
% In
sure
d &
Su
b
Deb
t
0
1
2
3
4
Mo
od
y's
Rat
ing
s
Insured to Total Deposits Moody's Rating Sub Debt Volume to Assets
Figure IV: Southeast Banking Corp (Fail Date 9/91) Moody's Ratings and Funding Sources Prior to
Failure
60
65
70
75
80
85
90
9 8 7 6 5 4 3 2 1
Quarters Prior to Failure
% In
sure
d &
Su
b
Deb
t
012345678
Mo
od
y's
Rat
ing
s
Insured to Total Deposits Moody's Rating Sub Debt Volume to Assets

33
Figure V: Bank of New England (Fail Date 1/91)Moody's Ratings and Funding Sources Prior to
Failure
8081828384858687
5 4 3 2 1
Quarters Prior to Failure
% In
sure
d &
S
ub
Deb
t
0
2
4
6
8
10
Mo
od
y's
Rat
ing
s
Insured to Total Deposits Moody's Rating Sub Debt Volume to Assets
Figure VI: MCorp (Fail Date 3/89)Moody's Ratings and Funding Sources Prior to
Failure
6062646668707274767880
15 14 13 12 11 10 9 8 7 6 5 4 3 2 1
Quarters Prior to Failure
% In
sure
d &
Sub
D
ebt
0123456789
Moo
dy's
Rat
ings
Insured to Total Deposits Moody's Rating Sub Debt Volume to Assets
34
Figure VII: One Bancorp (Fail Date 2/91) Moody's Ratings and Funding Sources Prior to
Failure
80
82
84
86
88
90
92
94
96
98
100
8 7 6 5 4 3 2 1
Quarters Prior to Failure
% In
sure
d &
Su
b D
ebt
0
1
2
3
4
5
6
7
8
9
Mo
od
y's
Rat
ing
s
Insured to Total Deposits Moody's Rating Sub Debt Volume to Assets

35
Figure VIII: Spreads on Insured CDs Prior to Failure
-1
-0.5
0
0.5
1
1.5
12 10 8 6 4 2
Quarters Prior to Failure
% S
pre
ads
on
Insu
red
D
epo
sits Continental (5/84)
MBank (3/89)Bank of NE (1/91)
Figure IX: Spreads on Uninsured CDs Prior to Failure
-5
0
5
10
15
20
9 8 7 6 5 4 3
Quarters Prior to Failure
% S
pre
ads
on
Un
insu
red
C
Ds
Continental (5/84)Southeast (9/91)MBank (3/89)Bank of NE (1/91)Maine (2/91)

36
Emerging Issues Series
A series of studies on emerging issues affecting the banking industry. Topics includebank supervisory and regulatory concerns, fair lending issues, potential risks to financialinstitutions and payment system risk issues.
These papers may also be obtained from the Internet at:http://www.chicagofed.org/publications/workingpapers/emergingissues.cfm
The Impact of New Bank Powers (Securities and Insurance S&R-99-1RActivities) on Bank Holding Companies’ RiskLinda Allen and Julapa Jagtiani
A Peek at the Examiners Playbook Phase III S&R-99-2Paul A. Decker and Paul E. Kellogg
Do Markets Discipline Banks and Bank Holding Companies? S&R-99-3REvidence From Debt PricingJulapa Jagtiani, George Kaufman and Catharine Lemieux
A Regulatory Perspective on Roll-Ups: Big Business S&R-99-4For Small Formerly Private CompaniesMichael Atz
Conglomerates, Connected Lending and Prudential Standards: S&R-99-5Lessons LearnedCatharine M. Lemieux
Questions Every Banker Would Like to Ask About Private Banking S&R-99-6And Their AnswersMichael Atz
Points to Consider when Financing REITs S&R-99-7Catharine M. Lemieux and Paul A. Decker
Stumbling Blocks to Increasing Market Discipline in the Banking S&R-99-8RSector: A Note on Bond Pricing and Funding Strategy Prior to FailureJulapa Jagtiani and Catharine M. Lemieux
Agricultural Lending: What Have We Learned? S&R-99-9Catharine M. Lemieux

37
Emerging Issues Series
Price Risk Management Creates Unique Credit Issues S&R-99-10Jack Wozek
The Role of Financial Advisors in Mergers and Acquisitions S&R-2000-1Linda Allen, Julapa Jagtiani and Anthony Saunders
Pooled Trust Preferred Stock – A New Twist on an Older Product S&R-2000-2Paul Jordan