stuttgart university 2009 · stuttgart university 2009 ... most probable trajectories are derived...
TRANSCRIPT
Stuttgart University
2009
The Department ofGeodesy and Geoinformatics

editing and layout:volker walter, friedhelm krumm, martin metzner, wolfgang scholler

1
Dear friends and colleagues,
It is our great pleasure to present to you this annual report1 on the 2009 activities and academichighlights of the Department of Geodesy & Geoinformatics of Universitat Stuttgart. The Depart-ment consists of the four institutes:
� Institute of Geodesy (GIS),
� Institute for Photogrammetry (ifp),
� Institute of Navigation (INS),
� Institute for Applications of Geodesy to Engineering (IAGB).
In the course of 2009 we have successfully filled the vacant chair of Engineering Geodesy andGeodetic Metrology. We are delighted to announce that Prof. Dr.-Ing. habil. Volker Schwieger wasappointed to this chair and assumed the position of head of IAGB (formally as of April 2010).
Research
This annual report documents our research contributions in many diverse fields of Geodesy &Geoinformatics: from satellite and physical geodesy through navigation, remote sensing, engi-neering surveying and telematics to photogrammetry, geographical information systems and lo-cation based services. Detailed information on projects and research output can be found in thefollowing individual institutes’ sections.
Teaching
Also Stuttgart is now participating in the Bologna process. Our first-year students entered thenew BSc programme Geodesy & Geoinformatics. Total enrolment, in both the BSc and theDiploma programmes, is stable at about 130 students. Please visit our redesigned websitewww.geodaesie.uni-stuttgart.de for additional information on the programme.
For the first time in its four-year existence, our international MSc programme Geomatics Engi-neering (GEOENGINE2) has achieved the enrolment target of 15 students. We attract the GEO-ENGINE student population from such diverse countries as China, Iran, Indonesia, Pakistan,Kenya, Uganda and Nigeria.
Beyond these two core curricula, the institutes are involved in a host of other programmes aroundcampus.
1A version with colour graphics is downloadable fromhttp://www.ifp.uni-stuttgart.de/publications/jahresberichte/jahresbericht.html
2http://www.geoengine.uni-stuttgart.de/

2
We want to express our gratitude to our friends and sponsors, most notably
� Verein Freunde des Studienganges Geodasie und Geoinformatik an der Universitat Stuttgarte.V. (F2GeoS),
� Microsoft company Vexcel Imaging GmbH,
� Ingenieur-Gesellschaft fur Interfaces mbH (IGI),
� DVW Landesverein Baden-Wurttemberg,
who support our programmes and our students with scholarships, awards and travel support.
Festivities
The year 2009 abounded in festivities and celebrations. Four events stood out:
� A geodetic colloquium on November 6th in honour of Prof. Dr.-Ing. Dr.E.h. mult Fritz Acker-mann in honour of his 80th birthday.
� A geodetic colloquium on December 4th in honour of Prof. Dr.-Ing.habil. Dr.tech.h.c.multDr.-Ing.E.h.mult Erik W. Grafarend in honour of his 70th birthday.
� 100th anniversary of Photogrammetric Week, organized by ifp at on September 7-11.
� The award of an honorary doctorate to Prof. Fernando Sanso of the Politecnico Milano forhis scientific achievements in the area of theoretical geodesy at the annual Dies Academicus(November 13th).
Nico SneeuwAssociate Dean (Academic)[email protected]
Institute for Applications of Geodesy to Engineering 3
Institute for Applications of Geodesy toEngineeringGeschwister-Scholl-Str. 24D, D-70174 Stuttgart,Tel.: +49 711 685 84041, Fax: +49 711 685 84044e-mail: [email protected] [email protected]: http://www.uni-stuttgart.de/iagb/
Head of InstituteProf. Dr.-Ing. Ulrich Rott, (Provisional Director) till March 2009Prof. Dr.-Ing. Ewald Kramer, (Provisional Director) since April 2009Dr.-Ing. Martin Metzner, Akad. Oberrat
SecretaryElke Rawe
EmeritusProf. Dr.-Ing. Dr.sc.techn.h.c. Dr.h.c. Klaus Linkwitz
Scientific StaffDipl.-Ing. Alexander Beetz Sensor IntegrationDr.-Ing. Renate Czommer (till 30.09.2009) Map MatchingDipl.-Ing. Ralf Laufer Quality AssuranceMSc Rainer Schutzle Information QualityDipl.-Ing. Jurgen Schweitzer Construction ProcessPD Dr.-Ing. Volker Schwieger Engineering GeodesyDipl.-Ing. Matthias Wengert (till 30.09.2009) Geodata and GIS ApplicationsDipl.-Ing. Li Zhang (since 15.09.2009) Construction ProcessDipl.-Ing. Bimin Zheng (since 01.04.2009) Kinematic Positioning
Technical StaffMartin KnihsLars PlateDoris Reichert

4 IAGB
External teaching staff
Dr.-Ing. Max Mayer - Landesamt fur Flurneuordnung
General View
After the retirement of Prof. Rott, until then provisionally head of the institute, Prof. Kramer pro-visionally is in charge of the institute. The work of the appointments committee on the new pro-fessorship is being continued throughout the year 2009. The Institute for Applications of Geodesyto Engineering is member of the faculty
”Aerospace Engineering and Geodesy“. Furthermore,
IAGB is still member of FOVUS (Traffic research Centre of the University of Stuttgart) and thuscontinues the close collaboration with the faculty
”Civil and Environmental Engineering“.
The institute’s main tasks in education and research reflect on engineering geodesy, geodeticmeasurement techniques, data processing, and traffic information techniques. The daily workis characterised by intensive co-operation with other engineering disciplines, especially withaerospace engineering, civil engineering, traf-fic engineering and construction management. Co-operations also exist with other university institutes as well as with the construction and automobileindustry, and various traffic services.
In education, the institute is responsible for the above-mentioned fields within the cur-ricula for
”Geodesy and Geoinformatics“ as well as for
”Geomatics Engineering“. In autumn 2009 the Bach-
elor”Geodasie und Geoinformatik“ began for the first time. This curriculum in combination with
the future Master will replace the diploma curriculum. In addition to the education in Survey-ing for Architects and Surveying for Civil Engineers, lectures on Acquisition and Management ofPlanning Data are presented to the diploma course of Technique and Economy of Real Estate.Furthermore, lectures are given to students of Geography and Traffic Engineering as well as twolectures in English within the master course Infrastructure Planning. Finally, eLearning modulesare applied in different curricula e.g. for geodetic measurement techniques or for cartographicanimations. The current research is reflected in most lectures and in diploma theses.

Institute for Applications of Geodesy to Engineering 5
Research and development
Positioning by mobile phones
The basis of modern traffic control and management is the acquisition of the current traffic stateand a reliable traffic prediction. Traditionally, local loop data and GPS-based floating car data(FCD) are the methods for traffic state acquisition. These methods are currently extended by so-called floating phone data (FPD) based on positions of mobile phones which are matched on thedigital road network. Due to the required availability of all mobile phone positions at a particulartime and at one computing centre, the positioning methods have to be network-based and nothandset-based. The network-based approach is pursued within the project
”Data Optimisation for
integrated Telematics“ (Do-iT) until March 2009 and was granted by the German Federal Ministryof Economics and Technology.
If positions shall be determined in a high temporal and spatial resolution, the data oft the so-calledA-bis interface has to be used. Here the signal strength observations of the serving and six neigh-bouring GSM antennas received at the mobile phone are recorded in the GSM network. Positionsare estimated with a frequency of 2Hz by matching these signal strength observations onto a sig-nal strength map available for every GSM antenna. Different filter algorithms identify participantsin the GSM network as pedestrian, cyclist, individual or public traffic participant. Kalman-filteredpositions of one identified participant are generating a kind of corridor based on the uncertaintiesof the position estimation. Within this corridor, data of the road network are extracted from thedigital map. Most probable trajectories are derived on the basis of shortest path algorithm (c.f.Figure 1).
Figure 1: Computation of possible trajectories (blue) with computed positions (red)using Abis-data
6 IAGB
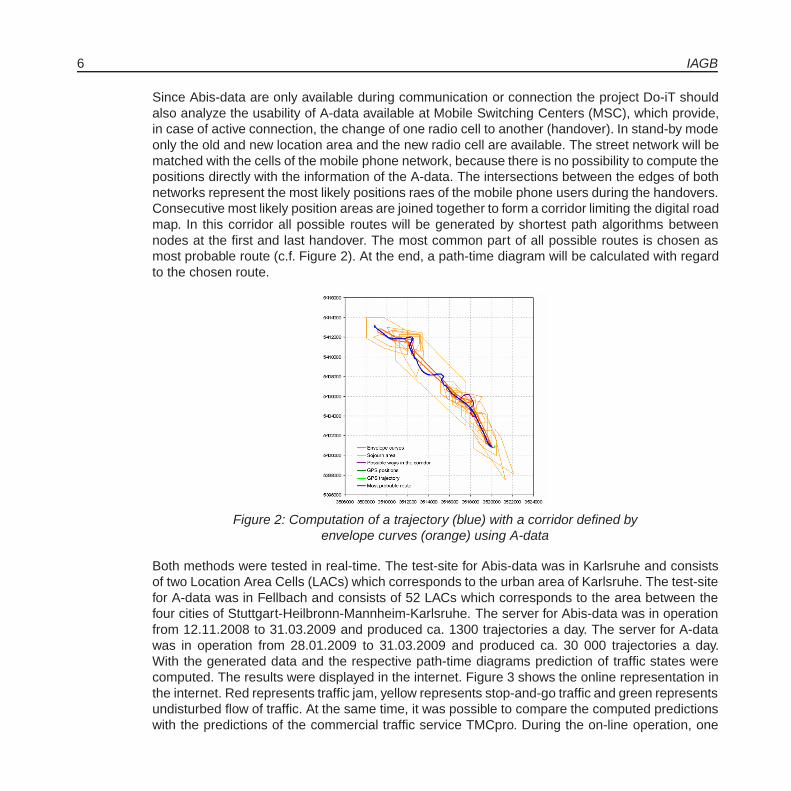
Since Abis-data are only available during communication or connection the project Do-iT shouldalso analyze the usability of A-data available at Mobile Switching Centers (MSC), which provide,in case of active connection, the change of one radio cell to another (handover). In stand-by modeonly the old and new location area and the new radio cell are available. The street network will bematched with the cells of the mobile phone network, because there is no possibility to compute thepositions directly with the information of the A-data. The intersections between the edges of bothnetworks represent the most likely positions raes of the mobile phone users during the handovers.Consecutive most likely position areas are joined together to form a corridor limiting the digital roadmap. In this corridor all possible routes will be generated by shortest path algorithms betweennodes at the first and last handover. The most common part of all possible routes is chosen asmost probable route (c.f. Figure 2). At the end, a path-time diagram will be calculated with regardto the chosen route.
Figure 2: Computation of a trajectory (blue) with a corridor defined byenvelope curves (orange) using A-data
Both methods were tested in real-time. The test-site for Abis-data was in Karlsruhe and consistsof two Location Area Cells (LACs) which corresponds to the urban area of Karlsruhe. The test-sitefor A-data was in Fellbach and consists of 52 LACs which corresponds to the area between thefour cities of Stuttgart-Heilbronn-Mannheim-Karlsruhe. The server for Abis-data was in operationfrom 12.11.2008 to 31.03.2009 and produced ca. 1300 trajectories a day. The server for A-datawas in operation from 28.01.2009 to 31.03.2009 and produced ca. 30 000 trajectories a day.With the generated data and the respective path-time diagrams prediction of traffic states werecomputed. The results were displayed in the internet. Figure 3 shows the online representation inthe internet. Red represents traffic jam, yellow represents stop-and-go traffic and green representsundisturbed flow of traffic. At the same time, it was possible to compare the computed predictionswith the predictions of the commercial traffic service TMCpro. During the on-line operation, one

Institute for Applications of Geodesy to Engineering 7
could detect that it wasn’t possible to compute trajectories for all mobile phone users over oneday. That means that for a commercial use it is essential to optimize the algorithms and to usemore powerful computers. Altogether we could show that it is possible to make forecasts of thetraffic state with floating phone data (FPD). Furthermore, FPD is a good source of information anda good addition to current methods for forecasts of traffic state.
Figure 3: Forecast of traffic state with A-data
Quality Evaluation of vehicle trajectories generated by radiolocation of Mobile Phones
The project Do-iT was finished successfully in 2009. In a final step the usability of traffic infor-mation extracted from mobile network was analyzed within demonstrators of the project partners.Main task of the IAGB was the evaluation of FPD-trajectories, which are calculable with the de-veloped algorithms using appropriate reference data. Besides a number of test-drives where aGPS-receiver was used for parallel recording of the driven reference trajectory, daily updatedmeasurements of traffic data from stationary traffic data acquisition systems (SAS) were availablewithin the project network.
Besides others, two quality parameters were defined for evaluation of the trajectories which quan-tify the mapping of calculated routes to the corresponding reference measured with GPS. Oneof these two parameters shows the correctly matched part of a route referring to the referenceroute measured by GPS (mapping correctness type A), the other parameter refers the correctlymatched part to the FPD-route (type B). Type B shows the percentage oft he FPD-trajectory thatis matched on the correct GPS trajectory.
8 IAGB
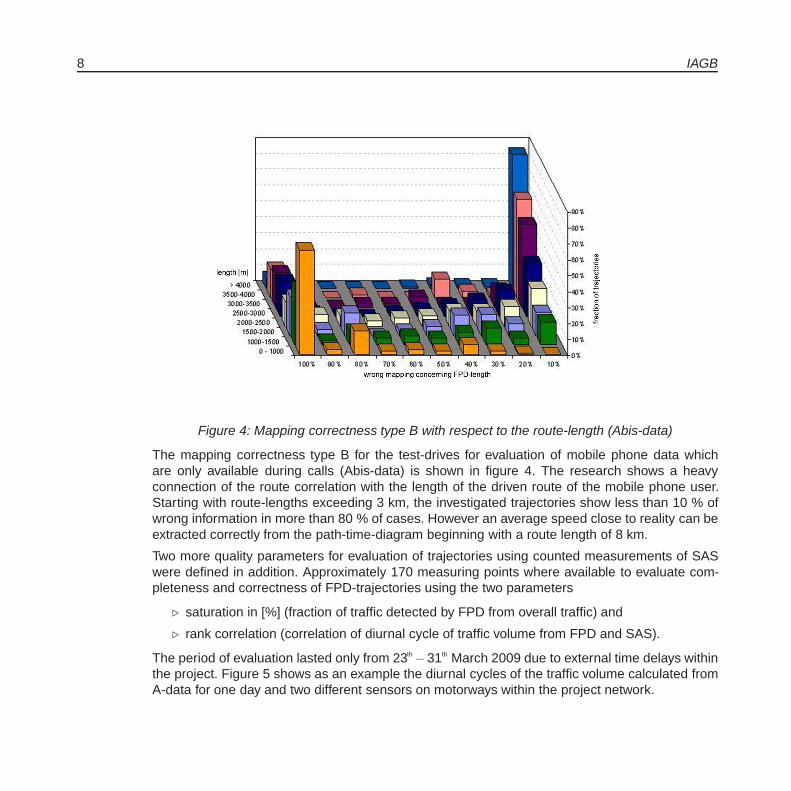
Figure 4: Mapping correctness type B with respect to the route-length (Abis-data)
The mapping correctness type B for the test-drives for evaluation of mobile phone data whichare only available during calls (Abis-data) is shown in figure 4. The research shows a heavyconnection of the route correlation with the length of the driven route of the mobile phone user.Starting with route-lengths exceeding 3 km, the investigated trajectories show less than 10 % ofwrong information in more than 80 % of cases. However an average speed close to reality can beextracted correctly from the path-time-diagram beginning with a route length of 8 km.
Two more quality parameters for evaluation of trajectories using counted measurements of SASwere defined in addition. Approximately 170 measuring points where available to evaluate com-pleteness and correctness of FPD-trajectories using the two parameters
� saturation in [%] (fraction of traffic detected by FPD from overall traffic) and
� rank correlation (correlation of diurnal cycle of traffic volume from FPD and SAS).
The period of evaluation lasted only from 23th −31th March 2009 due to external time delays withinthe project. Figure 5 shows as an example the diurnal cycles of the traffic volume calculated fromA-data for one day and two different sensors on motorways within the project network.

Institute for Applications of Geodesy to Engineering 9
Figure 5: Typical diurnal cycles of traffic volume detected with FPD (continuous)and SES (dashed)
The mean saturation for all SAS with FPD from A-data, reaches an average of approx. 8.5 ‰,respectively up to 600 veh./day on motorways and declines with the rise of infrastructure densitybelow 1 ‰ in the inner city of Karlsruhe, respectively less than 1 veh./h. The rank correlation ofdiurnal cycles reaches an average of more than 0.8 and declines in the city to less than 0.5.
Finally it can be concluded that GSM-based radiolocation is able to get dense traffic informationwhich can be used for example to calculate the traffic state. However the potential is heavilydepending on the density of the surrounding infrastructure as well as on the distances betweenintersections. Coverage of motorways with a quality which is even capable for estimation of trafficsituation appears realistic. This applies as well for the coverage of the highway network withinrural areas. But due to the GSM-network structure and the thereby limited spatial resolution, theradiolocation reaches natural limitations within the cities.
The combination of A- and Abis-data could be a chance. In rural areas the exclusive analysis ofA-data seems to be sufficient and saves computing time. In areas with more dense infrastructurethe use of Abis-data (which is much more complex and therefore computationally more intensive)can support the results due to a higher spatial resolution and position accuracy.
Modular System for Construction Machine Guidance
The modular system for construction machine guidance (PoGuide) which was developed at theinstitute is subject to continuous improvement. The core of PoGuide is a simulator for Hardware-in-the-Loop simulations. It consists of a remote control, model truck, robot tachymeter (Leica TCRP1201) and an interface between a PC and the remote control.

10 IAGB
Meanwhile the simulator was enhanced with individual shiftable modules. These modules arefor example various controllers (2-point-, 3-point-, P-, PI-, PID-controller) and also an improvedKalman filter which uses the geometric information of the predetermined trajectory for the predic-tion of the measured points. Furthermore, the simulator was upgraded with a module for automaticcalibration of the steering. In the past, calibration of the steering needs one working day. Now, thecalibration process is done in 30 minutes. The enhancement which can be achieved with new cal-ibration parameters is shown in Figure 6. In the chart the lateral deviations of a test drive beforeand after a calibration will be compared.
Figure 6: Lateral deviations before (red dotted line) and after (blue straight line) the calibration
It is obvious that the lateral deviations after the new calibration (blue straight line) are smaller thanbefore (red dotted line). The remaining oscillation is damped and a little bit smoother. The driveswith the new calibration parameters increase the mean RMS of the lateral deviations from 2.5 mmup to 1.8 mm.
In the future the computation of the vehicle azimuth will be stabilized with a MEMS inertial mea-surement unit (c.f. Figure 7). This inertial measurement unit (IMU) transmits data of three gyro-scopes, three acceleration sensors and three magnetometers via a 2.4 GHz radio interface to thecontrol PC. The current Kalman filter must be adapted to this implementation. Additionally robottachymeters of different manufacturers should be integrated in the simulator system. Thereby themain focus is the modularity and easy exchangeability of the sensors. Furthermore, for upgradingof the vehicle models in the simulator system, a model of a dozer (scale 1:14, Figure 7) should beacquired which simulates the behavior of tracked vehicles.

Institute for Applications of Geodesy to Engineering 11
Figure 7: On the left MEMS-IMU (source: Microstrain), on the right model dozer (source: TamyiaCarson)
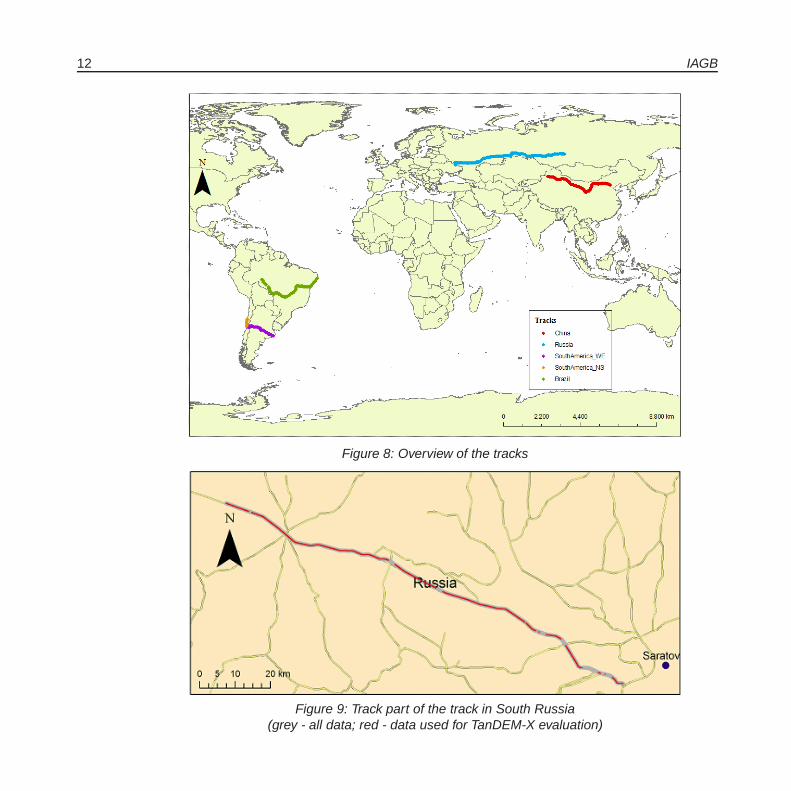
Kinematic GPS-Measurements for Evalulation of TanDEM-X Data
Based on the evaluation method of TanDEM-X Data developed in 2008, five tracks were evaluatedlast year using the method
”Precise Point Positioning“ (PPP). Tracks were driven in China, Russia
and the remaining three tracks are located in South America. Figure 8 shows an overview of theprocessed tracks.
The raw data (RINEX-files) are processed with the”GPS-Inferred Positioning SYstem and Orbit
Analysis SImulation Software“ (GIPSY-OASIS (GOA II)) provided by”Jet Propulsion Laboratory“
(JPL) and with the”Canadian Spatial Reference System (CSRS) PPP Online service“ provided
by the”Natural Resources Canada“ (NRCan). Finally, an evaluation of the result is realized using
PDGPS. Therefore a reference station near the track has to be chosen. Only the points within aradius of 20 km are evaluated and compared with the PPP solution.
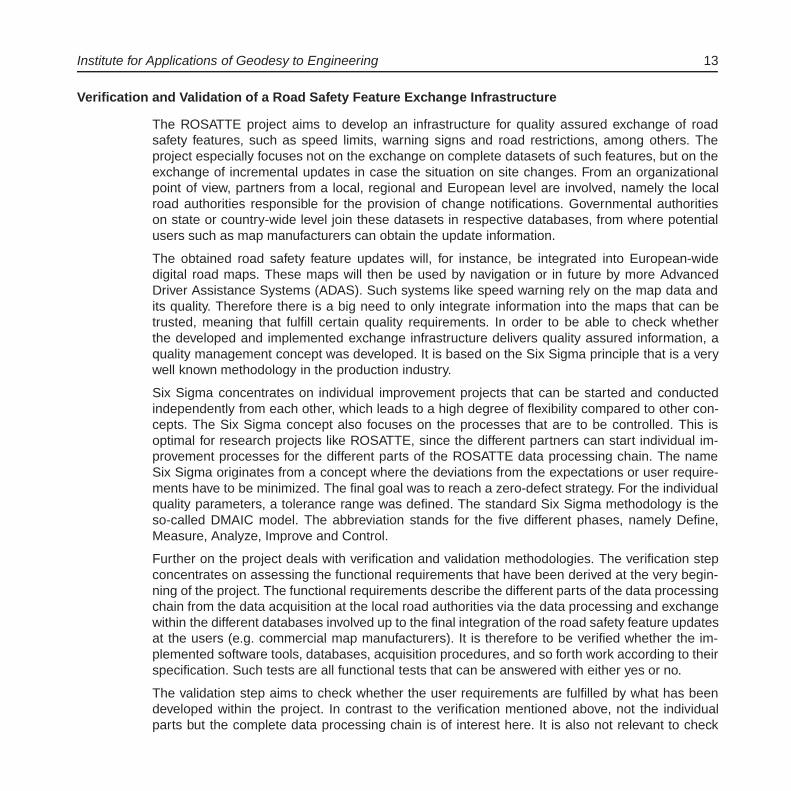
The track from Krasnojarsk to Belgorod in South Russia has a length of about 4585 km and isdivided into 40 separated parts. Each part shows driving times between 63 to 481 minutes. ALEICA GX 1230 receiver and an AX 1202 antenna were used for the data acquisition.
In the figure 9 a track part of the results is visualized in ArcGIS. The grey coloured track consists ofall gathered measurements. The red tracks are the selected measurements with a position differ-ence smaller than 1 meter between the two solutions (GIPSY-OASIS and CSRS). The availabilityrate is approximately 84%. The next step is the evaluation of the tracks from South Africa, WestAfrica, Australia, USA, Canada and India.
12 IAGB
Figure 8: Overview of the tracks
Figure 9: Track part of the track in South Russia(grey - all data; red - data used for TanDEM-X evaluation)
Institute for Applications of Geodesy to Engineering 13
Verification and Validation of a Road Safety Feature Exchange Infrastructure
The ROSATTE project aims to develop an infrastructure for quality assured exchange of roadsafety features, such as speed limits, warning signs and road restrictions, among others. Theproject especially focuses not on the exchange on complete datasets of such features, but on theexchange of incremental updates in case the situation on site changes. From an organizationalpoint of view, partners from a local, regional and European level are involved, namely the localroad authorities responsible for the provision of change notifications. Governmental authoritieson state or country-wide level join these datasets in respective databases, from where potentialusers such as map manufacturers can obtain the update information.
The obtained road safety feature updates will, for instance, be integrated into European-widedigital road maps. These maps will then be used by navigation or in future by more AdvancedDriver Assistance Systems (ADAS). Such systems like speed warning rely on the map data andits quality. Therefore there is a big need to only integrate information into the maps that can betrusted, meaning that fulfill certain quality requirements. In order to be able to check whetherthe developed and implemented exchange infrastructure delivers quality assured information, aquality management concept was developed. It is based on the Six Sigma principle that is a verywell known methodology in the production industry.
Six Sigma concentrates on individual improvement projects that can be started and conductedindependently from each other, which leads to a high degree of flexibility compared to other con-cepts. The Six Sigma concept also focuses on the processes that are to be controlled. This isoptimal for research projects like ROSATTE, since the different partners can start individual im-provement processes for the different parts of the ROSATTE data processing chain. The nameSix Sigma originates from a concept where the deviations from the expectations or user require-ments have to be minimized. The final goal was to reach a zero-defect strategy. For the individualquality parameters, a tolerance range was defined. The standard Six Sigma methodology is theso-called DMAIC model. The abbreviation stands for the five different phases, namely Define,Measure, Analyze, Improve and Control.
Further on the project deals with verification and validation methodologies. The verification stepconcentrates on assessing the functional requirements that have been derived at the very begin-ning of the project. The functional requirements describe the different parts of the data processingchain from the data acquisition at the local road authorities via the data processing and exchangewithin the different databases involved up to the final integration of the road safety feature updatesat the users (e.g. commercial map manufacturers). It is therefore to be verified whether the im-plemented software tools, databases, acquisition procedures, and so forth work according to theirspecification. Such tests are all functional tests that can be answered with either yes or no.
The validation step aims to check whether the user requirements are fulfilled by what has beendeveloped within the project. In contrast to the verification mentioned above, not the individualparts but the complete data processing chain is of interest here. It is also not relevant to check

14 IAGB
the technical functioning but to concentrate on the update information that has been processed.This will be done using a set of pre-defined scenarios that have to be processed at the differenttest sites. In these scenarios a certain number of road safety feature updates of a certain type inpre-defined areas like urban, inter-urban and motorways have to be processed. The situation thathas been entered into the system will be compared with the results after integration the updateinto the map providers’ databases. The following parameters will be evaluated in detail:
� Update availability rate
� Completeness of individual Road Safety Features
� Completeness of a set of Road Safety Features
� Attribute Consistency
� Attributive Correctness
� Topological Correctness
� Database Actuality
� Data processing time
� Geometric Accuracy
� Efficiency / ease of usage
� Standardization / harmonization
� Ease of adoption in other countries
Quality model for residential houses construction processes
To improve the possibilities of small and medium enterprises (SMEs) in the construction sectordespite rising business competition, labour costs and material costs, the costs for constructionshould be minimized at the same time holding or even improving the quality. For this task a qualityassurance system will be developed in the EU-project
”Development of a Real Time Quality Sup-
port System for the Houses Construction Industry“ (QuCon), the system should enable the SMEsto document their recent project states and achieved quality targets in a simple and fast manner. Aquality assurance software will be developed as the final product, that should be low-cost and ableto check the quality of residential houses construction in ‘Real Time’. This EU-project is granted bythe AIF (Arbeitsgemeinschaft industrieller Forschungsvereinigungen), it began in February 2009and will take two years.
For this project a construction process model was generated specially for residential houses con-struction. The sub-processes of the total construction process are chronologically arranged andrelationships among the sub-processes and processes are also contained in this model.
The focus of IAGB within this project is the development of a consistent quality model for thebuilding of residential houses and the definition of its parameters as well as quality indexes. If the

Institute for Applications of Geodesy to Engineering 15
actual and target states of the required building and construction processes are compared in realtime, this model will be able to calculate the quality assurance indexes. But the goal of the projectQuCon is not only to evaluate the quality of the product but also to optimize the constructionprocess, for this reason this quality model will distinguish between quality of products and ofprocesses (figure 10).
Figure 10: Quality model for residential houses construction processes
In the following the process- and the product-related characteristics are defined and describedbriefly.
Process related quality characteristics
� Expense - Adherence to the expense plan - relative expense rate in relation to the predeter-mined / planned Expense [%]
� Timeliness - Adherence to the time schedule. - Absolute time difference comparing withpredetermined / planned schedule [days]
� Process-Correctness - Adherence to the predetermined procedure - binary decision:true/false [0, 1]
16 IAGB
� Resource - Adherence to the predetermined resources - relative Resources rate in relationto the predetermined / planned resources [%]
� Synchronization - Adherence to the overall predetermined inter-process workflow -time dif-ference of synchronal planned sub-processes [days]
The process related quality characteristics expense, timeliness, resource, synchronization as wellas their parameter are defined in relation to the construction plan and the contract. The first fourcharacteristics refer to the total process and sub-processes, only the fifth characteristic synchro-nization refers to the interaction among the sub-processes, it describes how far sub-processes,which dependent on each other, run synchronically.
Product related quality characteristics
� Availability: - Overall quality characteristic - availability index [dimensionless]
� Completeness - Adherence to defined completeness of product - completeness rate [%]
� Product-Correctness - Adherence to demands, requirements - binary decision:true/false [0, 1]
� Accuracy - Degree of adherence to demands, requirements - standard deviation [m]
The product related quality characteristic availability is defined as the overall quality character-istic that takes into account all other characteristics. The product related quality characteristicsaccuracy and product-correctness as well as the process related quality characteristic process-correctness can be concreted with parameters using standards, generally recognised codes ofpractice and technical demands written in the contact.
The quality characteristics should be concreted with the parameters and further on the measure-ment of the quality as well as the analysis method should be developed for this quality model. Thesurveyors can play an important role for the measurement of the quality.
Process modeling in building construction
In June of this year a project, supported by the DFG (German Research Foundation) has started.It is called
”Optimisation of efficiency and quality assurance of engineering geodesy processes
in civil engineering“ (german: Effizienzoptimierung und Qualitatssicherung ingenieurgeodatischerProzesse im Bauwesen (EQuiP)) and has the goal to integrate the processes of engineeringgeodesy efficiently in building sequences with respect to quality control measures.
The first work package runs over 6 month and was carried through by four project partners:Geodetic Institute (University of Hannover), Institute of Construction Informatics (University ofHannover), Institute of Construction Management (University of Stuttgart), Institute for Applica-tions of Geodesy to Engineering (University of Stuttgart).

Institute for Applications of Geodesy to Engineering 17
The main aspect of the first work package was the formal description and modeling of the buildingprocess chain and the working-out of the interfaces to engineering geodesy.
As an example for the optimization of the integration of geodetic work in a building sequence theconstruction of a high-rise building with a climbing formwork was chosen. The modeling languagePetri nets (also known as place/transition nets) are used.
Petri nets are mathematical modeling languages for the description, analysis and simulation ofconcurrent and dynamic systems and they offer a graphical notation as a mathematical formalismto describe asynchrony and discrete distributed systems.
Figure 11 shows a building sequence of a floor of a building in shell construction by means of thesimplest Petri nets, the condition-event-nets (CEN). Rectangles represent transitions (i.e. discreteevents that may occur) and circle represent places (i.e. conditions). Places may contain a naturalnumber of tokens. A distribution of tokens over the places of a net is called a marking. Withmarkings the state and dynamic aspects can be modeled.
Figure 11: CEN for a floor of a high-rise building
Petri nets could also be nested, i.e. the process”create building core“ could contain a complete
Petri net. In the next step it is planned to integrate methods of quality assurance in the wholeprocess, based on a process orientated quality model with the goal to make a description of qualityof the engineering geodesy processes and products in building sequences. It will be necessary toreplace the simple CEN with high-level Petri nets (i.e. coloured Petri nets). Among others in highlevel Petri nets there can store additional information in tokens. This information could be e.g. thequality parameters.
Activities of Prof. Dr.-Ing.Dr.sc.techn.h.c.Dr.h.c. Klaus W. Linkwitz in 2009
Formfinding of Lightweight Surface Structures
The two-hour-lecture”Analytic Formfinding of Lightweight Surface Structures“ was incorporated
into the 4-Semester Master Course”Computational Mechanics of Materials and Structures (COM-
MAS)“ for foreign students. It was given as a 32-hour compact course in the summer semester

18 IAGB
2009. The additional appertaining practical computer exercises were performed on windows-XP-computers of the CIP-pool of the course
”Water Resource Engineering and Management
(WAREM)“ of the department”Civil- and Environment Engineering“ in the University Campus Pfaf-
fenwald. The exercises were intensified, since a final graded project-work was demanded from thestudents.
Further lectures of K. Linkwitz
As part of the obligatory course”Engineering Geometry and Design“ given to civil engineers in
their first semester by the Institute of Construction and Design II, two lectures on the subject
”Typical examples of computer-aided geometric design“ were given.
Symposia
The following essential Symposia visited in 2009 have to be mentioned:
� IASS - International Association for shell and spatial structures, Valencia, 28.09.-02.10.2009. Evolution and Trends in Design, Analysis and Construction of Shell and SpatialStructures - Form finding light plane load-bearing structures.
� Textile composites and inflatable structures III, Stuttgart 5.-7.10.2009; Organized by E.Onate, Univ. Politecnica de Catalunya, Barcelona, Spain and B. Kroplin, University ofStuttgart, Germany
Publications
Beetz, A.: Signalstarken-Matching und Map-Aiding-Methoden zur Positionsbestimmung von Mo-bilfunkteilnehmern in Echtzeit. POSNAV - Positionierung und Navigation 2009, DGON-Symposium, Dresden, 27.-28.10.2009
Laufer, R.; Beetz, A.; Czommer, R.; Schwieger, V.: Managing Data Quality - Exemplified for trafficdata generated from mobile phone data. Proceedings on 16th ITS World Congress 2009,Stockholm, Sweden, 21.-25.09.2009.
Laufer, R.: Evaluierung der Qualitat von Verkehrsinformationen aus Mobilfunkdaten. POSNAV -Positionierung und Navigation 2009, DGON-Symposium, Dresden, 27.-28.10.2009.
Linkwitz, K.: Grundbau Taschenbuch 07.Auflage, Herausgeber Karl Josef Witt, Teil I Geotech-nische Grundlagen - 1.10 geodatische Uberwachung von Geotechnischen Bauwerken(zusammen mit Otto Heunecke (Uni der Bundeswehr Munchen), und Wilfried Schwarz(Bauhaus Universitat Weimar)
Huber, M., Wessel, B., Kosmann, D., Felbier, A., Schwieger, V., Habermayer, M., Wendleder, A.,Roth, A.: Ensuring globally the TanDEM-X height accuracy: Analysis oft he refernce data

Institute for Applications of Geodesy to Engineering 19
sets ICESat, SRTM and KGPS-Tracks. International Geo Science and Remote SensingSymposium, Kapstadt, Sudafrika, 12.-17.07.2009.
Rosch, N., Schweitzer, J., Pach, J. Die Auswirkung der Einfuhrung von ETRS89/UTM auf Geo-fachdaten - Fallbeispiel eines EVU aus dem Bundesland Hessen. GIS.Science 4 (2009),S.123-129
Schutzle, R.: Quality Management in ROSATTE. ITS World Conference, Stockholm, Sweden, 21.-25.09.2009.
Schweitzer, J. Kinematischen GPS Messungen als eine Methode zur Evaluierung eines globalen,digitalen Hohenmodells. Geodatische Woche 2009, Karlsruhe, 22.-24.09.2009.
Schwieger, V.: High-Sensitivity GPS fur geodatische Anwendungen. 83. DVW-Seminar, GNSS2009: Systeme, Dienste, Anwendungen. Dresden, 18.-19.03.2009.
Schwieger, V: Accurate High-Sensitivity GPS for Short Baselines. FIG Working Week, Eilat, Israel,03.-08.05.2009.
Schwieger, V., Lilje, M., Sarib, R.: GNSS CORS - Reference Frames and Services. 7th FIG Re-gional Conference, Hanoi, Vietnam, 19.-22.10.2009.
Schwieger, V., Schweitzer, J., Kosmann, D.: GPS Precise Point Positioning as a Method to Evalu-ate Global TanDEM-X Digital Elevation Model. 7th FIG Regional Conference, Hanoi, Viet-nam, 19.-22.10.2009.
Schwieger, V.: High-Sensitivity GPS - an Availability, Reliability and Accuracy Test. INCT Bulletindes Sciences Geographiques, Institut National de Cartographie e de Teledetection (INCT),Algier, Algerien, No 23, September 2009.
Diploma Thesis
Lu, Bei: Fortfuhrung einer Karte und Aufbau einer Internetprasentation zu einem historisch an-gelegten Campusfuhrer
Radu, Diana: Beurteilung von Ausgleichungsrechnungssoftwarepaketen
Xia, Jing: Qualitatsprufung von Verarbeitungsprozessen fur Geodaten am Beispiel AGORA
Master Thesis
Wang, Ruifen: Investigation on Precise Point Positioning for kinematic GPS tracks
Shengzong, Su: Development of steady-state controllers and implementation of an up-dated ver-sion of a construction machine simulator
20 IAGB
Study works
Bauer, Nina: Qualitatsbeurteilung der Mobilfunkortung mittels Daten stationarer Verkehrsdatener-fassungssysteme
Frank, Jacek: Qualitatsmanagement fur die GeodatenverarbeitungFuchs, Thomas: Untersuchung des Umschaltverhaltens im GSM-Netz hinsichtlich geometrischer
ReproduzierbarkeitHoch, Alexander: Systeme zur vernetzten Zusammenarbeit in Bauprojekten (SA)Locher, Markus: Analyse des Bauprozesses im privaten WohnhausbauScheider, Annette: Entwicklung eines Qualitatsmanagementkonzeptes fur die Erfassung und den
Austausch von Geodaten
Education
Basic Geodetic Field Work (Beetz, Wengert) 5 daysGeodetic Measurement Techniques II (Metzner, Wengert) 2/1/0/0Geodetic Measurement Techniques I (Metzner, Zhang) 3/1/0/0Geodetic Seminar I, II (Fritsch, Keller, Kleusberg, Schwieger, Sneeuw) 0/0/0/4Integrated Field Work (in German) (Schwieger, Laufer) 10 daysStatistics and Error Theory II (Schwieger, Laufer) 1/1/0/0Surveying (Czommer, Schweitzer) 2/1/0/0Surveying Engineering I (Schwieger, Zheng) 2/1/0/0Surveying Engineering II (Schwieger, Zheng) 2/1/0/0Surveying Engineering III (Schwieger, Beetz) 2/1/0/0Surveying Engineering IV (Czommer) 2/1/0/0Thematic Cartography (in German) (Czommer, Schutzle) 1/1/0/0Multisensor Systems for Terrestrial Data Acquisition (in German) (Schwieger, Schweitzer) 1/1/0/0Causes and Impacts of Deformations in Structures (Metzner) 1/1/0/0Transport Telematics (in German) (Metzner, Czommer, Zheng) 2/1/0/0Reorganisation of Rural Regions (Mayer) 1/0/0/0Integrated Field Work (Schwieger, Laufer) 10 daysTerrestrial Multisensor Data Acquisition (Schwieger, Schutzle) 2/1/0/0Thematic Cartography (Metzner, Schutzle) 1/1/0/0Transport Telematics (Metzner, Czommer, Zheng) 2/1/0/0Kinematic Measurements and Positioning (Schwieger, Beetz) 2/1/0/0Acquisition and Management of Planning Data (Metzner, Wengert) 2/1/1/0GIS-based Data Acquisition (Schwieger, Zheng) 1/1/0/0Data Management and Analysis (Metzner, Laufer) 1/1/0/0GIS-based design of traffic transport structures (Metzner) 1/1/0/0

Institute of Geodesy 21
Institute of GeodesyGeschwister-Scholl-Str. 24D, D-70174 Stuttgart,Tel.: +49 711 685 83390, Fax: +49 711 685 83285e-mail: [email protected] or [email protected]: http://www.uni-stuttgart.de/gi
Head of Institute
SNEEUW NICO, Prof. Dr.-Ing.
Emeritus
GRAFAREND ERIK W, em. Prof. Dr.-Ing. habil. Dr.tech.h.c.mult. Dr.-Ing.E.h.mult.
Academic StaffBAUR OLIVER, Dr.-Ing.KELLER WOLFGANG, Prof. Dr. sc. techn.KRUMM FRIEDRICH, Dr.-Ing.REUBELT TILO, Dr.-Ing.WEIGELT MATTHIAS, Dr.-Ing.WOLF DETLEF, Prof. Dr. rer. nat. habil.
Research AssociatesANTONI MARKUS, Dipl.-Ing.CAI JIANQING, Dr.-Ing.DEVARAJU BALAJI, M. Sc.IRAN POUR SIAVASH, M.Sc.TOURIAN MOHAMMAD
Administrative/Technical StaffHOCK MARGARETE, Phys. T.A.SCHLESINGER RON, Dipl.-Ing. (FH)VOLLMER ANITA, Secretary
22 GIS
GuestsBORKOWSKI A, Prof., Wroclaw/Poland (26.10.-1.11.)DETREKOI A, Prof. Dr., Budapest/Hungary (21.4.-18.7.)GHITAU D, Prof. Dr., Bukarest/Rumania (1.8.-29.9.)GROSS RS, Dr., Pasadena/USA (27.4.)HAJKOVA J, Ing. Mgr., Pilsen, Czech Republic (2.11.-22.12.)JIANG W, Prof. Dr., Wuhan/China (1.8.-25.9.)LI H, Tongji/China (4.11.-31.12.)LI J, Prof. Dr., Wuhan/China (1.8.-31.8.)LIN Y, Dr., Tongji/China (2.3.-31.12.)MIRA S, Prof. Dr., Bandung/Indonesia (3.11.-13.11.)NIEMIEC M, M.Sc., Wroclaw/Poland (26.10.-1.11.)POUTANEN M, Prof. Dr., Masala/Finland (25.-28.3.)SANSO F, Prof., Milano/Italy (12.-13.11.)TSOULIS D, Ass. Prof. Dr., Thessaloniki/Greece (1.6.-31.8.)VARGA P, Prof. Dr., Budapest/Hungary (9.3.-5.4., 4.10.-1.11.)VIRTANEN J, Dr., Masala/Finland (25.-28.3.)WANG Z, Dr., Wuhan/China (1.8.-25.9.)XU X, Dr., Wuhan/China (2.3.- 31.12.)ZHANG X, Prof. Dr., Wuhan/China (1.8.-25.9.)ZOU X, Wuhan/China (1.1.-20.2.)
Additional LecturersENGELS J, PD Dr.-Ing. habil., StuttgartHAUG G, Dr.-Ing., Stadtplanungs- und Stadtmessungsamt, Esslingen/NeckarSCHONHERR H, Prasident Dipl.-Ing., Landesamt fur Geoinformation und Landentwicklung
Baden-Wurttemberg, Stuttgart
ResearchImprovement of regional gravity fields by using SST observations
1. Modeling of the gravity field
In the last decade the determination of the Earth’s gravitational field was mainly based on satelliteobservations, especially of the CHAMP-, GRACE- and the up-coming GOCE-mission. From theseobservations a global solution can be derived, which is usually expressed in terms of sphericalharmonics.

Institute of Geodesy 23
On the one hand, these base functions fulfill the Laplace equation outside of the body and theyare well known and easily calculated, but on the other hand spherical harmonics always cause aloss of information because of their global support.
To improve a regional gravity field, the signal and the model are separated into a global anda residual part. The global one is still described by spherical harmonics and a known set ofcoefficients, which are used to calculate a synthetic signal. After reducing the observation by thissignal, the residual part is analyzed by a second set of base functions.
2. Optimized radial base functions
For the modeling of the residual part the radial base functions are chosen, which form a systemof non-orthogonal but harmonic functions on the sphere. Each base can be characterized by acentre, a scale factor and a shape parameter and the function trends to zero outside its centre.An example of three base functions with different centers and shapes is visualized in the Figure 1,where the height at each center is normalized to one.
Figure 1: Example of three base functions for the analysis of a residual signal
The analysis of gravity-field related data by radial base functions can be formulated as an opti-mization problem, concerning the base parameters, in such a way that the sum of the quadraticdifferences between the model and the residual signal is minimized. The optimization is oftensimplified by solving only the linear problem with fixed positions and shape parameters, but thisrequires many base functions and because of the over-parameterization also regularization.
Our alternative is the non-linear optimization of all parameters, in order to achieve a purely databased improvement of the field. After finding some initial values by an interpolation of the datain the orbit, the parameters are estimated by an iterative Levenberg-Marquadt method until atermination condition is fulfilled. Possible conditions are the number of iterations, the correlationbetween the signal and the approximation or the step size of the last improvement.
This technique is successfully implemented for the in-situ measurement of the potential and theline-of sight gradiometry in the orbit, but also for the range-rate observation of GRACE.

24 GIS
3. GPS-leveling in Poland
In cooperation with the University of Wroclaw a scenario has been developed for testing the al-gorithm for practical surveying and to validate the results. The basic idea is the so-called GPSleveling, i.e. the substitution of the time consuming classical leveling by a known gravity field andthe geometric height h of GPS, in order to achieve the height information at the observation points.
The two necessary height systems are illustrated in Figure 2. In case of the satellite observationthe geoid is the reference for the gravity information and the geometric height h is separated intothe geoid height N and the orthometric height H. On the other hand in Poland or Germany thesurveying system is based on the quasigeoid with the normal height HN and the height anomaly ζas the remaining distance to the ellipsoid.
Figure 2: Orthometric and normal height
The aim of the project is to improve a satellite only model of the gravity field (GGM02s) by theoptimized radial base functions and to compare the achieved geoid heights N with the heightanomaly ζ of the classical leveling. As the geoid and the quasigeoid are very similar in flat terrain,the improvement in the satellite gravity field must reduce the difference to the anomaly as well.
In Figure 3 the test scenario is illustrated for one month of satellite data. On the left hand sidethe geoid heights N are visualized, once by GGM0s only and the second time with 10 additionalbase functions, whose positions are shown in the last panel on the right hand side. Only the geoidsolution with the base functions contains a similar curvature of the main (diagonal) structure likein the height anomalies, which are shown in the last picture on the left. The pictures on the rightpanel show the differences between the anomaly and the geoid height, which are reduced byalmost one meter by the additional base functions.
The remaining error is mainly caused by the limited solution of the GRACE mission and theneglected distinction of the geoid and the quasigeoid.

Institute of Geodesy 25
Figure 3: Validation of the optimized base function approach by comparing the Polish quasigeoidwith the regional
4. Range-rate observation
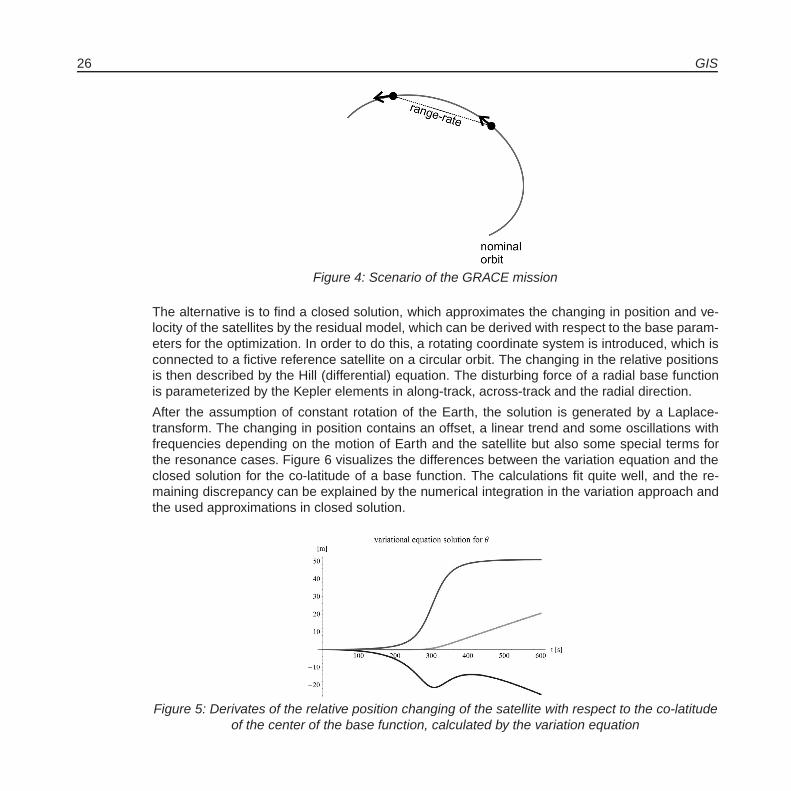
The original observation of the GRACE mission is the distance and the changing of the distancebetween two satellites, the so called range-rate (cf. Figure 4).
The challenge is to link the observations of GRACE to the parameters of the residual gravityfield. Usually this is done by solving the variation equations numerically, but then every arc in theorbit, every variable and each iteration lead to a new equation system. Figure 5 illustrates thederivates of the relative position changing with respect to the co-latitude coordinate of the basecenter in along-track, across-track and the radial component, where the base function is placed inthe middle of the arc at t=300 s.
26 GIS
Figure 4: Scenario of the GRACE mission
The alternative is to find a closed solution, which approximates the changing in position and ve-locity of the satellites by the residual model, which can be derived with respect to the base param-eters for the optimization. In order to do this, a rotating coordinate system is introduced, which isconnected to a fictive reference satellite on a circular orbit. The changing in the relative positionsis then described by the Hill (differential) equation. The disturbing force of a radial base functionis parameterized by the Kepler elements in along-track, across-track and the radial direction.
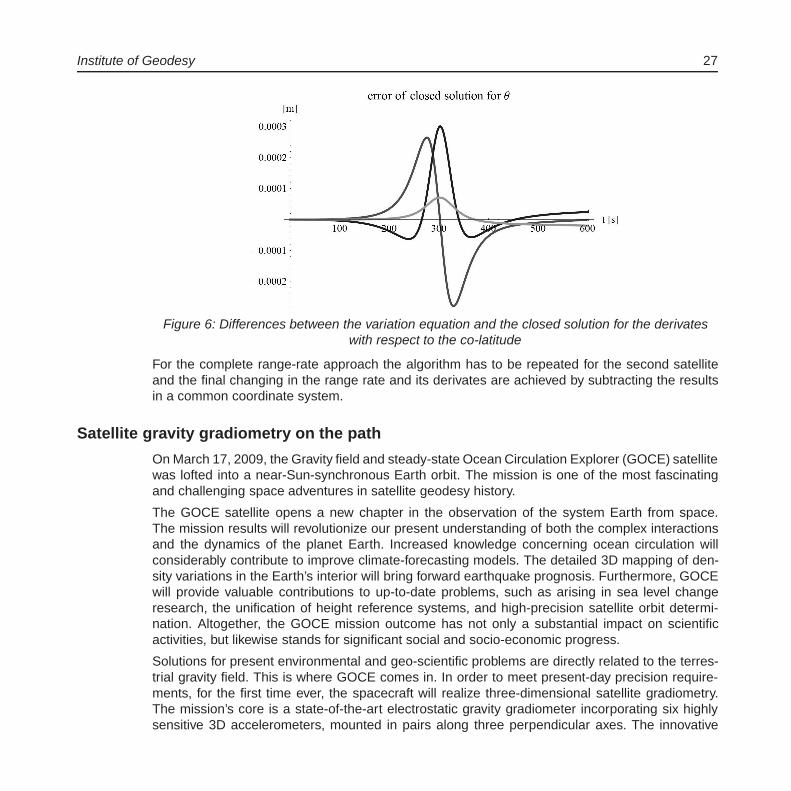
After the assumption of constant rotation of the Earth, the solution is generated by a Laplace-transform. The changing in position contains an offset, a linear trend and some oscillations withfrequencies depending on the motion of Earth and the satellite but also some special terms forthe resonance cases. Figure 6 visualizes the differences between the variation equation and theclosed solution for the co-latitude of a base function. The calculations fit quite well, and the re-maining discrepancy can be explained by the numerical integration in the variation approach andthe used approximations in closed solution.
Figure 5: Derivates of the relative position changing of the satellite with respect to the co-latitudeof the center of the base function, calculated by the variation equation
Institute of Geodesy 27
Figure 6: Differences between the variation equation and the closed solution for the derivateswith respect to the co-latitude
For the complete range-rate approach the algorithm has to be repeated for the second satelliteand the final changing in the range rate and its derivates are achieved by subtracting the resultsin a common coordinate system.
Satellite gravity gradiometry on the path
On March 17, 2009, the Gravity field and steady-state Ocean Circulation Explorer (GOCE) satellitewas lofted into a near-Sun-synchronous Earth orbit. The mission is one of the most fascinatingand challenging space adventures in satellite geodesy history.
The GOCE satellite opens a new chapter in the observation of the system Earth from space.The mission results will revolutionize our present understanding of both the complex interactionsand the dynamics of the planet Earth. Increased knowledge concerning ocean circulation willconsiderably contribute to improve climate-forecasting models. The detailed 3D mapping of den-sity variations in the Earth’s interior will bring forward earthquake prognosis. Furthermore, GOCEwill provide valuable contributions to up-to-date problems, such as arising in sea level changeresearch, the unification of height reference systems, and high-precision satellite orbit determi-nation. Altogether, the GOCE mission outcome has not only a substantial impact on scientificactivities, but likewise stands for significant social and socio-economic progress.
Solutions for present environmental and geo-scientific problems are directly related to the terres-trial gravity field. This is where GOCE comes in. In order to meet present-day precision require-ments, for the first time ever, the spacecraft will realize three-dimensional satellite gradiometry.The mission’s core is a state-of-the-art electrostatic gravity gradiometer incorporating six highlysensitive 3D accelerometers, mounted in pairs along three perpendicular axes. The innovative
28 GIS
gradiometer instrument allows recovering gravitational differences with an accuracy of one mil-lionth of the terrestrial acceleration. As a consequence, the data will yield the geoid with an ac-curacy of 1-2cm. The spatial resolution will be improved from several hundreds or thousands ofkilometres on previous missions to around 100km with GOCE.
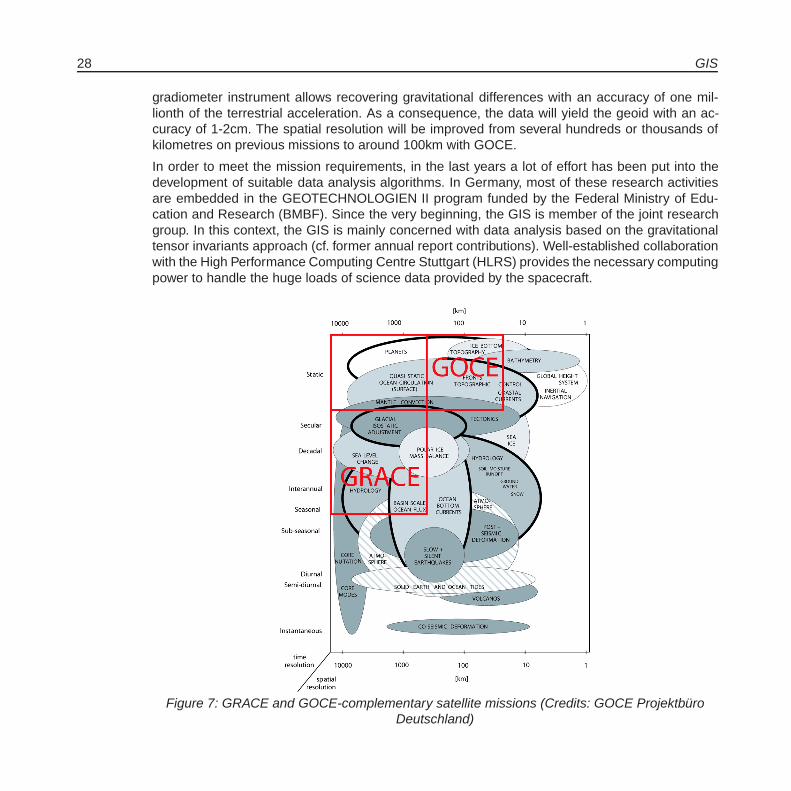
In order to meet the mission requirements, in the last years a lot of effort has been put into thedevelopment of suitable data analysis algorithms. In Germany, most of these research activitiesare embedded in the GEOTECHNOLOGIEN II program funded by the Federal Ministry of Edu-cation and Research (BMBF). Since the very beginning, the GIS is member of the joint researchgroup. In this context, the GIS is mainly concerned with data analysis based on the gravitationaltensor invariants approach (cf. former annual report contributions). Well-established collaborationwith the High Performance Computing Centre Stuttgart (HLRS) provides the necessary computingpower to handle the huge loads of science data provided by the spacecraft.
Figure 7: GRACE and GOCE-complementary satellite missions (Credits: GOCE ProjektburoDeutschland)

Institute of Geodesy 29
GOCE Gravity Field Recovery - GOCE real data analysis by means of rotationalinvariants
Following the successful launch in March 2009 and in-orbit testing of the most sophisticated grav-ity mission ever built, ESA’s GOCE satellite has been in ‘measurement mode’ since October2009, provides the opportunity to determine the static Earth gravity field with an accuracy neverreached before. Based on the results achieved from GOCE-GRAND I and II (GOCE GRavita-tionsfeldANalyse Deutschland) since 2001, a succeed joint research program REal data AnaL-ysis GOCE (REAL-GOCE) has been proposed by the German Institutes and approved to befunded by the Federal Ministry of Education and Research (BMBF) and the German researchfoundation (Deutsche Forschungsgemeinschaft) for period June 2009 to July 2012 within theGEOTECHNOLOGIEN II program
”Observation of the System Earth from Space“. The Institute
of Geodesy in Stuttgart (GIS) is member of this common project. The further participants arethe Universities of Munich, Bonn and Hanover, Karlsruhe, Hamburg, the Federal Agency for Car-tography and Geodesy (BKG), The German Geodetic Research Institute (DGFI) as well as theGeoForschungsZentrum (GFZ) Potsdam.
The goal of the national collaborative project REAL-GOCE in Germany is fully implement of thepreviously conceived GOCE data analysis chains and their application to the GOCE real data.To meet this objective, our institute is engaged in GOCE real data analysis by means of rota-tional invariants. The major objective of the individual project (WP 120) is the determination ofthe Earth gravity field from GOCE gradiometer observations in terms of the rotational invariantsrepresentation of the gravitational tensor.
In order to reach the aforementioned objective, first of all the real data need to be prepared forthe alternative analysis approach (preparation of the functional model). The strong correlationsbetween successive gradiometer measurements (‘colored noise“) induce the stochastic modelof the observations to be of particular importance. Based on the results acquired by the projectpartners, the stochastic model of the gravitational gradients is used to derive and describe thestochastic properties of he invariants. After the preparation of both the functional and stochasticmodels, the computation of the gravity field parameters will be carried out. Solving the resultingsystem of equations by least-squares techniques provides the appropriate parameter estimate.For the numerical process itself, high performance computers come into operation. In the courseof the adjustment procedure, the impact of the polar data gaps will be minimized by tailoredregularization. Finally, both the comparison of the invariants solution with the results obtained bythe project partners and its performance within the project-internal validation process allow toevaluate the optimal GOCE real data analysis scheme.
In summary, the following subtasks have to be tackled within the scope of WP120 (cf. Figure 8):
� Preparation of GOCE real data (Level 1b) for the invariants analysis approach
� Statistical investigations of the observation type”rotational invariant“
� Adaption and optimization of the stochastic model

30 GIS
� Polar gap problem elimination
� Computation of a GOCE-derived Earth gravity field model (Level 2)
� Validation of the obtained gravity field solution, and comparison with alternative analysismethods
Figure 8: Overview of the individual project (WP 120) of REAL GOCE
Future satellite concepts for the detection of time variable gravity fields
Within the two common projects”Assessment of a Next Generation Gravity Mission for Monitoring
the Variations of Earth’s Gravity Field“ (ESA) and”Zukunftskonzepte fur Schwerefeldsatellitenmis-
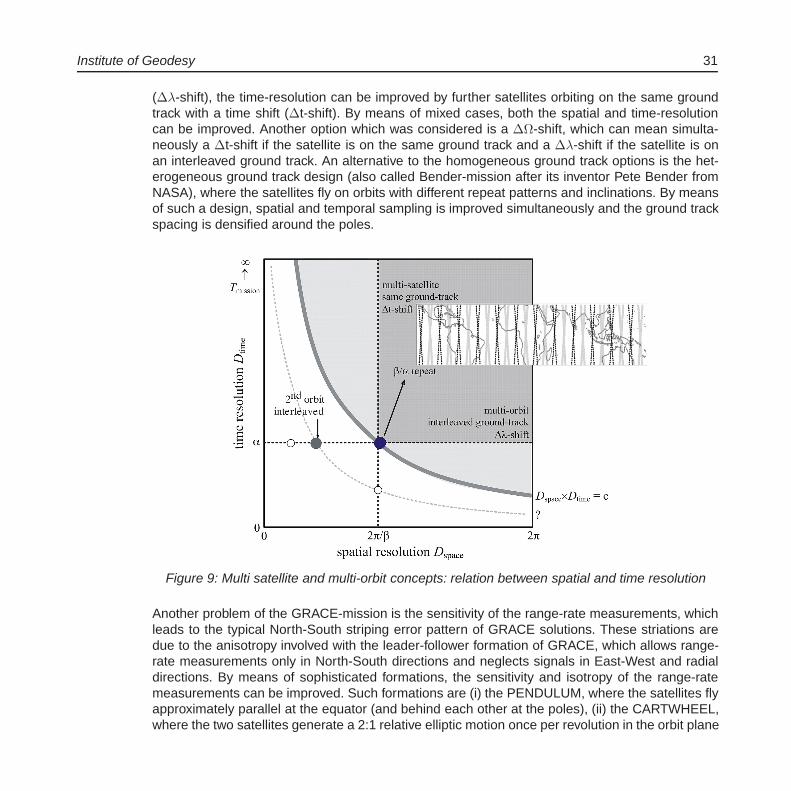
sionen“ (BMBF) with project partners from science and industry concepts for future multi-satellitemissions for the detection of time variable gravity fields are investigated. Two of the main objec-tives are the reduction of the aliasing-problem and the separation of the mass-transport sources.At the Geodetic Institute, multi-satellite and multi-orbit concepts for the improvement of the space-time-sampling have been studied. We focus on β/α-repeat orbits (β revolutions in α nodal days) toreduce the problem of time-variable ground tracks. The space-time sampling of a satellite-missionis mainly driven by two sampling theorems (Figure 9): (i) the
”Nyquist-theorem“ β ≥ 2L (or 2M),
which determines the spatial resolution (maximum degree/order L/M) and (ii) the”Heisenberg-
theorem“ Dspace x Dtime = 2πα / β = 2πTRev = const., which means that the product of spatial reso-lution Dspace and the time-resolution Dtime is constant. If the spatial resolution of a satellite missionshould be improved (Figure 9), additional satellites have to be placed on interleaved ground tracks
Institute of Geodesy 31
(Δλ-shift), the time-resolution can be improved by further satellites orbiting on the same groundtrack with a time shift (Δt-shift). By means of mixed cases, both the spatial and time-resolutioncan be improved. Another option which was considered is a ΔΩ-shift, which can mean simulta-neously a Δt-shift if the satellite is on the same ground track and a Δλ-shift if the satellite is onan interleaved ground track. An alternative to the homogeneous ground track options is the het-erogeneous ground track design (also called Bender-mission after its inventor Pete Bender fromNASA), where the satellites fly on orbits with different repeat patterns and inclinations. By meansof such a design, spatial and temporal sampling is improved simultaneously and the ground trackspacing is densified around the poles.
Figure 9: Multi satellite and multi-orbit concepts: relation between spatial and time resolution
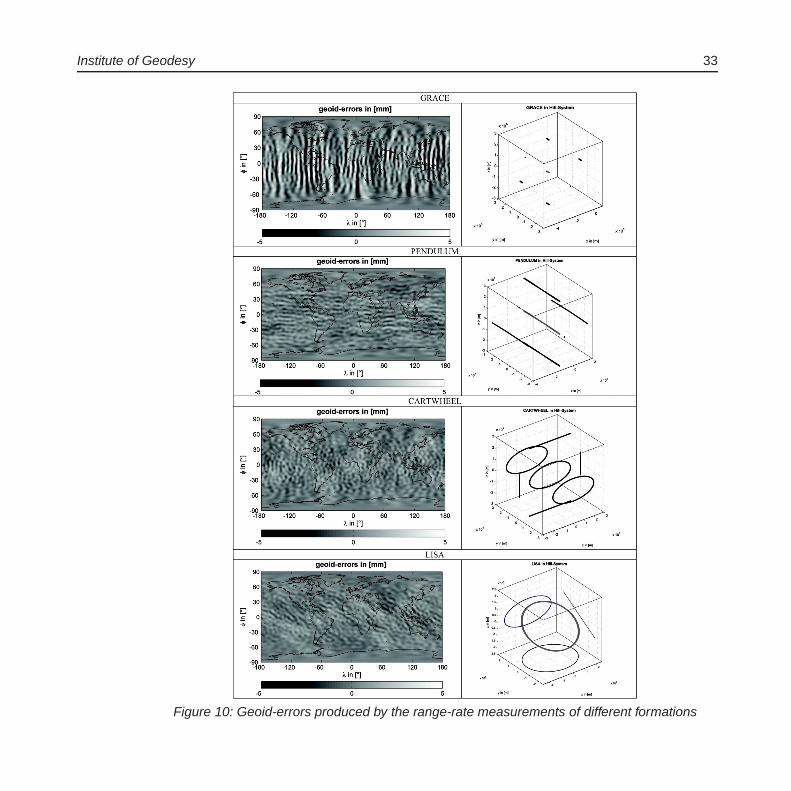
Another problem of the GRACE-mission is the sensitivity of the range-rate measurements, whichleads to the typical North-South striping error pattern of GRACE solutions. These striations aredue to the anisotropy involved with the leader-follower formation of GRACE, which allows range-rate measurements only in North-South directions and neglects signals in East-West and radialdirections. By means of sophisticated formations, the sensitivity and isotropy of the range-ratemeasurements can be improved. Such formations are (i) the PENDULUM, where the satellites flyapproximately parallel at the equator (and behind each other at the poles), (ii) the CARTWHEEL,where the two satellites generate a 2:1 relative elliptic motion once per revolution in the orbit plane

32 GIS
and (iii) the LISA formation, a combination of pendulum and cartwheel, where the two satellitesperform a circular motion in a plane tilted to the orbit plane. The relative motion of the satellites ofthese formations is shown in the Hill-frame in Figure 10. In contrast to the North-South directedmeasurements of GRACE, the PENDULUM generates measurements in East-West direction overthe equator (and possibly in North-South direction over the poles), the CARTWHEEL producesmeasurements alternating twice per revolution in radial and North-South direction and LISA per-forms measurements alternating in all three directions. As shown by the geoid errors in Figure10, the advanced formations are not only able to reduce the total error level, they also improvethe isotropy. While distinct North-South striations are visible for the GRACE formation, this neg-ative effect is eliminated by the other formations. The PENDULUM shows a slight EAST-WESTpattern, the CARTWHEEL and LISA produce the most homogeneous error pattern. The technicalrealisation of the sophisticated formations, which is comparatively difficult, is studied by industrialpartners within the mentioned projects.
Ice mass balance over Greenland
For the first time ever, the GRACE (Gravity Recovery And Climate Experiment) satellite missionallows the determination of global mass variations - such as ice melting in the polar areas - fromchanges in the Earth gravitational pull. The underlying measurement principle is as simple asstunning; it bases on the fact that the redistribution of masses on the Earth surface maps intochanges of the terrestrial gravity field. Hence, scientists measure the spatio-temporal variationsof the Earth’s gravitational attraction on a test mass in space, i.e., the GRACE spacecraft.
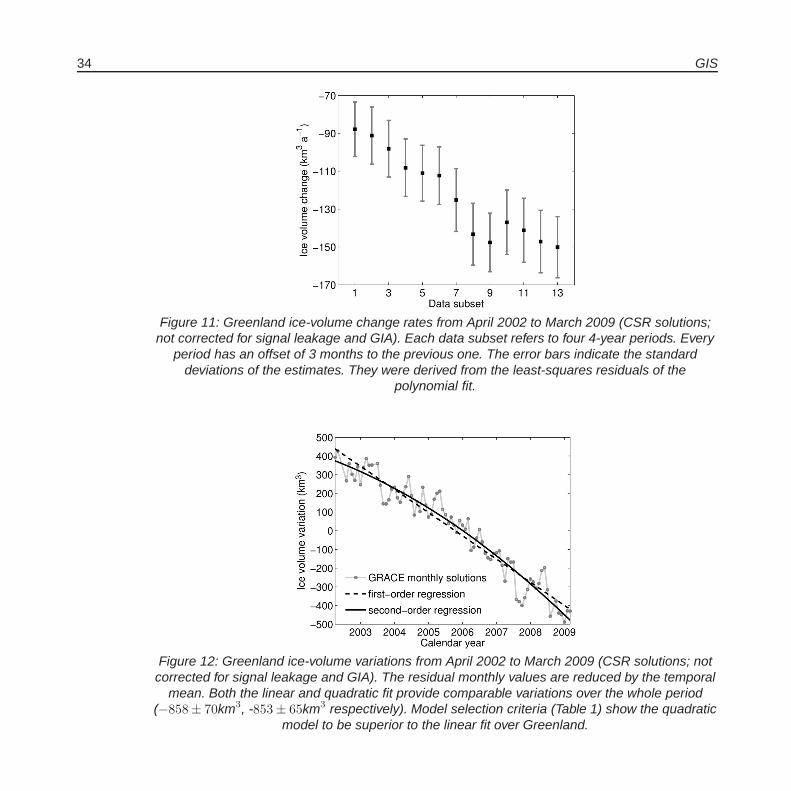
Commonly, GRACE monthly gravity field solutions are exploited to derive secular and seasonalmass changes on the Earth’s surface. The increased lifespan of the satellite mission, however,makes temporal characteristics of secular trends detectable. Fitting both linear and non-linearmodels to the mass-change time-series suggest accelerated melting of the Greenland ice sheetsin recent years (cf. Figures 11 and 12).
Institute of Geodesy 33
Figure 10: Geoid-errors produced by the range-rate measurements of different formations
34 GIS
Figure 11: Greenland ice-volume change rates from April 2002 to March 2009 (CSR solutions;not corrected for signal leakage and GIA). Each data subset refers to four 4-year periods. Every
period has an offset of 3 months to the previous one. The error bars indicate the standarddeviations of the estimates. They were derived from the least-squares residuals of the
polynomial fit.
Figure 12: Greenland ice-volume variations from April 2002 to March 2009 (CSR solutions; notcorrected for signal leakage and GIA). The residual monthly values are reduced by the temporal
mean. Both the linear and quadratic fit provide comparable variations over the whole period(−858± 70km3, -853 ± 65km3 respectively). Model selection criteria (Table 1) show the quadratic
model to be superior to the linear fit over Greenland.
Institute of Geodesy 35
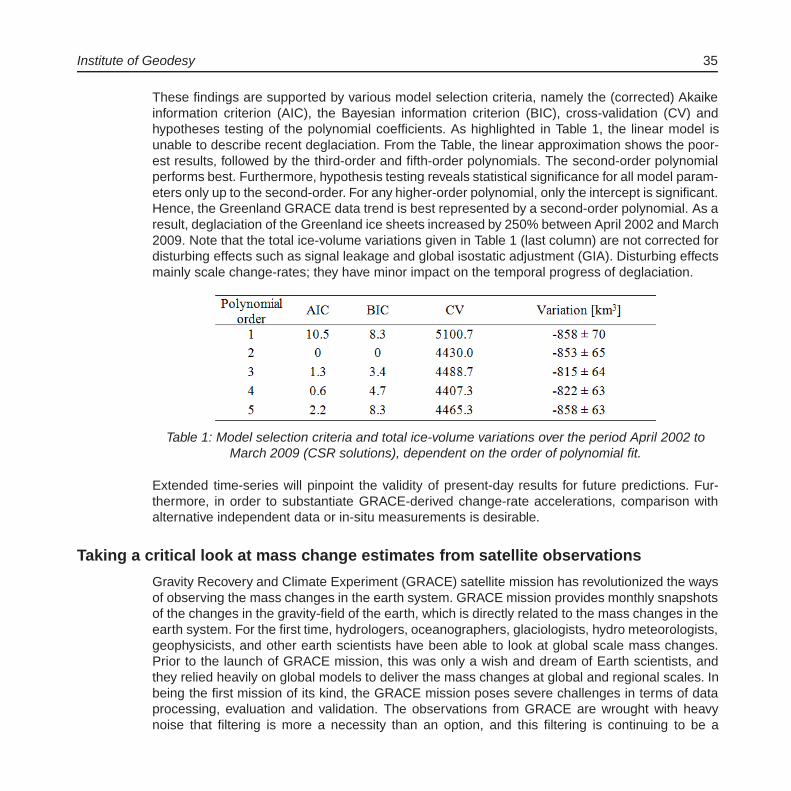
These findings are supported by various model selection criteria, namely the (corrected) Akaikeinformation criterion (AIC), the Bayesian information criterion (BIC), cross-validation (CV) andhypotheses testing of the polynomial coefficients. As highlighted in Table 1, the linear model isunable to describe recent deglaciation. From the Table, the linear approximation shows the poor-est results, followed by the third-order and fifth-order polynomials. The second-order polynomialperforms best. Furthermore, hypothesis testing reveals statistical significance for all model param-eters only up to the second-order. For any higher-order polynomial, only the intercept is significant.Hence, the Greenland GRACE data trend is best represented by a second-order polynomial. As aresult, deglaciation of the Greenland ice sheets increased by 250% between April 2002 and March2009. Note that the total ice-volume variations given in Table 1 (last column) are not corrected fordisturbing effects such as signal leakage and global isostatic adjustment (GIA). Disturbing effectsmainly scale change-rates; they have minor impact on the temporal progress of deglaciation.
Table 1: Model selection criteria and total ice-volume variations over the period April 2002 toMarch 2009 (CSR solutions), dependent on the order of polynomial fit.
Extended time-series will pinpoint the validity of present-day results for future predictions. Fur-thermore, in order to substantiate GRACE-derived change-rate accelerations, comparison withalternative independent data or in-situ measurements is desirable.
Taking a critical look at mass change estimates from satellite observations
Gravity Recovery and Climate Experiment (GRACE) satellite mission has revolutionized the waysof observing the mass changes in the earth system. GRACE mission provides monthly snapshotsof the changes in the gravity-field of the earth, which is directly related to the mass changes in theearth system. For the first time, hydrologers, oceanographers, glaciologists, hydro meteorologists,geophysicists, and other earth scientists have been able to look at global scale mass changes.Prior to the launch of GRACE mission, this was only a wish and dream of Earth scientists, andthey relied heavily on global models to deliver the mass changes at global and regional scales. Inbeing the first mission of its kind, the GRACE mission poses severe challenges in terms of dataprocessing, evaluation and validation. The observations from GRACE are wrought with heavynoise that filtering is more a necessity than an option, and this filtering is continuing to be a
36 GIS
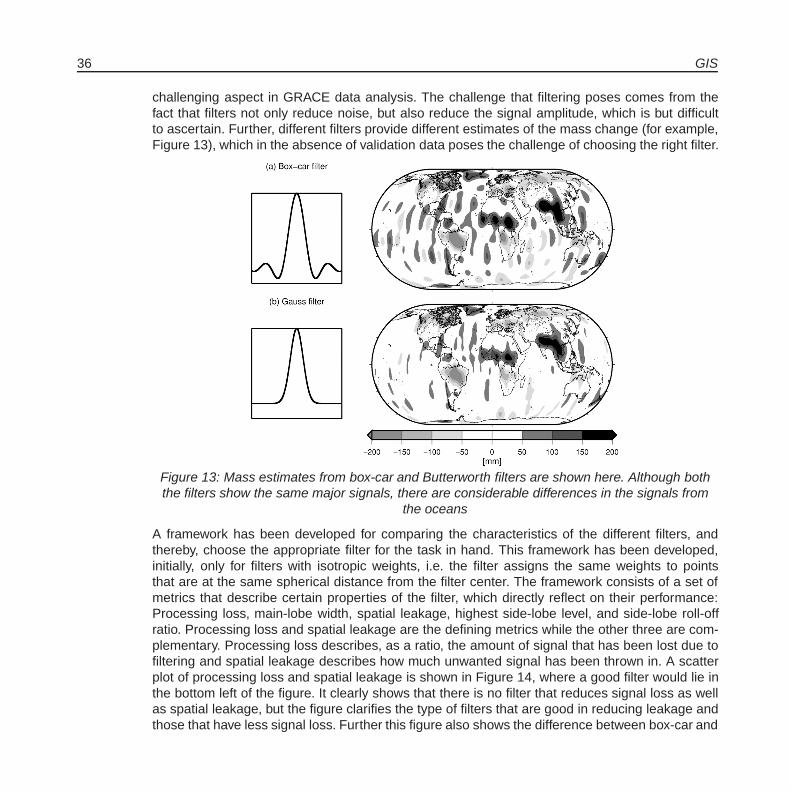
challenging aspect in GRACE data analysis. The challenge that filtering poses comes from thefact that filters not only reduce noise, but also reduce the signal amplitude, which is but difficultto ascertain. Further, different filters provide different estimates of the mass change (for example,Figure 13), which in the absence of validation data poses the challenge of choosing the right filter.
Figure 13: Mass estimates from box-car and Butterworth filters are shown here. Although boththe filters show the same major signals, there are considerable differences in the signals from
the oceans
A framework has been developed for comparing the characteristics of the different filters, andthereby, choose the appropriate filter for the task in hand. This framework has been developed,initially, only for filters with isotropic weights, i.e. the filter assigns the same weights to pointsthat are at the same spherical distance from the filter center. The framework consists of a set ofmetrics that describe certain properties of the filter, which directly reflect on their performance:Processing loss, main-lobe width, spatial leakage, highest side-lobe level, and side-lobe roll-offratio. Processing loss and spatial leakage are the defining metrics while the other three are com-plementary. Processing loss describes, as a ratio, the amount of signal that has been lost due tofiltering and spatial leakage describes how much unwanted signal has been thrown in. A scatterplot of processing loss and spatial leakage is shown in Figure 14, where a good filter would lie inthe bottom left of the figure. It clearly shows that there is no filter that reduces signal loss as wellas spatial leakage, but the figure clarifies the type of filters that are good in reducing leakage andthose that have less signal loss. Further this figure also shows the difference between box-car and

Institute of Geodesy 37
Gauss filters. Gauss filter has minimal spatial leakage and heavy processing loss, while box-carfilter has enormous spatial leakage and minimal processing loss. It is clear from this that thoughthe mass estimates from Gauss filter are subdued, they are relatively more local and realisticthan those from box-car. The spatial leakage of box-car also throws light on the big differencesbetween the two filters in the ocean signal and the signal in Africa. Thus, apart from helping inchoosing the right filter, the metrics developed also help in analyzing the mechanics of each filter,for example, leakage effects. Therefore, these metrics help in looking at the mass estimates fromfiltered GRACE data much more critically than was possible before.
Figure 14: Scatter plot between processing loss and spatial leakage of five different filters
Quantification of GRACE signal uncertainties to close the continental water balance
As a prior condition to achieve the main goal of the project, the direct determination of monthlyactual evapotranspiration ETa via a closed water balance by GRACE mass changes the uncertain-ties of GRACE and atmospheric moisture flux data have to be quantified. During the quantificationof uncertainties, in the respective signals, positive and negative peaks are detected in GRACE
38 GIS
signals which do not correspond to the related hydrological or atmospheric signals. These peaksmainly occur at specific times for many catchments simultaneously and thus can be interpreted asoutliers. Outliers in the GRACE signal are expected to deteriorate signal correlation with hydrologyand atmosphere and increase the noise level significantly.
An algorithm is developed to detect and identify outliers. The procedure of outlier detection isverified by a comparison of GRACE signals and both the hydrological and atmospheric signals.After identification, outliers in the GRACE signal are replaced by appropriate mean or interpo-lated values. The results of this outlier handling show a significant improvement in the correlationof GRACE signals versus hydrology and atmosphere. Also, a significant reduction of noise levelcan be achieved. On the other hand, in order to quantify the uncertainties the correlations of ag-gregated GRACE signal have been investigated. The correlations of aggregated GRACE signaltime series between different catchments (Inter Catchment Correlation) show a specific patternmainly created by the periodic local climatic conditions. Inter Catchment Correlations of monthlyresiduals of GRACE signals - monthly values minus mean monthly values - show a sinusoidal de-pendence on latitude. This is surprising as monthly mass residuals on landmasses are supposedto originate from monthly water balance variations and correlations of climatic variability over thehemispheres are not expected. Monthly residuals of corresponding hydrologic storage changes(P-Eta-R) and atmospheric storage changes from moisture flux divergence (-divQ-R) do not showcomparable correlation patterns. In fact, there is not enough runoff data available to certainlyverify that there is no hydrological correlation existing for catchments on different hemispheres.Hence, an extension from catchments to a global coverage is needed in order to recognize differ-ences between landmasses and oceans. Therefore, grid based (5°x5°) time series are generatedand correlated with respect to a reference cell. The spatial distribution of Inter Cell Correlations(ICC) of monthly GRACE signals reflect landmasses and oceans while ICC of monthly residu-als doesn’t show any reflection of landmasses and oceans. Instead, a dominant latitudinal andless dominant longitudinal dependence over the globe can be recognized. This means that theremust be a signal component in the monthly GRACE residual over the globe not depending on thespecific characteristics of landmasses and oceans. Neither its form nor origin is recognized sofar, and thus is deteriorating the signal quality for hydrology and oceanography. The objective ofthis investigation is to identify this signal component in the GRACE residual and check possiblesources. As possible sources of ICC, GRACE outliers and de-aliasing products are consideredand EOF analysis is applied to identify possible modes responsible for the ICC.

Institute of Geodesy 39
Figure 15: Inter catchment correlation of GRACE signal based on Amazon catchment
Satellite altimetry waveforms over non-ocean surfaces for hydrological purposes
Over the past two decades, satellite altimetry has been used to measure non-ocean water levelvariation for hydrologic studies. Non-ocean surfaces are much rougher than oceans. Moreover,satellite corrections for atmospheric propagation normally include errors in non-ocean surfaces.Hence, due to (1) the effect of topography and heterogeneity of reflecting surface and (2) atmo-spheric propagation, the expected echo shape for altimeter returns over land differs from that overocean surfaces. As a result, measurements over non-ocean area include erroneous and missingdata. We have been working on a method for an unsupervised classification of the satellite wave-forms and algorithm for waveform retracking. Balaton Lake and Urmia Lake have been chosen ascase study for our work.

40 GIS
Figure 16: Twenty randomly selected waveforms among 5520 waveforms over Balaton Lake,which display a wide variety of waveforms
Local gravity field refinement using base functions with strictly finite support
The recovery of local gravity features from satellite-to-satellite tracking is one of the current chal-lenges in Physical Geodesy. The most common approach is to employ a global spherical harmonicanalysis and select the area of interest later on. Typical side effects are leakage and loss of signalsince the spherical surface functions are bases with global support. As a consequence, massbalance estimates in areas like the Amazon or Greenland do not coincide well with hydrological orice models. The usage of locally supported base functions aims at the minimization of these sideeffects. So far, attempts to recover gravity features from spatially restricted data mostly concen-trate on the usage of the so-called radial base functions which still allows analytical expressionsfor the entries of the design matrix. Although they decay rapidly, their support is not exactly local,since they are global functions as well. Leakage occurs again (though reduced) since differentradial bases overlap.

Institute of Geodesy 41
A more rigorous approach is to use base functions with a strictly finite and distinct support. Thegravity field quantity is modelled by a single layer potential which requires the integration over thesurface of the area of interest. The unknowns are the surface mass densities in the corner points.For numerical implementation, the surface is decomposed into a finite number of basic shapeslike e.g. triangles or quadrilaterals. This method is also known as boundary element method. Thedisadvantage is that the entries of the design matrix cannot be calculated by closed expressionsanymore but have to be computed by numerical integration. Besides the usage of spatially re-stricted functions, one other strength of the method is its flexibility in the size of each surfaceelement, i.e. the size of each element does not need to be constant and even the combination ofdifferent types of shapes is possible. The placement of the corner points can thus be optimizedto each data set which is not a trivial problem, however. Additionally, the number and position ofthe surface mass densities will also depend on the assumption of their behaviour between thecorners of each shape element, i.e. whether the surface mass density is assumed to be constantor to change linearly (or with higher order) within an element.
Figure 17 shows results of a simulation study. A residual potential field has been created using4225 point masses at a depth of 120km. The signal is calculated at the position of a CHAMP-likesatellite flying at an orbit height of approximately 400km and simulating a measurement every 5seconds. Based on the triangular mesh in Figure 17 (right), the gravity signal is recovered and thedifference plot in Figure 17 (middle) shows a nearly random pattern which proofs that the methodcan be successfully applied to this type of data.
Figure 17: Simulated residual potential field at satellite height (left), difference between recoverdand input signal (middle), triangular based grid and location of the surface mass densities (right)
The next steps will include the application to a residual tensor signal and the application to realGRACE data. The complete procedure consists then of two steps. First, in-situ observations arederived using the so-called line-of-sight gradiometry technique. The K-Band range rates mea-sured by GRACE are connected by numerical differentiation to the second order derivative of the

42 GIS
gravitational potential of the Earth projected to the direction of the satellite motion. Subsequently,the second order derivative is connected to the single layer potential and the surface mass den-sities can be estimated. The procedure is computationally demanding as every surface elementneeds to be integrated but promises (from a theoretical point of view) to reduce leakage and tomake best use of the signal content in the K-Band ranging measurement.
Properties and applications of EOF-based filtering of GRACE solutions
The twin”Gravity Recovery and Climate Experiment“ (GRACE) satellites observe the time varying
gravity which is the sum of all mass variations in the Earth System. However, the main problemin the GRACE solutions of Stokes coefficients is the increasing noise at higher degrees in thespherical harmonics (SH) coefficients (Swenson and Wahr, 2006). The noises appear as un-physical North-South striping patterns in the spatial domain maps (for example in the EquivalentWater Height (EWH) maps) which have a strong correlation between the even and odd degreecoefficients. The stripes can be largely suppressed by weighting the SH coefficients by a Gaus-sian smoothing function, but since the errors have a non-isotropic character, while the functionis isotropic, a large smoothing radius is required for removing the stripes which by itself causesa significant loss of information in the GRACE solutions (Chen et al., 2007). One approach toremove those stripes is using Empirical Orthogonal Functions (EOF) in combination with white-noise testing of the resulting time series in the spectral domain (Wouters and Schrama, 2007).The EOF procedure can be recast into a filter equation, i.e. the filter transfer is described explic-itly. This also allows us to emphasize the characteristics of the EOF-based filter. Moreover, ourformulation provides an easy means to propagate the GRACE fields into degree variances andspatial covariance functions.
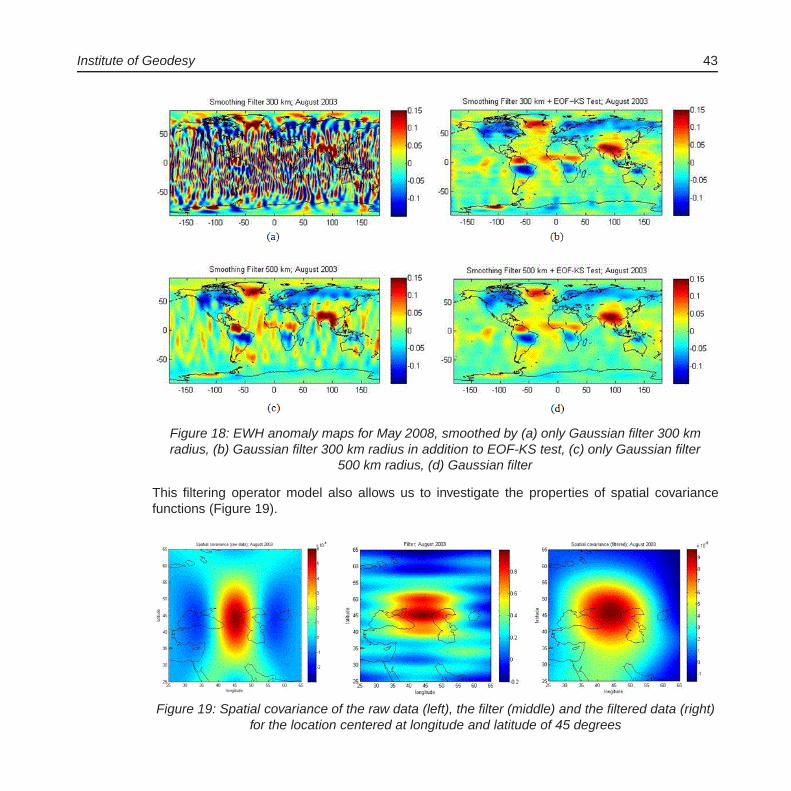
The reconstructed EWH maps provided by the spectral domain analysis of the GRACE data showa strong capability of EOF analysis for de-striping the patterns which is due to the ability of per-forming EOF analysis for individual orders (Iran Pour et al., 2009). Also examples in the spectraldomain show that the EOF analysis with white noise test but with smaller smoothing Gaussianfilters result in maps comparable to those which are just smoothed by the Gaussian smoothingfilters but with larger radii (Figure 18). The Kolmogorov-Smirnov test (KS test) is used as a tool forwhite noise recognition for the modes provided by EOF analysis which are performed through thefiltering operators.
Institute of Geodesy 43
Figure 18: EWH anomaly maps for May 2008, smoothed by (a) only Gaussian filter 300 kmradius, (b) Gaussian filter 300 km radius in addition to EOF-KS test, (c) only Gaussian filter
500 km radius, (d) Gaussian filter
This filtering operator model also allows us to investigate the properties of spatial covariancefunctions (Figure 19).
Figure 19: Spatial covariance of the raw data (left), the filter (middle) and the filtered data (right)for the location centered at longitude and latitude of 45 degrees
44 GIS
It is seen that some of the last modes of some orders pass the test (recognized as signals). Thiscan be explained by the non-white noise property of the modes, although it is important to mentionthat those last modes have very small singular values and therefore their contributions to the datareconstruction are also very small.
However, the test is claimed for the white noise recognition, while the modes could represent othertypes of noises which were not studied in this work. It can also be seen that the EOF analysis withthe white noise test smoothes the patterns which may diminish the effects of some geophysicalphenomena. This means that more investigations are needed for the testing strategies and thenoise recognition methods in the future.
Microgravimetric survey of the Great Pyramid, Giza, Egypt
The Institute of Geodesy is collaborating with the Ain Shams University and under the supervi-sion of the Supreme Council of Antiquities in an international archaeological mission at the GizaPlateau, Egypt. The aim is to investigate the internal structure of the Great Pyramid, also known asthe Cheops or Khufu pyramid. The project is called
”Non-Destructive Archaeology using Gravime-
try in the area of the Great Pyramids“ under the supervision of Dr. Elhabiby, director of the missionand assistant professor at Ain Shams University, and is partially funded by the BA/CSSP researchgrant of the Bibliotheca Alexandrina.
Till today, the construction of the Great Pyramid is a mystery and several theories exist, e.g. theusage of ramps, internal ramps and cable winches. The currently most popular theory is the idea ofan internal ramp, which is coiling upwards on the outer edge of the pyramid. After construction, theramp has been filled with material, e.g. sand and sandstone. The main problem for archaeologistsis that excavations tend to destroy the site. Considering the cultural heritage and the internationalpopularity of the Great Pyramid, any changes to its faces are not allowed. Gravimetry provides away out of this dilemma. It enables to examine the internal structure of the Great Pyramid withoutany excavations or destructions of the surface.
The procedure consists of two steps: first, carefully executed gravimetric measurements on thesurface of the pyramid using the Scintrex CG-5 of the Institute of Geodesy are collected and con-nected to a local reference frame by GPS measurements. Reductions are limited to instrumentalcorrections only. The second part consists of a forward modelling of the pyramid by taking allavailable information about the structure of the pyramid, the known voids and the density of therocks into account. Figure 1 (top left) shows a simplified model as it was used in the preparationof the campaign. 3D surface modelling from photographic images is supporting the construction.The calculation of an expected gravity observation at the location of the gravimetric observationand the comparison and analysis of the residuals will reveal details about the interior structure ofthe Great Pyramid.
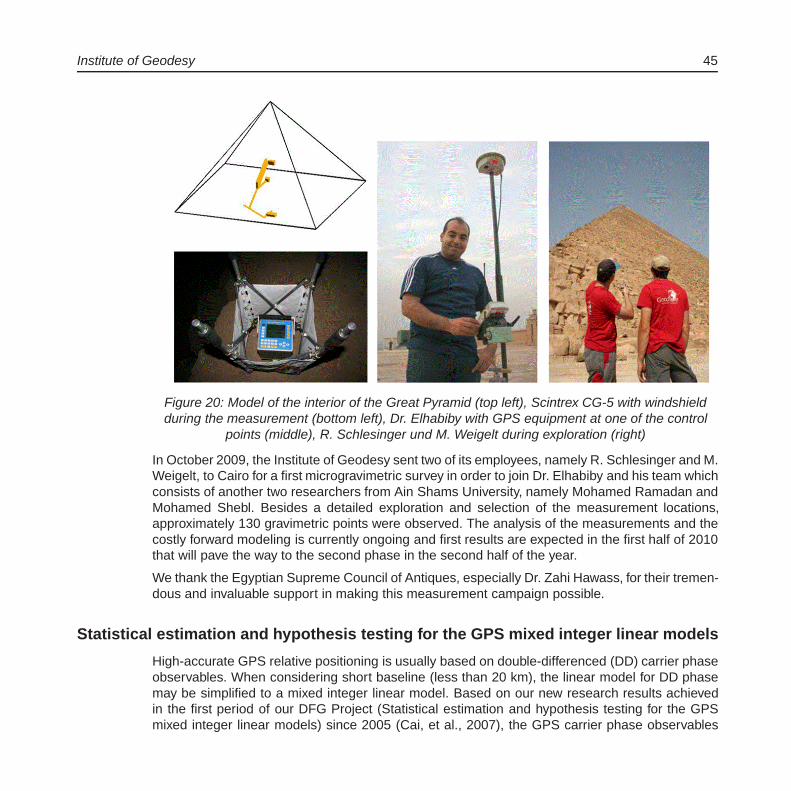
Institute of Geodesy 45
Figure 20: Model of the interior of the Great Pyramid (top left), Scintrex CG-5 with windshieldduring the measurement (bottom left), Dr. Elhabiby with GPS equipment at one of the control
points (middle), R. Schlesinger und M. Weigelt during exploration (right)
In October 2009, the Institute of Geodesy sent two of its employees, namely R. Schlesinger and M.Weigelt, to Cairo for a first microgravimetric survey in order to join Dr. Elhabiby and his team whichconsists of another two researchers from Ain Shams University, namely Mohamed Ramadan andMohamed Shebl. Besides a detailed exploration and selection of the measurement locations,approximately 130 gravimetric points were observed. The analysis of the measurements and thecostly forward modeling is currently ongoing and first results are expected in the first half of 2010that will pave the way to the second phase in the second half of the year.
We thank the Egyptian Supreme Council of Antiques, especially Dr. Zahi Hawass, for their tremen-dous and invaluable support in making this measurement campaign possible.
Statistical estimation and hypothesis testing for the GPS mixed integer linear models
High-accurate GPS relative positioning is usually based on double-differenced (DD) carrier phaseobservables. When considering short baseline (less than 20 km), the linear model for DD phasemay be simplified to a mixed integer linear model. Based on our new research results achievedin the first period of our DFG Project (Statistical estimation and hypothesis testing for the GPSmixed integer linear models) since 2005 (Cai, et al., 2007), the GPS carrier phase observables

46 GIS
that are actually measured on the unit circle have been statistically validated to have a von Misesnormal distribution. The existing validation and hypothesis testing procedures (e.g. χ2-test, F-test,t-test, and ratio test etc.) should therefore be improved accordingly. As one of the modern statis-tical techniques since 1980s bootstrap method refers to a class of computer-intensive statisticalprocedures, which can often be helpful for carrying out a statistical test of a point estimate in situa-tions where more usual statistical procedures are not valid and /or not available (e.g. the samplingdistribution of a statistic is not known).
For the linear model, these bootstrap methods provide inference procedures (e.g. confidencesets) that are asymptotically more accurate than those produced by the other methods. This isjust the case for the validation and hypothesis tests of the float and fixed estimates of GNSS mixedmodels in the directional context, with the emphasis on the determination of the confidence inter-vals of the estimates. In the second period of our DFG project we have successfully applied twobootstrap analysis methods for linear model, bootstrapping residuals and bootstrapping pairs, todeterminate the confidence domains of the parameters of the GNSS mixed integer linear models.The analysis of the Bootstrapping confidence intervals for the float solutions with the real GPSobservations shows that
� the Bootstrapping residuals and pairs for linear model provide us an efficient and accuratealgorithm to construct the confidence domains of the GPS float solutions
� the Bootstrapping pairs method depends on the conditional number of the design matrix
� the Bootstrapping confidence intervals are consistent with the LS confidence intervals basedon the t-test
� both kinds of the confidence intervals all cover the potential correct fixed ambiguity integers,which are important for searching process and fixed solution, see Figures 21 and 22
� the bootstrapping confidence intervals are derived without any assumption about the prob-ability distribution of the observations
The fundamental recognition of the statistical properties of the von Mises (circular) normal distri-bution of GPS carrier phase observables and the successful construction of the related hypothesistests with bootstrapping residuals and bootstrapping pairs for linear models provide a completesolution for the estimation and hypothesis tests on the parameters of the GPS mixed integer lin-ear models in the directional context. These research achievements will not only substantiallyimprove the theoretical background and application reality of GPS geodesy and navigation, butalso be significant to the forthcoming Galileo, Europe’s new civilian-managed Global NavigationSatellite System (GNSS).

Institute of Geodesy 47
Figure 21: The comparison of the float estimates and their confidence intervals with the LS (inblue) and bootstrapping residuals methods (in red).
Figure 22: The comparison of the float estimates and their confidence intervals with the LS (inblue) and bootstrapping pairs methods (in red).

48 GIS
Theses
Diploma Theses
(http://www.uni-stuttgart.de/gi/education/dipl/diploma theses.en.html)
BENTEL K: Empirical Orthogonal Function Analysis of GRACE Gravity Data (Analyse von Schw-erefelddaten der Satellitenmission GRACE mittels Zerlegung in Empirisch-OrthogonaleFunktionen)
BRITCHI A: Rumanische Geodatische Netze und Koordinaten-Transformation (Rumania Geode-tic Networks and Coordinate Transformation)
KARRER K: Impact of spatial and temporal resolution on the significance of GNSS performanceresults (Uber den Einfluss raumlicher und zeitlicher Auflosung auf die Aussagekraft vonGNSS Leistungsparametern)
LORENZ CH: Applying stochastic constraints on time-variable GRACE data (Anwendungstochastischer Bedingungen auf zeitvariable GRACE-Daten)
RAU D: Einfluss lateraler Variationen in Lithosphare und oberem Mantel auf den glazial-isostatischen Ausgleich in der Antarktis (Influence of the varying thickness of the litho-sphere and upper mantle on the regional glacial-isostatic adjustment (GIA) in Antarctica)
XUE Y: GOCE sensitivity studies in terms of cross-over analysis (GOCE Sensitivitatsstudien mit-tels Kreuzungspunktanalyse)
Study Theses
(http://www.uni-stuttgart.de/gi/education/dipl/study reports.en.html)
DUNKEL A: Java Applet zur Visualisierung der Erdorientierung (Visualization of the Earth Orien-tation with Java)
PETRESCU EP: Einfluss des direkten Strahlungsdrucks der Sonne auf CHAMP (Influence of thedirect solar radiation pressure on CHAMP)
RADU D: Continental water storage derived from GRACE: A review of four years of literature
ROTH M: Marine Full Tensor Gravity Gradiometry Data Analysis and Euler Deconvolution (Voll-tensorgravitationsgradiometrie auf dem Meer: Datenanalyse und Euler-Dekonvolution)
YANG Z: Kollokation und deren Anwendung in der Koordinatentransformation (On the use ofcolloction in coordinate transformations)

Institute of Geodesy 49
Publications
(http://www.uni-stuttgart.de/gi/research/index.en.html)
Refereed Journal Publications
ANTONI M, A BORKOWSKI, W KELLER AND M OWCZAREK: Verification of localized GRACEsolutions by the Polish quasiqeoid. Geodesy and Cartography 58 (2009) 21-36
ANTONI M, W KELLER AND M WEIGELT: Representation of Regional Gravity Fields by RadialBase Functions. In: MG Sideris (Ed.): Observation our Changing Earth. Proceedings ofthe 2007 IAG General Assembly, Perugia, Italy, July 2-13, 2007. IAG Symposia 133 (2009)pp 293-299
AUSTEN G AND W KELLER: Singularity free formulations of the geodetic boundary value prob-lem. Journal of Geodesy 83 (2009) 645-657
AWANGE JL, MA SHARIFI, O BAUR, W KELLER, WE FEATHERSTONE AND M KUHN: GRACEhydrological monitoring of Australia: current limitations and future prospects. Journal ofSpatial Science 54 (2009) 23-36
BAUR O: Tailored least-squares solvers implementation for high-performancegravity field research. Computers and Geosciences 35 (2009) 548-556,doi:10.1016/j.cageo.2008.09.004
BAUR O AND W KELLER: Computational considerations for satellite-based geopotential recov-ery. In: Nagel WE, DB Kroner and MM Resch (Eds.): High Performance Computing in Sci-ence and Engineering ’09, Springer Berlin Heidelberg (2010) 511-521, doi:10.1007/978-3-642-04665-0 35
BAUR O, M KUHN AND WE FEATHERSTONE: GRACE-derived ice-mass variations over Green-land by accounting for leakage effects. Journal of Geophysical Research 114 (2009) 1-13,B06407, doi:10.1029/2008JB006239
CAI J AND E GRAFAREND: Systematical analysis of the transformation between Gauss-Krueger-Coordinate/DHDN and UTM-Coordinate/ETRS89 in Baden-Wurttemberg with different es-timation methods. In: Drewes H (Ed.): Geodetic Reference Frames. Proceedings of the IAGSymposium Munich, Germany, October 9-14, 2006. IAG Symposia 134 (2009) 205-221
CAI J, E GRAFAREND AND C HU: The total optimal criterion in solving the mixed integer lin-ear model with GNSS carrier phase observations. GPS Solutions 13 (2009) 221-230,DOI:10.1007/s10291-008-0115-y
KUHN M, WE FEATHERSTONE, O MAKARYNSKYY AND W KELLER: Deglaciation-InducedSpatially Variable Sea-level Change: A Simple-Model Case Study for the Greenland andAntarctic Ice Sheets. International Journal of Ocean and Climate Systems, accepted
50 GIS
MOGHTASED-AZAR K AND E GRAFAREND: Surface deformation analysis of dense GPSnetworks based on intrinsic geometry: deterministic and stochastic aspects. Journal ofGeodesy 83 (2009) 431-454, DOI:10.1007/s00190-008-0252-7
WEIGELT M, MG SIDERIS AND N SNEEUW: On the influence of the ground track on the gravityfield recovery from high-low satellite-to-satellite tracking missions: CHAMP monthly gravityfield recovery using the energy balance approach revisited. Journal of Geodesy 83 (2009)1131-1143
XU C, K DING, J CAI AND E GRAFAREND: Methods of determining weight scaling fac-tors for geodetic-geophysical joint inversion. Journal of Geodynamics 47 (2009) 39-46,DOI:10.1016/j.jog.2008.06.005
ZEILE O, M LACHENMANN, E BAUMSTARK, A MOHR, D BOCK, R LAUFER, N SNEEUW ANDH-P ROSER: Analysis of orbital lifetime and observation conditions of small lunar satellites.Acta Astronautica 66 (2010) 516-527, DOI:10.1016/j.actaastro.2009.07.008
Other Refereed Contributions
GRAFAREND E: Geodetic reference frames: The kinematical Euler equations: a review of theirsingularities or the benefit of the Lusternik - Schnirelmann Category CAT(SO(3))=4. In: AVolume dedicated to Milan Bursa on the occasion of his 80th birthday, pp 85-99, Prague,Czech Republic, 2009
Non-refereed Contributions
DEUTSCHE PRESSEAGENTUR (DPA): Die Erde ist eine Kartoffel, 25.5.2009
MEDIENDIENST FORSCHUNG DER UNIVERSITAT STUTTGART: Eisschmelze mit Turbo-Effekt, 8.11.2009
PRESSEMITTEILUNG DER UNIVERSITAT STUTTGART: Vom Vermessen der Erde, 23.3.2009
RIGUZZI F, F KRUMM, K WANG, M MISZELY AND P VARGA: Influence of LOD variations onseismic energy release. Geophysical Research Abstracts 11 (2009) 2323
Poster Presentations
ANJASMARA IM, M KUHN AND O BAUR: Localized principal component analysis applied onGRACE time-variable gravity. IAG 2009, Buenos Aires, Argentina (31.8.-4.9.)
ANTONI M, W KELLER AND M WEIGELT: Recovery of residual GRACE-observations by radialbase functions. VII Hotine Marussi Symposium on Theoretical Geodesy, Rome, Italy (6.-10.7.)
BAUR O: Computational considerations for satellite-based geopotential recovery. The 12th Re-sults and Review Workshop of the HLRS, Stuttgart (8.-9.10.)

Institute of Geodesy 51
BAUR O, M KUHN AND WE FEATHERSTONE: Linear and non-linear secular mass variationsfrom GRACE. VII Hotine-Marussi Symposium on Theoretical Geodesy, Rome, Italy (6.-10.7.)
BAUR O, M KUHN AND WE FEATHERSTONE: Accounting for leakage effects in GRACE-derivedmass changes. IAG General Assembly 2009, Buenos Aires, Argentina (31.8.-4.9.)
DEVARAJU B AND N SNEEUW: Performance analysis of isotropic spherical harmonic spectralwindows. VII Hotine-Marussi Symposium on Theoretical Geodesy, Rome, Italy (6.-10.7.)
GRAFAREND E AND O BAUR: Orbital rotations of a satellite: Case study GOCE. VII Hotine-Marussi Symposium on Theoretical Geodesy, Rome, Italy (6.-10.7.)
IRAN POUR S AND N SNEEUW: Properties and applications of EOF-based filtering of GRACEsolutions. VII Hotine-Marussi Symposium on Theoretical Geodesy, Rome, Italy (6.-10.7.)
IRAN POUR S, K BENTEL AND N SNEEUW: EOF-based filtering of GRACE gravity field solu-tions: A comparison between spectral and spatial approaches. EGU General Assembly,Vienna, Austria (19.-24.4.)
KELLER W, M KUHN AND WE FEATHERSTONE: A set of analytical formulae to modeldeglaciation-induced polar wander. IAG General Assembly 2009, Buenos Aires, Argentina(31.8.-4.9.)
TOURIAN MJ, N SNEEUW AND A BARDOSSY: Controls on satellite altimetry over non-oceansurfaces for hydrological purposes. Geophysical Research Abstracts 11 (2009) 2713
Conference Presentations
ANTONI M, W KELLER AND M WEIGELT: Analyse von GRACE-Beobachtungen durch optimierteradiale Basisfunktionen. Geodatische Woche Karlsruhe (22.-24.9.)
BAUR O AND N SNEEUW: Punktmassenschatzung aus zeitvariablen GRACE Schwerefeldern.Geodatische Woche Karlsruhe (22.-24.9.)
BAUR O, N SNEEUW AND J CAI: GOCE Realdatenauswertung unter Anwendung derInvariantendar-stellung, Projekttreffen REAL-GOCE. Geodatische Woche Karlsruhe (22.-24.9.)
CAI J: Bootstrap analysis methods for linear model and its applications in GNSS data processing.Geodatische Woche Karlsruhe (22.-24.9.)
CAI J, E GRAFAREND AND C HU: Bootstrap method and its application to the hypothesis testingin GPS mixed integer linear model. EGU General Assembly, Vienna, Austria (19.-24.4.)
CAI J, E GRAFAREND AND C HU: Reconciling different criteria for solving the mixed integerlinear model with GNSS carrier phase observations. VII Hotine-Marussi Symposium onTheoretical Geodesy, Rome, Italy (6.-10.7.)

52 GIS
DEVARAJU B, MJ TOURIAN, N SNEEUW AND J RIEGGER: Inter-catchment correlation esti-mates from filtered GRACE monthly solutions. Geodatische Woche Karlsruhe (22.-24.9.)
FERSCH B, H KUNSTMANN, B DEVARAJU AND N SNEEUW: Large scale water balance esti-mations through regional atmospheric moisture flux modeling and comparison to GRACEsignals. 8th IAHS Scientific Assembly & 37th IAH Congress, Hyderabad, India (6.-12.9.)
FERSCH B, H KUNSTMANN, N SNEEUW AND B DEVARAJU: Continental scale atmosphericand terrestrial water budget modeling and comparison to GRACE. EGU General Assembly,Vienna, Austria (19.-24.4.)
GRAFAREND E: Intrinsic deformation analysis, synthesis of Earth deformation measures: surfaceEuler-Lagrange deformation tensors of first and second kind. IAG/ICCT Study Group 7
”Temporal variations of deformation and gravity“, Lanzarote, Spain (23.-26.2.)
GRAFAREND E: The Marussi Legacy: the anholonomity problem, geodetic examples. VII Hotine-Marussi Symposium on Theoretical Geodesy, Rome, Italy (6.-10.7.)
GRAFAREND E AND Z MARTINEC: Space gradiometry, characteristic boundary value problemsand regularized downward continuation. VII Hotine-Marussi Symposium on TheoreticalGeodesy, Rome, Italy (6.-10.7.)
GRAFAREND E, J ENGELS AND P VARGA: The gravitational field of a deformable body like theEarth or other celestial bodies. EGU General Assembly, Vienna, Austria (19.-24.4.)
IRAN POUR S, N SNEEUW AND B DEVARAJU: The EOF-based filtering of GRACE solutions -Properties and applications. Geodatische Woche Karlsruhe (22.-24.9.)
KELLER W, M ANTONI AND M WEIGELT: A Closed Solution of the Variational Equations forShort-Arc SST. IAG General Assembly 2009, Buenos Aires, Argentina (31.8.-4.9.)
LIN Y, S ZHANG, J CAI AND N SNEEUW: Application of Wavelet Support Vector Regression onSAR data Denoising. Geodatische Woche Karlsruhe (22.-24.9.)
LORENZ C, B DEVARAJU AND N SNEEUW: On the computation of a reliable signal covariancefor the stochastic filtering of time-variable gravity field from GRACE. EGU General Assem-bly, Vienna, Austria (19.-24.4.)
REUBELT T, N SNEEUW AND E GRAFAREND: Comparison of kinematic orbit analysis methodsfor gravity field recovery. VII Hotine-Marussi Symposium on Theoretical Geodesy, Rome,Italy (6.-10.7.)
REUBELT T, N SNEEUW, P VISSER, T VAN DAM AND M LOSCH: Future satellite missions fortime-variable geopotential recovery. EGU General Assembly, Vienna, Austria (19.-24.4.)
RIGUZZI F, F KRUMM, K WANG , M MISZELY AND P VARGA: Influence of LOD variations onseismic energy release. EGU General Assembly, Vienna, Austria (19.-24.4.)
SNEEUW N: Inclination functions: orthogonality and other properties. VII Hotine-Marussi Sympo-sium on Theoretical Geodesy, Rome, Italy (6.-10.7.)

Institute of Geodesy 53
SNEEUW N, EJO SCHRAMA, PNAM VISSER AND M WEIGELT: Spatial resolution from repeatorbit configurations: the Colombo-Nyquist rule revisited. EGU General Assembly, Vienna,Austria (19.-24.4.)
WEIGELT M, W KELLER AND M ANTONI: Comparing the local gravity field recovery based onradial base functions with the boundary element method. VII Hotine-Marussi Symposiumon Theoretical Geodesy, Rome, Italy (6.-10.7.)
WEIGELT M, W KELLER AND M ANTONI: Lokale Schwerefeldbestimmung mit Hilfe der Randele-mentemethode und radialen Basisfunktionen. Geodatische Woche Karlsruhe (22.-24.9.)
Guest Lectures and Lectures on special occasions
BRUNNER FK, Prof. Dr. (Institut fur Ingenieurgeodasie und Messsysteme, University Graz, Aus-tria): Raum-Zeit Analyse von GPS Messungen mittels Turbulenztheorie (4.12.)
DETREKOI A, Prof. Dr. (Geodetic and Geophysical Research Institute, Budapest University ofTechno-logy and Economics, Hungary): Some megatrends in Informatics - Influence onGeodesy (25.6.)
ELHABIBY M, Dr. (Department of Geomatics Engineering, University of Calgary, Canada):Wavelets for Geomatics Applications: De-Noising, Compression and Analysis Tool (21.9.)
FRITSCH D, Prof. Dr. (Institut fur Photogrammetrie, Universitat Stuttgart): Zur optimalen Punk-teinschaltung im Raum - vorwarts, ruckwarts, uberbestimmt (4.12.)
GROSS R S, Dr. (Jet Propulsion Laboratory, California Institute of Technology, Pasadena, USA):Consistency of Earth Rotation, Gravity, and Shape Measurements (27.4.)
KLEUSBERG A, Prof. Dr. (Institut fur Navigation, Universitat Stuttgart): Von Kreiseln und Satel-liten: Erik Grafarend’s Beitrage zur Navigation (4.12.)
POUTANEN M, Prof. Dr. (Finnish Geodetic Institute, Masala, Finland): DynaQlim - a multi-disciplinary program to better understand the dynamic Earth (26.3.)
SANSO F, Prof. (DIIAR, Sezione Rilevamento, Polytecnico di Milano, Italy): Ideas to combinesatellite and terrestrial global models (12.11.)
VIRTANEN J, Dr. (Finnish Geodetic Institute, Masala, Finland): Improving GRACE mass estimatesfor the Baltic Sea and validation using in situ measurements (26.3.)
Lectures at other universities
CAI JNew investigations of GNSS data analysis methods, Wuhan University (11.6.)New developments of GNSS data analysis methods, Tongji University (19.6.)

54 GIS
SNEEUW NSpaceborne Gravimetry as a Geodetic Remote Sensing Tool for Earth Sciences. Max-Planck-Institut fur Gravitationsphysik, Hannover (9.4.)The future of satellite gravimetry. Geodetic and Geophysical Research Institute, Sopron,Hungary (29.9.)
Research Stays
ANTONI MLandwirtschaftliche Universitat Wroclaw, Poland (15.-21.6.).
CAI JSchool of Geodesy and Geomatics, Wuhan University, China (5.-19.6.)
GRAFAREND EGeodetic and Geophysical Research Institute, Seismological Observatory, Budapest, Hun-gary (5.-13.9.)
KELLER WLandwirtschaftliche Universitat Wroclaw, Poland (15.-21.6.)
SNEEUW NGeodetic and Geophysical Research Institute, Sopron, Hungary (28.-29.9.)
Lecture Notes
(http://www.uni-stuttgart.de/gi/education/dipl/lecturenotes.en.htmlhttp://www.uni-stuttgart.de/gi/education/BSC/lecturenotes.en.html)
GRAFAREND E AND F KRUMMKartenprojektionen (Map Projections), 300 pages
HAUG GGrundstucksbewertung I (Real Estate/Property Valuation I), 28 pagesGrundstucksbewertung II (Real Estate/Property Valuation II), 11 pages
KELLER WDynamic Satellite Geodesy, 90 pagesFoundations of Satellite Geodesy, 51 pagesObservation Techniques in Satellite Geodesy, 50 pages
KRUMM F AND SNEEUW NAdjustment Theory, 102 pages
SCHONHERR HAmtliches Vermessungswesen und Liegenschaftskataster (Official Surveying and Real Es-tate Regulation), 58 pages

Institute of Geodesy 55
SNEEUW NAnalytic Orbit Computation of Artificial Satellites, 90 pagesGeodesy and Geodynamics, 68 pagesPhysical Geodesy (Measurement Techniques of Physical Geodesy, Modeling and DataAnalysis in the Field of Physical Geodesy), 137 pages
WOLF DContinuum Mechanics in Geophysics and Geodesy: Fundamental Principles, 100 pages
Participation in Conferences, Meetings and Workshops
ANTONI MGeodatische Woche, Karlsruhe, Germany (22.-24.9.)PPP-Projekt GPS-Levelling in Poland, Wroclaw (Breslau), Poland (16.-19.6.)VII Hotine-Marussi Symposium, Rome, Italy (6.-10.7.)
BAUR OGeodatische Woche, Karlsruhe, Germany (22.-24.9.)Project meeting REAL-GOCE, Karlsruhe, Germany (22.9.)The 12th Results and Review Workshop of the HLRS, Stuttgart, Germany (8.-9.10.)VII Hotine-Marussi Symposium, Rome, Italy (6.-10.7.)
CAI JEuropean Geosciences Union (EGU), General Assembly 2008, Vienna, Austria (19.-24.4.)Geodatische Woche, Karlsruhe, Germany (22.-24.9.)Project meeting REAL-GOCE, Karlsruhe, Germany (22.9.)VII Hotine-Marussi Symposium, Rome, Italy (6.-10.7.)
DEVARAJU BDFG-SPP1257 Workshop
”Mass transport and mass distribution in system Earth“, Eitorf
(29.6.-1.7.)European Geosciences Union (EGU), General Assembly 2008, Vienna, Austria (19.-24.4.)Geodatische Woche, Karlsruhe, Germany (22.-24.9.)VII Hotine-Marussi Symposium, Rome, Italy (6.-10.7.)
GRAFAREND EDGK Jahressitzung, Munchen (25.-27.11.)European Geosciences Union (EGU), General Assembly 2008, Vienna, Austria (19.-24.4.)ICCT Study Group 7, Lanzarote, Spain (23.-26.2.)VII Hotine-Marussi Symposium, Rome, Italy (6.-10.7.)
IRAN POUR SKick-Off-Meeting of the project
”Zukunftskonzepte fur Schwerefeldsatellitenmissionen“
(BMBF/DFG Geotechnologien Programm, Projekt Nr. 03G0729A), Institute of Geodesy,University of Stuttgart, Germany (17.-18.9.)
56 GIS
Project Meeting 1 of the project”Zukunftskonzepte fur Schwerefeldsatellitenmissionen“
(BMBF/DFG Geotechnologien Programm, Projekt Nr. 03G0729A), SpaceTech Industries,Immenstaad-Kippenhausen, Germany (2.-3.12.)
KELLER WEuropean Geosciences Union (EGU), General Assembly 2008, Vienna, Austria (19.-24.4.)IAG General Assembly, Buenos Aires, Argentina (31.8.-4.9.)PPP-Projekt GPS-Levelling in Poland, Wroclaw (Breslau), Poland (16.-19.6.)
REUBELT TEuropean Geosciences Union (EGU), General Assembly 2008, Vienna, Austria (19.-24.4.)GGOS/IGCP565-IAG-GEO-Workshop
”Towards a Roadmap for Future Satellite Gravity
Missions“, TU Graz, Austria (30.9.-2.10.)Kick-Off-Meeting of the project
”Zukunftskonzepte fur Schwerefeldsatellitenmissionen“
(BMBF/DFG Geotechnologien Programm, Projekt Nr. 03G0729A), Institute of Geodesy,University of Stuttgart, Germany (17.-18.9.)Project Meeting 1 of the project
”Zukunftskonzepte fur Schwerefeldsatellitenmissionen“
(BMBF/DFG Geotechnologien Programm, Projekt Nr. 03G0729A), SpaceTech Industries,Immenstaad-Kippenhausen, Germany (2.-3.12.)Requirements Review Meeting of the project
”Assessment of a Next Generation Grav-
ity Mission for Monitoring the Variations of Earth’s Gravity Field“ (ESA ITT AO/1-5914/09/NL/CT), ThalesAleniaSpace-I, Torino, Italy (19.11.)VII Hotine-Marussi Symposium, Rome, Italy (6.-10.7.)
SNEEUW NFestkolloquium zur Emeritierung von Prof. K.-H. Ilk, Bonn (29.1.)European Geosciences Union (EGU), General Assembly 2008, Vienna, Austria (19.-24.4.)DFG-SPP1257 Workshop
”Mass transport and mass distribution in system Earth“, Eitorf
(29.6.-1.7.)VII Hotine-Marussi Symposium, Rome, Italy (6.-10.7.)Geodatische Woche, Karlsruhe, Germany (22.-24.9.)GGOS/IGCP565-IAG-GEO-Workshop
”Towards a Roadmap for Future Satellite Gravity
Missions“, TU Graz, Austria (30.9.-2.10.)
TOURIAN MEuropean Geosciences Union (EGU), General Assembly 2008, Vienna, Austria (19.-24.4.)Direct Water Balance meeting, Stuttgart (6.8.)Direct Water Balance meeting, Stuttgart (2.9.)Direct Water Balance meeting Munchen (16.11.)Direct Water Balance meeting Stuttgart (22.12.)
WEIGELT MGeodatische Woche, Karlsruhe, Germany (22.-24.9.)VII Hotine-Marussi Symposium, Rome, Italy (6.-10.7.)

Institute of Geodesy 57
University Service
BAUR OMember of the PR-Commission of the study course Geodesy & Geoinformatics
GRAFAREND EMember Faculty of Aerospace Engineering and GeodesyMember Faculty of Civil- and Environmental EngineeringMember Faculty of Mathematics and Physics
KELLER WMember Search Committee Ingenieurgeodasie und Geodatische Messtechnik, Stuttgart
KRUMM FMember Search Committee Ingenieurgeodasie und Geodatische Messtechnik, Stuttgart
SNEEUW NAssociate Dean (Academic) Geodasie & Geoinformatik and GEOENGINE, StuttgartMember China Commission, International Affairs (IA)Member Examining Board of the Faculty of Aerospace Engineering and Geodesy, StuttgartMember Search Committee Ingenieurgeodasie und Geodatische Messtechnik, StuttgartMember Senate Committee for Structural Development, StuttgartVice-Chair Examining Board of the Faculty of Aerospace Engineering and Geodesy,Stuttgart
Professional Service (National)
CAI JMember Deutscher Verein fur Vermessungswesen
GRAFAREND EEmeritus Member German Geodetic Commission (DGK)
SNEEUW NMember Scientific Board of the Deutsche Geodatische Kommission (DGK)Member Scientific Advisory Committee of DGFIChair DGK section
”Erdmessung“
Chair AK7 (Working Group 7),”Experimentelle, Angewandte und Theoretische Geodasie“,
within DVW (Gesellschaft fur Geodasie, GeoInformation und LandManagement)Full Member Deutsche Geodatische Kommission (DGK)Member DGK-working group
”Neue Satellitenmissionen“
Professional Service (International)
CAI JLuojia Professor at School of Geodesy and Geomatics, Wuhan University, China
58 GIS
Member of the Institute of Navigation (ION, USA)Member of European Geosciences Union (EGU)
GRAFAREND EMember Royal Astronomical Society, Great BritainCorresponding Member Osterreichische Geodatische Kommission (OGK)Member Flat Earth SocietyElected Member Leibniz-Sozietat, BerlinFellow International Association of Geodesy (IAG)
KELLER WSociety of Industrial and Applied Mathematics (SIAM)
SNEEUW NMember IAG Working Group
”GGOS Satellite Mission“
Prasident IAG InterCommission Committee on Theory (ICCT)Member Editorial board of Studia Geophysica et GeodaeticaMember Editorial board of Journal of GeodesyFellow International Association of Geodesy (IAG)
WEIGELT MMember Inter-Commission Working Group (IC-WG2):
”Evaluation of Global Earth Gravity
Models“ (IAG)
Courses - Lecture/Lab/Seminar
Adjustment I (Krumm, Baur) 4/2/0Advanced Mathematics (Keller, Weigelt, Devaraju) 3/2/0Analytic Orbit Computation of Artificial Satellites (Sneeuw, Baur) 2/1/0Coordinates and Reference Systems (Krumm, Reubelt) 1/1/0Dynamic Satellite Geodesy (Keller) 1/1/0Foundations of Satellite Geodesy (Keller) 1/1/0Geodesy and Geodynamics (Sneeuw, Reubelt) 2/1/0Geodetic Reference Systems (ICRS-ITRS) for Satellite Geodesy and Aerospace(Weigelt, Reubelt) 2/1/0Geodetic Seminar I, II (Krumm, Sneeuw) 0/0/4Geometric Data Processing (Keller) 1/1/0Gravity Field Modeling (Keller, Baur) 2/1/0Integrated Field Work Geodesy and Geoinformatics (Keller, Sneeuw) 10 daysIntroduction Geodesy and Geoinformatics (Sneeuw) 0.5/0.5/0Map Projections and Geodetic Coordinate Systems (Krumm) 2/1/0Map Projections (Krumm) 1/1/0Mathematical Geodesy (Krumm) 2/1/0

Institute of Geodesy 59
Measurement Techniques of Physical Geodesy (Sneeuw, Reubelt) 2/1/0Modeling and Data Analysis in the Field of Physical Geodesy (Baur, Reubelt) 2/1/0Observation Techniques and Evaluation Procedures of Satellite Geodesy (Keller, Weigelt) 1/1/0Official Surveying and Real Estate Regulation (Schonherr) 2/0/0Orbit Determination and Analysis of Artificial Satellites (Baur, Reubelt) 2/1/0Physical Geodesy (Sneeuw, Reubelt) 2/1/0Real-Estate/Property Valuation I, II (Haug) 2/1/0Satellite Geodesy Observation Techniques (Weigelt) 2/1/0Satellite Geodesy (Keller) 2/1/0Statistical Inference (Krumm, Baur) 2/1/0

60 GIS

Institute of Navigation 61
Institute of NavigationBreitscheidstrasse 2, D-70174 Stuttgart,Tel.: +49 711 685 83400, Fax: +49 711 685 82755e-mail: [email protected]: http://www.nav.uni-stuttgart.de
Head of Institute
Prof. Dr.-Ing. A. K l e u s b e r g
Deputy: Dr.-Ing. Aloysius W e h rSecretary: Helga M e h r b r o d tEmeritus: Prof. em. Dr.-Ing. Ph. H a r t l
StaffDipl.-Ing. Doris B e c k e r Navigation SystemsDipl.-Ing. Xu F a n g Navigation SystemsDipl.-Ing. Michael G a e b Navigation SystemsDipl.-Geogr. Thomas G a u g e r GIS Modelling and MappingDipl.-Ing. Rene P a s t e r n a k Remote SensingDipl.-Ing. Bernhardt S c h a f e r Navigation SystemsDipl.-Ing. Wolfgang S c h o l l e r Education/Navigation SystemsDipl.-Ing. Alexandra S e i f e r t Navigation SystemsM. Sc. Hendy S u h a n d r i Navigation SystemsDipl.-Ing. (FH) Martin T h o m a s Laser SystemsDr.-Ing. Aloysius W e h r Laser SystemsDipl.-Ing. Xue W e i Inertial NavigationDr. Ing. Franziska W i l d - P f e i f f e r Navigation Systems
EDP and Networking
Regine S c h l o t h a n

62 INS
Laboratory and Technical Shop (ZLW)
Dr.-Ing. Aloysius W e h r (Head of ZLW)Technician Peter S e l i g - E d e rElectrician Sebastian S c h n e i d e rMechanician Master Michael P f e i f f e r
External teaching staff
Hon. Prof. Dr.-Ing. Volker L i e b i g - Directorate ESAHon. Prof. Dr.-Ing. B r a u n - RST Raumfahrt Systemtechnik AG, St.Gallen
Research ProjectsImproving the GNSS Observation through coupling with the MEMS-accelerationmeasurements
This topic is a part of the UniTAS IV project described in the last annual report. The task ofthe institute of navigation is to build-up an tightly couple inertial navigation system. The aim of thesystem is to support the GNSS tracking loop with the MEMS (Micro Electro-Mechanical Systems)-acceleration in order to improve the GNSS observations.
The performance of the GNSS tracking loop was tested. These tests showed the sensitivity of theGNSS tracking loop in relation to dynamic stress and signal quality. A following postprocessinganalysis revealed the improving of the GNSS observation by coupling with the MEMS-accelerationmeasurement. The developed algorithm is not suitable for real-time measurement and is not usingthe satellite geometry. Therefore the developement of the algorithm will continue in the followingyear.
The MEMS sensors need to be calibrated before the application in order to minimize the bias. Forthat reason a methodology to calibrate a MEMS sensor was developed in the last year.
Project Motion Pattern
The aim of Project Motion Pattern (PMP) is to show the feasibility of detecting physical activitywith low-cost micro-electro-mechanical systems (MEMS) accelerometers. In medicine and sportsscience the physical activity (PA) is an important parameter, which is often retrieved by question-naires or telephone interviews and nowadays also with accelerometers. The PMP was created atthe Institute of Navigation (INS) to investigate the framework of a system for PA detection usingMEMS accelerometers.

Institute of Navigation 63
For the tests with three probands, a wireless sensors platform was chosen comprising the triaxialMEMS accelerometer Freescale MMA7456L. The main features of the sensor platforms, the smallsize (35mm diameter, 10mm thickness) and light weight (20 g) combined with the wireless radiocommunication, allow the usage of these sensor platforms attached to the body of the probandswithout restrain their natural behaviors and movements.
So the probands, without being connected by any cable, were able to move freely and performtest series, where they were asked to walk, run, climb stairs, sit, stand and lie down. The specificforce was measured by three accelerometers attached to the probands at the ankle, above theknee at the thigh and at the belt.
All data was recorded with a laptop that received the measurements by a ZigBee compliant proto-col. Based on the measurements, MATLAB functions were developed to recognize the performedmotion pattern in a post-processing analysis.
The motion pattern, with a detection rate between 74% and 98%, are given in a high time resolu-tion and provide the PA of the probands in a very good quality.
Fig. 1: Three accelerometers are attached at the proband to detect the physical activity and themotion pattern.
EplusIn 2009 the quality investigation of the DTM from Intermap Technnologies for E-Plus MobilfunkGmbH reached a final step and will be finished in spring 2010. The results within 2009 causedIntermap to recalculate the delivered DTM. Even though 1% of the area is affected the resultswere in evidence along the working units in a positive way.
Investigating the horizontal accuracy of the DTM a test run was done with the Applanix POS LV420near Stuttgart. In Fig. 2 you can see the waypoints of the test run underlayed with the unprojectedORI-Image delivered by Intermap Tec. The waypoints fit the centerline of the tracks very well.

64 INS
Fig. 2: Waypoints of a test run underlayed with an unprojected DOP (left) and an the unprojectedORI-Image (right)
The acquired DTM encompasses the whole countryside of Germany and a 30km buffer. For thebuffer the vertical accuracy for 3 test sides was analyzed. The result is that the DTM observes theproduct specification valid for bare areas with a slope <10° within these test sides.
Fig. 3: Hillshade of the whole DTM

Institute of Navigation 65
Assessment, Prognosis, and Review of Deposition Loads and Effects in Germany
The joint research project”Assessment, Prognosis, and Review of Deposition Loads and Effects
in Germany“ (BMU/UBA FE-No 3707 64 200), is carried out on behalf of the German FederalEnvironment Agency (UBA) and on the account of Bundesministerium fur Umwelt, Naturschutzund Reaktorsicherheit (BMU). Within the project national maps of air concentration levels anddeposition loads are generated using measurement network data, additional model estimatesand high resolution land use maps.
From modelled data sets high resolution maps of deposition loads and air concentration levels arecalculated using GIS technique. The dose, in terms of deposition loads of air pollutants causingacidification and eutrophication in different forest and non-forest ecosystems in Germany, arecompared to ecosystem sensitivity given as critical levels and modelled critical loads in order toprovide an impact assessment in the form of exceedance maps for ecosystems. The trend of airpollutant input over time into the respective receptors on the national, regional, and local scalecan be identified.
The joint project is elaborated in close co-operation between the Netherlands Organization forApplied Scientific Research (TNO, Dept. Air Quality and Climate), Utrecht, The Netherlands, theworking group on Tropospheric Research of the Institute for Meteoroliogy of Freie UniversitatBerlin (FU Berlin, IfM, AG TrUmF), the Corporation for Ecosystem Analysis and EnvironmentalData Analysis (OKO-DATA, Strausberg), and the Institute of Navigation, Universitat Stuttgart (INS).The results of the project are support for the German Federal Environment Agency (UBA, Dessau)in calculation and verification of national data which are implemented in European scale CriticalLoads and Levels maps. The project results are national contribution for the protocols within theframework of UN/ECE Convention on Long-range Transboundary air pollution (UN/ECE LRTAP).Moreover the data are supporting EU and national regulations on air pollution control and emissionabatement (EU NEC directive, BImSchG, TA-Luft).
Further information:on the project: MAPESI (Modelling of Air Pollutants and EcoSystem Impact) www.mapesi.deon the methods applied: http://www.icpmapping.org/htm/manual/manual.htmon previous projects: http://www.nav.uni-stuttgart.de/navigation/forschung/critical loads
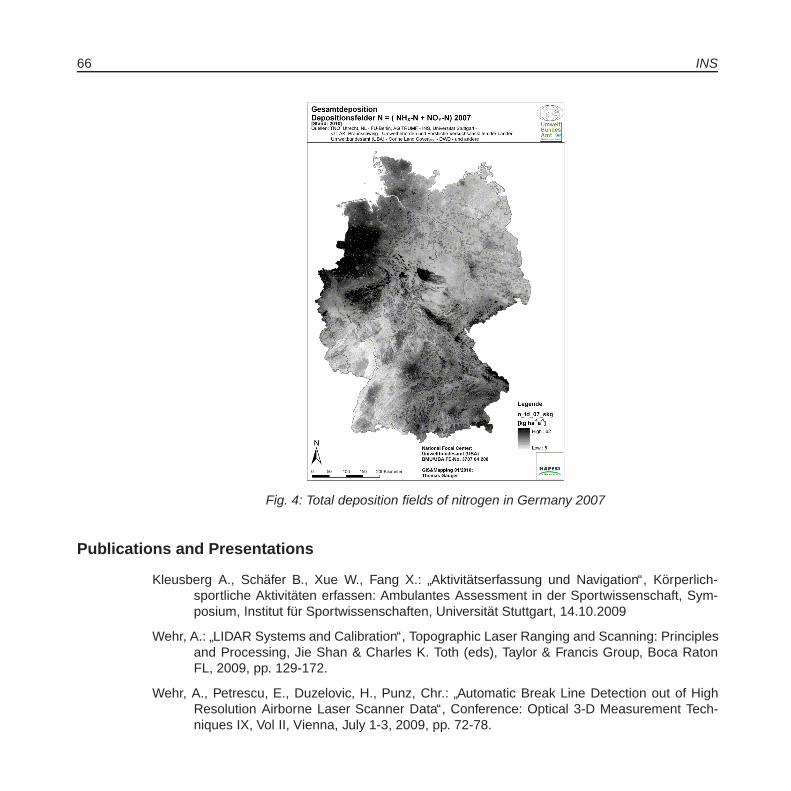
66 INS
Fig. 4: Total deposition fields of nitrogen in Germany 2007
Publications and Presentations
Kleusberg A., Schafer B., Xue W., Fang X.:”Aktivitatserfassung und Navigation“, Korperlich-
sportliche Aktivitaten erfassen: Ambulantes Assessment in der Sportwissenschaft, Sym-posium, Institut fur Sportwissenschaften, Universitat Stuttgart, 14.10.2009
Wehr, A.:”LIDAR Systems and Calibration“, Topographic Laser Ranging and Scanning: Principles
and Processing, Jie Shan & Charles K. Toth (eds), Taylor & Francis Group, Boca RatonFL, 2009, pp. 129-172.
Wehr, A., Petrescu, E., Duzelovic, H., Punz, Chr.:”Automatic Break Line Detection out of High
Resolution Airborne Laser Scanner Data“, Conference: Optical 3-D Measurement Tech-niques IX, Vol II, Vienna, July 1-3, 2009, pp. 72-78.

Institute of Navigation 67
A. Wehr, H. Duzelovic:”Bruchkantendetektion mit hochaufgelosten Laserscannerdaten“, Oster-
reichische Zeitschrift fur Vermessung & Geoinformation (vgi), 97. Jahrg., Heft 4/2009, pp.408-415.
Janak, J., Wild-Pfeiffer, F., Heck, B.:”Regional case study: Smoothing the gradiometric obser-
vations over eastern Asia and Europe using different topographic-isostatic models“, VIIHotine-Marussi Symposium, Rome, 07.07.2009.
Wild-Pfeiffer, F., Janak, J., Heck, B.:”Regional case study: Comparison of various topographic-
isostatic effects over eastern Asia and Europe in terms of smoothing gradiometric obser-vations“, Geodatische Woche 2009, 22.- 24.09.2009, Karlsruhe.
Study ThesisGao, Shangjin:
”Stand der Technik fur die automatische Generierung von Bruchkanten aus
hochauflosenden Laserscanner-Daten“; Studienarbeit, Institut fur Navigation; UniversitatStuttgart; September 2009; (Wehr).
Wang, Kan:”Modellierung der Dopplerfrequenz aus GPS- und MEMS-Messungen“; Studienar-
beit, Institut fur Navigation; Universitat Stuttgart; April 2009; (Wehr).
Locher, Marcus:”Galileo Aktueller Stand des Systems und der Signale“; Studienarbeit, Institut fur
Navigation; Universitat Stuttgart; Marz 2009; (Wehr).
Hu, Xiao:”Was ist MEMS?“; Studienarbeit, Institut fur Navigation; Universitat Stuttgart; April 2009;
(Wild-Pfeiffer).
Cobalas, Carmen:”Entwicklung eines internetbasierten Lernmoduls
”Navigation“ als erganzen-
des Lern- und Lehrmittel“; Studienarbeit, Institut fur Navigation; Universitat Stuttgart; Marz2009; (Wild-Pfeiffer).
Ming Deng:”Stabilitatsuntersuchungen an MEMS-Beschleunigungssensoren“; Studienarbeit, In-
stitut fur Navigation; Universitat Stuttgart; 2009; (Wehr).
Rosca, Alexandra:”Darstellung von importierten GPS-Tracks und von Echtzeitpositionen in
Google Earth“; Studienarbeit, Institut fur Navigation; Universitat Stuttgart; Dezember 2009;(Scholler).
Diploma ThesisShufang, Wang: Untersuchung zum Informationsgehalt von
”Full Waveform Laserdaten“; 2009
(Wehr).
Emilia Petrescu, Emilia:”Automatische Bruchkantendetektion aus hochauflosenden
Laserscanner-Messungen“; 2009 (Wehr).
Zimmermann, Naomi:”Positionsbestimmung fur Bodenradarsysteme“; 2009 (Braun, Wehr).
Locher, Marcus:”Umsetzung eines Kantendetektionsalgorithmus fur zusammengesetzte Raster-
datensatze in ArcObjects“; 2009 (Pasternak).

68 INS
Participation in Conferences, Meetings and Workshops
Wild-Pfeiffer, F.Gyro Symposium, Karlsruhe, 22.-23.09.2009Geodetic Week, Bremen, 22.09.-24.09.2009Meeting
”Frauen im DVW“, Intergeo Karlsruhe, 23.09.2009
Schafer B.DGON Navigationskonvent, Berlin, 09-10.07.2009Geodetic Week, Karlsruhe, 22-24.09.2009Korperlich-sportliche Aktivitaten erfassen: Ambulantes Assessment in der Sportwissen-schaft, Symposium, Stuttgart, 14.10.2009
Activities in National and International Organizations
Alfred KleusbergFellow of the International Association of the GeodesyMember of the Institute of Navigation (U.S.)Member of the Royal Institute of NavigationMember of the German Institute of Navigation
Honors/Awards
Wild-Pfeiffer, F.IAG Young Authors Award 2008
Education (Lecture / Practice / Training / Seminar)
Navigation and Remote Sensing (Kleusberg, Schafer) 2/1/0/0Electronics and Electrical Engineering (Wehr) 2/1/0/0Satellite Measurement Engineering (Kleusberg) 2/1/0/0Aircraft Navigation (Scholler, Wehr) 2/0/0/0Parameter Estimation in Dynamic Systems (Kleusberg) 2/1/0/0Navigation I (Kleusberg) 2/2/0/0Inertial Navigation (Kleusberg) 2/2/0/0Remote Sensing I (Wild-Pfeiffer) 2/2/0/0Remote Sensing II (Smiatek) 1/1/0/0Satellite Programs in Remote Sensing, Communication and Navigation I (Liebig) 2/0/0/0Satellite Programs in Remote Sensing, Communication and Navigation II (Liebig) 2/0/0/0Radar Measurement Methods I (Braun) 2/0/0/0Radar Measurement Methods II (Braun) 2/1/0/0Navigation II (Kleusberg) 2/2/0/0

Institute of Navigation 69
Integrated Positioning and Navigation (Kleusberg) 2/1/0/0Interplanetary Trajectories (Becker) 1/1/0/0Practical Course in Navigation (Scholler) 0/0/2/0Geodetic Seminar I, II (Fritsch, Sneeuw, Keller, Kleusberg, Mohlenbrink) 0/0/0/4
Introduction to Geodesy and Informatics (BSc) (Kleusberg, Schafer) WiSe 09/10, 2/2/0/0
Integrated Fieldwork (Schafer) (SoSe 2009)

70 INS

Institute for Photogrammetry 71
Institute for PhotogrammetryGeschwister-Scholl-Str. 24D, D-70174 StuttgartTel.: +49 711 685 83386, Fax: +49 711 685 83297e-mail: [email protected]: http://www.ifp.uni-stuttgart.de
Head of InstituteDirector: Prof. Dr.-Ing. Dieter FritschDeputy: apl. Prof. Dr.-Ing. Norbert HaalaSecretary: Martina KromaEmeritus: Prof. i.R. Dr. mult. Fritz Ackermann
Research Groups at the ifp:
Geoinformatics
Head: Dr.-Ing. Volker Walter GIS and Remote SensingDipl.-Ing. Hainan Chen Data IntegrationDipl.-Ing. Yevgenia Filippovska Data QualityDr.-Ing. Martin Kada 3D-VisualisationDipl.-Ing. Michael Peter Generalisation
Photogrammetry and Remote Sensing
Head: Dr.-Ing. Michael Cramer Digital Airborne SensorsDipl.-Ing. Susanne Becker Point Cloud InterpretationDipl.-Ing.(FH) Markus Englich Sensor LaboratoryM.Sc.Eng. Mohammed Othman Image OrientationDipl.-Ing.(FH) Werner Schneider Digital Photogrammetry LaboratoryM.Sc.Eng. Rongfu Tang Bundle Block Adjustment Extension
Terrestrial Positioning Systems and Computer Vision
Head: Dr.-Ing. Jan Bohm Spatial Segmentation and Object RecognitionM.Sc.Eng. Angela Budroni Indoor Model ReconstructionDipl.-Ing. Alessandro Cefalu Photogrammetric Calibration and Object RecognitionDipl.-Ing. Alexander Fietz Indoor MappingDipl.-Ing. Carina Raizner Objective Stray Light Measurement

72 ifp
External Teaching Staff
Dipl.-Ing. Stefan Dvorak, Amt fur Stadtentwicklung und Vermessung, ReutlingenDipl.-Ing. Sabine Urbanke, Landesvermessungsamt Baden-Wurttemberg
Research ProjectsGeoinformatics
Automatic Interpretation of Map Objects with Kohonen Feature Maps
Different map objects have typical geometrical appearances depending on their object type.For example, houses have typically rectangular structures, rivers are normally represented withsmooth lines and streets are often represented with straight lines. Some objects have a very typi-cal unique appearance, like football stadiums or churches. In order to interpret the object type, theobjects can be classified with a neural network. Kohonen Feature Maps (or self-organizing maps)are a special type of neuronal networks. A Kohonen Feature Map consists of an input layer andan output layer. Objects, that should be classified, are represented with a feature vector whichdescribes the object characteristics. This feature vector is the input for the Kohonen Feature Map.The output is a classification of the objects into different object classes.
In the following, the practical use of Kohonen Feature Maps for the classification of map objects isshown by an example. The objects are represented in the scale of 1:10,000 and the different objectclasses that should be classified are: Buildings, highways, major roads, side roads, roundabouts,stadiums and rail tracks. First, the object characteristics of the different object classes have tobe defined with a vector consisting of 0 and 1 values. Altogether ten object characteristics areused which result in an input vector with the dimension ten. In the next step, the numbers ofneurons of the Kohonen Feature Map have to be defined. The number of neurons of the input layercorresponds to the number of different object characteristics. The optimum number of neurons ofthe output layer was estimated by testing. Based on an evaluation of different configurations, weuse 30*30 neurons in the output layer.
We tested this classification approach using two test areas (one rural and one urban area). Theclassification result of the urban area is shown in Figure 1. The recognition rate in the rural areais 94.6% and in the urban area 79.7%. The reason for the lower recognition rate in urban areasis that object characteristics in urban areas have a higher variability as in rural areas. However,these are only first results and it can be expected that the recognition rate can be further improved.
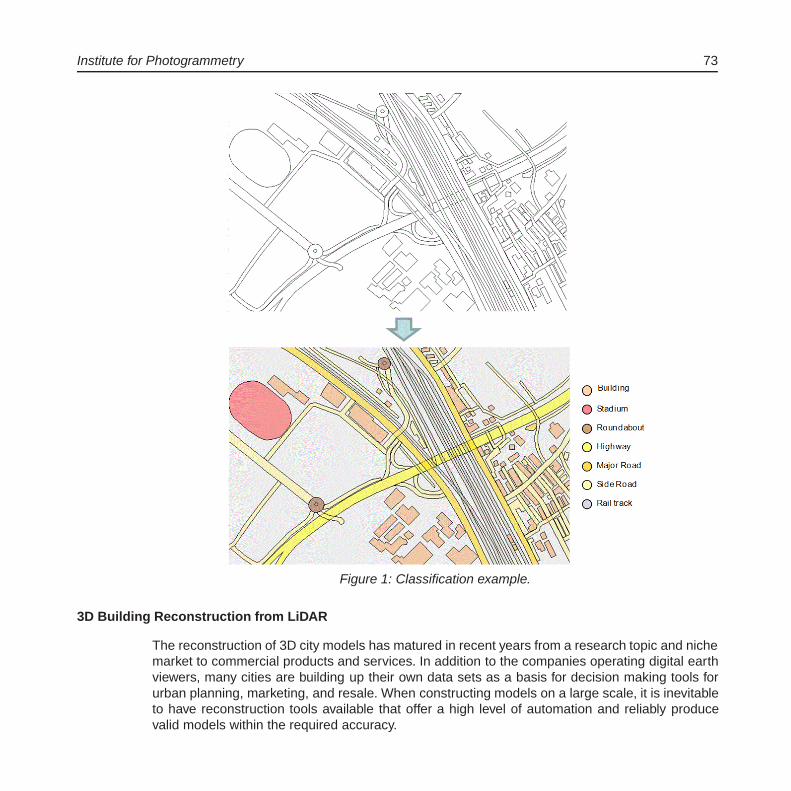
Institute for Photogrammetry 73
Figure 1: Classification example.
3D Building Reconstruction from LiDAR
The reconstruction of 3D city models has matured in recent years from a research topic and nichemarket to commercial products and services. In addition to the companies operating digital earthviewers, many cities are building up their own data sets as a basis for decision making tools forurban planning, marketing, and resale. When constructing models on a large scale, it is inevitableto have reconstruction tools available that offer a high level of automation and reliably producevalid models within the required accuracy.
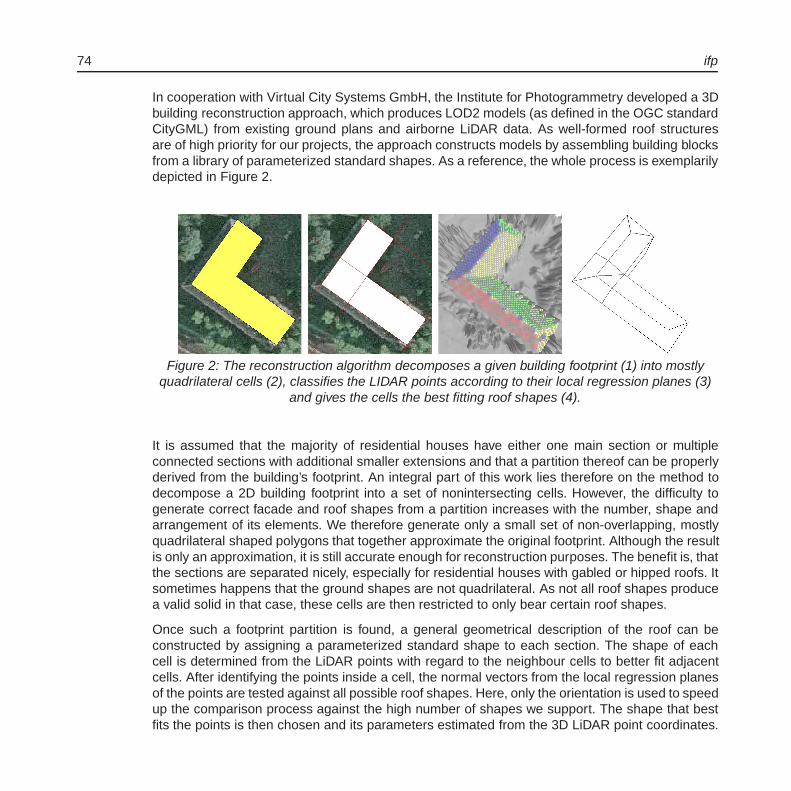
74 ifp
In cooperation with Virtual City Systems GmbH, the Institute for Photogrammetry developed a 3Dbuilding reconstruction approach, which produces LOD2 models (as defined in the OGC standardCityGML) from existing ground plans and airborne LiDAR data. As well-formed roof structuresare of high priority for our projects, the approach constructs models by assembling building blocksfrom a library of parameterized standard shapes. As a reference, the whole process is exemplarilydepicted in Figure 2.
Figure 2: The reconstruction algorithm decomposes a given building footprint (1) into mostlyquadrilateral cells (2), classifies the LIDAR points according to their local regression planes (3)
and gives the cells the best fitting roof shapes (4).
It is assumed that the majority of residential houses have either one main section or multipleconnected sections with additional smaller extensions and that a partition thereof can be properlyderived from the building’s footprint. An integral part of this work lies therefore on the method todecompose a 2D building footprint into a set of nonintersecting cells. However, the difficulty togenerate correct facade and roof shapes from a partition increases with the number, shape andarrangement of its elements. We therefore generate only a small set of non-overlapping, mostlyquadrilateral shaped polygons that together approximate the original footprint. Although the resultis only an approximation, it is still accurate enough for reconstruction purposes. The benefit is, thatthe sections are separated nicely, especially for residential houses with gabled or hipped roofs. Itsometimes happens that the ground shapes are not quadrilateral. As not all roof shapes producea valid solid in that case, these cells are then restricted to only bear certain roof shapes.
Once such a footprint partition is found, a general geometrical description of the roof can beconstructed by assigning a parameterized standard shape to each section. The shape of eachcell is determined from the LiDAR points with regard to the neighbour cells to better fit adjacentcells. After identifying the points inside a cell, the normal vectors from the local regression planesof the points are tested against all possible roof shapes. Here, only the orientation is used to speedup the comparison process against the high number of shapes we support. The shape that bestfits the points is then chosen and its parameters estimated from the 3D LiDAR point coordinates.
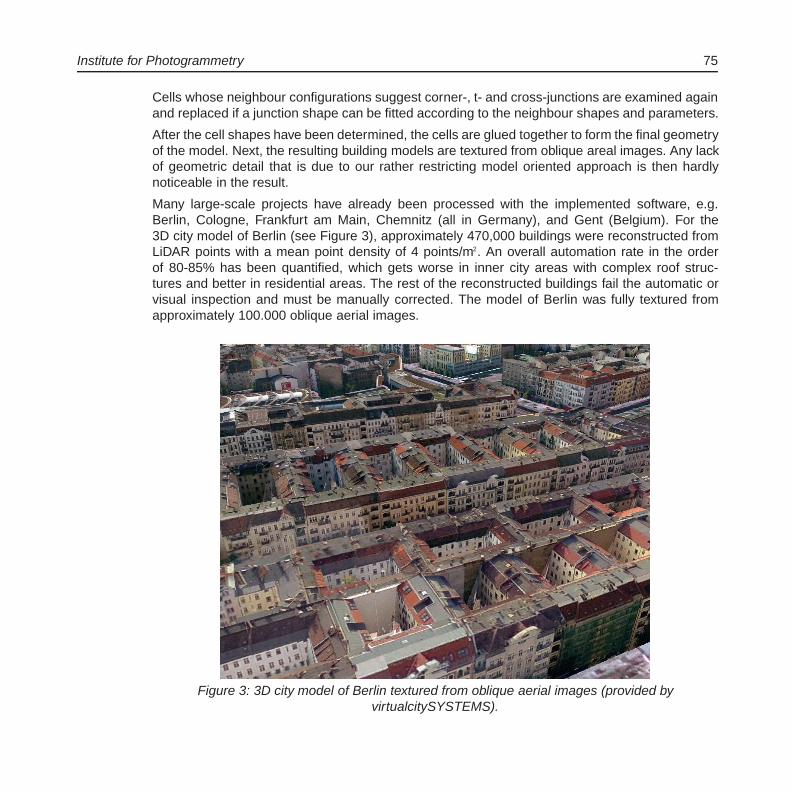
Institute for Photogrammetry 75
Cells whose neighbour configurations suggest corner-, t- and cross-junctions are examined againand replaced if a junction shape can be fitted according to the neighbour shapes and parameters.
After the cell shapes have been determined, the cells are glued together to form the final geometryof the model. Next, the resulting building models are textured from oblique areal images. Any lackof geometric detail that is due to our rather restricting model oriented approach is then hardlynoticeable in the result.
Many large-scale projects have already been processed with the implemented software, e.g.Berlin, Cologne, Frankfurt am Main, Chemnitz (all in Germany), and Gent (Belgium). For the3D city model of Berlin (see Figure 3), approximately 470,000 buildings were reconstructed fromLiDAR points with a mean point density of 4 points/m2. An overall automation rate in the orderof 80-85% has been quantified, which gets worse in inner city areas with complex roof struc-tures and better in residential areas. The rest of the reconstructed buildings fail the automatic orvisual inspection and must be manually corrected. The model of Berlin was fully textured fromapproximately 100.000 oblique aerial images.
Figure 3: 3D city model of Berlin textured from oblique aerial images (provided byvirtualcitySYSTEMS).
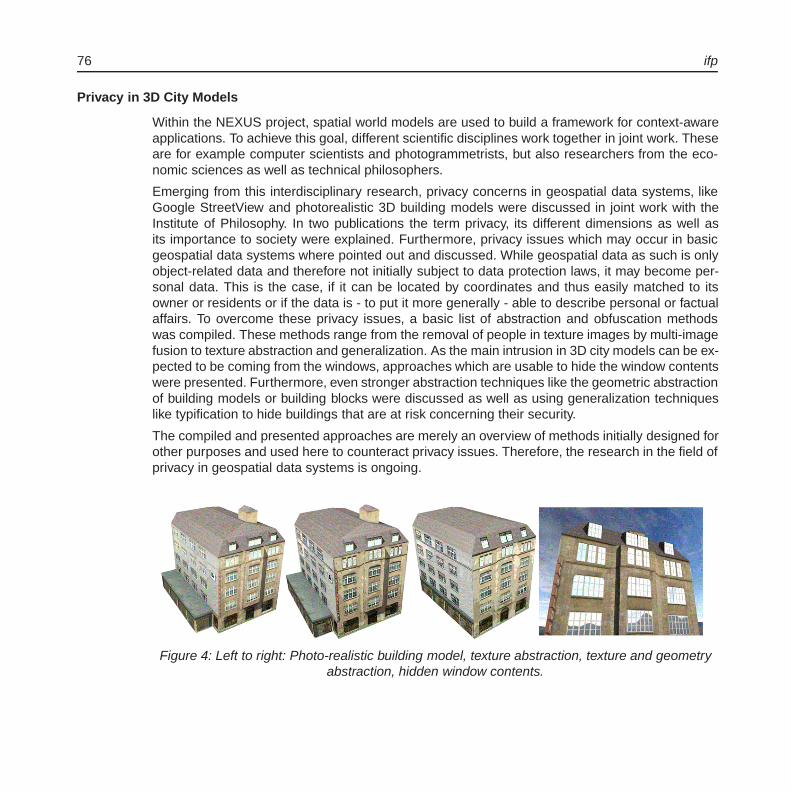
76 ifp
Privacy in 3D City Models
Within the NEXUS project, spatial world models are used to build a framework for context-awareapplications. To achieve this goal, different scientific disciplines work together in joint work. Theseare for example computer scientists and photogrammetrists, but also researchers from the eco-nomic sciences as well as technical philosophers.
Emerging from this interdisciplinary research, privacy concerns in geospatial data systems, likeGoogle StreetView and photorealistic 3D building models were discussed in joint work with theInstitute of Philosophy. In two publications the term privacy, its different dimensions as well asits importance to society were explained. Furthermore, privacy issues which may occur in basicgeospatial data systems where pointed out and discussed. While geospatial data as such is onlyobject-related data and therefore not initially subject to data protection laws, it may become per-sonal data. This is the case, if it can be located by coordinates and thus easily matched to itsowner or residents or if the data is - to put it more generally - able to describe personal or factualaffairs. To overcome these privacy issues, a basic list of abstraction and obfuscation methodswas compiled. These methods range from the removal of people in texture images by multi-imagefusion to texture abstraction and generalization. As the main intrusion in 3D city models can be ex-pected to be coming from the windows, approaches which are usable to hide the window contentswere presented. Furthermore, even stronger abstraction techniques like the geometric abstractionof building models or building blocks were discussed as well as using generalization techniqueslike typification to hide buildings that are at risk concerning their security.
The compiled and presented approaches are merely an overview of methods initially designed forother purposes and used here to counteract privacy issues. Therefore, the research in the field ofprivacy in geospatial data systems is ongoing.
Figure 4: Left to right: Photo-realistic building model, texture abstraction, texture and geometryabstraction, hidden window contents.

Institute for Photogrammetry 77
Quality inspection and quality improvement of road network data
Spatial data are collected by different institutions for different purposes which lead to multiplerepresentations of the same objects of the world. Multiple representations mean that redundantinformation is available which can be used for the evaluation and improvement of the quality ofthe spatial data.
In our study we use the following data sets: GDF (NavTeq), GDF (TeleAtlas) and OpenStreetMap.All three datasets are representing the road network and are available for very large areas. TheGDF data from TeleAtlas and NavTeq are represented in the same data model whereas the datamodel of OpenStreetMap is different. However, the modelling of the street network is similar in alldata sets.
At first, the edges of the datasets are matched. To consider the topological differences betweenthe two datasets, we extended the matching model
”Buffer Growing“ in order that not only match-
ings between edges but also between edges and nodes are possible. Then, the form of eachmatching pair is determined by a network algorithm and corresponding nodes are matched.
Data quality is calculated based on similarity measurement on different levels of granularity. Highsimilarity is an indicator for high relative quality. On the dataset level, a global geometric qualitymeasure based on the evaluation of adjacency matrices is proposed. Furthermore, completenessand topologic similarity are measured. On the matching pair level, geometric modeling, geometricsimilarity and attribute similarity are analyzed.
The last step is the quality improvement by conflation of the datasets. The conflation is subdividedinto two steps: conflation of unmatched objects and conflation of matched objects. Depending onthe form of the matching pairs, different methods are applied. Due to topological differences, notevery matching pair can be merged simply by calculating the middle line. Therefore, all matchingpairs with different topologies are allocated into a cluster and conflated by a transformation ofthis cluster. The attributes and semantic relationships of the matched objects can be transferredfrom one dataset into the other dataset. The unmatched objects of each dataset are allocated inadditional clusters and transferred into the final dataset using a geometrical transformation.
Figure 5 shows the conflation process on two examples. The TeleAtlas edges are represented ingreen color and the OpenStreetMap edges in blue color. The edges after data fusion are repre-sented in red color.
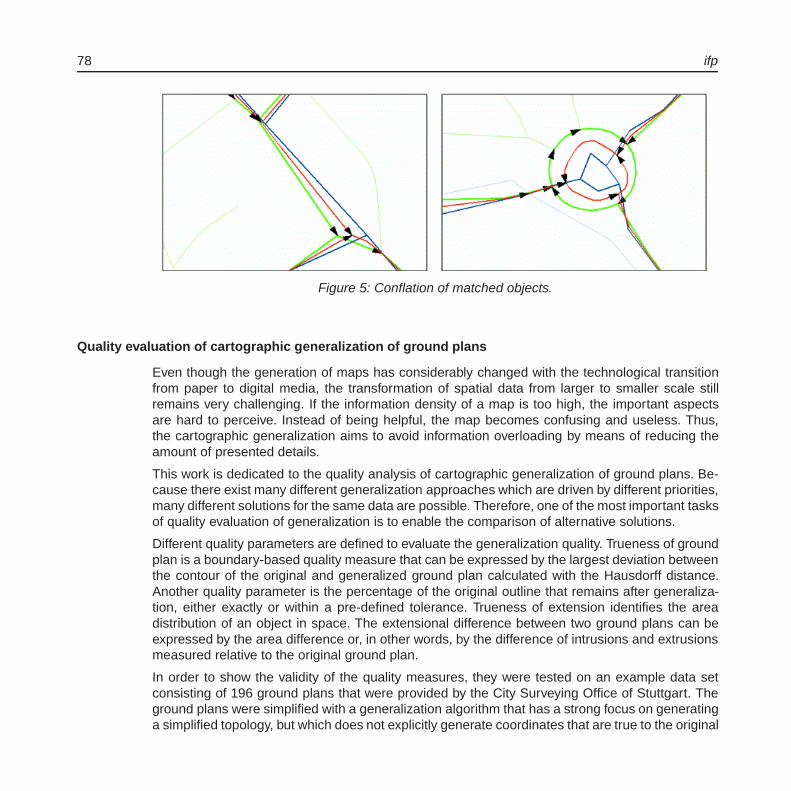
78 ifp
Figure 5: Conflation of matched objects.
Quality evaluation of cartographic generalization of ground plans
Even though the generation of maps has considerably changed with the technological transitionfrom paper to digital media, the transformation of spatial data from larger to smaller scale stillremains very challenging. If the information density of a map is too high, the important aspectsare hard to perceive. Instead of being helpful, the map becomes confusing and useless. Thus,the cartographic generalization aims to avoid information overloading by means of reducing theamount of presented details.
This work is dedicated to the quality analysis of cartographic generalization of ground plans. Be-cause there exist many different generalization approaches which are driven by different priorities,many different solutions for the same data are possible. Therefore, one of the most important tasksof quality evaluation of generalization is to enable the comparison of alternative solutions.
Different quality parameters are defined to evaluate the generalization quality. Trueness of groundplan is a boundary-based quality measure that can be expressed by the largest deviation betweenthe contour of the original and generalized ground plan calculated with the Hausdorff distance.Another quality parameter is the percentage of the original outline that remains after generaliza-tion, either exactly or within a pre-defined tolerance. Trueness of extension identifies the areadistribution of an object in space. The extensional difference between two ground plans can beexpressed by the area difference or, in other words, by the difference of intrusions and extrusionsmeasured relative to the original ground plan.
In order to show the validity of the quality measures, they were tested on an example data setconsisting of 196 ground plans that were provided by the City Surveying Office of Stuttgart. Theground plans were simplified with a generalization algorithm that has a strong focus on generatinga simplified topology, but which does not explicitly generate coordinates that are true to the original
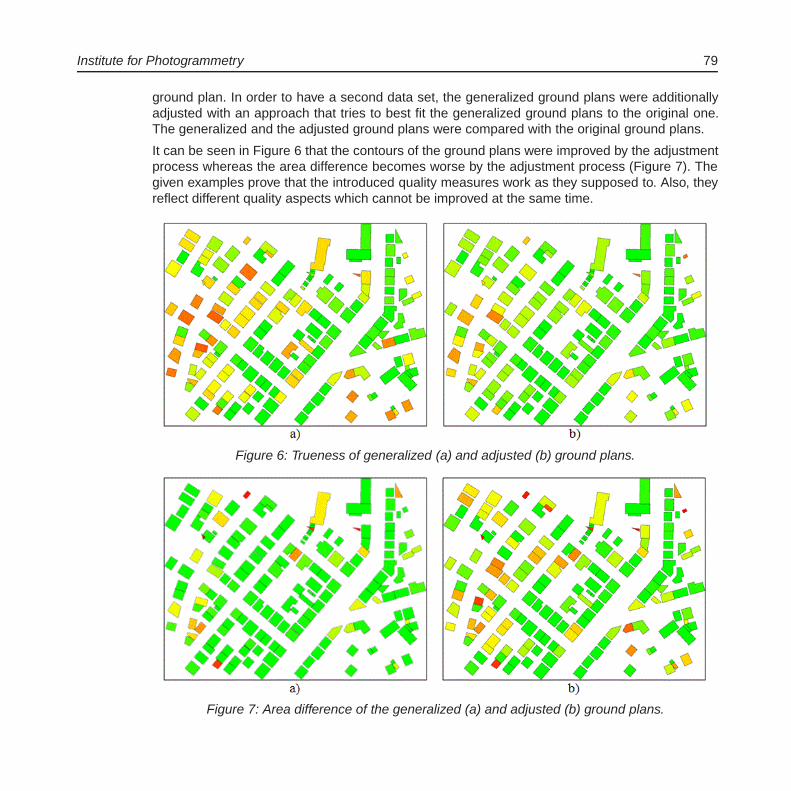
Institute for Photogrammetry 79
ground plan. In order to have a second data set, the generalized ground plans were additionallyadjusted with an approach that tries to best fit the generalized ground plans to the original one.The generalized and the adjusted ground plans were compared with the original ground plans.
It can be seen in Figure 6 that the contours of the ground plans were improved by the adjustmentprocess whereas the area difference becomes worse by the adjustment process (Figure 7). Thegiven examples prove that the introduced quality measures work as they supposed to. Also, theyreflect different quality aspects which cannot be improved at the same time.
Figure 6: Trueness of generalized (a) and adjusted (b) ground plans.
Figure 7: Area difference of the generalized (a) and adjusted (b) ground plans.

80 ifp
Photogrammetry and Remote SensingQuality dependent reconstruction of building facades
Modelling and visualization of 3D urban landscapes has been a topic of major interest in thelast years. A number of tools for the production of virtual city models were developed, which areusually based on 3D measurements from airborne stereo imagery or LiDAR. In addition to thisarea covering airborne data collection, which mainly provides the outline and roof shape of build-ings, terrestrial laser scanning is frequently used, especially if a more accurate and detailed 3Dmapping of man-made structures is required. Beside measurements from fixed viewpoints, thesescanners are often mounted on moving platforms. Such mobile mapping systems are usually alsoequipped with multiple video or digital cameras and allow for the rapid and cost effective capturingof 3D data for larger areas. However, considering 3D point clouds, differences in accuracy, cov-erage and density will occur due to variations in viewpoint and distance to the object of interest.Such differences in data quality will become even more evident when terrestrial data is collectedby non-experts using low-cost sensors. Thus, reconstruction techniques will be required whichare much more flexible towards different data quality and incomplete sensor data. In this respect,our grammar based approach for the quality sensitive reconstruction of 3D facade structures hasbeen further enhanced enabling the generation of realistic facade structures for large areas evenwhen only few senor data of sufficient quality is available.Figure 8 shows an example where a number of buildings in Stuttgart’s historic center have beensynthesized applying a grammar which has been automatically derived from facade structuresof a single facade. In addition to the good visual quality, which could be realized for all of ourreconstructed 3D models, several other applications using the resulting building structures willneed a decent quality assessment of the results. Therefore, strategies and metrics for the qualityevaluation of facade models have been proposed.
Figure 8: Synthesized facade structures for an exemplary block of buildings in Stuttgart.

Institute for Photogrammetry 81
Digital Airborne Imaging - State of the Art
Digital airborne imaging has become widely fully operational. Large format sensor systems likethe Intergraph/ZI DMC, Vexcel Imaging Ultracam and Leica Geosystems ADS products have ma-tured. Other systems based on medium format frame sensors, often arranged in multi-head con-figurations (like IGI Quattro DigiCAM or Trimble (former Rolleimetric) AIC-x4) are competing withthe above mentioned former large-format systems and may even exceed them in terms of imagesize. Besides that other systems are around, some of them following quite new imaging conceptslike the panorama-like VisionMap A3 sensor. As it can be seen today’s world in digital airborneimaging is quite heterogeneous and challenging.
Triggered by this dynamic development in digital airborne imaging the testing and independentevaluation of these new systems is an ongoing issue and was also one of the major activities atthe Institute for Photogrammetry during the past years. Such tests help to gain a knowledge basein digital camera performance which is then for example used for decision-making when chang-ing from analogue to digital sensor flights. Despite the fact, that some European countries likeFinland already decided to completely switch to digital image recording and abandon the old ana-logue cameras and film development equipment, comprehensive testing of the latest generationdigital sensor systems including the quality analysis of sensor products (i.e. covering the wholeprocess line) was typically not considered so far. This was the motivation of the German Societyof Photogrammetry, Remote Sensing and Geoinformation (DGPF) to define a test bed to compre-hensively analyse the performance of photogrammetric digital airborne camera systems and workflow. All these tests were done under the project coordination of the Institute for Photogrammetry.
Focus was laid on airborne and large format photogrammetric sensor systems. The test wasnot limited to sensor performance but also investigates the software processing chain which isanother important component when photogrammetric products are of interest. This is different tomost of the tests carried out before. In order to allow for a comprehensive analysis, the data wascollected in similar test flight conditions and controlled environments. Thus the flight campaignswere realized in summer/fall 2008 using the Vaihingen/Enz photogrammetric test site. The year2009 was used to finish the comprehensive analysis of the complex data sets, exemplarily resultsfor the geometric performance and the performance of photogrammetric DSM generation aregiven in the following.
Quality of object point determination from aerial triangulation
Figures 9 - 11 exemplarily depict the absolute accuracy from check point analysis for three of thesystems, namely analogue RMK-Top15 (for comparison) and the frame based multi-head sensorsDMC and Quattro DigiCAM. Results are obtained from image blocks flown with 8cm ground sam-pling distance (GSD). Notice, that the individual block geometries were slightly different, since thearea covered by each of the sensors is different due to the individual camera geometry. Thus re-sults may not directly be compared, at least the differences in block geometry and environmentalchanges during data recording have to be considered.
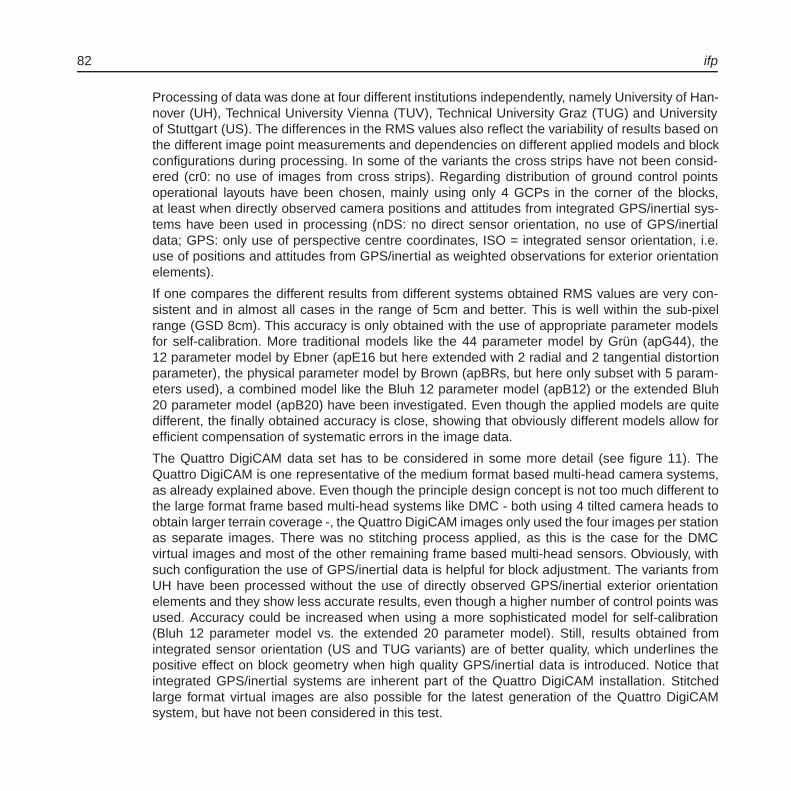
82 ifp
Processing of data was done at four different institutions independently, namely University of Han-nover (UH), Technical University Vienna (TUV), Technical University Graz (TUG) and Universityof Stuttgart (US). The differences in the RMS values also reflect the variability of results based onthe different image point measurements and dependencies on different applied models and blockconfigurations during processing. In some of the variants the cross strips have not been consid-ered (cr0: no use of images from cross strips). Regarding distribution of ground control pointsoperational layouts have been chosen, mainly using only 4 GCPs in the corner of the blocks,at least when directly observed camera positions and attitudes from integrated GPS/inertial sys-tems have been used in processing (nDS: no direct sensor orientation, no use of GPS/inertialdata; GPS: only use of perspective centre coordinates, ISO = integrated sensor orientation, i.e.use of positions and attitudes from GPS/inertial as weighted observations for exterior orientationelements).
If one compares the different results from different systems obtained RMS values are very con-sistent and in almost all cases in the range of 5cm and better. This is well within the sub-pixelrange (GSD 8cm). This accuracy is only obtained with the use of appropriate parameter modelsfor self-calibration. More traditional models like the 44 parameter model by Grun (apG44), the12 parameter model by Ebner (apE16 but here extended with 2 radial and 2 tangential distortionparameter), the physical parameter model by Brown (apBRs, but here only subset with 5 param-eters used), a combined model like the Bluh 12 parameter model (apB12) or the extended Bluh20 parameter model (apB20) have been investigated. Even though the applied models are quitedifferent, the finally obtained accuracy is close, showing that obviously different models allow forefficient compensation of systematic errors in the image data.
The Quattro DigiCAM data set has to be considered in some more detail (see figure 11). TheQuattro DigiCAM is one representative of the medium format based multi-head camera systems,as already explained above. Even though the principle design concept is not too much different tothe large format frame based multi-head systems like DMC - both using 4 tilted camera heads toobtain larger terrain coverage -, the Quattro DigiCAM images only used the four images per stationas separate images. There was no stitching process applied, as this is the case for the DMCvirtual images and most of the other remaining frame based multi-head sensors. Obviously, withsuch configuration the use of GPS/inertial data is helpful for block adjustment. The variants fromUH have been processed without the use of directly observed GPS/inertial exterior orientationelements and they show less accurate results, even though a higher number of control points wasused. Accuracy could be increased when using a more sophisticated model for self-calibration(Bluh 12 parameter model vs. the extended 20 parameter model). Still, results obtained fromintegrated sensor orientation (US and TUG variants) are of better quality, which underlines thepositive effect on block geometry when high quality GPS/inertial data is introduced. Notice thatintegrated GPS/inertial systems are inherent part of the Quattro DigiCAM installation. Stitchedlarge format virtual images are also possible for the latest generation of the Quattro DigiCAMsystem, but have not been considered in this test.
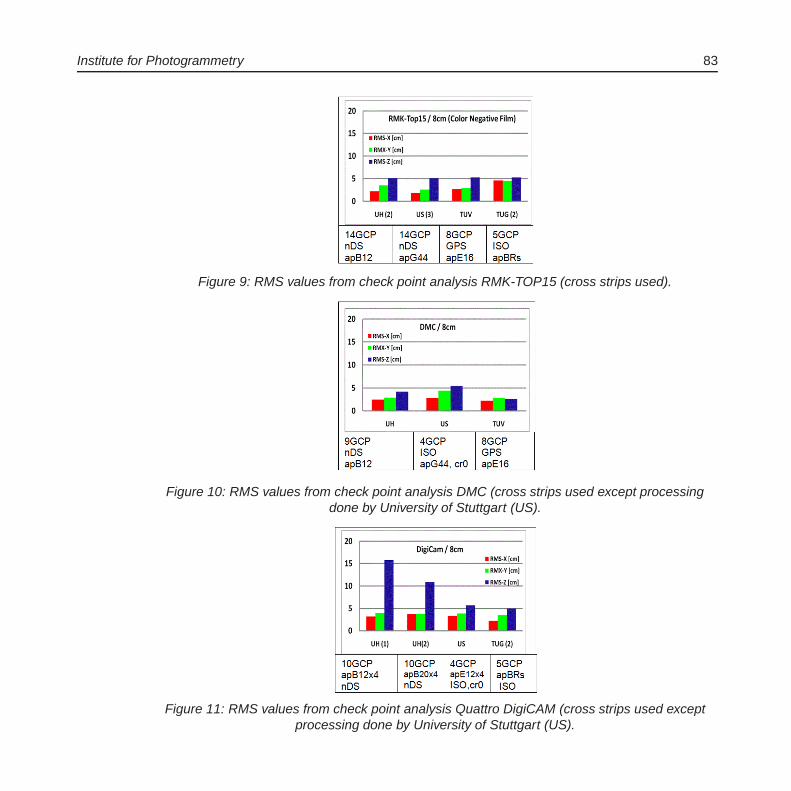
Institute for Photogrammetry 83
Figure 9: RMS values from check point analysis RMK-TOP15 (cross strips used).
Figure 10: RMS values from check point analysis DMC (cross strips used except processingdone by University of Stuttgart (US).
Figure 11: RMS values from check point analysis Quattro DigiCAM (cross strips used exceptprocessing done by University of Stuttgart (US).
84 ifp
Performance of Digital Surface Model (DSM) generation using image matching
Despite the fact that tools for automatic stereo image matching are available for more than twodecades, the collection of high resolution, high accuracy elevation data was mainly dominated bythe application of airborne LiDAR systems. However, digital airborne cameras meanwhile enablethe area covering acquisition of high dynamic image data with good signal-to-noise ratio. Thewide availability of this data also triggered the revival of elevation data collection based on imagematching. This trend is currently supported by the development of improved software tools whichfor example extend traditional stereo- to multi-image matching.
The accuracy, reliability and density of elevation data as generated from automatic image match-ing is influenced by a number of factors. Important factors are the quality of the available imagedata and the sophistication of the used matching algorithms, but also the geometric complexity ofthe respective object surfaces. Image quality again depends on the accuracy of image geometrywhich is affected by the geometric configuration of the image block, the geometric stability of thecamera and the accuracy and reliability of the camera model. Further on, it depends on the signal-to-noise-ratio of the digitized image signal, which is again influenced by the quality of the sensorsystem but also by the respective illumination and texture of the depicted surface patches. An-other considerable impact to the final result results from the subsequent data processing, wherethe employed software usually consists of different modules for automatic point transfer as wellas surface interpolation and filtering. The wide range of interacting factors which mutually influ-ence the quality of the generated elevation data complicates the analysis of the complete process.However, the data as it is available from the DGPF test provides a suitable scenario to discuss anumber of aspects.
The overall accuracy of DSM generation can be obtained from comparison of DSM heights toknown heights from terrestrial GPS reference point measurements. For the investigations DSMgrids of 0.2m raster width were generated from the 8cm GSD imagery using the software MATCH-T DSM. As a reference a 0.2m raster DSM was derived from the ALS 50 LiDAR point cloud. In or-der to allow for a first evaluation of the resulting DSM qualities, differences between the respectiveraster surfaces and the available reference points were computed. The results for the respectivecamera systems DMC, Ultracam-X, Quattro DigiCAM and RMK-Top15 and the LiDAR referencemeasurement are summarized in Table 1. About 145 reference points have been considered forthis accuracy check.
The resulting RMS value for the LiDAR DSM measured by the ALS 50 sensor is 3.4cm, which isalmost in the order of the vertical accuracy of the used check points. Compared to this accuracy,the RMS values of the DSMs for the DMC, Ultracam-X and DigiCAM are only slightly larger andrather similar for the different camera systems. The results of these highly overlapping blocks alsocorrespond very well to the vertical component of the preceding block adjustment which also gavea sub-pixel accuracy. For interpretation of these results, it still has to be mentioned, that all aboveused reference points were typically installed at paved areas like small roads or parking lots. If notoccluded, such flat neighborhoods are beneficial for the filtering and interpolation process during
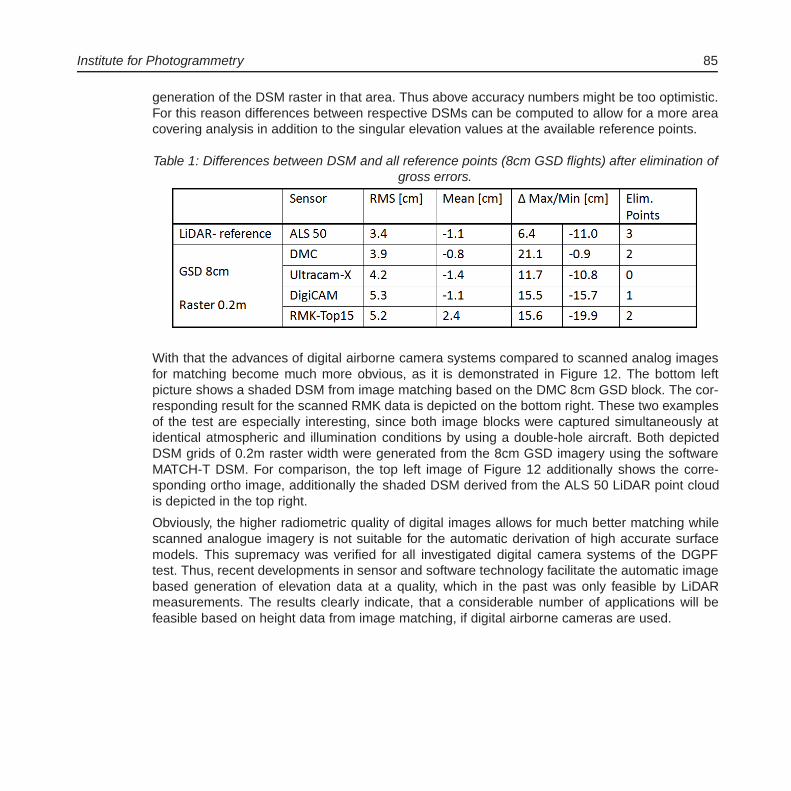
Institute for Photogrammetry 85
generation of the DSM raster in that area. Thus above accuracy numbers might be too optimistic.For this reason differences between respective DSMs can be computed to allow for a more areacovering analysis in addition to the singular elevation values at the available reference points.
Table 1: Differences between DSM and all reference points (8cm GSD flights) after elimination ofgross errors.
With that the advances of digital airborne camera systems compared to scanned analog imagesfor matching become much more obvious, as it is demonstrated in Figure 12. The bottom leftpicture shows a shaded DSM from image matching based on the DMC 8cm GSD block. The cor-responding result for the scanned RMK data is depicted on the bottom right. These two examplesof the test are especially interesting, since both image blocks were captured simultaneously atidentical atmospheric and illumination conditions by using a double-hole aircraft. Both depictedDSM grids of 0.2m raster width were generated from the 8cm GSD imagery using the softwareMATCH-T DSM. For comparison, the top left image of Figure 12 additionally shows the corre-sponding ortho image, additionally the shaded DSM derived from the ALS 50 LiDAR point cloudis depicted in the top right.
Obviously, the higher radiometric quality of digital images allows for much better matching whilescanned analogue imagery is not suitable for the automatic derivation of high accurate surfacemodels. This supremacy was verified for all investigated digital camera systems of the DGPFtest. Thus, recent developments in sensor and software technology facilitate the automatic imagebased generation of elevation data at a quality, which in the past was only feasible by LiDARmeasurements. The results clearly indicate, that a considerable number of applications will befeasible based on height data from image matching, if digital airborne cameras are used.
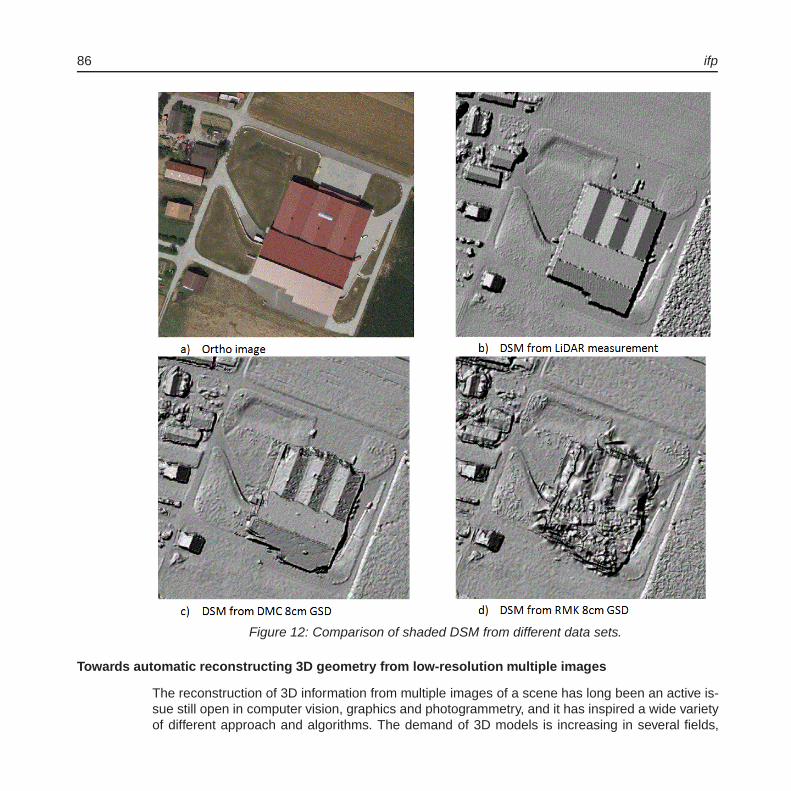
86 ifp
Figure 12: Comparison of shaded DSM from different data sets.
Towards automatic reconstructing 3D geometry from low-resolution multiple images
The reconstruction of 3D information from multiple images of a scene has long been an active is-sue still open in computer vision, graphics and photogrammetry, and it has inspired a wide varietyof different approach and algorithms. The demand of 3D models is increasing in several fields,
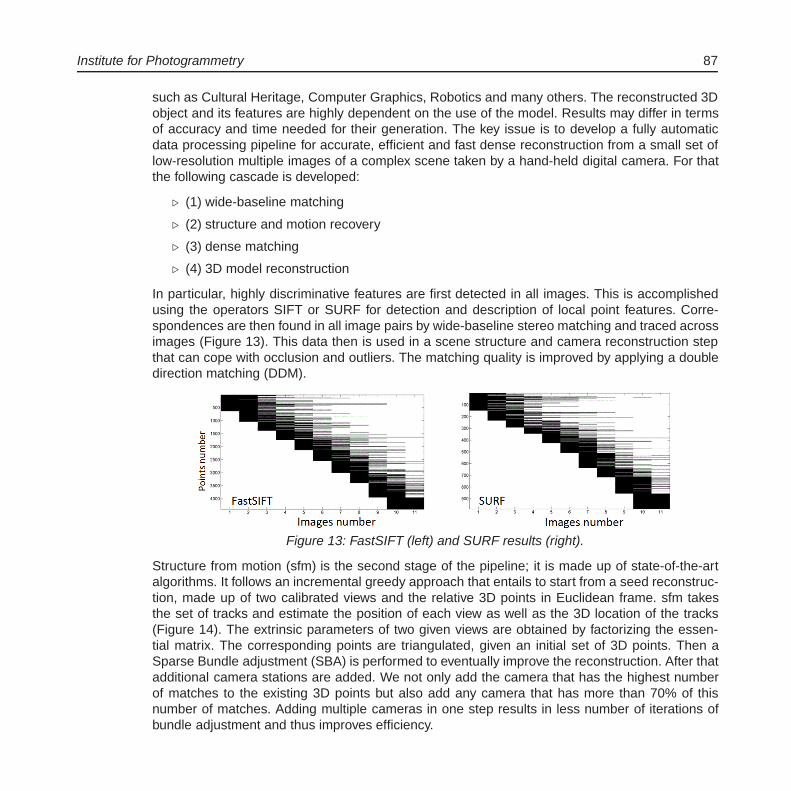
Institute for Photogrammetry 87
such as Cultural Heritage, Computer Graphics, Robotics and many others. The reconstructed 3Dobject and its features are highly dependent on the use of the model. Results may differ in termsof accuracy and time needed for their generation. The key issue is to develop a fully automaticdata processing pipeline for accurate, efficient and fast dense reconstruction from a small set oflow-resolution multiple images of a complex scene taken by a hand-held digital camera. For thatthe following cascade is developed:
� (1) wide-baseline matching
� (2) structure and motion recovery
� (3) dense matching
� (4) 3D model reconstruction
In particular, highly discriminative features are first detected in all images. This is accomplishedusing the operators SIFT or SURF for detection and description of local point features. Corre-spondences are then found in all image pairs by wide-baseline stereo matching and traced acrossimages (Figure 13). This data then is used in a scene structure and camera reconstruction stepthat can cope with occlusion and outliers. The matching quality is improved by applying a doubledirection matching (DDM).
Figure 13: FastSIFT (left) and SURF results (right).
Structure from motion (sfm) is the second stage of the pipeline; it is made up of state-of-the-artalgorithms. It follows an incremental greedy approach that entails to start from a seed reconstruc-tion, made up of two calibrated views and the relative 3D points in Euclidean frame. sfm takesthe set of tracks and estimate the position of each view as well as the 3D location of the tracks(Figure 14). The extrinsic parameters of two given views are obtained by factorizing the essen-tial matrix. The corresponding points are triangulated, given an initial set of 3D points. Then aSparse Bundle adjustment (SBA) is performed to eventually improve the reconstruction. After thatadditional camera stations are added. We not only add the camera that has the highest numberof matches to the existing 3D points but also add any camera that has more than 70% of thisnumber of matches. Adding multiple cameras in one step results in less number of iterations ofbundle adjustment and thus improves efficiency.

88 ifp
Figure 14: Camera and scene geometry.
For the dense matching and 3D model reconstruction (Figure 15) an approach is used, whichis implemented as a match, expand, and filter procedure. It starts from a sparse set of matchedkeypoints and repeatedly expanding these to nearby pixel correspondence before using visibilityconstraints to filter away false matches (PMVS program by Furukawa).
Figure 15: Reconstruction results (left) dense 3D point cloud (right) textured 3D model.

Institute for Photogrammetry 89
Terrestrial Positioning Systems and Computer Vision
Automated 3D Reconstruction of Interiors from Point Clouds
Building models in urban environments are currently classified through the formal specificationin CityGML. This open data model supports five different LODs that provide a hierarchical de-scription of building entities, both exterior and interior. The goal of our reconstruction process isto automatically achieve an indoor model that is consistent with the degree of resolution typicalfor a model at LOD4, the highest representation level of building features in terms of details. Sofar, realistic models of interiors have always been designed manually with the help of dedicatedsoftware packages. However, the demand for indoor models for different purposes has recentlyincreased, thus a higher automation could better satisfy different applications and speed up theprocesses by improving the efficiency in the project pipeline.
We developed a new technique for the fully automated 3D modelling of indoor environments froma point cloud. The procedure we propose in order to extract the model uses a 3D point cloud as aninput for the algorithm. After the data acquisition, the main steps of the algorithm are segmentation(based on a plane sweep technique) and ground plan extraction (using half-space modelling).The basic approach to data segmentation is plane sweeping based on a hypothesis-and-teststrategy. From the segmentation results, the ground plan is created through cell decomposition bytrimming the two-dimensional ground space using half-space primitives. An extension in height ofthe ground contours makes the generation of the 3D model possible. The generated indoor modelis stored in CAD format for analysis and further applications or, simply, as a record of the interiorgeometry.
Referring to the field of computer vision, segmentation is an image processing operation that par-titions a digital image by grouping sets of pixels with relevant common characteristics. In this way,objects of interest are isolated from the rest of the image, which becomes more meaningful andeasier to analyze. 2D segmentation of images shares the same goal of our segmentation, which,although it is applied to 3D points and not to intensity pixels, aims to make different structuresdistinguishable within the input data set. The distances of such structures from the origin of thecoordinates, together with their orientations (angles) in the reference system determine the typeof planar region identified (floor, ceiling, walls . . . ). To be precise, a plane sweep algorithm is usedto collect and separate points describing the walls and the two horizontal faces, namely floor andceiling. The approach is based on a hypothesis-and-test strategy. A hypothesis is made aboutthe position of a plane, referred to as the sweeping plane, along its normal vector. The criterionfor testing this hypothesis is a threshold on the number of points in the neighbourhoods of thesweeping plane. The plane is accepted when the number of points exceeds the threshold.
The second part of the algorithm extracts the ground plan through a half space modelling tech-nique. According to this paradigm, the two-dimensional space is partitioned and shaped by re-peatedly splitting it up into two half-spaces using straight lines. In order to recover the ground plancontours, the lines that are used to trim the ground space are those determined by the traces of

90 ifp
the walls on the floor. As a result, a set of ground cells is found. As we mentioned above, thealgorithm is able to estimate the geometry of the ground plan automatically without requiring anya priori information about its shape. This is a considerable advantage since the ground plan ofbuildings is not always available. In our case, we make the basic assumptions that the floor andthe ceiling are horizontal, the walls are vertical and they are either perpendicular or parallel toeach other. Results of our approach are displayed in Figure 16.
Figure 16: Two examples of our approach for automated reconstruction. The point cloud isdisplayed in grey. The reconstructed model is displayed in blue (floor) and green (wall).
RoboMAP
RoboMAP is a project funded by the Bundesministerium fur Bildung und Forschung aiming at thedevelopment of a robot guided optical inspection system for the measurement of cylinder headsin the automotive industry. In this project we cooperate with partners from science as well asindustry. In order to measure all significant features of a cylinder head, a combination of differ-ent measurement techniques has to be applied. A triangulating system and an interferometer arecombined to a multi sensor which is capable of measuring outer geometry as well as inner geom-etry, applying a specialized measuring strategy. This strategy is named Coarse-to-Fine-Strategyand can be roughly described as a stepwise improvement of measuring accuracy and sensorpositioning accuracy at the same time. As an initial step, to further increase the system’s flexibil-ity, the cylinder head is to be detected using an external, statically mounted camera. This objectrecognition task and the calibration of the overall system depict the main topics the Institute forPhotogrammetry is entrusted with.

Institute for Photogrammetry 91
Figure 17: Image of the multi sensor taken during a demonstration run in October 2009.
Figure 18: Image taken by the object recognition camera; the recognition’s result is used toproject the CAD model of the combustion chamber back into the image in order to demonstrate
its correctness.

92 ifp
In a first test phase a view based object recognition approach, which uses the known object ge-ometry provided via a CAD model, was applied to a simple test object. The experience gainedthis way helped determining the parts of the data useful for recognition and transferring the al-gorithm successfully to the cylinder head. The results could be improved in their accuracy fromabout 5mm to about 1.5mm concerning the determined object position. An adequate planning ofthe whole configuration was crucial for this development. This includes not only the choice of thecamera position but also the creation of a special lighting solution. We use high power LEDs anda large reflecting surface to create a very diffuse indirect lighting of the combustion chamber. Thisway we are able to exploit its reflectivity, which usually is seen as a disadvantage, by highlightingthe combustion chamber in an image that is otherwise very dark. This coincides with the fact thatwe solely use the combustion chamber for the purpose of recognition as this surface is the mostdistinct surface of the cylinder head.
Calibration of the over-all system was the second focus of our work in 2009. The task is to deter-mine the relations between the coordinate systems of all partitioning components. This includesthe static as well as the dynamic robot coordinate systems, the coordinate system of the ob-ject recognition camera and the coordinate systems of the two robot guided sensors. Especiallymerging those two sensors to a single multi sensor and determining this multi sensor’s relation tothe coordinate system of the robot hand demands the development of new calibration strategiesincluding the creation of a specialized calibration body. This body provides special features foreach sensor, whose measurement is to yield the complete 6DOF information for the sensors withrespect to the calibration body’s coordinate system.
In addition implementation issues, such as the integration of our software into the robot controlsystem, will be addressed. All of our work is influenced by general project constraints, e. g. robotworkspace design, cycle time of the cylinder head production and the demand for easy mainte-nance of the system.
Figure 19: Image taken during a demonstration run, showing the RoboMAP system whilemeasuring a calotte using the triangulation system.
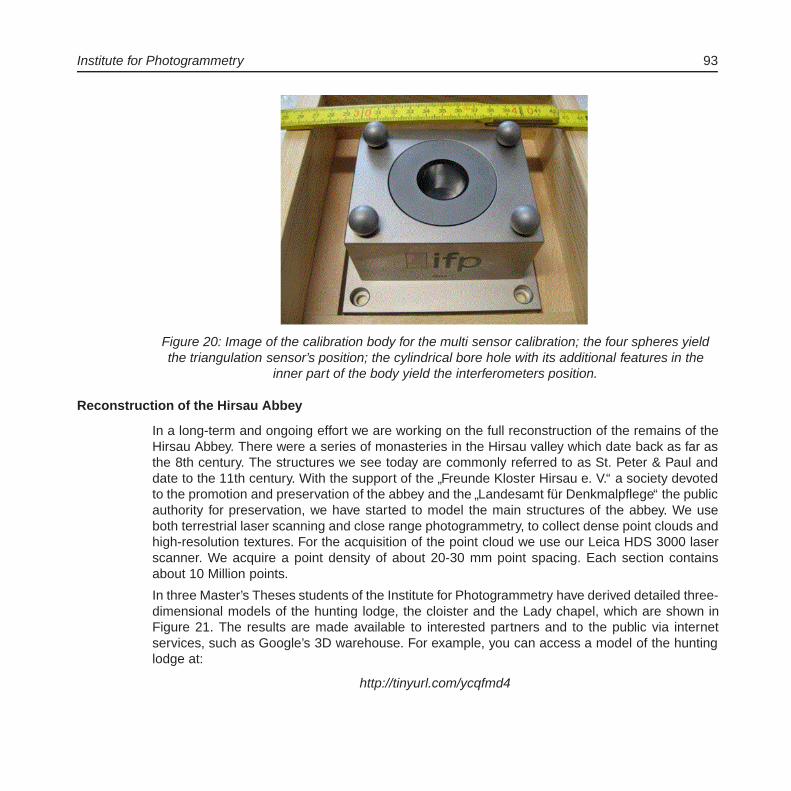
Institute for Photogrammetry 93
Figure 20: Image of the calibration body for the multi sensor calibration; the four spheres yieldthe triangulation sensor’s position; the cylindrical bore hole with its additional features in the
inner part of the body yield the interferometers position.
Reconstruction of the Hirsau Abbey
In a long-term and ongoing effort we are working on the full reconstruction of the remains of theHirsau Abbey. There were a series of monasteries in the Hirsau valley which date back as far asthe 8th century. The structures we see today are commonly referred to as St. Peter & Paul anddate to the 11th century. With the support of the
”Freunde Kloster Hirsau e. V.“ a society devoted
to the promotion and preservation of the abbey and the”Landesamt fur Denkmalpflege“ the public
authority for preservation, we have started to model the main structures of the abbey. We useboth terrestrial laser scanning and close range photogrammetry, to collect dense point clouds andhigh-resolution textures. For the acquisition of the point cloud we use our Leica HDS 3000 laserscanner. We acquire a point density of about 20-30 mm point spacing. Each section containsabout 10 Million points.
In three Master’s Theses students of the Institute for Photogrammetry have derived detailed three-dimensional models of the hunting lodge, the cloister and the Lady chapel, which are shown inFigure 21. The results are made available to interested partners and to the public via internetservices, such as Google’s 3D warehouse. For example, you can access a model of the huntinglodge at:
http://tinyurl.com/ycqfmd4

94 ifp
Figure 21: The three sections of the Hirsau abbey that were captured so far: the hunting lodge(top), the cloister (middle) and the Lady chapel (bottom). Each row shows an image of the
particular site, a rendering of the point cloud and the three-dimensional model, respectively.

Institute for Photogrammetry 95
References 2009
Al-Kheder, S., Al-Shawabkeh, Y., Haala, N.: Developing a Documentation System for DesertPalaces in Jordan Using 3D Laser Scanning and Digital Photogrammetry. Journal of Ar-chaeological Science, 36(2), 537-546.
Becker, S.: Generation and application of rules for quality dependent facade reconstruction. IS-PRS Journal of Photogrammetry and Remote Sensing, 64 (2009), 640-653.
Becker, S., Haala, N.: Grammar Supported Facade Reconstruction from Mobile LiDAR MappingCMRT09, IAPRS Vol XXXVII Part 3/4, 229-234.
Becker, S., Haala, N.: Quality Dependent Reconstruction of Building Facades. In: Rothermel, K.,Fritsch, D., Blochinger, W., Durr, F. (eds.): Proceedings of QuaCon 2009 - First InternationalWorkshop on Quality of Context Data. Lecture Notes in Computer Science, 5786, Springer,174-184.
Bohm, J.: Terrestrial LiDAR in Urban Data Acquisition. Photogrammetric Week 2009, WichmannVerlag, Heidelberg, 169-178.
Budroni, A., Bohm, J.: Toward Automated Reconstruction of Interiors from Laser Data. The Inter-national Archives of Photogrammetry, Remote Sensing and Spatial Information Sciences,Vol. XXXVIII, Part 5, Commission 5. ISPRS Workshop 3D-Arch 2009: 3D Virtual Recon-struction and Visualization of Complex Architectures, on CD-ROM.
Cefalu, A., Bohm, J.: Three-dimensional object recognition using a monoscopic camera systemand CAD geometry information. SPIE Videometrics, Range Imaging and Applications X,San Diego, USA, 74470K 1-8.
Chen, H., Walter, V.: Quality Inspection and Quality Improvement of Large Spatial Datasets. In:GSDI 11 World Conference, Spatial Data Infrastructure Convergence: Building SDI Bridgesto Address Global Challenges, on CD-ROM.
Cramer, M.: Digital Airborne Camera Performance - The DGPF Test. Photogrammetric Week2009, Wichmann Verlag, Heidelberg, 51-68.
Cramer, M.: Evaluierung digitaler photogrammetrische Kamerasysteme - Projektstatus Marz2009. Photogrammetrie - Fernerkundung - Geoinformation PFG, 4/2009.
Cramer, M.: Digital Camera Calibration, European Spatial Data Research (EuroSDR), OfficialPublication No. 55, 257 pages, ISBN: 978-9-051-79658-2.
Cramer, M., Haala, N.: DGPF Project: Evaluation of Digital Photogrammetric Aerial Based ImagingSystems - Overview and Results from the Pilot Centre. ISPRS Hannover Workshop 2009,High-Resolution Earth Imaging for Geospatial Information, on CD-ROM.
Cramer, M., Krauß, H., Jacobsen, K., von Schonermark, M., Haala, N., Spreckels, V.: Das DGPF-Projekt zur Evaluierung digitaler photogrammetrischer Kamerasysteme. Tagungsband 18/ 2009, Jahrestagung DGPF Jena, 9-21.
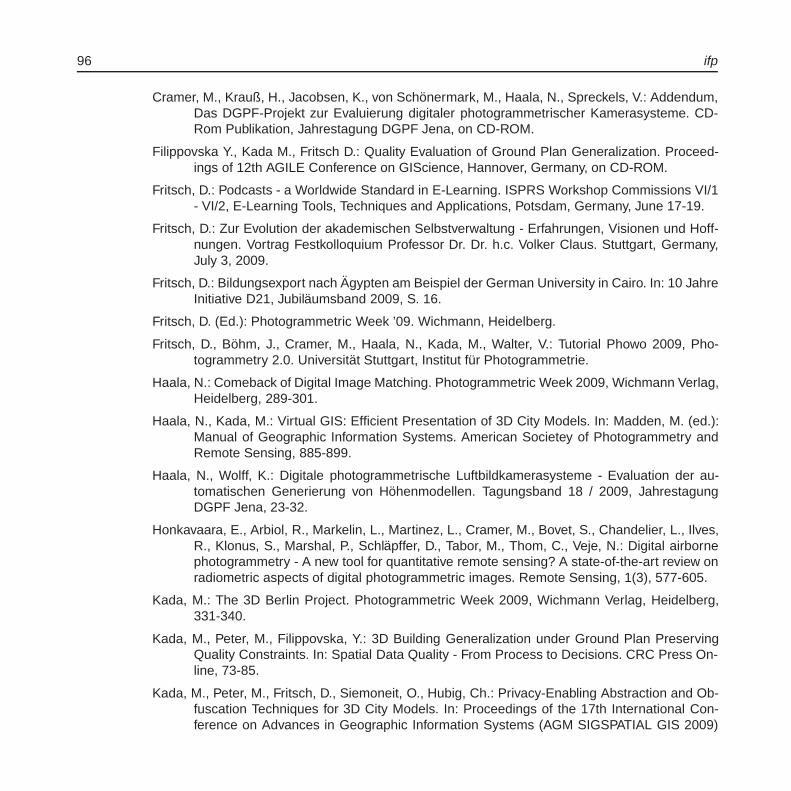
96 ifp
Cramer, M., Krauß, H., Jacobsen, K., von Schonermark, M., Haala, N., Spreckels, V.: Addendum,Das DGPF-Projekt zur Evaluierung digitaler photogrammetrischer Kamerasysteme. CD-Rom Publikation, Jahrestagung DGPF Jena, on CD-ROM.
Filippovska Y., Kada M., Fritsch D.: Quality Evaluation of Ground Plan Generalization. Proceed-ings of 12th AGILE Conference on GIScience, Hannover, Germany, on CD-ROM.
Fritsch, D.: Podcasts - a Worldwide Standard in E-Learning. ISPRS Workshop Commissions VI/1- VI/2, E-Learning Tools, Techniques and Applications, Potsdam, Germany, June 17-19.
Fritsch, D.: Zur Evolution der akademischen Selbstverwaltung - Erfahrungen, Visionen und Hoff-nungen. Vortrag Festkolloquium Professor Dr. Dr. h.c. Volker Claus. Stuttgart, Germany,July 3, 2009.
Fritsch, D.: Bildungsexport nach Agypten am Beispiel der German University in Cairo. In: 10 JahreInitiative D21, Jubilaumsband 2009, S. 16.
Fritsch, D. (Ed.): Photogrammetric Week ’09. Wichmann, Heidelberg.
Fritsch, D., Bohm, J., Cramer, M., Haala, N., Kada, M., Walter, V.: Tutorial Phowo 2009, Pho-togrammetry 2.0. Universitat Stuttgart, Institut fur Photogrammetrie.
Haala, N.: Comeback of Digital Image Matching. Photogrammetric Week 2009, Wichmann Verlag,Heidelberg, 289-301.
Haala, N., Kada, M.: Virtual GIS: Efficient Presentation of 3D City Models. In: Madden, M. (ed.):Manual of Geographic Information Systems. American Societey of Photogrammetry andRemote Sensing, 885-899.
Haala, N., Wolff, K.: Digitale photogrammetrische Luftbildkamerasysteme - Evaluation der au-tomatischen Generierung von Hohenmodellen. Tagungsband 18 / 2009, JahrestagungDGPF Jena, 23-32.
Honkavaara, E., Arbiol, R., Markelin, L., Martinez, L., Cramer, M., Bovet, S., Chandelier, L., Ilves,R., Klonus, S., Marshal, P., Schlapffer, D., Tabor, M., Thom, C., Veje, N.: Digital airbornephotogrammetry - A new tool for quantitative remote sensing? A state-of-the-art review onradiometric aspects of digital photogrammetric images. Remote Sensing, 1(3), 577-605.
Kada, M.: The 3D Berlin Project. Photogrammetric Week 2009, Wichmann Verlag, Heidelberg,331-340.
Kada, M., Peter, M., Filippovska, Y.: 3D Building Generalization under Ground Plan PreservingQuality Constraints. In: Spatial Data Quality - From Process to Decisions. CRC Press On-line, 73-85.
Kada, M., Peter, M., Fritsch, D., Siemoneit, O., Hubig, Ch.: Privacy-Enabling Abstraction and Ob-fuscation Techniques for 3D City Models. In: Proceedings of the 17th International Con-ference on Advances in Geographic Information Systems (AGM SIGSPATIAL GIS 2009)

Institute for Photogrammetry 97
- 2nd International Workshop on Security and Privacy in GIS and LBS (SPRINGL 2009),53-57.
Peter, M.: Presentation and Evaluation of Inconsistencies in Multiply Represented 3D BuildingModels. In: Rothermel, K., Fritsch, D., Blochinger, W., Durr, F. (eds.): Proceedings of Qua-Con 2009 - First International Workshop on Quality of Context Data. Lecture Notes inComputer Science; 5786, Springer, 156-163.
Siemoneit, O., Hubig, Ch., Kada, M., Peter, M., Fritsch, D.: Google Street View and Privacy: Somethoughts from a philosophical and engineering point of view. In: Proceedings of the 5thAsia-Pacific Computing and Philosophy Conference (APCAP 2009), 1-7.
Rothermel, K., Fritsch, D., Blochinger, W., Durr, F. (Eds.): Quality of Context. Lecture Notes inComputer Science 5786, Springer, Berlin Heidelberg, 185p.
Walter, V., Busch, S., Goutrie, R.: GPS Odyssey - a location based interactive city game. Pro-ceedings of 12th AGILE Conference on GIScience, Hannover, Germany, on CD-ROM.
Walter, V., Busch, S., Goutrie, R.: GPS Odyssey - ein ortsbasiertes interaktives Stadtspiel.gis.science, 1/2009, 26-30.
Walter, V., Luo, F.: Automatic Map Interpretation. In: 3rd ICA Workshop on Geospatial Analysisand Modeling, August 6-7, 2009, Gavle, Sweden, on CD-ROM.
Doctoral Theses
Blumrich, F.: Optische korrelationsbasierte Messtechnik mittels zufalliger Punktemuster.Forschungsbericht 2009-10, Deutsches Zentrum fur Luft- und Raumfahrt. Supervisor Prof.D. Fritsch, Co-Supervisor: Prof. A. Dilmann.
Diploma Theses / Master Theses
Tao, J.: Generierung von 3D-Oberflachenmodellen aus stark uberlappenden Bildsequenzen einesWeitwinkel-Kamerasystems. Supervisors: Kurz, F. (DLR), d’Angelo, P. (DLR), Haala, N.
Filippovska, Y.: Qualitatsuntersuchung von formvereinfachten Gebaudegrundrissen. Supervisor:Walter, V.
Zhang, L.: Lokalisierung eines mobilen Roboters mittels einer externen statischen Kamera. Su-pervisors: Grafenstein, J. (Robert Bosch GmbH), Haala, N.
Singh, J.: Information Extraction for the Classification of TerraSAR-X Images. Supervisor: Fritsch,D.
Fuchs, T.: Einsatz einer Highspeed-Kamera fur die PROPAC-Messtechnik. Supervisors: Blumrich,F. (DLR Gottingen), Haala, N.
Jarzabek, M.: Segmentation and presentation of multiple 3D point clouds. Supervisor: Haala, N.

98 ifp
Tao, T.: Entwicklung und Bewertung von LiDAR-Auswertemodulen fur die Aufnahme vonFreileitungstrassen. Supervisors: Haala, N., Dorr, I. (GA Energieanlagenbau Sud GmbH),Balsen, H. (GA Energieanlagenbau Sud GmbH), Walter, A. (GA Energieanlagenbau SudGmbH).
Zheng, B.: Optimierung der Prufung intrinsischer Kameraparameter und Evaluierung ver-schiedener Messkonzepte. Supervisors: Haala, N., Apel, U. (Robert Bosch GmbH), Weber,S. (Robert Bosch GmbH).
Dan, L.: Erstellung eines WebGIF (WebGIS) aus Basis .Net Web ADF und Erweiterung um Druck-funktionalitat. Supervisors: Walter, V., Helm, M. (Intend Geoinformatik GmbH).
Moussa, W.: Digital Preservation of the Hirsau Abbey by Means of Static LiDAR & HD CloseRange Photogrammetry. Supervisors: Fritsch, D., Bohm, J., Kolbe, T. (Th Berlin).
Study Theses
Zhou, D.: Radiometrische Einschatzung von digitalen Luftbildkameras. Supervisors: Cramer, M.,v. Schonermark, M. (IRS).
Konrad W.: Genauigkeitsanalyse automatischer Hohenmodelle fur Daten verschiedener Luftbild-kamera. Supervisor: Haala, N.
Korner, M.: Realisierung einer Strahlformungsoptik fur die Substratvorbelichtung. Supervisors:Pruss, C. (ITO, Stuttgart), Haala, N.
Schmid, S.: Untersuchungen zum geometrischen Auflosungsvermogen von digitalen Luftbildkam-eras. Supervisor: Cramer, M.
Tao, J.: Robuste Zuordnung von Merkmalspunkten in Aufnahmen ebener Objekte. Supervisor:Bohm, J.
Zhang, L.: Bestimmung der außeren Orientierungaus der projektiven Beziehung mehrerer Bilder.Supervisor: Bohm, J.
Rau, D.: Optimierung der Auswertesoftware fur die Reflected Pattern Correlation (REPAC). Su-pervisor: Haala, N., Blumrich, F. (DLR).
Activities in National and International Organizations
Bohm, J.:Co-Chair ISPRS Working Group V/4 - Image-based and range-based 3D modellingMitglied im VDI/VDE GMA Fachausschuss 3.32 Optische 3D-Meßtechnik - Gemein-schaftlicher Ausschuss des VDI und der DGPF
Cramer, M.:President EuroSDR Technical Commission I - Sensors, primary data acquisition and geo-referencing

Institute for Photogrammetry 99
Co-Chair ISPRS Working Group I/5 - Integrated Systems for Sensor Georeferencing andNavigation
Fritsch, D.:Member D21 Advisory BoardMember Board of Trustees German University in Cairo (GUC)Member Apple’s University Education Forum (UEF)Member Advisory Board Finnish Geodetic InstituteChairman Board of Trustees ‘The ISPRS Foundation’Chairman Scientific Advisory Board ‘Baden-Wurttemberg International’Member Advisory Board ISPRSVice-President Research EuroSDR
Haala, N.:Co-Chair ISPRS WG III/4 - Automatic Image Interpretation for City-ModellingVorsitz DGPF Arbeitskreis Sensorik und Plattformen
Walter, V.:Nationaler Berichterstatter fur die ISPRS Kommission IV
Education - Lectures/Exercises/Training/Seminars
Bachelor Geodasie und Geoinformatik
Introduction into Geodesy and Geoinformatics 4/2/0/0(Cramer, Fritsch, Sneeuw, Keller, Kleusberg)
Diplomstudiengang Geodasie und Geoinformatik
Adjustment Theory and Statistical Inference I, II (Fritsch, Sneeuw) 4/2/0/0Advanced Projects in Photogrammetry and GIS (Bohm, Cramer, Haala, Walter) 1/2/0/0Aerotriangulation and Stereoplotting (Cramer) 2/1/0/0Close Range Photogrammetry (Bohm) 2/1/0/0Databases and Geoinformation Systems (Walter) 2/1/0/0Digital Terrain Models (Haala) 1/1/0/0Digital Image Processing (Haala) 2/1/0/0Digital Signal Processing (Fritsch, Bohm) 2/1/0/0Geodetic Seminar I, II (Fritsch, Sneeuw, Keller, Kleusberg) 0/0/0/4Geoinformatics I (Fritsch, Walter) 2/1/0/0Geoinformatics II (Walter) 2/1/0/0Integrated Fieldworks (Fritsch, Sneeuw, Keller, Kleusberg) 0/0/4/0

100 ifp
Introductory Readings to Photogrammetry (Cramer) 2/0/0/0Image Acquisition and Monoplotting (Cramer) 2/1/0/0Urban Planning (Dvorak) 1/0/0/0Pattern Recognition and Image Based Geodata Collection (Haala) 2/1/0/0Photogrammetry and GIS (Cramer) 2/1/0/0Animation and Visualisation of Geodata (Haala, Kada) 1/1/0/0Cartography (Urbanke) 1/0/0/0
Master Course Geoengine
Airborne Data Acquisition (Fritsch, Cramer) 1/1/0/0Geoinformatics (Fritsch, Walter) 2/1/0/0Signal Processing (Fritsch, Bohm) 2/1/0/0Topology and Optimisation (Fritsch, Kada) 2/1/0/0
Master Courses ”Infrastructure Planning“ and ”Water Resource Management“
Advanced GIS (Walter) 2/0/0/0
Diplomstudiengang Geographie (Stuttgart und Tubingen)
Geoinformatics I (Fritsch, Walter) 2/1/0/0Geoinformatics II (Walter) 2/1/0/0Practical Training in GIS (Walter) 0/0/4/0
Diplomstudiengang Luft- und Raumfahrt
Introduction into Photogrammetry (Cramer) 2/0/0/0
Honors/Awards
Cramer, M.Carl Pulfrich Award 2009