style-d8.2-family strategies to cope with poor lm … · d 8.2 - family strategies to cope with...
TRANSCRIPT
This project has received funding from the European Union’s Seventh Framework Programme for research, technological development and demonstration under Grant Agreement no. 613256.
D 8.2 - Family strategies to cope with poor labour market outcomes Gabriella Berloffa, Marianna Filandri, Eleonora Matteazzi, Tiziana Nazio, Nicola Negri, Jacqueline O’Reilly and Alina Sandor University of Turin, University of Trento and University of Brighton STYLE-WP8: Family and Cultural Drivers of Youth Unemployment and Adulthood Transitions Deliverable 8.2 17 February 2016 Version - 1.4 Submission date - Planned: 29/02/2016 Actual: 28/02/2016

2 Berloffa, Filandri, Matteazzi, Nazio, Negri, O’Reilly and Sandor STYLE Working Papers are peer-reviewed outputs from the www.style-research.eu project. The series is edited by the project coordinator Professor Jacqueline O’Reilly. These working papers are intended to meet the European Commission’s expected impact from the project:
i) to ‘advance the knowledge base that underpins the formulation and implementation of relevant policies in Europe with the aim of enhancing the employment of young people and their transition to economic and social independence’, and
ii) to engage with ‘relevant communities, stakeholders and practitioners in the research with a view to supporting employment policies in Europe.’ Contributions to a dialogue about these results can be made through the project website www.style-research.eu, or by following us on Twitter @STYLEEU.
To cite this report: Berloffa, G., M. Filandri, E. Matteazzi, T. Nazio, N. Negri, J. O’Reilly and A. Sandor (2016) ‘Family strategies to cope with poor labour market outcomes’, STYLE Working Papers, STYLE-WP8.2 CROME, University of Brighton, Brighton. http://www.style-research.eu/publications/working-papers © Copyright is held by the authors About the authors Gabriella Berloffa http://www.style-research.eu/team/gabriella-berloffa
Marianna Filandri http://www.style-research.eu/team/marianna-filandri
Eleonora Matteazzi http://www.style-research.eu/team/eleonora-matteazzi
Tiziana Nazio http://www.style-research.eu/team/tiziana-nazio
Nicola Negri http://www.style-research.eu/team/nicola-negri
Jacqueline O’Reilly http://www.style-research.eu/team/jacqueline-oreilly Alina Sandor http://www.style-research.eu/team/alina-sandor
Acknowledgements The research leading to these results has received funding from the European Union’s Seventh Framework Programme for research, technological development and demonstration under grant agreement no. 613256. We are grateful for comments made on earlier drafts by Colette Fagan.
D 8.2 - Family strategies to cope with poor labour market outcomes 3
Executive Summary This work uses the EU-SILC data to examine the early stages of young people’s employment (or non employment) career trajectories, in the phase following educational achievements or completion.
In particular, we examine the extent to which young people’s family background and household characteristics impact on young individuals’ transitions from school to work and their probability of experiencing successful or failure paths. We propose a twofold definition of successful paths. Firstly, through the classification of employment trajectories and, secondly, through the dimensions of skills and wage for those who are employed. We provide new comparative empirical evidence, both cross-sectional and longitudinal, on the following effects:
• the effect of the family employment structure on young people's probability to follow certain school-to-work-transition trajectories, for those still living with parents
• how the experience in unemployment at the early stage of employment career reflects on the occupational conditions (pay & skill level) reached by young individuals, net of individual and country characteristics
• whether experiencing unemployment, (dis)continuity in employment or the type of entry job after leaving education affects, for those employed, the characteristics of their occupation three years later
• which employment strategies are more likely to lead to a successful employment condition
• how family social influences the strategies outcomes achieved by young people.
We devise and describe two typologies (of school-to-work trajectories and of success-failure in occupational positioning) and test the influence of several individuals’ and familial characteristics. The research results suggest that the employment structure of the family of origin plays a strong and decisive influence on the employment trajectories and likelihood of occupational success for young people. Our results support the idea that families of origin strongly stratify young people’s educational and occupational achievements, opportunities, strategies and prospects in the labour market. Their influence looms large, both when living within and outside the parental household.
In terms of school-leavers’ routes to the labour market the results suggest that the employment conditions of the household members can increase the likelihood of speedy trajectories. The study also indicates that, despite a clear but weak advantage of a continuous employment attachment and an early start, short-term unemployment does not impair subsequent outcomes. Results suggest that a slightly longer initial wait before first entry (instead of entering employment immediately after completing education), or a turbulent beginning (instead of continuous employment), might respond to a strategic move to securing an initially skilled positioning, often at the trade-off of a lower salary. The pursuit of ‘higher profile’ career paths is made easier for youth from higher social class, while for children from other social backgrounds staying longer in the parental home may be the most viable option to achieve better employment prospects. Net of the country differences in the proportion of young people employed and experiencing the measured outcomes, we find no country specific differences in mediating the effects of either of the outcomes analysed.
Key words: School-to-work transition; unemployment; employment; family background; strategies; inequalities

4 Berloffa, Filandri, Matteazzi, Nazio, Negri, O’Reilly and Sandor Table of Contents
1. Introduction ..................................................................................................................................... 71.1 Aims and organisation of this report .......................................................................................... 7
2. The influence of the family employment structure on school-to-work trajectories .......................... 82.1 Data and methodology ............................................................................................................... 9
Data, definitions and descriptive statistics .......................................................................... 92.1.1 Methodology ..................................................................................................................... 122.1.2
2.2 Results ..................................................................................................................................... 14
Marginal effects ................................................................................................................ 142.2.1 Predicted outcome probabilities and odds ratios by family type ....................................... 152.2.2
2.3 Working conditions of household members and youth transition trajectories .......................... 18
3. Employment strategies: duration in unemployment and early entrance ....................................... 203.1 Young people between studies and the labour market ............................................................ 20
3.2 Successful young people in the context of different labour markets ........................................ 23
3.3 The way to a better job: quick entrance and few interruptions ................................................. 26
3.4 Good and bad jobs: a typology of successful outcome ............................................................ 27
Duration in unemployment and employment outcomes .................................................... 283.4.1 Continuity in employment and employment outcomes ..................................................... 293.4.2
4. Employment strategies: better start and social class of origin ...................................................... 324.1 Earlier entrance or a better start? ............................................................................................ 32
4.2 Employment strategies by family of origin ............................................................................... 37
5. Conclusions .................................................................................................................................. 406. Bibliography .................................................................................................................................. 457. Appendix ....................................................................................................................................... 51Recent titles in this series .................................................................................................................... 56Research Partners ............................................................................................................................... 61Advisory Groups .................................................................................................................................. 62

D 8.2 - Family strategies to cope with poor labour market outcomes 5
Abbreviations
ALMP Active Labour Market Policy/PoliciesAT AustriaBE BelgiumBG BulgariaCH SwitzerlandCY CyprusCZ Czech RepublicDE GermanyDK DenmarkEC European CommissionEE EstoniaEPL Employment Protection LegislationES SpainEU European UnionEU-LFS European Union- Labour Force SurveyEU-SILC European Union Survey on Income and Living ConditionsFI FinlandFR FranceGR GreeceHU HungaryIE IrelandILO International Labour OfficeIS IcelandISCED International Standard Classification of EducationIT ItalyLFS Labour Force Survey LT LithuaniaLU LuxembourgLV LatviaMT MaltaNEET Not in Employment, Education or TrainingNGO Non-Governmental Organisation NL NetherlandsNO NorwayOECD Organisation for Economic Cooperation and DevelopmentOLS Ordinary Least SquaresPL PolandPT Portugal RO RomaniaSE Sweden

6 Berloffa, Filandri, Matteazzi, Nazio, Negri, O’Reilly and Sandor
SI SloveniaSK SlovakiaSTW School to WorkUK United Kingdom

D 8.2 - Family strategies to cope with poor labour market outcomes 7
1. Introduction
1.1 Aims and organisation of this report This report investigates the role of young people’s family of origin on their early labour market
trajectories and employment outcomes in Europe, with EU-SILC cross-sectional (2011) and
longitudinal data (2009-2012). We inspect differences between households’ working condition (of
parents and other adult members, distinguishing between mother and father’s employment) around
educational completion, taking account of country differences at the European level. We also focus on
the effects of early employment experiences (unemployment, continuity and early entrance) on young
people’s early employment outcomes in five selected countries: Finland, France, Italy, Poland and the
UK. To depict the (un)successful outcomes of employment strategies, we test both for the effect of
entry job and for social class differences on later occupational outcomes. This report is organised as
follows:
1. We inspect the effect of household members working condition on young people’s early
employment trajectories, by gender and over time, for those living with their parents, using EU-SILC
longitudinal data (2009-2012) in chapter 2.
2. We analyse the how the experience in unemployment at the early stage of employment career
reflects on the occupational conditions (pay & skill level) reached by young individuals, net of
individual and country characteristics, using EU-SILC data in chapter 3. Here, we also test whether
experiencing unemployment or (dis)continuity in employment affects, for those employed, the
characteristics of their employment outcomes three years later.
3. Chapter 4 analyses which employment strategies are more likely to lead to a successful
employment condition three years later (with longitudinal data). It also examines the relationship
between the social class of the families of origin on young people’s short term employment outcomes
(within 5 years since finishing education). It does so, distinguishing between individuals still living with
their parents or who already reached residential independence, using Eu-Silc ad-hoc module (2011).
4. The report concludes by summing up the key findings and their policy implications.

8 Berloffa, Filandri, Matteazzi, Nazio, Negri, O’Reilly and Sandor
2. The influence of the family employment structure on school-to-work trajectories
The experience of entering the labour market varies greatly across European countries both in terms
of entry-speed and job-stability. While in some countries young people enter rapidly in a stable
employment, in other countries they go through a long search process, or they change various short
and unstable jobs. Differences in youth school-to-work transitions may be explained by cross-country
differences in educational systems, labour market institutions, youth unemployment and other macro-
economic conditions (Müller and Gangl 2003; Scherer 2005; Schomburg and Teichler 2006; Shavit
and Müller 1998; Wolbers 2007).1 In this chapter we examine whether, besides individual and country
characteristics, the family background plays a role in determining the type of integration process into
the labour market experienced by young individuals.
Several studies analysed the relationship between young individuals' employment status and their
family background, considering intergenerational links (Solon 1992; Corak 2006; Ekhaugen 2009;
Black and Devereux 2011; Raitano and Vona 2015; Berloffa, Matteazzi and Villa 2015a), or the
contemporaneous effects of the working conditions of family members (Stafford 1980; Payne 1987;
Berloffa, Matteazzi and Villa 2015b). All these studies, however, focus either on the employment
conditions of young individuals at a single point in time, or on year-to-year transitions (generally
modelled as conditional probabilities; Ward-Warmedinger and Macchiarelli 2013; Berloffa, Modena
and Villa 2014; Filandri, Nazio and Negri 2015).
In this chapter we focus, instead, on young people school-to-work trajectories, i.e. on the type of
sequence of employment statuses that characterizes their early labour market experience. In
particular, we examine whether the working conditions of parents and other family members at the
time when young people leave education affect the characteristics of their entry path. To this end, we
use monthly data on employment statuses from the 2009 to 2012 longitudinal waves of EU-SILC, to
construct individual trajectories covering a period of 36 months. We group these trajectories into
different types according to the methodology discussed in Berloffa, Mazzolini and Villa (2015), and we
estimate the effect of the household employment structure on the probability of experiencing one type
of trajectory or the other. We adopt a gender approach and consider cross-country and time
differences in macro-economic conditions and institutional settings.
1 More precisely, scholars agree that the vocational specificity of the educational system, on one side, and the

D 8.2 - Family strategies to cope with poor labour market outcomes 9
The contribution of this work is threefold. First, we examine the impact of the family employment
conditions on the entire labour market entry process of young individuals. Second, we distinguish the
working status of parents from that of other working-age family members, to check whether they have
different effects on youth school-to-work trajectories. We also consider separately the employment
status of the mother and the father to examine whether there exists a father-son and mother-daughter
type of effect. Third, we predict youth probability of experiencing a particular trajectory by the type of
household employment structure.
The rest of the chapter is organized as follows. Section 2.1 describes the data and discusses some
methodological issues. Section 2.2 presents our main empirical findings and section 2.3 concludes.
2.1 Data and methodology
Data, definitions and descriptive statistics 2.1.1Throughout this chapter we focus on young people aged 16-34 and use the 2009 to 2012 longitudinal
waves of EU-SILC,2 which cover the years from 2006 to 2012. We select individuals with at least
three consecutive interviews, who were living with at least one parent during the three years covered
by the three interviews, and who left education during the same period.3 We use monthly information
on employment statuses to identify school-to-work (STW) trajectories.4 In each month, individuals
can be either employed, unemployed, in education or inactive. STW trajectories are represented by
the specific combination of these four statuses over 36 months. Because of data limitations, we could
consider only the following 17 European countries: AT, BE, CZ, DK, EE, EL, ES, FI, FR, HU, IT, PL,
PT, SE, SI, SK, and UK.5
As discussed in Berloffa, Mazzolini and Villa (2015), individual trajectories are classified according to
the time needed to reach, and the pathway that led to, the first relevant employment spell i.e., an
employment spell that lasts for at least six consecutive months.6 We distinguish successful and
unsuccessful trajectories according to the achievement of a relevant employment spell, and we
identify various sub-types according to whether individuals experienced a small number of long
2 With the revisions released in August 2013. 3 EU-Silc panel data provide information only for family members who are present at the time of the interview. No information is available for family members living permanently or temporarily outside the household. 4 Since monthly employment information refers to the calendar year preceding the interview, the analysis will often refer to the period 2005 to 2011. Individuals with missing information about their main activity during the 36 months covered by the three interviews are not included in the analysis. 5 LU, IS, NL and IE are excluded because the sample size is too small. BG, CY, LT, LV, MT, NO, RO are excluded because the policy variables that we use in the econometric analysis are not available for them. 6 The definition of a relevant employment spell follows the EU-Silc convention according to which a six-month period identifies the first regular job and whether individuals ever worked. Moreover, six months are a reference length also for some labour market policies, such as the UK Government’s Youth Contract wage incentive, which has been in place from 2012 to 2014, paying an incentive to firms that recruited long-term unemployed young people for at least 26 weeks.

10 Berloffa, Filandri, Matteazzi, Nazio, Negri, O’Reilly and Sandor unemployment spells or a large number of short employment and unemployment spells. We also take
into account the decision of returning to education after a sufficiently long period in the labour market
or in inactivity. These criteria result in six different STW-types:
Successful pathways:
• speedy pathways: sequences which present a relevant employment spell within six months
after leaving education;
• long search pathways: sequences which present a relevant employment spell after more than
six months in unemployment and/or inactivity;
• in&out successful pathways: sequences which present a relevant employment spell after
various non-relevant employment spells, interspersed by short periods in unemployment or inactivity.
Unsuccessful pathways:
• in&out unsuccessful pathways: sequences similar to the previous ones, but which do not end
up in a relevant employment spell;
• continuous unemployment/inactivity pathways: sequences characterized only by spells of
unemployment/ inactivity.
Return to education pathways: sequences characterized by a spell in education of at least six
consecutive months, experienced more than six months after having left education.
Figure A.1 in the Appendix shows these six STW-types.
Table 1 reports the distribution of young individuals across trajectories according to their gender and
the year when they left education: the period 2005-2007 (pre-crisis) and the period 2008-2011 (during
the crisis). Overall, about half of our sample experienced a speedy trajectory. However, as expected,
young people who entered the labour market during the crisis were less likely to have a speedy
trajectory (46% vs. 57% of those who entered before the crisis) and more likely to experience
continuously unemployment or inactivity (32% vs. 17% respectively). The crisis had somewhat worse
consequences for males than for females. The share of males who entered the labour market in the
period 2005-2007 and had a speedy trajectory was around 59% while those who remained
continuously unemployed/inactive were roughly 15%. Among those who finished education in the
following three years (2008-2011), only 45% experienced a speedy trajectory, and about 32%
remained continuously at the margin of the labour market. The evidence is not so surprising since the
crisis hit mainly male-dominated sectors.
D 8.2 - Family strategies to cope with poor labour market outcomes 11
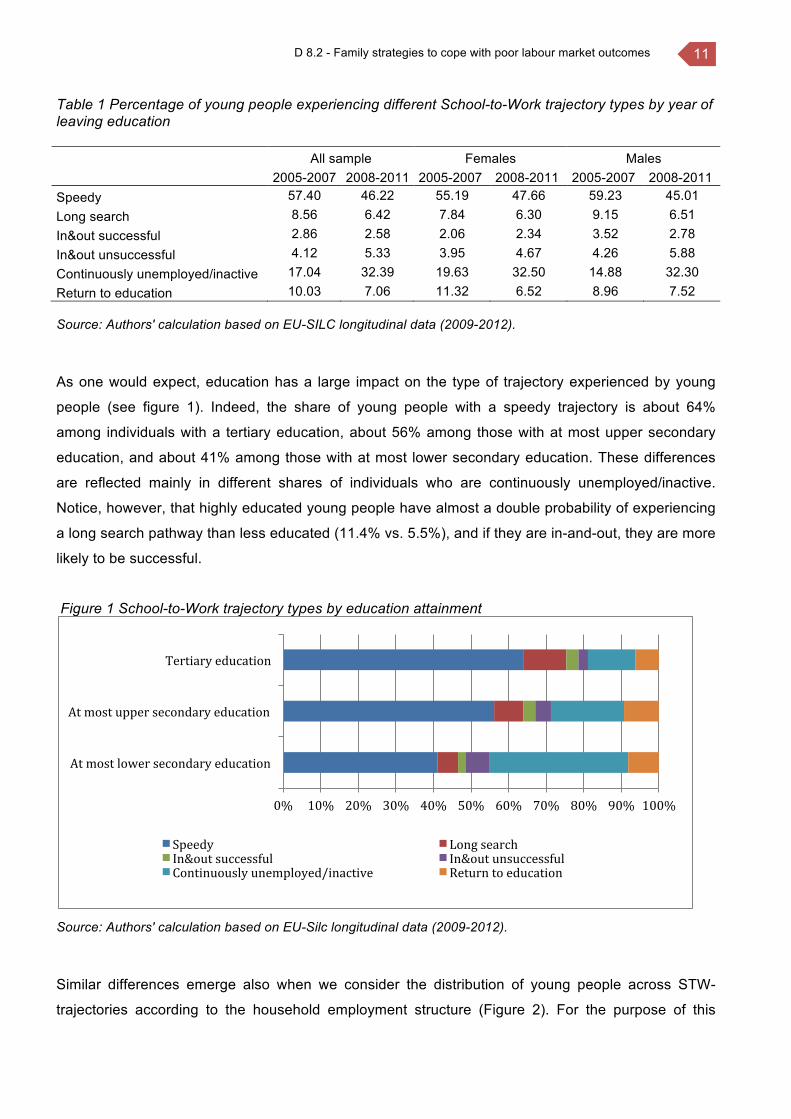
Table 1 Percentage of young people experiencing different School-to-Work trajectory types by year of leaving education
All sample Females Males
2005-2007 2008-2011 2005-2007 2008-2011 2005-2007 2008-2011
Speedy 57.40 46.22 55.19 47.66 59.23 45.01 Long search 8.56 6.42 7.84 6.30 9.15 6.51 In&out successful 2.86 2.58 2.06 2.34 3.52 2.78 In&out unsuccessful 4.12 5.33 3.95 4.67 4.26 5.88 Continuously unemployed/inactive 17.04 32.39 19.63 32.50 14.88 32.30 Return to education 10.03 7.06 11.32 6.52 8.96 7.52 Source: Authors' calculation based on EU-SILC longitudinal data (2009-2012).
As one would expect, education has a large impact on the type of trajectory experienced by young
people (see figure 1). Indeed, the share of young people with a speedy trajectory is about 64%
among individuals with a tertiary education, about 56% among those with at most upper secondary
education, and about 41% among those with at most lower secondary education. These differences
are reflected mainly in different shares of individuals who are continuously unemployed/inactive.
Notice, however, that highly educated young people have almost a double probability of experiencing
a long search pathway than less educated (11.4% vs. 5.5%), and if they are in-and-out, they are more
likely to be successful.
Figure 1 School-to-Work trajectory types by education attainment
Source: Authors' calculation based on EU-Silc longitudinal data (2009-2012).
Similar differences emerge also when we consider the distribution of young people across STW-
trajectories according to the household employment structure (Figure 2). For the purpose of this
0% 10% 20% 30% 40% 50% 60% 70% 80% 90% 100%
Atmostlowersecondaryeducation
Atmostuppersecondaryeducation
Tertiaryeducation
Speedy LongsearchIn&outsuccessful In&outunsuccessfulContinuouslyunemployed/inactive Returntoeducation
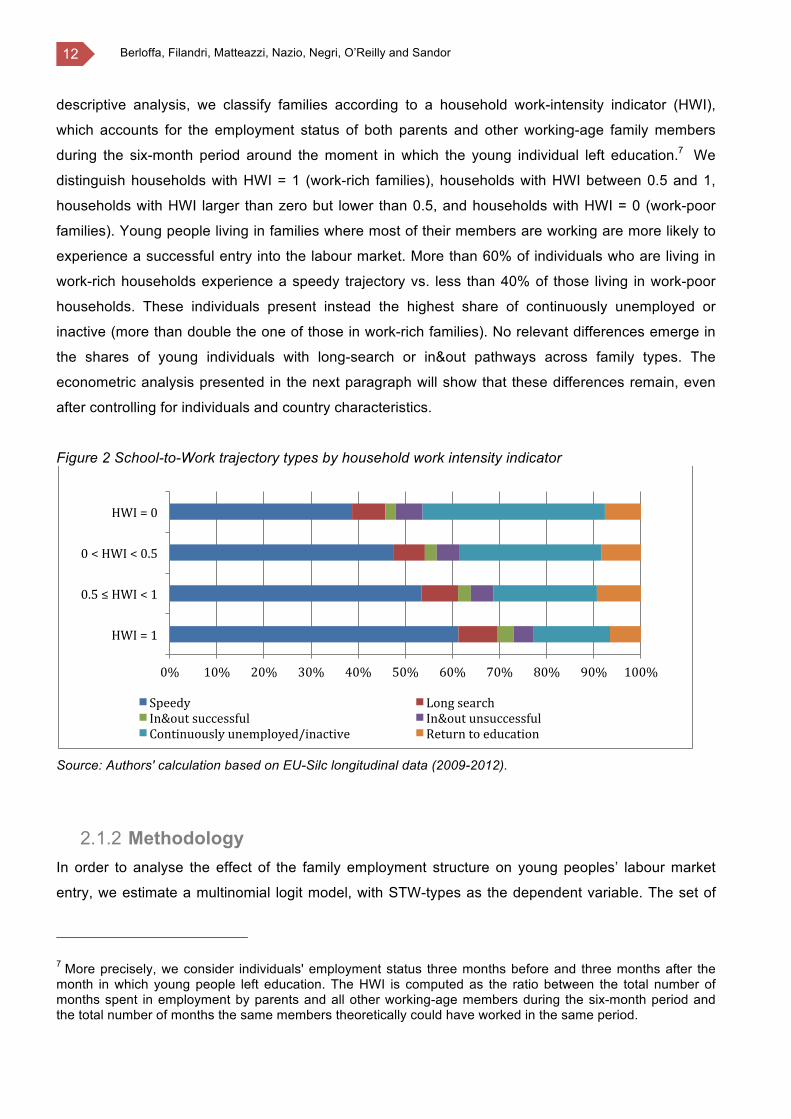
12 Berloffa, Filandri, Matteazzi, Nazio, Negri, O’Reilly and Sandor descriptive analysis, we classify families according to a household work-intensity indicator (HWI),
which accounts for the employment status of both parents and other working-age family members
during the six-month period around the moment in which the young individual left education.7 We
distinguish households with HWI = 1 (work-rich families), households with HWI between 0.5 and 1,
households with HWI larger than zero but lower than 0.5, and households with HWI = 0 (work-poor
families). Young people living in families where most of their members are working are more likely to
experience a successful entry into the labour market. More than 60% of individuals who are living in
work-rich households experience a speedy trajectory vs. less than 40% of those living in work-poor
households. These individuals present instead the highest share of continuously unemployed or
inactive (more than double the one of those in work-rich families). No relevant differences emerge in
the shares of young individuals with long-search or in&out pathways across family types. The
econometric analysis presented in the next paragraph will show that these differences remain, even
after controlling for individuals and country characteristics.
Figure 2 School-to-Work trajectory types by household work intensity indicator
Source: Authors' calculation based on EU-Silc longitudinal data (2009-2012).
Methodology 2.1.2In order to analyse the effect of the family employment structure on young peoples’ labour market
entry, we estimate a multinomial logit model, with STW-types as the dependent variable. The set of
7 More precisely, we consider individuals' employment status three months before and three months after the month in which young people left education. The HWI is computed as the ratio between the total number of months spent in employment by parents and all other working-age members during the six-month period and the total number of months the same members theoretically could have worked in the same period.
0% 10% 20% 30% 40% 50% 60% 70% 80% 90% 100%
HWI=1
0.5≤HWI<1
0<HWI<0.5
HWI=0
Speedy LongsearchIn&outsuccessful In&outunsuccessfulContinuouslyunemployed/inactive Returntoeducation

D 8.2 - Family strategies to cope with poor labour market outcomes 13
control variables includes individual characteristics, such as age and education, and country
characteristics. Among these, we consider country dummies and some variables that account for the
role of labour market institutions (active labour market policy expenditures per unemployed, 8
expressed as a percentage of GDP per capita,9 and OECD indicators of the strictness of the
employment protection legislation for regular and temporary contracts). 10 We also control for
household size and the presence of both parents. In order to capture the effect of business cycle
fluctuations, we include year dummies,11 and the country-specific GDP growth rate corresponding to
the year when the young person finished education.
Our main interest is on the role of family characteristics in influencing STWs. More precisely, for
parents and other working-age family members we use monthly employment status information
referring to the three months before and the three months after the month in which young individuals
left the education, and construct the following indicators. For each parent, we define three dummy
variables indicating whether, over these six months, he/she was always employed, never employed,
or partially employed (employed at least one month but less than six). For the other working-age
family members12 we construct a work intensity (WI) indicator as the ratio between the number of
months in employment of all working-age members (during the six months), and the potential number
of months the same members could have worked in the same period.13 We define three different
categories: WI = 1, 0 < WI < 1 and WI = 0. Since the work-intensity indicator would be equal to zero
both in the case where all family members did not work (during the six-month period) and in the case
where no other working-age family member is present, we add a dummy variable to control for the
latter case.14
8 Data are taken from the Eurostat LMP database. ALMPs include categories from 2 to 7. We run the same specifications with passive labour market policy expenditures (categories 8 and 9) and result are similar. For details on the definitions of these expenditures see Eurostat (2012). We could not enter both active and passive labour market policies because of the high correlation between the two variables (see Berloffa et al. 2015c). 9 See Scarpetta (1996), Nickell and Layard (1999), Boone and van Ours (2004), and OECD (2006). 10While the indicator for regular contracts (EPL-P) measures the strictness of the employment protection against individual dismissals, the indicator for temporary contracts (EPL-T) refers to the strictness of regulation on the use of fixed-term and temporary work agency contracts. A higher value of EPL-P indicates a greater difficulty for firms in firing workers, whereas a higher value of EPL-T indicates a greater difficulty for firms in hiring workers on fixed-term contracts or through temporary work agency contracts. Detailed methodology is discussed in OECD (2013).The value of EPL-P, EPL-T and ALMPs included in the regressions refers to the first year of the trajectory. 11 Year dummies refer to the year when young individuals have left education. Since individuals who left education in a later stage of the sequence may be less likely to have an in&out or a long search pathway, we control also for the number of months spent in education at the beginning of the sequence. 12Dependent children and persons aged over 65 and not employed are excluded from the indicator. Children are considered dependent if they are younger than 18 years old or aged over 18 but economically inactive. 13 Unfortunately, we cannot distinguish between part-time and full-time employment in our monthly data. 14 Notice, however, that the young individual may live with other persons in the households besides parents, such as brothers/sisters not in working-age, brothers/sisters in working-age but enrolled in education during the six-month period, persons older than 65 and not employed.

14 Berloffa, Filandri, Matteazzi, Nazio, Negri, O’Reilly and Sandor In order to check whether the role of the family employment structure changed over time (before and
during the crisis), we interacted all employment status indicators with a dummy variable indicating
whether the young individual left education during the crisis. However, since these interactions were
jointly not significant for both males and females, in the next section we present only the results of a
more parsimonious specification without interactions.15
2.2 Results Marginal effects 2.2.1
Estimation of a multinomial logit for trajectory types separately for females and males yielded the
results reported in tables A.1 and A.2 in the Appendix (expressed in terms of marginal effects for
selected variables). With respect to individual and country characteristics, education has, as
expected, large effects for both males and females. More precisely, the higher the educational level,
the higher is the probability of being speedy (10 to 17 percentage points higher for each educational
level) and the lower the probability of being continuously unemployed/inactive, and in&out
unsuccessful. Interestingly, having a tertiary education increases the probability of long search for
males, while it reduces that of returning to education for females. Among our policy and institutional
variables (ALMP expenditures and EPL indicators), only the regulation on permanent contracts
seems to have some effects on youth trajectories. Counter-intuitively, the more stringent the
regulation on individual dismissals, the higher is the probability of being speedy and the lower is the
probability of being continuously unemployed/inactive. For females, a more stringent regulation on
regular contracts also reduces the probability of being in&out unsuccessful.
Parents' education affects only the educational choices of their children. We find evidence of a father-
son and mother-daughter effect. Having a highly educated father raises the probability of returning to
education for his son, and, similarly, for mothers and daughters.16 Since parents’ education is
positively correlated with family permanent income, high parental educational levels could be
associated with a higher probability of long search because a higher family income may induce young
people to spend more time searching for a better job in terms of stability or skill-matching. However,
our estimates do not show this type of effect.
Parental working conditions are instead of crucial importance in explaining youth school-to-work
trajectories. For females, having a mother who worked continuously during the six-month period
increases the probability of being speedy and in&out successful, while it reduces the probability of
being continuously unemployed/inactive or in&out unsuccessful. The size of the effects is large and
similar to that of having an upper secondary educational level. A positive effect on the probability of
15 Results are available from the authors upon request. 16 See also Carneiro and Heckman (2004) and Björklund and Salvanes (2011).

D 8.2 - Family strategies to cope with poor labour market outcomes 15
being speedy is found also if the mother worked only some months, but in this case, there are no
effects on the other trajectory types. Generally, the working condition of the father has similar effects,
although somewhat smaller. However, if the father worked only some months, the only significant
effect is to increase female probability of being in&out unsuccessful. For males, the only significant
effects are associated with parents working continuously during the six-month period. In this case, for
both father and mother, we find similar positive effects on the probability of being speedy and
negative effects on the probability of being continuously unemployed/inactive. In other words, a stable
working condition of parents is associated with more favourable entry trajectories for their children,
whereas if the working condition of parents is unstable it has only some, not always positive, effects
on female trajectories.
The working status of other family members also affects significantly young people trajectories.
Specifically, when other working-age family members are employed (even if not all and/or not
continuously), the probability of a speedy trajectory is much higher and that of being continuously
unemployed/inactive much lower than in the case in which all other family members do not work.17
The size of the marginal effects is very large and similar across gender. Somewhat similar effects are
found if there are no other working-age family members in the household. In other words, there
seems to be a negative effect on the entry process of young people when all working-age household
members are not employed around the time when the individual leaves education. This negative
effect is overcome if either no other working-age family members are present, or if they work (at least
some of them for at least some months).
These results suggest that living in a family where someone works helps school-leavers to have a
rapid entry into the labour market. At the same time, living in a family with non-working parents
significantly raises youth probability of experiencing continuously unemployment or inactivity and the
latter further increases if also other members of the family are at the margins of the labour market.
Predicted outcome probabilities and odds ratios by family type 2.2.2In order to grasp the implications of our estimates, we computed predicted probabilities of being in a
particular trajectory by family type (where the family type is defined according to the working status of
both parents and other family members in working-age, if they are present) and use them to calculate
odd ratios. Thus, we compare, coeteris paribus, the overall effect of living, say in a two-parent work-
rich household or in a two-parent work-poor household, with or without other working-age family
members.18 Predicted probabilities are reported in table A.3 in the Appendix, while selected odds
17 For males, when other members are working, there is also a lower probability of returning into education and of being in&out unsuccessful. 18 We consider “fictitious” individuals who have all the individual characteristics equal to the sample mean, except for the presence and work experience of the parents and other family members.

16 Berloffa, Filandri, Matteazzi, Nazio, Negri, O’Reilly and Sandor ratios are shown in table 2. We consider the odds of being speedy and continuously
unemployed/inactive, that are the most representative trajectories, as well as those of returning to
education. Odds are set equal to one if the probabilities in the different types of household are not
significantly different.
Our estimates imply that, for example, a female in a two-parent household where both parents
worked continuously and there are no other working-age family members, has a probability of 73% of
being speedy and of 16% of being continuously unemployed/inactive. These probabilities become
54% and 34% respectively if both parents did not work. Furthermore, they become 38% and 53%
respectively if, besides parents there are other working-age family members, and none of them
worked. Similar evidence is found for males. This implies that, when no other members are present,
the probability of being speedy for a young person living in a work-rich household is about 30% higher
than for young individuals living in work-poor families. The probability of being continuously
unemployed is instead about a half. When other working-age family members, besides parents, are
present, odds are even larger. In this case, the probability of being speedy for young individuals living
in work-rich households is double the one for young people living in work-poor families, while the
probability of being continuously unemployed/inactive is more than 70% lower.
Comparing trajectory probabilities in work-poor households and in households where either parents or
the other working-age family members are working (mixed 1 and mixed 2 families in Table A.3), one
can see that it is sufficient that someone works to have a significantly higher probability of a speedy
trajectory, and a significantly lower probability of being continuously unemployed/inactive. Females
living in families where either both parents or all other working-age members are employed, have a
probability of being speedy that is almost 60% higher, and a probability of being continuously
unemployed/inactive that is more than 40% lower than females living in work-poor families (i.e., where
both parents and all working-age members are not working). Thus, for females, the working condition
of parents (jointly considered) and that of all other family members have similar consequences. The
same is true for males.19 For them, however, the working condition of parents and of other family
members have different effects on the probability of returning to education. When other working-age
family members are present, the probability of returning to education for young males living in work-
rich households or in families where only other family members are working is about a half compared
to young males living in work-poor households. In other words, males living in work-poor households
or in (large) families where other family members do not work are more likely to interrupt their
educational career for short periods and then return to education, probably because of the difficulties
encountered in entering the labour market.
19 For males, the working condition of other working-age family members seems to have larger effects than the working condition of parents. However, the probability of being speedy or continuously unemployed/inactive for young people living in families where parents do not work but other family members do (mixed 1) and those living in households where both parents work but other members do not (mixed 2) are not statistically different.

D 8.2 - Family strategies to cope with poor labour market outcomes 17
Table 2 Odds for the probability of being speedy or continuously unemployed/inactive and of returning to education Females Males
No other working-age family members (besides parents) are present: Work-rich vs Work-poor
Speedy 1.35 1.27 Continuously unemployed/inactive 0.47 0.44 Return to education 1.00 1.00
Other working-age family members (besides parents) are present: Work-rich vs Work-poor
Speedy 2.03 2.05 Continuously unemployed/inactive 0.26 0.21 Return to education 1.00 0.48 Mixed 1 vs Work-poor
Speedy 1.57 1.69 Continuously unemployed/inactive 0.57 0.50 Return to education 1.00 0.50 Mixed 2 vs Work-poor
Speedy 1.59 1.51 Continuously unemployed/inactive 0.56 0.52 Return to education 1.00 1.00 Mixed 1 vs Mixed 2
Speedy 1.00 1.00 Continuously unemployed/inactive 1.00 1.00 Return to education 1.00 0.42 Note: Mixed 1 denotes a family where parent are not working but all other family members are employed. Mixed 2 denotes a family where the parents are employed while other family members do not. Source: Authors' calculation based on EU-SILC longitudinal data (2009-2012). The role of the household working conditions on young people entry process did not change much
over time, except for males’ probability of experiencing a speedy trajectory.20 In Figure 3 we plot the
odds ratios of being speedy and continuously unemployed for young people living in work-rich and
work-poor households (when other working-age family members are present21). The corresponding
probabilities are reported in table A.4 in the Appendix. The relative advantage of females living in
work-rich households in terms of the likelihood of being speedy, slightly increased between 2006 and
2009 and then slightly decreased. For males, instead, the odds increased significantly from 2007 to
2010 (from about 1.7 to 2.7) and then decreased in 2011. This is mainly due to a different reduction in
the probability of being speedy for individuals living in work-poor and work-rich families. Indeed,
20Asalreadymentionedinsection2.2,wealsoestimatedamodelwithinteractionsbetweenemploymentindicatorsanda dummy variable indicating whether the young individual left education during the crisis (period 2008-2011). Theseinteractionswerejointlynotsignificant,forbothmaleandfemales.However,giventhenon-linearityofthelogitfunction,the odds are not constant over time, even though the estimated coefficients associatedwith the family employmentstructureareconstantovertime.21Similar results are also obtained for young individuals living in families where no other working-age individuals arepresent,besidesparents.

18 Berloffa, Filandri, Matteazzi, Nazio, Negri, O’Reilly and Sandor between 2007 and 2010, the probability of being speedy decreased from 50% to 27% in work-poor
families and from 84% to 72% in work-rich families. This means that during the crisis, young
individuals living in work-rich households were more protected from the increasing difficulties in
entering the labour market than their peers living in work-poor families, especially males.
Figure 3 Odds ratios (work-rich/work-poor) for the probability of being speedy or continuously unemployed/inactive by gender and year of exiting education
Source: Authors' calculation based on EU-Silc longitudinal data (2009-2012).
2.3 Working conditions of household members and youth transition trajectories
In this chapter we use the 2009 to 2012 longitudinal waves of EU-SILC to examine whether the
working conditions of parents and other family members at the time when young people leave
education affect youth integration process into the labour market. Following Berloffa, Mazzolini and
Villa (2015), we distinguish six possible school-to-work trajectories: 1) speedy; 2) long-search; 3)
in&out successful; 4) in&out unsuccessful; 5) continuously unemployed/inactive; 6) return to
education.
Descriptive statics show that the time when young people left education, their educational level and
the employment structure of the family of origin, all have large consequences for the type of trajectory
experienced by young individuals. In particular, those who entered the labour market during the crisis
(2008-2011), who are less educated, and who live in families where most of their members are not
working were less likely to have a speedy trajectory and more likely to experience continuously
unemployment or inactivity. For example, young individuals living in work-poor families have more
0.00
0.50
1.00
1.50
2.00
2.50
3.00
2005 2006 2007 2008 2009 2010 2011Speedy(Females)Continuouslyunemployed/inactive(Females)Speedy(Males)Continuouslyunemployed/inactive(Males)

D 8.2 - Family strategies to cope with poor labour market outcomes 19
than double the probability of being continuously unemployed or inactive compared with young
individuals in work-rich families.
The econometric analysis corroborates this evidence. Parental working conditions are of crucial
importance in explaining youth school-to-work trajectories. A stable working condition of parents is
associated with more favourable entry trajectories for both males and female school-leavers. The size
of the effects is large and similar to that of having an upper secondary educational level. The working
status of other working-age family members has also important consequences. There seems to be a
negative effect on the entry process of young people when all working-age household members are
not employed around the time when the individual leaves education. This negative effect is overcome
if either no other working-age family members, besides parents, are present, or if they work (at least
some of them for at least some months).
The relative probability of being in a particular trajectory for different family types is also quite
interesting. When no other members are present, the probability of being speedy for young individuals
living in work-rich households is about 30% higher than for those living in work-poor families. The
probability of being continuously unemployed is instead about a half. When other working-age family
members, besides parents, are present, odds are even larger. Our results suggest that it is sufficient
that someone in the family works, either parents or other working-age members, to have a
significantly higher probability of a speedy trajectory, and a significantly lower probability of being
continuously unemployed/inactive.
The role of the household working conditions on young people entry process did not change much
over time. However, during the crisis, young individuals living in work rich households were more
protected from the increasing difficulties in entering the labour market than their peers living in work-
poor families, especially males.
From a policy perspective, our empirical findings suggest that it is important to consider the
employment structure of young people families, at about the time when they leave education. In
particular, policy interventions should be targeted to young people living in households where parents
or other family members do not work. These interventions should focus both on young people
motivation, and on giving them access to an effective service of job search.

20 Berloffa, Filandri, Matteazzi, Nazio, Negri, O’Reilly and Sandor
3. Employment strategies: duration in unemployment and early entrance
3.1 Young people between studies and the labour market Here we focus, as in the previous chapter, on early labour market experiences. We do so in a
different framework, by focussing on the trajectories of young people upon completion of a secondary
or tertiary educational level. In this chapter we explore whether experience in unemployment at the
early stage of employment career reflects on the occupational conditions (pay & skill level) reached
by young individuals, net of individual and country characteristics. A transitory experience of low pay,
especially at an early stage, might not be as detrimental to young people's life course opportunities
and planning, as long term states of frailty such as low pay, unskilled or temporary employment.
In particular, we examine whether experiencing unemployment, discontinuity in employment or the
type of entry job at the time when young people leave education affects the characteristics of their
occupation three years later. For this purpose, we use monthly data on employment statuses from the
2005 to 2012 longitudinal waves of EU-SILC, to construct individual trajectories covering a period of
36 months following the completion of an educational level.
The departing point of this study is that, from a collective, institutional perspective, "any kind of job, be
it short-term, part-time or subsidized, is better than no job at all to forestall unemployment hysteresis
and deskilling." (Hemerijck & Eichhorst, 2010:327). However, from an individual level perspective, for
young people in the first years of their employment careers, is it really always that any job is better
than no job at all? A condition of unemployment, without income, carrying a consequent sizeable
amount of stress, easily makes any job seem better than being at home jobless, also from an
individual perspective. This view is also supported by several studies that testify of a positive relation
between happiness, social integration and occupational status. Specifically, being employed, even if
in a poor job, in the scholarly literature seems associated with a higher degree of happiness than
being unemployed. No differences in the level of reported happiness have instead been found
between inactive and employed (Layard, 2004). Job quality only matters to some extent, and often
people in bad jobs, on average, are still better off than those who remain unemployed (Grün et al.,
2010). However, previous research also found that being in a ‘low quality job’ is associated with lower
levels of self-reported life satisfaction and happiness, as compared to being in a ‘high quality job’
(Sànchez-Sànchez & McGuinness, 2013; Gallie 2013a; Green et al 2014); an association that holds
true across different institutional settings (Gallie 2007, 2009). The overall level of (dis)satisfaction can

D 8.2 - Family strategies to cope with poor labour market outcomes 21
be traced back to different factors: over-education, underemployment and employment conditions
(contractual forms and salary levels) (Peiró et al., 2010). Specifically, the literature has explored the
effects of several job characteristics and material circumstances of the job such as task autonomy,
economic and personal rewards, a stimulant and supportive environment, training opportunities,
contract security, work pressure and job control, among others (Gallie 2012; Gallie et al 2012; Gallie
2013b). Occupations can thus be distinguished along the lines of several characteristics that structure
(and contribute to define) ‘good’ from ‘bad’ jobs. Among these there are several material (monetary
and non-monetary) as well as non-material characteristics (Jencks et al., 1988). We can easily
imagine that higher quality jobs are associated with higher educational levels (thus more task
complexity, autonomy and control), higher salaries and thus higher degree of satisfaction. If we were
to build a scale of young people’s positions on the labour market on the basis of these three
characteristics, a picture like that of figure 4 would emerge. In there (Fig. 4) at the bottom level are the
unemployed people, followed by inactive, those employed in low quality jobs and, at the top, those
holding high quality jobs.
Figure 4 Scale of occupational positioning based on skills, wage and satisfaction
Figure 4 well reflects the argument that any job is better than no job. However, what could be a
reasonable choice for first job seekers might not necessarily hold true also in a long(er) time
framework, considering the long-term career goal of reaching well paid, good quality jobs. It is thus
important to explore which are the most effective strategies, those with highest pay-offs for young
people, for reaching this longer-term objective of a successful integration in the labour market. With
respect to long(er) term outcomes, is it better for young people to accept the first job offer being
achieved, or is it better to wait somewhat longer for a better match? In other words, beyond the
personal satisfaction in the short term and in face of increasingly precarious labour markets
(Wulfgramm & Fervers 2015), we investigate the effectiveness of different strategies for young people

22 Berloffa, Filandri, Matteazzi, Nazio, Negri, O’Reilly and Sandor on their securing a positive occupational outcome in the process of labour market integration. In this
respect, whereas the job search behaviour is strategic in all phases of one’s employment career, it is
particularly so for new entrants at their early experiences. A longer wait at entrance for securing a
better employment match, with familial resources mediating young people’s aspirations and
supportive of longer wait for a better match or prospect, may also be pursued to avoid
intergenerational downward mobility, especially by those families that have experienced upward
moves in the previous generation (Bernardi 2007). Or it might be one of the ways through which
wealthier families guide their children more effectively towards successful employment routes, even
net of their educational credentials and qualifications, as MacKnight (2015) suggests for the United
Kingdom (chapter 4 will focus more clearly on this).
In this chapter we will try to answer to several questions related to young people’s strategies in the
labour market, to which the following sections are devoted: (1) does a longer time in unemployment
lead to access a better job? (section 3.4.1); (2) does employment continuity influence the chances of
accessing a better job? (section 3.4.2). In the next chapter, we will continue with: (3) does a bad entry
job lead to more adverse employment outcomes later and, conversely, a good entry job lead to better
employment outcomes later (section 4.1)? Does social class of the families of origin mediate their
children strategies and outcomes in the labour market (section 4.2)?
For answering to all these questions, we use both cross-sectional (2011) and longitudinal data from
EU-SILC surveys from 2005 to 2012, focussing on five selected countries, representative of the
variety of ‘youth transition regimes’ (Walther 2006). We chose to adopt Walther’s theoretical model
because of its specific focus on youth in the transition from school to work and for its comprising
those aspects framing the institutional settings, which affect most young people’s entrance into the
labour market. We also claim that is the combination of different structures (welfare regimes (Gallie
and Paugam, 2000); work and structure of employment (Shavit and Müller, 1998; Gangl 2003) and
educational and training systems (Allmendinger, 1989; Müller & Gangl 2003)), which results in the
particular design of programmes for youth around employment (opportunities) and unemployment
(risk and protection). Young people’s biographies are embedded within transition systems, so that
their aspirations and strategies reflect the resources and opportunities they perceive as functional and
legitimate. Also on the basis of the available sample sizes, we selected one country per transition
regime: Finland for the universalistic regime, the UK for the liberal, France for the employment-
centred, Italy for the sub-protective model and Poland (we add to the original model) for the eastern
European group of countries.
We selected young people (aged 16-34) who successfully completed a spell in education resulting in
a higher educational level by their second interview and followed them for their successive 3 years.
Analytical sample comprises all individuals with four valid interviews. Before detailing the analyses on
the different strategies to enter the labour market, in the next section we will illustrate the
D 8.2 - Family strategies to cope with poor labour market outcomes 23
characteristics of the respective youth transition regimes and institutional contexts for the countries
under study.
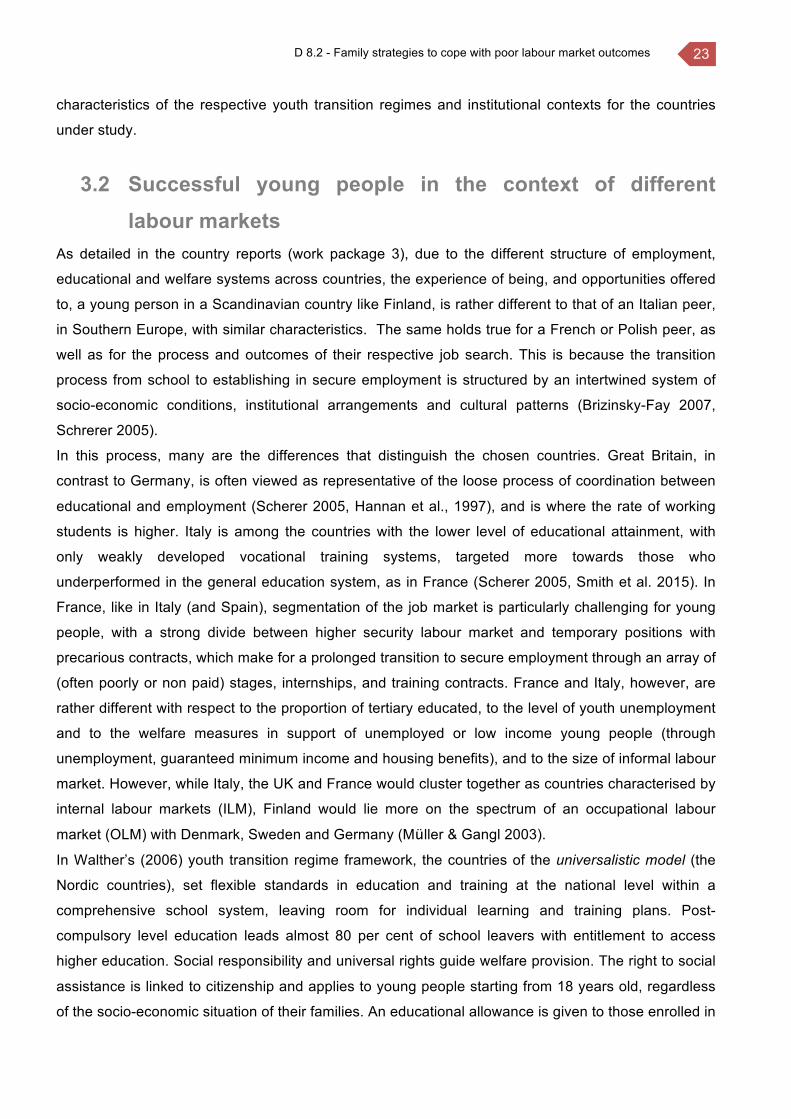
3.2 Successful young people in the context of different labour markets
As detailed in the country reports (work package 3), due to the different structure of employment,
educational and welfare systems across countries, the experience of being, and opportunities offered
to, a young person in a Scandinavian country like Finland, is rather different to that of an Italian peer,
in Southern Europe, with similar characteristics. The same holds true for a French or Polish peer, as
well as for the process and outcomes of their respective job search. This is because the transition
process from school to establishing in secure employment is structured by an intertwined system of
socio-economic conditions, institutional arrangements and cultural patterns (Brizinsky-Fay 2007,
Schrerer 2005).
In this process, many are the differences that distinguish the chosen countries. Great Britain, in
contrast to Germany, is often viewed as representative of the loose process of coordination between
educational and employment (Scherer 2005, Hannan et al., 1997), and is where the rate of working
students is higher. Italy is among the countries with the lower level of educational attainment, with
only weakly developed vocational training systems, targeted more towards those who
underperformed in the general education system, as in France (Scherer 2005, Smith et al. 2015). In
France, like in Italy (and Spain), segmentation of the job market is particularly challenging for young
people, with a strong divide between higher security labour market and temporary positions with
precarious contracts, which make for a prolonged transition to secure employment through an array of
(often poorly or non paid) stages, internships, and training contracts. France and Italy, however, are
rather different with respect to the proportion of tertiary educated, to the level of youth unemployment
and to the welfare measures in support of unemployed or low income young people (through
unemployment, guaranteed minimum income and housing benefits), and to the size of informal labour
market. However, while Italy, the UK and France would cluster together as countries characterised by
internal labour markets (ILM), Finland would lie more on the spectrum of an occupational labour
market (OLM) with Denmark, Sweden and Germany (Müller & Gangl 2003).
In Walther’s (2006) youth transition regime framework, the countries of the universalistic model (the
Nordic countries), set flexible standards in education and training at the national level within a
comprehensive school system, leaving room for individual learning and training plans. Post-
compulsory level education leads almost 80 per cent of school leavers with entitlement to access
higher education. Social responsibility and universal rights guide welfare provision. The right to social
assistance is linked to citizenship and applies to young people starting from 18 years old, regardless
of the socio-economic situation of their families. An educational allowance is given to those enrolled in

24 Berloffa, Filandri, Matteazzi, Nazio, Negri, O’Reilly and Sandor formal education or training. In Finland, students are exempted from paying tuition fees at public
universities and polytechnics. Counselling is widespread across all stages of education, training and
transition into employment, and is intended to orient individuals for reinforcing thir motivation for
personal development and individual choice.
In the liberal transition regime (UK and Ireland) individual rights and self-responsibilities prevail over
collective provisions. In most of UK a comprehensive school system reaches until 16 years, after
which, recently, the post-compulsory stage has been developed and diversified for granting more
space for vocational and academic routes. Welfare provisions start at age 18, with entitlement to
jobseeker’s allowance tied to citizenship, but with a low level of benefits, time-limited and conditional
on active job search. An emphasis on economic independence is backed by a flexible labour market,
with many access options, but with a generally low qualification of the workforce (Walther 2006).
The employment-centred transition regime comprises Germany and the Netherlands along with
France (in this study). Schooling is designed to allocate young people’s occupational careers in
different segments (in France, vocational training is school-based rather than company-based as in
Germany), and tuition fees in public universities are very low by international comparison (capped for
undergraduate studies). Labour markets are segmented between a highly standardized, protected
core and precarious peripheries (Walther 2006, Smith et al 2015). Welfare provisions reflect this
segmentation with higher level of compensation through social insurance schemes for those included
in standard work arrangements and a residual social assistance-based system for the rest, with
young people not automatically covered unless have contributed a certain amount to the social
insurance scheme. In this regime young people struggle their way between restricted options for
individual choice and strong demands from (and incentive to) standard trajectories.
The sub-protective transition regime includes the southern European countries (Italy in this study).
Here schooling is structured comprehensively until the end of compulsory education, while vocational
training is poorly developed and mainly confined to poor performers in the general system. Due to the
low intensity of technological development of the productive system and the economic weakness of
many regions, youth transitions often imply a long waiting phase also for highly educated. Young
people are not entitled to any social benefits and most often engage in precarious jobs, either in the
informal economy or in fixed-term contracts. Labour market segmentation, poorly performing industry,
blocked public employment recruitment, increasingly flexible service sector (with contracts by the
month or by the day, directly by enterprises or through temporary work agencies) and high degree of
informal work contribute to very high rates of youth unemployment. Labour market policies focus
mainly on further liberalisation of temporary contracts (Bernardi and Nazio 2005) with the intended
scope of creating employment, through incentives for employers (e.g. subsidies or reduced
contribution for training contracts, more recently the Jobs Act), ease to dismissal, development of
career guidance and assistance into self-employment. This transition system does not increase young
D 8.2 - Family strategies to cope with poor labour market outcomes 25
people's choice, flexibility or security, which depend instead on the extent of family support and
access to informal work for bridging long waiting periods.
The educational system in Poland comprises three main, hierarchical levels from primary school to
upper secondary school. All pupils proceed through lower-secondary school before tracking between
higher performers, most likely to purse general or technical high school, and lower performers, usually
choosing basic vocational schools (an infrequent option, like in France and Italy). Although recent
trends show rising interest in vocational schools at the expense of general education, and despite
numerous systemic changes in the past few years, the mismatch between the skills requested and
those provided in vocational schools remain to be bridged (Ślęzak and Szopa 2015). The vocational
training system is supplemented by the crafts system, where various certificates and professional
titles can be obtained. Although professional qualifications may be gained through various paths
(courses, external examinations, post-secondary training), the rather complex and highly regulated
nature of the educational system does not allow for flexibility between various paths. Both general
and professional high schools allow access to tertiary education, but there is an increasing gap
between the growing number of graduates and the number of skilled jobs openings available.
Working students, upon studies completion, have an easier transition to the labour market. Also in
Poland higher education lowers the risk of unemployment, and the highest rate is registered among
young people with primary education (Ślęzak and Szopa 2015).
These contextual differences are reflected in young people’s decisions around education and
employment, (length of) unemployment or inactivity in each country. With Italy, France and Germany
reflecting a higher tension between core and peripheral positions in the labour market for those
employed (Schmid 2008) following the liberalization in the use of more flexible jobs (for a review on
precariousness and insecurity, see O’Reilly et al. 2009) and welfare retrenchment with reduction of
social benefits in Bismarckian countries (Hemerijck and Eichhorst 2010). For example, the proportion
of students in a country will depend on individual people’s situated choices, aspirations and
dispositions, but also on the structure of their respective educational systems and on the average
lengths of the different educational routes and degree of enrolment in tertiary education (its cost,
access, financial or housing support, etc). The proportion of inactive, unemployed or employed young
people will also be a function of the respective labour markets (Gallie 2007a, 2007b, 2013, Van
Lancker 2012, Hipp et al. 2015), timing and modes to family formation (Gassen and Perelli-Harris
2015, Billari and Liefbroer 2010, Kalmijn 2007, Perelli-Harris and Lyons-Amos 2015), gender division
of labour therein (i.e. the ‘work-family articulation’) (Crompton and Lyonette 2006, Daly 2011, Orloff
1993) and not least of the regulation of labour market and income support measures (Palier 2010,
Gallie and Paugam 2000, Barbier 2011, Leschke 2008).

26 Berloffa, Filandri, Matteazzi, Nazio, Negri, O’Reilly and Sandor Table 3 Share of sample in each occupational status by country Employed Unemployed Student Inactive Total NFinland 61.8 5.5 26.0 6.7 100 238France 38.8 7.2 50.7 3.3 100 720Italy 40.8 9.8 38.5 10.9 100 814Poland 53.7 10.3 28.2 7.8 100 695UnitedKingdom 67.3 8.5 17.0 7.2 100 223
Source: Authors’ calculation on EU-SILC (unweighted)
As we can see in Table 3, different national contexts are associated with different the proportion of
young people in each occupational status. We thus observe that Finland, together with the UK,
displays the higher rate of young people in employment. In Finland, however, unlike in the UK, a
much greater proportion of our sample, over 70%, is found working in skilled occupations (results
available on request). Employment rates are lower in Poland, followed by Italy and France, which
have in turn a higher rate of young people pursuing further education. The rate of inactive young
people is highest in Italy, the country with the highest prevalence of NEETs, temporary and informal
work for young people. These preliminary figures testify a rather heterogeneous scenario in which
young people’s agency can be deployed, depending on their countries of residence for their
economies and systems of social protection.
Not only the occupational status, but also the proportion of young people found in different
occupational classes, for those employed, is a function of both individuals’ preferences and
characteristics, and of the different set of constraints and opportunities set by the characteristics of
the labour markets, welfare and family models in each of the countries. Occupational characteristics,
especially task complexity (as proxied by occupational skills in this study) is in turn a predictor of
employment likelihood of success (Reichelt 2015).
In this chapter we are interested in the strategies young people adopt in the process of establishing
successfully in the labour market. We will now explore in turn which elements might affect the rate of
success of young people’s experiences, testing whether individuals’ employment strategies are
enacted as response to different originating mechanisms across countries.
3.3 The way to a better job: quick entrance and few interruptions
Longer periods in unemployment are often the outcome of two different circumstances being faced in
the labour market. The first is the difficulty of finding a job: those looking for employment and ready to
start immediately, but who can not find paid work. The second circumstance for being unemployed is
not having taken up a job being offered. The choice to be selective and take the uncertainty and risk
of a long(er) wait, rather than accepting ‘any’ job, inevitably postpones the onset of one’s occupational

D 8.2 - Family strategies to cope with poor labour market outcomes 27
career and prolongs the duration in unemployment, but it could also be seen as a strategic move.
This is so for any job seekers, but becomes more salient for young people who are moving from
education to work for the first time. It is particularly significant for those attempting to enter internal
labour markets compared to those in systems with generalist education (Müller & Gangl 2003). We
could understand this choice within the framework of a rational strategy oriented towards the
satisfaction of one’s preferences with respect to long term income and employment stability. Empirical
evidence shows that beginning a professional career with a ‘bad job’, i.e low skilled, low paid, or both,
can become a real career trap (Barbera et al. 2010, Barone & Schizzerotto 2011, Gash 2008,
Reichelt 2015), in several European countries (Barone et al. 2011, Blossfeld et al. 2008, Bukodi &
Goldthorpe 2011, Hillmert 2011, Wolbers et al. 2011, Schrer 2005). Indeed, upward moves in the
labour market depend not only on the readiness and availability to pick up emerging opportunities, but
also on the ability to wait for the ‘right opportunity’. Especially at the early stages of one’s career, the
opening of opportunities might often entail good perspectives from initially unstable and poorly paid
jobs (e.g internships, stages, short term training contracts). However, in order to avoid the negative
consequences of speedy integration into poor quality jobs (Hipp et al 2015), young people will incur
longer unemployment spell(s). We explore the effects of both unemployment duration and
employment continuity on the likelihood to obtain a ‘good job’ three years after achieving a secondary
or tertiary educational qualification.
3.4 Good and bad jobs: a typology of successful outcome Using the dimensions of skills and wages we distinguish four possible states: ‘successful’ (high wages
and high skills) ‘investment’, ‘need’, and ‘failure’ (Fig 5). A ‘successful’ state is when a young people
enter a skilled and well-paid job. An ‘investment’ state is where a skilled position has been reached at
the trade-off of a lower salary. Jobs requiring higher skills or qualifications may initially be poorly paid
to begin with, but over time can result in much better wage returns. Well-paid is defined as above the
median wage of all employed individuals in each country each year.22
Figure 5 Typology of occupational positioning based on skills and wage
22 Country and yearly-based figures computed on annual wages of full-time employed.

28 Berloffa, Filandri, Matteazzi, Nazio, Negri, O’Reilly and Sandor Skilled occupations are defined on the basis of ISCO-88 codes: high-skilled non-manual occupations
(ISCO 11–34), low-skilled non-manual occupations (ISCO 41–52), skilled manual occupations (ISCO
61–83) and elementary occupations (ISCO 91–93) (Pintelon et al. 2011: 56-57). We considered both
manual and non-manual skilled occupations.
Duration in unemployment and employment outcomes 3.4.1We now turn to the role of unemployment duration. Young people in the first years of their
employment careers, upon study completion, can ideally manage a quick insertion in the labour
market and pursue a continuous attachment. But they may instead remain out of employment for
longer, either voluntarily, because they choose to wait longer, or involuntarily, because they are
unable to find a suitable job. We now test the effect of unemployment duration in the early phase of
young people career on the probability to access to a high wage occupation, a skilled occupation, or
both conditions jointly (a ‘success’ state). We codified the overall duration in unemployment over the
48 observation months (Fig 6). ‘None’ refers to individuals who either had no periods, or a maximum
of one month in unemployment. ‘Short’ refers to those with up to 6 months of unemployment; and
‘medium-long’ to those who experienced a total period of unemployment spell(s) lasting longer than 6
months. The sample comprises all individuals with 4 completed interviews, and who were employed
in the last observation.
Figure 6 Probability to be in a high wage, skilled or successful job by age and unemployment duration.
Source: Authors' calculation based on EU-SILC longitudinal data (2005-2012).

D 8.2 - Family strategies to cope with poor labour market outcomes 29
We ran separate logit models on EU-SILC longitudinal monthly data, predicting the occupational
condition reached three years after completing a secondary or tertiary qualification, for those
employed. Three different models explored the probability, for those employed, to be found in a high
wage occupation, in a skilled occupation or to be in a ‘success’ state (both high wage and skilled
occupation). Results for the effect of the average effect for the duration in unemployment of the three
models are shown jointly in Figure 6. All models use controls for age, gender, educational level,
country and number of employment episodes.
The probability to be found in a high wage position after three years (top left graph) is lower for those
aged over 24, with a medium-long duration (more than 6 months) of total unemployment compared to
those who had no record, or less than 6 months of having being unemployed. Having being
unemployed for less than six months did not make for any observable difference in getting a high
skilled occupation compared to those who had never been unemployed. However, differences in the
effect of unemployment duration were more perceptible on wage attainment than on reaching a
skilled occupation after 3 years (top left graph).
Each model has been tested also for interaction effects between country dummy variables and
duration in unemployment, an effect that did not prove statistically significant. This lack of significance
in the interaction term points to country specific ‘baseline’ probabilities to be in each state (high skills,
high wage or successful occupation), but not to different effects of the duration in unemployment
across countries. Lack of statistical significance may either be due to a small sample size, or to a
similar mechanism, across countries, linking length of unemployment to successful outcomes
(especially wages).
Continuity in employment and employment outcomes 3.4.2
We further explored any effects of the entry process on the employment outcome three years after
obtaining a qualification. Specifically we tested for effects due to the timing of unemployment. We
distinguished between those with few unemployment spells during the search for a first job, and the
frequency of unemployment (i.e. the number of job interruptions). We examine the results on the
effect of continuity in employment, where ‘continuity’ is defined as having none or only one spell of
unemployment. In other words the current employment situation is achieved with no interruptions, or
at most one, rather than with more frequent interruptions (intermitted employment).

30 Berloffa, Filandri, Matteazzi, Nazio, Negri, O’Reilly and Sandor Figure 7 Probability to be in a high wage, skilled or successful job by continuity in employment.
Source: Authors' calculation based on EU-Silc longitudinal data (2005-2012).
The results (Figure 7) show that continuity in employment does not have any clear statistically
significant effect on either the skills levels of the occupation achieved or the ‘success’, if employed,
after three years from obtaining a secondary or tertiary qualification. However, for those who are older
than 24 years, high wage are more likely for those who have been continuously employed (graph in
the top left part of Figure 7, High wage).
Continuity has a marginally significant effect on the probability of being in a ‘successful occupation’ for
the younger group (19-24 years) (bottom left graph of Figure 7, confidence intervals at the 95% level).
This points to a small positive effect of a quick entry: the shorter the search, i.e. the quicker the entry
after finishing education, the slightly more likely they are to be found in a successful occupation.
Again, no statistically significant effect was found for the interaction term between country and
continuity. These results suggest that both employment continuity and taking less time to find a first
job have some advantages, they are not as great as we might have expected.
To summarise, we detected some small effects on the employment outcomes investigated (high
wage, skilled employment or ‘success’ occupation) from entering quickly or not spending too long in
unemployment during this relatively short time window of observation (three years). This could be
specific of the early stage of the employment career, confirming that, despite a clear but not strong

D 8.2 - Family strategies to cope with poor labour market outcomes 31
advantage of continuous employment attachment and an early start, a short-term period of
unemployment does not appear to impair subsequent outcomes as much as we might have expected.
It is the medium-long experience of unemployment (of 6 or more months over the three years) that
has the greater impact; whether this experience is in a single short spell or in the accumulation of
several shorter spells, longer periods of unemployment clearly negatively affect the chances of
occupational success, especially in terms of wages, and for those aged 24 and older (Figure 6). A
slightly longer initial wait before first entering employment, or a turbulent beginning (Figure 7), seems
to affect the wage dimension the most for those over 24. For younger workers these factors have
more of an impact on their likelihood of making a transition to ‘successful’ job.
Net of the country differences in the proportion of young people being employed and experiencing the
measured outcomes, we found no differences by country specific differences in mediating the effects
of either continuity in employment or unemployment duration.
In the next chapter we examine access to occupations after graduating from school or college and the
effect on the kind of job achieved three years later.

32 Berloffa, Filandri, Matteazzi, Nazio, Negri, O’Reilly and Sandor
4. Employment strategies: better start and social class of origin
4.1 Earlier entrance or waiting for a better start?
The analyses presented so far seems to support the idea that any job is always better than
joblessness. But is it really this the entire account? The empirical evidence presented so far is not
enough to show how young people are not being trapped into poorly paid and low qualified jobs. What
it shows instead is that there seem to be career tracks (early entrance and few interruptions) that
overall lead to more favourable outcomes. To deepen our understanding it becomes crucial to explore
further young people’s initial position in the labour market. We will now turn to the changes between
the first job held the year after educational spell completion and that observed three years after (for
those employed).
We analyse young people’s occupational position the year after upper secondary or tertiary degree
completion, by way of the typology presented in Figure 5. The distribution of individuals across
categories in the five countries considered varies considerably (Figure 8). The shares of young
people reaching a condition of ‘successful occupation’ by the fourth year are higher in Finland and the
UK. By contrast, the smaller shares are registered in France and Italy (two countries with generalist
education systems and a strongly dualised labour market). These two latter countries are also those
with the higher share of youth still in education. Worth noticing also how the share of young people in
a ‘investment’ condition, i.e. that of a skilled occupation but paid below the median income, is very
similar across the five countries, only slightly lower in the UK. These differences are easily traced
back to those previously observed and recall the relevance of the different institutional contexts (see
section 3.2). Here we will not focus directly on how the occupational conditions of young people
change across different countries (reflecting their institutional contexts), but rather if the strategies
pursued by young people are different across countries in their effects. In other words, regardless of
the larger or smaller amount of ‘success’ positions observed in each country, we will investigate which
are the most effective strategies for young people to reach them. Specifically, we will focus on the
relevance of a ‘good employment entry’, with a good matching in skilled occupations.
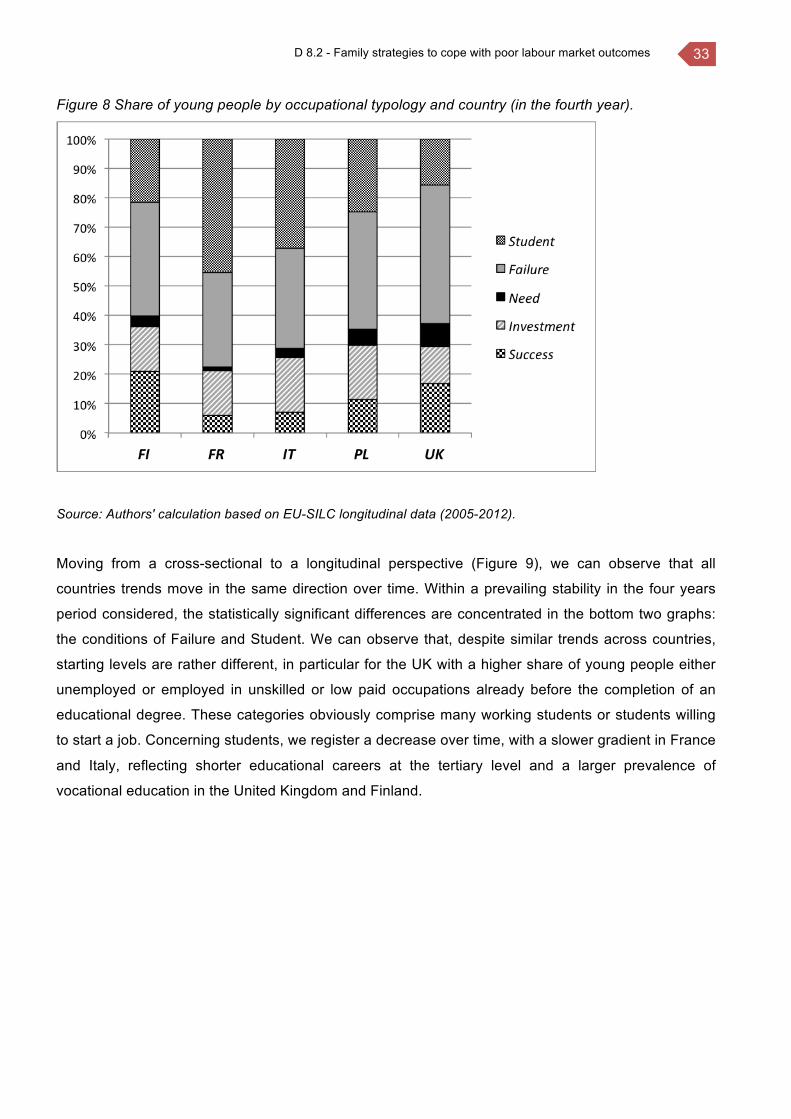
D 8.2 - Family strategies to cope with poor labour market outcomes 33
Figure 8 Share of young people by occupational typology and country (in the fourth year).
Source: Authors' calculation based on EU-SILC longitudinal data (2005-2012).
Moving from a cross-sectional to a longitudinal perspective (Figure 9), we can observe that all
countries trends move in the same direction over time. Within a prevailing stability in the four years
period considered, the statistically significant differences are concentrated in the bottom two graphs:
the conditions of Failure and Student. We can observe that, despite similar trends across countries,
starting levels are rather different, in particular for the UK with a higher share of young people either
unemployed or employed in unskilled or low paid occupations already before the completion of an
educational degree. These categories obviously comprise many working students or students willing
to start a job. Concerning students, we register a decrease over time, with a slower gradient in France
and Italy, reflecting shorter educational careers at the tertiary level and a larger prevalence of
vocational education in the United Kingdom and Finland.
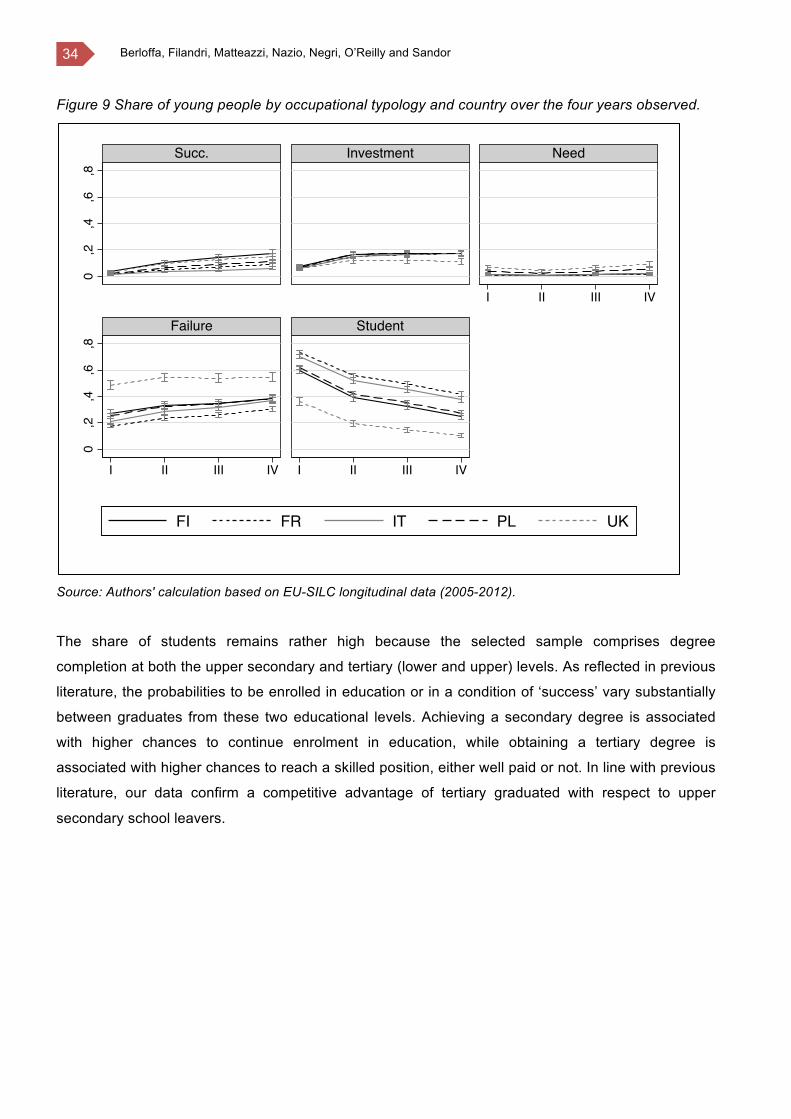
34 Berloffa, Filandri, Matteazzi, Nazio, Negri, O’Reilly and Sandor Figure 9 Share of young people by occupational typology and country over the four years observed.
Source: Authors' calculation based on EU-SILC longitudinal data (2005-2012).
The share of students remains rather high because the selected sample comprises degree
completion at both the upper secondary and tertiary (lower and upper) levels. As reflected in previous
literature, the probabilities to be enrolled in education or in a condition of ‘success’ vary substantially
between graduates from these two educational levels. Achieving a secondary degree is associated
with higher chances to continue enrolment in education, while obtaining a tertiary degree is
associated with higher chances to reach a skilled position, either well paid or not. In line with previous
literature, our data confirm a competitive advantage of tertiary graduated with respect to upper
secondary school leavers.
0,2
,4,6
,80
,2,4
,6,8
I II III IV
I II III IV I II III IV
Succ. Investment Need
Failure Student
FI FR IT PL UK

D 8.2 - Family strategies to cope with poor labour market outcomes 35
Figure 10 Typology by educational level (in the fourth year).
Source: Authors' calculation based on EU-SILC longitudinal data (2005-2012).
These findings suggest turning the analyses to the occupational condition three years after
educational level completion, separately by educational level achieved. To explore the effect of entry
occupational conditions on the job held three years after (using the typology devised in Figure 5), we
estimated multinomial logit models with EU-SILC longitudinal data, separately for secondary and
tertiary educated, adopting controls for age, country and sex. Interaction effects with reference
country have been estimated but the effect estimates were not statistically significant.
0%
10%
20%
30%
40%
50%
60%
70%
80%
90%
100%
Secondaryeducation
Tertiaryeducation
Student
Failure
Need
Investment
Success

36 Berloffa, Filandri, Matteazzi, Nazio, Negri, O’Reilly and Sandor Figure 11 Difference in probabilities for every occupational status as compared to being students, (secondary education)
Source: Authors' calculation based on EU-SILC longitudinal data (2005-2012).
Results are displayed in Figure 11, which shows the difference in probabilities for every occupational
status as compared to being students, for every initial condition. The figure shows a high persistence
for all statuses. For those who accomplished a secondary level of education, being in a ‘failure’ state
has a higher probability to remain so after three years (Failure graph in Figure 11, point above the
line). It is so for all other statuses as well: need, investment and success. However, as can be seen in
the graph at the top-left part of the figure, those who were initially in an ‘investment’ state have also
somewhat higher chances to be found in a ‘success’ status later (Success graph in Figure 11, second
point above the line). This effect is small but statistically significant. The effect of ‘investment’ goes in
the same direction but is stronger for tertiary graduated, as can be seen in the second graph
(Success graph in Figure 12, second point above the line). For highly educated the results are very
similar, if not for a much higher efficacy of the ‘investment’ status (a skilled job initially lowly paid).
This effectiveness, accepting a matching job even if poorly paid at the beginning but with an
increasing return over time, qualifies these choices as a possible real strategic move in the labour
market.
-,5
0
,5
1
-,5
0
,5
1
Succ.Investm.Need Failure Stud.
Succ.Investm.Need Failure Stud.Succ.Investm.Need Failure Stud.
Success Investment Need
Failure Student
Secondary education

D 8.2 - Family strategies to cope with poor labour market outcomes 37
Figure 12 Difference in probabilities for every occupational status as compared to being students, (tertiary education)
Source: Authors' calculation based on EU- SILC longitudinal data (2010-2012).
4.2 Employment strategies by family of origin
We have so far seen how the probability to be in one of the four outcome states of the proposed
typology (success, investment, need or failure, see Figure 5) varies according to the duration in
unemployment experienced, to the continuity of employment and to the conditions of entry into the
labour market. We now inspect further how it varies according to their social class of origin. We have
used for this purpose the cross-sectional EU-SILC 2011 data, which contain a special ad-hoc module
on intergenerational transmission of disadvantages. In this module it is possible to obtain information
on the educational level achieved by young people’s parents, also for those who have already left the
family of origin.23 The subsample for our analysis comprises all young people below 34 years who
23 Building an indicator on the social class of origin on the basis of available Eu-Silc data is confronted with two limitations. The first concerns the question framing: in the ad-hoc module it is asked about parents’ educational level when the respondent was aged 14, while for those who live with their parents the measure is taken at the time of interview. The second, more serious limitation, is that information of parents for those who live independently are only asked for people aged between 25 and 59. This means we are lacking information on
-,5
0
,5
1
-,5
0
,5
1
Succ.Investm.Need Failure Stud.
Succ.Investm.Need Failure Stud.Succ.Investm.Need Failure Stud.
Success Investment Need
Failure Student
Tertiary education

38 Berloffa, Filandri, Matteazzi, Nazio, Negri, O’Reilly and Sandor have obtained a secondary or tertiary educational qualification less than 5 years ago, for a total of
11824 young people. We estimated the probability to be found in one of the four states of the
illustrated in the typology described in earlier paragraphs (Figure 5). We tested for the social class of
origin as defined on the basis of the higher educational level between young people’s mothers and
fathers (criteria of dominance, Erikson & Goldthorpe 1992). Social class of origin, as based on
education, is classified in three categories: high (tertiary), middle (upper secondary) and low (primary
and lower secondary).
Multinomial logit models are controlled for gender, age, living independently or with parents and
country. Interaction effects with reference country have been estimated but the effect estimates
proved not statistically significant. For ease of interpretation, we will present again the main results in
the form of average predicted probabilities (marginal effects). More specifically, we illustrate the
differences in probability for each category with respect to be living with one’s own parents and
coming from a lower class (‘IN Low class’ in Figure 13).
Figure 13 Differences in the probability of being in each of the types of the typology by social class of origin.
Source: Authors' calculation based on EU-SILC cross-sectional data (2011).
those who already left the parental home at the time of interview, but are not yet 25 years old. In our sample they amount to around 17%.

D 8.2 - Family strategies to cope with poor labour market outcomes 39
Results from Figure 13 show clearly a statistical significant effect of social class of origin on young
people’s occupational conditions within 5 years from obtaining an educational qualification. Among
those who left the parental household, we see that belonging to a high or middle social class
increases the probability to be in a ‘success’ status (first two lines of top left graph in Figure 13). In
other words, all else being equal, success is more likely for the more advantaged strata of young
people (a result in line with McKnight 2015 for the UK). We also show that, among those who reside
with their parents, youth from the high class have a lower probability to be in an ‘investment’ condition
(i.e. skilled job but low paid) than their peers from lower and middle classes. These results point to a
better capacity of wealthier families to have their children proceed more frequently and faster into
skilled and well paid occupations (being it through counselling, guidance, referrals, soft skills or social
networks), whereas longer co-residence with ones parents and resorting to initially low paid
occupations might be the most effective strategy for children from other backgrounds to reach
consistent employment. A more frequent or longer co-residence could be an effective way for middle
classes to be able to obtain/accept skilled jobs, although (at least initially) poorly paid, but with
interesting perspectives of future opportunities. We also show that the probability to be found in a
‘failure’ condition is lower for both young people from higher and middle classes when still living with
their parents (graph ‘failure’ in figure 13). Finally, a similar effect of social class of origin and
residence with ones’ parents is also found around the decision to continue education (as seen also in
chapter 2 of this report and in deliverable 8.1). As before, it is young people from the higher and
middle classes living with their parents who have a higher probability to keep enrolled in the
educational system and afford further educational investments (bottom graph in figure 13). All these
findings highlight the persistence of a clear class divide for young people. The pursuit of ‘higher
profile’ career paths, here skilled jobs, is made easier for youth from higher social class, while for
children from other social backgrounds staying longer in the parental home may be the most viable
option to secure better employment prospects.
In this chapter we examined whether the family background plays a role in influencing the strategies
and occupational conditions (pay & skill level) reached by young individuals, compared with the
individual and country characteristics. Amongst these inequalities, we found that parental resources
matter. Wealthier parents not only help their children by affording them higher educational
achievements, by using their social networks, or by finding them useful unpaid internships (as
suggested in D8.1, McKnight 2015). They may also offer better careers guidance, with emphasis on a
preference for matching skills upon entrance in the labour market (despite lower initial pay), and
taking away the urgency in finding a(ny) job by granting a higher living standard (the 'glass floor' effect
found also by McKnight for the UK and described by Bernardi 2003 for Spain). For low and middle
classes, a prolonged co-residence may be the best available strategy for families to enhance their
children’s capacity to afford tertiary education and improve the chances of a better start in the labour
market.

40 Berloffa, Filandri, Matteazzi, Nazio, Negri, O’Reilly and Sandor
5. Conclusions
The objective of this report was to study the family strategies around young people’s entrance and
establishment into the labour market. The first and final parts of the report (chapters 2 and 4) focus on
effects of the household employment structure and parental social class background on school-to-
work trajectories and employment success, respectively. The central part (chapter 3) explored the
effects of unemployment duration, early entrance and employment continuity on the likelihood of
employment success (in terms of high wage, a skilled job, or both).
The main findings of chapter 2 suggest that the time when young people left education, their
educational level and the employment structure of the family of origin, all have large consequences
for the type of trajectory experienced by young individuals. In particular, those who entered the labour
market during the crisis (2008-2011), who are less educated, and who live in families where most of
their members are not working were less likely to have a speedy trajectory and more likely to
experience continuous unemployment or inactivity.
Focussing on the employment structure of the families of origin, we also find that parental working
conditions are of crucial importance in explaining youth school-to-work trajectories. A stable working
condition of parents is associated with more favourable entry trajectories for both males and female
school-leavers. It is enough to have one working household member, to increase significantly the
probability of a speedy trajectory, and decrease significantly the probability of being continuously
unemployed/inactive.
Further, we have tested how the role of the household employment conditions on young peoples’
entry process did not change much over time. However, we identify a stronger buffering role from
working-rich households during the crisis. Young individuals living in work rich households were more
protected from the increasing difficulties in entering the labour market than their peers living in work-
poor families, especially males.
From the analyses in chapter 3, we have first shown that, although both an early start and a
continuous employment attachment are associated with more favourable outcomes (especially a
higher rate of ‘success’ and higher paid occupations for young people above 24 years), these effects
are relatively small and do not support the idea that any job is necessarily always better than
joblessness. Indeed, a well-matched start at the trade-off of a lower salary (or of a longer job search),
in terms of skills level, is often a better strategy for securing better outcomes in the longer run,

D 8.2 - Family strategies to cope with poor labour market outcomes 41
especially for tertiary educated. Overall, a careful and informed planning of young people’s career
might well include the risk of some initial turbulence, or a slightly longer unemployment caused by
giving up on unskilled job offers, for securing better longer term prospects and a successful
establishment in employment.
Exploring the effects of initial occupations on later outcomes we have also revealed that, (initially)
being poorly paid but in skilled occupations (an ‘investment’ strategy) can constitute an opportunity for
young people that can soon turn into a successful positioning in the labour market. Instead, unskilled
occupations for qualified young people (‘need’ and ‘failure’ strategies) can become an employment
trap difficult to reverse in the long run (similar findings for the risk of unemployment in Germany are
from Reichelt, 2015). In other words, wage seems responding more easily to tenure (up skilling in line
with human capital accumulation or upward mobility) than occupational positioning on the basis of
skills level.
Finally, in chapter 3 we have shown that higher education seems still a major stepping-stone to a
professional job and a successful establishment in the labour market. However, the capacity of young
people to pursue tertiary education is still strongly stratified by family social class background (chapter
4) and family/household work intensity (chapter 2).
In the last part of this report (chapter 4), our analyses finds support for a strong influence of the family
social background on the strategies pursued and occupational conditions (pay & skill level) reached
by young individuals within five years of completing their education. These findings suggest a strong
familial influence on young peoples’ (un)successful employment outcomes. They point to
mechanisms related to a more successful role of higher class families in informing (through advice
and guidance), supporting (through social networks, aspiration building, more effective guidance
through the educational and employment systems) and backing-up (economic support and/or longer
co-residence) young peoples’ employment decisions. We have shown that the most likely effective
strategies, in order to lead to better outcomes, often entail initial losses such as higher risks (longer or
more likely unemployment) or investments (lower pay). These findings are in line with, and
complement, the findings from other work packages of the project focussing on the risk of mismatch
by educational institutions and search methods of first employment (McGuinness et al 2015) for the
impact of unemployment duration on a successful job search (Flek & Mysíková 2016).
However, concerning country differences, net of different baseline shares of young people in each
occupational status across countries, we found no statistically significant evidence of different
mechanisms linking either duration in unemployment, continuity of employment, entry jobs or social
class of the family of origin to the degree of success in employment three to five years after achieving

42 Berloffa, Filandri, Matteazzi, Nazio, Negri, O’Reilly and Sandor an educational qualification in the five selected cases from the youth transition regimes typology.
We conclude by discussing how, as inequalities widen, parents’ ability to invest in their children’s
success not only remains salient but also becomes more unequal. Since the outcomes of
employment careers seem so strongly influenced by what happens in the early period of
establishment in the labour market, a comprehensive investment strategy in young people’s transition
to employment should become a priority. Key steps would be: (1) increasing opportunities for low and
middle class children, and for households with a poor attachment to employment, to have first their
young people pursue higher education and secondly (2) offering later guidance for young peoples’
strategic planning through the initial steps of their career.
While the financial crisis has not been overcome and spills over into rising unemployment and cuts in
public services and welfare spending (health care, educational systems, pensions, social assistance)
the need for resilient employment and social policy is more urgent than ever. As of now, in most
European countries flexible jobs (agency work, fixed-term contracts, part-time work, mini-jobs, some
forms of self-employment) risk to become a lower segment of the labour force, catering especially for
young people, but unable to protect them from the risks of incurring a ‘trap jobs’ career,
unemployment, parenthood or illness, nor to provide a secure income guarantee in old age. Relaxing
hiring and firing legislation without compensating with generous social protection and active labour
market policies, while increasing retirement age, risks to affect young people’s capacity to establish
themselves in employment in a way that strongly stratifies their life opportunities according to their
class of origin. Facing rapid population ageing, a comprehensive retailoring and harmonisation of
welfare provisions across Europe, with a more balanced redistribution between generations
(especially in those countries facing sharper youth unemployment or NEETs), is a key step in allowing
fair chances for young people to access gainful employment across countries.
Given the strong influence that households characteristics and families of origin exercise in the
strategies pursued by young people in accessing and establishing employment careers, further rises
in unequal access to employment and income for households would jeopardise lower classes young
peoples’ life chances and opportunities. They would also, at the country level, increase further losses
in productivity (with a tremendous loss of productive potential) and increase the pressure towards
more passive income support measures. Alternatively, they would unevenly strain families who have
to compensate for retrenching welfare and increasingly fragile markets.
The overall empirical evidence emerging from this study suggests that, from a policy perspective, we
need to go beyond the view that helping (especially highly) educated young people into the labour
market results in providing them with employment attachment, or leads to a reduction of
D 8.2 - Family strategies to cope with poor labour market outcomes 43
unemployment duration. The results suggest instead that ‘any job’ is not necessarily always better to
unemployment, given the salience of the early steps in the labour market and the low prejudicial
effects of an early turbulence. It also supports several policy suggestions in areas such as family,
education and labour market policy.
Family policies:
- It is important to consider the employment structure of young people’s families, at about the time
when they leave education. In particular, policy interventions should be targeted to young people
living in households where parents or other family members do not work. These interventions should
focus both on young people aspirations and motivation, and on giving them access to an effective
service of job search.
- Rising awareness among parents on the importance of their expectations, guidance role, and array
of options with respect to their children educational routes (length and affordability) and potential
returns
Education policies:
- Policies and interventions should invest in educational programs (already at younger ages) to
increase self-awareness about one’s abilities and interests; to equalise educational aspirations and
expectations; as well as to provide more broadly some of the soft-skills that better-off parents can
afford their children (this might include self-confidence, leadership, resilience, diplomacy, cooperative
team-work and mediation).
- Securing a more even access to tertiary education by family background, especially in those
countries where tuition fees are higher and young people are excluded from entitlement to economic
support while studying, or where residential costs are an obstacle to the pursue of higher level
studies.
- Provide a wider and more homogeneous access to opportunities for internships or company-based
training.
- Restrict or monitor educational early tracking or shorter routes to professionalization where they are
taking place in the context of general educational systems which do not provide flexibility in changes
between career tracks.
Labour market policies:
- Encouraging the use of temporary contracts (relaxing hiring and firing regulations) in absence of
strong and universal income support measures, may increase young people’s turbulence in the initial
steps of their careers (by increasing unemployment overall duration and ‘need’ strategies, resorting to
‘failure’ strategies or informal work). It may also increase their dependence on their families of origin,
44 Berloffa, Filandri, Matteazzi, Nazio, Negri, O’Reilly and Sandor stratify further their destinies on the basis of their social background, and worsen their prospects of a
successful employment outcome in the longer term.
- Devising career guidance, especially for young people from poorer backgrounds, to enhance
aspirations and recognise and plan viable strategies towards the achievement of short and long-term
career goals.
- Harmonising benefit systems to include young people, since segmentation of the labour markets,
prolonged turbulence and informal work can easily become traps for those young people in need of
gainful employment.
- Providing young people with opportunities for exchange, mentoring and guidance within mixed
environments for sharing opportunities and social networks and for making the experience of a larger
array of strategies and outcomes possible as perceptions become highly selective in closed social
circles.

D 8.2 - Family strategies to cope with poor labour market outcomes 45
6. Bibliography
Allmendinger, J. (1989). ‘Educational Systems and Labour Market Outcomes’, European Sociological
Review, 5(3): 231–50.
Barbera, F., Filandri, M. and Negri, N. (2010). ‘Conclusioni: cittadinanza e politiche di ceto medio’. In:
N. Negri and M. Filandri, (Eds.) Restare di ceto medio. Il passaggio alla vita adulta nella
società che cambia, (Bologna: Il Mulino) pp. 213-238
Barbier, Jean-Claude (2011). ‘“Employment precariousness” in a European cross-national
perspective, A sociological review of thirty years of research’. Documents de travail du Centre
d’Economie de la Sorbonne 2011.78 - ISSN : 1955-611X. 2011. <halshs-00654370>
Barone, C., Lucchini, M. and Schizzerotto, A. (2011). ‘Career mobility in Italy’. European Societies,
13: 377-400.
Barone, C. and Schizzerotto, A. (2011). ‘Introduction’. European Societies, 13: 331-345.
Berloffa, G., Matteazzi, E. and Villa, P. (2015a). ‘Family Background and Youth Labour Market
Outcomes across Europe’. In: STYLE WP8.1 Work-poor and work-rich families (Berloffa G.,
Filandri M., Matteazzi E., Nazio T., Negri N., O'Reilly J., Villa P. and Zuccotti C.)
Berloffa, G., Matteazzi, E. and Villa, P. (2015b). ‘Households and Youth Employment’. In: STYLE
WP8.1 Work-poor and work-rich families (Berloffa G., Filandri M., Matteazzi E., Nazio T., Negri
N., O'Reilly J., Villa P. and Zuccotti C.)
Berloffa, G., Matteazzi, E., Sandor, A.M. and Villa, P. (2015c). Youth Employment Security and
Labour Market Institutions: A Dynamic Perspective (Mimeo, University of Trento).
Berloffa, G., Mazzolini, G. and Villa, P. (2015). ‘From Education to the First Relevant Employment
Spell’. In: STYLE WP10.2 Youth School-To-Work Transitions: from Entry Jobs to Career
Employment (Berloffa G., Matteazzi E., Mazzolini G., Sandor A. and Villa P.)
Berloffa, G., Modena, F. and Villa, P. (2014). ‘Changing Labour Market Opportunities for Young
People in Italy and the Role of the Family of Origin’. Rivista Italiana degli Economisti, 19(2):
227-251.
Bernardi, F., and Nazio, T. (2005). ‘Globalization and the transition to adulthood in Italy’, in Blossfeld
et al. (Eds.) Globalization, Uncertainty and Youth in Society (London: Routledge), pp. 347-72.
Bernardi, F. (2007). ‘Movilidad Social y Dinámicas Familiares. Una aplicación al estudio de la
emancipación familiar en España’. Revista Internacional de Sociología (RIS), 48: 33-54.

46 Berloffa, Filandri, Matteazzi, Nazio, Negri, O’Reilly and Sandor Billari, F.C. and Liefbroer, A.C. (2010). ‘Towards a new pattern of transition to adulthood?’. Advances
in Life Course Research, 15(2–3): 59–75
Björklund, A. and Salvanes, K.G. (2011) ‘Education and Family Background: Mechanism and
Policies’. In: Hanushek A., Machin S. and Woessmann L. (Eds.), Handbook of the Economics
of Education, Vol. 3: 201-247.
Black, S. and Devereux, P. (2011). ‘Recent Developments in Intergenerational Mobility,’ In:
Ashenfelter O. and Card D. (Eds.), Handbook of Labor Economics, Vol. 4 (Part B): 1487-1541.
Blossfeld, H. P., Kurz, K., Buchholz, S. and Bukodi, E. (2008) Young Workers, Globalization and the
Labor Market: Comparing Early Working Life in Eleven Countries (Cheltenham, UK
/Northampton, MA, USA: Edward Elgar).
Boone, J. and van Ours J.C. (2004). ‘Effective Labor Market Policies’. Discussion Paper 2004-87,
Tilburg University, Center for Economic Research.
Breen, R. (2005). ‘Explaining Cross-national Variation in Youth Unemployment. Market and
Institutional Factors’. European Sociological Review, 21: 125-134
Brzinsky-Fay, C. (2007). ‘Lost in Transition? Labour Market Entry Sequences of School Leavers in
Europe’. European Sociological Review, 23(4):409-422
Bukodi, E. and Goldthorpe, J. H. (2011). ‘Class origins, education and occupation attainment in
Britain’. European Societies, 13: 347-375.
Carneiro, P. and Heckman, J.J. (2004). ‘Human Capital Policy’. In: Heckman J.J. and Krueger A.B.
(Eds.) Inequality in America. (Cambridge: MIT Press).
Corak, M. (2006) ‘Do Poor Children Become Poor Adults? Lessons from a Cross-Country
Comparison of Generational Earnings Mobility’. In: Creedy J. and Kalb G. (Eds.) Dynamics of
Inequality and Poverty, Research on Economic Inequality 13: 143-188
Crompton, R. and Lyonette, C. (2006). ‘Work–Life ‘Balance’ in Europe’. Acta Sociologica, 49: 379-93
Daly, M. (2011). ‘What Adult Worker Model? A Critical Look at Recent Social Policy Reform in Europe
from a Gender and Family Perspective’. Social Politics, 18(1): 1–23
Ekhaugen, T. (2009). ‘Extracting the Causal Component from the Intergenerational Correlation in
Unemployment’. Journal of Population Economics, 22(1): 97-113.
Eurostat (2012). Labour Market Policy - Expenditure and Participants. Data 2010. Luxembourg:
Publication Office of the European Union.
Filandri, M., Nazio, T. and Negri, N. (2015). ‘Parents’ and Siblings’ Working Status on the Transitions
Around Employment’. In: STYLE WP8.1 Work-poor and work-rich families (Berloffa G., Filandri

D 8.2 - Family strategies to cope with poor labour market outcomes 47
M., Matteazzi E., Nazio T., Negri N., O'Reilly J., Villa P. and Zuccotti C.)
Flek, V. and M. Mysíková (2016). ‘Youth transitions and labour market flows - who moves & how?’
STYLE Working Papers. CROME, University of Brighton, Brighton
Gallie, D. (2007a). Employment Regimes and the Quality of Work. (Oxford: Oxford University Press)
Gallie, D. (2007b). ‘Welfare Regimes, Employment Systems and Job Preference Orientations’.
European Sociological Review, 23(3): 279-293
Gallie, D. and Paugam, S. (eds) (2000). Welfare Regimes and the Experience of Unemployment in
Europe. (Oxford: Oxford University Press.)
Gallie, D., Felstead, A. and Green, F. (2012). ‘Job preferences and the intrinsic quality of work: the
changing attitudes of British employees 1992-2006’. Work Employment and Society, 26(5):
806-821.
Gallie, D. (2012). ‘Skills, Job Control and the Quality of Work: the Evidence from Britain’. The
Economic and Social Review, 43(3): 325-341.
Gallie, D. (2013a). Economic Crisis, Quality of Work and Social Integration. The European
Experience. (Oxford: Oxford University Press)
Gallie, D. (2013b). ‘Direct participation and the quality of work’. Human Relations, 66(4): 453-473.
Gallie, D., Paugam, S. and Jacobs, S. (2003). ‘Unemployment, Poverty and Social Isolation: Is There
a Vicious Circle of Social Exclusion?’. European Societies, 5(1-1):1-32
Gangl, M. (2003). ‘The Structure of Labour Market Entry in Europe: A Typological Analysis. In Müller,
W. and Gangl, M. (Eds.),Transitions from Education to Work in Europe. (Oxford: Oxford
University Press), pp. 95–116.
Gash, V. (2008) ‘Bridge or Trap? Temporary Workers’ Transitions to Unemployment and to the
Standard Employment Contract’. European Sociological Review, 24(5):651–668
Gassen, N.S. and Perelli-Harris, B. (2015). ‘The increase in cohabitation and the role of union status
in family policies: A comparison of 12 European countries’. Journal of European Social Policy,
1–19
Green, F. Felstead, A., Gallie, D and Inanc, H. (2014). ‘Job-Related Well-Being Through the Great
Recession’. Journal of Happiness Studies, 1-23
Grün, C., Hauser, W. and Rhein, T. (2010). ‘Is Any Job Better than No Job? Life Satisfaction and Re-
employment’. Journal of Labour Research, 31: 285-306.
Hemerijck, A. and Eichhorst, W. (2010). ‘Whatever Happened to the Bismarckian Welfare State?
From Labor Shedding to Employment-Friendly Reforms’. in B. Palier (Ed.) A Long Goodbye to

48 Berloffa, Filandri, Matteazzi, Nazio, Negri, O’Reilly and Sandor
Bismarck? The Politics of Welfare Reforms in Continental Europe. (Amsterdam Univ. Press)
Hillmert, S. (2011). ‘Occupational mobility and developments of inequality along the life course’.
European Societies, 13: 401-423.
Hipp, L., Bernhardt, J, and Allmendinger, J (2015). ‘Institutions and the prevalence of nonstandard
employment’. Socio-Economic Review, 13 (2): 351-377.
Kalmijn, M. (2007). ‘Explaining cross-national differences in marriage, cohabitation, and divorce in
Europe, 1990–2000’. Population Studies, 61(3): 243–263
Jencks, C., Perman, L. and Rainwater, L. (1988). ‘What is a good job? A new measure of labor-
market success’. American Journal of Sociology, 93: 1322–1357.
Layard, R. (2004). ‘Good jobs and bad jobs’. Centre for Economic Performance occasional papers,
CEPOP19.
Leschke, Janine (2008). Unemployment Insurance and Non-Standard Employment. (Berlin: VS-
Research).
McGuinness, S., A. Bergin and A. Whelan (2015) ‘Recruitment Methods and Educational Provision
Effects on Graduate Over-Education and Over-Skilling’. STYLE Working Papers, WP5.3.
CROME, University of Brighton, Brighton
Müller, W. and Gangl. M. (2003). Transitions from Education to Work in Europe. The Integration of
Youth into EU Labour Markets. (Oxford: Oxford University Press).
Nickell, S. and Layard, R. (1999). ‘Labor Market Institutions and Economic Performance’. In:
Ashenfelter O. and Card D. (Eds.), Handbook of Labor Economics Vol. 3 (Chapter 46): 3029-
3084.
OECD (2006). OECD Employment Outlook 2006. Boosting Jobs and Incomes. (Paris: OECD
Publishing).
OECD (2013). ‘Protecting Jobs, Enhancing Flexibility: A New Look at Employment Protection
Legislation’. In: OECD Employment Outlook 2013. (Paris: OECD Publishing).
O’Reilly, J., Eichhorst, W. Gabos, A., Hadjivassiliou, K., Lain, D., Lesckhe, J., McGuinness, S., Mýtna
Kurakova, L., Nazio, T., Ortlieb, R., Russell, H. and Villa, P. (2015) ‘Five Characteristics of
Youth Unemployment in Europe: Flexibility, Education, Migration, Family Legacies, and EU
Policy’ SAGE Open Mar 2015, 5 (1) DOI: 10.1177/2158244015574962
http://sgo.sagepub.com/content/5/1/2158244015574962
O’Reilly, J., MacInnes, J., Nazio, T., and Roche, J. (2009) ‘The United Kingdom: From flexible
employment to vulnerable workers’ in L. Vosko, M. MacDonald and I. Campbell (eds.) Gender

D 8.2 - Family strategies to cope with poor labour market outcomes 49
and the Contours of Precarious Employment (NY: Routledge) pp. 108-126.
Orloff, A. (1993). ‘Gender and the Social Rights of Citizenship: The Comparative Analysis of Gender
Relations and Welfare States’. American Sociological Review, 58(3): 303–28.
Palier, B. (2010). A Long Goodbye to Bismarck? The Politics of Welfare Reforms in Continental
Europe. (Amsterdam: Amsterdam University Press)
Payne, J. (1987). ‘Does Unemployment Run in Families? Some Findings from the General Household
Survey’. Sociology, 21: 199-214.
Perelli-Harris, B. and Lyons-Amos, M. (2015). ‘Changes in partnership patterns across the life course:
An examination of 14 countries in Europe and the United States’. Demographic Research,
33(6): 145-178.
Peiró, J. M., Agut, S. and Grau, R. (2010). ‘The Relationship Between Overeducation and Job
Satisfaction Among Young Spanish Workers: The Role of Salary, Contract of Employment,
and Work Experience’. Journal of Applied Social Psychology, 40: 666–689.
Pintelon, O., Cantillon, B., Van den Bosch, K., and Whelan, C.T. (2011). ‘The Social Stratification of
Social Risks: Class and Responsibility in the ‘New’ Welfare State’. GINI Discussion Paper 13,
Amsterdam, AIAS.
Raitano, M. and Vona, F. (2015). ‘Measuring the Link between Intergenerational Occupational
Mobility and Earnings: Evidence from Eight Countries’. Journal of Economic Inequality, 13: 83-
102.
Reichelt, M. (2015). ‘Career Progression from Temporary Employment: How Bridge and Trap
Functions Differ by Task Complexity’. European Sociological Review, 31 (5): 558-572.
Sànchez-Sànchez, N. and McGuinness, S. (2013). ‘Decomposing the impacts of overeducation and
overskilling on earnings and job satisfaction: an analysis using REFLEX data’. Education
Economics, 23: 419-432.
Scarpetta S. (1996). ‘Assessing the Role of Labour Market Policies and Industrial Settings on
Unemployment: A Cross Country Study’. OECD Economic Studies No. 26. (Paris: OECD).
Scherer, S. (2005). ‘Pattern of Labour Market Entry - Long Wait or Career Instability? An Empirical
Comparison of Italy, Great Britain and West Germany’. European Sociological Review, 21(5):
427-440.
Schomburg, H. and Teichler, U. (2006). Higher Education and Graduate Employment in Europe.
Results from Graduate in Surveys in Twelve Countries. (Dordrecht: Springer).
Shavit, Y. and Müller, W. (1998). From School to Work. A Comparative Study of Educational

50 Berloffa, Filandri, Matteazzi, Nazio, Negri, O’Reilly and Sandor
Qualifications and Occupational Destinations. (Oxford: Oxford University Press).
Schmid, Günther (2008). Full Employment in Europe: Managing Labour Market Transitions and Risks,
(Cheltenham, UK: Edward Elgar).
Ślezak, E. and B. Szopa (2015). ‘Policy Performance and Evaluation: Poland’. STYLE Working
Papers, WP3.3/PL. CROME, University of Brighton, Brighton
Smith, M., Toraldo, M. L. and Pasquier, V. (2015). ‘Barriers to and triggers of policy innovation and
knowledge transfer in France’. STYLE Working Papers, WP4.1/FR. CROME, University of
Brighton, Brighton
Solon, G. (1992). ‘Intergenerational Income Mobility in the United States’. The American Economic
Review, 82(3): 393-408.
Stafford, E.M. (1980). ‘Employment, Work Involvement and Mental Health in Less Qualified Young
People’. Journal of Occupational Psychology, 53: 291-304.
Van der Velden, R.K.W. and Wolbers, M.H.J. (2003). ‘The Integration of Young People into the
Labour Market: The Role of Training Systems and Labour Market Regulations’. In: Muller, W.
and Gangl,. M. (Eds), Transitions from Education to Work in Europe. The Integration of Youth
into EU Labour Markets. (Oxford: Oxford University Press).
Van Lancker, W. (2012). ‘The European World of Temporary Employment: Gendered and poor?’.
European Societies, 14(1): 83 ︎ -111
Walther, A. (2006). ‘Regimes of youth transitions: Choice, flexibility and security in young people's
experiences across different European contexts’. Young, 14: 119-139.
Wolbers, M. H. J., Luijkx, R. and Ultee, W. (2011). ‘Educational attainment, occupational
achievements, career peaks’. European Societies, 13: 425-450.
Ward-Warmedinger, M. and Macchiarelli, C. (2013). ‘Transitions in Labour Status in the EU’. IZA
Discussion Paper, No 7814.
Wolbers, M.H.J. (2007). ‘Patterns of Labour Market Entry. A Comparative Perspective on School-to-
Work Transitions in 11 European Countries’. Acta Sociologica, 50(3): 189-210
Wulfgramm, M. and Fervers, S. (2015). ‘Unemployment and subsequent employment stability: does
labour market policy matter?’. Socio-Economic Review, 13(4):791–812

D 8.2 - Family strategies to cope with poor labour market outcomes 51
7. Appendix
Figure A.1 Individual School-to-Work transitions by trajectory type Speedy pathway Long-search pathway
In&out successful pathway In&out unsuccessful pathway
Continuous unemployed or inactive pathway Return to education pathway
Legend: Green: education; Blue: employment; Yellow: Unemployment; Red: Inactivity. Source: Author’s computation based on EU-SILC longitudinal data (2009-2012).
0
1000
2000
3000
4000
5000
0 10 20 30 40
0
200
400
600
800
0 10 20 30 40
0
100
200
300
0 10 20 30 40
0
100
200
300
400
500
0 10 20 30 40
0
1000
2000
3000
0 10 20 30 40
0
200
400
600
800
0 10 20 30 40

52 Berloffa, Filandri, Matteazzi, Nazio, Negri, O’Reilly and Sandor Table A.1 Predicted outcome probabilities and marginal effects for females
Speedy Longsearch
In&outsuccessful
In&outunsuccessful
Continuouslyunemployed/
inactive
Returntoeducation
Predictedoutcomeprobabilities: 0.640*** 0.020*** 0.003*** 0.039*** 0.248*** 0.047***
(0.011) (0.003) (0.001) (0.004) (0.010) (0.004)
Marginaleffects: Age 0.022*** 0.001 0.000 -0.002 -0.017*** -0.004**
(0.005) (0.001) (0.000) (0.002) (0.004) (0.002)
Atmostuppersecondaryeducation 0.108*** -0.004 -0.000 -0.013 -0.083*** -0.008
(0.028) (0.005) (0.001) (0.008) (0.025) (0.009)
Tertiaryeducation 0.164*** -0.001 -0.001 -0.033** -0.083** -0.046***
(0.042) (0.007) (0.002) (0.014) (0.040) (0.016)
Highlyeducatedfather -0.004 -0.009 0.003*** -0.006 0.005 0.011
(0.034) (0.006) (0.001) (0.011) (0.033) (0.010)
Highlyeducatedmother -0.030 -0.001 -0.002 0.004 -0.003 0.032***
(0.031) (0.005) (0.001) (0.010) (0.031) (0.009)
One-parentfamily -0.010 0.001 0.003** 0.004 0.010 -0.007
(0.032) (0.005) (0.001) (0.012) (0.029) (0.011)
Nootherworking-agefamilymembersarepresent 0.139*** -0.007 0.001 0.011 -0.145*** 0.002
(0.036) (0.005) (0.002) (0.016) (0.031) (0.011)
Householdsize -0.013 0.000 -0.000 -0.004 0.018** -0.000
(0.009) (0.001) (0.001) (0.004) (0.008) (0.003)
Motheremployed6months 0.114*** 0.004 0.002* -0.017** -0.109*** 0.005
(0.022) (0.004) (0.001) (0.008) (0.020) (0.007)
Motheremployedatleast1month(butlessthan6) 0.074* 0.009 -0.001 -0.018 -0.049 -0.016
(0.039) (0.006) (0.003) (0.013) (0.035) (0.0141)
Fatheremployed6months 0.079*** 0.000 0.003** 0.004 -0.077*** -0.008
(0.027) (0.004) (0.001) (0.010) (0.024) (0.009)
Fatheremployedatleast1month(butlessthan6) -0.053 -0.007 -0.002 0.026* 0.039 -0.003
(0.047) (0.009) (0.004) (0.015) (0.042) (0.016)
Allotherworking-agefamilymembers:work-intensity=1 0.184*** -0.003 0.002 0.011 -0.178*** -0.015
(0.040) (0.006) (0.002) (0.016) (0.035) (0.013)
Allotherworking-agefamilymembers:0<work-intensity<1 0.188*** -0.006 0.002 0.017 -0.190*** -0.011
(0.044) (0.006) (0.002) (0.016) (0.039) (0.014)
ALMPs -0.219 0.021 0.007 0.002 0.295 -0.107
(0.480) (0.071) (0.024) (0.186) (0.471) (0.140)
EPL-T 0.089 0.010 0.005 -0.032 -0.053 -0.019
(0.070) (0.010) (0.004) (0.024) (0.068) (0.025)
EPL-P 1.023*** 0.066 0.022 -0.465*** -0.580* -0.066
(0.346) (0.047) (0.051) (0.165) (0.325) (0.162)
Observations 3415 3415 3415 3415 3415 3415Note: Reference category for education: At most lower secondary education. Reference category for mother's employment status in the six-month period: never employed. Reference category for father's employment status in the six-month period: never employed. Reference category for other working-age family members: work-intensity = 0. We also control for country dummies, year dummies (year of exiting education), GDP growth rate corresponding to the year of exiting education, and length of the first spell of education (at the beginning of the sequence). Standard errors in parentheses.*** p<0.01, ** p<0.05, * p<0.1.

D 8.2 - Family strategies to cope with poor labour market outcomes 53
Table A.2.Predicted outcome probabilities and marginal effects for males
Speedy Longsearch
In&outsuccessful
In&outunsuccessful
Continuouslyunemployed/
inactive
Returntoeducation
Predicted outcome probabilities:
0.668*** 0.036*** 0.016*** 0.030*** 0.204*** 0.044***
(0.010) (0.003) (0.002) (0.003) (0.009) (0.004)
Marginal effects: Age 0.014*** 0.000 -0.000 -0.000 -0.010*** -0.002*
(0.004) (0.001) (0.001) (0.001) (0.00378) (0.001)
At most upper secondary education 0.109*** 0.009 0.005 -0.010* -0.118*** 0.004
(0.023) (0.007) (0.004) (0.005) (0.0205) (0.007)
Tertiary education 0.178*** 0.022** 0.005 -0.030** -0.166*** -0.009
(0.040) (0.011) (0.007) (0.012) (0.0386) (0.013)
Highly educated father -0.030 -0.006 0.003 0.002 -0.00476 0.035***
(0.028) (0.008) (0.005) (0.006) (0.0259) (0.008)
Highly educated mother -0.017 -0.003 -0.002 0.008 0.00998 0.004
(0.027) (0.008) (0.005) (0.006) (0.0245) (0.008)
One-parent family -0.026 0.0118 0.003 -0.001 0.0101 0.002
(0.029) (0.008) (0.005) (0.007) (0.0259) (0.011)
No other working-age family members are present 0.161*** -0.003 0.013* -0.014* -0.137*** -0.020**
(0.032) (0.009) (0.007) (0.008) (0.0279) (0.010)
Household size -0.016** 0.005** 0.002 0.000 0.00949 0.000
(0.008) (0.002) (0.001) (0.002) (0.00716) (0.003)
Mother employed 6 months 0.082*** 0.006 -0.008** 0.002 -0.0840*** 0.001
(0.020) (0.005) (0.004) (0.005) (0.0178) (0.006)
Mother employed at least 1 month (but less than 6) -0.004 0.004 0.002 0.003 -0.0251 0.019
(0.037) (0.010) (0.006) (0.009) (0.0336) (0.012)
Father employed 6 months 0.084*** 0.001 0.004 -0.005 -0.0836*** -0.001
(0.024) (0.007) (0.005) (0.007) (0.0214) (0.008)
Father employed at least 1 month (but less than 6) 0.012 0.013 0.005 -0.006 -0.0168 -0.007
(0.043) (0.011) (0.007) (0.011) (0.0372) (0.015)
Other working-agefamilymembers: work-intensity = 1 0.233*** -0.008 0.008 -0.017* -0.177*** -0.039***
(0.037) (0.009) (0.008) (0.009) (0.0322) (0.012)
Other working-agefamilymembers: 0 < work-intensity < 1 0.166*** -0.011 0.006 -0.012 -0.127*** -0.022*
(0.039) (0.010) (0.008) (0.009) (0.0335) (0.012)
ALMPs 0.066 0.189 0.066 -0.154 -0.00546 -0.162
(0.419) (0.124) (0.074) (0.107) (0.392) (0.123)
EPL-T -0.022 0.003 -0.003 -0.004 0.00332 0.022
(0.064) (0.0148) (0.012) (0.018) (0.0597) (0.02)
EPL-P 0.707*** -0.025 -0.008 -0.224 -0.419* -0.031
(0.273) (0.063) (0.048) (0.143) (0.243) (0.122)
Observations 3974 3974 3974 3974 3974 3974 Note: Reference category for education: At most lower secondary education. Reference category for mother's employment status in the six-month period: never employed. Reference category for father's employment status in the six-month period: never employed. Reference category for other working-age family members: work-intensity = 0. We also control for country dummies, year dummies (year of exiting education), GDP growth rate corresponding to the year of exiting education, and length of the first spell of education (at the beginning of the sequence). Standard errors in parentheses.*** p<0.01, ** p<0.05, * p<0.1.

54 Berloffa, Filandri, Matteazzi, Nazio, Negri, O’Reilly and Sandor Table A3. Predicted outcome probabilities by family type
Females Males
Pr
St.Err. Pr
St.Err.
Noothermemberspresent(besidesparents)
Bothparentsworkedduringthesix-monthperiod(work-rich) Speedy 0.728 *** 0.017 0.753 *** 0.014
Longsearch 0.020 *** 0.003 0.036 *** 0.005 In&outsuccessful 0.006 *** 0.002 0.018 *** 0.004 In&outunsuccessful 0.033 *** 0.006 0.026 *** 0.004 Continuouslyunemployed/inactive 0.160 *** 0.014 0.125 *** 0.011 Returnintoeducation 0.053 *** 0.007 0.042 *** 0.006 None parent worked during the six-month period (work-poor)
Speedy 0.540 *** 0.030 0.592 *** 0.029 Longsearch 0.016 *** 0.004 0.030 *** 0.006 In&outsuccessful 0.002 ** 0.001 0.022 *** 0.007 In&outunsuccesful 0.046 *** 0.012 0.029 *** 0.007 Continuouslyunemployed/inactive 0.340 *** 0.030 0.286 *** 0.028 Returnintoeducation 0.056 *** 0.011 0.042 *** 0.008
Otherfamilymemberspresent(besidesparents)
Bothparentsandallotherfamilymembersworkedduringthesix-monthsperiod(work-rich)Speedy 0.763 *** 0.021 0.808 *** 0.017
Longsearch 0.023 *** 0.004 0.031 *** 0.006
In&outsuccessful 0.008 *** 0.003 0.012 *** 0.004In&outunsuccessful 0.032 *** 0.007 0.023 *** 0.005Continuouslyunemployed/inactive 0.137 *** 0.017 0.099 *** 0.013Returnintoeducation 0.036 *** 0.007 0.027 *** 0.006Parentsandotherfamilymembersdidnotworkduringthesix-monthperiod(work-poor)
Speedy 0.376 *** 0.039 0.394 *** 0.039Longsearch 0.019 *** 0.005 0.028 *** 0.008In&outsuccessful 0.001 * 0.001 0.008 ** 0.004In&outunsuccessful 0.030 *** 0.012 0.039 *** 0.011Continuouslyunemployed/inactive 0.527 *** 0.042 0.475 *** 0.043Returnintoeducation 0.046 *** 0.011 0.056 *** 0.013Parentsdidnotworkwhileotherfamilymembersworkedduringthesix-monthperiod(mixed1)Speedy 0.589 *** 0.036 0.665 *** 0.033Longsearch 0.019 *** 0.005 0.026 *** 0.006In&outsuccessful 0.002 *** 0.001 0.016 *** 0.006In&outunsuccessful 0.048 ** 0.014 0.027 *** 0.007Continuouslyunemployed/inactive 0.303 *** 0.034 0.238 *** 0.031Returnintoeducation 0.040 *** 0.010 0.028 *** 0.007Parentsworkedwhileotherfamilymembersdidnotworkduringthesix-monthperiod(mixed2)Speedy 0.597 *** 0.034 0.597 *** 0.032Longsearch 0.028 *** 0.007 0.040 *** 0.009In&outsuccessful 0.005 ** 0.002 0.008 ** 0.003In&outunsuccessful 0.025 *** 0.009 0.042 *** 0.010Continuouslyunemployed/inactive 0.293 *** 0.031 0.247 *** 0.029Returnintoeducation 0.052 *** 0.012 0.066 *** 0.013Note. *** p<0.01, ** p<0.05, * p<0.1.

D 8.2 - Family strategies to cope with poor labour market outcomes 55
Table A4. Probability of being speedy and continuously unemployed/inactive by gender, year of exiting education and family type
Females Males
Year
Work-richfamilies
Work-poorfamilies
Work-richfamilies
Work-poorFamilies
Pr St.Err. Pr St.Err. Pr St.Err. Pr St.Err.
Speedy
2005 0.753 0.038 0.359 0.059 0.757 0.035 0.332 0.0532006 0.785 0.045 0.433 0.073 0.767 0.042 0.346 0.0632007 0.726 0.036 0.384 0.052 0.842 0.025 0.502 0.0552008 0.708 0.034 0.333 0.046 0.770 0.028 0.374 0.0472009 0.699 0.041 0.309 0.052 0.743 0.035 0.338 0.0492010 0.751 0.043 0.353 0.060 0.716 0.050 0.267 0.0542011 0.836 0.058 0.443 0.102 0.839 0.049 0.385 0.087
Continuouslyunempl/inac
2005 0.145 0.031 0.539 0.066 0.125 0.027 0.537 0.0662006 0.100 0.029 0.429 0.079 0.112 0.031 0.496 0.0782007 0.104 0.019 0.429 0.057 0.050 0.011 0.294 0.0522008 0.145 0.024 0.530 0.053 0.090 0.017 0.429 0.0532009 0.169 0.034 0.579 0.062 0.102 0.021 0.458 0.0602010 0.159 0.033 0.581 0.064 0.174 0.037 0.638 0.0622011 0.126 0.045 0.518 0.103 0.123 0.039 0.555 0.086
Note. Results are all statistically significant at 1% level.

56 Berloffa, Filandri, Matteazzi, Nazio, Negri, O’Reilly and Sandor
Recent titles in this series Available at: http://www.style-research.eu/publications/working-papers
WP3 POLICY PERFORMANCE Key Indicators and Drivers of Youth Unemployment Hadjivassiliou, Kirchner Sala and Speckesser (2015) STYLE Working Paper WP3.1 Indicators and Drivers of Youth Unemployment The Effectiveness of Policies to combat Youth Unemployment Gonzalez Carreras, Kirchner Sala and Speckesser (2015) STYLE Working Paper WP3.2 Policies to combat Youth Unemployment Policy Performance and Evaluation: Qualitative Country Case Studies Eichhorst, Hadjivassiliou and Wozny (eds.)(2015) STYLE Working Paper WP3.3 Policy Performance and Evaluation – Synthesis Report Country Reports Policy Performance and Evaluation: Germany Eichhorst, Wozny and Cox (2015) STYLE Working Paper WP3.3 Performance Germany Policy Performance and Evaluation: Estonia Eamets and Humal (2015) STYLE Working Paper WP3.3 Performance Estonia Policy Performance and Evaluation: Spain González-Menéndez, Mato, Gutiérrez, Guillén, Cueto and Tejero (2015) STYLE Working Paper WP3.3 Performance Spain Policy Performance and Evaluation: Netherlands Bekker, van de Meer, Muffels and Wilthagen (2015) STYLE Working Paper WP3.3 Performance Netherlands Policy Performance and Evaluation: Poland Ślezak and Szopa (2015) STYLE Working Paper WP3.3 Performance Poland Policy Performance and Evaluation: Sweden Wadensjö (2015) STYLE Working Paper WP3.3 Performance Sweden

D 8.2 - Family strategies to cope with poor labour market outcomes 57
Policy Performance and Evaluation: Turkey Gökşen, Yükseker, Kuz and Öker (2015) STYLE Working Paper WP3.3 Performance Turkey Policy Performance and Evaluation: United Kingdom Hadjivassiliou, Tassinari, Speckesser, Swift and Bertram (2015) STYLE Working Paper WP3.3 Performance UK
WP4 POLICY TRANSFER Barriers to and triggers of innovation and knowledge transfer Petmesidou and González-Menéndez (eds.)(2015) STYLE Working Paper WP4.1 Barriers to and triggers of policy innovation and knowledge transfer Country Reports Barriers to and triggers for innovation and knowledge transfer in Belgium Martellucci and Marconi (2015) STYLE-D4.1 Country Report Belgium Barriers to and triggers of policy innovation and knowledge transfer in Denmark Carstensen and Ibsen (2015) STYLE-D4.1 Country Report Denmark Barriers to and triggers for innovation and knowledge transfer in Spain González-Menéndez, Guillén, Cueto, Gutiérrez, Mato and Tejero (2015) STYLE-D4.1 Country Report Spain Barriers to and triggers for innovation and knowledge transfer in France Smith, Toraldo and Pasquier (2015) STYLE-D4.1 Country Report France Barriers to and triggers for innovation and knowledge transfer in Greece Petmesidou and Polyzoidis (2015) STYLE-D4.1 Country Report Greece Barriers to and triggers for innovation and knowledge transfer in the Netherlands Bekker, van der Meer and Muffels (2015) STYLE-D4.1 Country Report Netherlands Barriers to and triggers of policy innovation and knowledge transfer in Slovakia Veselkova (2015) STYLE-D4.1 Country Report Slovakia

58 Berloffa, Filandri, Matteazzi, Nazio, Negri, O’Reilly and Sandor Barriers to and Triggers for Innovation and Knowledge Transfer in Turkey Gökşen, Yükseker, Kuz and Öker (2015) STYLE-D4.1 Country Report Turkey Barriers to and Triggers for Innovation and Knowledge Transfer in the UK Hadjivassiliou, Tassinari and Swift (2015) STYLE-D4.1 Country Report UK
WP5 MISMATCH: SKILLS AND EDUCATION A Comparative Time Series Analysis of Overeducation in Europe: Is there a common policy approach? McGuinness, Bergin and Whelan (2015) STYLE Working Paper WP5.1 Overeducation in Europe Are student workers crowding out low-skilled youth? Beblavý, Fabo, Mýtna Kureková, and Žilinčíková (2015) STYLE Working Paper WP5.3 Are student workers crowding out the low skilled youth Recruitment Methods & Educational Provision effects on Graduate Over-Education and Over-Skilling McGuinness, Bergin and Whelan (2015) STYLE Working Paper WP 5.4 Report Recruitment Methods
WP6 MISMATCH: MIGRATION Re-emerging migration patterns: structures and policy lessons. Akgüç and Beblavý (2015) STYLE Working Paper WP6.3
WP7 SELF-EMPLOYMENT AND BUSINESS START UPS Business Start-Ups and Youth Self-Employment: A Policy Literature Overview Sheehan and McNamara (2015) STYLE Working Paper WP7.1 Business Start-Ups Youth Self-Employment Policy Literature Review Country Reports Business Start-Ups and Youth Self-Employment in Germany Ortlieb and Weiss (2015) STYLE Working Paper WP7.1 Germany

D 8.2 - Family strategies to cope with poor labour market outcomes 59
Business Start-Ups and Youth Self-Employment in Estonia Masso and Paes (2015) STYLE Working Paper WP7.1 Estonia Business Start-Ups and Youth Self-Employment in Spain González Menéndez and Cueto (2015) STYLE Working Paper WP7.1 Spain Business Start-Ups and Youth Self-Employment in Ireland Sheehan and Mc Namara (2015) STYLE Working Paper WP7.1 Ireland Business Start-Ups and Youth Self-Employment in Poland Pocztowski, Buchelt and Pauli (2015) STYLE Working Paper WP7.1 Poland Business Start-Ups and Youth Self-Employment in the UK Hinks, Fohrbeck and Meager (2015) STYLE Working Paper WP7.1 UK Mapping patterns of self-employment (forthcoming)(2015) STYLE Working Paper WP7.2
WP8 FAMILY DRIVERS Work-poor and work-rich families: Influence on youth labour market outcomes Berloffa, Filandri, Matteazzi, Nazio, O’Reilly, Villa and Zuccotti (2015) STYLE Working Paper WP8.1 Work-poor and work-rich families Leaving and returning to the parental home during the economic crisis (forthcoming) (2015) STYLE Working Paper WP8.3
WP9 ATTITUDES AND VALUES Value system shared by young generations towards work and family Hajdu and Sik (2015) STYLE Working Paper WP9.1 Searching for gaps: are work values of the younger generations changing?

60 Berloffa, Filandri, Matteazzi, Nazio, Negri, O’Reilly and Sandor The impact of youth unemployment on social capital O’Higgins and Stimolo (2015) STYLE Working Paper WP9.2 Youth unemployment and social capital: An experimental approach Aspirations of vulnerable young people in foster care Hart, Stubbs, Plexousakis, Georgiadi and Kourkoutas (2015) STYLE Working Paper WP9.3 Aspirations of vulnerable youth in foster care
WP 10 FLEXICURITY Mapping Flexicurity Performance in the Face of the Crisis: Key Indicators and Drivers of Youth Unemployment Eamets, Beblavý, Bheemaiah, Finn, Humal, Leschke, Maselli and Smith (2015) STYLE Working Paper WP10.1 Mapping flexibility and security performance in the face of the crisis Tracing the interface between numerical flexibility and income security for European youth during the economic crisis Leschke and Finn (2016) STYLE Working Paper WP10.1a Tracing the interface between numerical flexibility and income security for European youth during the economic crisis Youth School-To-Work Transitions: from Entry Jobs to Career Employment Berloffa, Matteazzi, Mazzolini, Sandor and Villa (2015) STYLE Working Paper WP10.2 Youth School-To-Work Transitions: from Entry Jobs to Career Employment Balancing Flexibility and Security in Europe: the Impact on Young People’s Insecurity and Subjective Well-being Russell, Leschke and Smith (2015) STYLE Working Paper WP10.3 Balancing Flexibility and Security in Europe: the Impact on Young People’s Insecurity and Subjective Well-being

D 8.2 - Family strategies to cope with poor labour market outcomes 61
Research Partners 1. University of Brighton – BBS CROME – United Kingdom
2. Institute for Employment Studies – United Kingdom
3. Institute for the Study of Labor – Germany
4. Centre for European Policy Studies – Belgium
5. TARKI Social Research Institute – Hungary
6. University of Trento – Italy
7. National University of Ireland Galway – Republic of Ireland
8. Democritus University of Thrace – Greece
9. University of Oxford – United Kingdom
10. Economic and Social Research Institute – Republic of Ireland
11. University of Salerno – Italy
12. University of Oviedo – Spain
13. University of Tartu – Estonia
14. Cracow University of Economics – Poland
15. Slovak Governance Institute – Slovakia
16. Metropolitan University Prague – Czech Republic
17. Grenoble School of Management – France
18. University of Tilburg – Netherlands
19. University of Graz – Austria
20. Copenhagen Business School – Denmark
21. Norwegian Social Research – Norway
22. Swedish Institute for Social Research – Sweden
23. Koç University Social Policy Centre – Turkey
24. University of Turin – Italy
25. EurActiv – Belgium
http://www.style-research.eu/research-organisations
62 Berloffa, Filandri, Matteazzi, Nazio, Negri, O’Reilly and Sandor
Advisory Groups
Consortium Advisory Network
Business Europe www.businesseurope.eu
ETUI: European Trade Union Institute www.etui.org
European Youth Forum www.youthforum.org
European Foundation for the Improvement of Living and Working Conditions www.eurofound.europa.eu
ILO: International Labour Office www.ilo.org
OECD: Organisation for Economic Cooperation and Development www.oecd.org
OSE: Observatoire Sociale Européen www.ose.be
SOLIDAR: European network of NGOs working to advance social justice in Europe www.solidar.org EurActiv www.euractiv.com
European Commission, DG Employment, Social Affairs and Inclusion http://ec.europa.eu/social/main.jsp?langId=enandcatId=1036
Local Advisory Boards including employers, unions, policy makers and non-government organisations
www.style-research.eu/project-advisors/local-advisory-boards/