sub-surface and near-bottom thermohaline circulation of a shallow sea during a dense water...
TRANSCRIPT
Sub-surface and near-bottom thermohaline circulation of a shallow sea during a Dense
Water production event:a case study from the northern Adriatic Sea.
Alvise Benetazzo, Andrea Bergamasco,Davide Bonaldo, Francesco M. Falcieri, Mauro Sclavo and
Sandro Carniel
CNR-ISMAR, Venice, Italy

Adapted from Puig (2009)
INLs
Heat and Moisture fluxes
(brine rejection durng sea-ice formation)
Cascading: a type of buoyancy driven current, in which dense water formed by cooling, evaporation or freezing in the surface layer over the continental shelf descends down the continental slope to greater depths…
… link between small scale processes and global phenomena (BUT climate models do not capture the small scale processes and need to be “fed in” correctly…)
Did you say “Dense Shelf Water”?Did you say “Dense Shelf Water”?
Bottom Friction
Hydraulic control
Ambient Water Entrainments
Shear Instabilities
Geostrophic Eddies
Neutral buoyancy

Cascading sites around the world…Cascading sites around the world…
not so many, but powerful drivers of the overall circulation, heat/salt /carbon transfer, and relevant for climate dynamics
not so many, but powerful drivers of the overall circulation, heat/salt /carbon transfer, and relevant for climate dynamics
From Ivanov et al., PIO (2004) & Durrieu de Madron et al., PIO (2005)
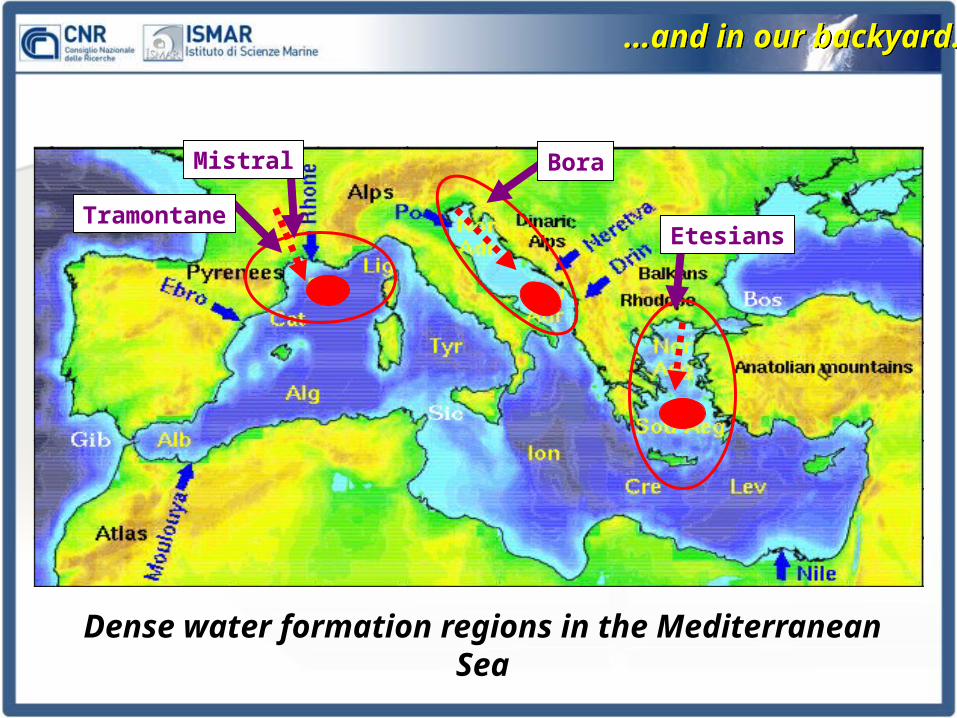
…and in our backyard……and in our backyard…
Mistral
Tramontane
Bora
Etesians
Dense water formation regions in the Mediterranean Sea


General strategy behind
WHY DSW, or DW, are formed in the Northern
Adriatic during cold periods associated to strong winds, triggered by local T and S conditions.
We call them also NAdDW (North Adriatic Dense Waters)
DW move southward and sink in those regions by cascading events. Responsible of the sediment transport along the SAM
Pathways and volumes are still largely unknown, but control heat and sediment export off-shelf
HOW MODEL: using a system at high
resolution, 2-way coupled wave-current-sediment, 1-way coupled atmosphere (see poster for 2-way AOW!)
DATA: tower. buoys, dedicated cruises (“ODW campaigns”)

In Winter 2012 a CAO episode spanned 15 consecutive days (January 29 to February 13): a mass of cold air descended from NE to the NA with strong winds and cool air (at “AA” U10 was 13.4 m/s on average and 35.1 m/s at most, air T dropped below 6°C, with a minimum record of -4.2 °C)
A severe wave condition was a consequence of such atmospheric event: maximum observed sea state had Hs 3.20 m, with 1.97 m in average.
The CAO event was characterized by an unusual duration!
General features of CAO effects on the Adriatic Sea described by Mihanović, Vilibic, Carniel et al. (Ocean Science 2013) and Raicich et al. (JGR 2013). Recently by Janekovic et al. (JGR 2014).
The 2012 event

February 2012 Cold Air Outbreak event
COSMO model (7 km)ground Air T & 10m-wind
snapshot (Feb 2, 00:00 UTC)
frozen Venice lagoon
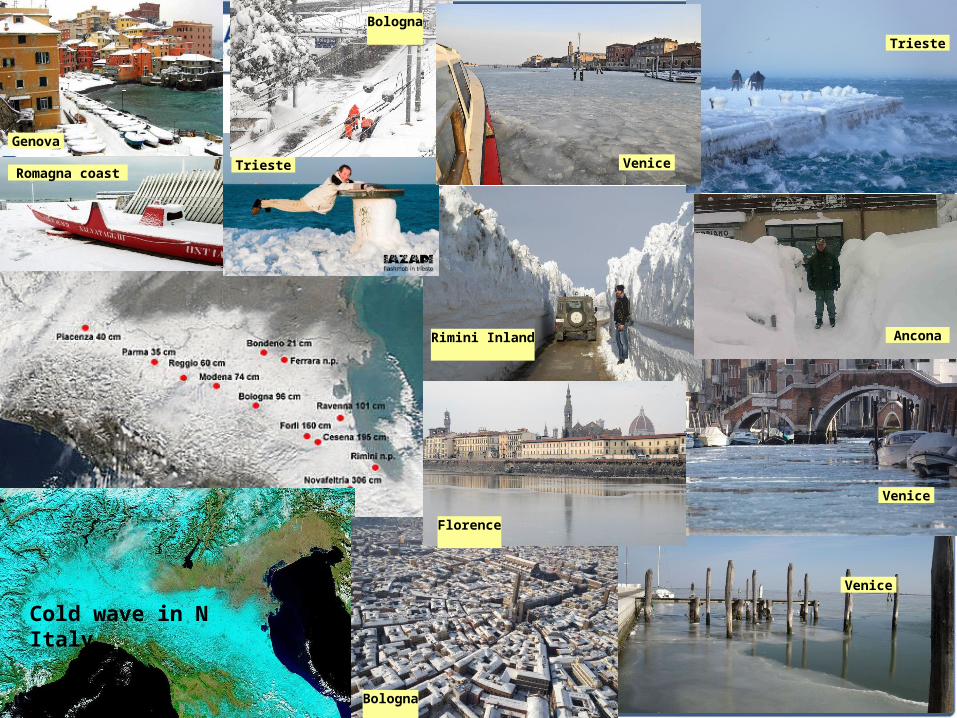
Bologna
Florence
Ancona
Trieste
Trieste
Venice
Rimini Inland
Venice
Bologna
Genova
Romagna coast
Cold wave in N Italy
Venice

Available model output and observations during CAO
Air temperature (2 m)
Wind speed
Atmospheric conditions at “AA” tower
Acqua Alta Tower(“AA”) – 17 m depth

An integrated and coupled modeling system of the Adriatic Sea
NAdDW production and spreading simulated by a 3-D coupled wave-ocean-sediment numerical model, eddy-permitting, high-resolution grid (1.0 x 1.0 km2). 30 levels, Nov 2011-June 2012.
Coupled-Ocean-Atmosphere-Wave-Sediment-Transport systemROMS-SWAN-SEDIMENTS
In this talk:2WC run: ocean-wave coupled (1800 s ½ COSMO forcing time step)UNC run: ocean and wave uncoupled.
Modeling Approach

Atmospheric forcings provided by the meteorological model COSMO-I7 (one-way 7.0 x 7.0 km2 horizontal resolution)
Observational dataset -oceanographic platform "Acqua Alta" (AA) in the northern Adriatic, -"Operation Dense Waters" (ODW2012) cruises in the southern Adriatic, -instrumented moorings deployed in the Bari Canyon (South Adriatic Sea).
Among the things to be recalled, we fostered the collaboration with our marine geologists colleagues, who were carrying out a survey off the Adriatic using new technologies (e.g. HR MultiBeam). This produced a NEW ADRIATIC BATHYMETRY
Modeling Approach

A new picture of the bottom areas
10 Km
b
c
Bari CanyonSystem

New data for a new bathymetry
Old bathymetry 2 km

New bathymetry (these results: 1 km)
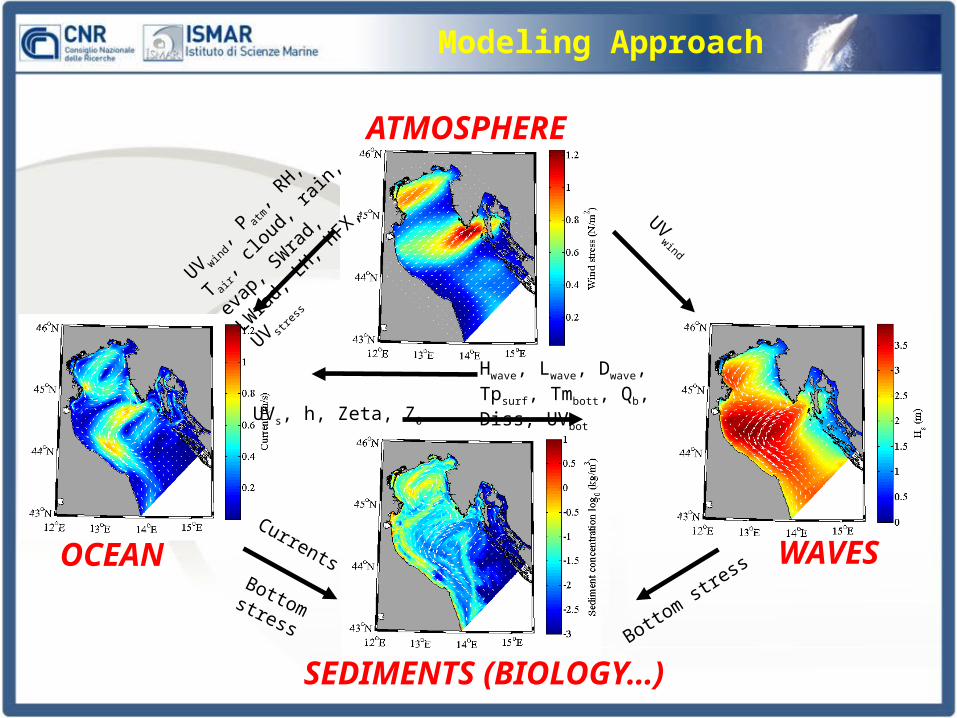
Modeling Approach
OCEAN WAVES
Bottom stressBottom stress
Currents
SEDIMENTS (BIOLOGY…)
UV wind, P atm
, RH, T air
, cloud,
rain, eva
p, SWrad, LW
rad,
LH, H
FX, U
V stress
UVwind
Hwave, Lwave, Dwave,Tpsurf, Tmbott, Qb, Diss, UVbot
UVs, h, Zeta, Z0
ATMOSPHERE

Several recent efforts using this coupled approach...
WCI: effects on the wave-fieldBenetazzo, Sclavo Bergamasco, Carniel, 2013. Ocean Modeling, 70
WCI: effects on suspended sedimentsSclavo, Carniel, Bergamasco, Falcieri et al., 2013. J. Coast. Res., 65
Effects of DSW on southern margin reshapingBonaldo, Bergamasco, Falcieri, Trincardi and Carniel , 2014 (submitted Marine Geology)
Effects of DSW on sediment fluxes in the Southern marginCarniel, Benetazzo, Falcieri et al., 2014 (submitted Marine Geology)
In this talk, we will refer to
Benetazzo, Bergamasco, Falcieri and Carniel 2014. The response of the Adriatic Sea to an intense CAO: basin renewal, dense water masses, near-bottom dynamics, and effects of ocean-wave coupling. (in revision, Progress in Oceanography)
Modeling Approach


= modeled T air and U10 are very good w.r.t. Data= generally, COSMO slightly “colder and faster”
=T&S data suffer from an “endemic” bias due to I.C. (2000 initialization, models adopted...)= waves are well reproduced
Model performances (“Acqua Alta”) Nov 2011-Jun 2012

model results
-2.9 m obs
Hydrology data at “AA”

=2 months after the CAO, T is underestimated (density higher than obs).
Model performances (CTD “Urania”)March 23-April 20, 2012

Model performances (CTD+ADCP)
-1.6°C, -0.10 PSU, 0.2 kg/m3

SST (Model snapshot VS multi-image merging from satellite)
Qualit. comparison on DW formation area

Wave Effects on Current speed and T fields (Jan 29 - Feb 07, 2012)
2WC and UNC difference
Effects of 2WC may be direct on increasing/decreasing surface velocity, but also on distributing local “blobs” w.r.t. coastal region.
This is a very important feature presented also by Sclavo et al. 2013 on the SSC
2WC UNC

WCI effects on Suspended Sediments
2WC and UNC difference
t1
t2
t3
© DHI
WCI: 2 max at “AA”
NO WCI: 1 max, different timing

Wave Effects on River plume (SSS on Mar 05, 02:00 UTC)
Interesting features: plume bifurcation
2WC UNC
See also F. Falcieri talk, tomorrow

Water Temperature (Surface and Bottom) - 2012 Feb 6, 00:00 UTC
2WC result example
2WC 2WC

Turbulent Fluxes comparison at “AA”

Control sections

Adriatic Sea total Mass north of Section A (using 2WC results)
When did we have the max new DWs?
Since CAO onset, mass grows approx. linearly(1.5 kg/m2/day loss of buoyancy)
After, gain of buoyancy 0.3 kg/m2/day

North Adriatic area - TS diagram (before and after the CAO)
New water masses characteristics
blue: a colder and saltier water (evaporation)
Haline contribution: ~ 25%
we track 1030.0

NAdDW Volumes (Feb 18, 14:00 UTC)
A vertical view of the Italian DW vein

Residence time for different thresholds (2WC)
No direct info about the thickness of the vein here...But note that HOW to compute these volumes matters!
# days since Jan 29 when near-bottom water pot. dens. > than...
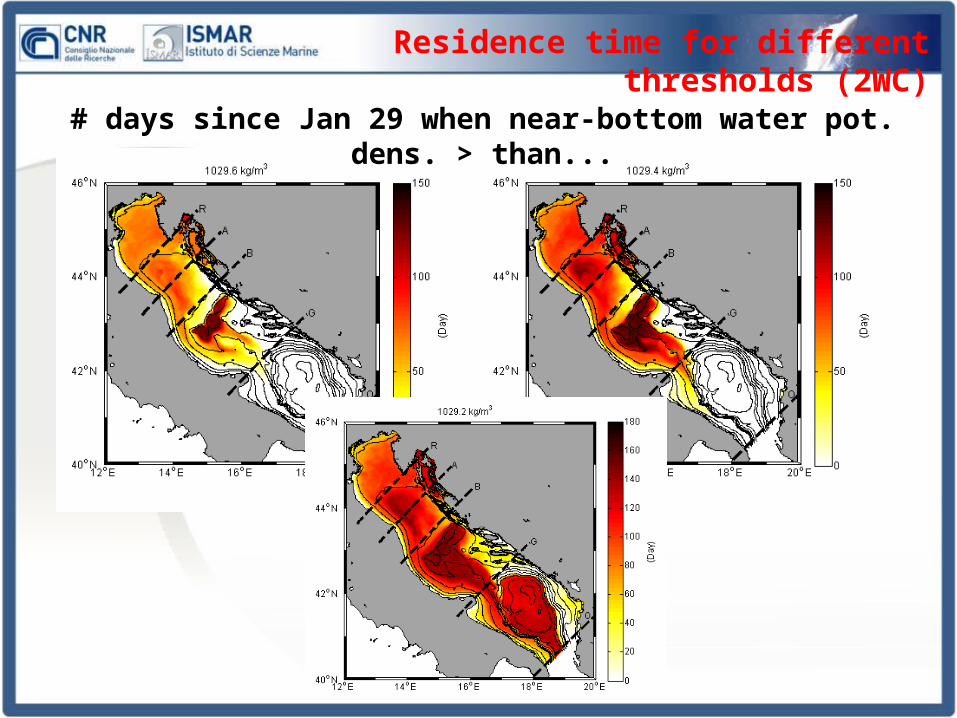
# days since Jan 29 when near-bottom water pot. dens. > than...
Residence time for different thresholds (2WC)

...tidal modulation rather evident (stronger at N and on lighter waters)
DW volume transports: time series
About 1 Sv transport (during CAO, 2/3 of NA water was exchanged)

Cumulative transp. Volumes: Section A---= no tide
Tidal effects on DW volumes

OBS and 2WC model results along channel B (Bari canyon system, 600 m)
Max density= 2-3 weeks after CAOFirst “flash-stroke” faster (30 cm/s). Then slower (8 cm/s)
DW volume in the South: arrival times
...time offset between model and data...bathymetry 1 km???

DW volumes at different transects: 2WC and UNC
We Integrate the time series of slide 23 into volumes at Sections----- = UNC run
From N to S: the very dense water decreases1029.6 increases until “A” (generated between “R” and “A”)
Large difference in “G” and “O” between UNC and 2WC (geostrophic adj. better preserved... why? Entrainment? Threshold?)

near-bottom current(Feb 1 – May 31 mean)
Bathymetry relevance

Density Anomaly: how it changes and along which paths travels from North to South Adriatic Sea (Feb-Jun)
A useful “DW roadmap”
Take-home messages
during February 2012, NAdDW production area occupied most of the basin > 43.5 °N from where it started to flow southerly
in the NA, DWs partially recirculated during the CAO event (that lasted about 15 days) and more than 50% of NA water volume is exported southward by denser waters
Water’s export is driven by two mechanisms: During the first days of CAO, strong and cold winds generate a jet of relatively fast (about 0.3 m/s) and dense waters that reaches the SA, with evidences measured in the Bari canyon system. After CAO’s cessation, NAdDW slowly flows southerly up to emptying the production basin.

Take-home messages
By following near-bottom vein of DWs, we have computed the residence time of masses exceeding a prescribed potential density threshold.
By selecting different thresholds, weakening of DW signal has been followed and sequential pathways of NAdDW identified (water density vein smoothly weakens along its propagation as a result of dilution and mixing with the surrounding ambient waters)
Results integrate the map presented by Vilibić and Supić (2005), with the main differences that a broader production basin and an adjustment towards Italian coast of the DW vein of Jabuka origin was depicted (see “DW” roadmap).

Take-home messages
Volumes transported show that DW fluxes are triggered by tidal effects, with strong instantaneous modulation. Further analysis would give insight on how kinetic and potential energies of NAdDW vein may be cyclically modified by tides.
2WC/UNC: in the NAdDW production area, the effects of wave forces that are removed from RANS equations modify intensity of ocean circulation (about 15% of the current speed and 10% of the average heat budget)
This can imply modified NAdDW volumes flowing to the SA and tracers features at both sub-basin and local scale, close to river mouths.

Take-home message
NAdDW splitting is present in the Central Adriatic, where two veins of underflow are identified: one on the Italian coast and another spilling from Jabuka pit. These veins partially merge in the area between Gargano peninsula and Palagruza sill.
Dilution of DWs along their paths is such that, close to the SAP (where DW can eventually cascade), DWs are identified with a difference of 0.8 kg/m3 compared to northern masses.
Possible tele-connection between circulation conditions in the NA (where DW are produced) and the amount of DW that reach the southern basin (about 600 km apart) and contribute to the SAP water renewal are to be further investigated