subject index to current population reports and other population report series
TRANSCRIPT

CURRENT POPULATION REPORTS
Special StudiesP23–192
by Linda Morris
U.S. Department of CommerceEconomics and Statistics Administration
BUREAU OF THE CENSUS

Acknowledgments
Linda Morris, Population Division, prepared this report under the direction of LindaShowalter, Statistical Information Staff. Overall direction was provided by LouisaMiller, Assistant Chief, Population Division.
The staff of the Administrative and Customer Services Division, Walter C. Odom,Chief, performed publication planning, design, composition, editorial review, andprinting planning and procurement. Barbara Abbott provided publication coordinationand editing.

CURRENT POPULATION REPORTS
Special StudiesP23–192
Issued August 1996
by Linda Morris
U.S. Department of CommerceMichael Kantor, Secretary
Economics and Statistics Administration
Everett M. Ehrlich, Under Secretary for Economic Affairs
BUREAU OF THE CENSUSMartha Farnsworth Riche, Director

ECONOMICS
AND STATISTICS
ADMINISTRATION
Economics and StatisticsAdministrationEverett M. Ehrlich, Under Secretaryfor Economic Affairs
BUREAU OF THE CENSUSMartha Farnsworth Riche, DirectorBryant Benton, Deputy Director
Paula J. Schneider, Principal AssociateDirector for ProgramsNancy M. Gordon, Associate Directorfor Demographic Programs
POPULATION DIVISIONLouisa F. Miller , Acting Chief
SUGGESTED CITATION
U. S. Bureau of the Census, Current Population Reports, P23-192, Subject Index to CurrentPopulation Reports and Other Population Report Series, U. S. Government Printing Office,Washington, DC 1996.
For sale by Superintendent of Documents, U.S. Government Printing Office, Washington, DC 20402.

iii
Contents
Page
Introduction . . . . . . . . . . . . . . . . . . . . . . . . . . . . . . . . . . . . . . . . . . . . . . . . . . . . . . . . . . . . . . . . . . . . . . . . . . . . . . . . . . . . . . . 1Current Population Reports. . . . . . . . . . . . . . . . . . . . . . . . . . . . . . . . . . . . . . . . . . . . . . . . . . . . . . . . . . . . . . . . . . . . . 1Other Population Report Series . . . . . . . . . . . . . . . . . . . . . . . . . . . . . . . . . . . . . . . . . . . . . . . . . . . . . . . . . . . . . . . . 2
Children and Youth . . . . . . . . . . . . . . . . . . . . . . . . . . . . . . . . . . . . . . . . . . . . . . . . . . . . . . . . . . . . . . . . . . . . . . . . . . . . . . . . 5Older Population . . . . . . . . . . . . . . . . . . . . . . . . . . . . . . . . . . . . . . . . . . . . . . . . . . . . . . . . . . . . . . . . . . . . . . . . . . . . . . . . . . . 7Race . . . . . . . . . . . . . . . . . . . . . . . . . . . . . . . . . . . . . . . . . . . . . . . . . . . . . . . . . . . . . . . . . . . . . . . . . . . . . . . . . . . . . . . . . . . . . . . . 8Hispanic Origin and Ethnic Origin Populations. . . . . . . . . . . . . . . . . . . . . . . . . . . . . . . . . . . . . . . . . . . . . . . . . . . 9Educational Attainment . . . . . . . . . . . . . . . . . . . . . . . . . . . . . . . . . . . . . . . . . . . . . . . . . . . . . . . . . . . . . . . . . . . . . . . . . . . . 10School Enrollment . . . . . . . . . . . . . . . . . . . . . . . . . . . . . . . . . . . . . . . . . . . . . . . . . . . . . . . . . . . . . . . . . . . . . . . . . . . . . . . . . 12Farm and Rural Populations . . . . . . . . . . . . . . . . . . . . . . . . . . . . . . . . . . . . . . . . . . . . . . . . . . . . . . . . . . . . . . . . . . . . . . 14Fertility . . . . . . . . . . . . . . . . . . . . . . . . . . . . . . . . . . . . . . . . . . . . . . . . . . . . . . . . . . . . . . . . . . . . . . . . . . . . . . . . . . . . . . . . . . . . . . 16Income and Wealth/Per Capita Income . . . . . . . . . . . . . . . . . . . . . . . . . . . . . . . . . . . . . . . . . . . . . . . . . . . . . . . . . . 17Income and Wealth. . . . . . . . . . . . . . . . . . . . . . . . . . . . . . . . . . . . . . . . . . . . . . . . . . . . . . . . . . . . . . . . . . . . . . . . . . . . . . 17Per Capita Income and Population Estimates for Counties and Incorporated Places . . . . . . 22
Poverty and Noncash Benefits. . . . . . . . . . . . . . . . . . . . . . . . . . . . . . . . . . . . . . . . . . . . . . . . . . . . . . . . . . . . . . . . . . . . 23Poverty . . . . . . . . . . . . . . . . . . . . . . . . . . . . . . . . . . . . . . . . . . . . . . . . . . . . . . . . . . . . . . . . . . . . . . . . . . . . . . . . . . . . . . . . . . . 23Noncash Benefits. . . . . . . . . . . . . . . . . . . . . . . . . . . . . . . . . . . . . . . . . . . . . . . . . . . . . . . . . . . . . . . . . . . . . . . . . . . . . . . . 26
Households and Families . . . . . . . . . . . . . . . . . . . . . . . . . . . . . . . . . . . . . . . . . . . . . . . . . . . . . . . . . . . . . . . . . . . . . . . . . 27Marital Status and Living Arrangements. . . . . . . . . . . . . . . . . . . . . . . . . . . . . . . . . . . . . . . . . . . . . . . . . . . . . . . . . . 30Geographical Mobility. . . . . . . . . . . . . . . . . . . . . . . . . . . . . . . . . . . . . . . . . . . . . . . . . . . . . . . . . . . . . . . . . . . . . . . . . . . . . . 32Travel to Work . . . . . . . . . . . . . . . . . . . . . . . . . . . . . . . . . . . . . . . . . . . . . . . . . . . . . . . . . . . . . . . . . . . . . . . . . . . . . . . . . . . . . 34Voting and Registration. . . . . . . . . . . . . . . . . . . . . . . . . . . . . . . . . . . . . . . . . . . . . . . . . . . . . . . . . . . . . . . . . . . . . . . . . . . . 35Estimates/Projections of the Voting Age Population. . . . . . . . . . . . . . . . . . . . . . . . . . . . . . . . . . . . . . . . . . . . . 36Profiles . . . . . . . . . . . . . . . . . . . . . . . . . . . . . . . . . . . . . . . . . . . . . . . . . . . . . . . . . . . . . . . . . . . . . . . . . . . . . . . . . . . . . . . . . . . . . 37Special Topics . . . . . . . . . . . . . . . . . . . . . . . . . . . . . . . . . . . . . . . . . . . . . . . . . . . . . . . . . . . . . . . . . . . . . . . . . . . . . . . . . . . . . 39Health and Disability . . . . . . . . . . . . . . . . . . . . . . . . . . . . . . . . . . . . . . . . . . . . . . . . . . . . . . . . . . . . . . . . . . . . . . . . . . . . . . . 41Population Estimate Totals . . . . . . . . . . . . . . . . . . . . . . . . . . . . . . . . . . . . . . . . . . . . . . . . . . . . . . . . . . . . . . . . . . . . . . . . 42Estimates of the Population of States, Counties, and Metropolitan Areas. . . . . . . . . . . . . . . . . . . 45Governmental Units—Population and Per Capita Income Estimates for Counties andIncorporated Places. . . . . . . . . . . . . . . . . . . . . . . . . . . . . . . . . . . . . . . . . . . . . . . . . . . . . . . . . . . . . . . . . . . . . . . . . . . . 47
Household Estimates . . . . . . . . . . . . . . . . . . . . . . . . . . . . . . . . . . . . . . . . . . . . . . . . . . . . . . . . . . . . . . . . . . . . . . . . . . . . . . 48Population Estimates by Age, Race, Hispanic Origin, and Sex. . . . . . . . . . . . . . . . . . . . . . . . . . . . . . . . . 49Population and Household Projections . . . . . . . . . . . . . . . . . . . . . . . . . . . . . . . . . . . . . . . . . . . . . . . . . . . . . . . . . . . 50Inventory of Local and State Agencies Making Estimates and Projections . . . . . . . . . . . . . . . . . . . . 51
Special Census Reports . . . . . . . . . . . . . . . . . . . . . . . . . . . . . . . . . . . . . . . . . . . . . . . . . . . . . . . . . . . . . . . . . . . . . . . . . 52Index of Special Census Reports, 1970 to 1989 . . . . . . . . . . . . . . . . . . . . . . . . . . . . . . . . . . . . . . . . . . . . . . 52Summary of Special Censuses Taken by the Census Bureau . . . . . . . . . . . . . . . . . . . . . . . . . . . . . . . 53

Introduction
CURRENT POPULATION REPORTS Users can order series subscriptions or purchaseindividual reports. CPS microdata files on computer tape
The Current Population Report series has long been and CD-ROM also are available.recognized as an important source of demographic Occasionally reports in the P20, P23, and P60 seriesinformation on a wide variety of population-related top- are designated as ‘‘research/developmental’’ reports, asics. This index is a reference source for data users of the indicated by the notation ‘‘RD’’ in the identificationCurrent Population Reports and is designed to provide a number. Such reports cover information in the develop-ready resource for each subject with the relevant reports mental stage, and not yet considered to be officiallisted sequentially by series number and title. This guide statistics.lists subjects covered in these reports, but does notindicate all cross-classifications (e.g., by age, race, P20: Population—Regularly recurring reports in theHispanic origin1, or sex) or the historical data shown in P20 series contain data on geographical mobility, fertil-some tables. ity, school enrollment, educational attainment, marital
A substantial amount of the current population data status, households and families, persons of Hispanicfrom the Census Bureau is derived from the Current origin, voter registration and participation, and variousPopulation Survey (CPS), the Survey of Income and other topics. Many of these reports show data by race. InProgram Participation (SIPP), and the Population Esti- 1989 regular reports on the Black population (formerly inmates and Projections program. Series P23) were added. Periodic reports on the Asian
The format of the series identifiers is as follows: a P and Pacific Islander population began with informationfollowed by the series number, a dash, and the report from March 1990 and 1991. The report on residents ofnumber (e.g., P20-463). The following abbreviated sym- farms and rural areas was added from Series P27bols will appear with the titles of some reports, to further beginning with the 1988 report, but was discontinuedenhance the information given in the title. after the 1991 publication. Also cited are those reports
prepared in cooperation with other agencies such as theCode definition: Bureau of Agricultural Economics.(A) Advance Report(RD) Research and Development Report P23: Special Studies—Information pertaining to meth-(RV) Revised Report ods, concepts, or specialized data is furnished in the(SIE) Survey of Income and Education Report publications in the P23 series. Also included are focused
analyses of demographic subjects of topical interest and
Current Population Survey occasional reports onmetropolitan-nonmetropolitan popu-lation, youth, women, the older population, and other
The CPS is a household sample survey of the civilian topics.noninstitutional population of the United States. Its pri-mary task is to produce monthly statistics on unemploy- P60: Consumer Income—Information concerning fami-ment and the labor force, as published by the Bureau of lies, individuals, and households at various income andLabor Statistics in its monthly bulletin, ‘‘Employment and poverty levels is presented in the P60 series of reports.Earnings.’’ The CPS also serves as a vehicle for supple- Data are also presented on noncash benefits (includingmental studies on subjects other than employment. health insurance), child support, and the relationship ofFrom the basic and supplemental data, the Census income to age, sex, race, Hispanic origin, family size,Bureau issues the following series of publications: education, occupation, work experience, and other char-
acteristics.1. P20: Population Characteristics
2. P23: Special StudiesSurvey of Income and Program Participation
3. P60: Consumer IncomeThe SIPP is a longitudinal national survey conducted
by the Census Bureau. Its principal purpose is to provide1Persons of Hispanic origin can be of any race. estimates of the economic situation of families and
1

individuals. Recurrent questions deal with employment, estimates were provided in the P25 series. The 1982types of income, participation in government programs estimates were published in individual State reports.and noncash benefits. Periodically, questions are added Beginning in 1984, the estimates were released by Statedealing with school enrollment, marital history, migra- in five regional reports (Northeast, East North Central,tion, child care, disability, and other topics. From time to West North Central, South, and West).time, special supplemental questions also are added. The P26 series was discontinued after the 1988
The data from SIPP are available in reports (P70: reports, and the population estimates now appear in theHousehold Economic Studies ), on microdata tape P25 series, in the paper listings, and on the Internet.files, and on CD-ROM. Users may order individualreports or arrange an annual subscription. P28: Special Censuses—This series is dedicated to
reporting the results of special censuses taken by theCensus Bureau between decennial censuses at the
Population Estimates and Projections request and expense of localities. No report has beenreleased in the series covering censuses taken since
Population estimates and projections are presented in 1985, but listings of special census results appear forthe following series of reports: the later periods in the Population Paper Listing (PPL)1. P25: Population Estimates and Projections series. A description of Special Censuses begins on
page 52 of this report.2. P26: Local Population Estimates
3. P28: Special Censuses. OTHER POPULATION REPORT SERIES
P25: Population Estimates and Projections— Pop- Information produced from the CPS, the SIPP, and theulation estimates data include monthly estimates of the Population Estimates and Projections program is madetotal U.S. population; annual midyear estimates of the available in various paper series in addition to CurrentU.S. population by age, sex, race, and Hispanic origin; Population Reports—Statistical Briefs and paper list-States by age and sex; plus population totals for coun- ings.ties, metropolitan areas, and 36,000 cities and otherlocal governments. The estimates for counties appearedin Series P26 during the 1970’s and 1980’s, as did Statistical Briefsestimates for the 36,000 local governments during the
The Census Bureau released its first Statistical Brief1980’s. Estimates for Puerto Rico and the outlying areas(identified by SB in the index) in 1986 as a means ofwere published in Series P25 through the 1980’s. Thereleasing interesting information obtained from Censusmonthly U.S. population estimates formerly published inBureau surveys and censuses in a concise (2 to 4 page),the P25 series are now available only through theunderstandable, easy-to-read format. In the past, mostInternet.Statistical Briefs were based on data published in aProjections of the U.S. and state populations are alsoprinted report. We are, however, moving toward releas-included in the P25 series. Beginning in the 1980’s,ing more data electronically rather than in a printedprojections are available not only by age and sex, butvolume, and increasingly, Statistical Briefs are beingalso by race and Hispanic origin. There also can beproduced based on unpublished data. This Subjectoccasional research/developmental reports in this series.Index to Current Population Reports and Other Popula-tion Report Series includes only those Statistical BriefsP26: Local Population Estimates—The P26 (Localthat are based on data from the CPS, the SIPP, or thePopulation Estimates) series was dedicated throughoutPopulation Estimates and Projections program. For a fullthe 1970’s and 1980’s to providing annual populationlist of all Statistical Briefs, write to Robert Bernstein,estimates for counties and metropolitan areas, usingPublic Information Office, Bureau of the Census, Wash-standardized methodology mutually agreed on by theington, DC 20233. The first two digits of the StatisticalCensus Bureau and the responsible State agency underBrief number indicate the year of release.the Federal-State Cooperative Program for Population
Estimates. County and metropolitan area (MA) esti-mates from 1981 to 1985 were released in individual Paper ListingsState reports. Beginning in 1986, county estimatesappeared in one comprehensive report and, beginning A series of paper listings was begun in 1994 to helpin 1988, MA estimates also were published in a single ensure and provide a structure for timely data release. Inreport for the year. the past, data listings like these were produced, but
Beginning in 1982, biennial population and per capita were never organized and announced publicly. Follow-income estimates for counties and 36,000 local govern- ing several naming schemes (PPL’s, ISBPL’s, and POV-ment jurisdictions were also included. Previously such PL’s), these listings are photocopies of data tables and
2

generally contain no analysis. As with the printed reports, Electronic Mediathe sources of data are the CPS, SIPP, and the Popu-lation Estimates and Projections program. Most Current Internet is rapidly becoming the primary releasemedium
Population Reports were reduced in physical size in for Census Bureau information. Most of the recent (1995forward) data releases, including Current Population1995; PPL’s provide the detailed data tables formerlyReports and Statistical Briefs, are available through theavailable in the printed reports.Internet (http://www.census.gov/).
Eventually, data from selected paper listings may be The paper listings are frequently available as files onarchived in printed reports; other items, especially those the Internet and computer diskette.likely to undergo successive revisions (e.g., population Call the Population Division (301-457-2422) for moreestimates) may be released only in this paper listing information about any of the reports and products listedformat. in this Subject Index, and the variety of formats.
3

Children and YouthSeries Title
Series P20
P20-32 Children and Youth: 1950P20-184 Women by Number of Own Children Under 5 Years Old: 1968 and 1967P20-205 Women by Number of Own Children Under 5 Years Old: March 1969P20-298 Daytime Care of Children: October 1974 and February 1975
Series P23
P23-30 Characteristics of American Youth (issued 1970)P23-34 Characteristics of American Youth: 1970P23-40 Characteristics of American Youth: 1971P23-44 Characteristics of American Youth: 1972P23-51 Characteristics of American Youth: 1974
P23-66 Characteristics of American Children and Youth: 1976P23-84 Divorce, Child Custody, and Child Support (issued 1979)P23-106 Child Support and Alimony: 1978 (A)P23-112 Child Support and Alimony: 1978P23-114 Characteristics of American Children and Youth: 1980
P23-117 Trends in Child Care Arrangements of Working Mothers (issued 1982)P23-124 Child Support and Alimony: 1981 (A)P23-129 Child Care Arrangements of Working Mothers: June 1982P23-140 Child Support and Alimony: 1981P23-141 Child Support and Alimony: 1983
P23-148 Child Support and Alimony: 1983 (Supplemental Report)P23-149 After-School Care of School-Age Children: December 1984P23-152 Child Support and Alimony: 1985 (A)P23-154 Child Support and Alimony: 1985 (Supplemental Report)P23-162 Studies in Marriage and the Family (issued 1989)
P23-163 Changes in American Family Life (issued 1989)P23-167 Child Support and Alimony: 1987P23-181 Households, Families, and Children: A 30-Year Perspective (issued 1992)
Series P60
P60-8 American Children: Economic Characteristics of Their Families (issued 1951)P60-173 Child Support and Alimony: 1989P60-187 Child Support for Custodial Mothers and Fathers: 1991
Series P70
P70-9 Who’s Minding the Kids? Child Care Arrangements: Winter 1984-85P70-13 Who’s Helping Out? Support Networks Among American Families (issued 1988)P70-20 Who’s Minding the Kids? Child Care Arrangements: 1986-87P70-23 Family Disruption and Economic Hardship: Short-Run Picture of Children (issued 1991)P70-28 Who’s Helping Out? Support Networks Among American Families: 1988
P70-30 Who’s Minding the Kids? Child Care Arrangements: Fall 1988P70-36 Who’s Minding the Kids? Child Care Arrangements: Fall 1991P70-38 The Diverse Living Arrangements of Children: Summer 1991P70-52RV What Does It Cost to Mind Our Preschoolers? (issued 1995)P70-53 Who’s Minding Our Preschoolers? (issued 1996)
Statistical Brief
SB/86-1 Age Structure of the U.S. Population in the 21st CenturySB/87-1 Children and Their Participation in Government Assistance ProgramsSB/87-2 Who’s Minding the Kids?SB/87-4 Where the Children AreSB/88-3 Who’s Helping Out? Support Network Among American Families
5

Children and Youth—Con.
Series Title
Statistical Brief—Con.
SB/89-1 Stepchildren and Their FamiliesSB/89-3 Single Parents and Their ChildrenSB/90-7 Time Off for Babies: Maternity Leave ArrangementsSB/90-11 What Does It Cost to Mind the Kids?SB/91-1 Children’s Well Being: An International Comparison
SB/91-18 Who’s Supporting the Kids?SB/92-5 Support Networks Among American FamiliesSB/92-12 When Families Break UpSB/92-13 Family Life Today. . .And How It Has ChangedSB/94-5 Who’s Minding the Kids?
SB/94-29 Participants in Assistance ProgramsSB/95-2 Mothers Who Receive AFDC Payments—Fertility and Socioeconomic CharacteristicsSB/95-16 Who Receives Child SupportSB/95-22 Mothers Who Receive Food Stamps—Fertility and Socioeconomic CharacteristicsSB/95-27 Getting a Helping Hand, Long-term Participants in Assistance ProgramsSB/95-29 Mothers Who Receive WIC Benefits—Fertility and Socioeconomic Characteristics
6

Older PopulationSeries Title
Series P23
P23-43 Some Demographic Aspects of Aging in the United States (issued 1973)P23-57 Social and Economic Characteristics of the Older Population: 1974P23-59 Demographic Aspects of Aging and the Older Population in the United States (issued 1976)P23-78 The Future of the American Family—Prospective Trends in the Size and Structure of the Elderly
Population, Impact of Mortality Trends, and Some Implications (issued 1979)P23-85 Social and Economic Characteristics of the Older Population: 1978
P23-128 America in Transition: An Aging Society (issued 1983)P23-138 Demographic and Socioeconomic Aspects of Aging in the United States (issued 1984)P23-153 America’s Centenarians Data From the 1980 CensusP23-178RV Sixty-Five Plus in America (issued 1992)P23-190 65+ in the United States (issued 1996)
Series P60
P60-46 Income of the Elderly in 1963
Series P70
P70-7 Household Wealth and Asset Ownership: 1984P70-8 Disability, Functional Limitation, and Health Insurance Coverage: 1984-1985P70-9 Who’s Minding the Kids? Child Care Arrangements: Winter 1984-85P70-12 Pensions: Worker Coverage and Retirement Income, 1984P70-13 Who’s Helping Out? Support Networks Among American Families (issued 1988)
P70-19 The Need for Personal Assistance With Everyday Activities (issued 1990)P70-20 Who’s Minding the Kids? Child Care Arrangements: Winter, 1986-1987P70-22 Household Wealth and Asset Ownership: 1988P70-25 Pensions: Worker Coverage and Retirement Benefits, 1987P70-26 Extended Measures of Well-Being: Selected Data 1984
P70-28 Who’s Helping Out? Support Networks Among American Families: 1988P70-29 Health Insurance Coverage: 1987-1990P70-30 Who’s Minding the Kids? Child Care Arrangements: Fall 1988P70-31 Characteristics of Recipients of Program Participation: 1987-1988P70-33 Americans with Disabilities: 1991-1992
P70-36 Who’s Minding the Kids? Child Care Arrangements: Fall 1991P70-37 Dynamics of Economic Well-Being: Health Insurance, 1990 to 1992P70-41 Dynamics of Economic Well-Being: Program Participation, 1990 to 1992P70-43 Dynamics of Economic Well-Being: Health Insurance, 1991 to 1993P70-44 The Effect of Health Insurance Coverage on Doctor and Hospital Visits: 1990 to 1992P70-46 Dynamics of Economic Well-Being: Program Participation, 1991 to 1993P70-47 Household Economic Studies Asset Ownership of Households: 1993
Statistical Brief
SB/86-1 Age Structure of the U.S. Population in the 21st CenturySB/88-1 Pensions: Planning for the FutureSB/88-3 Who’s Helping Out? Support Networks Among American FamiliesSB/90-12 Persons Needing Assistance With Everyday ActivitiesSB/91-21 Pensions: Who is Covered?
SB/93-6 Preparing for Retirement—Who Had Pension Coverage in 1991?SB/94-1 Americans With DisabilitiesSB/94-29 Participants in Assistance ProgramsSB/95-8 Sixty-Five Plus in the United StatesSB/95-26 What We’re Worth—Asset Ownership of Households: 1993SB/95-27 Getting a Helping Hand, Long-Term Participants in Assistance Programs
7

RaceSeries Title
Series P20
P20-115 Enrollment of Nonwhite Youths Rose Sharply In Last Five Years: 1961P20-142 Negro Population: March 1964P20-155 Negro Population: March 1965P20-168 Negro Population: March 1966P20-175 Negro Population: March 1967
P20-442 The Black Population in the United States: March 1988P20-448 The Black Population in the United States: March 1990P20-459 The Asian and Pacific Islander Population in the United States: March 1991 and 1990P20-464 The Black Population in the United States: March 1991P20-471 The Black Population in the United States: March 1992P20-480 The Black Population in the United States: March 1994 and 1993
Series P23
P23-24 Social and Economic Conditions of Negroes in the United States: October 1967P23-26 Recent Trends in Social and Economic Conditions of Negroes in the United States: July 1968P23-29 The Social and Economic Status of Negroes in the United States, 1969P23-35 Differences Between Incomes of White and Negro Families by Regions, 1969 and 1959P23-38 The Social and Economic Status of Negroes in the United States: 1970
P23-39 Differences Between Incomes of White and Negro Families by Work Experience of Wife and Region:1970, 1969, and 1959
P23-42 The Social and Economic Status of the Black Population in the United States: 1971P23-46 The Social and Economic Status of the Black Population in the United States: 1972P23-48 The Social and Economic Status of the Black Population in the United States: 1973P23-54 The Social and Economic Status of the Black Population in the United States: 1974P23-71 Racial Succession in Individual Housing Units (issued 1978)P23-80 The Social and Economic Status of the Black Population in the United States: An Historical View,
1790-1978P23-182 Exploring Alternative Race-Ethnic Comparison Groups in Current Population Surveys (issued 1992)
Paper Listing
PPL-32 The Asian and Pacific Islander Population: March 1994PPL-45 The Black Population in the United States: March 1995
Statistical Brief
SB/90-3 Blacks in AmericaSB/93-2 Black Americans: A ProfileSB/93-12 Asian and Pacific Islander Americans: A ProfileSB/93-18 Statistical Indicators on Women: An Asian PerspectiveSB/94-12 Blacks in America—1992SB/95-24 The Nation’s Asian and Pacific Islander Population: 1994
Congressional Brief
CB/94-1 Black Children in America: 1993
8

Hispanic Origin and Ethnic Origin PopulationsSeries Title
Series P20
P20-213 Persons of Spanish Origin in the United States: November 1969P20-220 Ethnic Origin and Educational Attainment: November 1969P20-221 Characteristics of the Population by Ethnic Origin: November 1969P20-224 Selected Characteristics of Persons and Families of Mexican, Puerto Rican, and Other Spanish Origin:
March 1971P20-238 Selected Characteristics of Persons and Families of Mexican, Puerto Rican, and Other Spanish Origin:
March 1972
P20-249 Characteristics of the Population by Ethnic Origin: March 1972 and 1971P20-250 Persons of Spanish Origin in the United States: March 1972 and 1971P20-264 Persons of Spanish Origin in the United States: March 1973P20-280 Persons of Spanish Origin in the United States: March 1974P20-290 Persons of Spanish Origin in the United States: March 1975
P20-310 Persons of Spanish Origin in the United States: March 1976P20-329 Persons of Spanish Origin in the United States: March 1977P20-339 Persons of Spanish Origin in the United States: March 1978P20-354 Persons of Spanish Origin in the United States: March 1979P20-396 Persons of Spanish Origin in the United States: March 1982
P20-422 The Hispanic Population in the United States: March 1985P20-434 The Hispanic Population in the United States: March 1986 and 1987P20-438 The Hispanic Population in the United States: March 1988P20-444 The Hispanic Population in the United States: March 1989P20-449 The Hispanic Population in the United States: March 1990
P20-455 The Hispanic Population in the United States: March 1991P20-465RV The Hispanic Population in the United States: March 1992P20-475 The Hispanic Population of the United States: March 1993P20-486 The Foreign-Born Population: 1994
Series P23
P23-60 Language Usage in the United States: July 1975 (A)P23-82 Coverage of the Hispanic Population of the United States in the 1970 CensusP23-116 Ancestry and Language in the United States: November 1979P23-172 The Hispanic Population of the U.S. Southwest Borderland (issued 1991)P23-182 Exploring Alternative Race-Ethnic Comparison Groups in Current Population Surveys (issued 1992)P23-183 Hispanic Americans Today (issued 1993)
Paper Listing
PPL-26 Hispanic Tabulations From the Current Population Survey: March 1994PPL-31 The Foreign-Born Population: 1994
Statistical Brief
SB/90-4 Hispanics in the United StatesSB/95-25 The Nation’s Hispanic Population: 1994
9

Educational AttainmentSeries Title
Series P20
P20-15P20-45P20-91P20-99P20-121
P20-132P20-138P20-158P20-169P20-182
P20-194P20-207P20-209P20-214P20-217
P20-219P20-220P20-227P20-229P20-243
P20-274P20-295P20-314P20-334P20-356
P20-390P20-415P20-428P20-451P20-462P20-476
Series P23
P23-6P23-8P23-9P23-116P23-133P23-136
Series P60
P60-56
P60-74
P60-92
P60-139P60-153P60-167
Educational Attainment of the Civilian Population: April 1947School Enrollment, Educational Attainment, and Illiteracy: October 1952Projections of Educational Attainment in the United States: 1960 to 1980Literacy and Educational Attainment: March 1959Educational Attainment: March 1962
Educational Change in a Generation: March 1962Educational Attainment: March 1964Educational Attainment: March 1966 and 1965Educational Attainment: March 1967Educational Attainment: March 1968
Educational Attainment: March 1969Educational Attainment: March 1970Educational Attainment in 30 Selected Standard Metropolitan Statistical Areas: 1967Educational Attainment in 30 Selected Standard Metropolitan Statistical Areas: 1968Illiteracy in the United States: November 1969
Educational Attainment in 30 Selected Standard Metropolitan Statistical Areas: 1969Ethnic Origin and Educational Attainment: November 1969Educational Attainment in 30 Selected Standard Metropolitan Statistical Areas: 1970Educational Attainment: March 1971Educational Attainment: March 1972
Educational Attainment in the United States: March 1973 and 1974Educational Attainment in the United States: March 1975Educational Attainment in the United States: March 1977 and 1976Demographic, Social, and Economic Profile of States: Spring 1976 (SIE)Educational Attainment in the United States: March 1978 and 1979
Educational Attainment in the United States: March 1981 and 1980Educational Attainment in the United States: March 1982 to 1985Educational Attainment in the United States: March 1987 and 1986Educational Attainment in the United States: March 1989 and 1988Educational Attainment in the United States: March 1991 and 1990Educational Attainment in the United States: March 1993 and 1992
Estimates of Illiteracy by States: 1950Estimates of Illiteracy by States: 1960Estimates of Median Age at High School and College Graduation: 1960 and 1950Ancestry and Language in the United States: November 1979Earnings in 1981 of Married-Couple Families, by Selected Characteristics of Husbands and WivesLifetime Work Experience and Its Effect on Earnings: Retrospective Data From the 1979 Income SurveyDevelopment Program
Annual Mean Income, Lifetime Income, and Educational Attainment of Men in the United States, forSelected Years, 1956 to 1966Annual Mean Income, Lifetime Income, and Educational Attainment of Men in the United States, forSelected Years, 1956 to 1968Annual Mean Income, Lifetime Income, and Educational Attainment of Men in the United States, forSelected Years, 1956 to 1972Lifetime Earnings Estimates for Men and Women in the United States: 1979Earnings in 1983 of Married-Couple Families, by Characteristics of Husbands and WivesTrends In Income, by Selected Characteristics: 1947 to 1988
10

Educational Attainment—Con.
Series Title
Series P70
P70-11 What’s It Worth? Educational Background and Economic Status: Spring 1984P70-21 What’s It Worth? Educational Background and Economic Status: Spring 1987P70-32 What’s It Worth? Educational Background and Economic Status: Spring 1990P70-51 What’s It Worth? Field of Training & Economic Status: Spring 1993
Paper Listing
ISBPL-7 Education in the United States by Historical Income Summary Measures
Statistical Brief
SB/91-4 Does Education Pay Off?SB/93-7 Education: The Ticket to Higher EducationSB/94-17 More Education Means Higher Career EarningsSB/94-25 Our Scholastic Society
11

School EnrollmentSeries Title
Series P20
P20-1P20-19P20-24P20-30P20-34
P20-40P20-45P20-52P20-54P20-66
P20-70P20-74P20-78P20-80P20-89
P20-93P20-97P20-101P20-107P20-110
P20-115P20-117P20-126P20-128P20-129
P20-133P20-148P20-162P20-167P20-183
P20-185P20-190P20-206P20-222P20-236
P20-241P20-252P20-257P20-260P20-268
P20-270P20-272P20-281P20-284P20-286
P20-289P20-299P20-303P20-318
P20-319
School Enrollment of the Civilian Population: October 1946School Enrollment of the Civilian Population: October 1947School Enrollment of the Civilian Population: October 1948School Enrollment of the Civilian Population: October 1949School Enrollment of the Civilian Population: October 1950
School Enrollment: October 1951School Enrollment, Educational Attainment, and Illiteracy: October 1952School Enrollment: October 1953School Enrollment: October 1954School Enrollment: October 1955
School Enrollment Increase Averages 1.6 Million a Year Since 1953School Enrollment: October 1956School Enrollment Reaches 41.2 Million (issued 1957)School Enrollment: October 1957School Enrollment Continues to Increase (issued 1958)
School Enrollment: October 1958School Enrollment Up 47 Percent Since 1950 (issued 1959)School Enrollment: October 1959Fall School Enrollment at 46 Million (issued 1961)School Enrollment, and Education of Young Adults and Their Fathers: October 1960
Enrollment of Nonwhite Youths Rose Sharply in Last Five Years (issued 1962)School Enrollment: October 1961School Enrollment: October 1962School Enrollment Increases 17 Percent 1958 to 1963School Enrollment: October 1963
Fall 1964 School Enrollment Approximately 52 MillionSchool Enrollment: October 1964School Enrollment: October 1965School Enrollment: October 1966Characteristics of Students and Their Colleges: October 1966
Factors Related to High School Graduation and College Attendance: 1967School Enrollment: October 1968 and 1967School Enrollment: October 1969School Enrollment: October 1970Undergraduate Enrollment in 2-Year and 4-Year Colleges: October 1971
Social and Economic Characteristics of Students: October 1971College Plans of High School Seniors: October 1972Undergraduate Enrollment in 2-Year and 4-Year Colleges: October 1972Social and Economic Characteristics of Students: October 1972Nursery School and Kindergarten Enrollment: October 1973
College Plans of High School Seniors: October 1973Social and Economic Characteristics of Students: October 1973Income and Expenses of Students Enrolled in Postsecondary Schools: October 1973College Plans of High School Seniors: October 1974School Enrollment—Social and Economic Characteristics of Students: October 1974
Major Field of Study of College Students: October 1974College Plans of High School Seniors: October 1975School Enrollment—Social and Economic Characteristics of Students: October 1975Nursery School and Kindergarten Enrollment of Children and Labor Force Status of Their Mothers:October 1967 to October 1976School Enrollment—Social and Economic Characteristics of Students: October 1976
12

School Enrollment—Con.
Series Title
Series P20—Con.
P20-333 School Enrollment—Social and Economic Characteristics of Students: October 1977P20-337 Relative Progress of Children in School: 1976 (SIE)P20-342 Travel to School: October 1978P20-343 Vocational School Experience: October 1976P20-346 School Enrollment—Social and Economic Characteristics of Students: October 1978
P20-348 Living Arrangements of College Students: 1976P20-351 Major Field of Study of College Students: October 1978P20-360 School Enrollment—Social and Economic Characteristics of Students: October 1979P20-400 School Enrollment—Social and Economic Characteristics of Students: October 1981 and 1980P20-408 School Enrollment—Social and Economic Characteristics of Students: October 1982
P20-413 School Enrollment—Social and Economic Characteristics of Students: October 1983P20-426 School Enrollment—Social and Economic Characteristics of Students: October 1985 and 1984P20-429 School Enrollment—Social and Economic Characteristics of Students: October 1986P20-443 School Enrollment—Social and Economic Characteristics of Students: October 1988 and 1987P20-452 School Enrollment—Social and Economic Characteristics of Students: October 1989
P20-460 School Enrollment—Social and Economic Characteristics of Students: October 1990P20-469 School Enrollment—Social and Economic Characteristics of Students: October 1991P20-474 School Enrollment—Social and Economic Characteristics of Students: October 1992P20-479 School Enrollment—Social and Economic Characteristics of Students: October 1993
Series P23
P23-121 Private School Enrollment, Tuition, and Enrollment Trends: October 1979
Series P27
P27-30 Educational Status, College Plans, and Occupational Status of Farm and Nonfarm Youths:October 1959
P27-32 Factors Related to College Attendance of Farm and Nonfarm High School Graduates: 1960
Series P70
P70-39 Dollars for Scholars: Postsecondary Costs and Financing, 1990-1991
Statistical Brief
SB/94-21 Dollars for Scholars—Postsecondary Costs and FinancingSB/94-25 Our Scholastic Society
13

Farm and Rural PopulationsSeries Title
CENSUS—BUREAU OF AGRICULTURAL ECONOMICS (BAE)
1 Estimates of Farm Population and Farm Households: April 1944 and April 19402 Farm Population Changes in 1944PS-2 Estimated Civilian Population by Farm Residence, Age, and Sex: April 19443 Farm Operators in the United States: April 1944 and April 19404 Net Movement Away From Farms in the United States, by Age and Sex: 1940 to 1944
5 Recent Changes in Farm Population6 Off-Farm Work of Farm Operators and Members of Their Households: 1943PS-6 Shifts in Farm Population: December 1941 to March 19457 Farm Population Changes: April 1940 to January 19468 Recent Farm Population Changes: April 1946
9 Farm Dwellings and Farm Population: January 194510 Farm Population: January 194711 Farm Population Changes: 1940 to 194712 Estimates of the Farm Population of the United States: 1940 to 194813 Estimated Farm Population of the United States: January 1949
14 Estimates of the Farm Population of the United States: 1940 to 194915 State Economic Areas of the United States (issued 1950)16A Estimates of the Farm Population: 1910 to 195016 Revised Estimates of the Farm Population of the United States: 1910 to 195017 Estimates of the Farm Population of the United States: April 1950 and April 195118 Estimates of the Farm Population of the United States: April 1950 to April 195219 Economic Subregions of the United States (issued 1953)
CENSUS—AGRICULTURE MARKETING SERVICE (AMS)
Series P27
P27-20 Estimates of the Farm Population of the United States: April 1950 to April 1954P27-21 Estimates of the Farm Population of the United States: April 1950 to April 1955P27-22 Rural-Farm Males Entering and Leaving Working Ages: 1940-50 and 1950-60: Replacement Ratios
and RatesP27-23 Estimates of the Farm Population of the United States: April 1950 to 1956P27-24 Estimates of the Farm Population of the United States: April 1950 to 1957
P27-25 Estimates of the Farm Population of the United States: April 1950 to 1958P27-26 Estimates of the Farm Population of the United States: April 1950 to 1959P27-27 Educational Status and School Plans of Farm and Nonfarm Youth: October 1959 (A)P27-28 Effect of Definition Changes on Size and Composition of the Rural-Farm Population: April 1960
and 1959P27-29 Estimates of the Rural-Farm Population of the United States: April 1960
CENSUS—ECONOMIC RESEARCH SERVICE (ERS)
Series P27
P27-30 Educational Status, College Plans, and Occupational Status of Farm and Nonfarm Youths:October 1959
P27-31 Estimates of the Farm Population of the United States: April 1961P27-32 Factors Related to College Attendance of Farm and Nonfarm High School Graduates: 1960P27-33 Estimates of the Farm Population of the United States: April 1962P27-34 Estimates of the Farm Population of the United States: April 1963
P27-35 Estimates of the Farm Population of the United States: 1964P27-36 Farm Population of the United States: 1965P27-37 Farm Population of the United States: 1966P27-38 Preliminary Estimates of the Farm Population of the United States: 1967P27-39 Farm Population of the United States: 1967
14

Farm and Rural Populations—Con.
Series Title
CENSUS—ECONOMIC RESEARCH SERVICE (ERS)—Con.
Series P27—Con.
P27-40 Farm Population of the United States: 1968P27-41 Farm Population of the United States: 1969P27-42 Farm Population of the United States: 1970P27-43 Farm Population of the United States: 1971P27-44 Farm Population of the United States: 1972
P27-45 Farm Population of the United States: 1973P27-46 Farm Population of the United States: 1974P27-47 Farm Population of the United States: 1975P27-48 Farm Population of the United States: 1976 (A)P27-49 Farm Population of the United States: 1976(Concludes series of joint Census-ERS publications)
P27-50 Farm Population of the United States: 1977 (A)P27-51 Farm Population of the United States: 1977P27-52 Farm Population of the United States: 1978P27-53 Farm Population of the United States: 1979P27-54 Farm Population of the United States: 1980
P27-55 Farm Population of the United States: 1981P27-56 Farm Population of the United States: 1982P27-57 Farm Population of the United States: 1983P27-58 Farm Population of the United States: 1984P27-59 Farm Population of the United States: 1985P27-60 Farm Population of the United States: 1986P27-61 Rural and Rural Farm Population: 1987(Last report in this series)
Series P20
P20-439 Rural and Rural Farm Population: 1988P20-446 Residents of Farms and Rural Areas: 1989P20-457 Residents of Farms and Rural Areas: 1990P20-472 Residents of Farms and Rural Areas: 1991
(Concludes the series on Residents of Farms and Rural Areas)
15

FertilitySeries Title
Series P20
P20-8 Differential Fertility: June 1946P20-18 Fertility: April 1946P20-27 Marital Fertility: April 1949P20-29 Estimated Net Reproduction Rates for the White Population, by Counties: April 1935 to April 1940P20-46 Fertility of the Population: April 1952
P20-65 Fertility of the Population: April 1954P20-84 Fertility of the Population: March 1957P20-108 Marriage, Fertility, and Childspacing: August 1959P20-136 Continuing Increase in the Average Number of Children Ever Born: 1940 to 1964 (A)P20-147 Fertility of the Population: June 1964 and March 1962
P20-184 Women by Number of Own Children Under 5 Years Old: 1968 and 1967P20-186 Marriage, Fertility, and Childspacing: June 1965P20-196 Changes in the Average Number of Children Ever Born to Women: 1960 to November 1969 (A)P20-203 Fertility of the Population: January 1969P20-205 Women by Number of Own Children Under 5 Years Old: March 1969
P20-211 Previous and Prospective Fertility: 1967P20-226 Fertility Variations by Ethnic Origin: November 1969P20-248 Birth Expectations and Fertility: June 1972P20-263 Fertility Histories and Birth Expectations of American Women: June 1971P20-265 Fertility Expectations of American Women: June 1973
P20-277 Fertility Expectations of American Women: June 1974P20-301 Fertility of American Women: June 1975P20-308 Fertility of American Women: June 1976P20-315 Trends in Childspacing: 1975P20-325 Fertility of American Women: June 1977
P20-341 Fertility of American Women: June 1978P20-358 Fertility of American Women: June 1979P20-375 Fertility of American Women: June 1980P20-378 Fertility of American Women: June 1981P20-385 Childspacing Among Birth Cohorts of American Women: 1905 to 1959
P20-387 Fertility of American Women: June 1982P20-395 Fertility of American Women: June 1983P20-401 Fertility of American Women: June 1984P20-406 Fertility of American Women: June 1985P20-421 Fertility of American Women: June 1986
P20-427 Fertility of American Women: June 1987P20-436 Fertility of American Women: June 1988P20-454 Fertility of American Women: June 1990P20-470 Fertility of American Women: June 1992P20-482 Fertility of American Women: June 1994
Series P23
P23-4 Estimated Net Reproduction Rates for the White Population, by Counties, April 1945 to 1950 and 1935to 1940
P23-36 Fertility Indicators: 1970P23-63 Premarital Fertility (issued 1976)P23-70 Perspectives on American Fertility (issued 1978)P23-123 International Fertility Indicators (Analysis Confined to the Mid-70’s) (issued 1983)
P23-142 Future Fertility of Women by Present Age and Parity (Analysis of American Historical Data, 1917-1980)P23-165 Work and Family Patterns of American Women (issued March 1990)P23-176 Studies in American Fertility (issued 1991)
Statistical Brief
SB/91-6 The Shifting Fertility Patterns of American Women
16

Income and Wealth/Per Capita IncomeIncome and Wealth
Series Title
Series P23
P23-35P23-39
P23-47
P23-84P23-106
P23-107P23-112P23-118
P23-124P23-126
P23-132P23-133P23-136
P23-137P23-140
P23-141P23-143P23-146P23-147P23-148
P23-151P23-152P23-154P23-157P23-167
Series P60
P60-1P60-2P60-3P60-4P60-5
P60-6P60-7P60-8P60-9P60-10
P60-11P60-12P60-13P60-14P60-15
P60-16P60-17P60-18P60-19P60-20
Differences Between Incomes of White and Negro Families by Region: 1969 and 1959Differences Between Incomes of White and Negro Families by Work Experience of Wife and Region:1970, 1969, and 1959Illustrative Projections of Money Income Size Distributions for Families and Unrelated Individuals(issued 1974)Divorce, Child Custody, and Child Support (issued 1979)Child Support and Alimony: 1978 (A)
Families Maintained by Female Householders: 1970-79Child Support and Alimony: 1978Wage and Salary Data From the Income Survey Development Program 1979 (Preliminary Data FromInterviewer Period One)Child Support and Alimony: 1981 (A)Estimating After-Tax Money Income Distribution Using Data From the March Current PopulationSurvey (issued 1983)
After-Tax Money Income Estimates of Households: 1981Earnings in 1981 of Married-Couple Families, by Selected Characteristics of Husbands and WivesLifetime Work Experience and Its Effect on Earnings: Retrospective Data From the 1979 IncomeSurvey Development ProgramAfter-Tax Money Income Estimates of Households: 1982Child Support and Alimony: 1981
Child Support and Alimony: 1983After-Tax Money Income Estimates of Households: 1983Women in the American Economy (issued 1986)After-Tax Money Income Estimates of Households: 1984Child Support and Alimony: 1983 (Supplemental Report)
Household After-Tax Income: 1985Child Support and Alimony: 1985 (A)Child Support and Alimony: 1985 (Supplemental Report)Household After-Tax Income: 1986Child Support and Alimony: 1987
Income of Nonfarm Families and Individuals: 1946Family and Individual Money Income in the United States: 1945Income of the Nonfarm Population: 1946Income of Families and Persons in Washington, D.C.: 1947Income of Families and Persons in the United States: 1947
Income of Families and Persons in the United States: 1948Income of Families and Persons in the United States: 1949American Children: Economic Characteristics of Their Families (issued 1951)Income of Families and Persons in the United States: 1950Income of Persons Up 10 Percent in 1951 (A)
Income of Persons in the United States: 1951Family Income in the United States: 1951Income of Persons at New Peak in 1952 (A)Income of Persons in the United States: 1952Family Income in the United States: 1952
Income of Persons in the United States: 1953Income of Persons in 1954 Equals 1953 Level (A)Family Income Equals 1953 Level; Up 7 Percent Over 1952 (A)Income of Persons in the United States: 1954Family Income in the United States: 1954 and 1953
17

Income and Wealth/Per Capita Income—Con.Income and Wealth—Con.
Series Title
Series P60—Con.
P60-21 Income of Men at All-Time High in 1955 (A)P60-22 Family Income Up 6 Percent Since 1954 (A)P60-23 Income of Persons in the United States: 1955P60-24 Family Income in the United States: 1955P60-25 Income of Men at All-Time High in 1956 (A)
P60-26 Family Income Up 8 Percent Since 1955 (A)P60-27 Income of Families and Persons in the United States: 1956P60-28 Average Income Rose Slightly in 1957 Despite Increased Unemployment (A)P60-29 Family Income Up 4 Percent in 1957 (A)P60-30 Income of Families and Persons in the United States: 1957
P60-31 Personal Income Unchanged in 1958 Despite Business Downturn (A)P60-32 Slight Rise in Family Income in 1958 (A)P60-33 Income of Families and Persons in the United States: 1958P60-34 Income of Persons and Families at Record High in 1959 (A)P60-35 Income of Families and Persons in the United States: 1959
P60-36 Average Income of Families Up Slightly in 1960 (A)P60-37 Income of Families and Persons in the United States: 1960P60-38 Average Family Income Increases in 1961 (A)P60-39 Income of Families and Persons in the United States: 1961P60-40 Average Family Income Up 4 Percent in 1962 (A)
P60-41 Income of Families and Persons in the United States: 1962P60-42 Income of Families and Persons at Record High in 1963 (A)P60-43 Income of Families and Persons in the United States: 1963P60-44 Average Family Income Up 5 Percent in 1964 (A)P60-46 Income of the Elderly in 1963
P60-47 Income in 1964 of Families and Persons in the United StatesP60-48 Income in 1964 of Families and Unrelated Individuals by Metropolitan-Nonmetropolitan ResidenceP60-49 Median Family Income Up About 5 Percent in 1965 (A)P60-50 Median Income of Persons Up in 1965 (A)P60-51 Income in 1965 of Families and Persons in the United States
P60-52 Average Family Income Up 7 Percent in 1966 (A)P60-53 Income in 1966 of Families and Persons in the United StatesP60-55 Family Income Advances, Poverty Reduced in 1967 (A)P60-56 Annual Mean Income, Lifetime Income, and Educational Attainment of Men in the United States, for
Selected Years 1956 to 1966P60-57 Household Income in 1967 by Selected Characteristics of the Head
P60-59 Families in the United States (issued 1969)P60-60 Income in 1967 of Persons in the United StatesP60-62 Household Income in 1967 and Selected Social and Economic Characteristics of HouseholdsP60-63 Average Family Income Up 8 Percent in 1968 (A)P60-64 Supplementary Report on Income in 1967 of Families and Persons in the United States
P60-65 Household Income in 1968 and Selected Social and Economic Characteristics of HouseholdsP60-66 Income in 1968 of Families and Persons in the United StatesP60-69 Income Growth Rates in 1939 to 1968 for Persons by Occupation and Industry Groups, for the United
StatesP60-70 Average Family Income Up 9 Percent in 1969 (A)P60-72 Household Income in 1969 and Selected Social and Economic Characteristics of HouseholdsP60-73 Occupation and Earnings of Family Heads in 1969, 1965, and 1959P60-74 Annual Mean Income, Lifetime Income, and Educational Attainment of Men in the United States, for
Selected Years, 1956 to 1968P60-75 Income in 1969 of Families and Persons in the United States
18

Income and Wealth/Per Capita Income—Con.Income and Wealth—Con.
Series Title
Series P60—Con.
P60-78 Median Family Income Up in 1970 (A)P60-79 Household Income in 1970 and Selected Social and Economic Characteristics of HouseholdsP60-80 Income in 1970 of Families and Persons in the United StatesP60-83 Money Income in 1971 of Families and Persons in the United States (A)P60-84 Household Money Income in 1971 and Selected Social and Economic Characteristics of Households
P60-85 Money Income in 1971 of Families and Persons in the United StatesP60-87 Money Income in 1972 of Families and Persons in the United States (A)P60-89 Household Money Income in 1972 and Selected Social and Economic Characteristics of HouseholdsP60-90 Money Income in 1972 of Families and Persons in the United StatesP60-92 Annual Mean Income, Lifetime Income, and Educational Attainment of Men in the United States, for
Selected Years, 1956 to 1972
P60-93 Money Income in 1973 of Families and Persons in the United States (A)P60-96 Household Money Income in 1973 and Selected Social and Economic Characteristics of HouseholdsP60-97 Money Income in 1973 of Families and Persons in the United StatesP60-99 Money Income and Poverty Status of Families and Persons in the United States: 1974 (A)P60-100 Household Money Income in 1974 and Selected Social and Economic Characteristics of Households
P60-101 Money Income in 1974 of Families and Persons in the United StatesP60-103 Money Income and Poverty Status of Families and Persons in the United States1975 and 1974
Revised (A)P60-104 Household Money Income in 1975 and Selected Social and Economic Characteristics of HouseholdsP60-105 Money Income in 1975 of Families and Persons in the United StatesP60-107 Money Income and Poverty Status of Families and Persons in the United States: 1976 (A)
P60-108 Household Money Income in 1975, by Housing Tenure and Residence for the United States,Regions, Divisions, and States (Survey of Income and Education)
P60-109 Household Money Income in 1976 and Selected Social and Economic Characteristics of HouseholdsP60-110 Money Income and Poverty Status in 1975 of Families and Persons in the United States and the
Northeast Region by Divisions and States (Survey of Income and Education)P60-111 Money Income and Poverty Status in 1975 of Families and Persons in the United States and the
North Central Region by Divisions and States (Survey of Income and Education)P60-112 Money Income and Poverty Status in 1975 of Families and Persons in the United States and the
South Region by Divisions and States (Survey of Income and Education)
P60-113 Money Income and Poverty Status in 1975 of Families and Persons in the United States and the WestRegion by Divisions and States (Survey of Income and Education)
P60-114 Money Income in 1976 of Families and Persons in the United StatesP60-116 Money Income and Poverty Status of Families and Persons in the United States: 1977 (A)P60-117 Money Income in 1977 of Households in the United StatesP60-118 Money Income in 1977 of Families and Persons in the United States
P60-120 Money Income and Poverty Status of Families and Persons in the United States: 1978 (A)P60-121 Money Income in 1978 of Households in the United StatesP60-122 Illustrative Projections of Money Income Size Distributions, for Households: 1980 to 1995P60-123 Money Income of Families and Persons in the United States: 1978P60-125 Money Income and Poverty Status of Families and Persons in the United States: 1979 (A)
P60-126 Money Income of Households in the United States: 1979P60-127 Money Income and Poverty Status of Families and Persons in the United States: 1980 (A)P60-129 Money Income of Families and Persons in the United States: 1979P60-132 Money Income of Households, Families, and Persons in the United States: 1980P60-134 Money Income and Poverty Status of Families and Persons in the United States: 1981 (A)
P60-137 Money Income of Households, Families, and Persons in the United States: 1981P60-139 Lifetime Earnings Estimates for Men and Women in the United States: 1979P60-140 Money Income and Poverty Status of Families and Persons in the United States: 1982 (A)P60-142 Money Income of Households, Families, and Persons in the United States: 1982
19

Income and Wealth/Per Capita Income—Con.Income and Wealth—Con.
Series Title
Series P60—Con.
P60-145 Money Income and Poverty Status of Families and Persons in the United States: 1983 (A)P60-146 Money Income of Households, Families, and Persons in the United States: 1983P60-149 Money Income and Poverty Status of Families and Persons in the United States: 1984 (A)P60-151 Money Income of Households, Families, and Persons in the United States: 1984P60-153 Earnings in 1983 of Married-Couple Families, by Characteristics of Husbands and Wives
P60-154 Money Income and Poverty Status of Families and Persons in the United States: 1985 (A)P60-156 Money Income of Households, Families, and Persons in the United States: 1985P60-157 Money Income and Poverty Status of Families and Persons in the United States: 1986 (A)P60-159 Money Income of Households, Families, and Persons in the United States: 1986P60-161 Money Income and Poverty Status in the United States: 1987 (A)
P60-162 Money Income of Households, Families, and Persons in the United States: 1987P60-164RD-1 Measuring the Effect of Benefits and Taxes on Income and Poverty: 1986P60-165 Earnings of Married-Couple Families: 1987P60-166 Money Income and Poverty Status in the United States: 1988 (A)P60-167 Trends In Income by Selected Characteristics: 1947 to 1988
P60-168 Money Income and Poverty Status in the United States: 1989P60-169RD Measuring the Effect of Benefits and Taxes on Income and Poverty: 1989P60-170RD Measuring the Effect of Benefits and Taxes on Income and Poverty: 1987-88 (Supplemental Data)P60-172 Money Income of Households, Families, and Persons in the United States: 1988 and 1989P60-173 Child Support and Alimony: 1989
P60-174 Money Income of Households, Families, and Persons in the United States: 1988 and 1989P60-176RD Measuring the Effect of Benefits and Taxes on Income and Poverty: 1990P60-177 Trends in Relative Income: 1964 to 1989P60-178 Workers With Low Earnings: 1964 to 1990P60-179 Income, Poverty and Wealth in the United States: A Chart Book (issued 1992)
P60-180 Money Income of Households, Families, and Persons in the United States: 1991P60-182RD Measuring the Effect of Benefits and Taxes on Income and Poverty: 1979 to 1991P60-183 Studies in the Distribution of Income (issued 1992)P60-184 Money Income of Households, Families, and Persons in the United States: 1992P60-186RD Measuring the Effect of Benefits and Taxes on Income and Poverty: 1992
P60-187 Child Support for Custodial Mothers and Fathers: 1991P60-188 Income, Poverty, and Valuation of Noncash Benefits: 1993P60-189 Income, Poverty, and Valuation of Noncash Benefits: 1994P60-191 A Brief Look at Postwar U.S. Income Inequality
Series P70
P70-1 Economic Characteristics of Households in the United States: Third Quarter 1983P70-83-4 Economic Characteristics of Households in the United States: Fourth Quarter 1983P70-3 Economic Characteristics of Households in the United States: First Quarter 1984P70-4 Economic Characteristics of Households in the United States: Second Quarter 1984P70-5 Economic Characteristics of Households in the United States: Third Quarter 1984
P70-6 Economic Characteristics of Households in the United States: Fourth Quarter 1984P70-7 Household Wealth and Asset Ownership: 1984P70-10 Male-Female Differences in Work Experience, Occupation, and Earnings: 1984P70-11 What’s It Worth? Educational Background and Economic Status: Spring 1984P70-12 Pensions: Worker Coverage and Retirement Income, 1984
P70-13 Who’s Helping Out? Support Networks Among American Families (issued 1988)P70-15RD-1 Transitions in Income and Poverty Status: 1984-85P70-16RD-2 Spells of Job Search and Layoff and Their Outcomes (issued 1989)P70-18 Transitions in Income and Poverty Status: 1985-1986
20

Income and Wealth/Per Capita Income—Con.Income and Wealth—Con.
Series Title
Series P70—Con.
P70-21 What’s It Worth? Educational Background and Economic Status: Spring 1987P70-22 Household Wealth and Asset Ownership: 1988P70-24 Transitions in Income and Poverty Status: 1987-88P70-25 Pensions: Worker Coverage and Retirement Benefits, 1987P70-26 Extended Measures of Well-Being: Selected Data From the 1984 Survey of Income and Program
Participation
P70-28 Who’s Helping Out? Support Network Among American Families: 1988P70-31 Characteristics of Recipients and the Dynamics of Program Participation: 1987-1988P70-32 What’s It Worth? Educational Background and Economic Status: Spring 1990P70-34 Household Wealth and Asset Ownership: 1991P70-35 Monitoring the Economic Health of American Households (issued 1994)
P70-40 Dynamics of Economic Well-Being: Labor Force and Income 1990 to 1992P70-41 Dynamics of Economic Well-Being: Program Participation 1990 to 1992P70-46 Dynamics of Economic Well-Being: Program Participation 1991 to 1993P70-47 Household Economic Studies Asset Ownership of Households: 1993P70-49 Dynamics of Economic Well-Being: Income, 1991 to 1992P70-51 What’s It Worth? Field of Training and Economic Status: Spring 1993
Technical Paper
TP-8 Trends in the Income of Families and Persons in the United States: 1947 to 1960TP-16 Present Values of Estimated Lifetime Earnings (issued 1967)TP-17 Trends in the Income of Families and Persons in the United States: 1947 to 1964TP-22 Measures of Overlap of Income Distributions of White and Negro Families in the United States
(issued 1970)TP-35 Family (Money) Income 1947 to 1971: Summarizing Twenty-Five Years of a Summary StatisticTP-54 Income Nonresponses: March 1983 CPS
Paper Listing
ISBPL-1 Historical Income Measures for Households in the United StatesISBPL-2 Historical Income Summary Measures for Families in the United StatesISBPL-3 Historical Income Summary Measures for Persons in the United StatesISBPL-4 Historical Health Insurance Coverage StatisticsISBPL-5 Income in the United States: 1993 (selected income tables not included in P60-188)ISBPL-6 Income in the United States: 1994 (selected income tables not included in P60-189)ISBPL-7 Education in the United States by Historical Income Summary Measures
Statistical Brief
SB/88-1 Pensions: Planning for the FutureSB/91-1 Children’s Well-Being: An International ComparisonSB/91-5 How Much Are We Worth? Household Wealth and Asset OwnershipSB/91-21 Pensions: Who is Covered?SB/93-1 America’s Income—Changes Between the Censuses
SB/93-6 Preparing for Retirement: Who Had Pension Coverage in 1991?SB/94-2 Household Wealth and Asset Ownership: 1991SB/94-3RV The Earnings LadderSB/95-1 Income and Job Mobility in the Early 1990’sSB/95-16 Who Receives Child Support
SB/95-17 How Much We Earn—Factors That Make a DifferenceSB/95-26 What We’re Worth—Asset Ownership of Households: 1993SB/95-27 Getting a Helping Hand, Long-Term Participants in Assistance Programs
21

Income and Wealth/Per Capita Income—Con.Per Capita Income and Population Estimates for Counties and Incorporated Places
State 1969,721969,72,74
1969,74,75 1969,77 1979,81 1979,83 1979,85 1979,87
Alabama . . . . . . .Alaska . . . . . . . . .Arizona. . . . . . . . .Arkansas . . . . . . .California . . . . . . .
Colorado . . . . . . .Connecticut. . . . .Delaware . . . . . . .Florida . . . . . . . . .Georgia . . . . . . . .
Hawaii . . . . . . . . .Idaho. . . . . . . . . . .Illinois . . . . . . . . . .Indiana . . . . . . . . .Iowa . . . . . . . . . . .
Kansas. . . . . . . . .Kentucky . . . . . . .Louisiana. . . . . . .Maine . . . . . . . . . .Maryland . . . . . . .
Massachusetts. .Michigan . . . . . . .Minnesota . . . . . .Mississippi. . . . . .Missouri . . . . . . . .
Montana. . . . . . . .Nebraska. . . . . . .Nevada . . . . . . . .New Hampshire.New Jersey. . . . .
New Mexico . . . .New York . . . . . .North Carolina . .North Dakota . . .Ohio . . . . . . . . . . .
Oklahoma . . . . . .Oregon. . . . . . . . .Pennsylvania . . .Rhode Island . . .South Carolina. .
South Dakota . . .Tennessee . . . . .Texas . . . . . . . . . .Utah . . . . . . . . . . .Vermont . . . . . . . .
Virginia . . . . . . . . .Washington. . . . .West Virginia . . .Wisconsin . . . . . .Wyoming . . . . . . .
P25-546P25-547P25-548P25-549P25-550
P25-551P25-552P25-553P25-554P25-555
P25-556P25-557P25-558P25-559P25-560
P25-561P25-562P25-563P25-564P25-565
P25-566P25-567P25-568P25-569P25-570
P25-571P25-572P25-573P25-574P25-575
P25-576P25-577P25-578P25-579P25-580
P25-581P25-582P25-583P25-584P25-585
P25-586P25-587P25-588P25-589P25-590
P25-591P25-592P25-593P25-594P25-595
P25-649P25-650P25-651P25-652P25-653
P25-654P25-655P25-656P25-657P25-658
P25-659P25-660P25-661P25-662P25-663
P25-664P25-665P25-666P25-667P25-668
P25-669P25-670P25-671P25-572P25-673
P25-674P25-675P25-676P25-677P25-678
P25-679P25-680P25-681P25-682P25-683
P25-684P25-685P25-686P25-687P25-688
P25-689P25-690P25-691P25-692P25-693
P25-694P25-695P25-696P25-697P25-698
P25-740P25-741P25-742P25-743P25-744
P25-745P25-746P25-747P25-748P25-749
P25-750P25-751P25-752P25-753P25-754
P25-755P25-756P25-757P25-758P25-759
P25-760P25-761P25-762P25-763P25-764
P25-765P25-766P25-767P25-768P25-769
P25-770P25-771P25-772P25-773P25-774
P25-775P25-776P25-777P25-778P25-779
P25-780P25-781P25-782P25-783P25-784
P25-785P25-786P25-787P25-788P25-789
P25-885P25-886P25-886P25-885P25-886
P25-886P25-882P25-885P25-885P25-885
P25-886P25-886P25-883P25-883P25-884
P25-884P25-885P25-885P25-882P25-885
P25-882P25-883P25-884P25-885P25-884
P25-886P25-884P25-886P25-882P25-882
P25-886P25-882P25-885P25-884P25-883
P25-885P25-886P25-882P25-882P25-885
P25-884P25-885P25-885P25-886P25-882
P25-885P25-886P25-885P25-883P25-886
P26-82-1-SCP-26-82-2-SCP-26-82-3-SC26-82-4-SC26-82-5-SC
26-82-6-SC26-82-7-SC26-82-8-SC26-82-9-SC26-82-10-SC
26-82-11-SC26-82-12-SC26-82-13-SC26-82-14-SC26-82-15-SC
26-82-16-SC26-82-17-SC26-82-18-SC26-82-19-SC26-82-20-SC
26-82-21-SC26-82-22-SC26-82-23-SC26-82-24-SC26-82-25-SC
26-82-26-SC26-82-27-SC26-82-28-SC26-82-29-SC26-82-30-SC
26-82-31-SC26-82-32-SC26-82-33-SC26-82-34-SC26-82-35-SC
26-82-36-SC26-82-37-SC26-82-38-SC26-82-39-SC26-82-40-SC
26-82-41-SC26-82-42-SC26-82-43-SC26-82-44-SC26-82-45-SC
26-82-46-SC26-82-47-SC26-82-48-SC26-82-49-SC26-82-50-SC
P26-84-S-SCP26-84--W-SCP26-84-W-SCP26-84-S-SCP26-84-W-SC
P26-84-W-SCP26-84-NE-SCP26-84-S-SCP26-84-S-SCP26-84-S-SC
P26-84-W-SCP26-84-W-SCP26-84-ENC-SCP26-84-ENC-SCP26-84-WNC-SC
P26-84-WNC-SCP26-84-S-SCP26-84-S-SCP26-84-NE-SCP26-84-S-SC
P26-84-NE-SCP26-84-ENC-SCP26-84-WNC-SCP26-84-S-SCP26-84-WNC-SC
P26-84-84-W-SCP26-84-WNC-SCP26-84-W-SCP26-84-NE-SCP26-84-NE-SC
P26-84-W-SCP26-84-NE-SCP26-84-S-SCP26-84-WNC-SCP26-84-ENC-SC
P26-84-S-SCP26-84-W-SCP26-84-NE-SCP26-84-NE-SCP26-84-S-SC
P26-84-WNC-SCP26-84-S-SCP26-84-S-SCP26-84-W-SCP26-84-NE-SC
P26-84-S-SCP26-84-W-SCP26-84-S-SCP26-84-ENC-SCP26-84-W-SC
P26-86-S-SCP26-86-W-SCP26-86-W-SCP26-86-S-SCP26-86-W-SC
P26-86-W-SCP26-86-NE-SCP26-86-S-SCP26-86-S-SCP26-86-S-SC
P26-86-W-SCP26-86-W-SCP26-86-ENC-SCP26-86-ENC-SCP26-86-WNC-SC
P26-86-WNC-SCP26-86-S-SCP26-86-S-SCP26-86-NE-SCP26-86-S-SC
P26-86-NE-SCP26-86-ENC-SCP26-86-WNC-SCP26-86-S-SCP26-86-WNC-SC
P26-86-W-SCP26-86-WNC-SCP26-86-W-SCP26-86-NE-SCP26-86-NE-SC
P26-86-W-SCP26-86-NE-SCP26-86-S-SCP26-86-WNC-SCP26-86-ENC-SC
P26-86-S-SCP26-86-W-SCP26-86-NE-SCP26-86-NE-SCP26-86-S-SC
P26-86-WNC-SCP26-86-S-SCP26-86-S-SCP26-86-W-SCP26-86-NE-SC
P26-86-S-SCP26-86-W-SCP26-86-S-SCP26-86-ENC-SCP26-86-W-SC
P26-88-S-SCP26-88-W-SCP26-88-W-SCP26-88-S-SCP26-88-W-SC
P26-88-W-SCP26-88-NE-SCP26-88-S-SCP26-88-S-SCP26-88-S-SC
P26-8-W-SCP26-88-W-SCP26-88-ENC-SCP26-88-ENC-SCP26-88-WNC-SC
P26-88-WNC-SCP26-88-S-SCP26-88-S-SCP26-88-NE-SCP26-88-S-SC
P26-88-NE-SCP26-88-ENC-SCP26-88-WNC-SCP26-88-S-SCP26-88-WNC-SC
P26-88-W-SCP26-88-WNC-SCP26-88-W-SCP26-88-NE-SCP26-88-NE-SC
P26-88-W-SCP26-88-NE-SCP26-88-S-SCP26-88-WNC-SCP26-88-ENC-SC
P26-88-S-SCP26-88-W-SCP26-88-NE-SCP26-88-NE-SCP26-88-S-SC
P26-88-WNC-SCP26-88-S-SCP26-88-S-SCP26-88-W-SCP26-88-NE-SC
P26-88-S-SCP26-88-W-SCP26-88-S-SCP26-88-ENC-SCP26-88-W-SC
22

Poverty and Noncash BenefitsPoverty
Series Title
Series P23
P23-18P23-19P23-28P23-37
P23-55
P23-73P23-75
Series P60
P60-45P60-54P60-55P60-58P60-61
P60-67P60-68P60-71P60-76P60-77
P60-81P60-82P60-86P60-88P60-91
P60-94P60-95P60-98P60-99P60-102
P60-103
P60-106P60-107P60-110
P60-111
P60-112
P60-113
P60-115P60-116P60-119
P60-120P60-124P60-125P60-127P60-130
Characteristics of the South and East Los Angeles Areas: November 1965Characteristics of Families Residing in ‘‘Poverty Areas’’ March 1966Revision in Poverty Statistics, 1959 to 1968Social and Economic Characteristics of the Population in Metropolitan and Nonmetropolitan Areas:1970 and 1960Social and Economic Characteristics of the Metropolitan and Nonmetropolitan Population:1974 and 1970Interregional Migration of the Poor: Some Recent Changes (issued 1978)Social and Economic Characteristics of the Metropolitan and Nonmetropolitan Population:1977 and 1970
Low-Income Families and Unrelated Individuals in the United States: 1963The Extent of Poverty in the United States 1959 to 1966Family Income Advances, Poverty Reduced in 1967 (A)Year-Round Workers With Low Earnings in 1966Characteristics of Families and Persons Living in Metropolitan Poverty Areas: 1967
Socioeconomic Trends in Poverty Areas 1960 to 1968Poverty in the United States: 1959 to 1968Poverty Continues to Decline in 1969 (A)24 Million Americans Poverty in the United States: 1969Poverty Increases by 1.2 Million in 1970 (A)
Characteristics of the Low-Income Population: 1970Characteristics of the Low-Income Population: 1971 (A)Characteristics of the Low-Income Population: 1971Characteristics of the Low-Income Population in 1972 (A)Characteristics of the Low-Income Population: 1972
Characteristics of the Low-Income Population: 1973 (A)Supplementary Report on the Low-Income Population: 1966 to 1972Characteristics of the Low-Income Population: 1973Money Income and Poverty Status of Families and Persons in the United States: 1974 (A)Characteristics of the Population Below the Poverty Level: 1974
Money Income and Poverty Status of Families and Persons in the United States: 1975 and 1974Revised (A)Characteristics of the Population Below the Poverty Level: 1975Money Income and Poverty Status of Families and Persons in the United States: 1976 (A)Money Income and Poverty Status in 1975 of Families and Persons in the United States and theNortheast Region, by Divisions and States (Survey of Income and Education)Money Income and Poverty Status in 1975 of Families and Persons in the United States and theNorth Central Region, by Divisions and States (Survey of Income and Education)
Money Income and Poverty Status in 1975 of Families and Persons in the United States and theSouth Region, by Divisions and States (Survey of Income and Education)Money Income and Poverty Status in 1975 of Families and Persons in the United States and theWest Region, by Divisions and States (Survey of Income and Education)Characteristics of the Population Below the Poverty Level: 1976Money Income and Poverty Status of Families and Persons in the United States: 1977 (A)Characteristics of the Population Below the Poverty Level: 1977
Money Income and Poverty Status of Families and Persons in the United States: 1978 (A)Characteristics of the Population Below the Poverty Level: 1978Money Income and Poverty Status of Families and Persons in the United States: 1979 (A)Money Income and Poverty Status of Families and Persons in the United States: 1980 (A)Characteristics of the Population Below the Poverty Level: 1979
23

Poverty and Noncash Benefits—Con.Poverty—Con.
Series Title
Series P60—Con.
P60-133 Characteristics of the Population Below the Poverty Level: 1980P60-134 Money Income and Poverty Status of Families and Persons in the United States: 1981 (A)P60-138 Characteristics of the Population Below the Poverty Level: 1981P60-140 Money Income and Poverty Status of Families and Persons in the United States: 1982 (A)P60-144 Characteristics of the Population Below the Poverty Level: 1982
P60-145 Money Income and Poverty Status of Families and Persons in the United States: 1983 (A)P60-147 Characteristics of the Population Below the Poverty Level: 1983P60-149 Money Income and Poverty Status of Families and Persons in the United States: 1984 (A)P60-152 Characteristics of the Population Below the Poverty Level: 1984P60-154 Money Income and Poverty Status of Families and Persons in the United States: 1985 (A)
P60-157 Money Income and Poverty Status of Families and Persons in the United States: 1986 (A)P60-158 Poverty in the United States: 1985P60-160 Poverty in the United States: 1986P60-161 Money Income and Poverty Status in the United States: 1987 (A)P60-163 Poverty in the United States: 1987
P60-164RD-1 Measuring the Effect of Benefits and Taxes on Income and Poverty: 1986P60-166 Money Income and Poverty Status in the United States: 1988 (A)P60-168 Money Income and Poverty Status in the United States: 1989 (A)P60-169-RD Measuring the Effect of Benefits and Taxes on Income and Poverty: 1989P60-170-RD Measuring the Effect of Benefits and Taxes on Income and Poverty: 1987-88
P60-171 Poverty in the United States: 1988 and 1989P60-175 Poverty in the United States: 1990P60-176-RD Measuring the Effect of Benefits and Taxes on Income and Poverty: 1990P60-178 Workers With Low Earnings: 1964 to 1990P60-179 Income, Poverty and Wealth in the United States A Chart Book (issued 1992)
P60-181 Poverty in the United States: 1991P60-182-RD Measuring the Effect of Benefits and Taxes on Income and Poverty: 1979 to 1991P60-185 Poverty in the United States: 1992P60-186-RD Measuring the Effect of Benefits and Taxes on Income and Poverty: 1992P60-187 Child Support for Custodial Mothers and Fathers: 1991P60-188 Income, Poverty, and Valuation of Noncash Benefits: 1993
Series P70
P70-1 Economic Characteristics of Households in the United States: Third Quarter 1983P70-83-4 Economic Characteristics of Households in the United States: Fourth Quarter 1983P70-3 Economic Characteristics of Households in the United States: First Quarter 1984P70-4 Economic Characteristics of Households in the United States: Second Quarter 1984P70-5 Economic Characteristics of Households in the United States: Third Quarter 1984
P70-6 Economic Characteristics of Households in the United States: Fourth Quarter 1984P70-8 Disability, Functional Limitation and Health Insurance Coverage: 1984-85P70-13 Who’s Helping Out? Support Networks Among American Families (issued 1988)P70-14 Characteristics of Persons Receiving Benefits From Major Assistance Programs: 1984P70-15RD-1 Transitions in Income and Poverty Status: 1984-85P70-18 Transitions in Income and Poverty Status: 1985-1986
P70-23 Family Disruption and Economic Hardship: The Short-Run Picture for Children (issued 1991)P70-24 Transitions in Income and Poverty Status: 1987-88P70-26 Extended Measures of Well-Being: Selected Data From the 1984 Survey of Income and Program
ParticipationP70-28 Who’s Helping Out? Support Networks Among American Families: 1988P70-31 Characteristics of Recipients and the Dynamics of Program Participation: 1987-1988
24

Poverty and Noncash Benefits—Con.Poverty—Con.
Series Title
Series P70—Con.
P70-34 Household Wealth and Asset Ownership: 1991P70-41 Dynamics of Economic Well-Being: Program Participation 1990 to 1992P70-42 Dynamics of Economic Well-Being: Poverty 1990 to 1992P70-45 Dynamics of Economic Well-Being: Poverty 1991 to 1993P70-46 Dynamics of Economic Well-Being: Program Participation 1991 to 1993P70-50RV Beyond Poverty, Extended Measures of Well-Being: 1992P70-52 Beyond Poverty, Extended Measures of Well-Being: 1992
Technical Paper
TP-50 Alternative Methods for Valuing Selected In-Kind Transfer Benefits and Measuring Their Effect onPoverty (issued 1982)
TP-51 Estimates of Poverty Including the Value of Noncash Benefits: 1979 to 1982TP-52 Estimates of Poverty Including the Value of Noncash Benefits: 1983TP-55 Estimates of Poverty Including the Value of Noncash Benefits: 1984TP-56 Estimates of Poverty Including the Value of Noncash Benefits: 1985TP-57 Estimates of Poverty Including the Value of Noncash Benefits: 1986TP-58 Estimates of Poverty Including the Value of Noncash Benefits: 1987
25

Poverty and Noncash BenefitsNoncash Benefits
Series Title
Series P23
P23-61P23-110
Series P60
P60-128P60-131
P60-135P60-136P60-141
P60-143P60-148P60-150P60-155P60-188P60-189
Series POVPL
POVPL-1POVPL-2POVPL-3
Statistical Brief
SB/87-1SB/90-1SB/91-10SB/91-18SB/93-15
SB/94-29SB/94-34SB/95-2SB/95-13SB/95-20
SB/95-22SB/95-27SB/95-29
Characteristics of Households Purchasing Food Stamps (issued 1976)Characteristics of Households and Persons Receiving Noncash Benefits: 1979
Characteristics of Households Receiving Noncash Benefits: 1980 (A)Characteristics of Households and Persons Receiving Selected Noncash Benefits: 1980(with comparable data for 1979)Characteristics of Households Receiving Selected Noncash Benefits: 1981 (A)Characteristics of Households and Persons Receiving Selected Noncash Benefits: 1981Characteristics of Households Receiving Selected Noncash Benefits: 1982 (A)
Characteristics of Households and Persons Receiving Selected Noncash Benefits: 1982Characteristics of Households and Persons Receiving Selected Noncash Benefits: 1983Characteristics of Households and Persons Receiving Selected Noncash Benefits: 1984Receipt of Selected Noncash Benefits: 1985Income, Poverty, and Valuation of Noncash Benefits: 1993Income, Poverty, and Valuation of Noncash Benefits: 1994
Historical Poverty Statistics in the United StatesPoverty Statistics: 1993 (selected poverty tables not included in P60-188)Poverty Statistics: 1994 (selected poverty tables not included in P60-189)
Children and Their Participation in Government Assistance ProgramsThe Revolving Door of PovertyThe Economics of Family DisruptionWho’s Supporting the Kids?Poverty in the United States: Changes Between the Censuses
Participants in Assistance ProgramsPoverty—Long and Short TermMothers Who Receive AFDC PaymentsPoverty AreasPoverty’s Revolving Door
Mother’s Who Receive Food Stamps—Fertility and Socioeconomic CharacteristicsGetting a Helping Hand, Long-Term Participants on Assistance ProgramsMothers Who Receive WIC Benefits—Fertility and Socioeconomic Characteristics
26
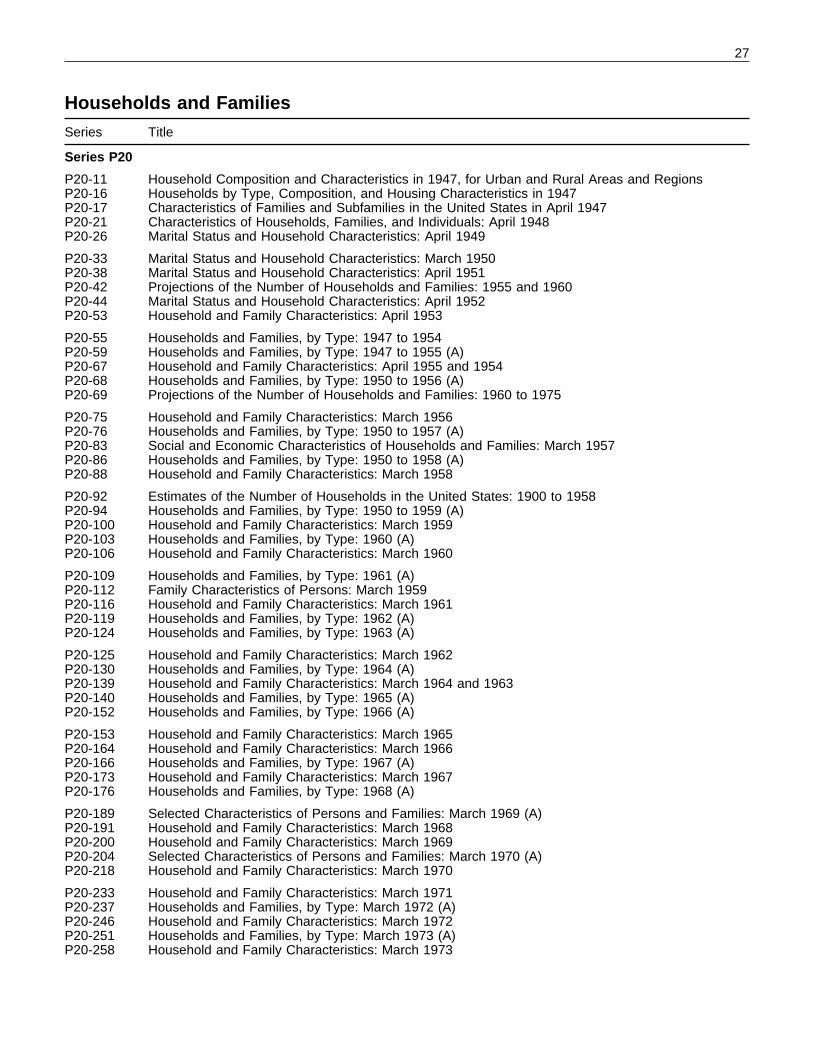
Households and FamiliesSeries Title
Series P20
P20-11P20-16P20-17P20-21P20-26
P20-33P20-38P20-42P20-44P20-53
P20-55P20-59P20-67P20-68P20-69
P20-75P20-76P20-83P20-86P20-88
P20-92P20-94P20-100P20-103P20-106
P20-109P20-112P20-116P20-119P20-124
P20-125P20-130P20-139P20-140P20-152
P20-153P20-164P20-166P20-173P20-176
P20-189P20-191P20-200P20-204P20-218
P20-233P20-237P20-246P20-251P20-258
Household Composition and Characteristics in 1947, for Urban and Rural Areas and RegionsHouseholds by Type, Composition, and Housing Characteristics in 1947Characteristics of Families and Subfamilies in the United States in April 1947Characteristics of Households, Families, and Individuals: April 1948Marital Status and Household Characteristics: April 1949
Marital Status and Household Characteristics: March 1950Marital Status and Household Characteristics: April 1951Projections of the Number of Households and Families: 1955 and 1960Marital Status and Household Characteristics: April 1952Household and Family Characteristics: April 1953
Households and Families, by Type: 1947 to 1954Households and Families, by Type: 1947 to 1955 (A)Household and Family Characteristics: April 1955 and 1954Households and Families, by Type: 1950 to 1956 (A)Projections of the Number of Households and Families: 1960 to 1975
Household and Family Characteristics: March 1956Households and Families, by Type: 1950 to 1957 (A)Social and Economic Characteristics of Households and Families: March 1957Households and Families, by Type: 1950 to 1958 (A)Household and Family Characteristics: March 1958
Estimates of the Number of Households in the United States: 1900 to 1958Households and Families, by Type: 1950 to 1959 (A)Household and Family Characteristics: March 1959Households and Families, by Type: 1960 (A)Household and Family Characteristics: March 1960
Households and Families, by Type: 1961 (A)Family Characteristics of Persons: March 1959Household and Family Characteristics: March 1961Households and Families, by Type: 1962 (A)Households and Families, by Type: 1963 (A)
Household and Family Characteristics: March 1962Households and Families, by Type: 1964 (A)Household and Family Characteristics: March 1964 and 1963Households and Families, by Type: 1965 (A)Households and Families, by Type: 1966 (A)
Household and Family Characteristics: March 1965Household and Family Characteristics: March 1966Households and Families, by Type: 1967 (A)Household and Family Characteristics: March 1967Households and Families, by Type: 1968 (A)
Selected Characteristics of Persons and Families: March 1969 (A)Household and Family Characteristics: March 1968Household and Family Characteristics: March 1969Selected Characteristics of Persons and Families: March 1970 (A)Household and Family Characteristics: March 1970
Household and Family Characteristics: March 1971Households and Families, by Type: March 1972 (A)Household and Family Characteristics: March 1972Households and Families, by Type: March 1973 (A)Household and Family Characteristics: March 1973
27

Households and Families—Con.
Series Title
Series P20—Con.
P20-266 Households and Families, by Type: March 1974 (A)P20-276 Household and Family Characteristics: March 1974P20-282 Households and Families by Type: March 1975 (A)P20-291 Household and Family Characteristics: March 1975P20-296 Households and Families by Type: March 1976 (A)
P20-311 Household and Family Characteristics: March 1976P20-313 Households and Families, by Type: March 1977 (A)P20-326 Household and Family Characteristics: March 1977P20-327 Households and Families, by Type: March 1978 (A)P20-340 Household and Family Characteristics: March 1978
P20-345 Households and Families, by Type: March 1979 (A)P20-352 Household and Family Characteristics: March 1979P20-357 Households and Families, by Type: March 1980 (A)P20-366 Household and Family Characteristics: March 1980P20-367 Households and Families, by Type: March 1981 (A)
P20-371 Household and Family Characteristics: March 1981P20-376 Households, Families, Marital Status, and Living Arrangements: March 1982 (A)P20-381 Household and Family Characteristics: March 1982P20-382 Households, Families, Marital Status, and Living Arrangements: March 1983 (A)P20-388 Household and Family Characteristics: March 1983
P20-391 Households, Families, Marital Status, and Living Arrangements: March 1984 (A)P20-398 Household and Family Characteristics: March 1984P20-402 Households, Families, Marital Status, and Living Arrangements: March 1985 (A)P20-411 Household and Family Characteristics: March 1985P20-412 Households, Families, Marital Status, and Living Arrangements: March 1986 (A)
P20-417 Households, Families, Marital Status, and Living Arrangements: March 1987 (A)P20-419 Household and Family Characteristics: March 1986P20-424 Household and Family Characteristics: March 1987P20-432 Households, Families, Marital Status, and Living Arrangements: March 1988 (A)P20-437 Household and Family Characteristics: March 1988
P20-441 Households, Families, Marital Status, and Living Arrangements: March 1989 (A)P20-447 Household and Family Characteristics: March 1990 and 1989P20-458 Household and Family Characteristics: March 1991P20-467 Household and Family Characteristics: March 1992P20-477 Household and Family Characteristics: March 1993P20-483 Household and Family Characteristics: March 1994
Series P23
P23-50 Female Family Heads (issued 1974)P23-52 Some Recent Changes in American Families (issued 1975)P23-78 The Future of the American Family (and) Prospective Trends in the Size and Structure of the Elderly
Population, Impact of Mortality Trends, and Some Implications (issued 1979)P23-104 American Families and Living Arrangements (issued 1980)P23-107 Families Maintained by Female Householders: 1970-79
P23-162 Studies in Marriage and the Family (issued 1989)P23-163 Changes in American Family Life (issued 1989)P23-165 Work and Family Patterns of American Women (issued 1990)P23-169 Studies in Household and Family Formation, Remarriage Among Women in the United States: 1985
and Living Arrangements of Young Adults Living Independently: Evidence From the LuxembourgIncome Study
P23-179 Studies in Household and Family Formation, When Households Continue, Discontinue and Form(issued 1992)
28

Households and Families—Con.
Series Title
Series P23—Con.
P23-180 Marriage, Divorce, and Remarriage in the 1990’sP23-181 Households, Families, and Children: A 30-Year Perspective (issued 1992)
Series P60
P60-165 Earnings of Married-Couple Families: 1987P60-172 Money Income of Households, Families, and Persons in the United States: 1988 and 1989P60-174 Money Income of Households, Families, and Persons in the United States: 1990P60-180 Money Income of Households, Families, and Persons in the United States: 1991P60-183 Studies in the Distribution of Income: 1992P60-184 Money Income of Households, Families, and Persons in the United States: 1992P60-188 Income, Poverty and Valuation of Noncash Benefits: 1993
Series P70
P70-13 Who’s Helping Out? Support Network Among American Families (issued 1988)P70-23 Family Disruption and Economic Hardship: The Short-Run Picture for Children (issued 1991)P70-24 Transitions in Income and Poverty Status: 1987-1988P70-28 Who’s Helping Out? Support Network Among American Families: 1988P70-34 Household Wealth and Asset Ownership: 1991P70-35 Monitoring the Economic Health of American Households (issued 1994)P70-47 Asset Ownership of Households: 1993
Statistical Brief
SB/88-3 Who’s Helping Out? Support Networks Among American FamiliesSB/89-1 Stepchildren and Their FamiliesSB/89-3 Single Parents and Their ChildrenSB/91-10 The Economics of Family DisruptionSB/92-5 Support Networks Among American FamiliesSB/92-13 Family Life Today. . . And How It Has Changed
29
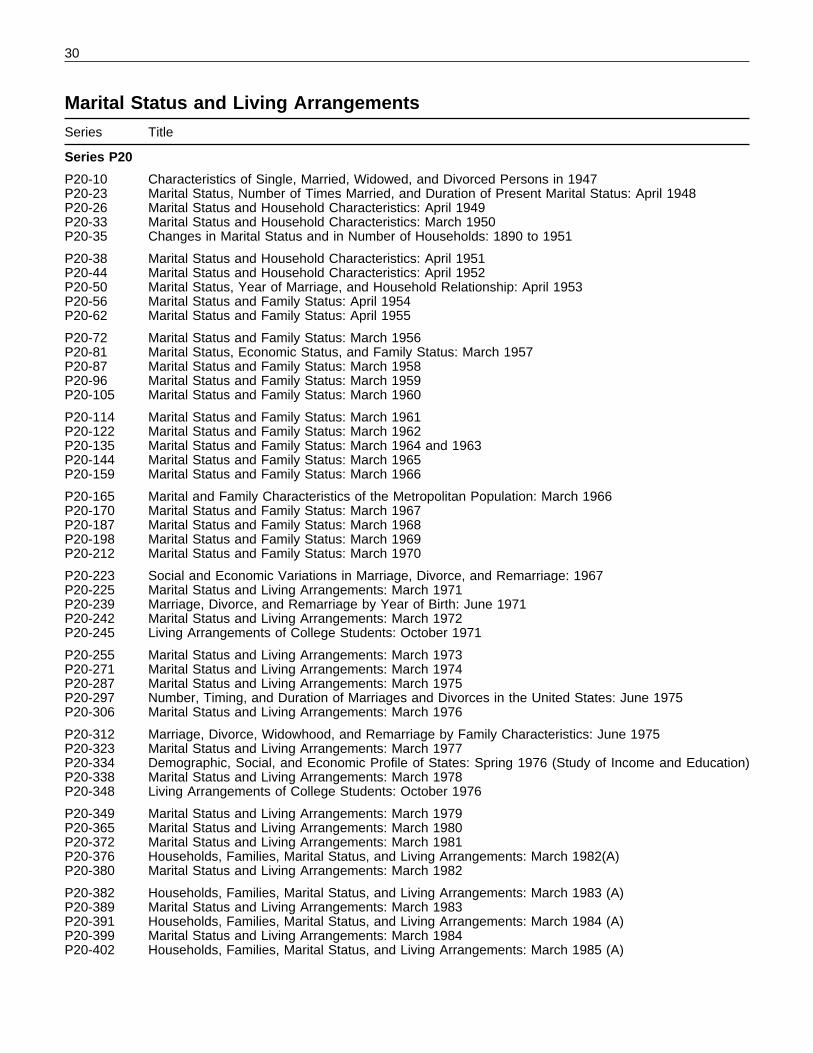
Marital Status and Living ArrangementsSeries Title
Series P20
P20-10P20-23P20-26P20-33P20-35
P20-38P20-44P20-50P20-56P20-62
P20-72P20-81P20-87P20-96P20-105
P20-114P20-122P20-135P20-144P20-159
P20-165P20-170P20-187P20-198P20-212
P20-223P20-225P20-239P20-242P20-245
P20-255P20-271P20-287P20-297P20-306
P20-312P20-323P20-334P20-338P20-348
P20-349P20-365P20-372P20-376P20-380
P20-382P20-389P20-391P20-399P20-402
Characteristics of Single, Married, Widowed, and Divorced Persons in 1947Marital Status, Number of Times Married, and Duration of Present Marital Status: April 1948Marital Status and Household Characteristics: April 1949Marital Status and Household Characteristics: March 1950Changes in Marital Status and in Number of Households: 1890 to 1951
Marital Status and Household Characteristics: April 1951Marital Status and Household Characteristics: April 1952Marital Status, Year of Marriage, and Household Relationship: April 1953Marital Status and Family Status: April 1954Marital Status and Family Status: April 1955
Marital Status and Family Status: March 1956Marital Status, Economic Status, and Family Status: March 1957Marital Status and Family Status: March 1958Marital Status and Family Status: March 1959Marital Status and Family Status: March 1960
Marital Status and Family Status: March 1961Marital Status and Family Status: March 1962Marital Status and Family Status: March 1964 and 1963Marital Status and Family Status: March 1965Marital Status and Family Status: March 1966
Marital and Family Characteristics of the Metropolitan Population: March 1966Marital Status and Family Status: March 1967Marital Status and Family Status: March 1968Marital Status and Family Status: March 1969Marital Status and Family Status: March 1970
Social and Economic Variations in Marriage, Divorce, and Remarriage: 1967Marital Status and Living Arrangements: March 1971Marriage, Divorce, and Remarriage by Year of Birth: June 1971Marital Status and Living Arrangements: March 1972Living Arrangements of College Students: October 1971
Marital Status and Living Arrangements: March 1973Marital Status and Living Arrangements: March 1974Marital Status and Living Arrangements: March 1975Number, Timing, and Duration of Marriages and Divorces in the United States: June 1975Marital Status and Living Arrangements: March 1976
Marriage, Divorce, Widowhood, and Remarriage by Family Characteristics: June 1975Marital Status and Living Arrangements: March 1977Demographic, Social, and Economic Profile of States: Spring 1976 (Study of Income and Education)Marital Status and Living Arrangements: March 1978Living Arrangements of College Students: October 1976
Marital Status and Living Arrangements: March 1979Marital Status and Living Arrangements: March 1980Marital Status and Living Arrangements: March 1981Households, Families, Marital Status, and Living Arrangements: March 1982(A)Marital Status and Living Arrangements: March 1982
Households, Families, Marital Status, and Living Arrangements: March 1983 (A)Marital Status and Living Arrangements: March 1983Households, Families, Marital Status, and Living Arrangements: March 1984 (A)Marital Status and Living Arrangements: March 1984Households, Families, Marital Status, and Living Arrangements: March 1985 (A)
30

Marital Status and Living Arrangements—Con.
Series Title
Series P20—Con.
P20-410 Marital Status and Living Arrangements: March 1985P20-412 Households, Families, Marital Status, and Living Arrangements: March 1986 (A)P20-417 Households, Families, Marital Status, and Living Arrangements: March 1987 (A)P20-418 Marital Status and Living Arrangements: March 1986P20-423 Marital Status and Living Arrangements: March 1987
P20-432 Households, Families, Marital Status, and Living Arrangements: March 1988 (A)P20-433 Marital Status and Living Arrangements: March 1988P20-441 Households, Families, Marital Status, and Living Arrangements: March 1989 (A)P20-445 Marital Status and Living Arrangements: March 1989P20-450 Marital Status and Living Arrangements: March 1990
P20-461 Marital Status and Living Arrangements: March 1991P20-468 Marital Status and Living Arrangements: March 1992P20-478 Marital Status and Living Arrangements: March 1993P20-484 Marital Status and Living Arrangements: March 1994
Series P23
P23-32 Probabilities of Marriage, Divorce, and Remarriage (issued 1970)P23-162 Studies in Marriage and the Family (issued 1989)P23-163 Changes in American Family Life (issued 1989)P23-180 Marriage, Divorce, and Remarriage in the 1990’sP23-181 Households, Families, and Children: A 30-Year Perspective (issued 1992)
Series P70
P70-38 The Diverse Living Arrangements of Children: Summer 1991
Statistical Brief
SB/89-1 Stepchildren and Their FamiliesSB/89-3 Single Parents and Their ChildrenSB/89-4 Singleness in AmericaSB/92-12 When Families Break UpSB/92-13 Family Life Today. . . And How It Has Changed
31

Geographical MobilitySeries Title
Series P20
P20-4P20-14P20-22P20-28P20-36
P20-39P20-47P20-49P20-57P20-61
P20-73P20-82P20-85P20-104P20-113
P20-118P20-127P20-134P20-141P20-150
P20-154P20-156P20-171P20-188P20-193
P20-210P20-235P20-262P20-273P20-285
P20-305P20-320P20-331P20-353P20-368
P20-377P20-384P20-393P20-407P20-420
P20-425P20-430P20-456P20-463P20-473P20-481P20-485
Series P23
P23-11P23-25P23-64P23-71
Postwar Migration and its Causes in the United States: August 1945 to October 1946Internal Migration in the United States: April 1940 to April 1947Internal Migration in the United States: April 1947 to April 1948Internal Migration in the United States: April 1948 to April 1949Internal Migration and Mobility in the United States: March 1949 to March 1950
Mobility of the Population, for the United States: April 1950 to April 1951Mobility of the Population of the United States: April 1952Mobility of the Population of the United States: April 1952 to April 1953Mobility of the Population of the United States: April 1953 to April 1954Mobility of the Population of the United States: April 1954 to April 1955
Mobility of the Population of the United States: March 1955 to 1956Mobility of the Population of the United States: April 1956 to 1957Mobility of the Population of the United States: March 1957 to 1958Mobility of the Population of the United States: April 1958 to 1959Mobility of the Population of the United States: March 1959 to 1960
Mobility of the Population of the United States: March 1960 to March 1961Mobility of the Population of the United States: April 1961 to April 1962Mobility of the Population of the United States: March 1962 to March 1963Mobility of the Population of the United States: March 1963 to March 1964Mobility of the Population of the United States: March 1964 to March 1965
Reasons for Moving: March 1962 to March 1963Mobility of the Population of the United States: March 1965 to March 1966Mobility of the Population of the United States: March 1966 to March 1967Mobility of the Population of the United States: March 1967 to March 1968Mobility of the Population of the United States: March 1968 to March 1969
Mobility of the Population of the United States: March 1969 to March 1970Mobility of the Population of the United States: March 1970 to March 1971Mobility of the Population of the United States: March 1970 to March 1973Mobility of the Population of the United States: March 1970 to March 1974Mobility of the Population of the United States: March 1970 to March 1975
Geographical Mobility: March 1975 to March 1976Geographical Mobility: March 1975 to March 1977Geographical Mobility: March 1975 to March 1978Geographical Mobility: March 1975 to March 1979Geographical Mobility: March 1975 to March 1980
Geographical Mobility: March 1980 to 1981Geographical Mobility: March 1981 to March 1982Geographical Mobility: March 1982 to March 1983Geographical Mobility: March 1983 to March 1984Geographical Mobility: March 1985
Geographical Mobility: March 1985 to March 1986Geographical Mobility: March 1986 to March 1987Geographical Mobility: March 1987 to March 1990Geographical Mobility: March 1990 to March 1991Geographical Mobility: March 1991 to March 1992Geographical Mobility: March 1992 to March 1993Geographical Mobility: March 1993 to March 1994
Lifetime Occupational Mobility of Adult Males: March 1962Lifetime Migration Histories of the American People (issued 1968)The Geographical Mobility of Americans: An International Comparison (issued 1976)Racial Succession in Individual Housing Units (issued 1978)
32

Geographical Mobility—Con.
Series Title
Series P23—Con.
P23-73 Interregional Migration of the Poor: Some Recent Changes (issued 1978)P23-81 Reasons for Interstate Migration: Jobs, Retirement, Climate, and Other Influences (issued 1979)P23-161 Migration Between the United States and Canada (issued 1990)P23-166 Perspectives on Migration Analysis (issued 1990)P23-175 Population Trends in the 1980’s, Trends in International Migration in the United States: 1980-1988
Series P25
P25-701 Gross Migration by County: 1965 to 1970
33

Travel to WorkSeries Title
Series P23
P23-68P23-72P23-86P23-87P23-88
P23-89P23-90P23-91P23-92P23-93
P23-94P23-95P23-96P23-97P23-98
P23-99P23-105P23-122
Selected Characteristics of Travel to Work in 21 Metropolitan Areas: 1975Selected Characteristics of Travel to Work in 20 Metropolitan Areas: 1976Selected Characteristics of Travel to Work in the Philadelphia SMSA: 1975Selected Characteristics of Travel to Work in the Chicago SMSA: 1975Selected Characteristics of Travel to Work in the San Francisco-Oakland SMSA: 1975
Selected Characteristics of Travel to Work in the Atlanta SMSA: 1975Selected Characteristics of Travel to Work in the Paterson-Clifton-Passaic SMSA: 1975Selected Characteristics of Travel to Work in the Milwaukee SMSA: 1975Selected Characteristics of Travel to Work in the San Diego SMSA: 1975Selected Characteristics of Travel to Work in the Miami SMSA: 1975
Selected Characteristics of Travel to Work in the Cincinnati SMSA: 1975Selected Characteristics of Travel to Work in the San Bernardino-Riverside-Ontario SMSA: 1975Selected Characteristics of Travel to Work in the New Orleans SMSA: 1975Selected Characteristics of Travel to Work in the Kansas City SMSA: 1975Selected Characteristics of Travel to Work in the Portland SMSA: 1975
The Journey to Work in the United States: 1975Selected Characteristics of Travel to Work in 20 Metropolitan Areas: 1977The Journey to Work in the United States: 1979
34

Voting and RegistrationSeries Title
Series P20
P20-143 Voter Participation in the National Election November 1964P20-174 Voting and Registration in the Election of November 1966P20-192 Voting and Registration in the Election of November 1968P20-228 Voting and Registration in the Election of November 1970P20-230 Characteristics of New Voters: 1972
P20-253 Voting and Registration in the Election of November 1972P20-293 Voting and Registration in the Election of November 1974P20-322 Voting and Registration in the Election of November 1976P20-344 Voting and Registration in the Election of November 1978P20-370 Voting and Registration in the Election of November 1980
P20-383 Voting and Registration in the Election of November 1982P20-405 Voting and Registration in the Election of November 1984P20-414 Voting and Registration in the Election of November 1986P20-440 Voting and Registration in the Election of November 1988P20-453 Voting and Registration in the Election of November 1990P20-466 Voting and Registration in the Election of November 1992
Series P23
P23-14 1960 Population of Voting Age and Votes Cast for President, 1964 and 1960, for States and CountiesP23-74 Registration and Voting in November 1976—Jurisdictions Covered by the Voting Rights Act
Amendments of 1975P23-102 Nonvoting Americans (issued 1980)P23-131 Voting and Registration Highlights From the Current Population Survey: 1964 to 1980P23-168 Studies in the Measurement of Voter Turnout (issued 1990)
Series P25
P25-627 Language Minority, Illiteracy and Voting Data Used in Making Determinations for the Voting Rights ActAmendments of 1975 (Public Law 94-73) (issued 1976)
Paper Listing
PPL-25RV Voting and Registration in the Election of November 1994
Statistical Brief
SB/91-23 The Decline in American Voter Turnout
35

Estimates/Projections of the Voting Age PopulationSeries Title
UNITED STATES
Series P25
P25-315 Estimates of the Population of Voting Age and of the Percent Voting in General Elections: 1920-1964P25-325 Projections of the Population of Voting Age: November 1966 and 1968
REGIONS/DIVISIONS/STATES
Series P25
P25-15 Estimates of the Population of Voting Age, by States: 1948P25-63 Estimates of the Civilian Population of Voting Age for States: November 1952P25-100 Estimates of the Civilian Population of Voting Age for States: November 1954P25-143 Estimates of the Civilian Population of Voting Age for States: November 1956 and 1952P25-185 Estimates of the Civilian Population of Voting Age for States: November 1958
P25-221 Estimates of the Civilian Population of Voting Age for States: November 1960P25-255 Estimates of the Civilian Population of Voting Age for States: November 1962P25-342 Projections of the Population of Voting Age for States: November 1966 and 1968P25-406 Estimates of the Population of Voting Age for States: November 1, 1968P25-479 Projections of the Population of Voting Age for States: November 1972
P25-526 Projections of the Population of Voting Age for States: November 1974P25-626 Projections of the Population of Voting Age for States: November 1976P25-732 Projections of the Population of Voting Age for States: November 1978P25-879 Projections of the Population of Voting Age for States: November 1980P25-916 Projections of the Population of Voting Age for States: November 1982
P25-948 Projections of the Population of Voting Age for States: November 1984P25-1019 Projections of the Population of Voting Age for States: November 1988P25-1059 Projections of the Voting-Age Population for States: November 1990P25-1085 Projections of the Voting-Age Population for States: November 1992P25-1117 Projections of the Voting-Age Population for States: November 1994
Statistical Brief
SB96-2 Election ’96—Counting the American Electorate
36

ProfilesSeries Title
Series P20
P20-2P20-9
P20-63P20-71P20-79
P20-95P20-98P20-102P20-111P20-131
P20-146P20-151P20-181P20-189P20-197
P20-204P20-216P20-279P20-292P20-307
P20-324P20-334P20-336P20-350P20-363P20-374
Series P23
P23-12P23-16P23-27P23-33P23-37
P23-45P23-49P23-50P23-52P23-53
P23-55
P23-58P23-69P23-75
P23-76
P23-100P23-107P23-108P23-111P23-113
General Characteristics of the Civilian Population of the United States: April 1947Urban and Rural Residence, Age, Sex, Color and Veteran Status of the Civilian Population of the UnitedStates: April 1947Civilian Population of the United States, by Type of Residence April: 1955 and 1950Civilian Population of the United States, by Type of Residence: March 1956 and April 1950Religion Reported by the Civilian Population of the United States: March 1957
Characteristics of Households with Telephones: March 1958Civilian Population of the United States, by Type of Residence: April 1959 and 1950Household Delivery of Daily and Sunday Newspapers: 1959Characteristics of Households with Telephones: March 1960Growth of Metropolitan Areas in the United States: 1960 to 1963
Characteristics of Households with Telephones: March 1965Population of the United States by Metropolitan and Nonmetropolitan Residence: April 1965 and 1960Population of the United States by Metropolitan-Nonmetropolitan Residence: 1968 and 1960Selected Characteristics of Persons and Families: March 1969(A)Population of the United States by Metropolitan-Nonmetropolitan Residence: 1969 and 1960
Selected Characteristics of Persons and Families: March 1970 (A)Labor Union Membership in 1966Population Profile of the United States: 1974Population Profile of the United States: 1975Population Profile of the United States: 1976
Population Profile of the United States: 1977Demographic, Social, and Economic Profile of States: Spring 1976 (Study of Income and Education)Population Profile of the United States: 1978Population Profile of the United States: 1979Population Profile of the United States: 1980Population Profile of the United States: 1981(This is the last Profile published in Series P20. Later reports were published in Series P23.)
Socioeconomic Characteristics of the Population: 1960Americans at Mid Decade (issued 1966)Trends in Social and Economic Conditions in Metropolitan Areas (issued 1969)Trends in Social and Economic Conditions in Metropolitan and Nonmetropolitan Areas (issued 1970)Social and Economic Characteristics of the Population in Metropolitan and Nonmetropolitan Areas:1970 and 1960
Persons in Engineering, Scientific, and Technical Occupations: 1970 and 1972Population of the United States, Trends and Prospects: 1950-1990 (issued 1974)Female Family Heads (issued 1974)Some Recent Changes in American Families (issued 1975)Selected Characteristics of Persons in Fields of Science or Engineering: 1974
Social and Economic Characteristics of the Metropolitan and Nonmetropolitan Population:1974 and 1970A Statistical Portrait of Women in the U.S. (issued 1976)1976 Survey of Institutionalized Persons: A Study of Persons Receiving Long-Term CareSocial and Economic Characteristics of the Metropolitan and Nonmetropolitan Population:1977 and 1970Selected Characteristics of Persons in Fields of Science or Engineering: 1976
A Statistical Portrait of Women in the United States: 1978Families Maintained by Female Householders: 1970-79Selected Characteristics of Persons in Physical Science: 1978Social and Economic Characteristics of Americans During Midlife (issued 1981)Selected Characteristics of Persons in Life Science: 1978
37

Profiles—Con.
Series Title
Series P23—Con.
P23-119 Selected Characteristics of Persons in Environmental Science: 1978P23-120 Selected Characteristics of Persons in Mathematical Specialties: 1978P23-125 Selected Characteristics of Persons in Social Science and Psychology: 1978P23-127 Labor Force Status and Other Characteristics of Persons With a Work Disability: 1982P23-130 Population Profile of the United States: 1982
P23-134 Selected Characteristics of Persons in Computer Specialties: 1978P23-135 Selected Characteristics of Persons in Engineering: 1978P23-145 Population Profile of the United States: 1983/84P23-146 Women in the American Economy (issued 1986)P23-150 Population Profile of the United States: 1984/85
P23-155 Computer Use In the United States: 1984P23-159 Population Profile of the United States: 1989P23-162 Studies in Marriage and the Family (issued 1989)P23-163 Changes in American Family Life (issued 1990)P23-164 How We’re Changing—Demographic State of the Nation: 1989
P23-170 How We’re Changing—Demographic State of the Nation: 1990P23-171 Computer Use in the United States: 1989P23-173 Population Profile of the United States: 1991P23-175 Population Trends in the 1980’sP23-177 How We’re Changing—Demographic State of the Nation: 1992
P23-184 How We’re Changing—Demographic State of the Nation: 1993P23-185 Population Profile of the United States: 1993P23-187 How We’re Changing—Demographic State of the Nation: 1994P23-188 How We’re Changing—Demographic State of the Nation: 1995P23-189 Population Profile of the United States: 1995P23-191 How We’re Changing—Demographic State of the Nation: 1996
Series P70
P70-8 Disability, Functional Limitation, and Health Insurance Coverage: 1984/85 (SIPP)P70-16RD-2 Spells of Job Search and Layoff and Their Outcomes (issued 1989)P70-27 Job Creation During the Late 1980’s: Dynamic Aspects of Employment Growth
Paper Listing
PPL-22 Computer Use in the United States: October 1993
Statistical Brief
SB/95-19RV Women in the United States: A Profile
38

Special TopicsSeries Title
Series P20
P20-342P20-486
Series P23
P23-1P23-13
P23-15P23-22P23-31
P23-41P23-56P23-62
P23-65
P23-67
P23-69P23-82P23-83P23-101P23-103
P23-115
P23-118
P23-126
P23-127P23-136
P23-139P23-158P23-160P23-165P23-182P23-186
Series P25
P25-699
P25-889
P25-933P25-963P25-984P25-1040RD-1
Series P26
P26-21
Travel to School: October 1978The Foreign-Born Population: 1994
The Development of the Urban-Rural Classification in the United States: 1874 to 1949Concepts and Methods Used in Household Statistics on Employment and Unemployment From theCurrent Population Survey: June 1964National Census Survival Rates, by Color and Sex for 1950 to 1960Concepts and Methods Used in Manpower Statistics From the Current Population Survey: June 1967Use of Social Security’s Continuous Work History Sample for Population Estimation (issued 1970)
Preliminary National Census Survival Rates, by Race and Sex for 1960 to 1970Coverage of Population in the 1970 Census and Some Implications for Public ProgramsConcepts and Methods Used in Labor Force Statistics Derived from the Current Population Survey(issued 1976)Developmental Estimates of the Coverage of the Population of States in the 1970 CensusDemographic AnalysisPopulation Estimates by Race, for States: July 1, 1973 and 1975
1976 Survey of Institutionalized Persons: A Study of Persons Receiving Long-Term CareCoverage of the Hispanic Population of the United States in the 1970 CensusCensus Bureau Conference on Issues in Federal Statistical Needs Relating to Women (issued 1979)Housing Successions Among Blacks and Whites in Cities and Suburbs (issued 1980)Methodology for Experimental Estimates of the Population of Counties, by Age and Sex: July 1, 1975
Coverage of the National Population in the 1980 Census by Age, Sex, and Race: PreliminaryEstimates by Demographic AnalysisWage and Salary Data from the Income Survey Development Program (Preliminary Data fromInterview Period One)Estimating After-Tax Money Income Distributions Using Data from the March Current PopulationSurvey (issued 1983)Labor Force Status and Other Characteristics of Persons With a Work Disability: 1982Lifetime Work Experience and its Effects on Earnings: Retrospective Data From the 1979 ISDP(Income Survey Development Program)
County Intercensal Estimates by Age, Sex, and Race: 1970-80Methodology for Experimental County Population Estimates for the 1980’sLabor Force Status and Other Characteristics of Persons With a Work Disability: 1981 to 1988Work and Family Patterns of American Women (issued 1990)Exploring Alternative Race-Ethnic Comparison Groups in Current Population Surveys (issued 1992)Standardization and Decomposition of Rates: A User’s Manual (issued 1993)
Population and Per Capita Money Income Estimates for Local Areas: Detailed Methodology andEvaluation (issued 1980)Comparison of Current Trends with the 1977 Population Projections of the United States(issued 1980)Evaluation of Population Estimation Procedures for States, 1980: an Interim ReportEvaluation of 1980 Subcounty Population EstimatesEvaluation of County Population Estimation Procedures: 1980Population Estimates by Race and Hispanic Origin for States, Metropolitan Areas, and SelectedCounties: 1980 to 1985
Federal-State Cooperative Program for Local Population Estimates: Test Results April 1, 1970
39

Special Topics—Con.
Series Title
Series P70
P70-8 Disability, Functional Limitation, and Health Insurance Coverage: 1984/85P70-16RD-2 Spells of Job Search and Layoff. . . And Their Outcomes (issued 1989)P70-17 Health Insurance Coverage: 1986-88P70-25 Pensions: Worker Coverage and Retirement Benefits, 1987P70-27 Job Creation During Late 1980’s: Dynamic Aspects of Employment Growth
P70-29 Health Insurance Coverage: 1987-1990P70-40 Dynamics of Economic Well-Being: Labor Force and Income, 1990 to 1992P70-48 Dynamics of Economic Well-Being: Labor Force, 1991 to 1993
40

Health and DisabilitySeries Title
Series P23
P23-69 1976 Survey of Institutionalized Persons: A Study of Persons Receiving Long-Term CareP23-127 Labor Force Status and Other Characteristics of Persons With a Work Disability: 1982P23-160 Labor Force Status and Other Characteristics of Persons With a Work Disability: 1981 to 1988
Series P60
P60-190 Health Insurance Coverage: 1994
Series P70
P70-8 Disability, Functional Limitation, and Health Insurance Coverage: 1984/85 (SIPP)P70-17 Health Insurance Coverage 1986-88P70-19 The Need for Personal Assistance with Everyday Activities: Recipients and Caregivers (issued 1990)P70-26 Extended Measures of Well-Being: Selected Data From the 1984 Survey of Income and Program
ParticipationP70-29 Health Insurance Coverage: 1987-1990
P70-31 Characteristics of Recipients and the Dynamics of Program Participation: 1987-1988P70-33 Americans With Disabilities: 1991-92P70-37 Dynamics of Economic Well-Being: Health Insurance, 1990 to 1992P70-41 Dynamics of Economic Well-Being: Program Participation, 1990 to 1992
P70-43 Dynamics of Economic Well-Being: Health Insurance, 1991 to 1993P70-44 The Effect of Health Insurance Coverage on Doctor and Hospital Visits: 1990 to 1992P70-46 Dynamics of Economic Well-Being: Program Participation 1991 to 1993P70-54 Who Loses Coverage and for How Long?
Statistical Brief
SB/90-9 Health Insurance Coverage: The Haves and Have-NotsSB/90-12 Persons Needing Assistance With Everyday ActivitiesSB/92-8 Health Insurance: Who Was Covered Between 1987 and 1990?SB/94-1 Americans With DisabilitiesSB/94-6 Health Insurance Coverage—Who Had a Lapse Between 1990 and 1992
SB/94-28 Health Insurance Coverage—1993SB/95-12 Just What the Doctor Ordered—The Effect of Health Insurance Coverage on Doctor and Hospital VisitsSB/95-21 Health Insurance Coverage—Who Had a Lapse Between 1991 and 1993
41

Population Estimate TotalsSeries Title
UNITED STATES
Series P23
P23-175 Population Trends in the 1980’s
Series P25
P25-632 Estimates of the Population of the United States and Components of Change: 1930 to 1975P25-802 Estimates of the Population of the United States and Components of Change: 1940 to 1978P25-1023 United States Population Estimates and Components of Change: 1970 to 1987P25-1045 United States Population Estimates, by Age, Sex, Race, and Hispanic Origin: 1980 to 1988
(includes components of change)P25-1095 United States Population Estimates, by Age, Sex, Race, and Hispanic Origin: 1980 to 1991P25-1127 National and State Estimates: 1990 to 1994
Paper Listing
PPL-41 U.S. Population Estimates by Age, Sex, Race, and Hispanic Origin: 1990 to 1995
REGIONS/DIVISIONS/STATES
Series P23
P23-175 Population Trends in the 1980’s
Series P25
P25-72 Estimates of the Population of States: July 1, 1940 to 1949P25-139 Estimates of the Population of States: 1900 to 1949P25-304 Revised Estimates of the Population of States and Components of Change: 1950 to 1960P25-460 Preliminary Intercensal Estimates of States and Components of Population Change: 1960 to 1970P25-957 Estimates of the Population of States: 1970 to 1983P25-1106 State Population Estimates by Age and Sex: 1980 to 1992P25-1127 National and State Population Estimates: 1990 to 1994
Paper Listing
PPL-20 Annual Population Change and Components of Change for States: 1980 to 1990 (April 1990 throughJuly 1994 Components of Change for Counties and States)
PPL-44 Population of States by Broad Age Groups and Sex: 1990 and 1995
METROPOLITAN AREAS
Series P23
P23-7 Components of Population Change, 1950 to 1960, for Counties, Standard Metropolitan StatisticalAreas, State Economic Areas, and Economic Subregions
P23-10 Standard Metropolitan Statistical Areas in the United States as Defined October 18, 1963P23-23 Standard Metropolitan Statistical Areas in the United States as Defined May 1, 1967 With Population
in 1960 and 1950P23-175 Population Trends in the 1980’s
Series P25
P25-330 Estimates of the Population of the Largest Standard Metropolitan Statistical Areas: 1960 to 1964P25-335 Estimates of the Population of 17 Large Metropolitan Areas: July 1, 1964 (supplements #330)P25-371 Estimates of the Population of Standard Metropolitan Statistical Areas: July 1, 1965P25-427 Estimates of the Population of Counties and Metropolitan Areas: July 1, 1966P25-432 Estimates of the Population of 100 Large Metropolitan Areas: 1967 and 1968
P25-505 Estimates of the Population of Metropolitan Areas, 1971 and 1972P25-537 Estimates of the Population of Metropolitan Areas, 1972 and 1973, and Components of Change
Since 1970P25-618 Estimates of the Population of Metropolitan Areas, 1973 and 1974, and Components of Change
Since 1970
42

Population Estimate Totals—Con.
Series Title
METROPOLITAN AREAS—Con.
P25-709 Estimates of the Population of Counties and Metropolitan Areas: July 1, 1974 and 1975P25-739 Estimates of the Population of Counties and Metropolitan Areas: July 1, 1975 and 1976P25-810 Estimates of the Population of Counties and Metropolitan Areas: July 1, 1976 and 1977P25-873 Estimates of the Population of Counties and Metropolitan Areas: July 1, 1977 and 1978P25-976 Patterns of Metropolitan Area and County Population Growth: 1980 to 1984P25-1039 Patterns of Metropolitan Area and County Population Growth: 1980 to 1987P25-1108 Population Estimates for Counties and Metropolitan Areas: July 1, 1991
Series P26
P26-85-(St)-C Estimates of the Population of (State) Counties and Metropolitan Areas: July 1,1981 to 1985(50 State reports)
P26-88-B Population Estimates for Metropolitan Statistical Areas, July 1, 1988, 1987, and 1986
Paper Listing
PPL-2 1992 Population Estimates for Metropolitan Areas and Incorporated Cities (Cities Greater than100,000 Population Rank)
PPL-27 Resident Population Change for Metropolitan Areas in the United States by Population Rank:July 1, 1994
PPL-42 Metropolitan Area/New England County Metropolitan Area Population Estimates: July 1, 1995
COUNTIES
Series P23
P23-7 Components of Population Change, 1950 to 1960 for Counties, Standard Metropolitan StatisticalAreas, State Economic Areas, and Economic Subregions
P23-156 Estimates of Households for Counties: July 1, 1985P23-175 Population Trends in the 1980’s
Series P25
P25-427 Estimates of the Population of Counties and Metropolitan Areas: July 1, 1966P25-461 Components of Population Change by County: 1960 to 1970P25-517 Estimates of the Population of Counties: July 1, 1971 and 1972P25-620 Estimates of the Population of Counties: July 1, 1973 and 1974P25-701 Gross Migration by County: 1965 to 1970
P25-709 Estimates of the Population of Counties and Metropolitan Areas: July 1, 1974 and 1975P25-739 Estimates of the Population of Counties and Metropolitan Areas: July 1, 1975 and 1976P25-810 Estimates of the Population of Counties and Metropolitan Areas: July 1, 1976 and 1977P25-873 Estimates of the Population of Counties and Metropolitan Areas: July 1, 1977 and 1978P25-1108 Population Estimates for Counties and Metropolitan Areas: July 1, 1991
Series P26
P26-85-(St)-C Estimates of the Population of (State) Counties and Metropolitan Areas: July 1, 1981 to 1985(50 State reports)
P26-88-A County Population Estimates: July 1, 1988, 1987, and 1986
Paper Listing
PPL-1 Intercensal County Population Estimates: 1980 to 1990PPL-7 July 1, 1992, Population Estimates for Counties (Sorted Alphabetically Within State), including
Components of ChangePPL-10 Preliminary Estimates of the Intercensal Population of Counties, by State: 1970-1979PPL-14 July 1, 1994, Population Estimates for Counties and Components of Change (Sorted Alphabetically
Within State)PPL-35 Population Estimates for Counties and Components of Charge (Sorted Alphabetically Within State):
July 1, 1995PPL-36 Population Estimates for Counties (Sorted Alphabetically within State): July 1, 1990 to
July 1, 1995
43

Population Estimate Totals—Con.
Series Title
INCORPORATED PLACES
Paper Listing
PPL-33 Table 1. Time Series of Resident Population for Places: April 1, 1990 to July 1, 1994(alphabetically within States)
MINOR CIVIL DIVISIONS
Paper Listing
PPL-33 Table 2. Time Series of Resident Population for Minor Civil Divisions: April 1, 1990 to July 1, 1994(alphabetically within county)
OUTLYING AREAS
Series P25
P25-80 Revised Estimates of the Population of Alaska, Hawaii, Puerto Rico, the Canal Zone, and the VirginIslands of the United States: 1940 to 1950
P25-336 Estimates of the Population of Puerto Rico and Other Outlying Areas: 1950 to 1965P25-603 Estimates of the Population of Puerto Rico and Other Outlying Areas: 1960 to 1973P25-943 Estimates of the Population of Puerto Rico and the Outlying Areas: 1970 to 1982P25-1049 Population Estimates for Puerto Rico and the Outlying Areas: 1980 to 1988
44
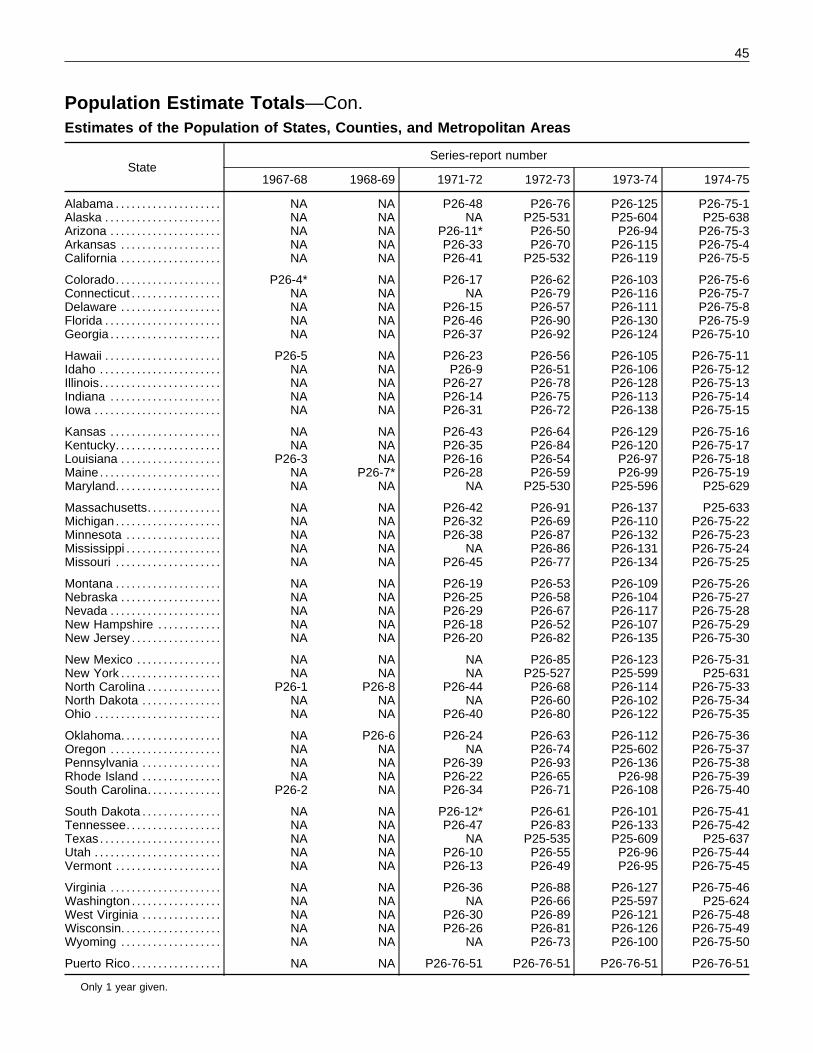
Population Estimate Totals—Con.Estimates of the Population of States, Counties, and Metropolitan Areas
StateSeries-report number
1967-68 1968-69 1971-72 1972-73 1973-74 1974-75
Alabama . . . . . . . . . . . . . . . . . . . .Alaska . . . . . . . . . . . . . . . . . . . . . .Arizona . . . . . . . . . . . . . . . . . . . . .Arkansas . . . . . . . . . . . . . . . . . . .California . . . . . . . . . . . . . . . . . . .
Colorado. . . . . . . . . . . . . . . . . . . .Connecticut . . . . . . . . . . . . . . . . .Delaware . . . . . . . . . . . . . . . . . . .Florida . . . . . . . . . . . . . . . . . . . . . .Georgia . . . . . . . . . . . . . . . . . . . . .
Hawaii . . . . . . . . . . . . . . . . . . . . . .Idaho . . . . . . . . . . . . . . . . . . . . . . .Illinois. . . . . . . . . . . . . . . . . . . . . . .Indiana . . . . . . . . . . . . . . . . . . . . .Iowa . . . . . . . . . . . . . . . . . . . . . . . .
Kansas . . . . . . . . . . . . . . . . . . . . .Kentucky. . . . . . . . . . . . . . . . . . . .Louisiana . . . . . . . . . . . . . . . . . . .Maine. . . . . . . . . . . . . . . . . . . . . . .Maryland. . . . . . . . . . . . . . . . . . . .
Massachusetts. . . . . . . . . . . . . .Michigan . . . . . . . . . . . . . . . . . . . .Minnesota . . . . . . . . . . . . . . . . . .Mississippi . . . . . . . . . . . . . . . . . .Missouri . . . . . . . . . . . . . . . . . . . .
Montana . . . . . . . . . . . . . . . . . . . .Nebraska . . . . . . . . . . . . . . . . . . .Nevada . . . . . . . . . . . . . . . . . . . . .New Hampshire . . . . . . . . . . . .New Jersey . . . . . . . . . . . . . . . . .
New Mexico . . . . . . . . . . . . . . . .New York . . . . . . . . . . . . . . . . . . .North Carolina . . . . . . . . . . . . . .North Dakota . . . . . . . . . . . . . . .Ohio . . . . . . . . . . . . . . . . . . . . . . . .
Oklahoma. . . . . . . . . . . . . . . . . . .Oregon . . . . . . . . . . . . . . . . . . . . .Pennsylvania . . . . . . . . . . . . . . .Rhode Island . . . . . . . . . . . . . . .South Carolina. . . . . . . . . . . . . .
South Dakota . . . . . . . . . . . . . . .Tennessee. . . . . . . . . . . . . . . . . .Texas . . . . . . . . . . . . . . . . . . . . . . .Utah . . . . . . . . . . . . . . . . . . . . . . . .Vermont . . . . . . . . . . . . . . . . . . . .
Virginia . . . . . . . . . . . . . . . . . . . . .Washington . . . . . . . . . . . . . . . . .West Virginia . . . . . . . . . . . . . . .Wisconsin. . . . . . . . . . . . . . . . . . .Wyoming . . . . . . . . . . . . . . . . . . .
Puerto Rico . . . . . . . . . . . . . . . . .
NANANANANA
P26-4*NANANANA
P26-5NANANANA
NANA
P26-3NANA
NANANANANA
NANANANANA
NANA
P26-1NANA
NANANANA
P26-2
NANANANANA
NANANANANA
NA
NANANANANA
NANANANANA
NANANANANA
NANANA
P26-7*NA
NANANANANA
NANANANANA
NANA
P26-8NANA
P26-6NANANANA
NANANANANA
NANANANANA
NA
P26-48NA
P26-11*P26-33P26-41
P26-17NA
P26-15P26-46P26-37
P26-23P26-9P26-27P26-14P26-31
P26-43P26-35P26-16P26-28
NA
P26-42P26-32P26-38
NAP26-45
P26-19P26-25P26-29P26-18P26-20
NANA
P26-44NA
P26-40
P26-24NA
P26-39P26-22P26-34
P26-12*P26-47
NAP26-10P26-13
P26-36NA
P26-30P26-26
NA
P26-76-51
P26-76P25-531P26-50P26-70P25-532
P26-62P26-79P26-57P26-90P26-92
P26-56P26-51P26-78P26-75P26-72
P26-64P26-84P26-54P26-59P25-530
P26-91P26-69P26-87P26-86P26-77
P26-53P26-58P26-67P26-52P26-82
P26-85P25-527P26-68P26-60P26-80
P26-63P26-74P26-93P26-65P26-71
P26-61P26-83P25-535P26-55P26-49
P26-88P26-66P26-89P26-81P26-73
P26-76-51
P26-125P25-604P26-94P26-115P26-119
P26-103P26-116P26-111P26-130P26-124
P26-105P26-106P26-128P26-113P26-138
P26-129P26-120P26-97P26-99P25-596
P26-137P26-110P26-132P26-131P26-134
P26-109P26-104P26-117P26-107P26-135
P26-123P25-599P26-114P26-102P26-122
P26-112P25-602P26-136P26-98P26-108
P26-101P26-133P25-609P26-96P26-95
P26-127P25-597P26-121P26-126P26-100
P26-76-51
P26-75-1P25-638P26-75-3P26-75-4P26-75-5
P26-75-6P26-75-7P26-75-8P26-75-9P26-75-10
P26-75-11P26-75-12P26-75-13P26-75-14P26-75-15
P26-75-16P26-75-17P26-75-18P26-75-19P25-629
P25-633P26-75-22P26-75-23P26-75-24P26-75-25
P26-75-26P26-75-27P26-75-28P26-75-29P26-75-30
P26-75-31P25-631
P26-75-33P26-75-34P26-75-35
P26-75-36P26-75-37P26-75-38P26-75-39P26-75-40
P26-75-41P26-75-42P25-637
P26-75-44P26-75-45
P26-75-46P25-624
P26-75-48P26-75-49P26-75-50
P26-76-51
Only 1 year given.
45

Population Estimate Totals—Con.Estimates of the Population of States, Counties, and Metropolitan Areas —Con.
StateSeries-report number
1975-76 1976-77 1977-78 1980-85 1986-88 1986-88
Alabama . . . . . . . . . . . . . . . . . . . .Alaska . . . . . . . . . . . . . . . . . . . . . .Arizona . . . . . . . . . . . . . . . . . . . . .Arkansas . . . . . . . . . . . . . . . . . . .California . . . . . . . . . . . . . . . . . . .
Colorado. . . . . . . . . . . . . . . . . . . .Connecticut . . . . . . . . . . . . . . . . .Delaware . . . . . . . . . . . . . . . . . . .Florida . . . . . . . . . . . . . . . . . . . . . .Georgia . . . . . . . . . . . . . . . . . . . . .
Hawaii . . . . . . . . . . . . . . . . . . . . . .Idaho . . . . . . . . . . . . . . . . . . . . . . .Illinois. . . . . . . . . . . . . . . . . . . . . . .Indiana . . . . . . . . . . . . . . . . . . . . .Iowa . . . . . . . . . . . . . . . . . . . . . . . .
Kansas . . . . . . . . . . . . . . . . . . . . .Kentucky. . . . . . . . . . . . . . . . . . . .Louisiana . . . . . . . . . . . . . . . . . . .Maine. . . . . . . . . . . . . . . . . . . . . . .Maryland. . . . . . . . . . . . . . . . . . . .
Massachusetts. . . . . . . . . . . . . .Michigan . . . . . . . . . . . . . . . . . . . .Minnesota . . . . . . . . . . . . . . . . . .Mississippi . . . . . . . . . . . . . . . . . .Missouri . . . . . . . . . . . . . . . . . . . .
Montana . . . . . . . . . . . . . . . . . . . .Nebraska . . . . . . . . . . . . . . . . . . .Nevada . . . . . . . . . . . . . . . . . . . . .New Hampshire . . . . . . . . . . . .New Jersey . . . . . . . . . . . . . . . . .
New Mexico . . . . . . . . . . . . . . . .New York . . . . . . . . . . . . . . . . . . .North Carolina . . . . . . . . . . . . . .North Dakota . . . . . . . . . . . . . . .Ohio . . . . . . . . . . . . . . . . . . . . . . . .
Oklahoma. . . . . . . . . . . . . . . . . . .Oregon . . . . . . . . . . . . . . . . . . . . .Pennsylvania . . . . . . . . . . . . . . .Rhode Island . . . . . . . . . . . . . . .South Carolina. . . . . . . . . . . . . .
South Dakota . . . . . . . . . . . . . . .Tennessee. . . . . . . . . . . . . . . . . .Texas . . . . . . . . . . . . . . . . . . . . . . .Utah . . . . . . . . . . . . . . . . . . . . . . . .Vermont . . . . . . . . . . . . . . . . . . . .
Virginia . . . . . . . . . . . . . . . . . . . . .Washington . . . . . . . . . . . . . . . . .West Virginia . . . . . . . . . . . . . . .Wisconsin. . . . . . . . . . . . . . . . . . .Wyoming . . . . . . . . . . . . . . . . . . .
Puerto Rico . . . . . . . . . . . . . . . . .
P26-76-1P25-712P26-76-3P26-76-4P26-76-5
P26-76-6P26-76-7P26-76-8P26-76-9P26-76-10
P26-76-11P26-76-12P26-76-13P26-76-14P26-76-15
P26-76-16P26-76-17P26-76-18P26-76-19P26-76-20
P25-715P26-76-22P26-76-23P26-76-24P26-76-25
P26-76-26P26-76-27P26-76-28P26-76-29P26-76-30
P26-76-31P26-76-32P26-76-33P26-76-34P26-76-35
P26-76-36P26-76-37P26-76-38P26-76-39P26-76-40
P26-76-41P26-76-42P25-717
P26-76-44P26-76-45
P26-76-46P25-707
P26-76-48P26-76-49P26-76-50
P26-76-51
P26-77-1P26-77-2P25-730P26-77-4P26-77-5
P26-77-6P26-77-7P26-77-8P26-77-9P26-77-10
P26-77-11P26-77-12P26-77-13P26-77-14P26-77-15
P26-77-16P26-77-17P26-77-18P26-77-19P26-77-20
P25-797P26-77-22P26-77-23P26-77-24P26-77-25
P26-77-26P26-77-27P26-77-28P26-77-29P26-77-30
P26-77-31P26-77-32P26-77-33P26-77-34P26-77-35
P26-77-36P26-77-37P26-77-38P26-77-39P26-77-40
P26-77-41P26-77-42P25-798
P26-77-44P26-77-45
P26-77-46P25-738
P26-77-48P26-77-49P26-77-50
P26-77-51
P26-78-1P25-866P25-804P26-78-4P26-78-5
P26-78-6P26-78-7P26-78-8P25-869
P26-78-10
P26-78-11P26-78-12P26-78-13P26-78-14P26-78-15
P26-78-16P26-78-17P26-78-18P26-78-19P26-78-20
P25-811P26-78-22P26-78-23P26-78-24P26-78-25
P26-78-26P26-78-27P26-78-28P26-78-29P26-78-30
P26-78-31P26-78-32P26-78-33P26-78-34P26-78-35
P26-78-36P25-813
P26-78-38P26-78-39P26-78-40
P26-78-41P26-78-42P25-867
P26-78-44P26-78-45
P26-78-46P25-808
P26-78-48P26-78-49P26-78-50
NA
P26-85-AL-CP26-85-AK-CP26-85-AZ-CP26-85-AR-CP26-85-CA-C
P26-85-CO-CP26-85-CT-CP26-85-DE-CP26-85-FL-CP26-85-GA-C
P26-85-HI-CP26-85-ID-CP26-85-IL-CP26-85-IN-CP26-85-IA-C
P26-85-KS-CP26-85-KY-CP26-85-LA-CP26-85-ME-CP26-85-MD-C
P26-85-MA-CP26-85-MI-CP26-85-MN-CP26-85-MS-CP26-85-MO-C
P26-85-MT-CP26-85-NE-CP26-85-NV-CP26-85-NH-CP26-85-NJ-C
P26-85-NM-CP26-85-NY-CP26-85-NC-CP26-85-ND-CP26-85-OH-C
P26-85-OK-CP26-85-OR-CP26-85-PA-CP26-85-RI-CP26-85-SC-C
P26-85-SD-CP26-85-TN-CP26-85-TX-CP26-85-UT-CP26-85-VT-C
P26-85-VA-CP26-85-WA-CP26-85-WV-CP26-85-WI-
P26-85-WY-C
P26-84-51
P26-88-AP26-88-AP26-88-AP26-88-AP26-88-A
P26-88-AP26-88-AP26-88-AP26-88-AP26-88-A
P26-88-AP26-88-AP26-88-AP26-88-AP26-88-A
P26-88-AP26-88-AP26-88-AP26-88-AP26-88-A
P26-88-AP26-88-AP26-88-AP26-88-AP26-88-A
P26-88-AP26-88-AP26-88-AP26-88-AP26-88-A
P26-88-AP26-88-AP26-88-AP26-88-AP26-88-A
P26-88-AP26-88-AP26-88-AP26-88-AP26-88-A
P26-88-AP26-88-AP26-88-AP26-88-AP26-88-A
P26-88-AP26-88-AP26-88-AP26-88-AP26-88-A
NA
P26-88-BP26-88-BP26-88-BP26-88-BP26-88-B
P26-88-BP26-88-BP26-88-BP26-88-BP26-88-B
P26-88-BP26-88-BP26-88-BP26-88-BP26-88-B
P26-88-BP26-88-BP26-88-BP26-88-BP26-88-B
P26-88-BP26-88-BP26-88-BP26-88-BP26-88-B
P26-88-BP26-88-BP26-88-BP26-88-BP26-88-B
P26-88-BP26-88-BP26-88-BP26-88-BP26-88-B
P26-88-BP26-88-BP26-88-BP26-88-BP26-88-B
P26-88-BP26-88-BP26-88-BP26-88-BP26-88-B
P26-88-BP26-88-BP26-88-BP26-88-BP26-88-B
NA
Only 1 year given.
46
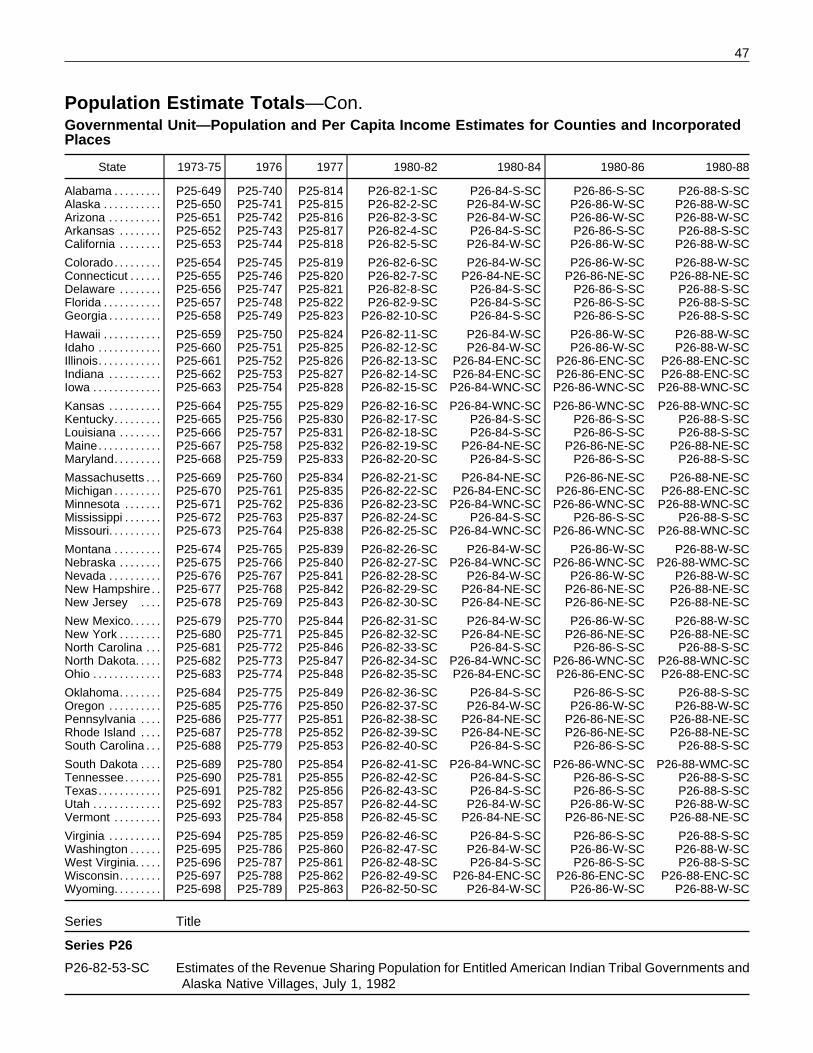
Population Estimate Totals—Con.Governmental Unit—Population and Per Capita Income Estimates for Counties and IncorporatedPlaces
State 1973-75 1976 1977 1980-82 1980-84 1980-86 1980-88
Alabama . . . . . . . . .Alaska . . . . . . . . . . .Arizona . . . . . . . . . .Arkansas . . . . . . . .California . . . . . . . .
Colorado. . . . . . . . .Connecticut . . . . . .Delaware . . . . . . . .Florida . . . . . . . . . . .Georgia . . . . . . . . . .
Hawaii . . . . . . . . . . .Idaho . . . . . . . . . . . .Illinois. . . . . . . . . . . .Indiana . . . . . . . . . .Iowa . . . . . . . . . . . . .
Kansas . . . . . . . . . .Kentucky. . . . . . . . .Louisiana . . . . . . . .Maine. . . . . . . . . . . .Maryland. . . . . . . . .
Massachusetts . . .Michigan . . . . . . . . .Minnesota . . . . . . .Mississippi . . . . . . .Missouri. . . . . . . . . .
Montana . . . . . . . . .Nebraska . . . . . . . .Nevada . . . . . . . . . .New Hampshire . .New Jersey . . . .
New Mexico. . . . . .New York . . . . . . . .North Carolina . . .North Dakota. . . . .Ohio . . . . . . . . . . . . .
Oklahoma. . . . . . . .Oregon . . . . . . . . . .Pennsylvania . . . .Rhode Island . . . .South Carolina . . .
South Dakota . . . .Tennessee. . . . . . .Texas. . . . . . . . . . . .Utah . . . . . . . . . . . . .Vermont . . . . . . . . .
Virginia . . . . . . . . . .Washington . . . . . .West Virginia. . . . .Wisconsin. . . . . . . .Wyoming. . . . . . . . .
P25-649P25-650P25-651P25-652P25-653
P25-654P25-655P25-656P25-657P25-658
P25-659P25-660P25-661P25-662P25-663
P25-664P25-665P25-666P25-667P25-668
P25-669P25-670P25-671P25-672P25-673
P25-674P25-675P25-676P25-677P25-678
P25-679P25-680P25-681P25-682P25-683
P25-684P25-685P25-686P25-687P25-688
P25-689P25-690P25-691P25-692P25-693
P25-694P25-695P25-696P25-697P25-698
P25-740P25-741P25-742P25-743P25-744
P25-745P25-746P25-747P25-748P25-749
P25-750P25-751P25-752P25-753P25-754
P25-755P25-756P25-757P25-758P25-759
P25-760P25-761P25-762P25-763P25-764
P25-765P25-766P25-767P25-768P25-769
P25-770P25-771P25-772P25-773P25-774
P25-775P25-776P25-777P25-778P25-779
P25-780P25-781P25-782P25-783P25-784
P25-785P25-786P25-787P25-788P25-789
P25-814P25-815P25-816P25-817P25-818
P25-819P25-820P25-821P25-822P25-823
P25-824P25-825P25-826P25-827P25-828
P25-829P25-830P25-831P25-832P25-833
P25-834P25-835P25-836P25-837P25-838
P25-839P25-840P25-841P25-842P25-843
P25-844P25-845P25-846P25-847P25-848
P25-849P25-850P25-851P25-852P25-853
P25-854P25-855P25-856P25-857P25-858
P25-859P25-860P25-861P25-862P25-863
P26-82-1-SCP26-82-2-SCP26-82-3-SCP26-82-4-SCP26-82-5-SC
P26-82-6-SCP26-82-7-SCP26-82-8-SCP26-82-9-SCP26-82-10-SC
P26-82-11-SCP26-82-12-SCP26-82-13-SCP26-82-14-SCP26-82-15-SC
P26-82-16-SCP26-82-17-SCP26-82-18-SCP26-82-19-SCP26-82-20-SC
P26-82-21-SCP26-82-22-SCP26-82-23-SCP26-82-24-SCP26-82-25-SC
P26-82-26-SCP26-82-27-SCP26-82-28-SCP26-82-29-SCP26-82-30-SC
P26-82-31-SCP26-82-32-SCP26-82-33-SCP26-82-34-SCP26-82-35-SC
P26-82-36-SCP26-82-37-SCP26-82-38-SCP26-82-39-SCP26-82-40-SC
P26-82-41-SCP26-82-42-SCP26-82-43-SCP26-82-44-SCP26-82-45-SC
P26-82-46-SCP26-82-47-SCP26-82-48-SCP26-82-49-SCP26-82-50-SC
P26-84-S-SCP26-84-W-SCP26-84-W-SCP26-84-S-SCP26-84-W-SC
P26-84-W-SCP26-84-NE-SCP26-84-S-SCP26-84-S-SCP26-84-S-SC
P26-84-W-SCP26-84-W-SC
P26-84-ENC-SCP26-84-ENC-SCP26-84-WNC-SC
P26-84-WNC-SCP26-84-S-SCP26-84-S-SC
P26-84-NE-SCP26-84-S-SC
P26-84-NE-SCP26-84-ENC-SCP26-84-WNC-SC
P26-84-S-SCP26-84-WNC-SC
P26-84-W-SCP26-84-WNC-SC
P26-84-W-SCP26-84-NE-SCP26-84-NE-SC
P26-84-W-SCP26-84-NE-SCP26-84-S-SC
P26-84-WNC-SCP26-84-ENC-SC
P26-84-S-SCP26-84-W-SCP26-84-NE-SCP26-84-NE-SCP26-84-S-SC
P26-84-WNC-SCP26-84-S-SCP26-84-S-SCP26-84-W-SCP26-84-NE-SC
P26-84-S-SCP26-84-W-SCP26-84-S-SC
P26-84-ENC-SCP26-84-W-SC
P26-86-S-SCP26-86-W-SCP26-86-W-SCP26-86-S-SCP26-86-W-SC
P26-86-W-SCP26-86-NE-SCP26-86-S-SCP26-86-S-SCP26-86-S-SC
P26-86-W-SCP26-86-W-SC
P26-86-ENC-SCP26-86-ENC-SCP26-86-WNC-SC
P26-86-WNC-SCP26-86-S-SCP26-86-S-SC
P26-86-NE-SCP26-86-S-SC
P26-86-NE-SCP26-86-ENC-SCP26-86-WNC-SC
P26-86-S-SCP26-86-WNC-SC
P26-86-W-SCP26-86-WNC-SC
P26-86-W-SCP26-86-NE-SCP26-86-NE-SC
P26-86-W-SCP26-86-NE-SCP26-86-S-SC
P26-86-WNC-SCP26-86-ENC-SC
P26-86-S-SCP26-86-W-SCP26-86-NE-SCP26-86-NE-SCP26-86-S-SC
P26-86-WNC-SCP26-86-S-SCP26-86-S-SCP26-86-W-SCP26-86-NE-SC
P26-86-S-SCP26-86-W-SCP26-86-S-SC
P26-86-ENC-SCP26-86-W-SC
P26-88-S-SCP26-88-W-SCP26-88-W-SCP26-88-S-SCP26-88-W-SC
P26-88-W-SCP26-88-NE-SCP26-88-S-SCP26-88-S-SCP26-88-S-SC
P26-88-W-SCP26-88-W-SC
P26-88-ENC-SCP26-88-ENC-SCP26-88-WNC-SC
P26-88-WNC-SCP26-88-S-SCP26-88-S-SC
P26-88-NE-SCP26-88-S-SC
P26-88-NE-SCP26-88-ENC-SCP26-88-WNC-SC
P26-88-S-SCP26-88-WNC-SC
P26-88-W-SCP26-88-WMC-SC
P26-88-W-SCP26-88-NE-SCP26-88-NE-SC
P26-88-W-SCP26-88-NE-SCP26-88-S-SC
P26-88-WNC-SCP26-88-ENC-SC
P26-88-S-SCP26-88-W-SCP26-88-NE-SCP26-88-NE-SCP26-88-S-SC
P26-88-WMC-SCP26-88-S-SCP26-88-S-SCP26-88-W-SCP26-88-NE-SC
P26-88-S-SCP26-88-W-SCP26-88-S-SC
P26-88-ENC-SCP26-88-W-SC
Series Title
Series P26
P26-82-53-SC Estimates of the Revenue Sharing Population for Entitled American Indian Tribal Governments andAlaska Native Villages, July 1, 1982
47

Household EstimatesSeries Title
UNITED STATES/REGIONS/DIVISIONS/STATES
Series P25
P25-356 Estimates of the Number of Households by State July 1, 1965P25-396 Estimates of the Number of Households by State July 1, 1966P25-425 Estimates of the Number of Households by State: July 1, 1967P25-440 Estimates of the Number of Households by State: July 1, 1968P25-515 Estimates of the Number of Households by State July 1, 1973 and 1972
P25-544 Estimates of the Number of Households for States: July 1, 1973 and 1974P25-623 Estimates of the Number of Households for States: July 1, 1974 and 1975P25-710 Estimates of the Number of Households for States: 1975 and 1976P25-725 Estimates of the Number of Households for States: 1976 and 1977P25-807 Estimates of the Number of Households for States: 1977 and 1978
P25-1044 State Population and Household Estimates, With Age, Sex, and Components of Change: 1981-88P25-1058 State Population and Household Estimates: July 1, 1989P25-1063 State and Local Agencies Preparing Population and Housing Estimates (issued 1990)P25-1123 State Housing Unit and Household Estimates: April 1, 1980, to July 1, 1993
COUNTIES
Series P23
P23-156 Estimates of Households, for Counties: July 1, 1985P25-1070RD-2 Estimates of Households by Age of Householder and Tenure for Counties: July 1, 1985
48

Population Estimates by Age, Race, Hispanic Origin, and SexSeries Title
UNITED STATESSeries P25P25-98 Estimates of the Population of the United States and of the Components of Change, by Age, Color,
and Sex: 1940 to 1950P25-114 Estimates of the Population of the United States, by Age, Color, and Sex: 1900 to 1940P25-310 Estimates of the Population of the United States and Components of Change, by Age, Color, and
Sex: 1950 to 1960P25-311 Estimates of the Population of the United States, Single Years of Age, Color, and Sex: 1900 to 1959P25-519 Estimates of the Population of the United States, by Age, Sex, and Race: April 1, 1960, to
July 1,1973
P25-917 Preliminary Estimates of the Population of the United States, by Age, Sex, and Race: 1970 to 1981P25-1040RD-1 Population Estimates by Race and Hispanic Origin for States, Metropolitan Areas, and Selected
Counties: 1980 to 1985P25-1095 U.S. Population Estimates, by Age, Sex, Race, and Hispanic Origin: 1980 to 1991P25-1127 National and State Population Estimates: 1990 to 1994 (age and sex)
Paper ListingPPL-41 U. S. Population Estimates by Age, Sex, Race and Hispanic Origin: 1990 to 1995
REGIONS/DIVISIONS/STATESSeries P23P23-67 Population Estimates by Race, for States: July 1, 1973 and 1975
Series P25P25-130 Estimates of the Civilian Population of States, by Broad Age Groups: July 1, 1950 to 1954P25-151 Estimates of the Civilian Population of States, by Broad Age Groups: July 1, 1955P25-172 Estimates of the Civilian Population by Broad Age Group, for States, Hawaii and Puerto Rico
July 1, 1956P25-194 Estimates of the Civilian Population by Broad Age Groups, for States and Selected Outlying Areas:
July 1, 1957P25-214 Estimates of the Civilian Population by Broad Age Groups, for States, and Selected Outlying Areas:
July 1, 1958
P25-384 Estimates of the Population of States, by Age: 1960 to 1966 (with provisional estimates forJuly 1, 1967)
P25-420 Estimates of the Population of States by Age: 1965 to 1967 (with provisional estimates forJuly 1, 1968)
P25-437 Estimates of the Population of States, by Age: 1968 (with provisional estimates for July 1, 1969P25-998 State Population and Household Estimates to 1985, With Age and Components of Change (shows
1971-1979 pop.)P25-1040RD-1 Population Estimates by Race and Hispanic Origin for States, Metropolitan Areas, and Selected
Counties: 1980 to 1985P25-1106 State Population Estimates by Age and Sex: 1980 to 1992P25-1127 National and State Population: 1990 to 1994 (age and sex)
Paper ListingPPL-44 Population of State by Broad Age Groups and Sex: 1990 and 1995
METROPOLITAN AREASSeries P25P25-1040RD-1 Population Estimates by Race and Hispanic Origin for States, Metropolitan Areas, and Selected
Counties: 1980 to 1985COUNTIESSeries P25P25-461 Components of Population Change by County: 1960 to 1970 (race only)P25-1040RD-1 Population Estimates by Race and Hispanic Origin for States, Metropolitan Areas, and Selected
Counties: 1980 to 1985
49

Population and Household ProjectionsSeries Title
UNITED STATES
Series P25
Population
P25-18 Forecasts of Population and School Enrollment in the United States: 1948 to 1960P25-43 Illustrative Projections of the Population of the United States: 1950 to 1960P25-78 Illustrative Projections of the Population of the United States, by Age and Sex: 1955 to 1975P25-381 Projections of the Population of the United States, by Age, Sex, and Color to 1990, Extensions
of Population by Age and Sex to 2015P25-480 Illustrative Population Projections for the United States: The Demographic Effects of Alternate Paths
to Zero Growth (issued 1972)P25-601 Projections of the Population of the United States: 1975 to 2050P25-613 Illustrative Projections of First Births for the United States: 1975 to 2000P25-704 Projections of the Population of the United States: 1977 to 2050P25-952 Projections of the Population of the United States, by Age, Sex, and Race: 1983 to 2080P25-995 Projections of the Spanish Origin Population of the United States: 1983 to 2080P25-1018 Projections of the Population of the United States, by Age, Sex, and Race: 1988 to 2080P25-1104 Population Projections of the United States, by Age, Sex, Race, and Hispanic Origin: 1993 to 2050P25-1130 Population Projections of the United States, by Age, Sex, Race and Hispanic Origin: 1995 to 2050
Households
P25-388 Summary of Demographic Projections (issued 1968)P25-394 Projections of the Number of Households and Families: 1967 to 1985P25-476 Demographic Projections for the United States (issued 1972)P25-607 Projections of the Number of Households and Families: 1975 to 1990P25-805 Projections of the Number of Households and Families: 1979 to 1995P25-986 Projections of the Number of Households and Families: 1986 to 2000P25-1129 Projections of the Number of Households and Families in the United States: 1995 to 2010
REGIONS/DIVISIONS/STATES
Series P25
Population
P25-132 Illustrative Projections of the College-Age Population by States: 1958 to 1973P25-160 Illustrative Projections of the Population, by States: 1960, 1965, and 1970P25-201 Projections of the School-Age Population, by States: 1959 to 1963P25-326 Illustrative Projections of the Population of States: 1970 to 1985P25-796 Illustrative Projections of State Populations by Age, Race and Sex: 1975 to 2000P25-937 Provisional Projections of the Population of States, by Age, and Sex: 1980 to 2000P25-1017 Projections of the Population of States by Age, Sex, and Race: 1988 to 2010P25-1053 Projections of the Population of States, by Age, Sex, and Race: 1989 to 2010 (contains no age
or sex data)P25-1111 Population Projections for States, by Age, Sex, Race, and Hispanic Origin: 1993 to 2020
Households
P25-387 Projections of the Number of Households, by States: July 1, 1970 and 1975
METROPOLITAN AREAS
Series P25
Population
P25-415 Projections of the Population of Metropolitan Areas: 1975
50

Inventory of Local and State Agencies Making Estimates and ProjectionsSeries Title
Series P25
P25-116 Current Status of Population Estimates Prepared by State Agencies (issued 1955)P25-178 Local Population Estimates Prepared by State and City Agencies: 1957-58P25-244 Local Population Estimates Prepared by State and City Agencies: Mail Survey of 1960P25-328 Inventory of State and Local Agencies Preparing Population Estimates: Survey of 1965P25-454 Inventory of State and Local Agencies Preparing Population Estimates: Survey of 1969
P25-723 State and Local Agencies Preparing Population Estimates and Projections: Survey of 1975-76P25-1017 Projections of the Population of States, by Age, Sex, and Race: 1988 to 2010 (Appendix B. Projections)P25-1063 State and Local Agencies Preparing Population and Housing Estimates: Survey of 1989
Series P26
P26-88-A County Population Estimates: July 1, 1988, 1987, and 1986 (Appendix A. Estimates)
51

Special Census Reports
INDEX OF SPECIAL CENSUS REPORTS, 1970 Number Areas covered and census date:TO 1989
1523 Brookhaven town, NY (Suffolk Co.),04-26-75
Special censuses taken prior to 1970 are listed in the 1524 Milwaukee, WI, 03-03-75U.S. summary of the ‘‘Number of Inhabitants’’ report in 1525 Dubuque, IA 09-30-75the decennial population censuses. After 1970, the 1526 Cedar Rapids, IA, 07-14-75
1527 San Bernardino Co., CA 04-01-75special census results were published in the P28 seriesand are cited below. (Summaries of special censuses 1528 Bonneville, Co., ID, 11-05-75taken from 1970 to 1985 are marked by an asterisk in 1529 Bloomington, MN, 09-02-75the listing.) A summary for the missing 1-1/2 year period 1530 Clarksville, TN, 11-13-75from July 1, 1978, through 1979 is available as the paper 1531 Scottsdale, AZ, 10-15-75listing PPL-13. A summary of the latter years of the 1532 Glendale, AZ, 10-15-751980’s (1986 to 1989) is available as PPL-11. Another
1533 Mesa, AZ, 10-15-75paper listing summarizing the special censuses taken1534 Joliet, IL, 08-04-75
during the 1990’s is planned. A summarization of all 1535 Waterloo, IA, 08-25-75sources is found at the end of this section. For further 1536 San Joaquin Co., CA, 10-06-75information on these paper listings or on specific special 1537 *SUMMARY, 07-01-75 to 12-31-75census reports prior to 1970, call the Statistical Informa-tionOffice, PopulationDivision on 301- 457-2422. (Reports 1538 Phoenix, AZ, 10-15-75
1539 Tempe, AZ, 10-15-75appear in Current Population Reports, Series P28.)1540 Green Bay, WI, 02-11-761541 Pima Co., AZ, 10-20-75Number Areas covered and census date: 1542 North Little Rock, AR, 04-28-76
1499 Skokie, IL, 06-28-71 1543 St. Petersburg, FL, 01-30-761500 *SUMMARY, 04-01-70 to 12-31-72 1544 Taylor, MI, 03-08-761501 Des Plaines, IL, 03-22-73 1545 Arlington Heights, IL, 07-13-761502 Oaklawn, IL, 07-14-72 1546 *SUMMARY, 01-01-76 to 06-30-761503 Arlington Heights, IL, 06-23-72 1547 Clinton twp., MI (Macomb Co.), 07-27-76
1504 Elgin, IL, 08-11-72 1548 Elgin, IL, 08-11-761505 Pasco Co., FL, 03-21-73 1549 Sterling Heights, MI, 09-21-761506 Fort Smith, AR, 06-13-73 1550 Greenville, SC, 09-13-761507 *SUMMARY, 01-01-73 to 06-30-73 1551 Travis Co., TX, 04-20-76 (census pretest)1508 *SUMMARY, 07-01-73 to 12-31-73 1552 *SUMMARY, 07-01-76 to 12-31-761509 *SUMMARY, 01-01-74 to 06-30-741553 Fort Smith, AR, 03-17-771510 Sarpy Co., NE, 07-15-74 1554 Mesa Co., CO, 03-21-771511 Johnson Co., IA, 09-20-74 1555 Mount Prospect, IL, 07-05-771512 *SUMMARY, 07-01-74 to 12-31-74 1556 Camden, NJ, 09-14-76 (census pretest)1513 Waukegan, IL, 01-09-75 1557 *SUMMARY, 01-01-77 to 06-30-771514 Little Rock, AR, 08-16-741558 *SUMMARY, 07-01-77 to 12-31-771515 Madison, WI, 10-22-74 1559 Janesville, WI, 01-24-781516 Fargo, ND, 01-09-75 1560 Shelby Co., AL, 04-21-781517 Eau Claire Co./pt. Eau Claire city in 1561 *SUMMARY, 01-01-78 to 06-30-78Chippewa Co., 03-31-75 1562 Toa Baja municipio, PR, 03-06-781518 Wayne Co., NY 04-22-75
1519 Longview, TX, 05-19-75 1563 Oakland, CA 04-26-77 (census pretest)1564 Schaumburg, IL, 09-13-781520 Putnam Co., NY, 04-14-75 1565 Richmond, VA Area, 04-04-78 (census1521 Davenport, IA, 02-14-75 dress rehearsal)1522 *SUMMARY, 01-01-75 to 06-30-75
52

Number Areas covered and census date: April 1, 1970, to June 30, 1978
1566 La Plata & Montezuma Co., CO, 04-04-78(census dress rehearsal) Current Population Reports, P28-1561, 1558, 1557,
1567 Lower Manhattan, NY (New York City), 1552, 1546, 1537, 1522, 1512, 1509, 1508, 1507, and09-26-78 (census dress rehearsal) 1500. Population by race and sex.
1509 *SUMMARY, 07-01-82 to 12-31-85 (shouldbe no. 1568)
SUMMARY OF SPECIAL CENSUSES TAKEN 1960 to 1969BY THE CENSUS BUREAU
U. S. Census of Population: 1970, PC(1)-A1, ‘‘Num-
1992 to Present ber of Inhabitants,’’ United States Summary, table 45.Population totals only. See Current Population Reports,
Listing planned. P28-1496, 1495, 1491, 1489, 1488, 1476, 1466, 1447,1420, 1388, 1362, 1316, 1285, and 1276 for race andsex.
1986 to 1989
PPL-11, Population and housing unit totals only.1950 to 1959Greater detail may be available through the Statistical
Information Office, Population Division, 301-457-2422.U. S. Census of Population: 1960, PC(1)-1A, ‘‘Num-
ber of Inhabitants,’’ United States Summary, table 40.1982 to 1985Population totals only. See Current Population Reports,P28-1272, 1241, 1171, 974, 926, 760, 604, 470, andCurrent Population Reports, P28-1509, October 1987.419 for race, sex, and occupied dwelling units.Population and housing unit counts (table 1), sex,
race/Hispanic origin, age, group quarters population(table 3), housing characteristics (table 4).
1940 to 1949
July 1, 1978, to December 31, 1979Census of Population: 1950, Vol. 1, ‘‘Number of
PPL-13, Population by race and sex in format com- Inhabitants,’’ United States Summary, table 32. Popula-parable to table 1 of P28 reports for earlier years in tion totals only. See Current Population Reports, P281970’s. series for greater detail.
53