sublittoral and bathyal harpacticoida (crustacea: … · nen con condiciones de escala mayor....
TRANSCRIPT

HARPACTICOID COMMUNITIES IN THE MAGELLAN REGION 147
SCI. MAR., 69 (Suppl. 2): 147-158 SCIENTIA MARINA 2005
THE MAGELLAN-ANTARCTIC CONNECTION: LINKS AND FRONTIERS AT HIGH SOUTHERN LATITUDES. W.E. ARNTZ, G.A. LOVRICH and S. THATJE (eds.)
Sublittoral and bathyal Harpacticoida (Crustacea:Copepoda) of the Magellan region. Composition,
distribution and species diversity of selected major taxa*
KAI HORST GEORGE
AG Zoosystematik und Morphologie, Institut für Biologie, Fakultät 5, Carl von Ossietzky-Universität, D-26111 Oldenburg, Germany.
Present address: Forschungsinstitut Senckenberg, Abteilung Deutsches Zentrum für Marine BiodiversitätsforschungDZMB, Südstrand 44, D-26382 Wilhelmshaven, Germany. E-mail: [email protected]
SUMMARY: Two expeditions, undertaken in 1994 and 1996, provided quantitatively sampled material of sublittoral andbathyal meiobenthos from the Paso Ancho of the Straits of Magellan, the Beagle Channel, and the Patagonian continentalslope (Chile). To investigate whether these distinct geographic areas might also be characterised by different harpacticoidassemblages, qualitative and quantitative analyses of Copepoda Harpacticoida were carried out. At supraspecific level 25harpacticoid families were found, as well as several species that could not yet be assigned to any major harpacticoid taxon.Due to the high amount of collected Harpacticoida, detailed investigations at species level had to be restricted to six taxa,namely the Ancorabolidae, Argestidae, Cletodidae, Diosaccinae, Paramesochridae, and Paranannopinae. The correspondingspecimens were assigned to 122 species in 52 genera. More than 80% of them are new to science. Qualitative comparisonsof both species composition and species distribution allow the three areas to be distinguished in terms of species richness.However, statistical analyses confirm these results only partly. Similarity analyses applying non-metrical multidimensionalscaling, as well as diversity analyses using the rarefaction method, suggest that the observed differences in distribution anddiversity patterns are due to small-scale, local conditions, which may overlay possible large-scale ones.
Keywords: meiobenthos, similarity analysis, Harpacticoida, Chile, Straits of Magellan, Beagle Channel.
RESUMEN: HARPACTICOÍDEOS SUBLITORALES Y BATIALES (CRUSTACEA, COPEPODA) DE LA REGIÓN MAGALLÁNICA. COMPOSI-CIÓN, DISTRIBUCIÓN Y DIVERSIDAD ESPECÍFICA DE TAXONES MAYORES SELECCIONADOS. – Durante dos expediciones realizadasen 1994 y en 1996, se colectó una gran cantidad de material meiobentónico del sublitoral y batial en el Paso Ancho del Estre-cho de Magallanes, del Canal Beagle y del talud continental patagónico (Chile). Posteriormente, se realizaron análisis cua-litativos y cuantitativos de los copépodos harpacticoideos para verificar si estas diferentes áreas geográficas también se dis-tinguen con respecto a la fauna harpacticoidea. A nivel supra-específico, se determinaron 25 familias diferentes, más variasespecies desconocidas que no pudieron ser asignadas a ningún taxon harpacticoideo. Debido al gran número de harpacti-coideos colectados, una evaluación a nivel de especies debió ser restringida a los representantes de solo seis familias, en par-ticular a los Ancorabolidae, Argestidae, Cletodidae, Diosaccinae, Paramesochridae y Paranannopinae. Los especímenes res-pectivos corresponden a 122 especies que pertenecen a 52 géneros. Más del 80% de ellas puede ser considerado como nuevopara la ciencia. Un análisis cualitativo de la composición y distribución de especies permite diferenciar entre las tres áreasgeográficas. Los análisis estadísticos de los datos cuantitativos confirmaron, sin embargo, este resultado sólo parcialmente.Sendos análisis de similaridad usando nMDS y de diversidad aplicando el método de “Rarefaction” indican que las dife-rencias observadas se deben principalmente a condiciones locales y de pequeña escala, las cuales posiblemente se superpo-nen con condiciones de escala mayor.
Palabras clave: meiobentos, análisis de similaridad, Harpacticoida, Chile, Estrecho de Magallanes, Canal Beagle.
*Received April 15, 2004. Accepted March 10, 2005.
sm69s2147/09 1/12/05 12:33 Página 147
INTRODUCTION
The disintegration of Gondwana and the relateddistribution of Gondwanan floral and faunal ele-ments form the basis of biogeographical compar-isons within the southern hemisphere. Since theearly sixties, several biogeographic investigationshave been carried out, focussing exclusively onmacrofauna (e.g. Knox, 1960; 1963; 1977; Knoxand Lowry, 1977; Lipps and Hickman, 1982;Brattstrøm and Johanssen, 1983; Brandt, 1992; Sieg,1992; Winkler, 1994). In particular, the supposedhigh affinity between Antarctica and South Ameri-ca, as the two Gondwanan fragments that were lastseparated, calls for studies on the origin and spread-ing of recent Antarctic and Magellan flora and faunaand for potential correlation with latitudinal gradi-ents in species diversity (Crame, 1994; Arntz, 1997,1999). A number of recent investigations concen-trated on different macrofaunal groups (e.g. Arntzand Gorny, 1996; Fahrbach and Gerdes, 1997(macrofaunal major groups); Brandt, 1991; 1992;Winkler, 1994 (Isopoda); Linse, 1997 (Mollusca)),and were followed some years later by the first stud-ies on meiofauna (Chen et al., 1999; George, 1999;George and Schminke, 1999).
Faunistic investigations dealing with Harpacti-coida from deeper waters (>100 m to ~1,000 m) atspecies level are rare (cf. George 1999). The presentcontribution is the first one to detect, describe andcompare harpacticoid assemblages from deeperwaters of different Magellan areas at species level,as a basis for future comparisons with correspondingAntarctic sublittoral and bathyal assemblages. Com-parable investigations in general are rare. Thedetailed investigation of harpacticoid taxa had to berestricted to six families, which is justified by theenormous amounts of specimens and species foundin the Magellan region.
MATERIAL AND METHODS
Sampling areas
The investigated material originates from twointernational sampling expeditions to the southerntip of South America:
The 1994 “Magellan Campaign” of RV “VictorHensen” (17.10.-20.11.1994; Arntz and Gorny,1996) provided quantitative sublittoral meiobenthicmaterial of this region for the first time. In total, 62
hauls at just as many stations were taken with aMinicorer (MIC) in the Paso Ancho of the Straits ofMagellan, as well as from the channels Magdalena,Cockburn, Brecknock, Ballenero and Beagle (Fig.1), 17 of which provided sufficient material for fur-ther quantitative analyses. The MIC, which resem-bles a small Multiple corer (MUC) as developed byBarnett et al. (1984), samples up to four cores perhaul simultaneously.
The 1996 expedition ANT XIII/4 of RV“Polarstern” in May, 1996 (Fahrbach and Gerdes,1997) provided material from the Patagonian conti-nental slope (Fig. 1). The MUC was used to sample 8stations, 3 of which were useful for further analyses.
Sampling localities
For the analyses, material from 20 stations wasavailable (Fig. 1, Table 1). Their distribution over theareas is as follows (depth ranges (m) in brackets):
Straits of Magellan (79-550):9 stations at 5 localities24 MIC cores
Beagle Channel (100-346):8 stations at 7 localities24 MIC cores
Patagonian continental slope (101-1,168):3 stations at 3 localities21 MUC cores
Treatment of samples
The material was immediately fixed in 5%formaldehyde. For the posterior treatment of sam-
148 K.H. GEORGE
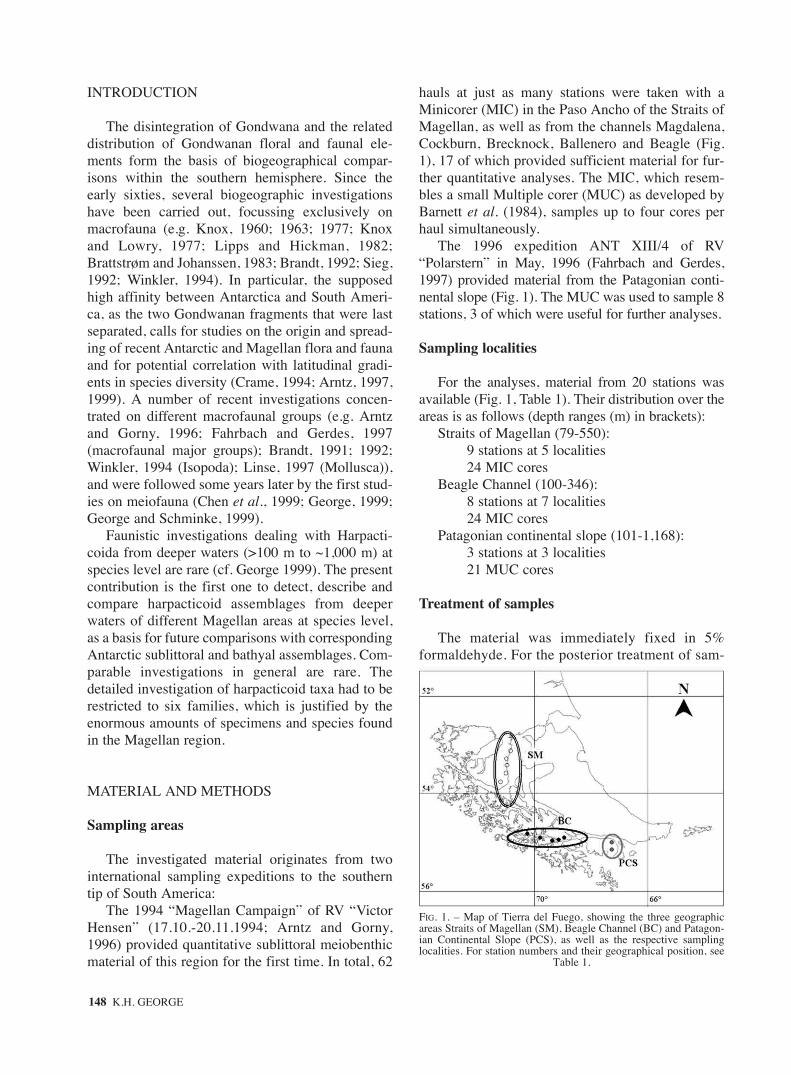
FIG. 1. – Map of Tierra del Fuego, showing the three geographicareas Straits of Magellan (SM), Beagle Channel (BC) and Patagon-ian Continental Slope (PCS), as well as the respective samplinglocalities. For station numbers and their geographical position, see
Table 1.
sm69s2147/09 1/12/05 12:33 Página 148

ples and abiotic conditions, see Chen et al. (1999).Sedimentological data are summarised in Table 1.Species determination was realised using a WildHeerbrugg M5 stereo microscope, a Leitz DialuxEB 22 phase contrast microscope, and a Leica DMLB interference contrast microscope, bothequipped with a 100x objective. Taxa determina-tion was done using identification keys (Lang,1948; Wells, 1976-1985; Huys et al., 1996) andoriginal literature.
Abbreviations used in the text: BC = BeagleChannel, MR = Magellan region, SM = Straits ofMagellan, PCS = Patagonian continental slope.
Selection of major harpacticoid taxa
Due to the high amounts of collected Harpacti-coida, for detailed analyses at species level a restric-tion of the material was necessary. AncorabolidaeSars, 1909, Argestidae sensu Por, 1986, Cletodidaesensu Por, 1986, Diosaccinae Sars, 1906, Parame-sochridae Lang, 1944, and Paranannopinae sensuPor, 1986 were selected because of the taxonomicalexpertise of the author in particular for these groups.However, as shown by George (1999), they reflectvery well the overall abundance data and distribu-tion patterns in the study area.
Similarity analysis
For a similarity analysis, non-metrical multidi-mensional scaling (nMDS) was applied usingCosine Similarity (Pfeifer et al., 1996):
where obx and oby are considered as n-dimensionalvectors x→ = [x1,...xk,...xN]T as well as y→ =[y1,...yk,...yN]T. Consequently, the Cosine Similaritythen corresponds to cos α between vectors x→ and y→
within a multidimensional ecological space. Thedimensions are represented by the attributes, i.e. thespecies at each station. Comparison between twovectors (here: stations) considers both the single andcommon presence of species. This means that nei-ther single nor common absences are taken intoaccount. To avoid any original data manipulation, notransformation was carried out.
RESULTS
Composition of Harpacticoida at family level
With 91.9%, Harpacticoida clearly dominatedthe benthic copepod fauna (George, 1999). In total,25 supraspecific harpacticoid taxa were determined,comprising a number of 5,493 adult individuals(Table 2). Ten families (40%) showed a distributionwithin the whole study area. Furthermore, both SMand PCS present exclusive taxa at family level(Adenopleurellidae and Harpacticidae in SM, Pel-tidiidae, Superornatiremidae and Tegastidae inPCS), while BC cannot be characterised by any
cos( , ) cos( , )ob obx y
x yx y
k kk
N
kk
N
kk
N
x y= ==
= =
∑
∑ ∑
1
2
1
2
1
r r
HARPACTICOID COMMUNITIES IN THE MAGELLAN REGION 149
TABLE 1. – Station list including sedimentological data: Granulometric data after Chen et al. (1999). “Median” describing median grain size (µm).
Geogr. area Station Locality Depth (m) Sand (%) Silt (%) Clay (%) Median
840 53°08.8’S/70°38.4’W 123 22.3 59.43 18.27 28.52847 53°21.2’S/70°42.7’W 200 50.99 39.85 9.16 65.4864 53°42.6’S/70°48.7’W 550 20.15 57.86 21.99 17.19866 53°51.8’S/70°54.6’W 440 11.87 65.17 22.96 12.97
SM 872 53°43.4’S/70°56.0’W 351 23.87 52.55 23.58 17.3877 53°41.5’S/70°56.5’W 227 - - - -954 53°59.7’S/70°33.0’W 79 4.98 37.3 57.72 2.742956 53°59.9’S/70°32.9’W 80 0 33.88 66.12 2.082977 53°33.0’S/70°39.2’W 459 2.02 67.78 30.2 8.6491033 54°52.7’S/69°55.2’W 309 1.04 72.29 26.67 8.0011076 54°53.6’S/69°30.3’W 346 7.2 75.04 17.76 15.121123 54°58.7’S/68°49.9’W 219 8.02 67.65 24.33 11.18
BC 1135 54°58.1’S/68°49.9’W 257 0 67.53 32.47 7.021138 54°54.5’S/68°38.7’W 320 6.56 71.83 21.61 11.011144 55°08.4’S/66°54.5’W 110 0 66.23 33.77 7.5351181 55°07.0’S/66°55.4’W 110 0 58.89 41.11 5.2951234 55°00.4’S/66°53.6’W 100 0 70.16 29.84 8.891
40/110 55°26.4’S/66°14.0’W 101 - - - -PCS 40/111 55°29.0’S/66°04.4’W 1168 - - - -
40/116 55°27.8’S/66°09.1’W 336 - - - -
sm69s2147/09 1/12/05 12:33 Página 149

exclusive family (Table 2). Itshares common taxa with at leastone of the remaining areas, whichindicates its possible role as a tran-sitional area, connecting the north-ern and eastern Magellan region.
Six families can be consideredas generally dominating theharpacticoid community in thestudy area: Ameiridae, Cletodidae,Diosaccinae, Ectinosomatidae,Paranannopinae and Parame-sochridae. However, each geo-graphic area shows at least minordifferences in taxa composition,illustrated in Figure 2. Dominatingtaxa in the SM are Ectinosomati-dae (31.4%) and Diosaccinae(24.8%), followed by three fami-lies exceeding 5% of relative abun-dance. Together, the five dominat-ing taxa exceed 77% of the relativeabundance, whereas the remaining13 families collected in this areareach almost 23%. BC shows dif-ferent dominance patterns.Although this area is also clearlydominated by Ectinosomatidae(42.2%), Diosaccinae (6.0%) playa secondary role only, while Cleto-didae (14.7%) and Ameiridae(14.5%) show a higher relativeabundance. Moreover, 11 addition-al families were recorded from thisarea, reaching 23% of relativeabundance. PCS differs from bothgeographic areas in havingAmeiridae (31.4%) as the domi-nating taxon, followed by a moreinterstitial group, the Parame-sochridae (20.4%). Ectinosomati-dae play only a minor role, notreaching 17%.
Distribution of genera
The Harpacticoida dealt withare distributed over 52 genera(Table 3). Compared with theresults at family level, the numberof taxa showing a distributionwithin the whole investigation area
150 K.H. GEORGE
TA
BL
E2.
– L
ist
of H
arpa
ctic
oida
col
lect
ed i
n th
e M
agel
lan
regi
on,
sort
ed p
er s
tatio
n an
d su
pras
peci
fic
taxo
n. F
amily
nam
es w
ritte
n in
cap
itals
ind
icat
e se
lect
ed f
amili
es f
or i
nves
tigat
ions
at
spec
ies
leve
l.
MS
BC
PCS
Pres
ence
/abc
ense
Stat
ion
840
847
864
866
872
877
954
956
977
1033
1076
1123
1135
1138
1144
1181
1234
4011
040
111
4011
6Su
mM
SB
CPC
S
Am
eiri
dae
1117
66
2617
1912
211
214
420
3857
159
511
2921
1000
++
+A
NC
OR
AB
OL
IDA
E2
81
3041
++
+A
RG
EST
IDA
E4
21
68
328
319
154
361
85
22
147
++
+"C
anth
ocam
ptid
ae"
25
610
12
5343
328
52
160
++
+C
LE
TO
DID
AE
144
1222
1922
134
139
6683
102
240
3+
++
DIO
SAC
CIN
AE
933
2474
109
5910
1731
415
2511
2812
1417
212
1548
767
++
+E
ctin
osom
atid
ae14
4143
7884
121
88
6516
663
2487
169
157
365
207
5626
1638
++
+PA
RA
NA
NN
OPI
NA
E1
1012
239
1512
116
23
818
301
116
2+
++
Tha
lest
rida
e1
417
115
22
21
137
485
118
++
+T
isbi
dae
19
274
1512
2512
57
410
414
615
5+
++
(rem
aini
ng s
peci
men
s8
1214
1512
1223
243
212
5)C
ervi
niid
ae3
46
26
1143
75+
+N
orm
anel
lidae
511
122
535
++
Hun
tem
anni
idae
13
4+
+C
rist
acox
idae
11
2+
+L
epta
stac
idae
4720
1986
++
PAR
AM
ESO
CH
RID
AE
12
1610
133
729
396
++
Lao
phon
tidae
11
591
62+
+T
etra
goni
cipi
tidae
52
241
32+
+H
arpa
ctic
idae
11
+A
deno
pleu
relli
dae
12
51
9+
Lep
topo
ntiin
ae36
36+
Neo
brad
yida
e1
1+
Pelti
diid
ae1
11
3+
Supe
rorn
atir
emid
ae29
130
+T
egas
tidae
55
+
Sum
6311
710
223
630
529
510
367
195
6498
179
8523
638
141
173
415
6512
013
754
93
sm69s2147/09 1/12/05 12:33 Página 150

decreases. Only 9 genera (17%) were collected atSM, BC, and PCS. The number of taxa shared bySM and BC is 15 (28.8%), which is almost twice thecommon genera between SM and PCS (7 taxa =13.5%). PCS and BC show no genus in common(Table 3). However, in contrast to the results at fam-ily level, each geographical area can be charac-terised by a certain number of exclusive genera. SMencloses 5, BC 7, and PCS 9 taxa. As shown in Fig-ure 3, only a few genera seem to dominate each geo-graphic area.
The differences between the areas increaseremarkably at this taxonomic level. Whereas SM
and BC shows at least two abundant genera (Cle-todes and Stenhelia), PCS shows quite a differenttaxa composition. Between SM and BC there arealso noteworthy differences. BC is characterised bya relatively high portion of genera (~38%) notreaching 5% of relative abundance, versus threedominant genera, with Enhydrosoma (39.7%) as themost abundant one. On the other hand, SM seems topresent a generally higher variety, comprising fivedominant genera (with Haloschizopera (23.4%)showing highest values) versus 31 taxa with a rela-tive abundance below 5%. Finally, PCS is clearlydominated by Amphiascus, Kliopsyllus, Parame-
HARPACTICOID COMMUNITIES IN THE MAGELLAN REGION 151
TABLE 3. – List of harpacticoid genera and their distribution within the Magellan region.
No. Genus/area SM BC PCS No. Genus/area SM BC PCS
1 Fultonia + + + 25 Laophontodes + +2 Cletodes + + + 26 Diosaccinae sp. 1 + +3 Amphiascus + + + 27 Paramphiascella + +4 Bulbamphiascus + + + 28 Kliopsyllus + +5 Haloschizopera + + + 29 Leptopsyllus + +6 Robertgurneya + + + 30 Paramesochra + +7 Stenhelia + + + 31 Scottopsyllus + +8 Typhlamphiascus + + + 32 Dendropsyllus +9 Paradanielssenia + + + 33 Argestidae sp. 8 +10 Argestidae sp. 1 + + 34 Diosaccinae sp. 2 +11 Argestidae sp. 2 + + 35 Diosaccinae sp. 6 +12 Argestidae sp. 3 + + 36 Paranannopinae sp. 1 +13 Eurycletodes (O.) + + 37 Arthropsyllus +14 Mesocletodes + + 38 Argestidae sp. 4 +15 Acrenhydrosoma + + 39 Argestidae sp. 5 +16 Enhydrosoma + + 40 Argestidae sp. 6 +17 Stylicletodes + + 41 Diosaccinae sp. 4 +18 Amphiascoides + + 42 Diosaccinae sp. 5 +19 Diosaccinae sp. 3 + + 43 Paranannopinae sp. 2 +20 Carolinicola + + 44 Argestidae sp. 7 +21 Jonesiella + + 45 Diosaccinae sp. 7 +22 Paranannopus + + 46 Diosaccinae sp. 8 +23 Psammis + + 47 Schizopera +24 Pseudomesochra + + 48 Paramesochridae sp. 1 +
49 Paramesochridae sp. 2 +50 Paranannopinae sp. 3 +51 Diarthrodella +52 Rossopsyllus +
FIG. 2. – Harpacticoid composition of SM, BC and PCS. The rela-tive abundance (%) of the dominating taxa Ameiridae, Cletodidae,Diosaccinae, Ectinosomatidae, Paranannopinae, and Paramesochri-dae is presented. The remaining families collected at SM (13), BC
(11) and PCS (19) are summarised as “others”.
FIG. 3. – Harpacticoid composition of the SM, BC and PCS. The rel-ative abundance (%) of the dominating taxa Amphiascus, Cletodes,Enhydrosoma, Haloschizopera, Kliopsyllus, Paramesochra,Pseudomesochra, Scottopsyllus, Stenhelia, and Typhlamphiascus ispresented. The remaining genera collected at SM (31), BC (28) and
PCS (23) are summarised as “others”.
sm69s2147/09 1/12/05 12:33 Página 151

sochra and Scottopsyllus, the latter three confirmingthe general dominance of Paramesochridae in thisarea. The four mentioned taxa face a number of 23remaining genera not reaching 20% of relative abun-dance.
Composition and diversity of harpacticoidspecies
Due to the high abundance, further analysis atspecies level was done on the representatives (=1,916 adult specimens) of 6 selected taxa(Ancorabolidae Sars, 1909, Argestidae Por, 1986,Cletodidae sensu Por, 1986, Diosaccinae Sars, 1906,Paramesochridae Lang, 1944, Paranannopinae Por,
1986) (Table 2). They can be assigned to 122 differ-ent species, 103 of which (= 84.4%) must be con-sidered as new to science (see Table 4 for specieslist). Recently, a few new species have beendescribed (George, 1998; 2001; 2002; George andSchminke, 1998; 2003) (Fig. 4).
Specific composition indicates both similaritiesand differences between the geographic areas. Atotal number of six species (Cletodes sp. 2, Stylicle-todes longicautdatus (Brady and Robertson, 1880),Amphiascus sp. 1, Haloschizopera exigua (Sars,1906), Stenhelia (D.) sp. 2, Typhlamphiascus sp.)was recorded in the whole investigation area, againmeaning a decrease of common taxa compared withthe results at family and genus level. In addition,
152 K.H. GEORGE
FIG. 4. – Some Harpacticoida of the Magellan region, A. Dendropsyllus magellanicus (Ancorabolidae Sars, 1909), B. Breviconia australis(Ancorabolidae), C. Ancorabolus ilvae (Ancorabolidae), D. Laophontisochra maryamae (Cristacoxidae Huys, 1990), E. Isthmiocaris longi-telson (Canthocamptidae Sars, 1906). A after George and Schminke 1998, B after George 1998, C after George 2001, D after George 2002,
E after George and Schminke 2003.
sm69s2147/09 1/12/05 12:33 Página 152

each geographical area shares some species with oneof the remaining areas (Fig. 5). SM and BC show arelatively high number of species in common,whereas adjacent BC and PCS share only fewspecies, falling even below the value shown by dis-tant SM/PCS.
Apart from similarities between the geographicalareas due to common species, all of them can becharacterised by several exclusive species (Fig. 5),thus confirming the distinction between the areasalready indicated at family and genus level. Tounderline the results obtained, quantitative similari-ty and diversity analyses were done.
Similarity analysis
The ordination plot (Fig. 6A) (cf. Fig. 6B forShepard diagram) indicates a general mixing of thestations, independent of their geographical location.Most of the SM, BC, and PCS stations form a biggroup on the right side of the plot. Only two smalldistinct groups are discernible, one formed by 2 sta-tions of the SM and one enclosing 3 BC stations(dotted circles in Fig. 6). Both groups match thegeographic locality of the corresponding stations.The SM group is located in the northern Paso Anchoand encloses stations 954 and 956. Both stations areunique in presenting the species Diosaccinae sp. 2(Table 4). Moreover, they differ from all remainingSM stations in the presence of Paramesochra sp. 1,a species collected also from station 40/110 (PCS).
The BC group is located in the eastern BC, com-prising stations 1144, 1181, and 1234. They shareBulbamphiascus sp. 2 (although single specimenswere also collected at two SM stations) (Table 4)and Paradanielssenia sp. 1 (although in common
HARPACTICOID COMMUNITIES IN THE MAGELLAN REGION 153
FIG. 5. – Numbers of harpacticoid species in common between therespective geographic areas (arrows with corresponding species(spp.) numbers). The graphic illustration shows the numbers ofexclusive harpacticoid species reported from the respective geo-graphical areas: WSA = Whole Study Area, SM = Straits of Magel-lan, BC = Beagle Channel, PCS = Patagonian Continental Slope.
FIG. 6. – A, Ordination plot resulting from the similarity matrixusing Cosine Similarity. Ordination is two-dimensional (monoto-nous, non-parametric regression, Stress 0,12). White rhomboiddots: SM stations, white circles: BC stations, black squares: PCS
stations. B, Shepard diagram of the nMDS.
FIG. 7. – Illustration of the compared species numbers (S), speciesrichness (H’), and evenness (E) values at the three investigated geo-graphic areas Straits of Magellan (SM), Beagle Channel (BC), and
Patagonian Continental Slope (PCS).
sm69s2147/09 1/12/05 12:33 Página 153

154 K.H. GEORGE
TABLE 4. – List of harpacticoid species collected in the Magellan region (individual numbers at corresponding stations).
SM BC PCSNo. species\station 840 847 864 866 872 877 954 956 977 1033 1076 1123 1135 1138 1144 1181 1234 40110 40111 40116 Sum
1 Arthropsyllus australis 1 12 Dendropsyllus magellanicus 1 13 Laophontodes sp.1 1 8 94 Laophontodes typicus 29 295 Laophontodes whitsoni 1 16 Argestidae sp.1 1 1 1 1 47 Argestidae sp.2 1 1 2 6 5 158 Argestidae sp.3 2 7 1 109 Argestidae sp.4 5 510 Argestidae sp.5 3 311 Argestidae sp.6 1 1 212 Argestidae sp.7 2 213 Argestidae sp.8 1 114 Eurycletodes (O.) abyssi 5 515 Eurycletodes (O.) monardi 4 416 Eurycletodes (O.) oblongus 1 2 4 717 Eurycletodes (O.) sp.1 1 1 1 9 3 1 3 1818 Eurycletodes (O.) sp.2 1 119 Eurycletodes (O.) sp.3 2 3 1 620 Fultonia bougisi 1 2 321 Fultonia sarsi 1 1 222 Fultonia sp.1 1 123 Fultonia sp.2 1 2 324 Fultonia sp.3 2 4 9 1525 Fultonia sp.4 3 326 Fultonia sp.5 2 227 Mesocletodes abyssicola 1 1 4 628 Mesocletodes soyeri 1 1 229 Mesocletodes sp.1 10 1 3 1430 Mesocletodes sp.2 1 2 1 1 7 1231 Acrenhydrosoma sp.1 3 1 1 1 2 832 Cletodes latirostris 2 10 1 1333 Cletodes sp.1 5 1 2 8 6 2 2434 Cletodes sp.2 5 1 3 3 8 1 10 1 21 4 1 5835 Cletodes sp.3 1 136 Cletodes sp.4 1 3 6 1037 Cletodes sp.5 4 438 Cletodes sp.6 2 239 Cletodes sp.7 1 140 Enhydrosoma hopkinsi 4 2 641 Enhydrosoma littorale 1 142 Enhydrosoma sp.1 1 1 1 5 843 Enhydrosoma sp.2 3 3 1 744 Enhydrosoma sp.3 2 2 445 Enhydrosoma sp.4 1 5 1 1 846 Enhydrosoma sp.5 3 3 1 1 2 4 1447 Enhydrosoma sp.6 65 59 84 20848 Enhydrosoma sp.7 1 3 449 Stylicletodes longicaudatus 3 1 1 3 7 1 1 1750 Stylicletodes oligochaeta 1 1 1 1 1 551 Diosaccinae sp.1 1 1 252 Diosaccinae sp.2 9 17 2653 Diosaccinae sp.3 4 3 1 854 Diosaccinae sp.4 1 155 Diosaccinae sp.5 1 156 Diosaccinae sp.6 4 457 Diosaccinae sp.7 1 158 Diosaccinae sp.8 1 159 Amphiascoides subdebilis 1 1 260 Amphiascoides sp.1 1 161 Amphiascus minutus 4 1 562 Amphiascus sp.1 1 1 1 1 192 13 20963 Bulbamphiascus sp.1 1 4 564 Bulbamphiascus sp.2 1 1 1 13 2 1865 Haloschizopera abyssi 7 27 20 5466 Haloschizopera exigua 18 1 33 20 21 1 6 1 4 2 22 12967 Haloschizopera sp.1 10 1068 Paramphiascella sp.1 5 1 5 1169 Paramphiascella sp.2 3 370 Robertgurneya sp.1 3 1 471 Robertgurneya sp.2 3 3
sm69s2147/09 1/12/05 12:33 Página 154

with stations 977 and 1123), but in particular theyare absolutely dominated by Enhydrosoma sp. 6.This species was collected in remarkably high indi-vidual numbers only from these three stations,reaching 84 specimens at station 1234 (Table 4).
Diversity analysis
SM and BC, both characterised by S = 70, mayshow the same species number, which is nearlytwice the PCS value (S = 38). This trend is general-
ly confirmed by Shannon’s H’ and Pielou’s evennessE, which are considerably higher at SM and BC thanat PCS (Fig. 7). The highest species richness was atSM, with higher H’ and E values than at BC. To ver-ify these results, a second diversity analysis wasdone, applying rarefaction to the three differentareas. Comparison of the geographic areas revealedsimilar results to using diversity indices (Fig. 8A).SM and BC show a considerably higher speciesrichness than PCS. However, in contrast with theresults obtained from calculating the diversity
HARPACTICOID COMMUNITIES IN THE MAGELLAN REGION 155
TABLE 4 (Cont.). – List of harpacticoid species collected in the Magellan region (individual numbers at corresponding stations).
SM BC PCSNo. species\station 840 847 864 866 872 877 954 956 977 1033 1076 1123 1135 1138 1144 1181 1234 40110 40111 40116 Sum
72 Schizopera sp.1 5 1 673 Stenhelia (D.) sp.1 2 1 374 Stenhelia (D.) sp.2 7 3 1 3 2 2 14 13 6 3 2 5675 Stenhelia (D.) sp.3 1 4 8 3 4 2 2276 Stenhelia (D.) sp.4 2 1 2 577 Stenhelia (D.) sp.5 1 178 Stenhelia (D.) sp.6 5 6 2 4 14 3179 Stenhelia (D.) sp.7 3 2 580 Stenhelia (D.) sp.8 2 1 381 Stenhelia (D.) sp.9 5 1 1 12 1982 Stenhelia (D.) sp.10 1 183 Stenhelia (D.) sp.11 4 484 Stenhelia (D.) sp.12 2 285 Stenhelia (St.) sp.1 1 186 Typhlamphiascus sp. 3 4 43 25 22 4 2 2 2 10787 Paramesochridae sp.1 15 1588 Paramesochridae sp.2 1 189 Diarthrodella sp. 2 290 Kliopsyllus sp.1 1 15 1 1791 Kliopsyllus sp.2 1 192 Kliopsyllus sp.3 37 13 5093 Kliopsyllus sp.4 95 9594 Kliopsyllus sp.5 2 295 Kliopsyllus sp.6 6 696 Kliopsyllus sp.7 2 9 1197 Leptopsyllus sp.1 7 798 Leptopsyllus sp.2 9 999 Paramesochra sp.1 8 10 10 28100 Paramesochra sp.2 75 75101 Rossopsyllus sp. 3 3102 Scottopsyllus sp.1 73 73103 Scottopsyllus sp.2 1 1104 Paranannopidae sp.1 1 1105 Paranannopidae sp.2 1 1106 Paranannopidae sp.3 1 1107 Carolinicola sp.1 1 2 3108 Carolinicola sp.2 3 3109 Jonesiella sp. 1 3 1 1 5 19 30110 Paradanielssenia sp.1 1 1 4 7 9 22111 Paradanielssenia sp.2 1 1 2112 Paranannopus sp.1 6 5 11113 Paranannopus sp.2 1 1114 Paranannopus sp.3 1 1 2115 Paranannopus sp.4 1 1 2 1 5116 Psammis sp.1 1 1 3 2 7117 Psammis sp.2 1 1 2 6 10118 Pseudomesochra longifurcata 2 2119 Pseudomesochra sp.1 3 1 3 1 8120 Pseudomesochra sp.2 3 1 1 5121 Pseudomesochra sp.3 12 19 5 2 9 47122 Pseudomesochra sp.4 4 4
Sum 28 52 49 127 145 107 26 27 72 18 35 80 30 76 87 123 155 582 18 79 1916
sm69s2147/09 1/12/05 12:33 Página 155

indices, rarefaction indicates a tendency of slightlyhigher species richness at BC than in SM. Due tothis deviation, a second analysis was done, compar-ing all single stations. This analysis reveals aremarkable small-scale variability even between sta-tions within the same geographic area (Fig. 8B),which may conceal probable large-scale influences.
DISCUSSION
The Magellan region is generally characterisedby a high variability in topographic, sedimentologi-cal, hydrographical, oceanographic and climatologi-cal conditions (e.g. Brattstrøm and Johanssen, 1983;Artegiani et al., 1991, Brambati et al., 1991,Antezana et al., 1996, Klöser, 1996). Therefore, thequestion arose whether the three geographically,topographically, and hydrographically distinct areasSM, BC and PCS might show differences also with
respect to their inhabiting sublittoral and bathyalharpacticoid fauna. This question becomes particu-larly important for future comparisons with corre-sponding harpacticoid assemblages of Antarctica.Against the background of a supposed high affinitybetween the Antarctic and the South American (i.e.Magellan) fauna, it is of importance to knowwhether the Magellan region is characterised bygeographically separated, clearly distinct faunaswhich may prohibit the consideration of the regionas a whole for interregional faunistic comparisons,as has been done for macrofauna. The resultsobtained in this study indicate a remarkable varietyof the Magellan region with respect to species com-position and species diversity. Instead of beingclearly distinct, the three studied areas show a con-siderable overlap of taxa composition and diversity,as shown by MDS and rarefaction. However, thisoverlap is due not to homogeneous but to heteroge-neous distribution of taxa. This leads to the conclu-sion that for future comparisons with Antarcticharpacticoid associations, the MR should be consid-ered as a whole.
The results presented here reveal an impressiveharpacticoid diversity within the Magellan region.Wells (1986) presumed that at family level,Harpacticoida would show a world-wide distribu-tion. For the Magellan region, his assumption wasalready confirmed by George and Schminke (1999),who presented a list of 19 families. However, it mustbe pointed out that the authors included Cerviniidae(George and Schminke, 1999, p. 135, Table 2), ataxon that was ignored in this contribution becauseit was represented exclusively by juveniles, whichwere not taken into account in the analyses.
The record of several specimens of Superor-natiremidae Huys, 1996 was somewhat surprising.They are considered as being restricted to anchialinecaves and showing an amphi-Atlantic/Mediter-ranean distribution (Huys, 1996). The specimenscollected at station 40/110 (PCS) extend both thedistribution and habitat preference considerably. Allspecimens belong to the same new species (Georgeand Martínez Arbizu, in press).
In the past, several investigations concluded thatfor faunistic investigations it was sufficient to dealwith taxa at higher taxonomic levels such as generaor even families (e.g. Hartmann, 1982; 1986; Heipet al., 1988; Ray, 1992; Lambshead, 1993). Theresults of the qualitative comparison of the geo-graphic areas SM, BC and PCS contradict thisassumption. For example, families and genera show
156 K.H. GEORGE
FIG. 8. – Rarefaction curves A. of the three geographic areas Straitsof Magellan (SM; black line), Beagle Channel (BC; dark grey line),and Patagonian Continental Slope (PCS; light grey line). S(N) =number of estimated species, with N = individual numbers, B. of allsingle stations of the investigated region (SM=black lines, BC=darkgrey lines, PCS=light grey lines). S(N) = number of estimated
species, with N = individual numbers.
sm69s2147/09 1/12/05 12:33 Página 156

a much wider distribution than the species theyenclose, clearly demonstrating the fact that familiesand even genera are united groups of differentspecies with quite different ecological claims.Whereas a family (e.g. Ancorabolidae) may be dis-tributed within the whole Magellan region, the cor-responding species (e.g. Breviconia, Dendro-psyllus) may be restricted to small areas. Therefore,although community analyses at higher taxonomiclevel may allow more taxa to be considered (here:all Harpacticoida), they undoubtedly generalise andbias real distribution patterns or community struc-ture instead of describing almost real patterns. Atfamily level, the geographical areas SM, BC andPCS show a relatively high degree of similarity(~40%), which decreases at generic level (~17%)and reaches at most ~5% at species level. There-fore, it is advisable to select the species level forcommunity analyses, even if this inolves a restric-tion of the taxa dealt with.
The remarkably high number of 122 speciesreported from the six investigated harpacticoid fam-ilies confirms the conclusion of Wells (1986) thatthe apparent poverty in species of the southernhemisphere reflects a lack of investigations ratherthan real species numbers. The report of 103 scien-tifically new species from the Magellan regionmeans an increase of nearly 30% for the wholeSouthern Hemisphere compared with Wells’ (1986)data. This points to the urgent need for further inves-tigations in this region.
The qualitative comparisons allow three areas tobe distinguished, each of which is characterised byexclusively collected species. It is surprising thatBC and PCS show such little similarity in bothspecies composition and species diversity. Onewould expect these areas especially to be more sim-ilar, due to a supposed continuous organism inputinto PCS from BC caused by predominating east-ward currents. However, apart from some taxashowing a distribution in the whole study area, BCand PCS have no taxa in common, even at genericlevel. Still, as shown by quantitative analysis, acharacterisation based only on presence and absenceof species would be too superficial. Firstly, it isobvious that the non-registration of a species in anarea may be an artefact of sampling; it does not nec-essarily reflect the distribution of the species. Sec-ondly, the species composition of each area is quitecomplex, leading to similarities and differencesbetween them. This complexity may already be indi-cated by the qualitative analysis, which apart from
differences also revealed certain similaritiesbetween areas, due to species in common. The MDSapproaches the actual conditions best. Just two smallareas, one in the northern SM and one in the easternBC, seem to be characterised by specific harpacti-coid assemblages. The remaining study area showsa remarkable variety, with neither clear differencesnor great similarities between the geographical areasSM, BC and PCS. On the other hand, stations of dif-ferent areas often show greater similarity than sta-tions of the same area. The same applies to theresults of the diversity analysis. The results of rar-efaction are favoured here because of its better“response” to smaller samples, paired with severalgeneral disadvantages of diversity indices (Hurlbert1971, Achtziger et al. 1992). However, both meth-ods applied to the geographical areas show that SMand BC have nearly the same species richness. Thedifference between the results of calculating H’ andE, which estimated SM to be richer than BC, andrarefaction, which shows the opposite, may beneglected because of the relatively small databaseon which they are based. However, the results pre-sented in Fig. 8B show clearly that, as in the simi-larity analysis, the study area also shows a consider-able variety with respect to species richness, thusmaking it impossible to distinguish the three geo-graphical areas SM, BC and PCS. In summary, it isconcluded that both similarity and diversity analysispoint towards a considerable influence of small-scale biotic and abiotic variables, leading to a highlocal variability in harpacticoid communities of theMagellan region.
ACKNOWLEDGEMENTS
I am indebted to Prof. Dr. H.K. Schminke (Old-enburg), Prof. Dr. W.E. Arntz (Bremerhaven) andall colleagues of the Arbeitsgruppe Zoosystematikund Morphologie (Carl von Ossietzky-Universität,Oldenburg) for their helpful and constructive criti-cism. I am grateful to three anonymous reviewersand the editors for their constructive criticisms andsuggestions. Mrs. I. Ohlendorf (Bremen) correctedthe English text. The author’s participation in the“Magellan Campaign” cruise of RV “VictorHensen” (1994) was supported by DeutscherAkademischer Austauschdienst (DAAD), and hisparticipation in the RV “Polarstern” cruise ANTXIII/4 (1996) was supported by DeutscheForschungsgemeinschaft (DFG).
HARPACTICOID COMMUNITIES IN THE MAGELLAN REGION 157
sm69s2147/09 1/12/05 12:33 Página 157

REFERENCES
Achtziger, R., U. Nigmann and H. Zwölfer. – 1992. Rarefaction-Methoden und ihre Einsatzmöglichkeiten bei der zooökologis-chen Zustandsanalyse und Bewertung von Biotopen. Z. Ökolo-gie u. Naturschutz, 1: 89-105.
Antezana, T., M. Hamamé, Y. Eissler and S. Jara. – 1996. Hydrog-raphy in Chilean fjords: Strait of Magellan and Beagle Channel(legs 1 and 2). In: W.E. Arntz and M. Gorny (eds.), Cruisereport of the Joint Chilean-German-Italian Magellan “VictorHensen” Campaign in 1994. Ber. Polarforsch., 190: 16-18.
Arntz, W.E. – 1997. Investigación antártica en biología marina:situación actual, proyectos internacionales y perspectivas. Bol.Soc. R. Esp. Hist. Nat., 93(1-4): 13-44.
Arntz, W.E. – 1999. Summary review. In: W.E. Arntz and C. Ríos(eds.), Magellan-Antarctic: Ecosystems that Drifted Apart. Sci.Mar., 63(Suppl. 1): 503-511.
Arntz, W.E. and M. Gorny (eds.). – 1996. Cruise report of the JointChilean-German-Italian Magellan “Victor Hensen” Campaignin 1994. Ber. Polarforsch., 190.
Artegiani, A., E. Paschini and J. Andueza Calderón. – 1991. Physi-cal oceanography of the Straits of Magellan. In: F. Faranda andL. Guglielmo (eds.), Data Report I. Nat. Sci. Com. Ant., Straitsof Magellan Oceanogr. Cruise, February-March 1991: 11-52.
Barnett, P.R.O., J. Watson and D. Connelly. – 1984. A multiplecorer for taking virtually undisturbed samples from shelf,bathyal and abyssal sediments. Oceanol. Acta, 7(4): 399-408.
Brambati, A., G. Fontolan and U. Simeoni. – 1991. Carta sedimen-tologica dello Stretto di Magellano. Instituto di Geologia ePaleontologia, Università degli Studi di Trieste, Primiera edi-zione, Trieste. Bol. Oceanol. Teor. Appl., 9(2-3), Appendix.
Brandt, A. – 1991. Zur Besiedlung des antarktischen Schelfes amBeispiel der Isopoda (Crustacea, Malacostraca). Ber. Polar-forsch., 98: 1-240.
Brandt, A. – 1992. Origin of Antarctic Isopoda (Crustacea, Mala-costraca). Mar. Biol., 113: 415-423.
Brattstrøm, H. and A. Johanssen. – 1983. Ecological and regionalzoogeography of the marine benthic fauna of Chile. Sarsia, 68:289-339.
Chen, G.T., R.L. Herman and M. Vincx. – 1999. Meiofauna com-munities from the Straits of Magellan and the Beagle Channel.Sci. Mar., 63(Suppl. 1): 123-132.
Crame, J.A. – 1994. Evolutionary history of Antarctica. In: Hempel,G. (ed.): Antarctic Science. Springer Verlag Berlin: 188-214.
Fahrbach, E and D. Gerdes (eds.). – 1997. Die ExpeditionANTARKTIS XIII/4-5 des Forschungsschiffs ”Polarstern”1996. Ber. Polarforsch., 1-239.
George, K.H. – 1998. A new species of Ancorabolidae (Copepoda,Harpacticoida) from the Beagle Channel (Chile). Hydrobiolo-gia, 379: 23-39.
George, K.H. – 1999. Gemeinschaftsanalytische Untersuchungender Harpacticoidenfauna der Magellanregion, sowie erste simi-laritätsanalytische Vergleiche mit Assoziationen aus derAntarktis. Ber. Polarforsch., 327: 1-187.
George, K.H. – 2001. First record of the „genus“ Ancorabolus Nor-man, 1903 from the Southern Hemisphere, including analysesof copepod development (Crustacea, Copepoda, Harpacticoida,Ancorabolidae). Senckenbergiana biol., 81(1/2): 23-36.
George, K.H. – 2002. New phylogenetic aspects of the Cristacoxi-dae Huys (Copepoda, Harpacticoida), including the descriptionof a new genus from the Magellan Region. Vie Milieu, 52(1):31-41.
George, K.H. and P. Martínez Arbizu. – (in press). Discovery ofSuperornatiremidae Huys (Copepoda, Harpacticoida) outsideanchialine caves, with the description of Gideonia noncaverni-cola gen. et sp. nov. from the Patagonian continental slope(Chile). Meiofauna Marina.
George, K.H. and H.K. Schminke. – 1998. First records of thegenus Ceratonotus G.O. Sars, 1909 (Copepoda, Ancorabolidae)from the southern hemisphere, with the description of two newspecies. Crustaceana, 71(7): 801-817.
George, K.H. and H.K. Schminke. – 1999. Sublittoral Harpacticoi-
da (Crustacea, Copepoda) from the Straits of Magellan and theBeagle Channel (Chile). Preliminary results on abundances andgeneric diversity. Sci. Mar., 63(Suppl. 1): 133-137.
George, K.H. and H.K. Schminke. – 2003. Isthmiocaris longitelsongen. et sp. nov., a strongly derived harpacticoid (Copepoda)from the Magellan Region, and its systematic affinities to cer-tain “canthocamptid” taxa. J. Crust. Biol., 23(1): 119-130.
Hartmann, G. – 1982. Tiergeographie - Animal geography. Ver.Deut. Zool. Ges., 127-144
Hartmann, G. – 1986. Biogeographie und Plattentektonik. Natur-wissenschaften, 73: 471-480
Heip, C., R.M. Warwick, M.R. Carr, P.M.J. Herman, R. Huys, N.Smol and K. Van Holsbeke. – 1988. Analyses of communityattributes of the benthic meiofauna of Frierfjord/Langesund-fjord. Mar. Ecol. Prog. Ser., 46: 171-180
Hurlbert, S.H. – 1971. The nonconcept of species diversity: A cri-tique and alternative parameters. Ecology, 52(2): 577-586.
Huys, R. – 1996. Superornatiremidae fam. nov. (Copepoda:Harpacticoida): An enigmatic family from North Atlanticanchihaline caves. Sci. Mar., 60(4): 497-542.
Huys, R., J.M. Gee, C.G. Moore and R. Hammond. – 1996. Marineand brackish water Harpacticoida copepods. Part 1. In: Barnes,R.S.K. and J.H. Crothers (eds.), Synopsis of the British Fauna(New Series), 51: 1-352.
Klöser, H. – 1996. Hydrography of the Beagle Channel (leg 4). In:W.E. Arntz and M. Gorny (eds.), Cruise report of the JointChilean-German-Italian Magellan “Victor Hensen” Campaignin 1994. Ber. Polarforsch., 190: 18-19.
Knox, G.A. – 1960. Littoral ecology and biogeography of the south-ern Oceans. Proc. Roy. Soc. Lond. B Bio, 152: 577-624.
Knox, G.A. – 1963. Antarctic relationships in Pacific biogeography.In: Gressit, J.L. (ed.): Pacific Basin Biogeography. BishopMuseum Press, Honolulu: 465-474.
Knox, G.A. – 1977. The Antarctic polychaete fauna: its character-istics, distribution patterns, and evolution. In: Llano, G.A. (ed.):Proceedings of the Third SCAR Symposium. Antarct. Biol.Gulf Publ. Co., Houston: 1111-1127.
Knox, G.A. and J.K. Lowry. – 1977. A comparison between thebenthos of the Southern Ocean and the North Polar Ocean withspecial reference to the Amphipoda and the Polychaeta. In: M.J. Dunbar (ed.), Polar Oceans. Antarct. Inst. North America:423-462.
Lambshead, P.J.D. – 1993. Recent developments in marine benthicbiodiversity research. Océanis, 19(6): 5-24.
Lang, K. – 1948. Monographie der Harpacticiden. Håkan OhlssonsBoktryckeri, Lund, Sweden.
Linse, K. – 1997. Die Verbreitung epibenthischer Mollusken imchilenischen Beagle-Kanal. Ber. Polarforsch., 228: 1-131.
Lipps, J.H. and C.S. Hickman. – 1982. Origin, age and evolution ofAntarctic deep-sea faunas. In: W.G. Ernst and J.G. Morin(eds.), The Environment of the Deep Sea. Rubey Vol. II. Pren-tice-Hall, Inc., Eaglewood Cliffs, N.J.: 325-355.
Pfeifer, D., H.-P. Bäumer, R. Dekker and U. Schleier. – 1996. Sta-tistical tools for monitoring benthic communities. Texte Stat.Ökol., 2: 1-17.
Ray, G.C. – 1992. Ökologische Vielfalt in Küstenzonen undMeeren. In: E.O. Wilson (ed.), Ende der Biologischen Vielfalt?,pp. 54-68. Spektrum Akad. Verlag, Heidelberg.
Sieg, J. – 1992. On the origin and age of the Antarctic tanaidaceanfauna. In: V.A. Gallardo, O. Ferretti and H.I. Moyano (eds.),Oceanografía en Antártica, pp. 421-430. ENEA - CentroEULA, Chile.
Wells, J.B.J. – 1976. Keys to aid in the identification of marineharpacticoid copepods. Dept. Zool., Univ. Aberdeen.
Wells, J.B.J. – 1978-1985. Keys to aid in the identification ofmarine harpacticoid copepods. Amendment Bulletins 1-5. Zool.Publ. Victoria Univ. Wellington
Wells, J.B.J. – 1986. Biogeography of benthic harpacticoid cope-pods of the marine littoral and continental shelf. Syllogeus, 58:126-135.
Winkler, H. – 1994. Charakterisierung der Isopodenfauna (Crus-tacea, Malacostraca) des Scotia-Bogens aus biogeographischerSicht: ein multivariater Ansatz. Ber. Polarforsch., 139: 1-196.
158 K.H. GEORGE
sm69s2147/09 1/12/05 12:33 Página 158