submicron hollow spot generation by solid immersion lens and
TRANSCRIPT

PAPER • OPEN ACCESS
Submicron hollow spot generation by solidimmersion lens and structured illuminationTo cite this article: M-S Kim et al 2012 New J. Phys. 14 103024
View the article online for updates and enhancements.
You may also likeNumerical Simulations on a Stepped SolidImmersion Lens Suggested from theExperimental Consideration of theBackflowMoon Ho Choi, Seung Hyun Han, YoonChul Rhim et al.
-
Improved Air Gap Controller for SolidImmersion Lens-Based Near-FieldRecording Servo SystemJung-Gon Kim, Won-Ho Shin, Jun Jeonget al.
-
Optical Design for the Optimum SolidImmersion Lens with High NumericalAperture and Large ToleranceNarak Choi, Seongbo Shim, Tom D.Milster et al.
-
Recent citationsEffect of pulse duration on the energydelivery under nonlinear propagation oftightly focused Cr:forsterite laser radiationin bulk siliconE I Mareev et al
-
Probing sub-diffraction optical confinementvia the polarized Raman spectroscopy of asingle-walled carbon nanotubeYun-Tae Kim et al
-
Creation of an anti-imaging system usingbinary opticsHaifeng Wang et al
-
This content was downloaded from IP address 178.205.136.242 on 30/12/2021 at 13:07
T h e o p e n – a c c e s s j o u r n a l f o r p h y s i c s
New Journal of Physics
Submicron hollow spot generation by solidimmersion lens and structured illumination
M-S Kim1,4, A C Assafrao2, T Scharf1, A J H Wachters2,S F Pereira2, H P Urbach2, M Brun3, S Olivier3, S Nicoletti3
and H P Herzig1
1 Optics and Photonics Technology Laboratory, Ecole Polytechnique Federalede Lausanne (EPFL), Rue A-L Breguet 2, Neuchatel CH-2000, Switzerland2 Optics Research Group, Delft University of Technology, Lorentzweg 1,2628 CJ Delft, The Netherlands3 CEA-LETI, Minatec Campus, 17 rue des Martyrs, 38054 Grenoble Cedex 9,FranceE-mail: [email protected]
New Journal of Physics 14 (2012) 103024 (19pp)Received 13 June 2012Published 16 October 2012Online at http://www.njp.org/doi:10.1088/1367-2630/14/10/103024
Abstract. We report on the experimental and numerical demonstration ofimmersed submicron-size hollow focused spots, generated by structuringthe polarization state of an incident light beam impinging on a micro-sizesolid immersion lens (µ-SIL) made of SiO2. Such structured focal spotsare characterized by a doughnut-shaped intensity distribution, whose centraldark region is of great interest for optical trapping of nano-size particles,super-resolution microscopy and lithography. In this work, we have used ahigh-resolution interference microscopy technique to measure the structuredimmersed focal spots, whose dimensions were found to be significantly reduceddue to the immersion effect of the µ-SIL. In particular, a reduction of 37%of the dark central region was verified. The measurements were comparedwith a rigorous finite element method model for the µ-SIL, revealing excellentagreement between them.
4 Author to whom any correspondence should be addressed.
Content from this work may be used under the terms of the Creative Commons Attribution-NonCommercial-ShareAlike 3.0 licence. Any further distribution of this work must maintain attribution to the author(s) and the title
of the work, journal citation and DOI.
New Journal of Physics 14 (2012) 1030241367-2630/12/103024+19$33.00 © IOP Publishing Ltd and Deutsche Physikalische Gesellschaft

2
Contents
1. Introduction 22. Immersion technique 33. Experimental arrangement 5
3.1. Experimental setup . . . . . . . . . . . . . . . . . . . . . . . . . . . . . . . . 53.2. Focused spots of structured illumination . . . . . . . . . . . . . . . . . . . . . 5
4. Geometry of the micro-size solid immersion lens 75. Verification of the immersion effect 86. Rigorous simulation model for micro-size solid immersion lens 107. Structuring immersion focal spots 11
7.1. Doughnut beam by focusing azimuthal polarization . . . . . . . . . . . . . . . 127.2. Decomposed azimuthal polarization: the two-half-lobes spot . . . . . . . . . . 147.3. The first-order Bessel–Gauss beam . . . . . . . . . . . . . . . . . . . . . . . . 15
8. Conclusions 17Acknowledgments 18References 18
1. Introduction
By manipulating the state of polarization of a laser beam, structured focal spots can be generatedin the focal plane of an optical system. In particular, when a cylindrical vector beam is incidenton a focusing lens of relatively low numerical aperture (NA), a doughnut-shape focused spotis generated. Typically, a radially or azimuthally polarized light leads to such doughnut-shapehollow spots [1, 2]. The former type of cylindrical polarization, namely radial polarization,has attracted much attention of researchers owing to the presence of a strong longitudinalcomponent for high-NA focusing lenses. This strong longitudinal field component fills up thecentral dark zone of the doughnut beam and finally generates a sharper focus compared withthat of a linear polarization with the same NA lens in theory [3, 4]. A reduced bright focalspot finds its application in many research areas ([5, 6] and references therein): not only infundamental subjects such as microscopy, lithography and optical data storage systems, butalso in advanced research, for instance, Raman spectroscopy, particle acceleration, fluorescentimaging and second- or third-harmonic generation. The latter case, the pure hollow spot createdby focusing an incident azimuthally polarized light, is equally advantageous for many othersuper-resolution optical systems, such as stimulated emission depletion (STED) microscopy [7]and subdiffraction lithography [8, 9]. Another fascinating application is optical trapping, wherethe central dark zone of the doughnut spot is essential to trap and manipulate tiny objects thatmight be repelled and pushed away from the regions of maximum intensity [10]. Low-refractive-index particles, such as air bubbles in liquids and metallic particles at certain frequencies, aretypically repelled by a bright spot [11, 12]. Absorbing (i.e. non-transparent) particles in liquidsand a gaseous medium are also repelled and pushed away from intensity maxima [13–15]. Inparticular, a dark trap is more beneficial for some applications than a bright trap for a simplereason: the light may not interact with the trapped object. This is of great advantage whiletrapping photosensitive materials, e.g. biological cells, and for trapping neutral atoms [16–18].
New Journal of Physics 14 (2012) 103024 (http://www.njp.org/)

3
Although optical trapping has been demonstrated using radial polarized beams, the stronglongitudinal field component creates major difficulties when the aforementioned particles areconsidered. In contrast, when focusing an azimuthally polarized light, a dark central zoneis always achieved due to non-existence of a longitudinal field, regardless of the NA of thefocusing lenses employed [1, 2, 19]. Such remarkable characteristics, i.e. a doughnut focusedspot with a well-defined dark zone, is by itself a major improvement on dark optical trappingtechniques. A further improvement step can be achieved by diminishing the overall size of thedark region, which would immediately allow for trapping even smaller samples. Such an attemptat nano-particle dark trapping has recently been reported using plasmonic nano-antennas [20].
Since most optical systems are already operating at high NAs, diminishing the size ofthe dark region demands that the NA should be pushed beyond the unity limitation. In thiswork, a detailed study of the doughnut-shaped focal spot, generated with azimuthally polarizedlaser beams, is given for a high-performance optical system with an NA larger than unity.To achieve such a high NA, a micro-size solid immersion lens (µ-SIL) is placed in the focalplane of an NA = 0.9 focusing lens. The resulting structured immersion focal spot is thenmeasured with a high-resolution interference microscope (HRIM), which allows measuringlight fields with nanometer precision. The experimental data are compared with a rigorousthree-dimensional (3D) computational model, based on the finite element method (FEM) thatsimulates the electric field distribution in the vicinity of a 2 µm diameter SIL. Comparisonsbetween the experiments and simulations are made, revealing good overall agreement. Theremainder of this paper is organized as follows. In section 2, methods for achieving NA largerthan unity are briefly discussed. In section 3, the experimental arrangements for realizing thecylindrically symmetric polarization status, especially azimuthal polarization, are shown. Next,in section 4, the fabrication and geometry of the µ-SIL are described. Section 5 is dedicatedto the experimental exploitation of the principal responses of the µ-SILs, namely spot-sizereduction and peak intensity enhancement. In section 6, the rigorous 3D FEM simulation modelfor µ-SIL is presented. Finally, in section 7, the actual measurements of the structured focusedspots generated by the µ-SIL, along with the simulation results, are shown. The conclusions arepresented in section 8.
2. Immersion technique
When focusing light through a medium made exclusively of air, the maximum achievable NAis theoretically limited to unity. This limitation follows directly from the definition of NA,given by
NA = n sin θ. (1)
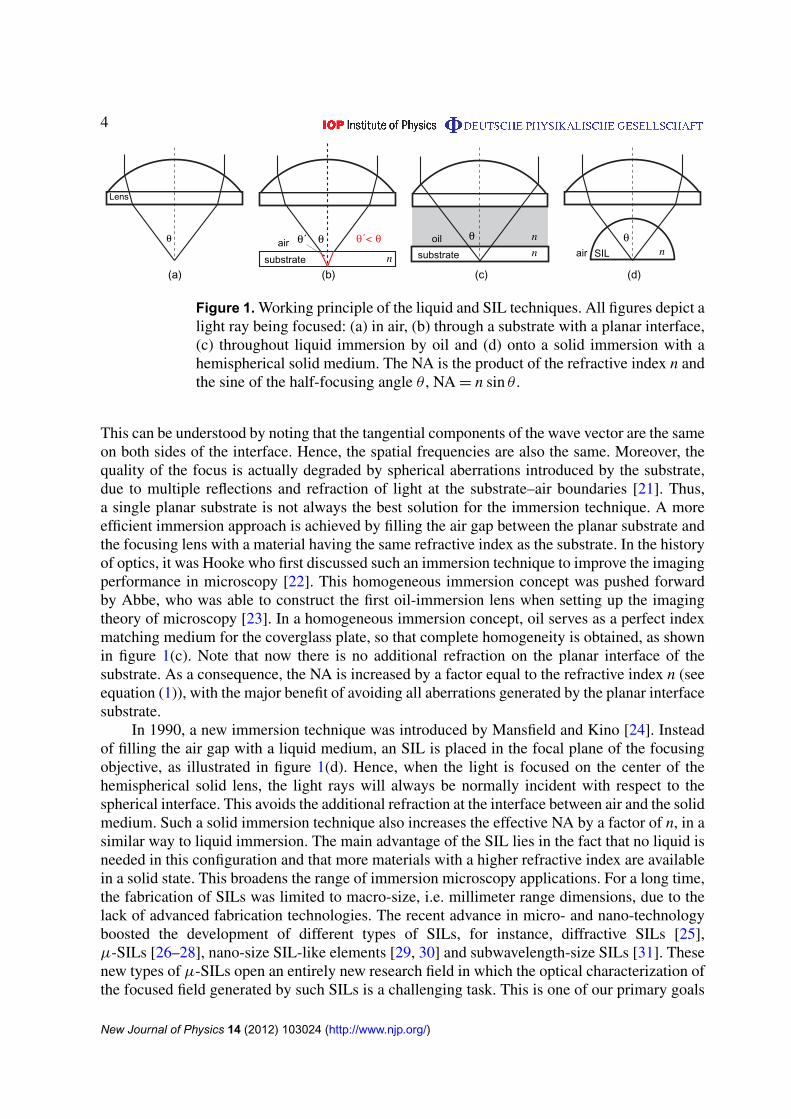
Here, θ is the angle that the marginal ray makes with the optical axis (half-angle of the focusingcone) and n is the refractive index of the medium through which the rays pass. Therefore, astraightforward solution to increase the NA is to switch the working space medium from air to ahigher-refractive-index material. In other words, the utilization of an immersion technique canpush the NA barrier above unity. Figure 1 illustrates the working principle of liquid and solidimmersion schemes. When one simply inserts a high-refractive-index medium with a planarsurface in an attempt to increase the NA by a factor of n, refraction of light reduces the focusingangle θ to θ ′, according to Snell’s law. This situation is depicted in figure 1(b). A quick analysisusing equation (1) and Snell’s law leads to the conclusion that the NA is sustained as before.
New Journal of Physics 14 (2012) 103024 (http://www.njp.org/)
4
Lens
θ
(a)substrate n
air
(b)
oil
substrate
n
n
θ
(c)
θSILair n
(d)
θθ θ θ
Figure 1. Working principle of the liquid and SIL techniques. All figures depict alight ray being focused: (a) in air, (b) through a substrate with a planar interface,(c) throughout liquid immersion by oil and (d) onto a solid immersion with ahemispherical solid medium. The NA is the product of the refractive index n andthe sine of the half-focusing angle θ , NA = n sin θ .
This can be understood by noting that the tangential components of the wave vector are the sameon both sides of the interface. Hence, the spatial frequencies are also the same. Moreover, thequality of the focus is actually degraded by spherical aberrations introduced by the substrate,due to multiple reflections and refraction of light at the substrate–air boundaries [21]. Thus,a single planar substrate is not always the best solution for the immersion technique. A moreefficient immersion approach is achieved by filling the air gap between the planar substrate andthe focusing lens with a material having the same refractive index as the substrate. In the historyof optics, it was Hooke who first discussed such an immersion technique to improve the imagingperformance in microscopy [22]. This homogeneous immersion concept was pushed forwardby Abbe, who was able to construct the first oil-immersion lens when setting up the imagingtheory of microscopy [23]. In a homogeneous immersion concept, oil serves as a perfect indexmatching medium for the coverglass plate, so that complete homogeneity is obtained, as shownin figure 1(c). Note that now there is no additional refraction on the planar interface of thesubstrate. As a consequence, the NA is increased by a factor equal to the refractive index n (seeequation (1)), with the major benefit of avoiding all aberrations generated by the planar interfacesubstrate.
In 1990, a new immersion technique was introduced by Mansfield and Kino [24]. Insteadof filling the air gap with a liquid medium, an SIL is placed in the focal plane of the focusingobjective, as illustrated in figure 1(d). Hence, when the light is focused on the center of thehemispherical solid lens, the light rays will always be normally incident with respect to thespherical interface. This avoids the additional refraction at the interface between air and the solidmedium. Such a solid immersion technique also increases the effective NA by a factor of n, in asimilar way to liquid immersion. The main advantage of the SIL lies in the fact that no liquid isneeded in this configuration and that more materials with a higher refractive index are availablein a solid state. This broadens the range of immersion microscopy applications. For a long time,the fabrication of SILs was limited to macro-size, i.e. millimeter range dimensions, due to thelack of advanced fabrication technologies. The recent advance in micro- and nano-technologyboosted the development of different types of SILs, for instance, diffractive SILs [25],µ-SILs [26–28], nano-size SIL-like elements [29, 30] and subwavelength-size SILs [31]. Thesenew types of µ-SILs open an entirely new research field in which the optical characterization ofthe focused field generated by such SILs is a challenging task. This is one of our primary goals
New Journal of Physics 14 (2012) 103024 (http://www.njp.org/)
5
in this paper. We will study a micro-fabricated hemispherical SIL, having 2 µm diameter and abody filled with SiO2 [28]. In section 3, a short description of the high-resolution interferencemicroscope is given, along with the experimental conditions for generating structured focusedbeams.
3. Experimental arrangement
3.1. Experimental setup
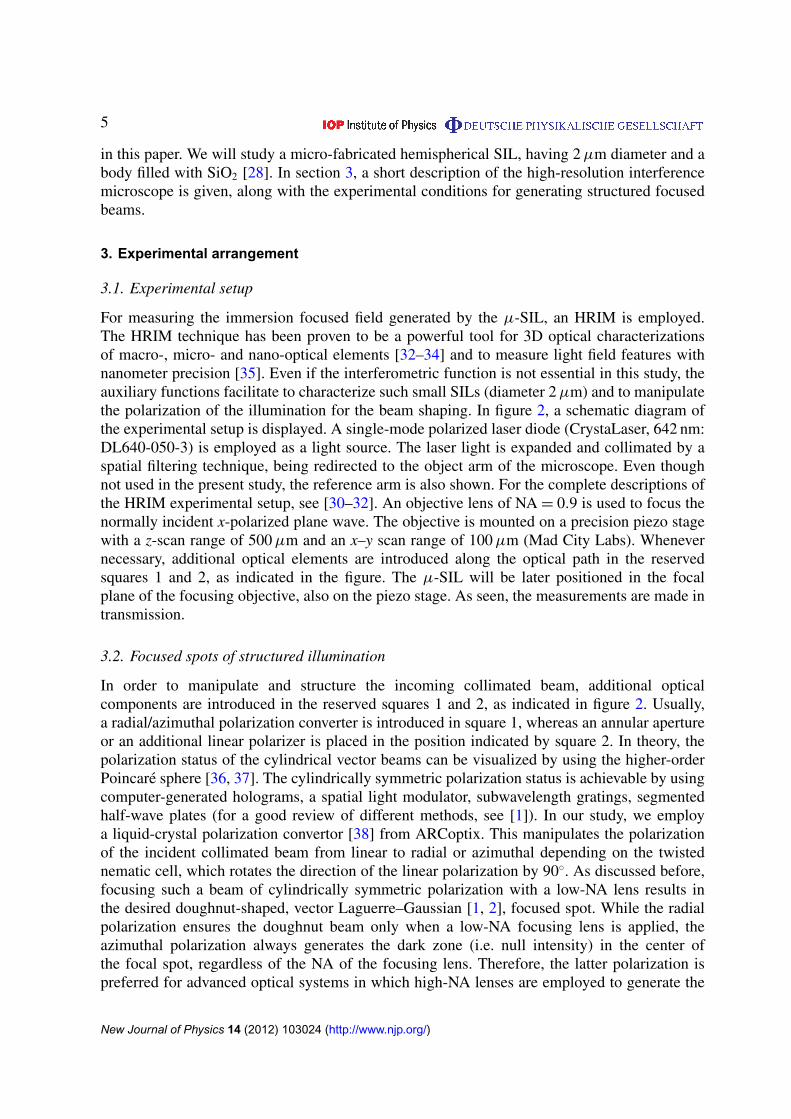
For measuring the immersion focused field generated by the µ-SIL, an HRIM is employed.The HRIM technique has been proven to be a powerful tool for 3D optical characterizationsof macro-, micro- and nano-optical elements [32–34] and to measure light field features withnanometer precision [35]. Even if the interferometric function is not essential in this study, theauxiliary functions facilitate to characterize such small SILs (diameter 2 µm) and to manipulatethe polarization of the illumination for the beam shaping. In figure 2, a schematic diagram ofthe experimental setup is displayed. A single-mode polarized laser diode (CrystaLaser, 642 nm:DL640-050-3) is employed as a light source. The laser light is expanded and collimated by aspatial filtering technique, being redirected to the object arm of the microscope. Even thoughnot used in the present study, the reference arm is also shown. For the complete descriptions ofthe HRIM experimental setup, see [30–32]. An objective lens of NA = 0.9 is used to focus thenormally incident x-polarized plane wave. The objective is mounted on a precision piezo stagewith a z-scan range of 500 µm and an x–y scan range of 100 µm (Mad City Labs). Whenevernecessary, additional optical elements are introduced along the optical path in the reservedsquares 1 and 2, as indicated in the figure. The µ-SIL will be later positioned in the focalplane of the focusing objective, also on the piezo stage. As seen, the measurements are made intransmission.
3.2. Focused spots of structured illumination
In order to manipulate and structure the incoming collimated beam, additional opticalcomponents are introduced in the reserved squares 1 and 2, as indicated in figure 2. Usually,a radial/azimuthal polarization converter is introduced in square 1, whereas an annular apertureor an additional linear polarizer is placed in the position indicated by square 2. In theory, thepolarization status of the cylindrical vector beams can be visualized by using the higher-orderPoincare sphere [36, 37]. The cylindrically symmetric polarization status is achievable by usingcomputer-generated holograms, a spatial light modulator, subwavelength gratings, segmentedhalf-wave plates (for a good review of different methods, see [1]). In our study, we employa liquid-crystal polarization convertor [38] from ARCoptix. This manipulates the polarizationof the incident collimated beam from linear to radial or azimuthal depending on the twistednematic cell, which rotates the direction of the linear polarization by 90◦. As discussed before,focusing such a beam of cylindrically symmetric polarization with a low-NA lens results inthe desired doughnut-shaped, vector Laguerre–Gaussian [1, 2], focused spot. While the radialpolarization ensures the doughnut beam only when a low-NA focusing lens is applied, theazimuthal polarization always generates the dark zone (i.e. null intensity) in the center ofthe focal spot, regardless of the NA of the focusing lens. Therefore, the latter polarization ispreferred for advanced optical systems in which high-NA lenses are employed to generate the
New Journal of Physics 14 (2012) 103024 (http://www.njp.org/)
6
Tube lens
CCD
Beam Expansion
Obj. arm
Ref
. ar
m
HWP
PBS
G-TPolarizer
z
x
y
Pinhole
BS
Las
er
ligh
tso
urc
e 5-stepphase shifting algorithm
100x/NA1.4oil imm.
Imm. oil
µ-SIL
z-axisscanning
NA 0.9
1
2
Figure 2. Schematic diagram of the experimental setup of the HRIM. Theµ-SIL and the NA = 0.9 focusing lens are inserted on the same sample stage.In the object arm, a plane wave is normally incident onto the focusing lens. Byscanning the µ-SIL together with the focusing lens along the z-axis, 3D mapsof the focused field are obtained. Additional optical elements are introducedin squares 1 and 2 to manipulate the wavefront and polarization state of thelight.
hollow spots. Hence, throughout this work, this particular state of polarization shall be used. Infigure 3, when immersion is not yet applied, the four different structured focal spots measuredare shown. The spot shown in figure 3(a), measured in the focal plane of the NA = 0.9 lens,is obtained by focusing the incident azimuthally polarized beam without any other opticalelements in square 2. Note that the desired doughnut shape, with a pronounced dark zone inits central region, is obtained under these experimental circumstances. If a linear polarizer withextinction axes in the transverse plane is now introduced in the position indicated by square2, the doughnut beam is decomposed into a two-half-lobes spot, as shown in figures 3(b) and(c). When the linear polarizer is removed and an annular aperture, which blocks 70% of theentrance pupil of the focusing lens, is inserted in square 2 position, the amplitude distribution ofthe focused spot in the focal plane resembles the first-order Bessel function of the first kind, asshown in figure 3(d). This type of experimental beam is known as the Bessel–Gauss beam forboth a scalar field [39] and a vector field [40, 41]. Our result in figure 3(d) fails in the case of a
New Journal of Physics 14 (2012) 103024 (http://www.njp.org/)

7
0
0.2
0.4
0.6
0.8
1
(a) (d)(b) (c)
Figure 3. Measured transverse intensity distributions of the structured non-immersed focal spots generated by the NA = 0.9 objective. The incomingplane wave is azimuthally polarized. (a) No additional optical elements areintroduced. A typical doughnut-shaped spot is obtained. A linear polarizer isused to decompose the azimuthally polarized beam, resulting in the two-half-lobes spots with the extinction axis parallel to (b) the x-axis and (c) the y-axis,respectively. (d) The first-order Bessel–Gauss spot generated by introducing anannular aperture at the entrance pupil of the focusing lens. A dark central zoneis also obtained for this case. The scale bar represents 1 µm. The intensities areall normalized.
vector field due to the high-NA focusing. Nevertheless, a tiny central dark zone is also observedin this type of focused spot at the cost of stronger side lobes.
At this point, experimental procedures for obtaining structured focused spots at high NA,characterized by the desired doughnut shape, are described. The next step is, therefore, to studythe immersion properties of these particular spots under a µ-SIL influence. Thus, in section 4,a brief discussion of the µ-SIL geometry is presented, followed by an immersion study.
4. Geometry of the micro-size solid immersion lens
In this study, a chip containing many hemispherical µ-SILs, having 2 µm diameter, is employed.The fabrication of such µ-SILs is a result of several conventional micromachining processescombined, such as etching, deposition and polishing. The details of the fabrication processesare reported in [28]. In figure 4, the geometry of a single µ-SIL is shown. The hemisphericalSIL body, filled with silicon dioxide (SiO2, n = 1.5), is held by a 200 nm thick silicon nitride(Si3N4) membrane of 100 × 100 µm2. The main SIL chip is formed in a 550 µm thick silicon(Si) substrate, which is back-side etched to release the spherical surface to the air. Note thatside wall angle α of the Si substrate and the 100 µm width of the bottom opening lead to theback-side opening of approximately 1.65 mm. By simply applying geometrical optics, one canconclude that the size of the NA = 0.9 focused beam 550 µm above the focal plane will belarger than this opening itself, therefore limiting the NA of the focusing lens. In fact, the finitesize of this back-side opening results in an effective NA of approximately 0.8. The µ-SILs aredesigned in an array with various numbers, e.g. 3 × 3, 2 × 2 and 1 × 6, and a single SIL aswell. Since the thin Si3N4 membrane is transparent for the visible spectrum, the µ-SILs canstill be seen from the bottom surface side and localized through the membrane. In this way,
New Journal of Physics 14 (2012) 103024 (http://www.njp.org/)

8
Si3N4 100 nm
Si3N4 100 nm
Si3N4 200 nm
SiO2 Ø = 2 µmSi substrate
Bottom surface
Optical axis
x
yz
550 µmα = 55o
100 µm
Figure 4. Schematic representation of the µ-SIL geometry: the hemisphericalSIL body (SiO2) with 2 µm diameter is held by the 200 nm thick Si3N4
membrane. The thickness of the Si substrate is 550 µm and the side wall angle α
is approximately 55◦. The width of the bottom opening is 100 µm (not to scalehere). Light propagates along the positive z-axis.
optical characterizations are carried out through this membrane in the HRIM, as explained infigure 2.
5. Verification of the immersion effect
The expected property of the µ-SIL is, naturally, to reduce the focal spot size by a factorintrinsically related to the refractive index of the immersion medium. As a primary consequence,the resolution of the optical system in which the µ-SIL is employed would be increased. Inthis section, a preliminary experimental investigation of the spot-size reduction caused by theµ-SIL is carried out. For the moment, no additional optical components (polarization converters,annular aperture, etc) are used in the optical setup. Therefore, the incident illumination upon theobjective lens is the collimated linearly polarized plane wave. Figure 5 shows the observed focalspots on the bottom of the SIL chip, where the Si3N4 membrane holds the µ-SILs (see figure 4).
The 3 × 3 circular features represent the bottom view of the 2 µmSILs. Initially, a referencespot is defined by focusing the light onto the Si3N4 membrane (out of the SIL), as shown infigure 5(a). This spot is referred to as a non-immersed spot. Next, the light is focused ontoeach of the µ-SILs at a time, as shown in figures 5(b)–(h). Visually, it is already possible torecognize the spot-size reduction and the intensity enhancement due to the expected immersioneffect. Moreover, a rough inspection of the immersed spot size indicates that all lenses respondto the incident field in a similar way. This gives an indication of the uniformity and homogeneityof the fabricated µ-SILs.
Further quantitative analysis has been carried out on the measured data in order to confirmthe aforementioned observations. For a statistical analysis, each spot has been measured fivetimes at the same position. The results indicate that the transverse size of the non-immersedfocused spot is 502 ± 10 nm along the x-axis and 504 ± 9 nm along the y-axis. In the longitudinaldirection, i.e. along the z-axis, the spot size and the peak intensity are found to be 3805 ± 39 nmand 115 ± 4 (arbitrary unit), respectively. The small standard deviation values for the spot size(<2%) confirm the repeatability and reliability of our measurements. For the immersed spots,the standard deviation from the five measurements exhibits analogous results to that of the
New Journal of Physics 14 (2012) 103024 (http://www.njp.org/)

9
(a) (c)
(f)
(d)
(h)
(b)
(g)(e)
Figure 5. Focal spots observed on the bottom of the SIL chip, where the 3 × 3circular features represent an array of µ-SILs. (a) The focal spot outside the µ-SIL (non-immersion spot) and (b)–(h) the focal spots on the individual µ-SIL(immersion spots). The image size is 15 × 15 µm2 and the scale bar represents2 µm.
non-immersed spot. Taking, for example, the spot shown in figure 5(d), the transverse size is343 ± 6 nm in the x-axis and 350 ± 7 nm in the y-axis. Along the z-axis, the peak intensity is204 ± 8 (arbitrary unit) and the spot size is 1392 ± 63 nm. A direct comparison of the averagetransverse size of the non-immersed and the immersed focal spots shows a reduction ratio ofapproximately 1.5 (x-axis: 1.47 and y-axis: 1.4). This agrees with the refractive index value ofthe SiO2 SIL, namely n = 1.5 at 642 nm wavelength. The peak intensity is enhanced by theimmersion effect, due to stronger spatial confinement of light. Considering the power P carriedby a Gaussian beam, expressed by equation (2), an estimate of the peak enhancement can bederived:
P =12πw2 I. (2)
Here, I is the peak intensity and w is the beam waist [42]. Note that equation (2) is validfor a scalar field. For the vector field, the beam waist w along the x- and y-axes should betaken into account. However, equation (2) provides a quick estimation of the peak intensityenhancement caused by the immersion effect. For the case of no absorption and other losses(i.e. P is a constant), the peak intensity value is only proportional to the square of the spotsize. The spot-size reduction of 1.5 theoretically leads to the peak intensity enhancement of2.25(= 1.52). In the measurements, the peak intensity is enhanced by a factor of 1.87. Thisroughly indicates that there is a transmission loss of approximately 17% that includes the 13%reflection loss at the spherical surface. In conclusion, the spot-size reduction due to the µ-SILis found to be of the same order as the refractive index of the material of the lens. These results,which hold for x-polarized light, must now be investigated for the structured illumination beamshaving azimuthal polarization. The next sections are, therefore, exclusively dedicated to studysuch structured spots.
New Journal of Physics 14 (2012) 103024 (http://www.njp.org/)

10
-1000 -500 5000 1000
z-ax
is (n
m)
1000
500
0
0
0.5
1
-300
x-axis (nm)
Figure 6. Computational domain of the 3D FEM model for the µ-SIL. The µ-SIL, described as a hemihemispherical structure, is placed in the focal planeof an objective lens with an effective NA of 0.8. The immersed focal spot,collected at the bottom of the µ-SIL lens, will be used for comparison with themeasurements.
6. Rigorous simulation model for micro-size solid immersion lens
The small features of the µ-SIL introduce extra concern when one tries to rigorously simulatethe focused spot generated by these tiny SILs. Unlike the models used to describe an SIL,which usually consider an upper half-space filled with the refractive index of the SIL material,the wavelength dimensions of the µ-SILs require a complete meshing representation of the SILstructure. In a sense, the µ-SIL must be treated as a small scatterer, whose shape, size andorientation cannot be neglected. Since this scatterer is placed on the focal plane of a high-NAfocusing lens, the vectorial nature of the light must also be taken into account. Hence, a rigoroussimulation tool, based on solving Maxwell’s equations and capable of handling complicatedstructures, has to be applied when analyzing such problems. Therefore, throughout this work,all simulations described are carried out in a rigorous 3D FEM simulation tool [43, 44].
In a typical simulation section, the polarized laser light (at the wavelength of 642 nm) isfocused onto the planar bottom surface of the µ-SIL, as shown in figure 6. Note that lightpropagates from the top to the bottom. The geometrical focus of the high-NA lens is chosento be at z = 0 nm, coincident with the bottom of the µ-SIL. The µ-SIL is meshed as a 3Dhemispherical object with refractive n = 1.5. All surrounding space is filled with air (n = 1).A higher number of points in the central region of the computation domain were assigned toensure good representation of the rounded µ-SIL structure. All simulations were performed ina cluster of four AMD Quad-Core Opteron 6176 (2.3 GHz) with 256 GB of internal memory,operating under the Linux environment. Elements of order 2 [45] were used on a hexahedralmesh with total size varying from 2100 × 2100 × 1350 nm3. The mesh size was chosen insuch a way that the entire µ-SIL fits completely inside the computational domain, a conditionnecessary for achieving convergence. A perfect matched layer [45] with a width of 50 nm inall directions was defined to truncate the computational domain. The total execution time of asingle calculation was about 6 h. In figure 6, the normalized energy density of the total electricfield, i.e. |Et|
2= |Ex |
2 +∣∣Ey
∣∣2+ |Ez|
2, computed across the µ-SIL is shown. Here, Ex , Ey andEz are the complex electric field components and E2
t is usually referred to as the total electricfield or field intensity I . From the normalized form of the total electric field intensity, computed
New Journal of Physics 14 (2012) 103024 (http://www.njp.org/)

11
ExperimentSimulation
−2000 −1000 0 1000 2000 x−axis (nm)
Nor
mal
ized
inte
nsity
0.10.20.30.40.50.60.70.80.9
1
0
(a) ExperimentSimulation
−2000 −1000 0 1000 2000 x−axis (nm)
Nor
mal
ized
inte
nsity
0.10.20.30.40.50.60.70.80.9
1
0
(b)
Figure 7. Intensity profiles of the measured and simulated non-immersedstructured focal spots: (a) the doughnut-shape hollow spot (see figure 3(a)) and(b) the first-order Bessel–Gauss focal spot (see figure 3(d)). Excellent agreementis found between experiments and simulations. The intensities are all normalized.
below the boundary (SIL–air), the spot profile is taken and will be used for comparisons withthe experimental data.
When the µ-SIL is removed from the computational domain, the focused spot generatedby the focusing objective lens alone must match the measured spot shown in figure 3(a).Therefore, a preliminary simulation for the azimuthally polarized beam being focused by anNA = 0.8 lens (considering the NA cut-off due to the finite size of the Si substrate opening,see section 4), with and without the annular aperture, is performed and compared with themeasured spots. The results are plotted in figure 7. When the azimuthally polarized beam isfocused by the high-NA objective, the doughnut-shaped spot is obtained in the focal plane, asseen from the profile shown in figure 7(a). The blue dashed line, obtained from the simulation,is in good agreement with the measured spot under the same conditions (red solid line). In thesame way, when an annular aperture is placed in front of the focusing objective, the resultingfirst-order Bessel–Gauss is realized. The polarization of this generated Bessel–Gauss beam isazimuthal, which leads to a cylindrically symmetric focal spot. The vector nature of the highlyfocused field causes the depolarization effect [46], which decomposes the polarization into thexyz components. However, the azimuthal polarization naturally possesses only the transversecomponents, i.e. the xy ones. Therefore, the generated first-order Bessel–Gauss beam exhibitsthe central null intensity with relatively strong side lobes. As shown in figure 7(b), goodagreement is also obtained between experiment and simulation in this case. Hence, the nextstep is to place the µ-SIL on the focal plane of the high-NA lens in order to study numericallyand experimentally the structured immersed focused spots.
7. Structuring immersion focal spots
As previously discussed, different optical elements are introduced in the optical path of thelaser beam leading to the structured focal spots, such as the desired doughnut-shaped spot.Now, the structured focused spots are immersed using the µ-SIL. The measured spots are
New Journal of Physics 14 (2012) 103024 (http://www.njp.org/)

12
−2000 −1000 00
1000 2000
0.2
0.4
0.6
0.8
1
x−axis (nm)
Nor
mal
ized
inte
nsity
ImmersedNon−Immersed
−1000−1000
0
0
1000
1000
x−axis (nm)
y−
axis
(nm
)
0.5
0
1
−1000−1000
0
0
1000
1000
x−axis (nm)
y−
axis
(nm
)0.5
0
1
Figure 8. Measured intensity distributions of the doughnut-shape hollow spots:top left, the non-immersed spot is mapped in a 2 µm circular measuring window.The immersed spot is shown bottom left. The intensities are normalized withrespect to the peak intensity of the immersion spot. In the right figure, the profilesalong the x-axis for both spots are plotted after unity normalization. A reductionof the spot size of approximately 30% is achieved due to the immersion lens.
then qualitatively and quantitatively compared with the simulation results, for the doughnutspot, the two-half-lobes spot (the decomposed case of the doughnut spot) and the first-orderGauss–Bessel spot.
7.1. Doughnut beam by focusing azimuthal polarization
The first case considered is the azimuthally polarized laser beam being focused by the high-NA lens onto and outside the µ-SIL. The measured immersed and non-immersed focal spotsare mapped in a circular measuring window with 2 µm diameter, after being normalized by themaximum intensity value of the immersed spot. The figure color map is adjusted to displaycolors from zero to unity in both figures in such a way that the difference between maximumintensities can be readily visualized. To quantify the measured spots, the unity normalizedintensity profiles along the x-axis are also plotted. The results are shown in figure 8. Fromthe focused spot intensity distributions shown on the left, it is qualitatively visible that spot-sizereduction occurs due to the immersion effect. Moreover, by comparing the maximum intensityvalues in both immersed and non-immersed spots, it is found that the measured peak intensityof the immersed spot is enhanced by 1.54 times compared with the non-immersed one. On theright plot, the intensity profiles quantitatively show an overall reduction in the immersed spotsize and the size of the central dark region, measured in terms of the full-width at half-maximum(FWHM). On average, the immersed focused spot is reduced by a factor of 1.3 times comparedwith the non-immersed spot. In what follows, a further comparison with the simulations is made.
The simulation is carried out as explained in the previous section. The azimuthallypolarized light is focused onto and outside the µ-SIL, and the spot computed in the radialdirection (i.e. x- and y-directions) is plotted as a function of the position. The same color-map
New Journal of Physics 14 (2012) 103024 (http://www.njp.org/)
13
−1000 0 10000
1
0.2
0.4
0.6
0.8
x−axis (nm)N
orm
aliz
ed In
tens
ity
−1000−1000
0
0
1000
1000
x−axis (nm)
y−
axis
(nm
)
−1000−1000
0
0
1000
1000
x−axis (nm)
y−
axis
(nm
)
0.5
0
1
0.5
0
1ImmersedNon−Immersed
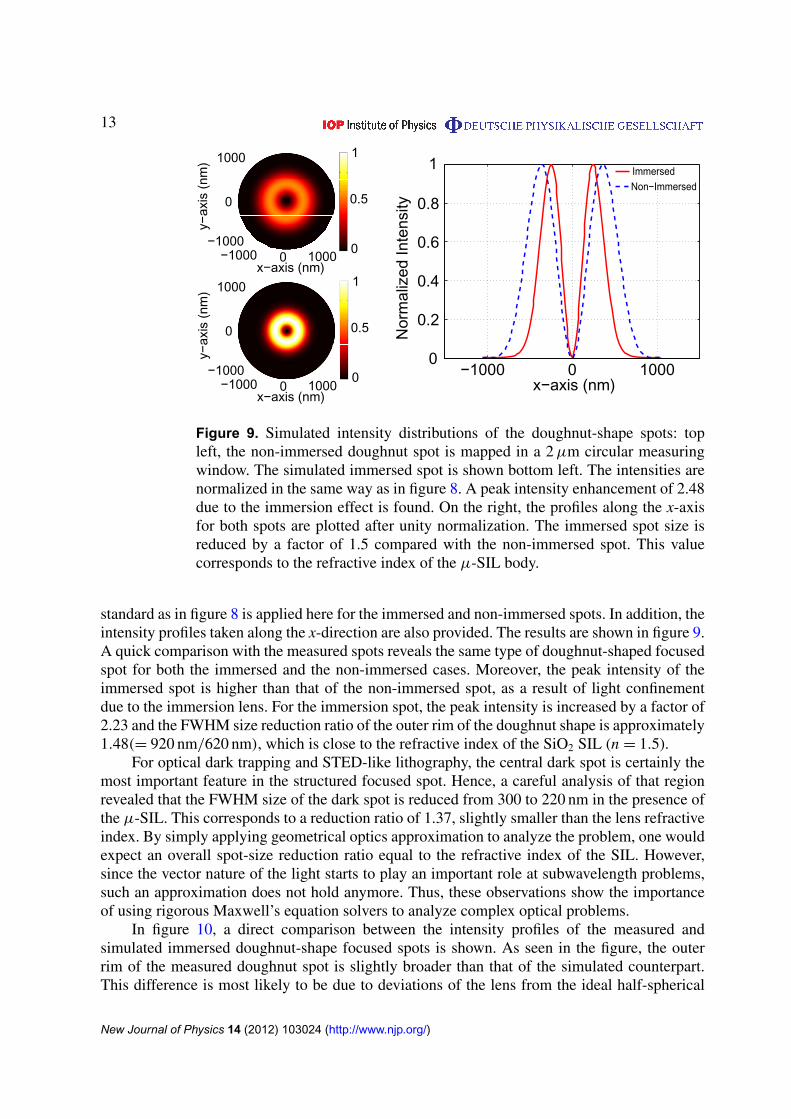
Figure 9. Simulated intensity distributions of the doughnut-shape spots: topleft, the non-immersed doughnut spot is mapped in a 2 µm circular measuringwindow. The simulated immersed spot is shown bottom left. The intensities arenormalized in the same way as in figure 8. A peak intensity enhancement of 2.48due to the immersion effect is found. On the right, the profiles along the x-axisfor both spots are plotted after unity normalization. The immersed spot size isreduced by a factor of 1.5 compared with the non-immersed spot. This valuecorresponds to the refractive index of the µ-SIL body.
standard as in figure 8 is applied here for the immersed and non-immersed spots. In addition, theintensity profiles taken along the x-direction are also provided. The results are shown in figure 9.A quick comparison with the measured spots reveals the same type of doughnut-shaped focusedspot for both the immersed and the non-immersed cases. Moreover, the peak intensity of theimmersed spot is higher than that of the non-immersed spot, as a result of light confinementdue to the immersion lens. For the immersion spot, the peak intensity is increased by a factor of2.23 and the FWHM size reduction ratio of the outer rim of the doughnut shape is approximately1.48(= 920 nm/620 nm), which is close to the refractive index of the SiO2 SIL (n = 1.5).
For optical dark trapping and STED-like lithography, the central dark spot is certainly themost important feature in the structured focused spot. Hence, a careful analysis of that regionrevealed that the FWHM size of the dark spot is reduced from 300 to 220 nm in the presence ofthe µ-SIL. This corresponds to a reduction ratio of 1.37, slightly smaller than the lens refractiveindex. By simply applying geometrical optics approximation to analyze the problem, one wouldexpect an overall spot-size reduction ratio equal to the refractive index of the SIL. However,since the vector nature of the light starts to play an important role at subwavelength problems,such an approximation does not hold anymore. Thus, these observations show the importanceof using rigorous Maxwell’s equation solvers to analyze complex optical problems.
In figure 10, a direct comparison between the intensity profiles of the measured andsimulated immersed doughnut-shape focused spots is shown. As seen in the figure, the outerrim of the measured doughnut spot is slightly broader than that of the simulated counterpart.This difference is most likely to be due to deviations of the lens from the ideal half-spherical
New Journal of Physics 14 (2012) 103024 (http://www.njp.org/)

14
−2000 −1000 00
1000 2000
0.2
0.4
0.6
0.8
1
x−axis (nm)
Nor
mal
ized
inte
nsity
Experiment
Simulation
Figure 10. Comparison between the measured and the simulated intensityprofiles of the immersed doughnut spot. The measured central dark region showsgood agreement with that of the simulation. All intensities are normalized.
shape, which is expected to be more pronounced on the outer regions of the µ-SIL. Thus, sincethe full extension of the incident doughnut spot on the µ-SIL reaches up to 2 µm (see figure 7),a larger deviation from the ideal case (simulation) will occur in that region. In addition, notincluding the Si3N4 layer and the Si holder structure in the simulation model may also becontributing to the small difference. On the other hand, the central dark regions of both themeasured and the simulated spots show excellent agreement. The reason is, as seen from theperformance test of the immersion effect done with the linearly polarized plane wave, that thecentral part of the µ-SIL has a much better spherical surface, thus minimizing the experimentalerrors in that region.
7.2. Decomposed azimuthal polarization: the two-half-lobes spot
A second interesting type of structured focal spot achievable with azimuthally polarized lightis obtained by placing before the focusing lens a polarizer aligned with the x-axis or y-axis.This extra optical component leads to a decomposition of the doughnut spot into two half-lobes,vertically or horizontally aligned depending on the polarizer direction, as shown in figure 11.The upper row contains the measured spots, whereas the bottom row contains the simulatedones. Again, the measured immersed and non-immersed focused spots are mapped in a circularmeasuring window with 2 µm diameter after being normalized by the maximum intensity valueof the immersed spot (on the left-hand side for each case). The measurement results of theimmersed spots by the µ-SIL revealed an overall spot-size reduction of approximately 1.3times in comparison with the non-immersed spot. In a similar way, the peak intensity of theimmersed spot was enhanced by a factor of approximately 1.4 times when compared withthe non-immersed one. These results are further confirmed by the simulations, where a spotreduction ratio of 1.5 and a peak intensity enhancement ratio of almost 2.1 were found. Suchtwo-lobe spots are particularly interesting for direct-write vortex beam lithography, which can
New Journal of Physics 14 (2012) 103024 (http://www.njp.org/)

15
0
0.2
0.4
0.6
0.8
1
Figure 11. Measured and simulated focused intensity distributions of thedecomposed azimuthally polarized beam. The top row shows the measured spots,whereas the bottom row contains the simulated spots. The first two columns (left:immersion; and right: non-immersion) were obtained by setting the polarizeraligned with the x-axis, while for the remaining spots on the last two columns,the polarizer was aligned with the y-axis. A spot-size reduction of approximately30% was found experimentally. The simulation predicts a maximum reductionof almost 1.5 due to the immersion effect. All intensities are normalized withrespect to the peak intensity of the immersed spot. The circular measuringwindow has 2 µm diameter.
produce well-separated line patterns of width below 100 nm at visible light illumination. Onemay also use such beams for spontaneous trapping of two nano-scale particles with 100 nmseparation.
7.3. The first-order Bessel–Gauss beam
The last structured spot considered in this work is obtained by placing an annular aperture inthe entrance pupil of the high-NA focusing lens, as described before. The resulting focusedspot, known as the first-order Bessel–Gauss beam, is characterized by the presence of relativelystrong side lobes, as shown in figure 12. In that figure, the spot-size reduction and peakintensity enhancement due to the immersion effect are clearly verified. The unity normalizedintensity profiles in the right column confirm the spot size reduction. In fact, a reduction ratioof approximately 1.3 is found in the measurements.
Simulations performed with the azimuthally polarized beam incident on the focusingobjective in the presence of the annular aperture confirm the experimental results. As seenin figure 13, the spot-size reduction and peak intensity enhancement are predicted by thesimulations. The reduction ratio is again close to the refractive index value of the µ-SIL, namelyn = 1.5. Interestingly, the maximum intensity enhancement reaches a ratio of almost 3.1, thehighest ratio found among all the cases considered here. However, the absolute value of the
New Journal of Physics 14 (2012) 103024 (http://www.njp.org/)

16
−2000 −1000 00
1000 2000
0.2
0.4
0.6
0.8
1
x−axis (nm)
Nor
mal
ized
inte
nsity
ImmersedNon−Immersed
−1000−1000
0
0
1000
1000
x−axis (nm)
y−
axis
(nm
)
0.5
0
1
−1000−1000
0
0
1000
1000
x−axis (nm)
y−
axis
(nm
)0.5
0
1
Figure 12. Measured intensity distributions of the first-order Bessel–Gaussspots: on the top left, the non-immersed spot is shown. The immersed spot isshown on the bottom left. The intensities are normalized with respect to the peakintensity of the immersion spot. In the right figure, the profiles along the x-axisfor both spots are plotted after unity normalization. A reduction of the spot sizeof approximately 30% is achieved due to the immersion lens. The Bessel spotsare mapped in a 2 µm circular measuring window.
−1000 0 10000
0.2
0.4
0.6
0.8
1
x−axis (nm)
Nor
mal
ized
Inte
nsity
ImmersedNon−Immersed
−1000−1000
0
0
1000
1000
x−axis (nm)
y−
axis
(nm
)
0.5
0
1
−1000−1000
0
0
1000
1000
x−axis (nm)
y−
axis
(nm
)
0.5
0
1
Figure 13. Simulated intensity distributions of the first-order Bessel–Gauss focalspots: on the top left, the non-immersed spot is shown, whereas the immersedspot is shown on the bottom left. Intensities are normalized in the same wayas in figure 8. A huge peak intensity enhancement of 3.1 times compared withthe non-immersed spot is found. On the right, the profiles along the x-axis forboth spots are plotted after unity normalization. The immersed spot size is againreduced by a factor of 1.5 compared with the non-immersed spot.
New Journal of Physics 14 (2012) 103024 (http://www.njp.org/)
17
−2000 −1000 00
1000 2000
0.2
0.4
0.6
0.8
1
x−axis (nm)
Nor
mal
ized
inte
nsity
Experiment
Simulation
Figure 14. Comparison between the measured and the simulated intensityprofiles of the immersed first-order Bessel–Gauss spot. The measured centraldark region is in good agreement with the simulated spot. All intensities arenormalized.
peak intensity in the immersed case is two orders of magnitude smaller than in the other cases.Such reduction in the absolute value is a direct consequence of having 70% of the entrance pupilblocked.
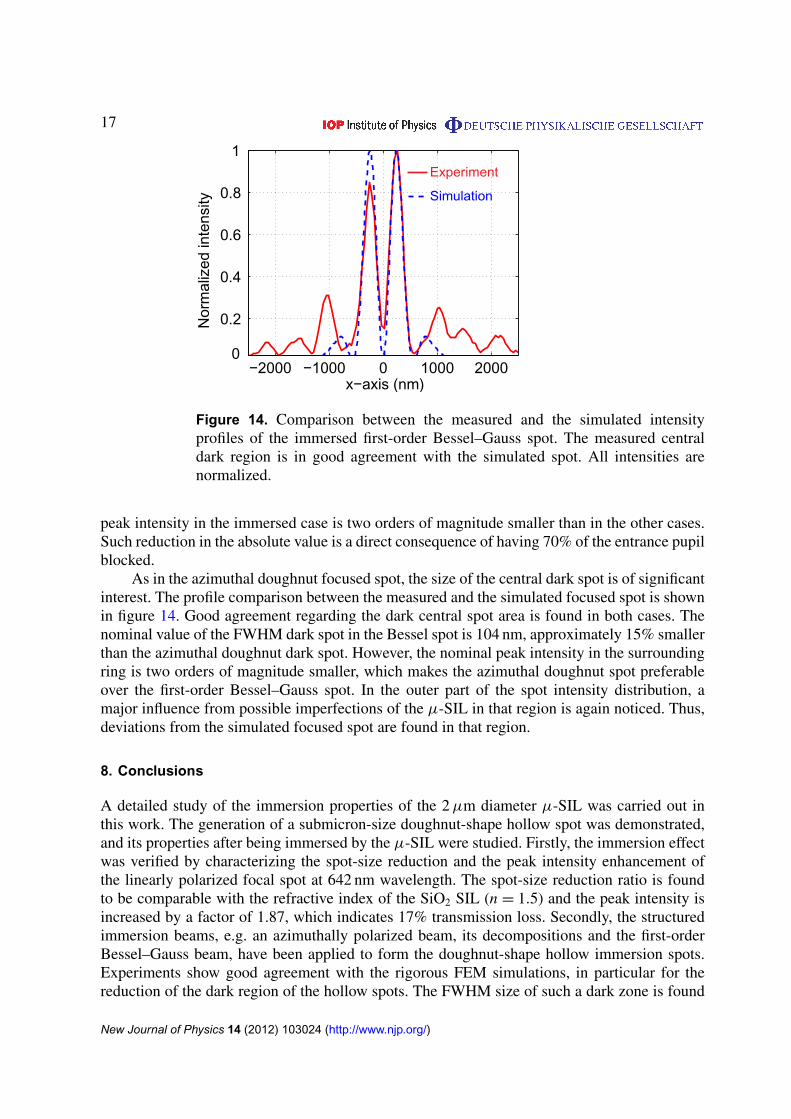
As in the azimuthal doughnut focused spot, the size of the central dark spot is of significantinterest. The profile comparison between the measured and the simulated focused spot is shownin figure 14. Good agreement regarding the dark central spot area is found in both cases. Thenominal value of the FWHM dark spot in the Bessel spot is 104 nm, approximately 15% smallerthan the azimuthal doughnut dark spot. However, the nominal peak intensity in the surroundingring is two orders of magnitude smaller, which makes the azimuthal doughnut spot preferableover the first-order Bessel–Gauss spot. In the outer part of the spot intensity distribution, amajor influence from possible imperfections of the µ-SIL in that region is again noticed. Thus,deviations from the simulated focused spot are found in that region.
8. Conclusions
A detailed study of the immersion properties of the 2 µm diameter µ-SIL was carried out inthis work. The generation of a submicron-size doughnut-shape hollow spot was demonstrated,and its properties after being immersed by the µ-SIL were studied. Firstly, the immersion effectwas verified by characterizing the spot-size reduction and the peak intensity enhancement ofthe linearly polarized focal spot at 642 nm wavelength. The spot-size reduction ratio is foundto be comparable with the refractive index of the SiO2 SIL (n = 1.5) and the peak intensity isincreased by a factor of 1.87, which indicates 17% transmission loss. Secondly, the structuredimmersion beams, e.g. an azimuthally polarized beam, its decompositions and the first-orderBessel–Gauss beam, have been applied to form the doughnut-shape hollow immersion spots.Experiments show good agreement with the rigorous FEM simulations, in particular for thereduction of the dark region of the hollow spots. The FWHM size of such a dark zone is found
New Journal of Physics 14 (2012) 103024 (http://www.njp.org/)

18
to be 220 nm in immersion by the µ-SIL. We assume that the fabrication errors near the rimcause a small discrepancy of the experimental results compared with the numerical results.Since an important feature is the size of the dark zone, such errors near the rim can be neglectedin applications. In particular, the central dark region of such a small hollow focal spot is of greatinterest for optical dark trapping of nano-size particles and vortex beam direct-write lithography.
Acknowledgments
The research leading to these results has received funding from the European Space Agencyand the European Community’s Seventh Framework Programme FP7-ICT-2007-2 under grantagreement no. 224226.
References
[1] Zhan Q 2009 Adv. Opt. Photon. 1 1–57[2] Brown T G 2011 Prog. Opt. 56 81–129[3] Descrovi E, Vaccaro L, Aeschimann L, Nakagawa W, Staufer U and Herzig H G 2005 J. Opt. Soc. Am. A
22 1432–41[4] Dorn R, Quabis S and Leuchs G 2003 Phys. Rev. Lett. 91 233901[5] Sheppard C J R and Choudhury A 2004 Appl. Opt. 43 4322–7[6] Wang H, Shi L, Lukyanchuk B, Sheppard C and Chong C T 2008 Nature Photon. 2 501–5[7] Hell S W and Wichmann J 1994 Opt. Lett. 19 780–2[8] Fischer J and Wegener M 2011 Opt. Mater. Express 1 614–24[9] Scott T F, Kowalski B A, Sullivan A C, Bowman C N and McLeod R R 2009 Science 15 913–7
[10] Dienerowitz M, Mazilu M and Dholakia K 2008 J. Nanophoton. 2 021875[11] Lankers M, Popp J, Urlaub E, Stahl H, Rossling G and Kiefer W 1995 J. Mol. Struct. 348 265–8[12] Sasaki K, Koshioka M, Misawa H, Kitamura N and Masuhara H 1992 Appl. Phys. Lett. 60 807–9[13] Davis E J and Schweiger G 2002 The Airborne Microparticle: Its Physics, Chemistry, Optics and Transport
Phenomena (Berlin: Springer) pp 780–5[14] Shvedov V G, Desyatnikov A S, Rode A V, Krolikowski W and Kivshar Yu S 2009 Opt. Express 17 5743–57[15] Shvedov V G, Hnatovsky C, Rode A V and Krolikowski W 2011 Opt. Express 19 17350–6[16] Chu S 1998 Rev. Mod. Phys. 70 685–706[17] Isenhower L, Williams W, Dally A and Saffman M 2009 Opt. Lett. 34 1159–61[18] Xu P, He X, Wang J and Zhan M 2010 Opt. Lett. 35 2164–6[19] Ganic D, Gan X and Gu M 2003 Opt. Express 11 2747–52[20] Kang J-H, Kim K, Ee H-S, Lee Y-H, Yoon T-Y, Seo M-K and Park H-G 2011 Nature Commun. 2 582[21] Braat J 1997 Appl. Opt 36 8459–67[22] Hooke R 1678 Lectures and Collections; Microscopium (London: Royal Society)[23] Abbe E 1879 J. R. Microsc. Soc. 2 812–24[24] Mansfield S M and Kino G S 1990 Appl. Phys. Lett. 57 2615[25] Brunner R, Burkhardt M, Pesch A, Sandfuchs O, Ferstl M, Hohng S and White J O 2004 J. Opt. Soc. Am. A
21 1186–91[26] Fletcher D A, Crozier K B, Quate C F, Kino G S, Goodson K E, Simanovskii D and Palanker D V 2000 Appl.
Phys. Lett. 77 2109[27] Lang M, Milster T D, Aspnes E, Minamitani T and Borek G 2007 Japan. J. Appl. Phys. 46 3737[28] Brun M, Richard M and Nicoletti S 2009 Int. Symp. on Optical Memory Mo-E-04 pp 56–7[29] Lee J Y et al 2009 Nature 460 498–501[30] Mason D R, Jouravlev M V and Kim K S 2010 Opt. Lett. 35 2007–9
New Journal of Physics 14 (2012) 103024 (http://www.njp.org/)

19
[31] Kim M-S, Scharf T, Haq M T, Nakagawa W and Herzig H P 2011 Opt. Lett. 36 3930–2[32] Kim M-S, Scharf T and Herzig H P 2010 Opt. Express 18 14319–29[33] Kim M-S, Scharf T, Muhlig S, Rockstuhl C and Herzig H G 2011 Opt. Express 19 10206–20[34] Kim M-S, Scharf T, Menzel C, Rockstuhl C and Herzig H G 2012 Opt. Express 20 4903–20[35] Rockstuhl C, Marki I, Scharf T, Salt M, Herzig H G and Dandliker R 2006 Curr. Nanosci. 2 337–50[36] Milione G, Sztul H I, Nolan D A and Alfano R R 2011 Phys. Rev. Lett. 107 053601[37] Milione G, Evans S, Nolan D A and Alfano R R 2012 Phys. Rev. Lett. 108 190401[38] Stalder M and Schadt M 1996 Opt. Lett. 21 1948–51[39] Gori F, Guattari G and Padovani C 1987 Opt. Commun. 64 491–5[40] Greene P L and Hall D G 1998 J. Opt. Soc. Am. A 15 3020–27[41] Huang K, Shi P, Cao G W, Li K, Zhang X B and Li Y P 2011 Opt. Lett. 36 888–90[42] Siegman A E 1986 Lasers (Mill Valley, CA: University Science Books) 665[43] Wachters A J and Urbach H P 2008 Technical Note Phillips Research Europe PR-TN 00042[44] Wei W, Wachters A J and Urbach H P 2007 J. Opt. Soc. Am. A 24 866–81[45] Monk P 2003 Finite Element Method for Maxwell’s Equations (Oxford: Oxford Science Publications)[46] Bahlmann K and Hell S W 2000 Appl. Phys. Lett. 77 pp 612–4
New Journal of Physics 14 (2012) 103024 (http://www.njp.org/)