submitted to ieee transactions on haptics 1 · pdf filesubmitted to ieee transactions on...
TRANSCRIPT

SUBMITTED TO IEEE TRANSACTIONS ON HAPTICS 1
Incrementally Learning Objects by Touch:
Online Discriminative and Generative Models
for Tactile-based RecognitionHarold Soh ([email protected]) and Yiannis Demiris ([email protected])
Abstract
Human beings not only possess the remarkable ability to distinguish objects through tactile feedback but are
further able to improve upon recognition competence through experience. In this work, we explore tactile-based
object recognition with learners capable of incremental learning. Using the sparse online infinite Echo-State Gaussian
process (OIESGP), we propose and compare two novel discriminative and generative tactile learners that produce
probability distributions over objects during object grasping/palpation. To enable iterative improvement, our online
methods incorporate training samples as they become available. We also describe incremental unsupervised learning
mechanisms, based on novelty scores and extreme value theory, when teacher labels are not available. We present
experimental results for both supervised and unsupervised learning tasks using the iCub humanoid, with tactile sensors
on its five-fingered anthropomorphic hand, and 10 different object classes. Our classifiers perform comparably to state-
of-the-art methods (C4.5 and SVM classifiers) and findings indicate that tactile signals are highly relevant for making
accurate object classifications. We also show that accurate “early” classifications are possible using only 20-30% of
the grasp sequence. For unsupervised learning, our methods generate high quality clusterings relative to the widely-
used sequential k-means and self-organising map (SOM), and we present analyses into the differences between the
approaches.
I. INTRODUCTION
Our sense of touch is considered our most pervasive sense and is exquisitely sensitive; a large number of nerve
receptors distributed across our body allows us to finely examine and explore our environment. With touch sensing,
we can detect, identify and manipulate objects not within our field-of-view. For example, we can easily feel to
locate and grasp a pen on a desk behind us while simultaneously attending to another visual-based task, such as
reading a paper. In addition, objects that have similar appearance may be more easily distinguished using tactile
feedback (e.g., full and half-full bottles, ripe and unripe fruits).
The development of “artificial skin” — tactile sensors created from flexible semiconducting materials — may
provide robots with similar, or even heightened, touch-sensing capabilities. A particularly interesting and important
area of research is the recognition of objects based on tactile feedback. Identifying handled objects can enable better
manipulation, for example, moving fingers to obtain a better grasp position. In recent years, studies have explored
tactile-based object classification using offline machine learning methods, such as the C4.5 decision tree [1], [2]
SUBMITTED TO IEEE TRANSACTIONS ON HAPTICS 2
OIESGP Tactile Learner
OIESGPExpert
Model 1
OIESGPExpert
Model 2
OIESGPExpert
Model n
Spatio-Temporal Tactile & Encoder
Features
Grasping with the iCub hand
Bayesian Update / Norm
alisation
Distribution overObject Classes
t
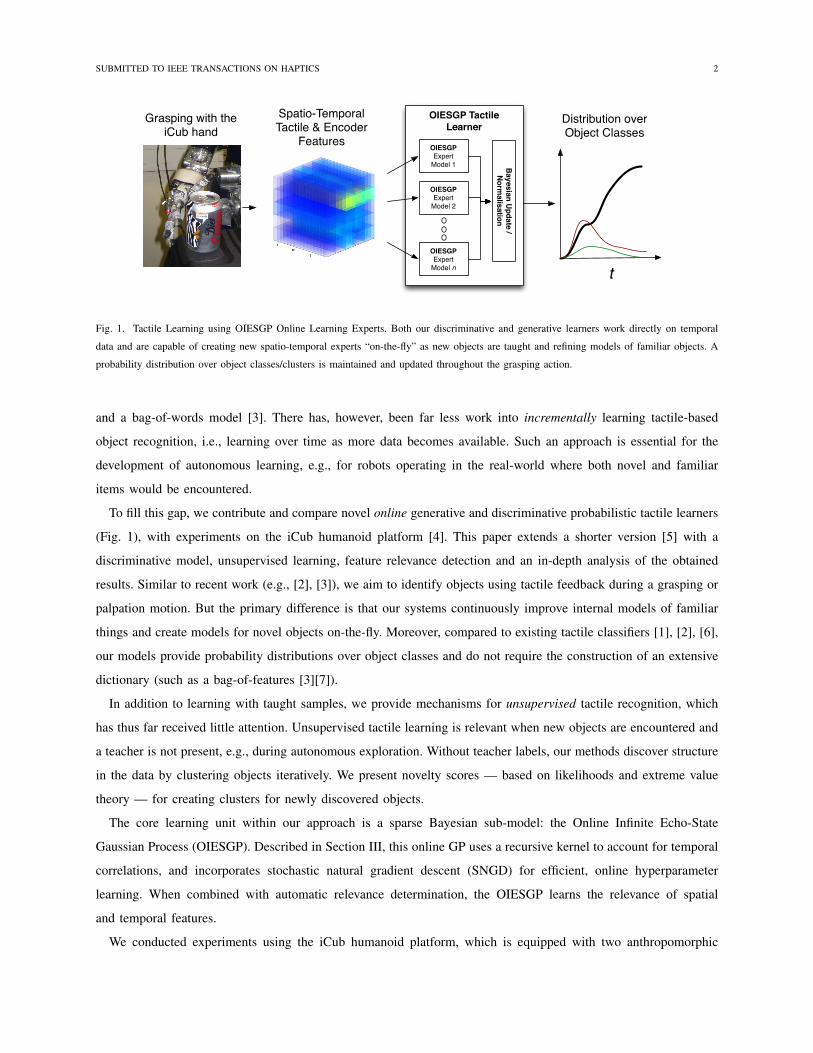
Fig. 1. Tactile Learning using OIESGP Online Learning Experts. Both our discriminative and generative learners work directly on temporal
data and are capable of creating new spatio-temporal experts “on-the-fly” as new objects are taught and refining models of familiar objects. A
probability distribution over object classes/clusters is maintained and updated throughout the grasping action.
and a bag-of-words model [3]. There has, however, been far less work into incrementally learning tactile-based
object recognition, i.e., learning over time as more data becomes available. Such an approach is essential for the
development of autonomous learning, e.g., for robots operating in the real-world where both novel and familiar
items would be encountered.
To fill this gap, we contribute and compare novel online generative and discriminative probabilistic tactile learners
(Fig. 1), with experiments on the iCub humanoid platform [4]. This paper extends a shorter version [5] with a
discriminative model, unsupervised learning, feature relevance detection and an in-depth analysis of the obtained
results. Similar to recent work (e.g., [2], [3]), we aim to identify objects using tactile feedback during a grasping or
palpation motion. But the primary difference is that our systems continuously improve internal models of familiar
things and create models for novel objects on-the-fly. Moreover, compared to existing tactile classifiers [1], [2], [6],
our models provide probability distributions over object classes and do not require the construction of an extensive
dictionary (such as a bag-of-features [3][7]).
In addition to learning with taught samples, we provide mechanisms for unsupervised tactile recognition, which
has thus far received little attention. Unsupervised tactile learning is relevant when new objects are encountered and
a teacher is not present, e.g., during autonomous exploration. Without teacher labels, our methods discover structure
in the data by clustering objects iteratively. We present novelty scores — based on likelihoods and extreme value
theory — for creating clusters for newly discovered objects.
The core learning unit within our approach is a sparse Bayesian sub-model: the Online Infinite Echo-State
Gaussian Process (OIESGP). Described in Section III, this online GP uses a recursive kernel to account for temporal
correlations, and incorporates stochastic natural gradient descent (SNGD) for efficient, online hyperparameter
learning. When combined with automatic relevance determination, the OIESGP learns the relevance of spatial
and temporal features.
We conducted experiments using the iCub humanoid platform, which is equipped with two anthropomorphic

SUBMITTED TO IEEE TRANSACTIONS ON HAPTICS 3
dexterous hands and tactile sensors on its fingertips (Fig. 2). This platform, along with the grasp controller, dataset
objects (composed of 9 everyday items) and testing methodology are described in Section V.
Our experimental results, described in Section VI, reveal that our methods perform comparably to state-of-the-art
optimised methods (incremental SVM and offline C4.5 and SVM classifiers). In addition, we discuss results from an
online-learning experiment involving human subjects and plastic bottles of varying fullness, which suggest potential
research avenues in active learning and sensor fusion. Section VII details our unsupervised learning experimental
results; we compare our proposed discriminative and generative methods against each other and against popular
competing algorithms, i.e., sequential k-means [8] and self-organising maps (SOM) [9].
Finally, ideas and other considerations for future work are discussed in Section VIII. In the next section, we first
give an overview of related work in object classification using data obtained from tactile sensors.
II. RELATED WORK
Our focus in this work is on the identification of objects being grasped using tactile data. The development of the
tactile sensors themselves constitutes a major research field and we refer interested readers to recent reviews [10],
[11].
A related strand of research is in grasp stability estimation and analysis using tactile feedback. Recent work [12],
[13] has evaluated the effectiveness of machine learning methods (AdaBoost, Support Vector Machines, hidden
Markov Models) for stability prediction. In particular, the studies showed that sequential or temporal data was
beneficial for generalisation, dynamic grasp execution and when working with deformable objects. Within the
context of this paper, the closest related work was by Schill et al. [14]; a support vector machine (SVM) was used
for online detection of grasp stability during execution. Unlike the methods described in this paper however, the
SVM has to be trained offline. Although not explored here, our proposed methods can be applied towards grasp
stability estimation. Similar to the algorithms previously explored, our approach makes use of temporal tactile data
but with the added benefit of incremental training and prediction.
In the remainder of this section, we describe classification techniques applied along with the features used
to determine the identity of handled objects. To organise our discussion, we group the reviewed works into
discriminative or generative methods. In general, discriminative models tend to have lower asymptotic errors,
whilst generative models may more quickly reach their lower bound [15].
A. Discriminative Tactile Classifiers
Given observation (or features) o 2 Rd, we can directly model the conditional distribution p(ci|o) over object
class ci 2 C, which yields a discriminative classifier. For example, Schopfer, Ritter and Heidemann [6] used a
local linear map (LLM) neural network trained on features1 obtained using a low-cost 16⇥ 16 tactile sensor array
mounted on a Unimation 6-DOF PUMA 200 robot arm. More recent work by Schopfer [16] used a C4.5 decision
1Features were dimensionally-reduced using principal components analysis.

SUBMITTED TO IEEE TRANSACTIONS ON HAPTICS 4
tree trained on 51 tactile features (e.g., maximum taxel value), which achieved 92.5% accuracy score on 16 different
objects.
The C4.5 tree was also used by Chitta et al. [1], [2] to estimate the internal state of bottles with varying fullness
grasped using the PR2 gripper equipped with a capacitive sensor with 22 cells. The classifier used the frequency
response of the manipulated objects, achieving an accuracy score of 93.9% in recognising the different liquid
containers.
Opting for a nearest neighbour approach, Drimus et al. [17] performed classification of 10 objects (both rigid
and deformable objects) using the k-Nearest Neighbour algorithm. Each object was represented by a variable length
vector composed of the first two moments of each “tactile frame”. Distances between the two vectors were computed
using Dynamic Time Warping and the closest k neighbours voted on the object’s class. The best accuracy obtained
using this method on the 10 different objects (with 10 repeated grasps per object) was 92%.
B. Generative Tactile Classifiers
In contrast to the discriminative approach, the generative approach models the joint distribution p(o, ci) =
p(o|ci)p(ci) and through application of Bayes rule, obtains the class distribution p(ci|o) / p(o|ci)p(ci). The
primary task in generative modelling is in creating the likelihood distribution p(o|ci) since p(ci) can usually be
estimated easily from the obtained data or assumed uniform.
One class of generative models make use of shape representations — which can be generated via a number of
methods (e.g., [18], [19], [20]) — to obtain an appropriate likelihood function, p(o|ci). For example, Pezzementi,
Reyda and Hager [21] constructed a 2-D tactile mosaic (based on occupancy grid mapping) that was then used
to estimate the object class via particle and histogram filters. The latter estimation method achieved perfect object
recognition accuracy on a constructed test set (raised letters) using a DigiTacts sensor. Work by Meier et al.
[22] demonstrated that compact 3-D representations of unknown objects could be obtained by tactile sensors. In
particular, Kalman filters were used to build a probabilistic point cloud (stored as a kd-tree).
As an alternative to shape models described above, it is possible to construct recognition models that do not
explicitly encode the object’s form. For example, Schneider et al. [3] extracted a bag-of-features from low-resolution
tactile intensity images. A vocabulary of codewords was obtained using k-means clustering on the obtained images;
distances were measured using a linear weighted combination of the pixel-by-pixel Euclidean distance (with vertical
shift correction) and the width of the fingers. Finally, a histogram of the codewords for each object was generated.
This method achieved a recognition rate of 84.6% with 10 test grasps on each of the 16 objects tested.
Schneider’s work was recently extended by Pezzementi et al. [7] to incorporate descriptors from the image
processing community and to use Gaussian Mixture Models (GMM) for codebook creation. This improved method
was capable of handling varying object poses and achieved higher accuracies exceeding 95%. Another bag-of-
words model was proposed by Gorges et al. [23] which used an anthropomorphic robot hand. Classifications were
performed using a combination of tactile and finger configurations (so called haptic key features), which were
dimensionally reduced using PCA. Instead of using k-means or GMM, the codebook was obtained using a SOM.

SUBMITTED TO IEEE TRANSACTIONS ON HAPTICS 5
The average accuracy of this approach was 75% (individual object accuracies varied greatly, ranging from 50% to
100%).
C. Moving Forward: Incremental and Unsupervised Learning
Whether discriminative or generative, machine-learning classifiers generally achieved high accuracies, reflecting
the informativeness of tactile signals. However, one common attribute of the aforementioned methods is that they
are inherently offline; models are ”frozen” after training and the grasp or palpation has to be completed before a
classification can be made.
In contrast, humans are both able to learn incrementally from experience and determine the type or properties of
handled objects during the manipulation process. Moreover, we are generally able to decide if an object is ”novel”
and can group objects by touch, even without object identities or labels. In the following sections, we describe
tactile recognition models that are similarly capable, starting with our underlying core method.
III. ONLINE INFINITE ECHO-STATE GAUSSIAN PROCESS
The Online Infinite Echo-State Gaussian Process (OIESGP) is a online learner for multi-variate time series. In
brief, it combines a sparse online Gaussian Process (SOGP) [24] with a recursive automatic relevance determination
(ReARD) kernel [5] and stochastic natural gradient descent (SNGD) [25] for iterative hyperparameter adaptation.
The composition of these elements enables the method to operate in an online manner (processing a sample/mini-
batches at a time) on sequential data, which facilitates use in on-demand real-world applications such as robotics.
By storing only a limited set of basis vectors, the OIESGP has a fixed maximum computational and storage budget
that can be constrained based on available resources. This method was recently demonstrated in [5] to achieve
lower errors than state-of-the-art online-learning methods, i.e., locally-weighted-process regression (LWPR) [26]
and online echo-state networks. In the following subsections, we summarise the three prominent aspects of the
OIESGP: the sparse online GP approximations, the ReARD kernel and finally, the SNGD optimiser.
A. Sparse Online Gaussian Process
The Sparse Online Gaussian Process (SOGP) proposed by Csato and Opper [24] is an application of Bayesian
Online Learning to GPs. The SOGP is grouped under the larger umbrella of deterministic training conditional
(DTC) approximations, where the basis vectors are more generally referred to as inducing inputs [27].
Denote xt+1
as the input and yt+1
as the observed output signal at time t+ 1. We incrementally update the GP
at time t given (xt+1
, yt+1
) by performing a Bayesian update to yield a posterior:
p(f |yt+1
) =
P (yt+1
|f(xt+1
))pt(f)
hP (yt+1
|f(xt+1
))pt(f)it. (1)
where we have neglected conditioning on the inputs for notational simplicity. In the case of GP regression, this
update is exact. In the general case where this update is not tractable, we project the process onto the closest GP q

SUBMITTED TO IEEE TRANSACTIONS ON HAPTICS 6
by minimising the Kullback-Leibler divergence, KL(pt||q), which is equivalent to matching the first two moments
of p and q:
mt(x) = ↵T
t k(x) (2)
kt(x,x0) = k(x,x0
) + k(x)
T
Ctk(x0) (3)
where k(·, ·) is the kernel or covariance function and k(x) = [k(x,xi)]t�1
i=1
. The vector ↵ and matrix C are updated
using:
↵t+1
= ↵t + w1
(Ctkt+1
+ et+1
) (4)
Ct+1
= Ct + w2
(Ctkt+1
+ et+1
)(Ctkt+1
+ et+1
)
T (5)
where kt+1
= [k(x1
,xt+1
), ..., k(xt,xt+1
)], et+1
is the t+ 1
th unit vector and the scalar coefficients w1
and w2
are given by:
w1
= @ft lnhP (yt+1
|f(xt+1
))it (6)
w2
= @2
ft lnhP (yt+1
|f(xt+1
))it (7)
To maintain sparsity, the number of the data points retained — the basis vectors (BV), b 2 B — are limited
using a scoring function that computes the “novelty” of xt+1
:
�(xt+1
) = k(xt+1
,xt+1
)� k
T
B,t+1
K
�1
B,tkB,t+1
(8)
where kB,t+1
= [k(bi,xt+1
)]bi2B and K
�1
B,t = [k(bi,bj)]bi,bj2B. If �(xt+1
) is below some constant threshold,
✏� , then approximate update using (4) and (5) is performed with the only change being that we use:
ˆ
et+1
= K
�1
B,tkt+1
(9)
instead of the unit vector et+1
. This update does not increase the size B but does absorb states which are not
included. The inverse of KB can be computed iteratively using the Sherman-Morrison formula, i.e., K�1
B,t+1
=
K
�1
B,t + ��1
t+1
(
ˆ
et+1
� et+1
)(
ˆ
et+1
� et+1
)
T. To delete a basis vector, we score each b 2 B:
✏i =|↵t+1
(i)|K
�1
B,t+1
(i, i) +Ct+1
(i, i), (10)
which is truncated loss between the approximated and updated GPs, and remove the lowest scoring BV.
Making predictions at an unknown test point x⇤ is straightforward with the mean of the predictive distribution
given by:
µ⇤ = kB,t(x⇤)>↵t (11)
and variance:
�2
⇤ = kr(x⇤,x⇤) + kB,t(x⇤)>CtkB,t(x⇤) (12)
SUBMITTED TO IEEE TRANSACTIONS ON HAPTICS 7
The computational costs associated with model updates and predictions are on the order of O(s2B) where sB is
the maximum pre-defined size of B. In effect, sB determines the trade-off between accuracy and computational
cost; larger basis vector sets allow the SOGP to approach the accuracy of the full GP with higher cost per iteration.
B. Recursive Kernel with Automatic Relevance Determination
To account for the temporal nature of many real-world signals, such as those produced by tactile sensors, we
make use of recursive kernels [28] — a recently-proposed class of kernels that share an intimate relationship with
recurrent neural networks (RNNs) and were principally derived as a means to extend RNNs to infinite size. Note
that recursive kernels are denoted with the symbol to differentiate them from standard kernels and although
theoretically applicable to time-series of infinite length, we restrict the recursion depth using a parameter ⌧ in
practice.
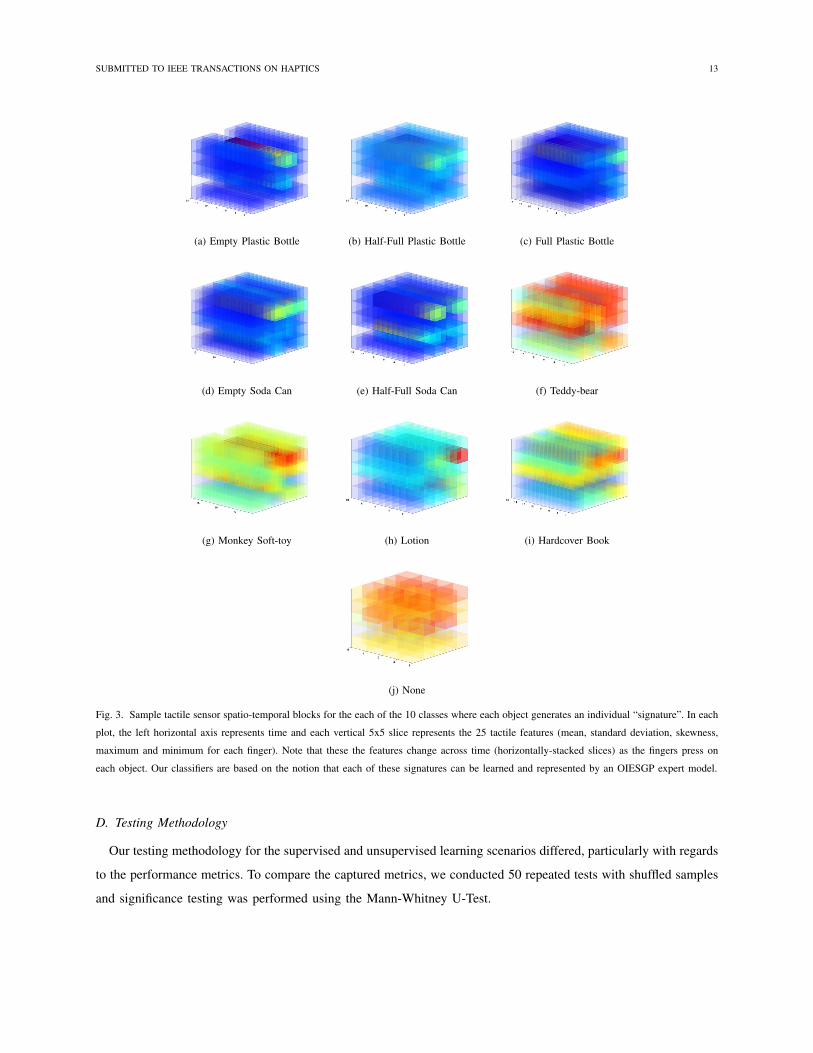
The OIESGP employs a recursive kernel based on automatic relevance detection (ARD) [29], [30]:
ARDt (x,x0
) = exp
✓�1
2
(xt � x
0t)
T
M(xt � x
0t)
◆
exp
✓ARDt�1
(x,x0)� 1
�2
⇢
◆(13)
where M = diag(l)�2, a diagonal d ⇥ d matrix where l = [li]di=1
. The kernel construction and proof of positive
semi-definiteness are given in [30]. Unlike the standard squared exponential, this recursive ARD (ReARD) kernel
is anisotropic; varying the li’s for different inputs allows us to control the impact that the inputs have on the
predictions; responsiveness to input dimension k is inversely related to lk.
The parameter �⇢ weights the previous recursion kernel value. In other words, it functions as a temporal
lengthscale; if �⇢ is large, the past recursive kernel value will decrease in relevancy. This temporal lengthscale
is related to the spectral radius ⇢ in echo-state networks (ESNs) [31] and affects kernel stability [28]. If the inverse
lengthscale ��1
⇢ < 1, the kernel is stable and iterative applications of the function will converge to a fixed point.
The closer ��1
⇢ is to 1, the slower this rate of decay will be. The spectral radius of the ESN performs the same
role: the larger ⇢ is, the slower the rate of “memory fade”.
Finally, to simplify hyper-parameter optimisation, we unified our parameters into a single function and modified
(13) above to include the noise and signal variance:
(x,x0) = �2
fARDt (x,x0
) + �2
n�x,x0 (14)
where �2
f is the signal variance, �2
n is the noise variance, and �x,x0 is the Kronecker delta which is one iff x = x0
and zero otherwise.
C. Stochastic Natural Gradient Descent
Applying the ReARD kernel requires us to specify its hyperparameters ✓ = [l,�⇢,�p,�n]. In this work, we
optimise ✓ with regard to the leave-one-out likelihood by following the natural gradient of the loss function:
L(✓) = �Z
log p(yt|xt,✓)p(xt, yt)dxtdyt (15)

SUBMITTED TO IEEE TRANSACTIONS ON HAPTICS 8
where, again for notational convenience, we have dropped the dependence on the training data seen thus far. In our
case,
log p(yt|xt,✓) = logN (yt � µt,�2
t ) (16)
= �1
2
log �2
t �(yt � µt)
2
2�2
t
� 1
2
log 2⇡ (17)
where µt and �2
t are given by (11) and (12) respectively. The direction of steepest descent is given by the natural
gradient [25]:
G�1
✓ r✓L (18)
where G�1
✓ is the inverse Riemannian metric tensor (the covariance of the gradients [32]) and r✓L is the standard
gradient. For the space of probability distributions represented by the hyperparameters, G✓ is the Fisher Information
matrix:
I✓ =
E@ log p(yt|xt,✓)
@✓i
@ log p(yt|xt,✓)
@✓j
��|✓|
i,j=1
(19)
In this work, we approximate the natural gradient over sg iterations using an averaging approach with the Sherman-
Morrison formula:
˜I�1
✓ =
✏t1� ✏t
˜I�1
✓ � ✏t1� ✏t
(
˜I�1
✓ r✓˜L)(r✓
˜L>˜I�1
✓ )
(1� ✏t) + ✏tr✓˜L>
(
˜I�1
✓ r✓˜L)
(20)
where ✏t = 1/sg . A similar approach was used in [33] for multi-layer perceptrons but here, we average over the
sampling window and update the hyperparameters progressively:
✓j+1
= ✓j + ⌘˜I�1
✓ r✓˜L (21)
where ⌘ is the step size or learning rate. We use the straightforward approach of setting ⌘ = 1/j. Once the
hyperparameters are updated, the GP posterior is out-of-date, forcing a re-computation of K, C and Q which we
perform directly using the basis vector set B.
To compute the gradients, we use the derivatives for ARDt , which are also recursive in nature:
@ARDt
@li= ARD
t
1
�2
⇢
@ARDt�1
@li+
�i
l3i
�(22)
@ARDt
@�⇢= ARD
t
�2(ARD
t�1
� 1)
�3
⇢
+
1
�2
⇢
@ARDt�1
@�⇢
�(23)
where �i = (xt,i � x0t,i)
2 with base cases:
@ARD1
@li=
�i
l3iARD1
and@ARD
1
@�⇢= 0
IV. GENERATIVE AND DISCRIMINATIVE TACTILE LEARNERS WITH OIESGP SUB-MODELS
In this study, we developed both generative and discriminative methods composed of OIESGP sub-models,
mi 2 M, representing each object class (or cluster) ci. At each time-step t, the methods are provided with an
observation ot and are expected to provide a probability distribution p(ci). When teacher labels are available, our

SUBMITTED TO IEEE TRANSACTIONS ON HAPTICS 9
models can be trained in the standard supervised fashion. For unsupervised learning, our methods generate new
clusters when needed using probability-based novelty scores to detect when an ”distinct” sample is observed. To
simplify exposition, we use the following acronyms: Discriminative Supervised (DS), Generative Supervised (GS),
Discriminative Unsupervised (DU) and Generative Unsupervised (GU).
A. Discriminative Tactile Learning
Recall that in the discriminative approach, we model the conditional distribution p(ci|o) directly. Here, we have
used one-versus-all classifier scheme whereby one classifier is trained for each object.
Unlike regression, the target values hi,t 2 {�1,+1} are positive for the correct class and negative otherwise,
rendering the Gaussian likelihood inappropriate. As such, we applied the probit likelihood [34]. Each observation
in a given sequence is associated with the appropriate target, which yields the following likelihood function:
qt(ci|ot) = �
✓hi,tµi,t
�i,t
◆(24)
where
�(z) =
Z z
�1N (z|0, 1)dz (25)
is a cumulative density function of a standard normal distribution, µi,t and �i,t are the predicted mean and standard
deviations using model mi. A normalised probability class distribution at a given time t can be obtained via:
pt(ci|ot) =qt(ci|ot)
P|M|j qt(cj |ot)
. (26)
Following the standard winner-takes-all approach, the recognised object is the one with the highest probability
throughout the sequence, i.e.,
argmax
ipt(ci|ot) for all t = 1, 2, . . . , T. (27)
1) Supervised Training (DS): To train a DS model, the appropriate sub-model mi is provided with a positive
(correct) sequence and updated as described in the section III-A. However, negative samples present a problem when
dealing with temporal sequences in a multi-class setting; the same observation may be generated from different
classes and the number of classes imply a positive-negative imbalance. We experimented with four different training
schemes for dealing with negative samples: providing negative samples to all models, none of the models (only
positive training), and the closest (as measured by probability) or wrongly selected model. Positive and closest-
model training yielded the best scores and as such, we focus on the results obtained via the latter scheme for the
remainder of this paper.
2) Unsupervised Learning (DU): To construct an online unsupervised model, we need ascertain which cluster a
given sample should be assigned to or if it is necessary to create a new cluster.
Fortunately, one-versus-all discriminative models with probabilistic outputs lend themselves easily to unsu-
pervised learning. Samples are assigned to the ”winning” cluster, i.e., the sub-model with highest probability
s = argmaxi pt(ci|o). In cases where the un-normalised probability qt(cs|o) is too low — the observation is not
SUBMITTED TO IEEE TRANSACTIONS ON HAPTICS 10
probable given the best cluster [35] — a new cluster is generated and updated with the observation. Naturally, ”low”
is application and data-dependent. Furthermore, given our Bayesian sub-models, maximum uncertainty is attained
when qt(cs|o) = 0.5, i.e., the observed input is ”far” from previously observed positive and negative samples.
Taking this into consideration and that each grasped object results in sequential observations, we define a novelty
score:
⌫D = 1� T�1
TX
t=1
max(0, 2qt(cs|o)� 1) (28)
In this work, we control cluster creation using a user-defined threshold parameter, �D 2 [0, 1], which is compared
against ⌫D. The lower �D, the higher the propensity for cluster creation; at the extreme of zero, a cluster will be
created for each object and at the extreme of one, only one cluster will be generated.
Summarising, we begin the clustering process with one cluster generated using the first sample. As learning
proceeds, each sample is assigned to the most probable cluster unless a novel sample is observed (⌫D > �D), in
which case the sample is placed in a new cluster.
B. Generative Tactile Learning
Recall that in the generative framework, we model the joint probability distribution. Since our data is inherently
temporal in nature, we model pt(ot|ci) and pt(ci) where the latter represents the current belief over the classes.
Inference is performed using a Bayes filter to update a probability distribution over the model classes as observations
arrive:
pt(ci|o,M) =
pt(ot|mi)pt�1
(ci)Pj p(ot|mj)pt�1
(cj)(29)
where we use a standard (independent) observational model:
p(ot|mi) =
Y
k
N(ok,t|µi,k,t,�i,k,t). (30)
When the palpation motion is initiated, the initial prior is set to be uniformly distributed across the object classes
and the class distribution is continuously updated as sensory data is received. To compare accuracies with the other
methods, the class with the highest probability at the end of the grasping action is selected as the recognised object.
1) Supervised Training (GS): With teacher labels, training the generative classifier GS simply corresponds to
updating the correct model with example sequences. To reduce computational and storage costs, we use the same
basis vector set for all sub-models for a given class and perform the SOGP updates given in Section III-A.
2) Unsupervised Learning (GU): As with the DU model, samples are assigned to the cluster with highest
probability. However, deciding on when to create a new cluster is non-trivial because placing a threshold on the
Gaussian likelihood is difficult; the likelihood values are often small, even for ”close” or likely observations.
To perform unsupervised learning with GU, we use a novelty score based on recent results in Extreme Value The-
ory (EVT) for multivariate Gaussian distributions [36]. EVT is a statistical description of the extrema of generative
distributions; given a set of i.i.d random variables X = {xi}mi=1
generated from the same distribution p1
(x), the

SUBMITTED TO IEEE TRANSACTIONS ON HAPTICS 11
extreme value distribution (EVD) is the cumulative distribution function H+
(xmax
x) where xmax
= max(X ).
The EVD of a multivariate Gaussian is available in closed form [36]:
Ge(y) = 1� exp
�✓
y
cm
◆↵m�
(31)
where ↵m and cm are estimated Weibull parameters (See Section 6 of [36] for more details). Thus, given our
predictions µand uncertainties ⌃, we can define the novelty score of a given observation o as:
⌫G(o,µ) = 1�Ge(N (o|µ,⌃)) (32)
= exp
�✓
1
Cncme�
(o�µ)>⌃
�1(o�µ)2
◆↵m�
(33)
where Cn = (2⇡)n2 k⌃k 1
2 . Similar to the DU model, we define a threshold �U 2 [0, 1], which controls the cluster
creation tendency.
V. EXPERIMENTS ON THE ICUB PLATFORM
Using the iCub humanoid platform, we collected a tactile dataset and performed experiments for online supervised
and unsupervised learning. In the following subsections, we give specifics on the test objects, grasping procedure,
initialisation parameters and our testing methodologies.
A. Test Objects
In this experiment, we used nine different everyday objects and one baseline where the grasp was performed with
no object, totalling ten classes (shown in Fig. 2). These objects comprise plastic bottles with differing amounts of
liquid, two soft toys, soda-cans (also of varying fullness), a bottle of lotion and a hardcover book. For each class,
we created a dataset of twenty samples using our grasp controller and recorded data for the pressing portion of the
grasp, yielding a total of 200 samples. The objects were slightly perturbed (translation and rotation) between grasps.
As can be seen in Fig. 3, each grasped object generates a distinctive spatio-temporal “signature”. Our classifiers
are based on the notion that each of these signatures can be learned and represented by an “expert model” (Fig.
1). To encourage reproducibility and future development, we have made this dataset freely available online [37].
B. Grasping with the iCub Hand
Previous work on tactile classification has focussed mainly on using grippers (e.g., the two-fingered gripper on
PR2 robot, [1]) and industrial-style robotic arms [6], [3]. For this study, we used the iCub humanoid robotic platform
(Fig. 2) which has two anthropomorphic dexterous hands with 5 fingers (as shown in Fig. 4). Each fingertip is
wrapped with 12 capacitive pressure sensors under a layer of soft silicone foam. When pressure is applied to the
fingertips, the silicone foam is compressed, changing the capacitance. An embedded board samples all the sensors
sequentially, generating an output values ranging from 0 to 255. In this work, the data capture rate was 10Hz.
We devised a grasp controller that executed a three-step action: first, it fixed the hand position and orientation
and then fully opened the hand digits, yielding the pre-shape (as shown in Fig. 5a). After we placed an object in a

SUBMITTED TO IEEE TRANSACTIONS ON HAPTICS 12
Fig. 2. iCub with Objects: Plastic bottles (full, half-full, empty), Soda cans (empty, half-full), Teddy-bear, Monkey soft-toy, Lotion bottle and
Hardcover Book.
graspable position, the controller closed the digits with low velocity (20 deg/s for each degree of freedom) along
a pre-defined trajectory, as illustrated in Fig. 5b, until the tactile sensor readings breached a critical threshold or
the trajectory was completed. It was necessary to vary this threshold from 15-20 to compensate for sensor drift.
Finally, the controller would press on the object by moving each digit further along the same trajectory but with a
higher velocity (40 deg/s) until the motion was blocked or the trajectory motion was finished. Motion blocks were
detected by checking that motor encoder values remained unchanged for 0.5 seconds.
C. Model Parameterisation and Set-up
Our models process the encoder (measuring each of the 9 DOFs) and tactile sensor data from each finger. Instead
of using all twelve sensors directly, the sensor data was reduced by computing the first three moments (mean,
standard deviation and skewness) as well as the maximum and minimum reading for the twelve sensors on each
finger; note that this data reduction is “spatial” and not temporal as we do not compute statistics across the time-
steps. This resulted in an observation/feature vector ot 2 R34 (25 tactile features and 9 encoder values) for each
time step t. We also experimented with reduced data streams with only the tactile or encoder features.
Both methods were initialised with single model after the first object was encountered and a model class was
created whenever a new object is taught to the classifier. Each model was set to use 50 basis vectors with initial
lengthscales l = [10.0]Di=1
for the generative model and l = [1.0]Di=1
for the discriminative model. The remaining
hyper-parameters initialised with �f = 1.0, �n = 0.1, ⌧ = 15 and ⇢ = 1.01 for both classifiers. Hyper-parameter
adaptation was enabled with the sampling window sg set at 30 and stopping criteria ||4✓||2 < cg = 10
�4 over 10
iterations. The same parameters were used for both the supervised and unsupervised learning experiments.
SUBMITTED TO IEEE TRANSACTIONS ON HAPTICS 13
(a) Empty Plastic Bottle (b) Half-Full Plastic Bottle (c) Full Plastic Bottle
(d) Empty Soda Can (e) Half-Full Soda Can (f) Teddy-bear
(g) Monkey Soft-toy (h) Lotion (i) Hardcover Book
(j) None
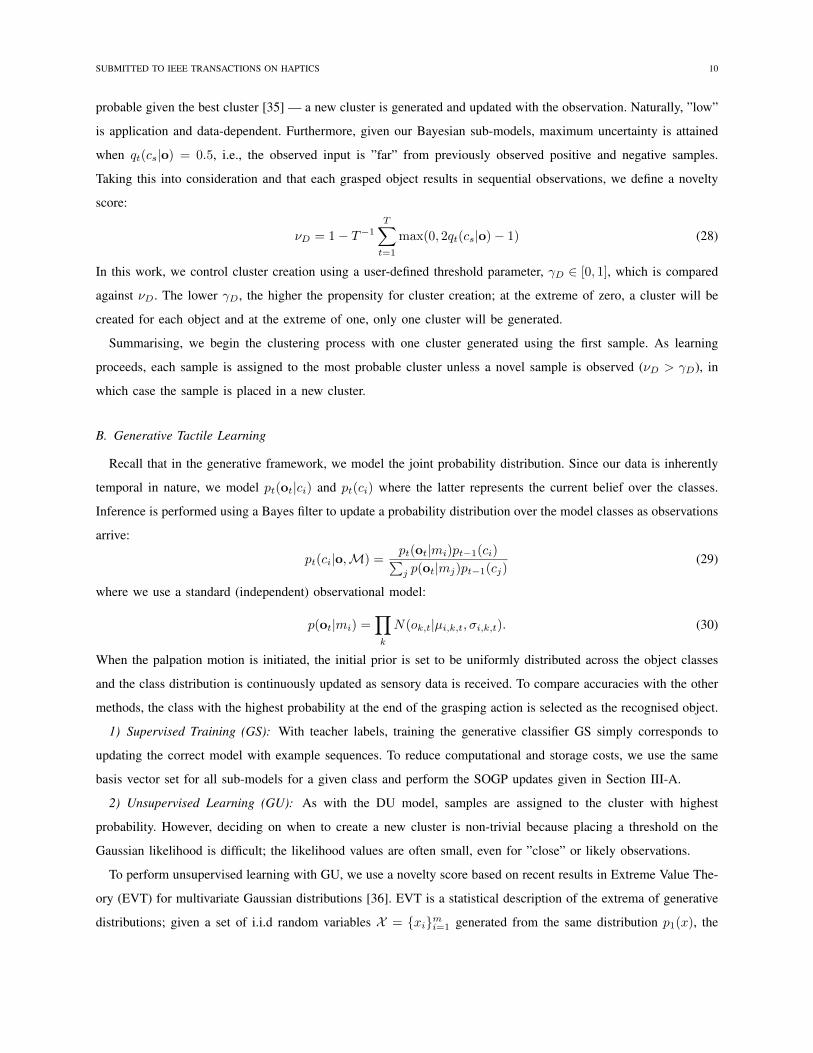
Fig. 3. Sample tactile sensor spatio-temporal blocks for the each of the 10 classes where each object generates an individual “signature”. In each
plot, the left horizontal axis represents time and each vertical 5x5 slice represents the 25 tactile features (mean, standard deviation, skewness,
maximum and minimum for each finger). Note that these the features change across time (horizontally-stacked slices) as the fingers press on
each object. Our classifiers are based on the notion that each of these signatures can be learned and represented by an OIESGP expert model.
D. Testing Methodology
Our testing methodology for the supervised and unsupervised learning scenarios differed, particularly with regards
to the performance metrics. To compare the captured metrics, we conducted 50 repeated tests with shuffled samples
and significance testing was performed using the Mann-Whitney U-Test.

SUBMITTED TO IEEE TRANSACTIONS ON HAPTICS 14
1
2
4
3
57
689
6
9
8
7
5
4
3
2
1 Finger MP abduction
Thumb MP opposition
Thumb MP abduction
Thumb MP-IP coupling
Index MP flexion
Index PIP-DIP coupling
Middle MP flexion
Middle PIP-DIP coupling
Ring-little coupling
MP: metacarpophalangealIP: interphalangealPIP: proximal interphalangealDIP: distal interphalangeal
MP
PIP
DIP
IPMP
Fig. 4. The iCub Hand has 19 joints and 9 DoFs; this induces a coupling between certain joints as indicated by the colour codes and labelings.
In our experiments, we use the the tactile (capacitive) sensors on each fingertip. Each fingertip incorporates a flexible printed circuit board
underneath an electrically conductive silicone and provides 12 pressure measurements.
(a) Grasping Pre-shape (b) Grasping Motion
Fig. 5. The Grasping controller would first initialise the iCub hand into a “pre-shape” as shown in Fig. 5a. It would then close the fingers onto
the object via the motion depicted in Fig. 5b, pressing onto the object to obtain tactile sensory input.
SUBMITTED TO IEEE TRANSACTIONS ON HAPTICS 15
All Features Tactile Features Encoder Features
Online Discriminative and Generative Classification Accuracies of Grasped Objects
Trial Set Trial Set Trial Set
Accu
racy
Sco
re
DS (All)DS (Tactile)DS (Encoder)GS (All)GS (Tactile)GS (Encoder)Inc. SVM0.6
0.8
1.0
0 2 4 6 8 10 0 2 4 6 8 10 0 2 4 6 8 10
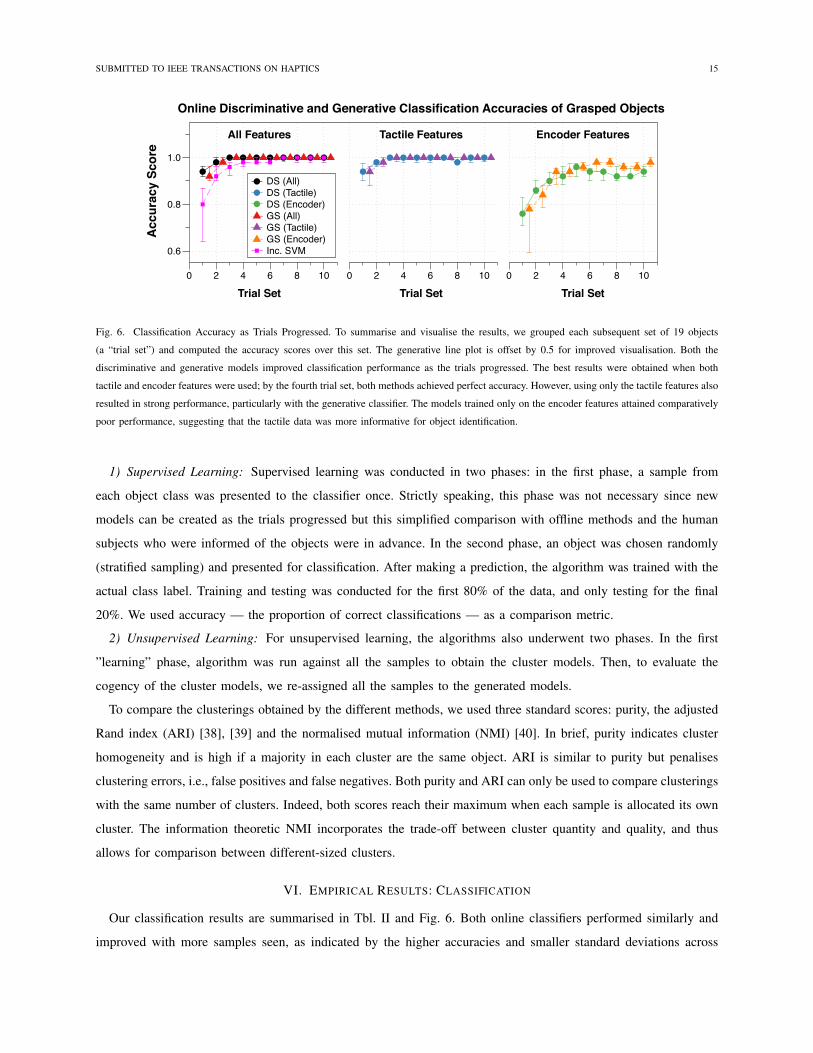
Fig. 6. Classification Accuracy as Trials Progressed. To summarise and visualise the results, we grouped each subsequent set of 19 objects
(a “trial set”) and computed the accuracy scores over this set. The generative line plot is offset by 0.5 for improved visualisation. Both the
discriminative and generative models improved classification performance as the trials progressed. The best results were obtained when both
tactile and encoder features were used; by the fourth trial set, both methods achieved perfect accuracy. However, using only the tactile features also
resulted in strong performance, particularly with the generative classifier. The models trained only on the encoder features attained comparatively
poor performance, suggesting that the tactile data was more informative for object identification.
1) Supervised Learning: Supervised learning was conducted in two phases: in the first phase, a sample from
each object class was presented to the classifier once. Strictly speaking, this phase was not necessary since new
models can be created as the trials progressed but this simplified comparison with offline methods and the human
subjects who were informed of the objects were in advance. In the second phase, an object was chosen randomly
(stratified sampling) and presented for classification. After making a prediction, the algorithm was trained with the
actual class label. Training and testing was conducted for the first 80% of the data, and only testing for the final
20%. We used accuracy — the proportion of correct classifications — as a comparison metric.
2) Unsupervised Learning: For unsupervised learning, the algorithms also underwent two phases. In the first
”learning” phase, algorithm was run against all the samples to obtain the cluster models. Then, to evaluate the
cogency of the cluster models, we re-assigned all the samples to the generated models.
To compare the clusterings obtained by the different methods, we used three standard scores: purity, the adjusted
Rand index (ARI) [38], [39] and the normalised mutual information (NMI) [40]. In brief, purity indicates cluster
homogeneity and is high if a majority in each cluster are the same object. ARI is similar to purity but penalises
clustering errors, i.e., false positives and false negatives. Both purity and ARI can only be used to compare clusterings
with the same number of clusters. Indeed, both scores reach their maximum when each sample is allocated its own
cluster. The information theoretic NMI incorporates the trade-off between cluster quantity and quality, and thus
allows for comparison between different-sized clusters.
VI. EMPIRICAL RESULTS: CLASSIFICATION
Our classification results are summarised in Tbl. II and Fig. 6. Both online classifiers performed similarly and
improved with more samples seen, as indicated by the higher accuracies and smaller standard deviations across
SUBMITTED TO IEEE TRANSACTIONS ON HAPTICS 16
1 2 3 4 5 6 7 8 9 10
1
2
3
4
5
6
7
8
9
10
950100%
00.0%
00.0%
00.0%
00.0%
00.0%
00.0%
00.0%
00.0%
00.0%
100%0.0%
00.0%
950100%
00.0%
00.0%
00.0%
00.0%
00.0%
00.0%
00.0%
00.0%
100%0.0%
00.0%
00.0%
950100%
00.0%
00.0%
00.0%
00.0%
00.0%
00.0%
00.0%
100%0.0%
00.0%
00.0%
00.0%
950100%
00.0%
00.0%
00.0%
00.0%
00.0%
00.0%
100%0.0%
00.0%
350.4%
00.0%
00.0%
91195.9%
00.0%
30.0%
00.0%
00.0%
10.0%
95.9%4.1%
00.0%
00.0%
00.0%
00.0%
00.0%
950100%
00.0%
00.0%
00.0%
00.0%
100%0.0%
00.0%
00.0%
00.0%
00.0%
00.0%
00.0%
950100%
00.0%
00.0%
00.0%
100%0.0%
00.0%
00.0%
00.0%
00.0%
00.0%
00.0%
00.0%
950100%
00.0%
00.0%
100%0.0%
00.0%
00.0%
00.0%
00.0%
00.0%
00.0%
00.0%
00.0%
950100%
00.0%
100%0.0%
00.0%
00.0%
00.0%
00.0%
130.1%
00.0%
320.3%
00.0%
00.0%
90595.3%
95.3%4.7%
100%0.0%
96.4%3.6%
100%0.0%
100%0.0%
98.6%1.4%
100%0.0%
96.4%3.6%
100%0.0%
100%0.0%
99.9%0.1%
99.1%0.9%
Target Class
Out
put C
lass
Confusion Matrix
(a) Discriminative (All)
1 2 3 4 5 6 7 8 9 10
1
2
3
4
5
6
7
8
9
10
950100%
00.0%
00.0%
00.0%
00.0%
00.0%
00.0%
00.0%
00.0%
00.0%
100%0.0%
00.0%
950100%
00.0%
00.0%
00.0%
00.0%
00.0%
00.0%
00.0%
00.0%
100%0.0%
00.0%
00.0%
950100%
00.0%
00.0%
00.0%
00.0%
00.0%
00.0%
00.0%
100%0.0%
00.0%
00.0%
10.0%
94999.9%
00.0%
00.0%
00.0%
00.0%
00.0%
00.0%
99.9%0.1%
00.0%
1201.3%
00.0%
00.0%
83087.4%
00.0%
00.0%
00.0%
00.0%
00.0%
87.4%12.6%
00.0%
00.0%
00.0%
00.0%
00.0%
950100%
00.0%
00.0%
00.0%
00.0%
100%0.0%
30.0%
00.0%
00.0%
00.0%
00.0%
00.0%
94799.7%
00.0%
00.0%
00.0%
99.7%0.3%
00.0%
00.0%
00.0%
00.0%
00.0%
00.0%
00.0%
950100%
00.0%
00.0%
100%0.0%
00.0%
00.0%
00.0%
00.0%
00.0%
00.0%
00.0%
00.0%
950100%
00.0%
100%0.0%
00.0%
00.0%
00.0%
00.0%
10.0%
00.0%
190.2%
00.0%
00.0%
93097.9%
97.9%2.1%
99.7%0.3%
88.8%11.2%
99.9%0.1%
100%0.0%
99.9%0.1%
100%0.0%
98.0%2.0%
100%0.0%
100%0.0%
100%0.0%
98.5%1.5%
Target Class
Out
put C
lass
Confusion Matrix
(b) Discriminative (Tactile)
1 2 3 4 5 6 7 8 9 10
1
2
3
4
5
6
7
8
9
10
93198.0%
40.0%
150.2%
00.0%
00.0%
00.0%
00.0%
00.0%
00.0%
00.0%
98.0%2.0%
630.7%
76880.8%
1191.3%
00.0%
00.0%
00.0%
00.0%
00.0%
00.0%
00.0%
80.8%19.2%
1651.7%
2182.3%
56759.7%
00.0%
00.0%
00.0%
00.0%
00.0%
00.0%
00.0%
59.7%40.3%
00.0%
00.0%
00.0%
89894.5%
00.0%
520.5%
00.0%
00.0%
00.0%
00.0%
94.5%5.5%
00.0%
00.0%
00.0%
00.0%
93798.6%
00.0%
00.0%
00.0%
00.0%
130.1%
98.6%1.4%
00.0%
00.0%
00.0%
100.1%
00.0%
94098.9%
00.0%
00.0%
00.0%
00.0%
98.9%1.1%
00.0%
00.0%
00.0%
00.0%
00.0%
00.0%
94599.5%
00.0%
00.0%
50.1%
99.5%0.5%
00.0%
00.0%
00.0%
00.0%
00.0%
00.0%
00.0%
94098.9%
100.1%
00.0%
98.9%1.1%
00.0%
00.0%
00.0%
00.0%
00.0%
00.0%
00.0%
1631.7%
78782.8%
00.0%
82.8%17.2%
00.0%
00.0%
00.0%
00.0%
370.4%
00.0%
120.1%
00.0%
20.0%
89994.6%
94.6%5.4%
80.3%19.7%
77.6%22.4%
80.9%19.1%
98.9%1.1%
96.2%3.8%
94.8%5.2%
98.7%1.3%
85.2%14.8%
98.5%1.5%
98.0%2.0%
90.7%9.3%
Target Class
Out
put C
lass
Confusion Matrix
(c) Discriminative (Encoder)
1 2 3 4 5 6 7 8 9 10
1
2
3
4
5
6
7
8
9
10
950100%
00.0%
00.0%
00.0%
00.0%
00.0%
00.0%
00.0%
00.0%
00.0%
100%0.0%
00.0%
950100%
00.0%
00.0%
00.0%
00.0%
00.0%
00.0%
00.0%
00.0%
100%0.0%
00.0%
00.0%
950100%
00.0%
00.0%
00.0%
00.0%
00.0%
00.0%
00.0%
100%0.0%
00.0%
00.0%
00.0%
950100%
00.0%
00.0%
00.0%
00.0%
00.0%
00.0%
100%0.0%
00.0%
270.3%
00.0%
00.0%
91596.3%
00.0%
70.1%
00.0%
00.0%
10.0%
96.3%3.7%
00.0%
00.0%
00.0%
00.0%
00.0%
950100%
00.0%
00.0%
00.0%
00.0%
100%0.0%
00.0%
00.0%
00.0%
00.0%
00.0%
00.0%
950100%
00.0%
00.0%
00.0%
100%0.0%
00.0%
00.0%
00.0%
00.0%
00.0%
00.0%
00.0%
950100%
00.0%
00.0%
100%0.0%
00.0%
00.0%
00.0%
00.0%
00.0%
00.0%
00.0%
60.1%
94499.4%
00.0%
99.4%0.6%
00.0%
00.0%
00.0%
00.0%
140.1%
00.0%
290.3%
00.0%
00.0%
90795.5%
95.5%4.5%
100%0.0%
97.2%2.8%
100%0.0%
100%0.0%
98.5%1.5%
100%0.0%
96.3%3.7%
99.4%0.6%
100%0.0%
99.9%0.1%
99.1%0.9%
Target Class
Out
put C
lass
Confusion Matrix
(d) Generative (All)
1 2 3 4 5 6 7 8 9 10
1
2
3
4
5
6
7
8
9
10
950100%
00.0%
00.0%
00.0%
00.0%
00.0%
00.0%
00.0%
00.0%
00.0%
100%0.0%
00.0%
950100%
00.0%
00.0%
00.0%
00.0%
00.0%
00.0%
00.0%
00.0%
100%0.0%
00.0%
00.0%
94999.9%
10.0%
00.0%
00.0%
00.0%
00.0%
00.0%
00.0%
99.9%0.1%
00.0%
00.0%
00.0%
950100%
00.0%
00.0%
00.0%
00.0%
00.0%
00.0%
100%0.0%
00.0%
790.8%
00.0%
00.0%
87191.7%
00.0%
00.0%
00.0%
00.0%
00.0%
91.7%8.3%
00.0%
00.0%
00.0%
00.0%
00.0%
950100%
00.0%
00.0%
00.0%
00.0%
100%0.0%
00.0%
00.0%
00.0%
00.0%
00.0%
00.0%
950100%
00.0%
00.0%
00.0%
100%0.0%
00.0%
00.0%
00.0%
00.0%
00.0%
00.0%
00.0%
950100%
00.0%
00.0%
100%0.0%
00.0%
00.0%
00.0%
00.0%
00.0%
00.0%
00.0%
40.0%
94699.6%
00.0%
99.6%0.4%
00.0%
00.0%
00.0%
00.0%
10.0%
00.0%
230.2%
00.0%
00.0%
92697.5%
97.5%2.5%
100%0.0%
92.3%7.7%
100%0.0%
99.9%0.1%
99.9%0.1%
100%0.0%
97.6%2.4%
99.6%0.4%
100%0.0%
100%0.0%
98.9%1.1%
Target Class
Out
put C
lass
Confusion Matrix
(e) Generative (Tactile)
1 2 3 4 5 6 7 8 9 10
1
2
3
4
5
6
7
8
9
10
86791.3%
20.0%
810.9%
00.0%
00.0%
00.0%
00.0%
00.0%
00.0%
00.0%
91.3%8.7%
110.1%
83387.7%
1061.1%
00.0%
00.0%
00.0%
00.0%
00.0%
00.0%
00.0%
87.7%12.3%
971.0%
850.9%
76880.8%
00.0%
00.0%
00.0%
00.0%
00.0%
00.0%
00.0%
80.8%19.2%
00.0%
00.0%
00.0%
92997.8%
00.0%
210.2%
00.0%
00.0%
00.0%
00.0%
97.8%2.2%
00.0%
00.0%
00.0%
00.0%
93398.2%
00.0%
50.1%
00.0%
00.0%
120.1%
98.2%1.8%
00.0%
00.0%
00.0%
80.1%
00.0%
94299.2%
00.0%
00.0%
00.0%
00.0%
99.2%0.8%
00.0%
00.0%
00.0%
00.0%
00.0%
00.0%
950100%
00.0%
00.0%
00.0%
100%0.0%
00.0%
00.0%
00.0%
00.0%
00.0%
00.0%
00.0%
94499.4%
60.1%
00.0%
99.4%0.6%
00.0%
00.0%
00.0%
00.0%
00.0%
00.0%
00.0%
1972.1%
75379.3%
00.0%
79.3%20.7%
00.0%
00.0%
00.0%
00.0%
860.9%
00.0%
30.0%
40.0%
250.3%
83287.6%
87.6%12.4%
88.9%11.1%
90.5%9.5%
80.4%19.6%
99.1%0.9%
91.6%8.4%
97.8%2.2%
99.2%0.8%
82.4%17.6%
96.0%4.0%
98.6%1.4%
92.1%7.9%
Target Class
Out
put C
lass
Confusion Matrix
(f) Generative (Encoder)
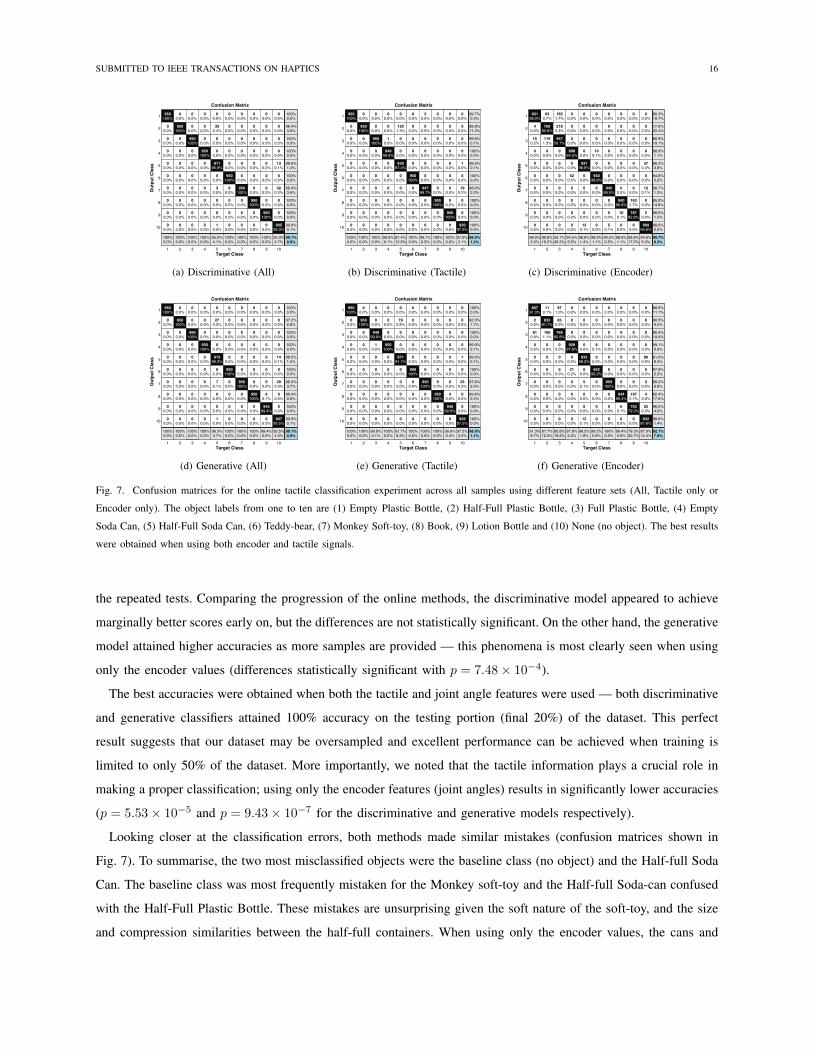
Fig. 7. Confusion matrices for the online tactile classification experiment across all samples using different feature sets (All, Tactile only or
Encoder only). The object labels from one to ten are (1) Empty Plastic Bottle, (2) Half-Full Plastic Bottle, (3) Full Plastic Bottle, (4) Empty
Soda Can, (5) Half-Full Soda Can, (6) Teddy-bear, (7) Monkey Soft-toy, (8) Book, (9) Lotion Bottle and (10) None (no object). The best results
were obtained when using both encoder and tactile signals.
the repeated tests. Comparing the progression of the online methods, the discriminative model appeared to achieve
marginally better scores early on, but the differences are not statistically significant. On the other hand, the generative
model attained higher accuracies as more samples are provided — this phenomena is most clearly seen when using
only the encoder values (differences statistically significant with p = 7.48⇥ 10
�4).
The best accuracies were obtained when both the tactile and joint angle features were used — both discriminative
and generative classifiers attained 100% accuracy on the testing portion (final 20%) of the dataset. This perfect
result suggests that our dataset may be oversampled and excellent performance can be achieved when training is
limited to only 50% of the dataset. More importantly, we noted that the tactile information plays a crucial role in
making a proper classification; using only the encoder features (joint angles) results in significantly lower accuracies
(p = 5.53⇥ 10
�5 and p = 9.43⇥ 10
�7 for the discriminative and generative models respectively).
Looking closer at the classification errors, both methods made similar mistakes (confusion matrices shown in
Fig. 7). To summarise, the two most misclassified objects were the baseline class (no object) and the Half-full Soda
Can. The baseline class was most frequently mistaken for the Monkey soft-toy and the Half-full Soda-can confused
with the Half-Full Plastic Bottle. These mistakes are unsurprising given the soft nature of the soft-toy, and the size
and compression similarities between the half-full containers. When using only the encoder values, the cans and
SUBMITTED TO IEEE TRANSACTIONS ON HAPTICS 17
plastic bottles were most frequently confused, as well as the lotion bottle and hardcover bottle, as these objects had
similar widths and resulted in similar hand configurations.
A. Comparison to Partial-Online and Offline Methods
We first compared the results obtained by our classifiers against those obtained by the incremental SVM (iSVM) [41]
with a squared-exponential (SE) kernel. Since iSVM does not directly work on temporal data, we created a feature
vector similar to [2] by computing statistics across the temporal dimension (shown in Tbl. I). Thus, unlike our
methods, classifications by the iSVM were obtained only after completing the entire grasping motion. As such, we
term this a partial-online algorithm. The iSVM parameters (penalty term C and kernel width) were optimised via
a grid search to minimise the error over 80% of the data.
Table II shows that the iSVM attained a ⇡ 4% lower accuracy score of 0.954 (results statistically significant
with p < 10
�18) compared to DU and GU. In Fig. 6, we observe lower accuracies during the first six time steps
(differences statistically significant, p < 10
�5), indicating a slower learning rate.
Next, we compared our results against offline methods, i.e., the C4.5 decision tree (used with success in several
research works on tactile classification [1], [2]) and SVM using the RapidMiner platform2. Similar to the iSVM,
we optimised each algorithm using a grid-search. Specifically, we optimised the penalty term C and the SE kernel
width for the SVM and C4.5 parameters (i.e. leaf size, split criteria, minimal gain). For the SVM, we also performed
feature selection (FS) using a genetic algorithm3. The best 5-fold cross-validation accuracies of the two methods
(in Tbl. II) are comparable to those achieved by our online methods. However, our methods do not require heavy
offline optimisation and produce predictions during the grasping motion.
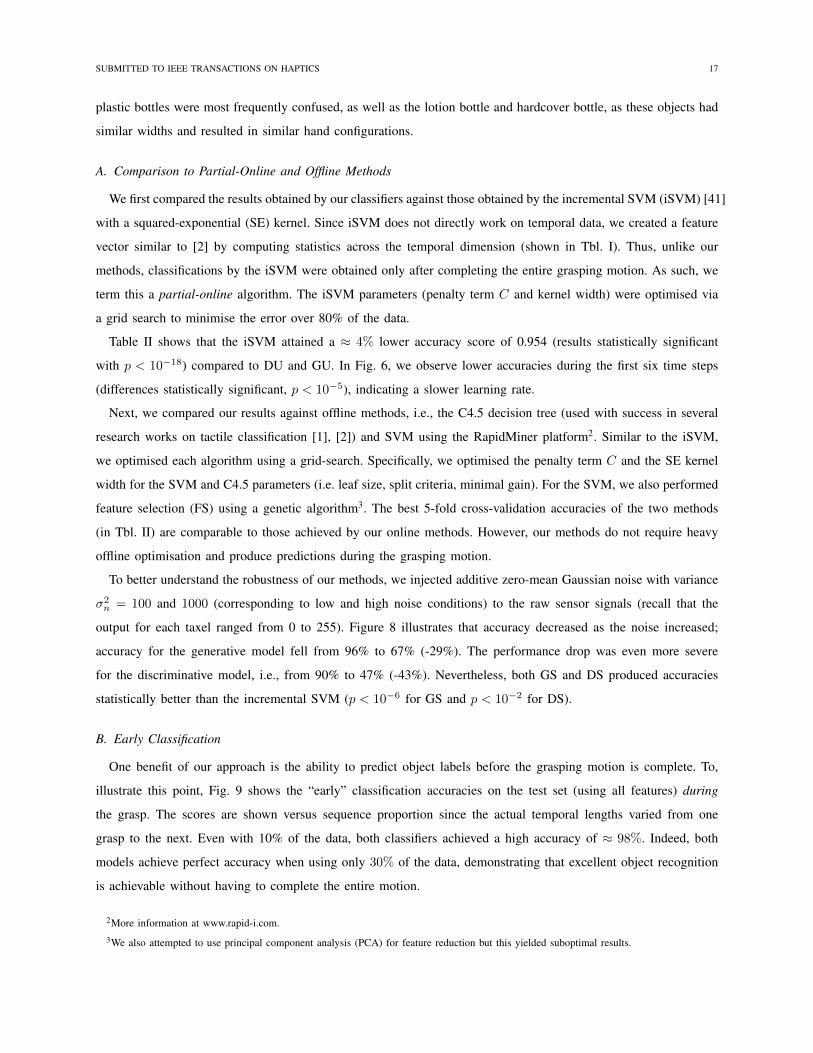
To better understand the robustness of our methods, we injected additive zero-mean Gaussian noise with variance
�2
n = 100 and 1000 (corresponding to low and high noise conditions) to the raw sensor signals (recall that the
output for each taxel ranged from 0 to 255). Figure 8 illustrates that accuracy decreased as the noise increased;
accuracy for the generative model fell from 96% to 67% (-29%). The performance drop was even more severe
for the discriminative model, i.e., from 90% to 47% (-43%). Nevertheless, both GS and DS produced accuracies
statistically better than the incremental SVM (p < 10
�6 for GS and p < 10
�2 for DS).
B. Early Classification
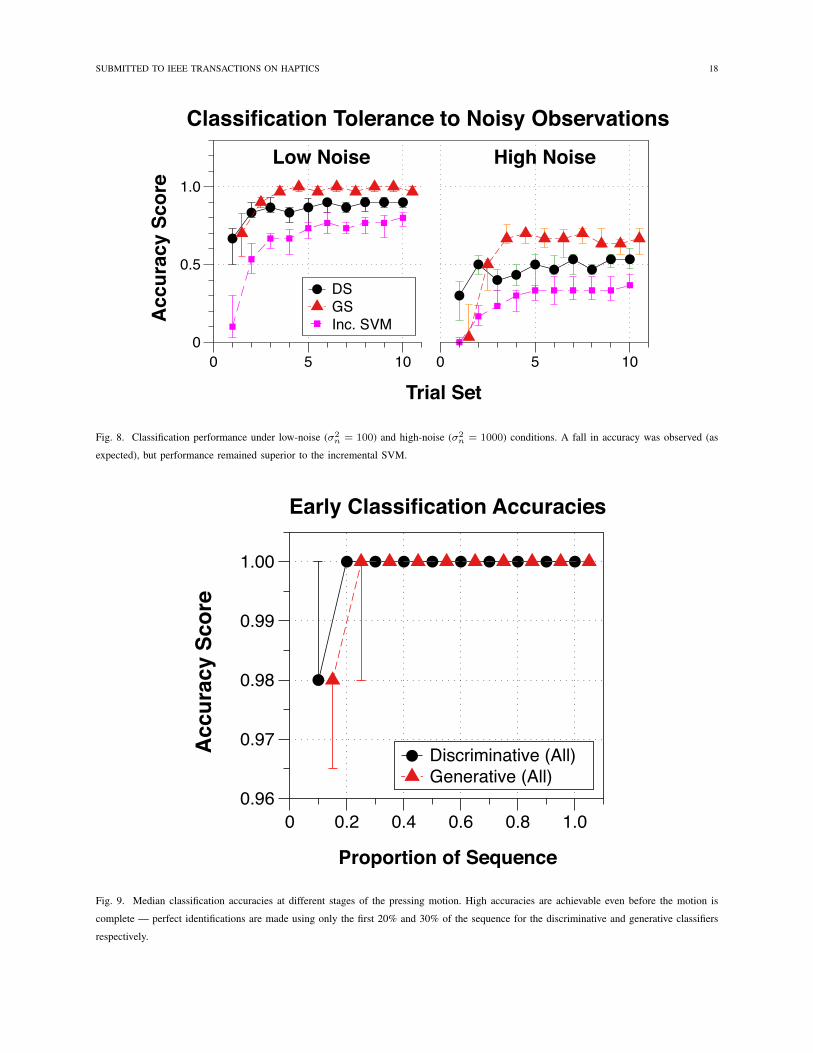
One benefit of our approach is the ability to predict object labels before the grasping motion is complete. To,
illustrate this point, Fig. 9 shows the “early” classification accuracies on the test set (using all features) during
the grasp. The scores are shown versus sequence proportion since the actual temporal lengths varied from one
grasp to the next. Even with 10% of the data, both classifiers achieved a high accuracy of ⇡ 98%. Indeed, both
models achieve perfect accuracy when using only 30% of the data, demonstrating that excellent object recognition
is achievable without having to complete the entire motion.
2More information at www.rapid-i.com.3We also attempted to use principal component analysis (PCA) for feature reduction but this yielded suboptimal results.
SUBMITTED TO IEEE TRANSACTIONS ON HAPTICS 18
Trial Set
Low Noise High Noise
Classification Tolerance to Noisy ObservationsAc
cura
cy S
core
DS GSInc. SVM
0
0.5
1.0
0 5 10 0 5 10
Fig. 8. Classification performance under low-noise (�2n = 100) and high-noise (�2
n = 1000) conditions. A fall in accuracy was observed (as
expected), but performance remained superior to the incremental SVM.
Discriminative (All)Generative (All)
0.96
0.97
0.98
0.99
1.00
0 0.2 0.4 0.6 0.8 1.0
Acc
urac
y Sc
ore
Proportion of Sequence
Early Classification Accuracies
Fig. 9. Median classification accuracies at different stages of the pressing motion. High accuracies are achievable even before the motion is
complete — perfect identifications are made using only the first 20% and 30% of the sequence for the discriminative and generative classifiers
respectively.

SUBMITTED TO IEEE TRANSACTIONS ON HAPTICS 19
TABLE I
FEATURES USED FOR PARTIAL-ONLINE AND OFFLINE METHODS (COMPUTED FOR EACH FINGER SEPARATELY).
Feature Description
1-25 First 3 moments, max and min of the mean tactile data
26-50 First 3 moments, max and min of the sd. tactile data
51-75 First 3 moments, max and min of the tactile data skewness
76-165 Encoder data during maximum and minimum tactile readings
TABLE II
OBJECT CLASSIFICATION FOR THE OIESGP-BASED CLASSIFIERS, PARTIAL-ONLINE AND OFFLINE METHODS.
Methodology Algorithm Score-Type All Features Tactile Features Encoder Features
Online Discriminative (DS) All 0.991 (0.026) 0.985 (0.025) 0.907 (0.066)
(OIESGP) Discriminative (DS) Final 20% 1.000 (0.000) 0.992 (0.012) 0.936 (0.029)
Generative (GS) All 0.991 (0.027) 0.989 (0.030) 0.921 (0.096)
Generative (GS) Final 20% 1.000 (0.000) 1.000 (0.000) 0.970 (0.024)
Partial-Online iSVM All 0.952 (0.009) — —
iSVM Final 20% 0.993 (0.018) — —
Offline C4.5 5-fold 0.985 (0.012) — —
SVM 5-fold 0.995 (0.001) — —
C. Feature Relevance
By analysing the optimised lengthscales of the discriminative classification model, we can gain insights into the
relevance of features. We observed an average increase in the lengthscales to 1.8, suggesting the initial values were
too low. The minimum lengthscales — indicative of importance — were different across the objects, indicating that
feature relevancy was object-specific. The three most relevant features (with minimum lengthscales) were the tactile
features corresponding to the middle finger and thumb, as well as the middle-finger proximal flexion/extension joint
angle. Interestingly, the C4.5 decision tree method picked a similar feature set corresponding to the mean tactile
reading for the thumb, middle and ring fingers and the standard deviation of the thumb tactile reading.
D. Computational Costs
Our computational test-bed was a Apple Macbook laptop with a 2.6Ghz Intel Core-i7 processor and 16GB
of RAM. For the discriminative classifier, each prediction iteration (for each observation) required an average
of 0.0093s. Training was more expensive at 0.02s given the need to compute derivatives for hyperparameter
optimisation. Prediction and training times were marginally higher for the generative model at 0.0097s and 0.0265s
respectively. Nevertheless, both models were capable of updating their internal states in less time than required to
execute the grasping motion. In short, the training and prediction can be made in real-time given reasonable limits

SUBMITTED TO IEEE TRANSACTIONS ON HAPTICS 20
(a)
0.7
0.90.9
0.8
Mea
n Ac
cura
cy
0.4
0.6
0.8
1.0
Trial1-10 11-20 21-30 All
Human Classification Accuracy
(b)
Fig. 10. Human online classification experiment with the three plastic bottles (of varying fullness). Participants were provided true-label feedback
after each sample, giving them the opportunity to learn from mistakes. (10b) Human Classification Accuracy as trials progressed (with medians
shown in the boxes) show an improvement in accuracy between trials 1-10 and 11-20.
on the number of classes.
E. Comparison to Human Subjects
From preliminary tests, we discovered that humans easily classified the (easily deformed) soda cans, the soft toys
(through texture), the lotion bottle and the hard-cover book. However, they had difficulty discriminating between the
plastic bottles. Similar findings were reported by Chitta et al. [2], where human subjects achieved a classification
accuracy score of 75.2% when asked to discriminate between full and empty (both open and closed) plastic bottles
— note however that in that study, the humans trained before-hand (until they were confident about their abilities)
and were not offered the correct labels during the testing stage.
We invited 15 human subjects (ages 21-38 years, mean 28.5 years, 13 males) to participate in an experiment
similar to the classification task described in Section V but limited to the three plastic bottles (Fig. 10a). In the
first phase, each participant was allowed to grasp each of the items once and told the object’s class; they were not
allowed to lift or otherwise move the bottles. In the second phase, they were asked to classify a randomly selected
bottle (30 trials with stratified sampling) hidden in covered box. After each attempt, the participants were provided
feedback (the true-label), giving them the opportunity to learn from mistakes.
The average human score was 80.4% (sd. 12.4%), lower than that achieved by iCub with OIESGP classifiers.
From the confusion matrix (Tbl. III ), we observed that the empty and half-full bottles were more difficult to tell
apart; our participants frequently misclassified the empty bottle as half-full, particularly during earlier trials. The
one participant who achieved perfect accuracy revealed to us after the experiment that he used a combination of
temperature and bottle deformation to help him with the task. Since our methods can easily accommodate other
sensor-streams, future work may fuse sensor data to better classify items.
To determine if the subjects improved as the trials progressed, we segmented the data into three portions, i.e.,
SUBMITTED TO IEEE TRANSACTIONS ON HAPTICS 21
TABLE III
CONFUSION MATRIX FOR FULL, HALF-FULL AND EMPTY PLASTIC BOTTLES (HUMAN STUDY)
Predicted
True Label Empty Half-Full Full
Empty 111 37 2
Half-Full 17 110 23
Full 0 9 141
DUGU
0
0.5
1.0
0 0.5 1.0 0 0.5 1.0 0 0.5 1.0
Novelty Threshold
Cluster Evaluation ScoresPurity ARI NMI
Scor
e
Fig. 11. Purity and ARI scores fell as the novelty threshold was increased. The NMI penalises the large number of effective clusters spawned
by the discriminative model and hence, we observe a rise from approximately 0.5 to 0.9 (at �D = 0.3), followed by a fall back to the initial
score.
the first ten, second ten and final ten trials. As can be seen in Fig. 10b, the median accuracy scores rose from 70%
to 90% from the first to the second segments and remained relatively stable after. The difference in the first and
second segments were statistically significant at the 95% level (p = 0.033), in favour of the hypothesis that human
beings learnt continuously from feedback. We also noted that the human subjects repeated their grasps in order
to make a decision (especially when they were unsure). As future work, we plan to investigate using the model’s
uncertainty estimates in a similar “active-touch” strategy.
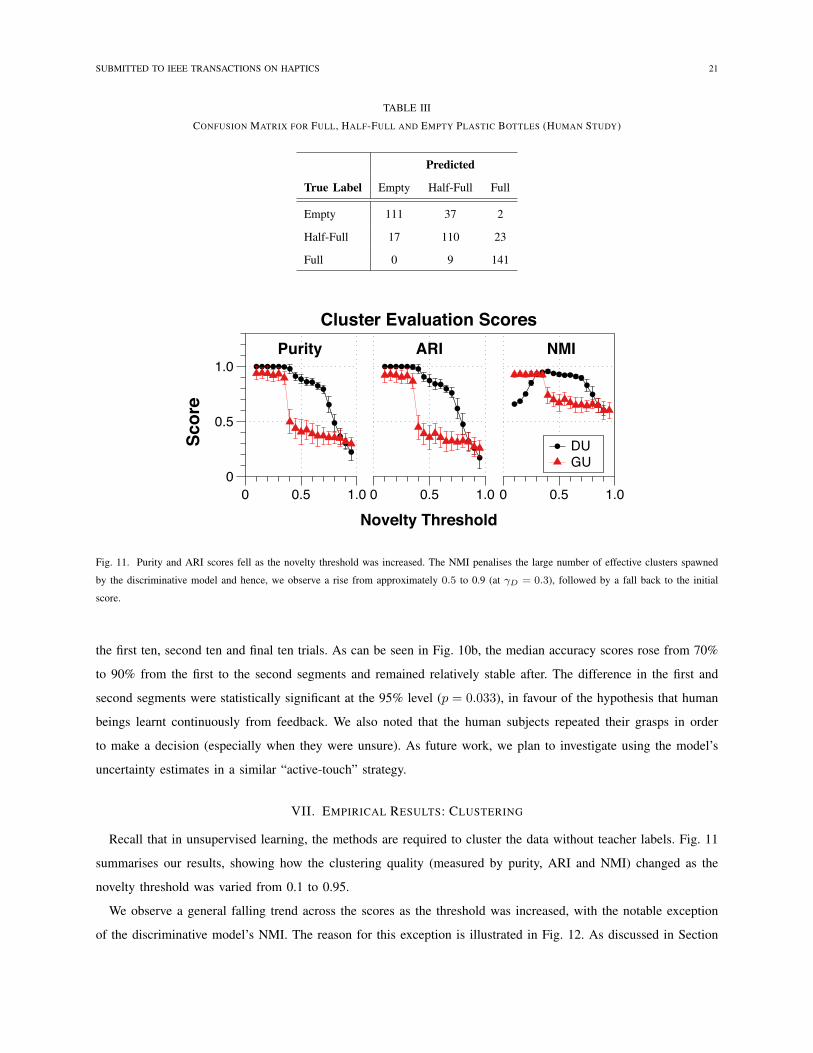
VII. EMPIRICAL RESULTS: CLUSTERING
Recall that in unsupervised learning, the methods are required to cluster the data without teacher labels. Fig. 11
summarises our results, showing how the clustering quality (measured by purity, ARI and NMI) changed as the
novelty threshold was varied from 0.1 to 0.95.
We observe a general falling trend across the scores as the threshold was increased, with the notable exception
of the discriminative model’s NMI. The reason for this exception is illustrated in Fig. 12. As discussed in Section

SUBMITTED TO IEEE TRANSACTIONS ON HAPTICS 22
DU ClustersDU Eff. ClustersGU ClustersGU Eff. Clusters
10
100
0 0.2 0.4 0.6 0.8 1.0
Cou
nt (l
og-s
cale
)
Novelty Threshold
Number of Clusters Generated
Fig. 12. The average number of clusters and effective clusters generated decreased as the novelty threshold was increased. Note that the
relationship is non-linear. The discriminative model kept active the same number of clusters that it generated — 200 when the threshold was at
0.1 and only one at 0.95. The generative model generated many initial clusters (up to 50 at low novelty thresholds) but kept effective clusters
a much smaller number (only up to 18).
Num. Effective Clusters
NM
I
Normalised Mutual Info. Scores
k-meansSOMGenerativeDiscriminative0.4
0.6
0.8
1.0
0 5 10 15 20
Fig. 13. NMI scores for all four methods increased with the number of effective clusters, up to 15 clusters. After the respective maxima, NMI
fell slowly (within the window of 20 clusters). Both the generative and discriminative model achieved higher NMI scores relative to sequential
k-means and SOM (p < 10�4 from 11 effective clusters onwards).
SUBMITTED TO IEEE TRANSACTIONS ON HAPTICS 23
TABLE IV
CLUSTER EVALUATION SCORES FOR TACTILE-BASED OBJECT RECOGNITION (10 CLUSTERS/NEURONS)
Algorithm Purity ARI NMI
Discriminative (DU) 0.835 (0.021) 0.807 (0.022) 0.914 (0.011)
Generative (GU) 0.824 (0.025) 0.774 (0.042) 0.903 (0.018)
Sequential k-means 0.735 (0.080) 0.700 (0.092) 0.857 (0.040)
Sequential SOM 0.777 (0.056) 0.718 (0.068) 0.858 (0.036)
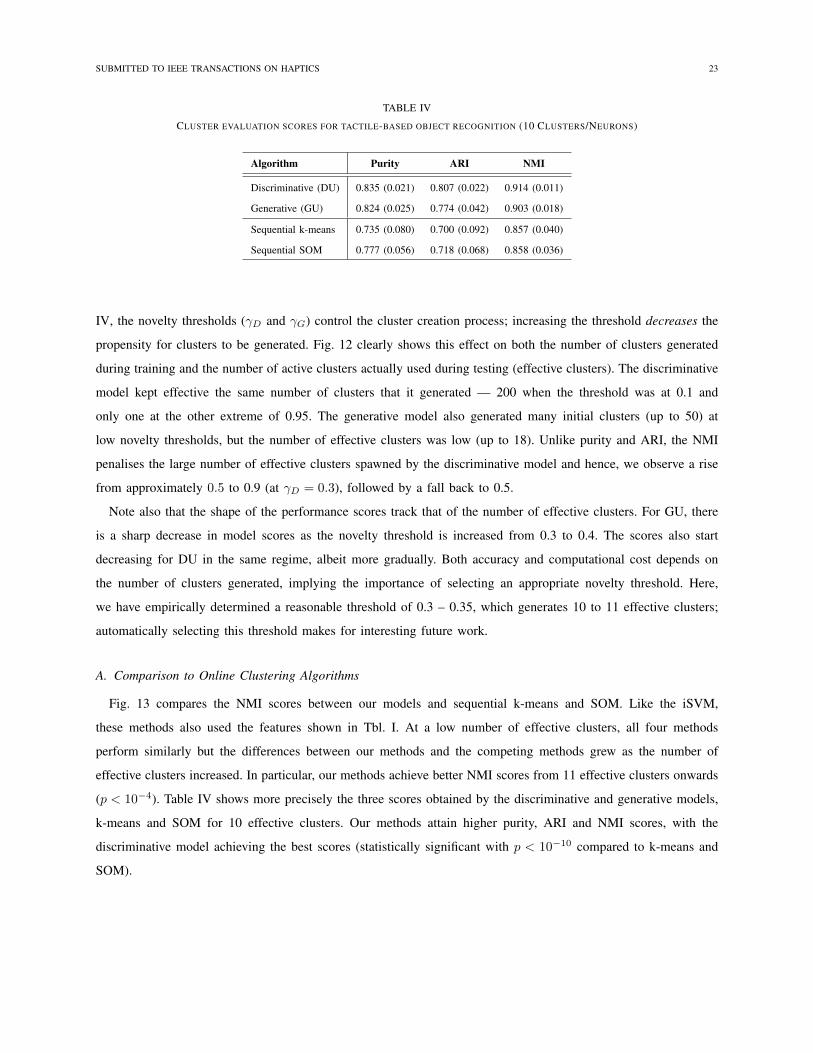
IV, the novelty thresholds (�D and �G) control the cluster creation process; increasing the threshold decreases the
propensity for clusters to be generated. Fig. 12 clearly shows this effect on both the number of clusters generated
during training and the number of active clusters actually used during testing (effective clusters). The discriminative
model kept effective the same number of clusters that it generated — 200 when the threshold was at 0.1 and
only one at the other extreme of 0.95. The generative model also generated many initial clusters (up to 50) at
low novelty thresholds, but the number of effective clusters was low (up to 18). Unlike purity and ARI, the NMI
penalises the large number of effective clusters spawned by the discriminative model and hence, we observe a rise
from approximately 0.5 to 0.9 (at �D = 0.3), followed by a fall back to 0.5.
Note also that the shape of the performance scores track that of the number of effective clusters. For GU, there
is a sharp decrease in model scores as the novelty threshold is increased from 0.3 to 0.4. The scores also start
decreasing for DU in the same regime, albeit more gradually. Both accuracy and computational cost depends on
the number of clusters generated, implying the importance of selecting an appropriate novelty threshold. Here,
we have empirically determined a reasonable threshold of 0.3 – 0.35, which generates 10 to 11 effective clusters;
automatically selecting this threshold makes for interesting future work.
A. Comparison to Online Clustering Algorithms
Fig. 13 compares the NMI scores between our models and sequential k-means and SOM. Like the iSVM,
these methods also used the features shown in Tbl. I. At a low number of effective clusters, all four methods
perform similarly but the differences between our methods and the competing methods grew as the number of
effective clusters increased. In particular, our methods achieve better NMI scores from 11 effective clusters onwards
(p < 10
�4). Table IV shows more precisely the three scores obtained by the discriminative and generative models,
k-means and SOM for 10 effective clusters. Our methods attain higher purity, ARI and NMI scores, with the
discriminative model achieving the best scores (statistically significant with p < 10
�10 compared to k-means and
SOM).

SUBMITTED TO IEEE TRANSACTIONS ON HAPTICS 24
VIII. SUMMARY AND CONCLUSIONS
This work presented online discriminative and generative classifiers — composed of flexible spatio-temporal
OIESGP sub-models — for distinguishing objects by touch.
In contrast to existing methods, our classifiers provide online classification via a probability distribution over object
classes at each time-step. When applied to the tactile and encoder signals provided by the iCub anthropomorphic
hand, our methods achieved high accuracies on a variety of objects. The best scores were obtained when using a
combination of tactile and encoder (joint angle) signals, indicating that both feature sets are relevant for accurate
object identification. On the unsupervised learning task, our algorithms generated more cogent clusterings relative to
the popular sequential k-means and SOM methods. Comparing the two approaches, the generative model achieved
better classifications, but the discriminative model produced better clusters.
Touch-based recognition remains an interesting and challenging area for future work. In particular, we note
several unresolved issues and avenues for future work. First, it would be interesting to determine what other
spatial features (other than the simple moments used here) can be extracted in real-time from the sensor stream
— in particular, adapting image-based features used in the vision community appears a promising route. From an
algorithmic perspective, the OIESGP models used were optimised using stochastic natural gradient descent which,
while effective, may fall prey to local minima. Future work may investigate “global” optimisation methods such as
evolutionary algorithms (e.g., [42]).
Unlike the classification methods, the unsupervised algorithms (DU and GU) can be used for data exploration
on data collected from tactile sensors. The clusters may also serve as a codebook (e.g., [43]) or as lower-level
features in deep-learning classifiers [44] or in hierarchical methods [45]. Unsupervised learning is also particularly
relevant for autonomous robots operating in unstructured environments. For example, our novelty-based methods
enable robots to detect newly-discovered objects on which to direct their attention, allowing for real-time intelligent
exploration and learning by-touch.
As future work, we noted a proper novelty threshold was required for good performance. Can the threshold be
set automatically from the data? In addition, the generative model created many clusters that were not ultimately
used. How best to prune these unused clusters over time and free up resources remains an open problem. It would
also be interesting to consider a semi-supervised approach (merging elements from the methods presented) whereby
both labelled and unlabelled data can be fully utilised.
Finally, our experiments with human subjects have provided two additional means of extending our work. The
first is the fusion of additional sensory data such as temperature and vision to better classify objects (such as [46]).
The second research thread is active classification, i.e., gathering additional sensory data when confidences are low.
Moreover, the current system uses exploration with a single hand and grasp trajectory; it would be interesting to
consider multiple actuators (e.g., grasping with two hands) and grasp controllers, using the uncertainties as guidance.
In a similar vein, active learning can be used to minimise the amount of samples required for learning. We anticipate
that research in these areas will bring us closer to autonomous systems that are better capable of tactile exploration
SUBMITTED TO IEEE TRANSACTIONS ON HAPTICS 25
and interaction in unconstrained environments.
ACKNOWLEDGMENT
The authors would like to thank members of the Personal Robotics Lab at Imperial College London for their
help in the preparation of this manuscript. This work was supported in part by the EU FP7 project WYSIWYD
under Grant 612139 and a SMART Scholar Grant.
REFERENCES
[1] S. Chitta, M. Piccoli, and J. Sturm, “Tactile object class and internal state recognition for mobile manipulation,” in IEEE International
Conference on Robotics and Automation, May 2010, pp. 2342–2348.
[2] S. Chitta, J. Sturm, M. Piccoli, and W. Burgard, “Tactile Sensing for Mobile Manipulation,” IEEE Transactions on Robotics, vol. 27, no. 3,
pp. 558 –568, June 2011.
[3] A. Schneider, J. Sturm, C. Stachniss, M. Reisert, H. Burkhardt, and W. Burgard, “Object identification with tactile sensors using bag-of-
features,” in IEEE/RSJ International Conference on Intelligent Robots and Systems, 2009, pp. 243 –248.
[4] G. Metta, G. Sandini, D. Vernon, L. Natale, and F. Nori, “The iCub humanoid robot: an open platform for research in embodied cognition,”
in 8th Workshop on Performance Metrics for Intelligent Systems, New York, NY, USA, 2008, pp. 50–56.
[5] H. Soh, Y. Su, and Y. Demiris, “Online spatio-temporal Gaussian process experts with application to tactile classification,” in IEEE/RSJ
International Conference on Intelligent Robots and Systems, 2012, pp. 4489–4496.
[6] M. Schopfer, H. Ritter, and G. Heidemann, “Acquisition and application of a tactile database,” in IEEE International Conference on
Robotics and Automation, april 2007, pp. 1517 –1522.
[7] Z. Pezzementi, E. Plaku, C. Reyda, and G. Hager, “Tactile-object recognition from appearance information,” IEEE Transactions on Robotics,
vol. 27, no. 3, pp. 473 –487, June 2011.
[8] J. MacQueen et al., “Some methods for classification and analysis of multivariate observations,” in Proceedings of the fifth Berkeley
symposium on mathematical statistics and probability, vol. 1, no. 281-297. California, USA, 1967, p. 14.
[9] T. Kohonen, “The self-organizing map,” Proceedings of the IEEE, vol. 78, no. 9, pp. 1464–1480, 1990.
[10] J. Tegin and J. Wikander, “Tactile sensing in intelligent robotic manipulation–a review,” Industrial Robot: An International Journal, vol. 32,
no. 1, pp. 64–70, 2005.
[11] H. Yousef, M. Boukallel, and K. Althoefer, “Tactile sensing for dexterous in-hand manipulation in robotics—a review,” Sensors and
Actuators A: Physical, vol. 167, no. 2, pp. 171–187, 2011.
[12] Y. Bekiroglu, J. Laaksonen, J. A. Jorgensen, V. Kyrki, and D. Kragic, “Assessing grasp stability based on learning and haptic data,” IEEE
Transactions on Robotics, vol. 27, no. 3, pp. 616–629, 2011.
[13] J. Laaksonen, V. Kyrki, and D. Kragic, “Evaluation of feature representation and machine learning methods in grasp stability learning,”
in Humanoid Robots (Humanoids), 2010 10th IEEE-RAS International Conference on, dec. 2010, pp. 112 –117.
[14] J. Schill, J. Laaksonen, M. Przybylski, V. Kyrki, T. Asfour, and R. Dillmann, “Learning continuous grasp stability for a humanoid robot
hand based on tactile sensing,” in IEEE RAS EMBS International Conference on Biomedical Robotics and Biomechatronics (BioRob),
2012, pp. 1901–1906.
[15] A. Y. Ng and M. I. Jordan, “On discriminative vs. generative classifiers: A comparison of logistic regression and naive bayes,” in Advances
in Neural Information Processing Systems, 2001, pp. 841–848.
[16] M. Schopfer, M. Pardowitz, and H. Ritter, “Using entropy for dimension reduction of tactile data,” in International Conference on Advanced
Robotics, June 2009, pp. 1 –6.
[17] A. Drimus, G. Kootstra, A. Bilberg, and D. Kragic, “Classification of rigid and deformable objects using a novel tactile sensor,” in 2011
15th International Conference on Advanced Robotics (ICAR), June 2011, pp. 427 –434.
[18] M. Moll and M. A. Erdmann, “Dynamic shape reconstruction using tactile sensors,” vol. 2. IEEE, 2002, pp. 1636–1641.
[19] A. Bierbaum, I. Gubarev, and R. Dillmann, “Robust shape recovery for sparse contact location and normal data from haptic exploration,”
in IEEE/RSJ International Conference on Intelligent Robots and Systems (IROS), 2008, pp. 3200–3205.

SUBMITTED TO IEEE TRANSACTIONS ON HAPTICS 26
[20] D. Faria, R. Martins, J. Lobo, and J. Dias, “Probabilistic representation of 3d object shape by in-hand exploration,” in IEEE/RSJ International
Conference on Intelligent Robots and Systems (IROS), 2010, pp. 1560–1565.
[21] Z. Pezzementi, C. Reyda, and G. D. Hager, “Object mapping, recognition, and localization from tactile geometry,” in 2011 IEEE
International Conference on Robotics and Automation (ICRA). IEEE, 2011, pp. 5942–5948.
[22] M. Meier, M. Schopfer, R. Haschke, and H. Ritter, “A probabilistic approach to tactile shape reconstruction,” IEEE Transactions on
Robotics, vol. 27, no. 3, pp. 630–635, 2011.
[23] N. Gorges, S. Navarro, D. Goger, and H. Worn, “Haptic object recognition using passive joints and haptic key features,” in IEEE
International Conference on Robotics and Automation, 2010, pp. 2349–2355.
[24] L. Csato and M. Opper, “Sparse On-Line Gaussian Processes,” Neural Computation, vol. 14, no. 3, pp. 641–668, March 2002.
[25] S. I. Amari, “Natural gradient works efficiently in learning,” Neural computation, vol. 10, no. 2, pp. 251–276, 1998.
[26] S. Vijayakumar, A. D’souza, and S. Schaal, “Incremental online learning in high dimensions,” Neural Computation, vol. 17, no. 12, pp.
2602–2634, 2005.
[27] J. Quinonero Candela and C. E. Rasmussen, “A unifying view of sparse approximate gaussian process regression,” Journal of Machine
Learning Research, vol. 6, pp. 1939–1959, December 2005.
[28] M. Hermans and B. Schrauwen, “Recurrent Kernel Machines: Computing with Infinite Echo State Networks,” Neural Computation, vol. 24,
no. 1, pp. 104–133, 2011.
[29] R. Neal, Bayesian learning for neural networks, ser. Lecture Notes in Statistics. Springer Verlag, 1996, no. 118.
[30] H. Soh, “Online Spatio-Temporal Learning and Prediction for Adaptive Robotic Systems,” Ph.D. dissertation, Imperial College London,
South Kensington, London, United Kingdom, 2013.
[31] H. Jaeger, “A tutorial on training recurrent neural networks, covering BPPT , RTRL , EKF and the ”echo state network” approach,” German
National Research Center for Information Technology, Tech. Rep. GMD Report 159, 2005.
[32] N. Le Roux, P. A. Manzagol, and Y. Bengio, “Topmoumoute online natural gradient algorithm,” in Advances in Neural Information
Processing Systems, vol. 20, 2007, pp. 849–856.
[33] S. I. Amari, H. Park, and K. Fukumizu, “Adaptive method of realizing natural gradient learning for multilayer perceptrons,” Neural
Computation, vol. 12, no. 6, pp. 1399–1409, 2000.
[34] R. Neal, Bayesian Statistics. Oxford University Press, 1997, vol. 6, ch. Regression and classification using Gaussian process priors, pp.
475—501.
[35] C. Chow, “On optimum recognition error and reject tradeoff,” Information Theory, IEEE Transactions on, vol. 16, no. 1, pp. 41–46, Jan
1970.
[36] D. A. Clifton, S. Hugueny, and L. Tarassenko, “Novelty detection with multivariate extreme value statistics,” Journal of signal processing
systems, vol. 65, no. 3, pp. 371–389, 2011.
[37] H. Soh, “iCub Grasp Dataset,” 2012. [Online]. Available: http://www.bitbucket.org/haroldsoh/icub grasp dataset
[38] W. M. Rand, “Objective criteria for the evaluation of clustering methods,” Journal of the American Statistical association, vol. 66, no.
336, pp. 846–850, 1971.
[39] L. Hubert and P. Arabie, “Comparing partitions,” Journal of classification, vol. 2, no. 1, pp. 193–218, 1985.
[40] A. Strehl and J. Ghosh, “Cluster ensembles—a knowledge reuse framework for combining multiple partitions,” The Journal of Machine
Learning Research, vol. 3, pp. 583–617, 2003.
[41] C. P. Diehl and G. Cauwenberghs, “SVM incremental learning, adaptation and optimization,” in International Joint Conference on Neural
Networks, vol. 4. IEEE, 2003, pp. 2685–2690.
[42] D. Petelin, B. Filipic, and J. Kocijan, “Optimization of Gaussian Process Models with Evolutionary Algorithms,” in Adaptive and Natural
Computing Algorithms, ser. Lecture Notes in Computer Science, A. Dobnikar, U. Lotric, and B. Ster, Eds. Springer Berlin Heidelberg,
2011, vol. 6593, pp. 420–429.
[43] M. Madry, L. Bo, D. Kragic, and D. Fox, “ST-HMP: Unsupervised spatio-temporal feature learning for tactile data,” in IEEE International
Conference on Robotics and Automation (ICRA) (to appear), May 2014.
[44] Y. Bengio, “Learning deep architectures for ai,” Foundations and trends R� in Machine Learning, vol. 2, no. 1, pp. 1–127, 2009.
[45] Y. Demiris and B. Khadhouri, “Hierarchical attentive multiple models for execution and recognition of actions,” Robotics and Autonomous
Systems, vol. 54, no. 5, pp. 361–369, 2006.

SUBMITTED TO IEEE TRANSACTIONS ON HAPTICS 27
[46] J. Ilonen, J. Bohg, and V. Kyrki, “Fusing visual and tactile sensing for 3-d object reconstruction while grasping,” in IEEE International
Conference on Robotics and Automation (ICRA), 2013, pp. 3547–3554.