submitted to the american iron and steel institute and the ... · submitted to the american iron...
TRANSCRIPT

Test Verification of the Effect of Stress Gradient on Webs of Cee and Zee Sections FINAL REPORT March 2002
submitted to the American Iron and Steel Institute and the Metal Building Manufacturers Association
by Ben Schafer, and
Cheng Yu

Executive Summary This report details the work performed under a research grant funded by the American Iron and Steel Institute (AISI) and the Metal Building Manufacturers Association (MBMA) entitled “Test Verification of the Effect of Stress Gradient on Webs of Cee and Zee Sections.” The project evolved in response to the inconclusive nature of existing test data on Cees and Zees in bending and the need for a set of simple repeatable tests on industry standard sections that account for typical details in current practice and provide the actual bending capacity in local buckling. Findings and recommendations from the research follow. Existing design procedures for the effective width (strength) of webs (AISI 1996) are theoretically inconsistent, discontinuous, and ignore the influence of the flange. Modifications adopted in the new North American Specification (AISI 2002) partially remove the web/flange interaction issue but introduce a strength discontinuity at web wid Existing test data on Cees and Zees in bending has inpredicted ratio for the AISI Specification. Previous rand distortional buckling failures, so it is difficult tocapacity of members with panels through-fastened to than 4, generally agree well with existing (AISI 1996Zees without attached panels consistently produce low Developing a new test procedure requires that specificompression flange. In typical unrestrained industbuckling occurs before local buckling. In the testingfasteners (as opposed to a single fastener through midrestrict distortional bucking and initiate local bucklingsensitive to the fastener detail. Evaluation of the test results suggests that existing distortional buckling is restricted. In several tests, evecapacity greater than moment at first yield) was obseaccurate, the observed web effective width generally and the Canadian (S136 1994) standard. The n(www.ce.jhu.edu/bschafer) provides the best predictiquite different optimum dimensions than existing meth
Future research is needed to evaluate and develop deCees and Zees with unrestrained compression flanges local buckling tests performed here. These lower strengirts under suction, continuous beams over supportswhich no restriction of the compression flange is provi
(a) local buckling, λ =5 in., Mcr/My=0.98
(b) distortional buckling, λ = 27 in., Mcr/My=0.74
Elastic buckling of 8.5 in. deep t=0.073 in. Zee
th to flange width ratios (h/b) of 4.
ordinate scatter compared with the test-to-esearch did not distinguish between local resolve the data meaningfully. However, the compression flange, and h/b ratios less ) standards. Academic testing on Cees and er strength predictions than AISI (1996).
c attention be paid to the restriction of the ry standard Cees and Zees, distortional performed here, a pair of panel-to-purlin -flange of the purlin) was required to fully failures. The strength and failure mode is
design provisions are adequate as long as n inelastic reserve capacity (tested moment rved. Assuming the flange expressions are falls between that assumed by AISI (1996) ewly proposed Direct Strength method on of member capacity, and also suggests ods, particularly with regard to lip length.
sign expressions for distortional buckling. have systematically lower strength than the gths are potentially relevant for purlins and , or any other purlin, girt, stud or joist in ded and distortional buckling can form.

Table of Contents Progress Report 1 – February 2001
1 Introduction ......................................................................................................................1-1 2 Design Methods ..................................................................................................................... 1
2.1 Existing methods for C’s and Z’s in flexure ................................................................... 1 2.1.1 Expressions for the web (AISI, S136 (Cohen), Schafer) .................................................................. 1 2.1.2 Expressions for the flange ................................................................................................................ 1 2.1.3 Direct Strength Design ..................................................................................................................... 1
2.2 Analytical evaluation of existing methods ...................................................................... 2 2.2.1 web expressions................................................................................................................................ 2 2.2.2 flange expressions ............................................................................................................................ 3 2.2.3 flange/web interaction ...................................................................................................................... 3
2.3 Local flange/web interaction........................................................................................... 3 2.3.1 Expressions for flange/web local buckling....................................................................................... 3 2.3.2 Impact of local flange/web interaction ............................................................................................. 3 2.3.3 Fixed bc is optimistic for web equation............................................................................................ 5
3 Evaluation via Existing Experiment.................................................................................... 5 3.1 Member geometry ........................................................................................................... 5
3.1.1 MBMA Z members .......................................................................................................................... 6 3.1.2 Elhouar and Murray study ................................................................................................................ 6 3.1.3 Compilation of C’s with known experimental results ...................................................................... 6 3.1.4 Geometric range of SSMA members................................................................................................ 6 3.1.5 Geometric range of Rack Manufacturer members............................................................................ 6 3.1.6 A note on yield stress ....................................................................................................................... 6
3.2 AISI Performance............................................................................................................ 6 3.2.1 For geometry used by MBMA ......................................................................................................... 6 3.2.2 For geometry used by Elhouar and Murray...................................................................................... 6 3.2.3 As a function of web height to flange width ratio ............................................................................ 7
3.3 Alternative web expressions performance ...................................................................... 7 3.3.1 As a function of web height to flange width ratio ............................................................................ 7
3.4 Ramifications of adopting alternative methods on MBMA Z members......................... 7 3.4.1 Adoption of new web expressions with no other change (S136)...................................................... 7 3.4.2 Comparisons with modified flange expressions only (ka, S136 web) .............................................. 7 3.4.3 Comparisons with fully effective flanges (>>kf, S136 web)............................................................ 8 3.4.4 Comparisons with modified flange and web expressions (ka, 1.6kw, S136 web)............................ 8
3.5 A few words about distortional buckling ........................................................................ 8 3.6 Overall ideas/comments on the AISI Specification ........................................................ 9
4 Flexural Tests on C’s and Z’s ............................................................................................ 10 4.1 Motivation for new studies............................................................................................ 10 4.2 Specimen selection........................................................................................................ 10 4.3 Selected Specimen dimensions ..................................................................................... 11 4.4 Testing Details............................................................................................................... 11 4.5 Testing Plan................................................................................................................... 14 4.6 Measured dimensions of specimens.............................................................................. 15 4.7 Current status and timeline............................................................................................ 17
5 Acknowledgment ................................................................................................................. 17 6 References ............................................................................................................................ 17

Progress Report 2 - July 2001
1 Introduction ......................................................................................................................2-1 2 Previous work........................................................................................................................ 1 3 Testing Plan ........................................................................................................................... 2
3.1 Motivation ....................................................................................................................... 2 3.2 Selection of Specimens ................................................................................................... 2 3.3 Testing Details................................................................................................................. 3 3.4 Panel-to-Purlin Fastener Configuration .......................................................................... 6
4 Results .................................................................................................................................. 10 4.1 Geometry....................................................................................................................... 10 4.2 Load-deformation.......................................................................................................... 11 4.3 Strength and Design Predictions ................................................................................... 14
5 Discussion............................................................................................................................. 14 5.1 Test-to-predicted ........................................................................................................... 14 5.2 Direct Strength .............................................................................................................. 16 5.3 Web Effective Width..................................................................................................... 16 5.4 Continued Testing ......................................................................................................... 17
6 Conclusions .......................................................................................................................... 17 7 Acknowledgments ............................................................................................................... 17
Progress Report 3 - March 2002
1 Introduction ......................................................................................................................3-1 2 Local Buckling Tests ............................................................................................................. 3
2.1 Specimen Selection ......................................................................................................... 3 2.2 Specimen dimensions...................................................................................................... 3 2.3 Testing Details................................................................................................................. 4 2.4 Panel-to-Purlin Fastener Configuration .......................................................................... 7
3 Tension Tests ......................................................................................................................... 8 4 Experimental Results ............................................................................................................ 9 5 Comparison with Design Methods..................................................................................... 16
5.1 Test-to-predicted ........................................................................................................... 16 5.2 Web Effective Width..................................................................................................... 17
6 Conclusions .......................................................................................................................... 17 7 Acknowledgement ............................................................................................................... 18 8 References ............................................................................................................................ 18

Progress Report 1 AISI Committee on Specification Meeting February 20, 2001
Test Verification of the Effect of Stress Gradient on Webs of Cee and Zee Sections
submitted to the AISI and MBMA
by Ben Schafer, Ph.D.
1 Introduction This report provides a brief synopsis of current progress on the project “Test Verification of the Effect of Stress Gradient on Webs of Cee and Zee Sections”. Progress to date includes:
9-2000 Project commenced 10-2000 Detailed examination of existing test data 10-2000 Analytical work on web/flange interaction issues in current AISI Specification 10-2000 Finite strip and further hand analysis to determine dimensions of specimens for testing 10-2000 Detailed testing plan and approval of AISI task group 11-2000 Physical overhaul of JHU structures lab facility in preparation of project 11-2000 C and Z specimens delivered to JHU 12-2000 Two undergraduate assistants: Sam Phillips and Liakos Ariston joined project part-time 12-2000 Specimens organized and labeled, damaged specimens re-ordered as needed 12-2000 Additional structural steel for reaction frame and loading mechanisms acquired 1-2001 One graduate student: Cheng Yu joined project full-time 1-2001 Detailed dimensional measurements of 8.5" Z's and 8" C's completed 1-2001 Controller, DAQ system acquired 1-2001 Finalization of testing apparatus for tests on 8.5" Z's 2-2001 (anticipated) Completion of first full specimen and testing
Progress is kept updated at www.ce.jhu.edu/bschafer. This report focuses primarily on the analytical work leading up to the experimental investigation. The marriage of this work with the test results in the lab will be provided in the next progress report (summer 2001).
2 Design Methods 2.1 Existing methods for C’s and Z’s in flexure
2.1.1 Expressions for the web (AISI, S136 (Cohen), Schafer) Expressions for the determination of the effective width of the web considered here: AISI (1996), S136 also known as the Cohen (1987) method, and Schafer and Peköz (1999). All methods are summarized in Schafer (1997).
2.1.2 Expressions for the flange Expressions for the flange considered here: AISI (1996) and the change proposed by Dinovitzer (1992) and adopted by AISI in 2000. The methods for effective width of flanges proposed by Schafer and Peköz (1999) and Hancock (1997) are not explicitly considered at this time, as the focus of this study is on local buckling, not distortional buckling. However, since distortional buckling involves the web, ultimately this issue must be revisited.
2.1.3 Direct Strength Design Current Direct Strength methods, as summarized in AISI task group on the Direct Strength method, (AISI February 2001 meeting) will be considered in this project. At this time, comparisons have not been completed.

Progress Report 1 – Feb. 2001 1-2
2.2 Analytical evaluation of existing methods
2.2.1 web expressions
2.2.1.1 The AISI web equation is effectively using 1.5ρ Peculiarities, discontinuities and inconsistencies of the existing AISI (1996) expressions for the effective width of a web have been previously investigated (most recently: Schafer and Peköz 1999). The following example shows the primary difference between the AISI (1996) method and proposed methods (as demonstrated using the method of S136).
Consider defining
comp
21*
bbb +
=ρ ,
thus ρ* is the ratio of effective portion of the element in compression. For the case of ξ=2 (ψ=-1), i.e. pure bending then the S136 method calculates
4b
b e1 = ,
4b
b2b
b e1
e2 =−= , where wbe ρ= .
Therefore for the S136 method:
ρ=
ρ
=+
=+=ρ
2w2w
b4
b4b
bbb
comp
ee
comp
21* .
For the same example AISI (1996) gives
4b
b e1 = ,
2b
b e2 = , and therefore,
ρ=
ρ
=+
=+=ρ23
2w4w3
b2
b4
b
bbb
comp
ee
comp
21* !
Thus, the effective width expressions for the web using current AISI expressions result in a 50% greater capacity for the web alone. In essence, the effective width expression for an element in pure bending by AISI is
�
���
�
λ−=ρ 122.01
23*
AISI
which for ρ*=1.0 implies a limiting λ=1.25.
2.2.1.2 Compactness / slenderness (h/t) AISI vs. S136 AISI predicts fully effective webs for much deeper (more slender) members than alternative methods.
Table 1 Slenderness limits for fully effective elements
slenderness fully effective h/t limit limit for yield stress of
Method λ 30 ksi 50 ksi 55 ksi 60 ksi Flexure
AISI (k=24) 1.25 183 141 135 129 S136 (k=24) 0.673 98 76 73 70
Compression AISI (k=4) 0.673 40 31 30 28
AISI (k=0.43) 0.673 13 10 10 9

Progress Report 1 – Feb. 2001 1-3
2.2.2 flange expressions
2.2.2.1 ka and ku in AISI B4.2 The ka term in AISI B4.2 expressions attempt to account for flange/lip local buckling interaction. The expression is a linear fit to the experimentally observed elastic buckling in Desmond et al.’s (1981) experiments. This choice is unusual because experimental buckling predications based on strain reversal methods are sensitive to imperfections and the details of the specific test, which are generally accounted for in the strength expressions for ρ, as opposed to k. All other portions of the AISI Specification use theoretical k values, not experimental k values.
The ku term in AISI B4.2 accounts for local buckling of the lip alone, but ignores the beneficial effect of a stress gradient on the lip. The current expressions for ka and ku are overly conservative, and unfairly penalize the performance of members with longer lip lengths. Schafer (1997) and Schafer and Peköz (1999) provide more accurate, and less conservative, expressions for flange/lip local buckling interaction that could be used to replace ka and lip local buckling under a stress gradient that could be used to replace ku.
2.2.3 flange/web interaction The existing AISI specification does not explicitly account for flange/web interaction in local buckling. The existing AISI web expressions empirically rely on a high degree of beneficial flange/web interaction. This is discussed in greater detail in the following section.
2.3 Local flange/web interaction
2.3.1 Expressions for flange/web local buckling Expressions for prediction of flange/web interaction in local buckling are provided in Schafer and Peköz (1999). Those expressions have been extensively refined and are presented in the following graphs, of which the key expressions from the graph are:
kwss: web plate buckling coefficient when simply supported (as a function of stress gradient), km: max web plate buckling coefficient, effectively kw with fixed edges (as a function of stress gradient) and k1: web plate buckling coefficient at h/b = 1.
Note, (kwss/k1)0.5 = h/b value at which the web reaches the simply supported value (e.g. kwss = 24 in pure bending) - for h/b in excess of this value (e.g., h/b > 2.27 in pure bending) the actual kw is greater than the simply supported value. A cautionary note, as the final graph shows, as h/b is increased the web plate bucking coefficient continues to increase; however, eventually the flange plate buckling coefficient will decrease, as it must.
2.3.2 Impact of local flange/web interaction Using the finite strip results as a guide, and comparing to current practice in the AISI (1996) Specification we may make some interesting observations:
• k for the web may be overly conservative for many common members; however this is apparently offset by effective width equations which increase ρ to 1.5ρ,
• k for the flange may be unconservative for common members, however, in some cases the AISI Spec. still arrives at approximately the correct value, by implementing a reduction on k as a function of Is/Ia when actually the reduction is a flange/web interaction issue that can better be expressed through the h/b ratio.
Since current methods do not separate between local and distortional buckling of members, it is difficult to distinguish all the ramifications of ignoring local flange/web interaction. Comparison against existing experimental data presented in subsequent sections addresses this further.

Progress Report 1 – Feb. 2001 1-4
0
10
20
30
40
50
60
70
80
0 0.1 0.2 0.3 0.4 0.5 0.6 0.7 0.8 0.9 1
ratio of flange width to web height (b/h)
plat
e bu
cklin
g co
effic
ient
for t
he w
eb k
w
ξ = 3ξ = 2ξ = 1.4ξ = 1element methodinteraction method
m
2
1
wssm2wss
wwss
1 khb
kkkkk
kk
hb +�
�
���
����
����
� −=→<
2
1wwss
1
bhkk
kk
hb
��
���
�=→≥
( )2
2
2
wcr ht
112Ekf �
�
���
�
ν−π=
4)(7.7k 2m +ξ=
445.0k 23wss +ξ+ξ=
72.4)3(08.0k 21 +−ξ−=
( )[ ]2wssw b/h4,kmink =
1
21
fff −=ξ
interaction method element method
local bucklingfinite strip analysis
( ) 8.342k m ==ξ
( ) 242k wss ==ξ
( ) 64.42k1 ==ξ
ξ = 3
ξ = 2
ξ = 1.4
ξ = 1
( )( )2k
2khb
wss
1
=ξ=ξ=
Figure 1 Web plate buckling coefficient as a function of flange width to web height ratio for local buckling
including web/flange interaction, approximate hand expressions also given
0
10
20
30
40
50
60
70
80
1 2 3 4 5 6 7 8 9 10
ratio of web height to flange width (h/b)
plat
e bu
cklin
g co
effic
ient
for t
he w
eb k
w
ξ = 3ξ = 2ξ = 1.4ξ = 1element methodinteraction method
( )2
2
2
wcr ht
112Ekf �
�
���
�
ν−π=
local bucklingfinite strip analysis
( ) 8.342km ==ξ
( ) 242kwss ==ξ
( ) 64.42k1 ==ξ
ξ = 3
ξ = 2
ξ = 1.4
ξ = 1
( )( ) wssw
1
wss kk2k2k
bh >→
=ξ=ξ>
Figure 2 Web plate buckling coefficient as a function of web height to flange width for a variety of
different stress gradients (ξξξξ) on the web.

Progress Report 1 – Feb. 2001 1-5
0
0.5
1
1.5
2
2.5
3
3.5
4
4.5
5
1 2 3 4 5 6 7 8 9 10
ratio of web height to flange width (h/b)
plat
e bu
cklin
g co
effic
ient
for t
he fl
ange
k f
ξ = 3ξ = 2ξ = 1.4ξ = 1
local bucklingfinite strip analysis
ξ = 3
ξ = 2, pure bending
ξ = 1.4
ξ = 1
Figure 3 Flange plate buckling coefficient as a function of web height to flange width for local buckling
including web/flange interaction for a variety of different stress gradients on the web and pure compression on the flange
2.3.3 Fixed bc is optimistic for web equation Finite strip analysis, and the previous discussion, suggest that use of a higher k value for the web is justified (but not with current expressions for b1 and b2) in many cases.
How high would k have to increase if the S136 expressions were used for effective width, but the resulting strength was to be the same as AISI’s current values? A lot, k would have to be approximately 2.4 times its current value. Assuming fixed boundary conditions (km in the previously given expressions) the maximum increase in kw is approximately 1.6 times it current value.
As the previous graphs show, typical members 3.1 < h/b < 3.7 may expect increases smaller than 1.6 times k. This discussion has ignored, the detrimental effect on the flange of members with higher h/b ratios. Use of the maximum k value for the web, combined with the S136 web expressions, will go a long ways towards providing comparable strength predictions to the existing AISI method – but the choice of k is optimistic. Nonetheless, it is more justifiable and rational than the arbitrary b1, b2 equations in current practice.
3 Evaluation via Existing Experiment 3.1 Member geometry The geometric range of C and Z flexural members used in practice, and those studied experimentally are provided in the following table; where h = web height, b = flange width, d = lip length, and t = thickness.
Table 2 Range of geometry for industry members and available experimental data
h/t b/t d/t h/b d/b min max min max min max min max min max MBMA Z’s 53 170 17 47 5 17 3.1 3.7 0.28 0.45 SSMA members 25 318 11 132 1 33 1.0 10.9 0.12 0.33 Rack members 23 136 16 45 6 15 1.0 3.2 0.27 0.38 Elhouar and Murray (1985) 68 165 24 52 3 24 2.6 3.8 0.09 0.49 Schafer and Peköz (1999) 43 270 15 75 3 34 1.5 13.7 0.14 0.70

Progress Report 1 – Feb. 2001 1-6
3.1.1 MBMA Z members For this study, CECO, VP, and Butler each provided detailed cross-section information on their Z members for depths between 6.5 and 11.5 inches deep. The most striking geometric feature of the MBMA Z members is the apparent optimization of the web height to flange width ratio - h/b is in a remarkably tight range.
However, data provided by LGSI for an earlier study indicates that in some cases Z members with h/b as high as 5.9 are used in current practice. Further, other common Z members (e.g. 10x2.5) have h/b in excess of the collected MBMA Z members. While these sections do not appear to be in common use for the pre-engineered metal building industry, it is conceivable that Z’s with high h/b ratios are used within the cold-formed industry.
3.1.2 Elhouar and Murray study A compilation of industry tests on purlins was reported by Elhouar and Murray (1985). This database of tests covers member geometries consistent with those used as purlins for pre-engineered metal buildings. However, this database does not cover Z members reported by LGSI, nor does it cover the wider class of members reported in other industries.
3.1.3 Compilation of C’s with known experimental results A large compilation of experimental data on C’s in flexure was examined in Schafer and Peköz (1999). From this compilation the tests of: Cohen (1987), LaBoube and Yu (1978), Moreyra (1993), Rogers (1995), Schardt and Schrade (1982), Schuster (1992), Shan et al. (1994), and Willis and Wallace (1990) are included in discussions presented here. This database of members covers a broad range of geometric ratios, but does not include members with h/b near 1.0.
3.1.4 Geometric range of SSMA members The geometric summaries attributed to the SSMA were compiled based on the geometry of C members submitted by Dietrich and Clark collected in an earlier study. Examination of the current SSMA profiles indicates a wide range of available products. Note in particular the wide range of h/b ratios employed.
3.1.5 Geometric range of Rack Manufacturer members The geometric summaries attributed to the Rack members were provided by Unarco for and earlier study. The rack members include C shapes with nearly square aspect ratio (h/b=1.0) up to those that have aspect ratios common with the MBMA Z members, h/b ~ 3.
3.1.6 A note on yield stress The geometric parameters discussed in the previous sections uniquely determine the elastic buckling of the member. However, strength and failure mode is a function of the yield stress, as well as the geometry. Therefore, the adequacy of the available experimental data to address the strength of members is not completely assessed because yield stress is not examined. In general, current members have higher, and in some cases markedly higher, yield stress than the members experimentally tested and summarized in Elhouar and Murray (1985) and Schafer and Peköz (1999).
3.2 AISI Performance The following analyses are based on the experimental testing of C’s compiled by Schafer and Peköz (1999) and summarized in the previous section.
3.2.1 For geometry used by MBMA Of 180 specimens, 21 have 3.1 < h/b < 3.7 and 0.28 < d/b < 0.45 (geometry consistent with MBMA member company Z profiles) for these 21 specimens the mean test to predicted ratio for the AISI (1996) Specification is 1.00 with a standard deviation of 0.09.
3.2.2 For geometry used by Elhouar and Murray Of 180 specimens, 64 have 2.6 < h/b < 3.8 and 0.1 < d/b < 0.5 (geometry consistent with industry tests on Z’s compiled by Elhouar and Murray (1985)) for these 64 specimens the mean test to predicted ratio for the AISI (1996) Specification is 1.03 with a standard deviation of 0.10.

Progress Report 1 – Feb. 2001 1-7
3.2.3 As a function of web height to flange width ratio Although the AISI (1996) Specification provides a reliable prediction for limited ranges of h/b and d/b (such as those often used by MBMA member companies) it can be quite unsafe out of these ranges. Consider the mean test to predicted ratio for specimens with a 0.1 < d/b < 0.5 as a function of h/b.
The figure shows the test to predicted ratio for all members with h/b greater than a given “x” value. For example, if h/b is > 3 the mean test to predicted ratio is 0.97 (this does not imply that the test to predicted ratio at h/b = 3 is 0.97). The majority of change in the accuracy occurs in the 2 < h/b < 4 range.
0.8
0.9
1
1.1
1 2 3 4 5 6 7 8 9 10
web height to flange width ratio (h/b)
mea
n te
st to
pre
dict
ed r
atio
for
C-m
embe
rs in
exc
ess o
f a g
iven
h/b
AISI
typical h/b range for metal building industry Z's
Figure 4 Test to predicted ratio for members in excess of a given h/b ratio
3.3 Alternative web expressions performance
3.3.1 As a function of web height to flange width ratio Replacing only the AISI (1996) Specification web expressions does not fully relieve the systematic error on h/b shown in the previous graph. Use of S136’s web equations or those proposed in Schafer and Peköz (1999) is shown below. The alternative expressions are more conservative, and closer to a test to predicted ratio of 1.0 for a much wider range of members. The expressions from Schafer and Peköz (1999) have the smallest amount of systematic error. None of the existing expressions alone rectify the systematic error, which is a function of flange/web local buckling interaction.
3.4 Ramifications of adopting alternative methods on MBMA Z members
3.4.1 Adoption of new web expressions with no other change (S136) If the current AISI expressions for the web are replaced by the S136 expressions, the average strength prediction for MBMA Z members will decrease by 5%. Individual members may see as much as a 9% change. (Findings are similar for the web expressions proposed by Schafer and Peköz 1999)
3.4.2 Comparisons with modified flange expressions only (ka, S136 web) If the current AISI expressions for the web are replaced by the S136 expressions, and the current ka expression for the flange is improved to more accurately account for flange/lip local buckling, the average strength prediction for MBMA Z members will decrease by 4%. Individual members may see as much as a 8% change. (Findings are similar for the web expressions proposed by Schafer and Peköz 1999)

Progress Report 1 – Feb. 2001 1-8
0.8
0.9
1
1.1
1 2 3 4 5 6 7 8 9 10
web height to flange width ratio (h/b)
mea
n te
st to
pre
dict
ed r
atio
for
C-m
embe
rs in
exc
ess o
f a g
iven
h/b
AISIS136Web-Schafer
typical h/b range for metal building industry Z's
Figure 5 Test to predicted ratio for AISI and Alternative Methods
for members in excess of a given h/b ratio
3.4.3 Comparisons with fully effective flanges (>>kf, S136 web) If the current AISI expressions for the web are replaced by the S136 expressions, AND the flange is assumed to be fully effective, then the average strength prediction for MBMA Z members equals or exceeds current AISI predictions. Individual members may still see as much as a 5% reduction in predicted capacity.
Thus, if the S136 web expressions are adopted, corrections and improvements to the flange expressions alone, will not alleviate the concerns of MBMA members regarding changes to the web expressions.. Conclusions: the strength of many typical MBMA Z members are strongly influenced by changes in the web expressions alone, many of the MBMA Z members have fully effective, or nearly fully effective flanges. (Findings are similar for the web expressions proposed by Schafer and Peköz 1999).
3.4.4 Comparisons with modified flange and web expressions (ka, 1.6kw, S136 web) If the current AISI expressions for the web are replaced by the S136 expressions, the ka expression for the flange is improved to properly account for flange/lip local buckling, AND the web expressions for local buckling are replaced by the maximum kw, ~ 1.6 times the current k for the web (i.e, assume fixed boundaries instead of simple supports) then the average strength prediction for MBMA Z members is the same as currently predicted by the AISI Specification. Individual members may see as much as a 4% reduction, or a 2% increase in strength.
The above changes represent a solution that maintains the status quo in strength prediction while correcting the sharp inconsistency of the current AISI method. However, as previously noted, assuming the k for the web is fixed is an optimistic (upperbound) assumption. Further, this solution will not alleviate systematic error for members with high h/b values. HOWEVER, it is a significant step in the right direction and re-focuses attention on the problems with the plate buckling coefficient (k and k(h/b)) instead of the strength expression (ρ).
3.5 A few words about distortional buckling Lack of an explicit treatment for distortional buckling has been cited as a problem in the AISI Specification (Hancock 1997, Schafer and Peköz 1999) However, work on C and Z members in compression (Schafer 2000) demonstrate that the Specification’s lack of a treatment for local web/flange interaction is as important as problems related to distortional buckling.
Demonstration of the systematic error in the current AISI Specification as a function of h/b does not purely place the blame on web/flange interaction in local buckling. Examination of the predicted failure strength for local and distortional buckling using the Direct Strength method will be employed to provide further insight on this matter.
For nearly constant geometry (h, b, d constant) distortional buckling is more likely to be a problem for thicker members than for thinner members.

Progress Report 1 – Feb. 2001 1-9
Distortional buckling is more likely to be a problem for members with higher yield stress than lower yield stress.
Local web/flange interaction and distortional buckling are two separate issues. While distortional buckling is roughly accounted for through the use of Is/Ia in the current AISI Specification, local web/flange interaction is entirely ignored .
Attachment of a deck to a flange may stabilize distortional buckling to some extent; however it is unlikely to have much of an effect, if any, on local buckling and local web/flange interaction issues discussed herein.
3.6 Overall ideas/comments on the AISI Specification The following comments are based on the analytical work conducted for this project and existing research to date. The experimental research currently being conducted will allow for a more direct examination of local web/flange interaction issues and, no doubt, some of the points listed below will continue to evolve.
Within the confines of the current unified effective width approach the following points are worthy of mention.
web buckling • For a wide class of members the current “k” used by AISI for the web is overly conservative. • Local web/flange interaction is ignored in AISI’s “k” expressions for the web. • Distortional buckling is ignored in AISI’s “k” expressions for the web. • Expressions for local web/flange interaction in C’s and Z’s have been determined and could be included
web effective width • AISI’s effective width equations are unintuitive, discontinuous, and inconsistent. • For sections in common use by MBMA members the equations provide reasonable strength prediction. • For a wider class of members current AISI strength prediction can be unconservative. • Alternative effective width equations (S136, Schafer and Peköz 1999) result in average reductions in
strength prediction of 5%, if adopted with no other changes. • Current expressions for effective width of the web indirectly account for an assumed beneficial web/flange
interaction. This interaction should be directly accounted for through appropriate selection of k. • If current strength predictions are justified, then either change ρ for flexural members to reflect increased
post-buckling capacity for these elements, or change k to reflect increased web buckling stress for these elements.
flange buckling • AISI’s “k” for the flange ignores local web/flange interaction. • AISI’s ka value for flange/lip interaction is overly conservative. • AISI’s ku vale for lip local buckling is overly conservative. • AISI’s “k” for the flange only partially accounts for distortional buckling. • Expressions for local web/flange interaction and distortional buckling impact “k” for the flange.
flange effective width • AISI’s current effective width equations for the flange are complicated but adequate; however, the primary
input to these equations “k” requires significant modification as discussed above.
General comments The integration of local web/flange interaction and distortional buckling into the current AISI Specification
methodology is a difficult task, because the behavior inherently involves more than one element, and the current approaches are based on treating each element of the cross-section separately. In current methods, only h/t influences local buckling of the web and it does not matter whether that web is attached to the a slender flange or a compact flange. Looking to the future, allowing numerical prediction of the local buckling stress, and implementing Direct Strength design which accounts for the interaction of the elements may alleviate these problems and systematic error.

Progress Report 1 – Feb. 2001 1-10
4 Flexural Tests on C’s and Z’s 4.1 Motivation for new studies Existing tests on C- and Z-Sections do not provide definitive evaluations of the design expressions for the web due to: incomplete restriction of the distortional mode, arrangement of the specimens (back-to-back vs. toe- to-toe), and lack of information on bracing details. A series of new flexural tests focused on the role of web slenderness in local buckling failures of C- and Z-Sections is proposed. Through careful bracing and an understanding of the inherent interaction between the flange and the web the results may be used for evaluation of existing and proposed methods for strength prediction of webs.
4.2 Specimen selection The AISI (1996) Specification calculates the effective width of webs as a function of the web slenderness (h/t) alone. The proposed tests are designed to provide systematic variation in h/t while at the same time varying the other non-dimensional parameters (h/b, b/t, d/t, d/b) enough to determine the adequacy of existing and proposed design rules. Because the focus of the testing is on the webs, significant variation in d/b is not investigated.
The primary consideration in investigating the web slenderness (h/t) is whether to achieve this variation by varying t, while holding h, b, d approximately constant – or varying h while holding b, d and t approximately constant. Practical considerations (available industry specimens) dictate that studies on the Z purlins vary t, while holding h, b, and d approximately constant. However, the wide variety of C specimens commonly produced allow both methods of variation to be examined.
0
20
40
60
80
100
120
140
160
180
70 80 90 100 110 120 130 140web slenderness (h/t)
mem
ber b
uckl
ing
stre
ss (k
si) (
incl
udes
inte
ract
ion)
vary t - fin strip localvary t - fin strip distvary h - fin strip localvary h - fin strip dist
local buckling - vary t -
h=8.5, b=2.5, d=1.0,
t=0.120 to 0.059
local buckling - vary h -h=4.2 to 8.5, b=2.5,d=1.0, t=0.059
distortional buckling - vary tdistort ional buckling -vary h
Figure 6 Local and distortional buckling stress of a typical purlin as t or h is varied as a function of web
slenderness.
The need to examine both variations is demonstrated through a simple study of a typical purlin in which the same h/t values are investigated, but in one set h is varied with t constant, in the other set t is varied with h constant, see the finite strip results of Figure 6. In the example, the two members are identical at an h/t of 144 – however as h/t is reduced by either varying h or t – the two diverge. (With regard to the distortional buckling stress, a longer lip, or attachment to decking may preclude this mode see section 3.5 for further comments on this issue).
Traditionally local buckling of the web = f(h/t, E, ν, ξ) (note, ξ = stress gradient) Accounting for web/flange interaction local buckling of the web = f(h/t, h/b, E, ν, ξ) Traditionally the effective width of the web = f(fy, h/t, E, ν, ξ) Accounting for web/flange interaction local buckling of the web = f(fy, h/t, h/b, E, ν, ξ)

Progress Report 1 – Feb. 2001 1-11
Therefore, varying t, while holding h, b, d constant examines the effective width (post-buckling behavior) for only one unique h/b value. Varying h, samples across many different h/b values but does so for a constant b/t. By using industry standard specimens a wide variation is still investigated, but the focus remains on practical members.
4.3 Selected Specimen dimensions Based on discussions with the Task Group Members and Chairmen in September the original work plan from the proposal for this project was amended (same number of total tests was kept). The overall test plan in to conduct: 3 tests to work out the bracing details, 10 standard tests on C’s, 12 standard tests on Z’s, and an additional 4 tests to be conducted on “outlier” test results for a total of 29 tests. The summary of the geometry follows:
Table 3 Summary of Geometry to be Tested h/t h/b b/t d/t d/b
Tests to be performed num min max min max min max min max min maxDetermination of bracing config. 3 dimensions of specimens not determined at this timeZ Study 1: h,b,~d fixed, t varied 7 70.8 144.1 3.4 same 20.8 42.4 8.4 12.6 0.28 0.41Z Study 2: h,b,~d fixed, t varied 5 95.8 157.5 3.3 same 29.2 47.9 8.4 12.6 0.26 0.29C Study 1: h,b,d fixed, t varied 5 82.5 242.4 4.0 same 20.6 60.6 6.4 18.9 0.31 sameC Study 2: b,d,t fixed, h varied 5 67.0 222.2 1.8 6.0 37.0 same 11.6 same 0.31 sameAdditional tests on outliers 4 dimensions to be determined based on test results
TOTAL 29 67.0 242.4 1.8 6.0 20.6 60.6 6.4 18.9 0.26 0.31 With regard to the original proposal: A greater number of tests on Z’s will be conducted, more tests on Z’s require elimination of the proposed testing of C’s with the neutral axis lowered, one set of the tests on C’s have been changed from varying h while b, d, t are constant to varying t, while h, b, d are constant – this provides comparisons to the tests on Z’s where use of industry standard sections only allow variations in t, with h, b, and ~ d held constant.
The details of the geometry of the specimens anticipated for testing are given below.
Table 4 Details of Geometry to be Tested nominal out-to-out dimensions nondimensional ratios studied
Identifier Label num h b d θ t h/t h/b b/t d/t d/b(in.) (in.) (in.) (deg) (in.)
Z Study 1: h,b,~d fixed, t variedVarco-Pruden 8.5x2.5x0.7057x0.059 1 8.5 2.5 0.706 50 0.059 144.1 3.4 42.4 12.0 0.28Varco-Pruden 8.5x2.5x0.78x0.065 2 8.5 2.5 0.78 50 0.065 130.8 3.4 38.5 12.0 0.31Varco-Pruden 8.5x2.5x0.9206x0.073 3 8.5 2.5 0.921 50 0.073 116.4 3.4 34.2 12.6 0.37Varco-Pruden 8.5x2.5x0.9382x0.082 4 8.5 2.5 0.938 50 0.082 103.7 3.4 30.5 11.4 0.38Varco-Pruden 8.5x2.5x0.9577x0.092 5 8.5 2.5 0.958 50 0.092 92.4 3.4 27.2 10.4 0.38Varco-Pruden 8.5x2.5x0.9832x0.105 6 8.5 2.5 0.983 50 0.105 81.0 3.4 23.8 9.4 0.39Varco-Pruden 8.5x2.5x1.0125x0.12 7 8.5 2.5 1.013 50 0.12 70.8 3.4 20.8 8.4 0.41Z Study 2: h,b,~d fixed, t variedVarco-Pruden 11.5x3.5x0.9206x0.073 8 11.5 3.5 0.921 50 0.073 157.5 3.3 47.9 12.6 0.26Varco-Pruden 11.5x3.5x0.9382x0.082 9 11.5 3.5 0.938 50 0.082 140.2 3.3 42.7 11.4 0.27Varco-Pruden 11.5x3.5x0.9577x0.092 10 11.5 3.5 0.958 50 0.092 125.0 3.3 38.0 10.4 0.27Varco-Pruden 11.5x3.5x0.9832x0.105 11 11.5 3.5 0.983 50 0.105 109.5 3.3 33.3 9.4 0.28Varco-Pruden 11.5x3.5x1.0125x0.12 12 11.5 3.5 1.013 50 0.12 95.8 3.3 29.2 8.4 0.29C Study 1: h,b,d fixed, t varied
SSMA 800S200-33 13 8 2 0.625 90 0.033 242.4 4.0 60.6 18.9 0.31SSMA 800S200-43 14 8 2 0.625 90 0.043 186.0 4.0 46.5 14.5 0.31SSMA 800S200-54 15 8 2 0.625 90 0.054 148.1 4.0 37.0 11.6 0.31SSMA 800S200-68 16 8 2 0.625 90 0.068 117.6 4.0 29.4 9.2 0.31SSMA 800S200-97 17 8 2 0.625 90 0.097 82.5 4.0 20.6 6.4 0.31
C Study 2: b,d,t fixed, h variedSSMA 1200S200-54 18 12 2 0.625 90 0.054 222.2 6.0 37.0 11.6 0.31SSMA 1000S200-54 19 10 2 0.625 90 0.054 185.2 5.0 37.0 11.6 0.31SSMA 800S200-54 - 8 2 0.625 90 0.054 148.1 4.0 37.0 11.6 0.31SSMA 600S200-54 20 6 2 0.625 90 0.054 111.1 3.0 37.0 11.6 0.31SSMA 400S200-54 21 4 2 0.625 90 0.054 74.1 2.0 37.0 11.6 0.31SSMA 362S200-54 22 3.62 2 0.625 90 0.054 67.0 1.8 37.0 11.6 0.31
indicates that for fy = 60 ksi, h/t is in a rangewhere AISI 1996 predicts fully effective web,but proposed methods predict partially eff. web
4.4 Testing Details Details of the testing plan are provided in the following figures. The plan itself is discussed in subsequent sections.

Progress Report 1 – Feb. 2001 1-12
Figure 7 Elevation view of overall test arrangement for four point bending test
Figure 8 End-on elevation view of specimen at end support
Figure 9 Range of specimens to be tested

Progress Report 1 – Feb. 2001 1-13
Figure 10 Paired specimen and tube detail
Figure 11 Support and loading apparatus

Progress Report 1 – Feb. 2001 1-14
4.5 Testing Plan The proposed plan consists of a series of 4 point bending tests. The basic specimen length is 16 ft., with the loading applied at the 1/3 points. Two members oriented in an opposing fashion are selected. The member are attached to one another by: standard steel decking (t = 0.019 in., 1.25 in. high ribs) screwed down at the center of the compression flange, small angles at the center of the tension flange (also screwed), and tubes at the loading point and at the supports (bolted), as detailed in the previous section.
Overall Setup
• 4 pt. bending test (loading at 1/3 points.) • Total span length 16 ft. (actual member length 18 ft.) • 2 members (C or Z), 10 in. apart, orientation: opposed
Orientation • The members are selected to be in an opposed fashion; such that in-plane rotation of the C’s and Z’s would
lead to tension in the panel, and thus provide additional restriction against distortional buckling of the compression flange.
Length • Length is selected considering: shear demands, actuator capacity, actuator stroke, and future testing. • Shear demands, actuator capacity, and actuator stroke are discussed further below. The future testing
consideration is that the constant moment length in the center should be long enough that distortional buckling would form in an unbraced member (~2×distortional buckling half wavelength is used as a minimum). In these tests the center span will be braced, but in future tests this restriction may be lifted and distortional buckling investigated further.
Bracing • Screw down panel attached to compression flange
(typical industry panel t ~ 0.019 in. max rib height 1.25 in.) • 1 ¼ x 1 ¼ x 0.057 in. Angles attached (every 12 in.) to tension flange • ¼ in. thick steel tube 10 in. wide 7.5 in high and 6 in. long will be placed between the 2 specimens at the
loading pt. and the supports (see details). • Screw down spacing of panel will be studied in initial tests, 12 in. spacing may be sufficient to engage
enough of the panel’s stiffness, but tighter spacing may be required, particularly on the thicker specimens due to propensity for distortional buckling.
Attachment • It is assumed that the panels and angles will be attached by screws through the center of the flanges.
Though better performance may be achieved by attachment away from the center, this effect is intentionally ignored in this work.
• the tubes connecting the two members will be bolted to the specimens, 4 bolts are sufficient of rthe maximum shear transfer required.
Limit States Local buckling
• Local buckling is the target failure mode for all tests, the bracing schemes, panel etc. are selected with the goal of achieving this failure mode.
Shear • Based on a moment capacity equal to the AISI (1996) prediction and a moment arm of 5’-4” shear capacity
is adequate for all members. Web Crippling
• Web crippling is adequate due to the tube at the loading point, and angles at the end supports. • At the loading point the tube which is bolted to the two specimens will stiffen the web, further the tube will
be flush with the top of the flange, so loading will be through bearing on the tube and transferred as shear to the flanges.
• At the end support a 4 x 4 x ¼ in. angle is bolted to the specimens to insure the bottom of the specimen does not cripple at the support.

Progress Report 1 – Feb. 2001 1-15
Lateral buckling • Preliminary calculations of the deepest C section (most prone to lateral buckling) show lateral buckling will
not be a problem at these span lengths if the two members act together. • The members are bolted to one another at the loading point and supports. • Additional calculations will be performed before initiating work on the 11.5 in. deep Z’s and deep C’s, but
work will continue on the 8.5 in. Z’s and 8 in. C’s in the interim. Distortional buckling
• Calculations indicate that a fully engaged panel provides sufficient torsional resistance to limit distortional buckling.
• Calculations (finite strip) were performed to determine the stiffness required of a torsional spring connected to the center of the compression flange, this stiffness is less than the rotational (bending) stiffness of the panel over the short length between specimens (i.e., success of a typical panel spaced 5 ft. on centers is not assessed, rather the panel in this test, spaced 10 in. on center, can provide necessary resistance.)
Shear + bending • Not explicitly checked – though shear demand to capacity is relatively low. It is intended to avoid problems
with shear + bending through the use of the large tube bracing between the two members at the loading point (when shear + bending are both at a maximum)
Instruments Actuator Capacity
• The 20 kip actuator will be at capacity on the thicker 11.5 in. deep Z’s. It is important that these members have an fy at or near 50 ksi. The constant moment length in the center can be decreased (thus increasing the moment arm for the member) as additional capacity is needed.
• For typical members approx. 50% of actuator capacity will be used. Actuator stroke
• The stroke of the actuator (6 in.) will be near its limits for the smallest C sections tested. • For typical members approx. 40% of actuator stoke will be used.
Monitoring • LVDT’s for deflection , and strain gages on a limited number of specimens
4.6 Measured dimensions of specimens Dimensions of the 8 in. C’s and 8.5 in. deep Z’s have been completed. Measurements were taken at the center of the specimen and mid-distance between the center and loading points (A total of 3 measurement locations for each specimen). Measurements for the Z’s follow.
Figure 12 Definition of specimen dimensions for a Z

Progress Report 1 – Feb. 2001 1-16
Table 5 Measured specimen dimensions for 8.5 in. deep Z’s MEAN and STDEV
Label h b2 θθθθ4 d2 θθθθ2 r4 b1 θθθθ3 d1 θθθθ1 r3 t8.5z12-4 8.439 2.630 1.8 0.927 52.4 0.344 2.469 -0.5 0.996 50.7 0.344 0.1168.5z12-4 0.019 0.019 3.5 0.030 3.1 - 0.002 0.3 0.003 1.0 - 0.001 8.5z12-48.5z12-3 8.438 2.460 -0.3 0.994 49.2 0.354 2.582 -0.3 0.955 47.5 0.359 0.1158.5z12-3 0.018 0.007 0.4 0.006 1.9 0.009 0.025 0.5 0.006 0.9 - - 8.5z12-38.5z12-2 8.470 2.459 -0.9 1.004 49.8 0.344 2.588 -0.5 0.957 48.3 0.359 0.1158.5z12-2 0.037 0.012 0.2 0.005 1.7 - 0.022 0.2 0.010 0.6 - 0.002 8.5z12-28.5z12-1 8.428 2.518 0.6 0.992 51.5 0.354 2.648 0.7 0.938 47.4 0.359 0.1168.5z12-1 0.032 0.026 0.7 0.015 1.3 0.009 0.013 3.3 0.012 0.5 - 0.001 8.5z12-18.5z105-2 8.476 2.362 0.7 0.948 48.1 0.339 2.661 0.4 0.947 50.1 0.323 0.1018.5z105-2 0.001 0.003 0.1 0.005 0.2 0.009 0.023 0.2 0.025 1.7 0.009 0.001 8.5z105-28.5z105-1 8.422 2.692 0.5 0.971 50.2 0.313 2.364 0.6 0.905 48.1 0.339 0.0998.5z105-1 0.019 0.012 0.3 0.010 1.2 - 0.005 0.3 0.009 0.2 0.009 0.003 8.5z105-18.5z092-4 8.412 2.409 0.3 0.959 50.5 0.307 2.613 1.7 0.927 51.3 0.292 0.0898.5z092-4 0.019 0.003 0.6 0.015 0.4 0.009 0.031 0.4 0.019 0.8 0.009 0.001 8.5z092-48.5z092-3 8.401 2.584 1.2 0.945 50.7 0.292 2.406 0.2 0.941 51.3 0.313 0.0888.5z092-3 0.002 0.007 0.2 0.015 1.3 0.009 0.009 0.2 0.007 0.8 - 0.001 8.5z092-38.5z092-2 8.432 2.404 0.0 0.949 50.4 0.313 2.611 0.0 0.921 51.7 0.281 0.0898.5z092-2 0.001 0.009 0.2 0.006 0.2 - 0.009 0.2 0.009 0.4 - 0.001 8.5z092-28.5z092-1 8.421 2.394 0.3 0.952 50.6 0.313 2.593 0.3 0.929 52.1 0.281 0.0888.5z092-1 0.019 0.011 0.1 0.011 0.8 - 0.010 0.4 0.008 1.1 - 0.001 8.5z092-18.5Z082-4 8.475 2.385 -1.7 0.966 53.0 0.297 2.524 -1.8 0.944 50.4 0.281 0.0808.5Z082-4 0.018 0.008 0.2 0.009 0.9 - 0.008 0.2 0.012 1.7 - 0.001 8.5Z082-48.5Z082-3 8.496 2.368 -2.2 0.961 51.8 0.297 2.529 -1.9 0.936 51.9 0.276 0.0808.5Z082-3 0.036 0.022 0.3 0.015 0.3 - 0.020 0.2 0.010 1.4 0.009 0.000 8.5Z082-38.5z082-2 8.455 2.397 -1.7 0.952 54.1 0.297 2.506 -2.1 0.946 50.0 0.281 0.0808.5z082-2 - 0.006 0.3 0.004 0.6 - 0.013 0.0 0.007 0.7 - 0.000 8.5z082-28.5z082-1 8.465 2.362 -1.5 0.970 51.8 0.297 2.502 -2.1 0.945 51.1 0.281 0.0798.5z082-1 0.018 0.027 0.1 0.015 1.2 - 0.021 0.2 0.010 1.4 - 0.000 8.5z082-18.5z073-68.5z073-68.5z073-68.5z073-58.5z073-58.5z073-58.5z073-4 8.508 2.412 -1.1 0.920 51.4 0.292 2.526 -0.7 0.933 50.3 0.281 0.0718.5z073-4 0.001 0.037 0.1 0.013 2.2 0.009 0.030 0.1 0.012 1.3 - 0.000 8.5z073-48.5z073-3 8.498 2.376 -0.8 0.962 51.8 0.297 2.534 -0.7 0.913 50.8 0.281 0.0718.5z073-3 0.019 0.036 0.9 0.035 4.4 - 0.007 0.4 0.005 0.6 - 0.001 8.5z073-38.5z073-2 8.488 2.499 -0.7 0.915 49.1 0.281 2.414 -1.3 0.945 52.5 0.297 0.0718.5z073-2 0.018 0.027 0.3 0.014 1.6 - 0.006 0.1 0.007 1.0 - 0.001 8.5z073-28.5z073-1 8.498 2.535 -0.8 0.932 51.0 0.281 2.408 -1.2 0.922 52.2 0.297 0.0718.5z073-1 0.018 0.034 0.1 0.007 1.4 - 0.004 0.0 0.009 1.0 - 0.000 8.5z073-1
*blank rows indicate the specimen was damaged on delivery. Yellow indicates the wider of the two flanges – wider flanges will be paired and used for the compression flange.

Progress Report 1 – Feb. 2001 1-17
4.7 Current status and timeline Experimental status as of February 20, 2001 We are in the process of preparing the first 8.5 in. deep Z specimens. The first specimen has been measured, marked, holes drilled and bolted to the hot-rolled tubes. Decking has been screw fastened at 12 in. o.c. to the compression flange of the Z’s and angles have been screw fastened to the tension flange (12 in. o.c.). The end-plates (effectively an anti-roll clip that also alleviates web crippling at the supports) is currently in fabrication and is expected at week’s end. The reaction frame, and end supports have been designed, fabricated and installed. The actuator and controller have recently been repaired and the actuator is ready to be mounted to the reaction frame. The computer and DAQ system has been purchased and communications between the computer and controller established – we will be using LabView and we are in the process of completing the setup. Testing on the first specimens is expected by the end of the month of February.
Experimental Timeline Definitive comments regarding the timeline are difficult, with the first tests commencing in February, barring any major changes in the loading apparatus, etc, then March and April will focus on testing the 8.5 in. deep Z’s. Testing in May will be on the 8 in. deep C’s. Preliminary results of this testing at the summer 2001 AISI meeting is anticipated. Completion of all testing by the end of summer 2001 is the goal of the testing program.
Analytical work While the experimental work progresses the analytical work discussed in the proposal also continues. Evaluations of the experiments using current and proposed methods for the effective width of the web will be completed. Further, use of the Direct Strength method on these tests will also be given.
5 Acknowledgment The sponsorship of AISI and MBMA and the donation of materials by Varco-Pruden, and Clark Steel is gratefully acknowledged. The assistance of the AISI task group in developing the testing plan is appreciated. Don Johnson, Maury Golovin, Joe Nunnery, Joe Wellinghoff, and Steve Thomas have all been helpful with their ideas and generous with their time. Johns Hopkins undergraduates: Liakos Ariston and Sam Phillips and graduate student Cheng Yu have provided additional support in the lab and deserve recognition as well. The assistance of Jack Spangler in re-invigorating the JHU structural testing facility has been invaluable. The donation of miscellaneous steel parts by Prosser Steel has also been invaluable.
6 References American Iron and Steel Institute (1996). AISI Specification for the Design of Cold-Formed Steel Structural Members. American Iron and Steel
Institute. Washington, D.C. Cohen, J. M. (1987). Local Buckling Behavior of Plate Elements, Department of Structural Engineering Report, Cornell University, Ithaca, NY. Desmond T.P., Peköz, T. and Winter, G. (1981a). "Edge Stiffeners for Thin-Walled Members." Journal of the Structural Division, ASCE,
February 1981, 329-353. Dinovitzer (1992) complete cite unavailable at this time. Elhouar, S., Murray, T.M. (1985) “Adequacy of Proposed AISI Effective Width Specification Provisions for Z- and C-Purlin Design.” Fears
Structural Engineering Laboratory, FSEL/MBMA 85-04, University of Oklahoma, Norman, Oklahoma. Hancock, G.J. (1997). “Design for Distortional Buckling of Flexural Members.” Thin-Walled Structures, 27(1), 3-12, Elsevier Science Ltd. LaBoube, R.A., Yu, W. (1978). “Structural Behavior of Beam Webs Subjected to Bending Stress.” Civil Engineering Study Structural Series, 78-
1, Department of Civil Engineering, University of Missouri-Rolla, Rolla, Missouri. Moreyra, M.E. (1993). The Behavior of Cold-Formed Lipped Channels under Bending. M.S. Thesis, Cornell University, Ithaca, New York. Rogers, C.A., Schuster, R.M. (1995) “Interaction Buckling of Flange, Edge Stiffener and Web of C-Sections in Bending.” Research Into Cold
Formed Steel, Final Report of CSSBI/IRAP Project, Department of Civil Engineering, University of Waterloo, Waterloo, Ontario. Schafer, B.W. (1997). “Cold-Formed Steel Behavior and Design: Analytical and Numerical Modeling of Elements and Members with
Longitudinal Stiffeners.” Ph.D. Dissertation. Cornell University. Schafer, B.W., Peköz, T. (1999). “Laterally Braced Cold-Formed Steel Flexural Members with Edge Stiffened Flanges.” Journal of Structural
Engineering. 125(2). Schafer, B.W. (2000). Distortional Buckling of Cold-Formed Steel Columns. Final Report to the American Iron and Steel Institute (AISI). Schafer, B.W. (2001). “Design by the Direct Strength Method, December 18, 2000 Draft” Report to the AISI Task Group on the Direct Strength
Method – February 2001 meeting Schardt, R. Schrade, W. (1982). “Kaltprofil-Pfetten.” Institut Für Statik, Technische Hochschule Darmstadt, Bericht Nr. 1, Darmstadt. Schuster, R.M. (1992). “Testing of Perforated C-Stud Sections in Bending.” Report for the Canadian Sheet Steel Building Institute, University of
Waterloo, Waterloo Ontario. Shan, M., LaBoube, R.A., Yu, W. (1994). “Behavior of Web Elements with Openings Subjected to Bending, Shear and the Combination of
Bending and Shear.” Civil Engineering Study Structural Series, 94-2, Department of Civil Engineering, University of Missouri-Rolla. Willis, C.T., Wallace, B. (1990). “Behavior of Cold-Formed Steel Purlins under Gravity Loading.” J. of Structural Engineering, ASCE. 116(8).

Progress Report 2 AISI Committee on Specification Meeting (San Diego) July 24, 2001
Test Verification of the Effect of Stress Gradient on Webs of Cee and Zee Sections
submitted to the AISI and MBMA
by Ben Schafer, Ph.D.
1 Introduction This report provides a synopsis on progress since February 2001 for the project “Test Verification of the Effect of Stress Gradient on Webs of Cee and Zee Sections”. A timeline of the work since February includes:
2-2001 Finalization of testing apparatus for initial testing on 8.5 in. Zees 3-2001 Assembly of first full specimen and testing of that specimen 4-2001 Computational analysis and selection of panel-to-purlin fastener arrangement 4-2001 Experiments (3 tests, t=0.073 in.) on selected panel-to-purlin arrangement to insure local buckling 5-2001 Experiments (2 tests, t=0.059 in.) on selected panel-to-purlin arrangement to insure local buckling 5-2001 Continued testing on 8.5 in. Zees and testing of tensile coupons 6-2001 Testing on 8.5 in. Zees completed (summary online) 7-2001 Tension testing on all 8.5 in. Zees completed (note fy varies from 53 to 68 ksi depending on the thickness) 7-2001 Modifications for test setup to change from Zees to Cees 7-2001 Testing on 8 in. deep Cees underway 7-2001 Testing on 8 in. deep Cees and tension testing completed (projected) 8-2001 Testing on 3.6 in. to 12 in. deep Cees and tension testing completed (projected) 9-2001 Testing on 11.5 in. deep Zees (projected)
Progress is kept updated at www.ce.jhu.edu/bschafer and includes pictures and summaries the testing as it is undergone. This report focuses on the experimental work conducted since February 2001. The marriage of the earlier analytical work (Progress Report 1) with the test results will be provided following the completion of the testing.
2 Previous work This summary of previous work focuses on issues related to the AISI Design Specification and avoids a lengthy discussion of existing experimental data and new analytical developments in predicting behavior. Instead, the work of Progress Report 1 (February 20, 2001) which provides a detailed examination of the existing AISI (1996) and S136 (1991) rules, and AISI-COS ballot CS00-127B which has been proposed and adopted is summarized. The experimental research currently underway will allow for a direct examination of local web/flange interaction issues, and, no doubt, some of the points listed in this summary will continue to evolve. Within the confines of the current effective width approach the following points are worthy of mention.
web buckling • For a wide class of members the current “k” used by AISI1 for the web is overly conservative. • Local web/flange interaction is ignored in AISI’s “k” expressions for the web. • Distortional buckling is ignored in AISI’s “k” expressions for the web. • Expressions for local web/flange interaction in Cees and Zees are available (see Progress Report 1) • Expressions for distortional buckling in Cees and Zees are available (Schafer and Peköz 1999)
1 AISI: In this summary AISI refers to the most up-to-date version of AISI – i.e., all ballots adopted up to the July 2001 San Diego meeting, including CS00-127B which uses AISI (1996) for h/b < 4 and S136 (1991) for h/b > 4.

Progress Report 2 - July 24, 2001 – Test Verification… 2-2
web effective width • CS00-127B is an interim fix only • Due to the adoption of CS00-127B a strength discontinuity now exists at h/b = 4 • The adoption of CS00-127B provides a piece-wise solution to problems with web/flange interaction by
using 2 different effective width expressions. • One effective width expression and a “k” which accounts for web/flange interaction is still needed. • For h/b < 4 the effective width equations are unintuitive, discontinuous, and inconsistent but provide
reasonable strength prediction compared to the wide scatter of existing data. • For h/b > 4 the effective width equations provide reasonable strength prediction, however for high h/b
( ~ h/b > 7) systematic unconservative predictions result (see technical support for CS00-127B) • AISI expressions for web effective width (AISI 1996 or S136 1991) do not provide a force and equilibrium
balance for the resulting effective section (see Schafer and Peköz 1999).
flange and lip buckling • AISI’s “k” for the flange ignores local web/flange interaction. • AISI’s ka value for flange/lip interaction is overly conservative. • AISI’s ku vale for lip local buckling is overly conservative. • AISI’s “k” for the flange only partially accounts for distortional buckling. • Expressions for local web/flange interaction and distortional buckling impact “k” for the flange. • Alternative, and correct, expressions for k, ka, ku are available (Progress Report 1).
flange effective width • AISI’s current effective width equations for the flange are overly complicated but adequate • The two reductions performed to determine the lip effective width in the AISI method are inconsistent with
other effective width procedures.
General comments The integration of local web/flange interaction and distortional buckling into the current AISI Specification
methodology is a difficult task, because the behavior inherently involves more than one element, and the current approaches are based on treating each element of the cross-section separately. For example, in current methods, only h/t influences local buckling of the web and it does not matter whether that web is attached to a slender flange or a compact flange. This work is focused on properly predicting the local buckling strength of webs, including local web/flange interaction, but does not provide a resolution to issues related to distortional buckling.
3 Testing Plan 3.1 Motivation Existing tests on Cees and Zees do not provide definitive evaluations of the design expressions for the web due to: incomplete restriction of the distortional mode, arrangement of the specimens (back-to-back vs. toe- to-toe), and lack of information on bracing details. A series of new flexural tests focused on the role of web slenderness in local buckling failures of Cee and Zee Sections is proposed. Through careful bracing and an understanding of the inherent interaction between the flange and the web the results may be used for evaluation of existing and proposed methods for strength prediction of webs.
3.2 Selection of Specimens The AISI Specification calculates the effective width of webs as a function of the web slenderness (h/t) alone. The proposed tests are designed to provide systematic variation in h/t while varying the other non-dimensional parameters (h/b, b/t, d/t, d/b see section 4.1 for definitions) enough to determine the adequacy of existing and proposed design rules. The focus of the testing is on the webs, therefore large variation in d/b is not investigated.
The primary consideration in investigating the web slenderness (h/t) is whether to achieve this variation by varying t, while holding h, b, and d approximately constant – or varying h while holding b, d and t approximately constant. Practical considerations (available industry specimens) dictate that studies on the Zee purlins vary t, while holding h, b, and d constant. However, the wide variety of Cee specimens commonly produced allow both methods of variation to be examined. A summary of the selected geometry follows:

Progress Report 2 - July 24, 2001 – Test Verification… 2-3
Table 1 Summary of geometry to be tested h/t h/b b/t d/t d/b
Tests to be performed num min max min max min max min max min maxDetermination of bracing config. 3 dimensions of specimens not determined at this timeZ Study 1: h,b,~d fixed, t varied 7 70.8 144.1 3.4 same 20.8 42.4 8.4 12.6 0.28 0.41Z Study 2: h,b,~d fixed, t varied 5 95.8 157.5 3.3 same 29.2 47.9 8.4 12.6 0.26 0.29C Study 1: h,b,d fixed, t varied 5 82.5 242.4 4.0 same 20.6 60.6 6.4 18.9 0.31 sameC Study 2: b,d,t fixed, h varied 5 67.0 222.2 1.8 6.0 37.0 same 11.6 same 0.31 sameAdditional tests on outliers 4 dimensions to be determined based on test results
TOTAL 29 67.0 242.4 1.8 6.0 20.6 60.6 6.4 18.9 0.26 0.31 Table 2 Nominal dimensions of specimens to be tested
nominal out-to-out dimensions nondimensional ratios studiedIdentifier Label num h b d θ t h/t h/b b/t d/t d/b
(in.) (in.) (in.) (deg) (in.)Z Study 1: h,b,~d fixed, t variedVarco-Pruden 8.5x2.5x0.7057x0.059 1 8.5 2.5 0.706 50 0.059 144.1 3.4 42.4 12.0 0.28Varco-Pruden 8.5x2.5x0.78x0.065 2 8.5 2.5 0.78 50 0.065 130.8 3.4 38.5 12.0 0.31Varco-Pruden 8.5x2.5x0.9206x0.073 3 8.5 2.5 0.921 50 0.073 116.4 3.4 34.2 12.6 0.37Varco-Pruden 8.5x2.5x0.9382x0.082 4 8.5 2.5 0.938 50 0.082 103.7 3.4 30.5 11.4 0.38Varco-Pruden 8.5x2.5x0.9577x0.092 5 8.5 2.5 0.958 50 0.092 92.4 3.4 27.2 10.4 0.38Varco-Pruden 8.5x2.5x0.9832x0.105 6 8.5 2.5 0.983 50 0.105 81.0 3.4 23.8 9.4 0.39Varco-Pruden 8.5x2.5x1.0125x0.12 7 8.5 2.5 1.013 50 0.12 70.8 3.4 20.8 8.4 0.41Z Study 2: h,b,~d fixed, t variedVarco-Pruden 11.5x3.5x0.9206x0.073 8 11.5 3.5 0.921 50 0.073 157.5 3.3 47.9 12.6 0.26Varco-Pruden 11.5x3.5x0.9382x0.082 9 11.5 3.5 0.938 50 0.082 140.2 3.3 42.7 11.4 0.27Varco-Pruden 11.5x3.5x0.9577x0.092 10 11.5 3.5 0.958 50 0.092 125.0 3.3 38.0 10.4 0.27Varco-Pruden 11.5x3.5x0.9832x0.105 11 11.5 3.5 0.983 50 0.105 109.5 3.3 33.3 9.4 0.28Varco-Pruden 11.5x3.5x1.0125x0.12 12 11.5 3.5 1.013 50 0.12 95.8 3.3 29.2 8.4 0.29C Study 1: h,b,d fixed, t varied
SSMA 800S200-33 13 8 2 0.625 90 0.033 242.4 4.0 60.6 18.9 0.31SSMA 800S200-43 14 8 2 0.625 90 0.043 186.0 4.0 46.5 14.5 0.31SSMA 800S200-54 15 8 2 0.625 90 0.054 148.1 4.0 37.0 11.6 0.31SSMA 800S200-68 16 8 2 0.625 90 0.068 117.6 4.0 29.4 9.2 0.31SSMA 800S200-97 17 8 2 0.625 90 0.097 82.5 4.0 20.6 6.4 0.31
C Study 2: b,d,t fixed, h variedSSMA 1200S200-54 18 12 2 0.625 90 0.054 222.2 6.0 37.0 11.6 0.31SSMA 1000S200-54 19 10 2 0.625 90 0.054 185.2 5.0 37.0 11.6 0.31SSMA 800S200-54 - 8 2 0.625 90 0.054 148.1 4.0 37.0 11.6 0.31SSMA 600S200-54 20 6 2 0.625 90 0.054 111.1 3.0 37.0 11.6 0.31SSMA 400S200-54 21 4 2 0.625 90 0.054 74.1 2.0 37.0 11.6 0.31SSMA 362S200-54 22 3.62 2 0.625 90 0.054 67.0 1.8 37.0 11.6 0.31
indicates that for fy = 60 ksi, h/t is in a rangewhere AISI 1996 predicts fully effective web,but proposed methods predict partially eff. web
3.3 Testing Details The basic testing setup is illustrated in Figure 1 through Figure 6. The 4 pt. bending test consists of a pair of 16 ft long Cee or Zee specimens in parallel loaded at the 1/3 points. The specimens have small angles attached to the tension flange and a through-fastened panel attached to the compression flange. Large hot-rolled tube sections bolt the pair of Cee or Zee members together at the load points and the supports, as well as insure shear and web crippling problems are avoided at those locations.
Additional details have been added or changed as the testing progresses. The arrangement of rollers at both supports has been changed to a pin-roller configuration. The use of rollers at both supports was changed in response to large longitudinal movement observed during the first test. Additional web stiffening bars have been added to the I-beams at the supports. The web stiffeners were added to the I-beam because of observable rotation initially in the supports when testing the t=0.120 in., 8.5 in. deep Zee specimens. Machined, quarter-round aluminum blocks have been placed as guides for the rollers at the loading points. Thin Teflon sheets have been added at the load points and support points to limit unwanted friction and help insure the boundary conditions are predictable. The panel-to-purlin fastener configuration has been investigated in detail as described in the subsequent section. The only significant difference between testing the Zees and the Cees, is that when testing the Cees, the hot-rolled angles detailed in Figure 2 connect to the tube and the end plate on the inside of the tube, instead of the outside of the tube, as detailed for the Zee specimens. All other details remain unchanged.

Progress Report 2 - July 24, 2001 – Test Verification… 2-4
Figure 1 Elevation view of overall test arrangement for four point bending test
Figure 2 End-on elevation view of specimen at end support
Figure 3 Range of specimens to be tested

Progress Report 2 - July 24, 2001 – Test Verification… 2-5
Figure 4 Paired specimen and tube detail
Figure 5 Support and loading apparatus
Figure 6 Overall view of test setup

Progress Report 2 - July 24, 2001 – Test Verification… 2-6
3.4 Panel-to-Purlin Fastener Configuration A series of tests on the 8.5 in. deep Zees with t=0.073 in. was conducted in order to determine the appropriate panel-to-purlin fastener detail for restricting the distortional mode. The initial test (8.5Z073-5E6W) was conducted with single fasteners 12 in. o.c.. The fasteners were through the center of the purlin flange and located adjacent to the raised corrugations of the panel. The panels are lapped, and the panel on top of the lap is the one through-fastened at lap locations. It is the author’s understanding that this is the industry standard for through-fastened panels. Additionally, panel-to-panel fasteners were also employed at the panel laps.
The initial test had sudden longitudinal movement at 6897 lbf. The setup was modified from roller-roller to roller-pin at the supports, as discussed previously. In the second test of the same specimens, the maximum recorded load was 7576 lbf. The failure mode in the test appeared to be of a distortional character. Therefore, a new test was conducted with an additional screw fastened on each side of the raised corrugation, in an attempt to more fully engage the bending resistance of the panel. Peak load with a single fastener on each side of the corrugation was 7691 lbf, essentially the same as the first test. The overall view and failure mode are shown in Figure 7 and Figure 8.
Figure 7 Overall view of failed specimen (test 8.5Z073-1E2W shown)
Figure 8 Close-up view of failed purlin (test 8.5Z073-1E2W shown)
The rotation in the compression flange (Figure 8) was cause for some concern as the desired failure mode is local, not distortional buckling. Local failures are not necessarily easy to achieve for these specimens; without the panel in place distortional buckling occurs at a lower buckling stress than local buckling, as shown in Figure 9. However, this was known before testing – and an analysis modeling the panel as providing a continuous rotational restraint to the flange showed that a fully engaged panel would restrict distortional buckling and allow local buckling to form.
If a fully engaged panel has adequate stiffness, and adequate stiffness restricts distortional buckling, the test seems to indicate that the bending stiffness of the panel is not fully engaged with a single fastener 12 in. o.c. or with single fasteners on both sides of the raised corrugation. That is, the discretely fastened purlin does not, in this test, behave the same as a continuously restrained purlin.
(a) local buckling
(b) distortional buckling
Figure 9 Elastic buckling analysis of 8.5 in. deep t=0.073 in. Zee purlin (no attachments)

Progress Report 2 - July 24, 2001 – Test Verification… 2-7
When the purlin buckles one purlin flange goes up while the other goes down (Figure 10(a)). With only one fastener in place little bending is engaged in the panel, as for the most part the panel can rotate in a straight line. The primary resistance to this rotation is the torsional stiffness of the panel – which is quite weak. A simple idea for engaging a greater portion of the panel bending stiffness is to place two fasteners through the flange (Figure 10(b)). Thus, allowing the development of a small moment couple and better engaging the panel's bending stiffness.
(a) initial fastener configuration
(b) proposed 2 screw fastener configuration
Figure 10 Idealized panel movement and fastener configurations
Before conducting additional testing, with yet another screw configuration, analytical evidence that the new 2 screw fastener configuration of Figure 10(b) would work, was sought. A finite element model that allows for discrete fastening of the panels to the purlins was created. The cross-section dimensions of the finite element model are not identical to the tested specimen, though the depth and thickness are the same, the flange is a bit narrower and the lip a bit shorter. This model was used to investigate a number of different fastener configurations.
The finite element model is shown in Figure 11. The lowest buckling mode when a single screw fastener is employed is shown in Figure 12. The lowest buckling mode when using 2 screws, as demonstrated in Figure 10(b), is shown in Figure 13. Analysis indicates that 2 paired panel-to-purlin screws are needed to fully engage the panel in this test setup. Additionally, the modeling indicates that the fasteners do not change the local buckling mode - thus, it can be safely assumed that this configuration successfully restricts distortional buckling without artificially increasing the local buckling strength.
Figure 11 Finite element model of test setup for 8.5Z073, red dots indicate location of fasteners in current
configuration
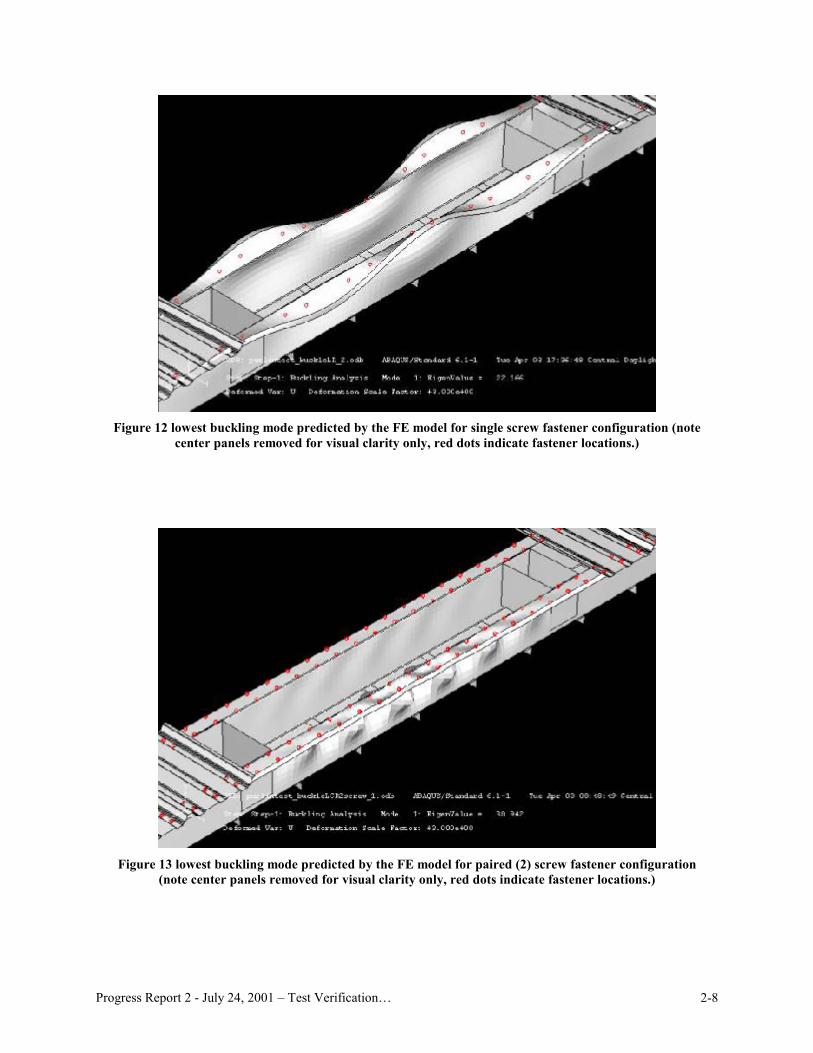
Progress Report 2 - July 24, 2001 – Test Verification… 2-8
Figure 12 lowest buckling mode predicted by the FE model for single screw fastener configuration (note
center panels removed for visual clarity only, red dots indicate fastener locations.)
Figure 13 lowest buckling mode predicted by the FE model for paired (2) screw fastener configuration
(note center panels removed for visual clarity only, red dots indicate fastener locations.)

Progress Report 2 - July 24, 2001 – Test Verification… 2-9
Testing on the specimen (8.5Z073-4E3W) which used paired screws on each side of the raised corrugation resulted in a failure load of 8341 lbf, significantly higher than the earlier tests and within 4% of the AISI (1996) predicted moment strength. However, the final failure mechanism remained somewhat similar to the earlier test with a single screw fastener configuration (Figure 8) – though the wavelength was noticeably shorter.
For the same web height, flange width and lip length (h, b, and d the same), the thinner the specimen, the greater the propensity for local buckling. In fact, for the t = 0.059 in., 8.5 in. deep Zees the local and distortional buckling stress for a purlin without a panel are nearly the same. Therefore, local buckling failures are easiest to achieve in the thinnest specimens. To insure that the failure mechanism observed is consistent with local buckling the 2 screw fastener configuration was used on the thinnest Zee specimens and the observed mode of failure is compared against the earlier 0.073 in. specimens, as shown in Figure 14.
(a) Collapse of 8.5 in. Zee, t = 0.073 in. (nominal)
(b) Collapse of 8.5 in. Zee, t=0.059 in.(nominal)
Figure 14 Collapse of 8.5 in. Zees t=0.073, 0.059 in.
Final failure is by a "mechanism", as shown by the strong yield lines in the pictures. That said, one generally tries to determine which instability "triggers" or is most strongly "related" to the failure mechanism. To this end, we generally discuss whether or not a failure is in the "local" mode, or in the "distortional mode" (as shown in the pictures of Figure 9 above). The goal of this testing is to study failures in the "local" mode, are we succeeding? The failure mechanism of t = 0.073 in. (8.5Z073-4E3W) and t = 0.059 in. (8.5Z059-4E3W)
• involve vertical translation at the flange/lip juncture consistent with distortional buckling, • occur at a short half-wavelength, consistent with local buckling, • involve rotation at the flange/lip junction, consistent with local buckling, and • involve deformation in the flange, consistent with local buckling.
Figure 15 Selected standard panel-to-purlin and panel-to-panel fastener configuration
Definitive conclusions are difficult, some aspects of both modes exist in the failure mechanism. For all of the 8.5 in. deep Zees, without the panels, distortional buckling occurs at a lower buckling stress than local buckling. It is no

Progress Report 2 - July 24, 2001 – Test Verification… 2-10
surprise then that the panel itself and the panel-to-purlin fastener configuration are strongly influencing the results. The distortional mode has been highly restricted and many characteristics consistent with a local mode have been successfully triggered. Comparison with predicted design capacities (presented in subsequent sections) further support that distortional buckling has been successfully restricted in these tests (see section 5.2). For the remainder of the testing, the standard panel-to-purlin fastener detail will consist of paired screws on both sides of the raised corrugation as shown in Figure 15.
4 Results 4.1 Geometry The mean specimen dimensions, as determined from three sets of measurements within the constant moment region, are given in Table 3. The variables used for the dimensions are defined as follows:
h out to out web depth bc out to out compression flange width (projection of outer thickness intersection lines) dc out to out compression flange lip stiffener length θc compression flange stiffener angle from horizontal bt out to out tension flange width dt out to out compression flange lip stiffener length θt tension flange stiffener angle from horizontal rhc outer radius between web and compression flange rcd outer radius between compression flange and lip* rht outer radius between web and tension flange rtd outer radius between tension flange and lip* * direct measurements not completed for Zee specimens - assumed equal to web to flange radii (as of 4.20.01)
The variables used for the metal properties are defined as follows: t base metal thickness fy yield stress E modulus of elasticity
Metal properties are determined from 3 tensile coupons taken from the end of each specimen: one from the web flat, one from the compression flange flat, and one from the tension flange flat. Since the members are of different thickness, the coils used for the forming the specimens are also different, therefore fy can vary greatly from thickness to thickness. The large variation in fy complicates comparisons across the test database, but it is important to recognize this variation, as fy for the Zees varies from 53 to 68 ksi and for the Cees from 46 to 61 ksi.
Note, tensile testing is only fully complete for the 8.5 in. Zees (Table 3(a))- the t and fy data for the Cees is estimated and thus subject to change. For those 8 in. deep Cees that have been tested a single tensile coupon has been tested for each thickness – the remainder of the coupons will be tested in subsequent weeks. An E of 29500 ksi is assumed for all of the members. This is supported by limited testing on 0.059 in. and 0.082 in. tensile specimens from the Zees which had an average measured E of 29200 ksi.

Progress Report 2 - July 24, 2001 – Test Verification… 2-11
Table 3 Measured geometry
(a) Final measured values for 8.5 in. deep Zees specimen h bc dc θc bt dt θt rhc rdc rht rdt t fy8.5z120-3 8.44 2.58 0.96 47.2 2.46 0.99 48.9 0.36 0.36 0.35 0.35 0.118 61.38.5z120-2 8.47 2.59 0.96 47.8 2.46 1.00 48.9 0.36 0.36 0.34 0.34 0.116 61.28.5z105-2 8.48 2.66 0.95 50.5 2.36 0.95 48.7 0.32 0.32 0.34 0.34 0.101 67.88.5z105-1 8.42 2.69 0.97 50.7 2.36 0.91 48.7 0.31 0.31 0.34 0.34 0.105 67.88.5z092-4 8.41 2.61 0.93 53.0 2.41 0.96 50.8 0.29 0.29 0.31 0.31 0.089 56.88.5z092-2 8.43 2.61 0.92 51.8 2.40 0.95 50.4 0.28 0.28 0.31 0.31 0.089 56.88.5z082-2 8.45 2.51 0.95 47.9 2.40 0.95 52.4 0.28 0.28 0.30 0.30 0.080 58.18.5z082-1 8.46 2.50 0.95 49.0 2.36 0.97 50.3 0.28 0.28 0.30 0.30 0.080 56.38.5z073-6 8.50 2.52 0.92 49.6 2.40 0.94 50.9 0.28 0.28 0.30 0.30 0.072 54.08.5z073-5 8.50 2.52 0.92 49.6 2.40 0.94 50.9 0.28 0.28 0.30 0.30 0.073 55.68.5z073-4 8.51 2.53 0.93 49.6 2.41 0.92 50.3 0.28 0.28 0.29 0.29 0.071 56.18.5z073-3 8.50 2.53 0.91 50.1 2.38 0.96 51.0 0.28 0.28 0.30 0.30 0.072 55.68.5z073-2 8.49 2.50 0.92 48.4 2.41 0.95 51.2 0.28 0.28 0.30 0.30 0.072 54.88.5z073-1 8.50 2.54 0.93 50.2 2.41 0.92 51.0 0.28 0.28 0.30 0.30 0.071 55.78.5z065-3 8.47 2.42 0.83 47.3 2.43 0.79 47.3 0.27 0.27 0.28 0.28 0.065 52.88.5z065-1 8.47 2.44 0.76 47.4 2.43 0.84 47.1 0.28 0.28 0.27 0.27 0.063 52.88.5z059-4 8.50 2.50 0.77 50.9 2.35 0.72 48.9 0.28 0.28 0.28 0.28 0.060 58.78.5z059-3 8.50 2.44 0.78 50.2 2.22 0.69 50.4 0.28 0.28 0.28 0.28 0.060 58.08.5z059-2 8.49 2.51 0.78 50.6 2.33 0.70 50.2 0.28 0.28 0.28 0.28 0.059 59.18.5z059-1 8.50 2.51 0.78 51.2 2.33 0.71 49.4 0.28 0.28 0.28 0.28 0.059 58.9
(b) Final measured geometry, and estimated t and fy for 8 in. deep Cees specimen h bc dc θc bt dt θt rhc rdc rht rdt t fy8C097-3 8.03 2.09 0.56 84.0 2.08 0.54 88.2 0.30 0.28 0.28 0.29 0.098 61.18C097-2 8.04 2.12 0.57 85.6 2.08 0.52 85.7 0.30 0.28 0.28 0.30 0.098 61.18C097-1 8.04 2.09 0.58 85.1 2.07 0.53 86.3 0.28 0.28 0.29 0.28 0.098 61.18C068-5 8.03 2.03 0.52 83.2 2.04 0.53 87.0 0.28 0.25 0.24 0.24 0.073 53.08C068-4 8.01 2.05 0.52 84.0 2.04 0.54 87.6 0.27 0.26 0.24 0.27 0.073 53.08C068-2 8.03 2.03 0.53 83.1 2.05 0.53 88.1 0.30 0.26 0.25 0.26 0.075 53.08C068-1 8.02 2.04 0.52 83.4 2.04 0.53 87.6 0.28 0.25 0.24 0.26 0.076 51.38C054-8 8.08 2.02 0.58 88.1 1.96 0.48 82.3 0.22 0.20 0.22 0.23 0.069 46.68C054-7 8.01 2.03 0.57 88.7 2.04 0.53 83.4 0.21 0.23 0.24 0.23 0.057 46.68C054-6 8.00 2.05 0.59 89.4 2.04 0.56 83.3 0.22 0.23 0.23 0.24 0.059 46.68C054-1 8.00 2.04 0.52 88.9 2.07 0.50 84.7 0.22 0.23 0.23 0.23 0.061 46.68C043-6 8.06 2.01 0.53 88.9 2.00 0.46 87.0 0.19 0.20 0.22 0.20 0.049 46.08C043-5 8.04 2.02 0.53 88.8 1.98 0.53 87.3 0.18 0.20 0.21 0.20 0.050 46.78C043-4 8.02 2.01 0.53 88.8 2.01 0.53 87.3 0.17 0.20 0.17 0.18 0.050 46.08C043-3 8.04 2.02 0.54 89.3 2.01 0.53 87.5 0.19 0.19 0.19 0.19 0.047 47.38C043-2 8.03 1.99 0.52 88.9 1.98 0.54 87.7 0.18 0.19 0.20 0.19 0.050 46.08C043-1 8.03 2.02 0.54 89.0 1.98 0.54 85.8 0.19 0.19 0.29 0.19 0.048 46.1
4.2 Load-deformation The load-deformation response for the 8.5 in. deep Zee specimens (type ‘a’ of Table 5) is given in Figure 16. The load is the actuator force (total load on the paired specimens) the deformation is the vertical displacement of the LVDTs at the load points on the east beam (see Figure 6). Little non-linear response is observed prior to formation of the failure mechanism. The thicker specimens, which have a tested capacity at or near the yield moment (t > 0.082 in.), exhibit the most nonlinear deformation prior to failure; while the thinner specimens have essentially elastic response prior to formation of a failure mechanism. Failure of the weaker specimen, i.e., the ‘controlling’ specimen of the pair, results in a significant loss in capacity. Redistribution of load into the second specimen of the pair causes failure soon thereafter. Failure of the second specimen can be recognized by the change in slope of the post-peak load-deformation response.
Load-deformation response of a limited amount of the 8 in. Cees is given in Figure 17. Overall, the post-peak response of the Cees is more gradual than the Zees, even in the thinner specimens. In the tests on the Cees both specimens tend to fail at approximately the same load, as opposed to the progressive failure observed in the Zees. The observed failure mechanisms for the Cees are given in Figure 18 (see Figure 14 for the Zees). The failure mechanism of the Cees is similar, but not identical to the Zees.

Progress Report 2 - July 24, 2001 – Test Verification… 2-12
(a) t=0.120 in. (Mtest/My=1.02)
(b) t=0.105 in. (Mtest/My=1.00)
(c) t=0.092 in. (Mtest/My=0.94)
(d) t=0.082 in. (Mtest/My=0.94)
(e) t=0.073 in. (Mtest/My=0.86)
(f) t=0.059 in. (Mtest/My=0.79)
Figure 16 Force-deformation response for tests on 8.5 in. deep Zees

Progress Report 2 - July 24, 2001 – Test Verification… 2-13
(a) t=0.097 in. (Mtest/My=1.02)
(b) t=0.043 in. (Mtest/My=0.69)
Figure 17 Force-deformation response for tests on 8 in. deep Cees
(a) t=0.097 in (test 8C097-2E3W)
(a) t=0.043 in (test 8C043-5E6W)
Figure 18 Observed failure mechanisms for tests on 8 in. deep Cees
(a) t=0.097 in. (test 8C097-2E3W) first failure occurred
in this specimen near the strain gages
(b) t=0.068 in. (test 8C068-4E5W) first failure occurred
in the other beam of the pair
Figure 19 Strain on web and lip for tests on 8 in. deep Cees

Progress Report 2 - July 24, 2001 – Test Verification… 2-14
Strain gages were placed at midspan, on the lip and the top of the web, at the same vertical cross-section height, on two of the tests on 8 in. deep Cee members to monitor the longitudinal strain. The output from the gages is given in Figure 19. In the initial elastic range the gages read nearly identical, indicating that the testing arrangement is achieving the desired loading about the geometric axis and no twisting develops in the section. At an intermediate load level the strain on the lip begins to reverse while the strain in the web continues unchanged. Strain reversal occurs long before deformation in the lip is noticeable.
4.3 Strength and Design Predictions Results for all specimens tested to date are detailed in Table 5 and summarized in Table 4. The results are divided into 4 groups:
(a) 8.5 in. deep Zees considered representative of the local buckling strength of these specimens (b) 8.5 in. deep Zees used to determine the panel-to-purlin fastener configuration.
Only the test which is the standard configuration is included in the summary for (a) as well. (c) an 8.5 in. deep Zee that was pre-damaged by the application of an eccentric load prior to testing. (d) Preliminary results on the 8 in. deep Cees tested to date.
Three strength prediction methods are presented: AISI (1996), S136 (1991) and Direct Strength. All of the members tested to date have an h/b < 4, therefore the design prediction for the current AISI Specification (2001 with ballot CS00-127B adopted) is the same as AISI (1996), listed as Maisi in the tables. For fair comparison only the “Controlling Z” and “Controlling C” rows (Table 4) should be compared as they relate to the specimen which failed first in the test.
5 Discussion 5.1 Test-to-predicted The average (µ) and standard deviation (σ) of the test-to-predicted ratios indicate that all methods provide an adequate prediction of the available test data. For the AISI and S136 data the test-to-predicted ratios are graphically depicted in Figure 20. The AISI and S136 methods are identical except for the expressions for the effective width of the web, the S136 method assumes the web is partially effective for λweb > 0.673 while the AISI method does not. A small amount of inelastic reserve capacity is observed in the stockiest specimens. The average strength difference between the AISI and S136 predictions is 5%, with AISI having a test-to-predicted ratio slightly less than 1.0 and S136 having a test-to-predicted ratio slightly greater than 1.0. (Agreement of the Direct Strength method is commented on in the next section).
0
0.2
0.4
0.6
0.8
1
1.2
0.60 0.70 0.80 0.90 1.00 1.10 1.20 1.30 1.40 1.50 1.60
web slenderness = λλλλweb = (fy/fcrweb)0.5
test
-to-p
redi
cted
ratio
S136: 8.5 in. deep ZeesS136: 8 in. deep CeesAISI: 8.5 in. deep ZeesAISI: 8 in. deep Cees
testing to determinepanel-to-purlin fastener
configuration
specimens damaged prior to testing
Figure 20 Test-to-predicted ratio vs. web slenderness

Progress Report 2 - July 24, 2001 – Test Verification… 2-15
Table 4 Summary of test-to-predicted ratios for existing and proposed design methods µ σ
Mtest/Maisi Mtest/MS136 Mtest/MDSl Mtest/Maisi Mtest/MS136 Mtest/MDSl
Second Z 0.96 1.01 1.00 0.04 0.01 0.03Controllling Z 0.97 1.02 1.00 0.05 0.03 0.03Damaged or Other Z 0.87 0.94 0.92 0.02 0.02 0.02Second C 0.95 1.01 0.99 0.07 0.04 0.03Controlling C 0.96 1.01 1.00 0.05 0.04 0.04Controlling: First Z or C of the paired set to fail (the 'controlling' specimen)Second: Second Z or C of the paired set to failDamaged or Other Z: Predamaged, or without standard panel-to-purlin fasterner configurationMaisi: AISI (1996) predicted flexural capacityMS136: S136 (1991) predicted flexural capacityMDSl: Direct Strength - Local mode expression as reported in (2000) to AISI TG (a.k.a: Mnl)
Table 5 Measured and predicted strength
(a) 8.5 in. deep Zees with standard panel-to-purlin fastener configuration (i.e. Figure 15) specimen fy h/t bc/t dc/t λweb Mtest Mtest/My Mtest/Maisi Mtest/MS136 Mtest/MDSl Mtest/MDSd
8.5z120-3 61.3 71 22 8 0.70 280.3 1.01 1.01 1.01 1.01 1.258.5z120-2 61.2 73 22 8 0.71 280.3 1.02 1.02 1.02 1.02 1.268.5z105-2 67.8 84 26 9 0.86 267.5 1.00 1.06 1.07 1.00 1.328.5z105-1 67.8 80 26 9 0.83 267.5 0.97 1.01 1.02 1.00 1.328.5z092-4 56.8 95 29 10 0.89 181.3 0.94 0.97 0.99 0.94 1.228.5z092-2 56.8 95 29 10 0.90 181.3 0.93 0.97 1.00 0.95 1.228.5z082-2 58.1 105 31 12 1.00 162.1 0.91 0.97 1.02 0.99 1.238.5z082-1 56.3 106 31 12 0.99 162.1 0.94 0.99 1.03 1.02 1.278.5z073-4 56.1 119 35 13 1.12 133.5 0.86 0.95 1.02 0.99 1.208.5z073-3 55.6 118 35 13 1.10 133.5 0.86 0.96 1.03 0.99 1.208.5z059-4 58.7 143 42 13 1.37 100.4 0.76 0.91 0.99 1.02 1.198.5z059-3 58.0 143 41 13 1.36 100.4 0.79 0.91 1.00 1.05 1.218.5z059-2 59.1 144 43 13 1.38 98.9 0.75 0.91 0.99 1.05 1.218.5z059-1 58.9 144 43 13 1.38 98.9 0.75 0.91 0.99 1.01 1.18
(b) 8.5 in. deep Zees – tests to determine panel-to-purlin fastener configuration specimen fy h/t bc/t dc/t λweb Mtest Mtest/My Mtest/Maisi Mtest/MS136 Mtest/MDSl Mtest/MDSd
8.5z073-6 54.0 118 35 13 1.08 121.2 0.81 0.88 0.94 0.92 1.128.5z073-5 55.6 117 35 13 1.09 121.2 0.78 0.85 0.91 0.88 1.088.5z073-4 56.1 119 35 13 1.12 133.5 0.86 0.95 1.02 0.99 1.208.5z073-3 55.6 118 35 13 1.10 133.5 0.86 0.96 1.03 0.99 1.208.5z073-2 54.8 118 35 13 1.09 123.1 0.81 0.89 0.95 0.92 1.128.5z073-1 55.7 119 35 13 1.11 123.1 0.80 0.88 0.95 0.92 1.11
(c )8.5 in. deep Zees – specimen damaged by eccentric preload before testing specimen fy h/t bc/t dc/t λweb Mtest Mtest/My Mtest/Maisi Mtest/MS136 Mtest/MDSl Mtest/MDSd
8.5z065-3 52.8 131 37 13 1.19 95.5 0.74 0.83 0.90 0.93 1.128.5z065-1 52.8 134 39 12 1.21 95.5 0.77 0.87 0.96 0.92 1.12
(d) 8 in. deep Cees – fy estimated from single coupon of each thickness (as of 7.24.01) specimen fy h/t bc/t dc/t λweb Mtest Mtest/My Mtest/Maisi Mtest/MS136 Mtest/MDSl Mtest/MDSd
8C097-3 61.1 82 21 6 0.80 172.3 1.02 1.05 1.06 1.02 1.268C097-2 61.1 82 22 6 0.80 172.3 1.01 1.04 1.05 1.01 1.278C068-5 53.0 110 28 7 1.00 103.6 0.95 0.99 1.04 1.01 1.228C068-4 53.0 110 28 7 1.00 103.6 0.95 0.99 1.05 1.00 1.218C068-2 53.0 106 27 7 0.97 98.3 0.88 0.91 0.96 0.94 1.138C068-1 51.3 106 27 7 0.95 98.3 0.89 0.93 0.97 0.95 1.158C054-8 46.6 118 29 8 1.008C054-7 46.6 140 36 10 1.208C054-6 46.6 136 35 10 1.168C054-1 46.6 131 33 9 1.128C043-6 46.0 163 41 11 1.38 51.1 0.79 0.93 1.03 1.05 1.158C043-5 46.7 162 41 11 1.39 51.1 0.76 0.90 0.99 0.98 1.058C043-4 46.0 160 40 11 1.368C043-3 47.3 170 43 11 1.46 47.8 0.74 0.92 0.99 0.98 1.048C043-2 46.0 160 40 10 1.358C043-1 46.1 169 42 11 1.43 47.8 0.75 0.90 0.98 0.99 1.05

Progress Report 2 - July 24, 2001 – Test Verification… 2-16
5.2 Direct Strength Table 4 and Table 5 present the summary statistics for the Direct Strength method (Schafer 2001). Failure by local buckling (MDSl) and by distortional buckling (MDSd) are both considered. The high test-to-predicted ratios for the distortional buckling strength (Mtest/MDSd) indicate that distortional buckling is successfully restricted with the testing details employed. If the member had failed in a distortional buckling mode the test-to-predicted ratio for Mtest/MDSd would be close to 1.0.
If one assumes that local buckling is the controlling failure mode, then the test-to-predicted performance of the Direct Strength method is quite good. Comparison against the wider body of flexural members (hats, decks, other Cees and Zees etc.) commonly presented for the Direct Strength method is completed in Figure 21. Results indicate that trends in the current experiments are consistent with those generally observed for cold-formed steel flexural members. In fact, the scatter around the predicted capacity is quite small, and these points include all data of Table 5 (i.e., they data includes damaged specimens, etc.).
0
0.5
1
1.5
0 1 2 3 4 5
Distortional
Local
Winter
Distortional Curve
Local Curve
Schafer (2001) testing
λma = M M
MM
test
y
Figure 21 Cee and Zee test data compared with other Direct Strength Predictions
5.3 Web Effective Width Full evaluation of the web effective width equations cannot be performed until Cee study 2 of Table 2 is complete. However, using the data collected to date, a preliminary evaluation of the web effective width expression can be completed. If we assume that the flange expressions are accurate, then we can use the experimentally observed capacity to back-calculate the correct effective width for the web, expressed as (b1+b2)/bcomp, where b1 and b2 are the effective width of the compressive portions of the web, and bcomp is the depth of the full compression portion of the web. The results of this calculation are given in Figure 22.
The majority of the bending strength is derived from the flange. Therefore, large changes are required in the web effective width in order to make a small change in the predicted bending capacity. For example, the AISI prediction for 8.5Z092, λweb=0.9, Mtest/Maisi = 0.97 is just 3% off in strength, but the predicted web effectiveness by AISI is 100% and the back-calculated experimental web effectiveness is 86% - a 14% difference! Therefore, the large differences between the two methods tend to get overstated when examining the web effective width in isolation, as in Figure 22. Nonetheless, to date, the collected data provides little support for the AISI (1996) prediction of 100% effective webs at higher web slenderness ratios. Again, it is cautioned that the above comments assume the expressions for the flange are 100% accurate – refer to section 2 for a summary of the problems with the existing flange expressions.

Progress Report 2 - July 24, 2001 – Test Verification… 2-17
0%
20%
40%
60%
80%
100%
120%
140%
0.60 0.70 0.80 0.90 1.00 1.10 1.20 1.30 1.40 1.50 1.60
web slenderness = λλλλweb = (fy/fcrweb)0.5
web
effe
ctiv
enes
s =
ρ ρ ρ ρ =
(b1+
b 2)/b
com
p (%
)
AISI (1996)S136 (1991)8" C8.5" Z
accuracy of web prediction, assuming AISI (1996) flange equations are 100% accurate
testing to determine panelto-purlin fastener
configuration
specimens damaged prior to testing
Figure 22 Back-calculated experimental web effective width vs. predictions
5.4 Continued Testing Completion of the testing on the 8 in. deep Cees including all tensile coupons is currently underway and expected in 2 weeks time. The testing on the second group of Cees, which will provide information over a wide range of h/b and h/t ratios will be next, and completion is expected by the end of August. At that time, a more detailed examination of the role of web/flange interaction will be possible; and the results will be communicated to the task group.
An additional set of LVDTs has been purchased so that the deformation of both specimens may be monitored during the loading, as well as any twist that develops as the specimens deform. These LVDTs will be employed in the next set of specimen tests. Further, strain gages will be placed on at least some of the remaining specimens, to further investigate the role of the web, flange, and lip in destabilizing the cross-section.
6 Conclusions Previous work demonstrates that many improvements in the elastic buckling and effective width calculation of Cees and Zees are still possible, and in many cases expressions are already available. Through computational and experimental means the developed testing plan and details have been shown to adequately restrict distortional buckling and provide a simple repeatable test that generates the local buckling flexural capacity for Cees and Zees. Definitive conclusions on the evaluation of existing methods for the effective width of webs await completion of the remaining testing, but based on the testing completed to date: overall test-to-predicted ratios for AISI, S136, and the Direct Strength method are all adequate, if the flange expressions are assumed accurate then the data supports a reduction in the web effectiveness similar to the S136 (1991) expressions as opposed to the AISI (1996) expressions.
7 Acknowledgments The sponsorship of AISI and MBMA and the donation of materials by Varco-Pruden, and Clark Steel is gratefully acknowledged. The assistance of the AISI task group in developing the testing plan is appreciated. Don Johnson, Maury Golovin, Joe Nunnery, Joe Wellinghoff, and Steve Thomas have all been helpful with their ideas and generous with their time. Johns Hopkins undergraduates: Liakos Ariston and Sam Phillips and graduate student Cheng Yu have provided additional support in the lab and deserve recognition as well. The assistance of Jack Spangler in re-invigorating the JHU structural testing facility has been invaluable. The donation of miscellaneous steel parts by Prosser Steel has also been invaluable.
Progress Report 3 March, 2002
Test Verification of the Effect of Stress Gradient on Webs of Cee and Zee Sections
submitted to the AISI and MBMA
by Cheng Yu and Ben Schafer
Background This is the final progress report for “Test Verification of the Effect of Stress Gradient on Webs of Cee and Zee Sections”. This report details the completion and analysis of the testing discussed in the first 2 progress reports. All materials used in the reports and additional explanatory materials are available online at www.ce.jhu.edu/bschafer.
Abstract C- and Z-sections are two of the most common cold-formed steel shapes in use today. Accurate prediction of the bending performance of these sections is important for reliable and efficient cold-formed steel structures. Recent analytical work has highlighted discontinuities and inconsistencies in the AISI (1996) design provisions for stiffened elements under a stress gradient (i.e., the web of C- or Z-sections). New methods have been proposed for design, and an interim method has been adopted in the NAS (North American Specification 2001). However, existing tests on Cs and Zs do not provide a definitive evaluation of the design expressions, due primarily to incomplete restriction of the distortional buckling mode. Described in this paper are a series of flexural tests with details selected specifically to insure that local buckling is free to form, but distortional buckling and lateral-torsional buckling are restricted. The members selected for the tests provide systematic variation in the web slenderness (h/t) while varying other relevant non-dimensional parameters (i.e., h/b, b/t, d/t, d/b). Initial analysis of the completed testing indicates that overall test-to-predicted ratios for AISI (1996), S136 (1994), NAS (2001) and the Direct Strength Method (Schafer 2002) are all adequate, but systematic error is observed in AISI and S136 due to web/flange interaction.
1 Introduction Determination of the ultimate bending capacity of cold-formed steel C- and Z-sections is complicated by yielding and the potential for local, distortional, and lateral-torsional buckling of the section (Figure 1). Local buckling is particularly prevalent and is characterized by the relatively short wavelength buckling of individual plate elements. Distortional buckling involves both translation and rotation at the compression flange/lip fold line of the member. It takes place as a consequence of distortion of a portion of the cross-section and predominately rigid response of a second portion (i.e. the flange/lip). The wavelength of distortional buckling is generally intermediate between that of local buckling and lateral-torsional buckling. Lateral-torsional buckling, or “global buckling,” occurs when the cross-section buckles without distortion.

Progress Report 3 – March, 2002 – Test Verification… 3-2
In Table 1 available experimental data is compared with the C- and Z-sections typically used in industry. A compilation of industry tests on purlins was reported by Elhouar and Murray (1985). This database of tests covers member geometries consistent with those used as purlins for metal building systems; however, the tested sections do not cover Z members reported by the Light Gauge Structural Institute (LGSI), nor the wider class of members reported in other industries. A large compilation of experimental data on Cs and Zs in flexure was summarized in Schafer and Peköz (1999). This database covers a broad range of geometric ratios, but does not include members with web height to flange width ratio (h/b) near 1.0.
100
101
102
103
0
0.5
1
1.5
half−wavelength (in.)
Mcr
/ M
y
AISI96 Ex. 1−10
My=112.82kip−in.
Local Mcr
/My=0.86 Distortional M
cr/M
y=0.65
Lateral−torsional
Figure 1 Buckling modes of the cold-formed steel beam
Existing tests on C- and Z-Sections generally focus on the performance of the compression flange and do not provide definitive evaluations of the design expressions for the web, due to: incomplete restriction of the distortional mode, arrangement of the specimens (back-to-back vs. toe- to-toe), and a general lack of information on bracing details. A series of new flexural tests focused on the role of web slenderness in local buckling failures of C- and Z-Sections are reported in this paper. Bracing has been carefully considered in these tests to insure that distortional buckling and lateral-torsional buckling do not influence the interpretation of results. The test results can be used for evaluation of existing and proposed methods for strength prediction of webs in local buckling. In addition, these tests can form the basis for later evaluations in which restrictions on the distortional mode are relieved.
Table 1 Range of geometry for industry members and available experimental data h/t b/t d/t h/b d/b
min max min max Min max min max min maxZ purlins 53 170 17 47 5 17 3.1 3.7 0.28 0.45C studs 25 318 11 132 1 33 1.0 10.9 0.12 0.33
Typical industry members Rack members 23 136 16 45 6 15 1.0 3.2 0.27 0.38
Elhouar & Murray (1985) 68 165 24 52 3 24 2.6 3.8 0.09 0.49Available experimental
data Schafer & Peköz (1999) 43 270 15 75 3 34 1.5 13.7 0.14 0.70

Progress Report 3 – March, 2002 – Test Verification… 3-3
2 Local Buckling Tests
2.1 Specimen Selection
The AISI (1996) Specification calculates the effective width of webs as a function of the web slenderness (h/t) alone. The proposed tests are designed to provide systematic variation in h/t while also varying the other non-dimensional parameters: web height vs. flange width ratio h/b, flange width vs. thickness ratio b/t, edge stiffener length vs. thickness ratio d/t, and edge stiffener vs. flange width ratio d/b, enough to determine the adequacy of existing and proposed design rules. The focus of the testing is on the webs, therefore significant variation in d/b is not investigated.
The primary consideration in investigating the web slenderness (h/t) is whether to achieve this variation by varying t, while holding h, b, d approximately constant or varying h while holding b, d and t approximately constant. Using industry standard sections dictates that studies on the Z-sections vary t, while holding h, b, and d approximately constant. However, the wide variety of C specimens commonly produced (SSMA standard sections, Table 1) allows both methods of variation to be examined for Cs.
2.2 Specimen dimensions
The dimensions of the specimens were recorded at the center of the specimen (mid-length) and mid-distance between the center and loading points (a total of three measurement locations for each specimen). The mean specimen dimensions, as determined from the three sets of measurements within the constant moment region are given in Table 2. The variables used for the dimensions are defined as follows:
h out-to-out web depth bc out-to-out compression flange width dc out-to-out compression flange lip stiffener length θc compression flange stiffener angle from horizontal bt out-to-out tension flange width dt out-to-out compression flange lip stiffener length θt tension flange stiffener angle from horizontal rhc outer radius between web and compression flange rdc outer radius between compression flange and lip rht outer radius between web and tension flange rdt outer radius between tension flange and lip
The variables used for the metal properties are defined as follows: t base metal thickness fy yield stress E modulus of elasticity

Progress Report 3 – March, 2002 – Test Verification… 3-4
t t
h h
rht
rdt rht
rdt
btbt
θt
bc bc
dtdt
rhc rdc θc
rhc rdcdc
θt
dc
θc
Figure 2 Definitions of specimen dimensions for Z and C
Figure 3 Dimension of panel
2.3 Testing Details
The basic testing setup is illustrated in Figure 4 through Figure 7. The 16 ft. span length, four-point bending test, consists of a pair of 18 ft. long C or Z specimens in parallel loaded at the ⅓ points. The members are oriented in an opposed fashion; such that in-plane rotation of the Cs or Zs lead to tension in the panel, and thus provide additional restriction against distortional buckling of the compression flange. Small angles (1¼ × 1¼ × 0.057 in.) are attached to the tension flanges every 12 in. and a through-fastened panel (t = 0.019 in., 1¼ in. high ribs, Figure 3) is attached to the compression flanges. Hot-rolled tube sections (10 × 7½ × 6 × ¼ in) bolt the pair of C or Z members together at the load points and the supports, and insure shear and web crippling problems are avoided at these locations. When testing the Cs, the hot-rolled angles detailed in Figure 6 connect to the tube and the end plate on the inside of the tube, instead of the outside of the tube, as detailed for the Z specimens.
After initial testing the details were improved to insure pure bending was maintained, and to restrict distortional and lateral-torsional buckling. Major improvements were made on the panel-to-purlin fastener configuration (see detail in subsequent section). The arrangement of rollers at the supports was modified to more closely model a pin-roller configuration (Figure 9). Additional web stiffening bars were added to the I-beams at the supports and load points. Machined, quarter-round aluminum blocks were placed as guides for the rollers at the loading points (Figure 10). Thin Teflon sheets were added at the load points and support points to limit unwanted friction and help insure the boundary conditions were predictable (Figure 9and Figure 10).

Progress Report 3 – March, 2002 – Test Verification… 3-5
Table 2 Measured Geometry Test label Specimen h bc dc θc bt dt θt rhc rdc rht rdt t fy
8.5Z120-3E2W 8.5Z120-3 8.44 2.58 0.96 47.2 2.46 0.99 48.9 0.36 0.36 0.35 0.35 0.1183 61.3 8.5Z120-2 8.47 2.59 0.96 47.8 2.46 1.00 48.9 0.36 0.36 0.34 0.34 0.1180 60.1
8.5Z105-2E1W 8.5Z105-2 8.48 2.66 0.95 50.5 2.36 0.95 48.7 0.32 0.32 0.34 0.34 0.1040 68.8 8.5Z105-1 8.42 2.69 0.97 50.7 2.36 0.91 48.7 0.31 0.31 0.34 0.34 0.1050 66.8
8.5Z092-4E2W 8.5Z092-4 8.41 2.61 0.93 53.0 2.41 0.96 50.8 0.29 0.29 0.31 0.31 0.0900 57.3 8.5Z092-2 8.43 2.61 0.92 51.8 2.40 0.95 50.4 0.28 0.28 0.31 0.31 0.0887 57.0
8.5Z082-1E2W 8.5Z082-1 8.46 2.50 0.95 49.0 2.36 0.97 50.3 0.28 0.28 0.30 0.30 0.0801 58.4 8.5Z082-2 8.45 2.51 0.95 47.9 2.40 0.95 52.4 0.28 0.28 0.30 0.30 0.0804 58.1
8.5Z073-6E5W 8.5Z073-6 8.50 2.52 0.92 49.6 2.40 0.94 50.9 0.28 0.28 0.30 0.30 0.0720 54.0 8.5Z073-5 8.50 2.52 0.92 49.6 2.40 0.94 50.9 0.28 0.28 0.30 0.30 0.0727 55.6
8.5Z073-4E3W 8.5Z073-4 8.51 2.53 0.93 49.6 2.41 0.92 50.3 0.28 0.28 0.29 0.29 0.0715 56.1 8.5Z073-3 8.50 2.53 0.91 50.1 2.38 0.96 51.0 0.28 0.28 0.30 0.30 0.0720 55.6
8.5Z073-1E2W 8.5Z073-2 8.50 2.54 0.93 50.2 2.41 0.92 51.0 0.28 0.28 0.30 0.30 0.0715 55.7 8.5Z073-1 8.49 2.50 0.92 48.4 2.41 0.95 51.2 0.28 0.28 0.30 0.30 0.0720 54.8
8.5Z065-3E1W 8.5Z065-3 8.47 2.42 0.83 47.3 2.43 0.79 47.3 0.27 0.27 0.28 0.28 0.0640 53.5 8.5Z065-1 8.47 2.44 0.76 47.4 2.43 0.84 47.1 0.28 0.28 0.27 0.27 0.0640 53.1
8.5Z059-4E3W 8.5Z059-4 8.50 2.50 0.77 50.9 2.35 0.72 48.9 0.28 0.28 0.28 0.28 0.0590 58.6 8.5Z059-3 8.50 2.44 0.78 50.2 2.22 0.69 50.4 0.28 0.28 0.28 0.28 0.0595 58.5
8.5Z059-2E1W 8.5Z059-2 8.49 2.51 0.78 50.6 2.33 0.70 50.2 0.28 0.28 0.28 0.28 0.0590 59.1 8.5Z059-1 8.50 2.51 0.78 51.2 2.33 0.71 49.4 0.28 0.28 0.28 0.28 0.0590 58.9
8C097-2E3W 8C097-2 8.04 2.12 0.57 85.6 2.08 0.52 85.7 0.30 0.28 0.28 0.30 0.0980 59.9 8C097-3 8.03 2.09 0.56 84.0 2.08 0.54 88.2 0.30 0.28 0.28 0.29 0.0940 59.6
8C068-4E5W 8C068-4 8.03 2.03 0.52 83.2 2.04 0.53 87.0 0.28 0.25 0.24 0.24 0.0750 48.6 8C068-5 8.01 2.05 0.52 84.0 2.04 0.54 87.6 0.27 0.26 0.24 0.27 0.0770 53.1
8C068-1E2W 8C068-2 8.02 2.04 0.52 83.4 2.04 0.53 87.6 0.28 0.25 0.24 0.26 0.0758 51.7 8C068-1 8.03 2.03 0.53 83.1 2.05 0.53 88.1 0.30 0.26 0.25 0.26 0.0754 51.4
8C054-1E8W 8C054-1 8.00 2.04 0.52 88.9 2.07 0.50 84.7 0.22 0.23 0.23 0.23 0.0550 40.0 8C054-8 8.08 2.02 0.58 88.1 1.96 0.48 82.3 0.22 0.20 0.22 0.23 0.0540 40.3
8C043-5E6W 8C043-5 8.04 2.02 0.53 88.8 1.98 0.53 87.3 0.18 0.20 0.21 0.20 0.0496 44.9 8C043-6 8.06 2.01 0.53 88.9 2.00 0.46 87.0 0.19 0.20 0.22 0.20 0.0490 45.0
8C043-3E1W 8C043-3 8.04 2.02 0.54 89.3 2.01 0.53 87.5 0.19 0.19 0.19 0.19 0.0474 46.0 8C043-1 8.03 2.02 0.54 89.0 1.98 0.54 85.8 0.19 0.19 0.29 0.19 0.0476 45.7
12C068-9E5W 12C068-9 12.02 1.92 0.53 82.0 2.00 0.55 85.3 0.28 0.27 0.30 0.28 0.0652 35.1 12C068-5 12.00 1.79 0.55 85.9 2.06 0.53 94.8 0.27 0.27 0.22 0.27 0.0654 35.0
12C068-3E4W 12C068-3 11.97 1.96 0.59 82.5 1.99 0.56 77.4 0.26 0.27 0.27 0.27 0.0671 56.6 12C068-4 12.02 2.01 0.52 80.6 2.00 0.52 83.3 0.26 0.27 0.26 0.27 0.0670 57.3
10C068-2E1W 10C068-2 10.08 1.93 0.50 83.2 1.98 0.52 83.3 0.27 0.25 0.27 0.25 0.0572 33.6 10C068-1 10.03 2.04 0.55 80.7 1.97 0.54 81.9 0.27 0.26 0.28 0.25 0.0573 34.2
6C054-2E1W 6C054-2 6.04 2.00 0.56 85.7 2.00 0.52 90.0 0.21 0.24 0.26 0.25 0.0616 36.1 6C054-1 6.03 2.01 0.56 86.5 2.05 0.52 90.5 0.22 0.25 0.25 0.24 0.0616 37.0
4C054-1E2W 4C054-1 3.95 1.99 0.55 79.2 2.02 0.55 77.4 0.24 0.24 0.23 0.24 0.0551 45.0 4C054-2 3.96 1.95 0.50 74.2 1.96 0.55 74.8 0.22 0.27 0.25 0.25 0.0561 44.7
3.62C054-1E2W 3.62C054-1 3.65 1.97 0.49 77.1 2.00 0.42 88.1 0.23 0.26 0.26 0.25 0.0555 32.8 3.62C054-2 3.67 1.99 0.51 79.8 1.97 0.44 79.8 0.24 0.25 0.26 0.26 0.0554 32.0
11.5Z092-1E2W 11.5Z092-1 11.41 3.33 0.96 50.1 3.51 0.96 49.5 0.25 0.27 0.27 0.27 0.1027 61.0 11.5Z092-2 11.34 3.33 0.98 48.3 3.54 0.89 48.1 0.28 0.27 0.28 0.28 0.1033 60.4
11.5Z082-2E1W 11.5Z082-2 11.45 3.50 0.88 50.3 3.45 0.87 52.2 0.31 0.31 0.35 0.35 0.0837 61.5 11.5Z082-1 11.47 3.49 0.90 50.6 3.43 0.88 51.0 0.32 0.32 0.35 0.35 0.0839 60.4
11.5Z073-2E1W 11.5Z073-2 11.39 3.51 0.87 46.0 3.35 0.83 44.8 0.27 0.28 0.27 0.28 0.0709 65.4 11.5Z073-1 11.35 3.52 0.95 45.4 3.40 0.90 44.2 0.27 0.11 0.27 0.07 0.0695 66.8
Note: Typical specimen label is xZ(or C)xxx-x. For example, 8.5Z073-1 means the specimen is 8.5 in. high for the web, Z- section, 0.073in. thick and the beam number is 1 (used to distinguish with other specimens with same dimensions). Typical test label is xZ(or C)xxx-xExW. For example, test 8.5Z073-1E2W means the two paired specimens are 8.5Z073-1 at the east side and 8.5Z073-2 at the west side.
The loading system employs a 20 kip MTS actuator, which has a maximum 6 in. stroke. The test is performed in displacement control at a rate of 0.0015 in./sec. A MTS 407 controller and load cell monitors the force and insures the desired displacement control is met. Meanwhile, deflections for one specimen at the ⅓ points were measured using two LVDTs (later, for the 10 in. C and 11.5 in. Z beam tests the 2 LVDTs were replaced by 4 position transducers). For a limited number of tests, strain gages were placed at mid-span, on the lip and the top of the web, at the same vertical cross-section height, to monitor the longitudinal strain. A Labview program was written to control the actuator as well as monitor and record the test data (Figure 8).
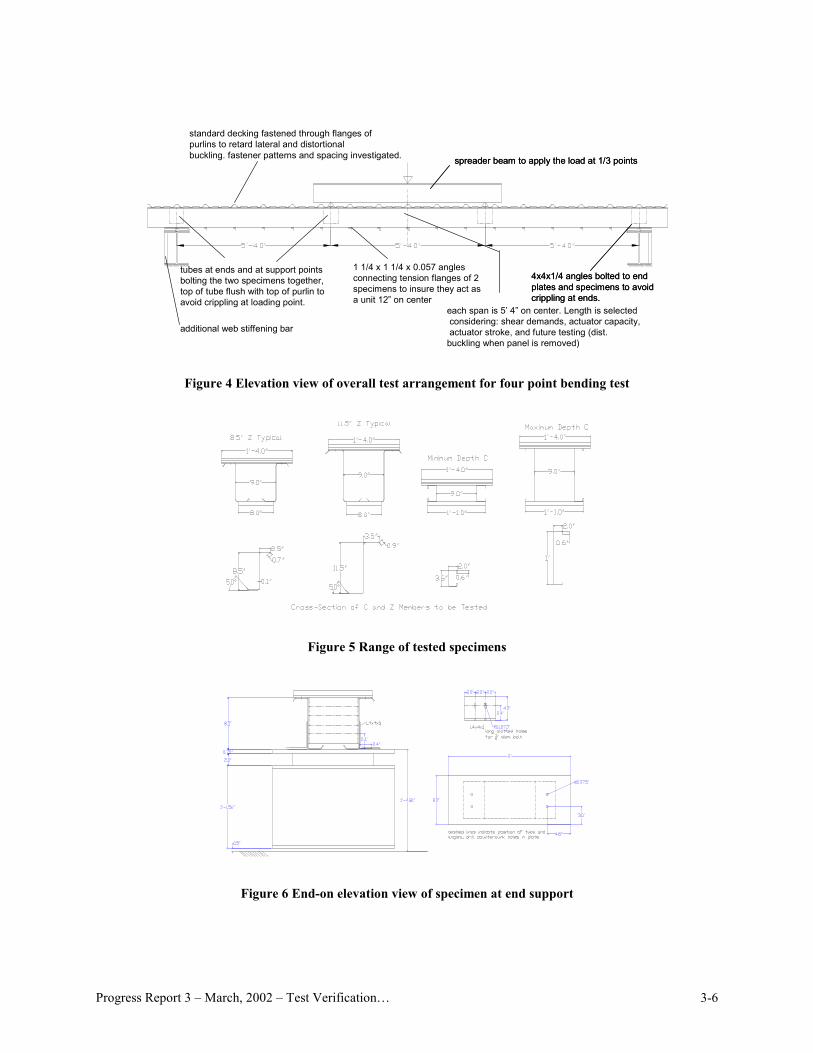
Progress Report 3 – March, 2002 – Test Verification… 3-6
spreader beam to apply the load at 1/3 pointsspreader beam to apply the load at 1/3 points
tubes at ends and at support pointsbolting the two specimens together,top of tube flush with top of purlin toavoid crippling at loading point.
4x4x1/4 angles bolted to endplates and specimens to avoidcrippling at ends.
4x4x1/4 angles bolted to endplates and specimens to avoidcrippling at ends.
1 1/4 x 1 1/4 x 0.057 anglesconnecting tension flanges of 2specimens to insure they act asa unit 12” on center
standard decking fastened through flanges ofpurlins to retard lateral and distortional buckling. fastener patterns and spacing investigated.
each span is 5’ 4” on center. Length is selectedconsidering: shear demands, actuator capacity,actuator stroke, and future testing (dist.
buckling when panel is removed)additional web stiffening bar
Figure 4 Elevation view of overall test arrangement for four point bending test
Figure 5 Range of tested specimens
Figure 6 End-on elevation view of specimen at end support

Progress Report 3 – March, 2002 – Test Verification… 3-7
Figure 7 Overall view of test setup Figure 8 Labview program interface
Figure 9 Support configuration
Figure 10 Loading point configuration
2.4 Panel-to-Purlin Fastener Configuration
A series of tests on the 8.5 in. deep Zs with t = 0.073 in. was conducted in order to determine the appropriate panel-to-purlin fastener detail for restricting the distortional mode. Initial testing using single panel-to-purlin fasteners placed through the center of the purlin flange and spaced at 12 in. o.c. failed at a capacity of 89% of the AISI prediction and visually appeared to suffer from deformations consistent with distortional buckling. Elastic finite element analysis (Figure 11) indicated that the lowest elastic buckling mode for this fastener detail was distortional buckling. Additional analysis indicated that a pair of fasteners placed on either side of the raised ribs of the panel (Figure 12 and Figure 13) would cause local buckling to be the lowest mode. Testing confirmed this prediction; paired fasteners as shown in Figure 13 provided a capacity 10% greater than single fasteners and 98% of the AISI (1996) prediction. Fasteners in the center of the panel pans did not further improve the results. Additionally, modeling indicates that the paired fasteners do not change the local buckling mode; thus, it can be safely assumed that this configuration restricts distortional buckling without artificially increasing the local buckling strength.
The selected standard panel-to-purlin fastener detail is a pair of screws placed 1.5 in. (2.5 in. for Z-section) apart and spaced 8 in. away from a second pair in the pan of the deck, as show in Figure 13. The paired fastener configuration is only maintained inside the constant moment region of the test. In the shear span, one screw is used instead of one pair at the same location as that of the constant moment region.

Progress Report 3 – March, 2002 – Test Verification… 3-8
Figure 11 Lowest buckling mode predicted by FE model for single screw fastener configuration (note
center panels removed for visual clarity only, dots indicate fastener locations.)
Figure 12 Lowest buckling mode predicted by FE model for paired screw fastener configuration (note
center panels removed for visual clarity only, dots indicate fastener locations.)
1.5 in.
8 in.
Figure 13 Selected standard panel-to-purlin and panel-to-panel fastener configuration (C-section)
3 Tension Tests Tension tests were carried out following “ASTM E8–00 Standard Test Methods for Tension Testing of Metallic Material.” The dimensions of a typical tensile coupon are shown in Figure 15. Three tensile coupons were taken from the end of each specimen: one from the web flat, one from the compression flange flat, and one from the tension flange flat. A screw-driven ATS 900; with a maximum capacity of 10 kips was used for the loading. An
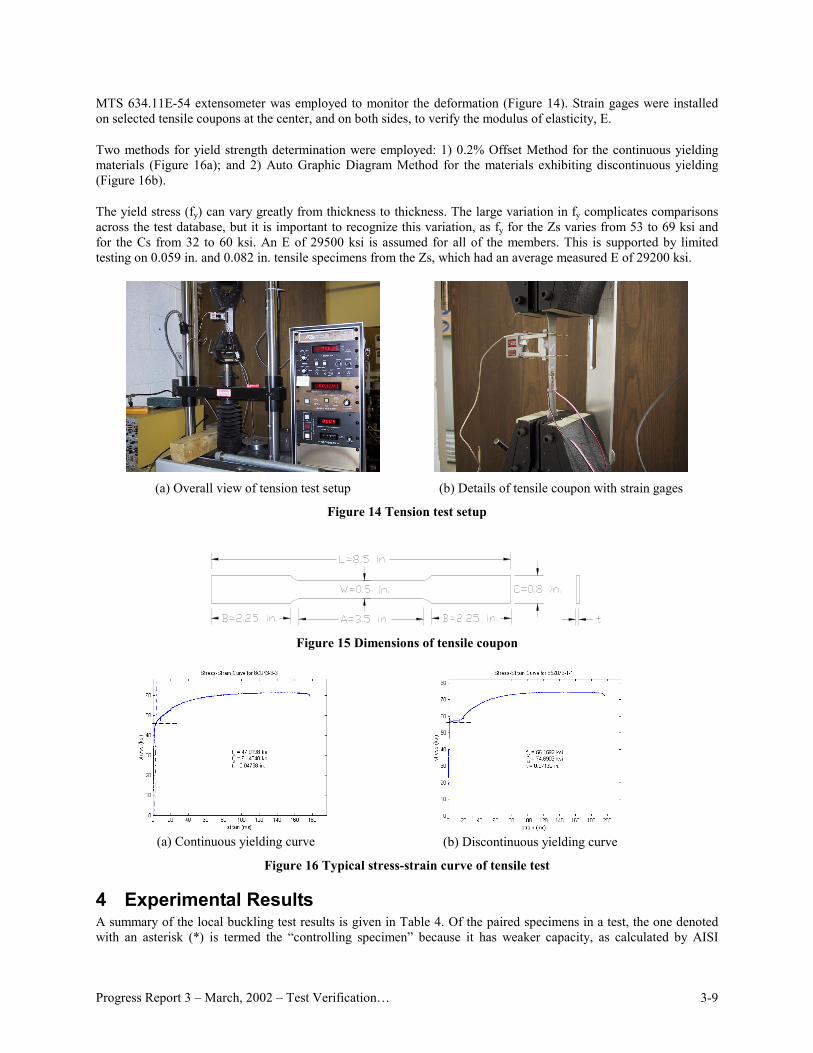
Progress Report 3 – March, 2002 – Test Verification… 3-9
MTS 634.11E-54 extensometer was employed to monitor the deformation (Figure 14). Strain gages were installed on selected tensile coupons at the center, and on both sides, to verify the modulus of elasticity, E.
Two methods for yield strength determination were employed: 1) 0.2% Offset Method for the continuous yielding materials (Figure 16a); and 2) Auto Graphic Diagram Method for the materials exhibiting discontinuous yielding (Figure 16b).
The yield stress (fy) can vary greatly from thickness to thickness. The large variation in fy complicates comparisons across the test database, but it is important to recognize this variation, as fy for the Zs varies from 53 to 69 ksi and for the Cs from 32 to 60 ksi. An E of 29500 ksi is assumed for all of the members. This is supported by limited testing on 0.059 in. and 0.082 in. tensile specimens from the Zs, which had an average measured E of 29200 ksi.
(a) Overall view of tension test setup
(b) Details of tensile coupon with strain gages
Figure 14 Tension test setup
Figure 15 Dimensions of tensile coupon
(a) Continuous yielding curve
(b) Discontinuous yielding curve
Figure 16 Typical stress-strain curve of tensile test
4 Experimental Results A summary of the local buckling test results is given in Table 4. Of the paired specimens in a test, the one denoted with an asterisk (*) is termed the “controlling specimen” because it has weaker capacity, as calculated by AISI

Progress Report 3 – March, 2002 – Test Verification… 3-10
(1996). The controlling specimens’ data, selected from tests with expected configurations (gray items in Table 4), are used to examine the design methods.
The actuator load-displacement response is given in Figure 18, 19 and 20. Little non-linear response is observed prior to formation of the failure mechanism. The specimens, which have a tested capacity at or near the yield moment (Mtest/My ~ 1), exhibit the most nonlinear deformation prior to failure; while the more slender specimens have essentially elastic response prior to formation of a sudden failure mechanism.
Failure of the weaker specimen, results in a significant loss in capacity. Redistribution of load into the second specimen of the pair causes failure soon thereafter. Failure of the second specimen can be recognized by the change in slope of the post-peak load-deformation response. In the studied members the post-peak response of the Cs was generally more gradual than comparable Zs, even in the thinner specimens. In tests on the Cs both specimens tend to fail at approximately the same time, as opposed to the progressive failure observed in most Zs. The observed failure mechanisms for the Cs are shown in Figure 23 (see Figure 22 for the Zs). The failure mechanism of the Cs is similar, but not identical to the Zs.
Strain gages were placed at midspan, on the lip and the top of the web, at the same vertical cross-section height, on nine C members, to monitor the longitudinal strain. Typical output from the gages is given in Figure 17. In the initial elastic range the gages read nearly identical and agree with simple beam theory predictions, indicating that the testing arrangement is achieving the desired loading about the geometric axis and no twisting is developing in the section. At an intermediate load level, before buckling deformations were visible, strain on either the lip or web began to reverse. In most, but not all, the strain on the lip began to reverse prior to the web. Once buckling initiates the strain distribution varies around the profile and along the length, and it becomes difficult to provide definitive conclusions from the limited strain data.

Progress Report 3 – March, 2002 – Test Verification… 3-11
Table 3 Summary of tension test results specimen t (in) fy (ksi) fu (ksi) fu/fy ratio
Deck1 0.0182 101.24 104.21 103% Deck2 0.0183 100.72 101.54 101%
8.5Z120-3 0.1183 61.34 84.27 137% 8.5Z120-2 0.1176 60.05 82.56 137% 8.5Z105-2 0.1038 68.84 91.30 133% 8.5Z105-1 0.1048 66.85 89.13 133% 8.5Z092-4 0.0901 57.36 72.30 126% 8.5Z092-2 0.0891 56.99 71.91 126% 8.5Z082-2 0.0804 58.10 74.04 127% 8.5Z082-1 0.0806 58.37 74.01 127% 8.5Z073-6 0.0720 54.02 72.63 134% 8.5Z073-5 0.0727 55.58 73.62 132% 8.5Z073-4 0.0715 56.15 74.68 133% 8.5Z073-3 0.0720 55.55 74.33 134% 8.5Z073-2 0.0720 54.78 73.15 134% 8.5Z073-1 0.0715 55.66 74.07 133% 8.5Z065-3 0.0644 53.52 68.86 129% 8.5Z065-1 0.0642 53.07 68.58 129% 8.5Z059-4 0.0595 58.63 80.89 138% 8.5Z059-3 0.0595 58.46 81.03 139% 8.5Z059-2 0.0590 59.10 80.83 137% 8.5Z059-1 0.0590 58.90 80.58 137% 8C097-3 0.0936 59.64 76.12 128% 8C097-2 0.0978 59.89 76.69 128% 8C068-5 0.0755 48.58 64.58 133% 8C068-4 0.0768 53.05 66.25 125% 8C068-2 0.0753 51.43 65.95 128% 8C068-1 0.0757 51.75 65.34 126% 8C054-8 0.0540 40.35 52.75 131% 8C054-4 0.0591 46.61 60.95 131% 8C054-1 0.0545 40.04 52.05 130% 8C043-6 0.0491 45.04 60.78 135% 8C043-5 0.0496 44.85 60.97 136% 8C043-3 0.0472 45.96 61.48 134% 8C043-1 0.0475 45.68 61.33 134% 6C054-2 0.0616 36.10 50.33 139% 6C054-1 0.0616 36.96 50.01 135% 4C054-2 0.0561 44.71 54.54 122% 4C054-1 0.0551 44.97 55.49 123%
3.62C054-2 0.0554 31.98 54.11 169% 3.62C054-1 0.0555 32.77 53.91 165% 12C068-9 0.0652 35.08 58.50 167% 12C068-5 0.0654 34.86 58.63 168% 12C068-4 0.0670 57.28 75.93 133% 12C068-3 0.0671 56.64 74.90 132% 10C068-2 0.0572 33.56 57.32 171% 10C068-1 0.0573 34.19 56.93 167%
11.5Z073-1 0.0695 66.82 84.55 127% 11.5Z073-2 0.0709 65.40 82.82 127% 11.5Z082-1 0.0838 60.43 79.92 132% 11.5Z082-2 0.0837 61.49 81.00 132% 11.5Z092-1 0.1027 61.02 78.54 129% 11.5Z092-2 0.1033 60.42 78.00 129%

Progress Report 3 – March, 2002 – Test Verification… 3-12
(a) t=0.097 in. (test 8C097-2E3W) first failure occurred in this specimen near the strain gages
(b) t=0.068 in. (test 8C068-4E5W) first failure
occurred in the other beam of the pair
Figure 17 Strain on web and lip for tests on 8 in. deep Cs
(a) t=0.120 in. (Mtest/My=1.02)
(b) t=0.105 in. (Mtest/My=1.00)
(c) t=0.092 in. (Mtest/My=0.94)
(d) t=0.082 in. (Mtest/My=0.94)
(e) t=0.073 in. (Mtest/My=0.86)
(f) t=0.059 in. (Mtest/My=0.79)
Figure 18 Actuator force-displacement response for tests of 8.5 in. deep Zs

Progress Report 3 – March, 2002 – Test Verification… 3-13
(a) t=0.097 in. (Mtest/My=1.04)
(b) t=0.068 in. (Mtest/My=0.91)
(c) t=0.054 in. (Mtest/My=0.90)
(d) t=0.043 in. (Mtest/My=0.81)
Figure 19 Actuator force-displacement response for tests of 8 in. deep Cs
(a) h=12 in. (Mtest/My=0.71)
(b) h=10 in. (Mtest/My=0.6)
(c) h=8 in. (Mtest/My=0.90)
(d) h=6 in. (Mtest/My=1.06)
(e) h=4 in. (Mtest/My=1.03)
(f) h=3.62 in. (Mtest/My=1.16)
Figure 20 Actuator force-displacement response for tests of 3.62 to 12 in. deep Cs

Progress Report 3 – March, 2002 – Test Verification… 3-14
(a) t=0.073 in. (Mtest/My=0.62 )
(b) t=0.082 in. (Mtest/My=0.79 )
(c) t=0.092 in. (Mtest/My=0.85 )
Figure 21 Actuator force-displacement response for tests of 11.5 in. deep Zs
(a) Collapse of 8.5 in. Z, t = 0.073 in.
(nominal)
(b) Collapse of 8.5 in. Z, t=0.059 in.
(nominal)
Figure 22 Collapses of 8.5 in. Zs t=0.073, 0.059 in.
(a) t=0.097 in (test 8C097-2E3W)
(b) t=0.043 in (test 8C043-5E6W)
Figure 23 Observed failure mechanisms for tests on 8 in. deep Cs

Progress Report 3 – March, 2002 – Test Verification… 3-15
Table 4 Local buckling test results
Test label Panel type Specimen Mtest My Mcrl Mcrd Mtest/
My Mtest/Maisi
Mtest/ MS136
Mtest/ MNAS'01
Mtest/ MDSl
Mtest/ MDSd
8.5Z120-3E2W C 8.5Z120-3 280.3 268 727 391 1.05 1.05 1.05 1.05 1.05 1.22 8.5Z120-2 * 280.3 264 722 391 1.06 1.06 1.06 1.06 1.06 1.23
8.5Z105-2E1W C 8.5Z105-2 267.5 270 480 293 0.99 1.05 1.07 1.04 0.99 1.28 8.5Z105-1 * 267.5 264 487 295 1.01 1.06 1.07 1.06 1.01 1.29
8.5Z092-4E2W C 8.5Z092-4 181.3 192 321 217 0.94 0.98 1.01 0.98 0.94 1.20 8.5Z092-2 * 181.3 189 306 208 0.96 1.01 1.04 1.01 0.97 1.23
8.5Z082-1E2W C 8.5Z082-1 * 162.1 174 226 170 0.93 1.00 1.05 1.00 1.01 1.25 8.5Z082-2 162.1 174 229 174 0.93 1.00 1.05 0.99 1.00 1.24
8.5Z073-6E5W A 8.5Z073-6 * 121.2 146 165 133 0.83 0.92 0.99 0.91 0.94 1.15 8.5Z073-5 121.2 152 170 136 0.80 0.89 0.96 0.88 0.91 1.11
8.5Z073-4E3W C 8.5Z073-4 133.5 151 161 129 0.88 0.98 1.06 0.98 1.02 1.26 8.5Z073-3 * 133.5 150 165 135 0.89 1.00 1.08 0.99 1.01 1.24
8.5Z073-1E2W B 8.5Z073-2 * 123.1 150 161 130 0.82 0.91 0.98 0.91 0.94 1.16 8.5Z073-1 123.1 147 166 134 0.84 0.92 0.99 0.92 0.94 1.16
8.5Z065-3E1W C 8.5Z065-3 95.5 125 115 90 0.77 0.86 0.96 0.86 0.93 1.18 8.5Z065-1 * 95.5 123 117 92 0.78 0.89 0.99 0.89 0.93 1.17
8.5Z059-4E3W C 8.5Z059-4 * 100.4 126 87 74 0.79 0.98 1.07 0.98 1.06 1.34 8.5Z059-3 100.4 125 86 76 0.80 0.97 1.06 0.97 1.07 1.33
8.5Z059-2E1W D 8.5Z059-2 98.9 127 86 74 0.78 0.96 1.04 0.96 1.04 1.32 8.5Z059-1 * 98.9 127 86 74 0.78 0.96 1.04 0.96 1.04 1.32
8C097-2E3W C 8C097-2 # 172.3 166 334 241 1.04 1.07 1.08 1.07 1.04 1.21 8C097-3 * 172.3 157 308 226 1.10 1.13 1.15 1.13 1.10 1.28
8C068-4E5W C 8C068-4 # 103.6 102 162 136 1.02 1.05 1.10 1.05 1.03 1.22 8C068-5 * 103.6 114 176 146 0.91 0.95 0.99 0.95 0.93 1.10
8C068-1E2W C 8C068-2 * 98.3 109 166 139 0.90 0.94 0.98 0.94 0.93 1.10 8C068-1 98.3 108 165 137 0.91 0.94 0.98 0.94 0.94 1.11
8C054-1E8W C 8C054-1 *# 55.9 62 65 65 0.90 0.97 1.07 0.95 1.04 1.17 8C054-8 55.9 63 59 61 0.89 0.93 1.02 0.93 1.07 1.20
8C043-5E6W C 8C043-5 51.1 64 47 51 0.80 0.95 1.04 0.95 1.05 1.17 8C043-6 * 51.1 63 44 48 0.81 0.96 1.06 1.06 1.07 1.21
8C043-3E1W C 8C043-3 47.8 63 41 45 0.76 0.93 1.01 0.93 1.03 1.17 8C043-1 *# 47.8 62 41 45 0.77 0.93 1.01 0.93 1.04 1.17
12C068-9E5W C 12C068-9 * 104.1 113 88 115 0.92 0.95 1.08 1.08 1.18 1.32 12C068-5 # 104.1 110 90 122 0.95 0.98 1.12 1.12 1.19 1.33
12C068-3E4W C 12C068-3 136.7 190 96 131 0.72 0.86 0.93 0.93 1.07 1.25 12C068-4 * 136.7 192 94 121 0.71 0.90 0.97 0.95 1.07 1.28
10C068-2E1W C 10C068-2 70.1 73 65 121 0.96 0.98 1.11 1.11 1.18 1.28 10C068-1 * 70.1 76 65 131 0.92 0.94 1.06 1.06 1.14 1.23
6C054-2E1W C 6C054-2 *# 44.8 42 101 87 1.06 1.09 1.09 1.09 1.06 1.16 6C054-1 44.8 43 102 81 1.04 1.06 1.06 1.06 1.04 1.14
4C054-1E2W D 4C054-1 27.7 27 66 43 1.02 1.11 1.11 1.10 1.02 1.15 4C054-2 *# 27.7 27 73 45 1.03 1.13 1.13 1.11 1.03 1.15
3.62C054-1E2W D 3.62C054-1 *# 20.2 17 64 38 1.16 1.20 1.20 1.20 1.16 1.24 3.62C054-2 20.2 17 65 41 1.17 1.20 1.20 1.20 1.17 1.24
11.5Z092-1E2W! C 11.5Z092-1 352.0 414 474 115 0.85 0.99 1.10 0.99 0.96 1.30 11.5Z092-2* 352.0 409 477 122 0.86 1.00 1.10 1.00 0.96 1.34
11.5Z082-2E1W C 11.5Z082-2* 274.0 345 252 121 0.79 1.05 1.13 1.05 1.04 1.38 11.5Z082-1 274.0 341 253 131 0.80 1.04 1.13 1.04 1.04 1.39
11.5Z073-2E1W C 11.5Z073-2* 193.9 311 150 115 0.62 0.96 1.01 0.96 0.94 1.31 11.5Z073-1# 193.9 315 144 122 0.62 0.96 1.00 0.96 0.95 1.30
Note: Grey items are the final effective data. !: Result is estimated due to peak load exceeds the recording range. *: Controlling specimens #: Strain gages were placed at midspan, on the lip and the top of the web, at the same vertical cross-section height Panel fastener type: A: one screw on the lapped side of raised corrugation B: one screw on each side of raised corrugation C: two screws on each side of raised corrugation in the constant moment region, one screw on each side of raised corrugation in
the shear spans D: two screws on each side of raised corrugation, and two screws in center of pans for the constant moment region, one screw on
each side of raised corrugation in the shear span

Progress Report 3 – March, 2002 – Test Verification… 3-16
5 Comparison with Design Methods Four design methods were considered for comparison: the existing American Specification (AISI 1996), the existing Canadian Standard (S136 1994), the newly adopted combined U.S./Canada/Mexico - North American Specification (NAS 2001) and the recently proposed Direct Strength Method (Schafer and Peköz 1998, Schafer 2002a,b).
5.1 Test-to-predicted
The average (µ) and standard deviation (σ) of the test-to-predicted ratios indicate that overall, all considered methods provide an adequate prediction of the test data. The test-to-predicted ratios for AISI and S136 are graphically depicted in Figure 24. NAS results are close to AISI when h/bc is less than 4; otherwise they will be close to S136 results. The AISI and S136 methods are identical except for the expressions for the effective width of the web. The S136 method assumes the web is partially effective for λweb > 0.673 while the AISI method does not. The AISI has systematically higher predictions than S136 for the slender specimens. The average strength difference between the AISI and S136 predictions is 7%, with AISI having a test-to-predicted ratio slightly less than 1.0 and that of S136 greater than 1.0.
Table 4 and Table 5 present the summary statistics for the Direct Strength Method. Failures by local buckling (MDSl) and by distortional buckling (MDSd) are both considered. The high test-to-predicted ratios for the distortional buckling strength (Mtest/MDSd) indicate that distortional buckling is successfully restricted with the testing details employed. Further, it indicates that without the fastener details in place the expected strength would be significantly reduced.
0
0.2
0.4
0.6
0.8
1
1.2
1.4
0.4 0.6 0.8 1 1.2 1.4 1.6 1.8
web slenderness = λλλλweb = (fy/fcrweb)0.5
test
-to-p
redi
cted
ratio
AISI (1996)S136 (1994)
unslender specimens
Figure 24 Test-to-predicted ratios vs. web slenderness for slender specimens

Progress Report 3 – March, 2002 – Test Verification… 3-17
Table 5 Summary of test-to-predicted ratios for existing and proposed design methods µ σ Mtest/MAISI Mtest/MS136 Mtest/MNAS Mtest/MDSl Mtest/MDSd Mtest/MAISI Mtest/MS136 Mtest/MNAS Mtest/MDSl Mtest/MDSd
Controlling 1.11 1.12 1.11 1.07 1.22 0.05 0.05 0.05 0.05 0.06 Unslender N=6 Second 1.09 1.09 1.09 1.05 1.21 0.06 0.06 0.06 0.06 0.05
Controlling 0.97 1.04 0.98 1.02 1.25 0.04 0.04 0.05 0.07 0.08 Slender N=15 Second 0.96 1.04 0.98 1.03 1.25 0.05 0.06 0.07 0.07 0.08
Note: Slender: the specimens with Mtest/My<1.0 (total N=15 tests) Unslender: the specimens with Mtest/My>=1.0 (total N=6 tests) Controlling: the controlling specimen Second: the uncontrolling specimen of the paired set MAISI: AISI (1996) predicted flexural capacity MS136: S136 (1994) predicted flexural capacity MNAS: NAS (2001) predicted flexural capacity MDSl: Direct Strength - Local mode expression as reported in (2002b) to AISI (a.k.a: Mnl) MDSd: Direct Strength - Distortional mode expression as reported in (2002b) to AISI (a.k.a: Mnd)
5.2 Web Effective Width
If we assume that the flange expressions are accurate, then we can use the experimentally observed capacity to back-calculate the correct effective width for the web, expressed as (b1+b2)/bcomp, where b1 and b2 are the effective width of the compressive portions of the web, and bcomp is the depth of the full compression portion of the web. The results of this calculation are given in Figure 25.
The majority of the bending strength is derived from the flange. Therefore, large changes are required in the web effective width in order to make a small change in the predicted bending capacity. For example, the AISI prediction for 8.5Z059-1, λweb=1.38, Mtest/Maisi = 96%, the predicted web effectiveness by AISI is 88% and the back-calculated experimental web effectiveness is 69% – a 19% difference! Therefore, the large differences between the two methods tend to get overstated when examining the web effective width in isolation, as in Figure 25.
0%
20%
40%
60%
80%
100%
120%
140%
0.60 0.80 1.00 1.20 1.40 1.60 1.80
web slenderness = λλλλweb = (fy/fcrweb)0.5
web
effe
ctiv
enes
s =
ρ ρ ρ ρ =
(b1+
b 2)/b
com
p (%
)
AISI (1996)S136 (1994)8" C8.5" Z12-3.62 C05411.5" Z
accuracy of web prediction, assuming AISI (1996) flange equations are 100% accurate
testing to determine panel-to-purlin fastener configuration
specimens damaged prior to testing
Figure 25 Back-calculated experimental web effective width vs. predictions
6 Conclusions Through computational and experimental means the developed testing plan and details have been shown to adequately restrict distortional buckling and provide a simple repeatable test that generates the local buckling

Progress Report 3 – March, 2002 – Test Verification… 3-18
flexural capacity for C- and Z-Sections. Overall the test results indicate that AISI (1996), S136 (1994), and the new NAS (2001) design methods provide adequate strength predictions. However, this overall agreement is primarily due to conservative predictions in unslender members that had observable inelastic reserve capacity (Mtest/My>1). Among the considered methods, the Direct Strength method provides the best test-to-predicted ratio for both slender and unslender specimens. The test results demonstrate that many improvements in the elastic buckling and effective width calculation of Cs and Zs are still possible. The authors intend to pursue additional testing and analysis to determine the distortional buckling capacity of Cs and Zs as well as more closely define the role of fasteners and other details.
7 Acknowledgement The sponsorship of AISI and MBMA and the donation of materials by VP Buildings, and Clark Steel is gratefully acknowledged. The assistance of the AISI task group in developing the testing plan is appreciated. Don Johnson, Maury Golovin, Joe Nunnery, Joe Wellinghoff, and Steve Thomas have all been helpful with their ideas and generous with their time. Johns Hopkins undergraduates: Sam Phillips, Liakos Ariston, and Andrew Myers have provided additional support in the lab and deserve recognition as well. The assistance of Jack Spangler in re-invigorating the JHU structural testing facility has been invaluable. The donation of steel parts by Prosser Steel is also appreciated.
8 References AISI (1996). “Specification for the Design of Cold-Formed Steel Structural Members.” American Iron and Steel
Institute. Washington, D.C. NAS (2001) “OCTOBER 12, 2001 DRAFT of North American Specification for the Design of Cold-Formed Steel
Structural Members.” American Iron and Steel Institute. Washington, D.C. S136 (1994) “Cold-Formed Steel Structural Members” S136-94. Canadian Standards Association. Rexdale, Ontario,
Canada Schafer, B.W. (2002a) “Local, Distortional, and Euler Buckling in Thin-walled Columns.” J. of Struct. Eng. ASCE.
128(3) 289-299. Schafer, B.W. (2002b) “Design Manual for Direct Strength Method of Cold-Formed Steel Design.” Report to the
American Iron and Steel Institute, Washington, D.C. (available online www.ce.jhu.edu/bschafer/direct_strength) Schafer, B.W., Peköz, T. (1998). “Direct Strength Prediction of Cold-Formed Steel Members using Numerical
Elastic Buckling Solutions.” 14th Int’l. Spec. Conf. on Cold-Formed Steel Structures. St. Louis, Missouri. Schafer, B.W., Peköz, T. (1999). “Laterally Braced Cold-Formed Steel Flexural Members with Edge Stiffened
Flanges.” J. of Struct. Eng. ASCE. 125(2) 118-127.