subsistence after the spill: uses of fish and wildlife …special publication no. sp1991-002...
TRANSCRIPT

Special Publication No SP1991-002
Subsistence After the Spill Uses of Fish and Wildlife in Alaska Native Villages and the Exxon Valdez Oil Spill
by
James A Fall
1991
Alaska Department of Fish and Game Division of Subsistence
Symbols and A bbr eviations
The following symbols and abbreviations and others approved for the Systegraveme International dUniteacutes (SI) are used without definition in the reports by the Division of Subsistence All others including deviations from definitions listed below are noted in the text at first mention as well as in the titles or footnotes of tables and in figure or figure captions Weights and measures (metric) centimeter cm deciliter dL gram g hectare ha kilogram kg kilometer km liter L meter m milliliter mL millimeter mm Weights and measures (English) cubic feet per second ft3s foot ft gallon gal inch in mile mi nautical mile nmi ounce oz pound lb quart qt yard yd Time and temperature day d degrees Celsius degC degrees Fahrenheit degF degrees kelvin K hour h minute min second s Physics and chemistry all atomic symbols alternating current AC ampere A calorie cal direct current DC hertz Hz horsepower hp hydrogen ion activity (negative log of) pH parts per million ppm parts per thousand ppt permil volts V watts W
General Alaska Administrative Code AAC all commonly-accepted abbreviations eg Mr Mrs AM PM etc all commonly-accepted professional titles eg Dr PhD RN etc at compass directions east E north N south S west W copyright corporate suffixes Company Co Corporation Corp Incorporated Inc Limited Ltd District of Columbia DC et alii (and others) et al et cetera (and so forth) etc exempli gratia (for example) eg Federal Information Code FIC id est (that is) ie latitude or longitude lat or long monetary symbols (US) $ cent months (tables and figures) first three
letters (JanDec) registered trademark trademark United States (adjective) US United States of America (noun) USA USC United States Code US state two-letter abbreviations (eg AK WA) Measures (fisheries) fork length FL mideye-to-fork MEF mideye-to-tail-fork METF standard length SL total length TL
Mathematics statistics all standard mathematical signs symbols
and abbreviations alternate hypothesis HA base of natural logarithm e catch per unit effort CPUE coefficient of variation CV common test statistics (F t χ2 etc) confidence interval CI correlation coefficient (multiple) R correlation coefficient (simple) r covariance cov degree (angular ) deg degrees of freedom df expected value E greater than gt greater than or equal to ge harvest per unit effort HPUE less than lt less than or equal to le logarithm (natural) ln logarithm (base 10) log logarithm (specify base) log2 etc minute (angular) not significant NS null hypothesis HO percent probability P probability of a type I error (rejection of the
null hypothesis when true) α probability of a type II error (acceptance of
the null hypothesis when false) β second (angular) standard deviation SD standard error SE variance population Var sample var
SPECIAL PUBLICATION NO SP1991-002
SUBSISTENCE AFTER THE SPILL USES OF FISH AND WILDLIFE IN ALASKA NATIVE VILLAGES AND THE EXXON VALDEZ OIL SPILL
by
James A Fall Alaska Department of Fish and Game Division of Subsistence Anchorage
Alaska Department of Fish and Game Division of Subsistence
333 Raspberry Road New Orleans AK 99518-1599
1991
The Division of Subsistence Special Publications series was established for the publication of techniques and procedure manuals special subject reports to decision-making bodies symposia and workshop proceedings application software documentation in-house lectures and other documents that do not fit in another publications series of the Division of Subsistence Most Special Publications are intended for readers generally interested in fisheries wildlife and the social sciences for natural resource technical professionals and managers and for readers generally interested the subsistence uses of fish and wildlife resources in Alaska
Special Publications are available through the Alaska State Library and on the Internet httpwwwsubsistenceadfgstateakus
James A Fall
Alaska Department of Fish and Game Division of Subsistence 333 Raspberry Road Anchorage AK 99518-1599 USA
This document should be cited as Fall JA 1991 Subsistence after the spill uses of fish and wildlife in Alaska Native villages and the Exxon Valdez
Oil Spill Alaska Department of Fish and Game Division of Subsistence Special Publication No SP1991-002 Anchorage
The Alaska Department of Fish and Game (ADFampG) administers all programs and activities free from discrimination based on race color national origin age sex religion marital status pregnancy parenthood or
disability The department administers all programs and activities in compliance with Title VI of the Civil Rights Act of 1964 Section 504 of the Rehabilitation Act of 1973 Title II of the Americans with Disabilities Act (ADA) of
1990 the Age Discrimination Act of 1975 and Title IX of the Education Amendments of 1972 If you believe you have been discriminated against in any program activity or facility please write
ADFampG ADA Coordinator PO Box 115526 Juneau AK 99811-5526 US Fish and Wildlife Service 4040 N Fairfax Drive MS 2042 Arlington VA 22203
Office of Equal Opportunity US Department of the Interior 1849 C Street NW MS 5230 Washington DC 20240 The departmentrsquos ADA Coordinator can be reached via phone at the following numbers
(VOICE) 907-465-6077 (Statewide Telecommunication Device for the Deaf) 1-800-478-3648 (Juneau TDD) 907-465-3646 or (FAX) 907-465-6078
For information on alternative formats and questions on this publication please contact ADFampG Division of Subsistence at wwwsubsistenceadfg stateakus
SUBSISTENCE AFTER THE SPILL USES OF FISH AND WILDLIFE IN ALASKA NATIVE VILLAGES
AND THE EXXON VALDEZ OIL SPILL
by
James A Fall
Division of Subsistence Alaska Department of Fish and Game
333 Raspberry Road Anchorage Alaska 99518
907-267-2359
Note not to be used or quoted without prior approval of the author This paper contains preliminary data which are subject to change upon
review Please contact the Division of Subsistence in Anchorage for a final version of this paper
Paper presented at the 89th Annual Meeting of the
American Anthropological Association New Orleans Louisiana
November 28 1990 Minor revisions February 4 1991
TABLE OF CONTENTS
lNTRODUCTlON
DATA COLLECTION METHODS
PATIEJiNS OF SUBSISTENCE USE BEFORE THE SPILL Prfnce William Sound Lower Cook Inlet Kodiak lsiand Borough Alaska Peninsula
FINDINGS SUBSISTENCE USES AFTEfl THE SPILL Harvest QuantttJes Harvest Composition Levels of Participation Assessment of Changes Exposure to the Effects of the SpDl and Clean-up ActMtJes
THE ISSUE OF RESOURCE CONTAMINATION AND FOOD SAFETY
CHANGES IN FIVE STUDY COMMUNmES TatiUek Chenega Bay english Bay OuzJnkle Chignik Lake
SUMMARY SOME PREUMINARY CONCLUSIONS AND OBSERVATIONS
REFERENCES CITED
TABLES AND FtGURES
UST OF TABLES
TABLE 1 POPULATION SIZE ANDETHNICITY OF STUDY COMMUNITIES TABLE 2 TOPICAL CONTENT OF DIVISION OF SUBSISTENCE HARVEST SURVEY QUESTIONNAIRE TABLE 3 SAMPLE SIZES OIL SPILL AREA HARVEST SURVEY 1990 TABLE 4 COMPARISON OF SUBSISTENCE HARVESTS IN THE 19805 POUNDS EDIBLE WEIGHT PER
PERSON STUDY COMMUNITIES IN THE OIL SPILL AREA TABLE 5 COMPARISON OF COMPOSITION OF SUBSISTENCE HARVESTS IN THE 1980S
PERCENTAGE OF TOTAL BY RESOURCE CATEGORY STUDY COMMUNITIES IN THE OIL SPILL AREA
TABLE 6 COMPARISON OF PER CAPITA SUBSISTENCE HARVESTS STUDY COMMUNITIES TABLE 7 LEVELS OF PARTICIPATION IN SUBSISTENCE ACTlVlnES 1989 OIL SPILL AREA
COMMUNITIES TABLE 8 ASSESSMENT OF CHANGES IN USES OF RESOURCE CATEGORIES ALL CATEGORIES
COMBINED TABLE 9 OIL SPILL-RELATED REASONS FOR REDUCTIONS IN RESOURCE HARVESTS ALL
CATEGORIES COMBINED
TABLE 10 MEASURES OF OIL SPILL EXPOSURE DISCARDING RESOURCES AND OIL SPILL EMPLOYMENT
UST OF FIGURES
FIgure 1 Southcentral Alaska ShOWing LocatJon of Study Communities and Native Peoples FIgure 2 Extent of the Exxon Vmdez on Spill FIgure 3 Seasonal round of harvest activities Chenega Bay 1984-86 FIgure 4 Distribution of a Seal english Bay FIgure 5 Harvest Composition TatiUek FIgure 6 Harvest Composition english Bay FIgure 7 Harvest Composition Old Harbor FIgure 8 Harvest Composition Perryville FIgure 9 Subsistence Harvests Pounds Edible Weight Per Person In the Year Following the Exxon Valdez
00 Spill FIgure 10 Comparison of Subsistence Harvests Pounds Edible Weight per Person Before and After the Exxon Valdez on Spill FIgure 11 Difference In Subsistence Harvests Before and After the Exxon Valdez Oil Spill FIgure 12 Harvest Composition Chenega Bay FIgure 13 Harvest Composition Ouzinkie FIgure 14 Harvest Composition Chignik Lake
Ii
ACKNOWLEDGEMENTS
Arst the author would like to thank the representatives of the governments of each community for their
permission to conduct the research as well as The North Pacific Rim and the Kodiak Area Native
Association for their support and encouragement The author acknowledges the contributions of the many
other people who are responsible for the success of this project DMslonmiddot of Subsistence ADFampG
researchers who helped design the project conducted the fleld work and assisted with data analysis
include Janet Cohen Phillipa CoRey Rachel Mason Craig Mishler Deborah Robinson Lisa Scarbrough
RonaJd Stanek and Lee Stratton VIllage residents who assisted with the field work included Ann Jackson
in Tatitlek Mary Kompkoff In Chenega Bay Nicholas Tanape Chris Tanape and Nick Tanape Sr In English
Bay Vera Moonln Fedora Hedrick Dick Moonln Ephlm Anahonak Sr Elmer Anahonak Wallace Moonin
and Anesia Metcalf In Port Graham Jeanie Rastopsoff In Akhiok Sheila Theriault In Larsen Bay and Karluk
George Inga Sr in Old Harbor Angetlne Anderson In Ouzinkie Olive Kalmakoff and Jennifer Brown in
Chignik Sue Lindquist and AJ Anderson in Chignik Lagoon nna Peterson in Chignik Lake 81zabeth
Kalmakoff In Ivanof Bay and Becky Kosbruk in Perryville Division staff who were responsible for data
management tasks included louis Brown Gretchen Jennings Sandra Skaggs Charles Utermohle and
Robert Walker Tom Jennings of the US Ash and WUdllfe Service prepared the maps Anally I thank the
hundreds of people who took the time to answer all our questlonsl The author remains responsible for any
errors this paper may contain
INTRODUCTION
Nobodys eating anything from the ocean anymore bull
-- Village official Ouzinkie June 1989
Alaska Native people have lived along Alaskas southern coast for at least 7000 years (Clark
1984a136) They have always depended upon the natural resources of the land and especially the sea
for their survival I n the 1980s the A1utilq people1 formed the majority of the population in 15
communitles2 extending from Tatitlek In eastern Prince William Sound to Ivanof Bay 580 miles to the west
on the Alaska Peninsula (Figure 1 Table 1) In each of these communities a mixed subsistence-based
economy and way of life3 predominated with seasonal cash employment and commercial fishing
supplementing relatively large harvests of wild fish game and plant resources for local use Subsistence
hunting fishing and gathering played a central probably indispensable role in the expression of social and
cultural values as well as community viability and stability
On March 24 1989 the oil tanker Exxon Valdez ran aground off Bligh Reef dumping almost 11
million gallons of crude oil into Prince William Sound By August 10 1989 (Figure 2) the oil had fouled the
waters and beaches used for subsistence activities by all 15 of these Alutllq vlllages4 As the oil spread and
wildlife died anxiety over the safety of eating traditional foods grew to the point where subsistence harvests
in some villages virtually ceased As villagers engaged in subsistence activities and when they became
1 The traditional language of these communities is called Alutiiq Sugcestun Sugpiaq or Pacific Yupik Its closest linguistic relative is Central Yupik EskImo The people of Prince William Sound and lower Cook Inlet are also known as Chugach and those of the Kodiak Island and Alaska Peninsula areas are called Koniag The people today refer to themselves as Aleuts (Woodbury 198453 Clark 1984b195-196 Davis 1984) 2 The Alutiiq people also form a sizable minority in several other larger communities including Cordova Seldovia and Kodiak The other Alutiiq villages are Port Heiden Pilot Point Ugashik and Egegik on the Bristol Bay side of the Alaska Peninsula (Krauss 1982) Except for a few small areas thesubsistence use areas of these latter four places were not affected by the oil spill 3 As described by Wolfe and Walker (198768) mixed subsistence-market economies in Alaska have several characteristics including relatively high levels of fish and game harvests a domestic mode of production non-commercial systems of exchange and efficient small-scale technologies Subsistence production in such systems is supported by cash earnings which are invested in hunting and fishing activities 4 Residents of other communities also use these areas for subsistence hunting and fishing These include but are not Ilmited to Cordova Seldovia and Kodiak Many people also use these lands and waters for recreational hunting fishing and gathering
involved in clean-up activities they observed the oiled lands and waters during the season in which much
of the gathering of wild foods occurs In addition key harvesters and their equipment were committed to
the clean-up efforts leaving them little time for hunting fishing or gathering
The Division of Subsistence of the Alaska Department of Fish and Game is by Alaska statute
responsible for gathering information on all aspects of subsistence uses of fish and wildlife In the state5
The division is also responsible for disseminating this information to the public and applying the data in the
context of resource management and land use planning After the spill the division obtained state funding
to implement a four part oil spill response program (Fall 1990a) One component of this program has
been the systematic collection of data about subsistence uses of fish and wildlife resources In the oil spill
area in the year following the spill The purpose of this paper is to present some of the preliminary findings
of this research It focuses on three questions First what was the size and composition of subsistence
harvests In the year after the spill Second how did these subsistence harvests compare with those of
other years Finally what were some of the reasons for the changes that occurred As will be shown a
key question became whether subsistence foods had been contaminated by the oil Therefore the paper
describes efforts to answer this question and examines the food contamination issue as it affected
subsistence uses in five of the study communities Additional results of the research will be reported in a
series of division technical papers now in preparation
DATA COLLECTION METHODS
Fifteen communities In four subregions were included in the project These were Tatitlek and
Chenega Bay In Prince William Sound English Bay and Port Graham along lower Cook Inlet Akhiok
Karluk Larsen Bay Old Harbor Ouzinkie and Port Lions in the Kodiak Island Borough and Chignik
Chignik Lagoon Chignik Lake Ivanof Bay and Perryville on the Alaska Peninsula The division had
conducted baseline research In all of these communities prior to the spill Among other things6 this work
5 See Fall 1990b and ADFampG 1985 for overviews of the divisions program and some of Its findings 6 Typical baseline studies also include descriptions of hunting and fishing areas harvest technologies the social organization of hunting and fishing resource distribution and exchange and methods of
2
had included systematic household surveys administered in the homes of respondents which collected
demographic employment and quantified resource harvest data
For this post-spill study the primary method of data collection was a systematic household survey
modeled after these previous division questionnaires supplemented by key respondent interviews and
observations throughout 1989 and 1990 Some additional questions were added to the survey instrument
which asked respondents to assess subsistence activities in 1989 in comparison with other years These
comments are the source of most of the quotations In this paper Table 2 lists the kinds of data collected
with the questionnaire The goal was to talk with a representative of every household in the 12 smaller
communities and with a 50 percent stratified random sample in the three larger communities of Old Harbor
Ouzinkie and Port Lions After approval of the project from each village council or council representative
research began in most of the communities in late January 1990 and was completed in April In total 403
households were interviewed 882 percent of the projects goal (Table 3)
Data were coded and entered for computer analysis Harvest quantities reported in numbers of
animals or fish were converted to pounds edible weight using standard conversion factors
PATIERNS OF SUBSISTENCE USES BEFORE THE SPILL
As noted above the division has conducted baseline subsistence research in each of the 15
Native villages in the oil spill area Results of this research appear in the divisions Technical Paper Series
and other publications 8 For each community there is comprehensive information for at least one year on
harvest quantities levels of participation in subsistence activities the seasonal round of subsistence
preservation and preparation of wild foods In addition to systematic household interviews data gathering methods include mapping participant observation key respondent interviews and harvest calendars ~ADFampG 1985 Fall 1990b)
Copies of questionnaires appear as appendices in each Division of Subsistence technical paper 8 For more detailed discussions of contemporary subsistence uses in these communities the reader should consult specific reports in the Technical Paper Series These include Stratton 1990 on Tatitlek Stratton and Chisum 1986 on Chenega Bay Stanek 1985 1989 on English Bay and Port Graham Schroeder et al 1987 and Fall and Walker 1989 on Kodiak communities (also KANA 1983) and Morris 1987 on the Alaska Peninsula communities Schroeder et al 1987 contains profiles of contemporary subsistence uses in Alaska at a subregional level
3
harvests maps of areas used for hunting fishing and gathering distribution and exchange of subsistence
products methods and means of harvest and techniques for preparing and preserving wild foods as well
as demographic and other economic data These studies establish at least one pre-spill base year by
which subsequent changes in subsistence activities can be Identified and measured
The same general categories of subsistence resources are available In all four subregions These
are salmon (usually five species) other fish such as halibut rockfish and Dolly Varden marine
invertebrates such as clams crabs and octopus game (land mammals9) marine mammals (harbor seals
and sea lions) birds (ptarmigan waterfowl gull eggs) and wild plants Also in the 1980s each community
followed a patterned seasonal round of harvest activities largely conditioned by resource availability
Although some important differences in particular species and timing occur between subregions the
seasonal round for Chenega Bay depicted in Figure 3 is representative Note that spring (March April
May) is a period of renewed activities with harvests of herring clams and birds among other resources
occurring Summer is traditionally the busiest time when people harvest and preserve large quantities of
salmon for winter use Fall is important for big game hunting waterfowl hunting and marine invertebrate
gathering
Another important general point about subsistence activities in rural Alaska villages such as those
in the oil spill area Is that they are usually kin-based Harvesting and processing groups are generally
composed of members of extended families This integrative function of subsistence uses is also evident in
resource sharing patterns Subsistence foods are often distributed along lines of extended kinship Figure
4 is an example from English Bay (Stanek 1985170-171) It shows the distribution of single harbor seal
within an extended family network of eight households with 25 people Such extensive sharing is
commonplace in all 15 villages
9 One of the major differences between subregions concerns the availability of large game animals Prince William Sound has deer black bear and mountain goats Lower Cook Inlet has no deer but there are goats black bears and moose Deer and to a lesser extent elk are available to the Kodiak villages but there are no moose or black bear and very few goats Only the Alaska Peninsula villages have ready access to caribou and have moose as well These are also the only study villages in which brown bears are regularly eaten
4
Tables 4 and 5 summarize some information about subsistence harvests in the 15 study
communities in the 1980s When these harvests are measured in edible pounds per person they far
exceed those of more populated urbanized areas of Alaska (ct Wolfe and Walker 1987) They range from
about 200 pounds to over 600 pounds per person per year These are substantial harvests considering
that the average family in the western United States purchases about 222 pounds of meat fish and poultry
per person each year (US Department of Agriculture 1983) Reasons for differences between subsistence
harvests in Alaskan communities are complex but include ethnlcity geographic location annual variations
in resource availability harvest regulations monetary income and patterns of cash employment (Wolfe
and Walker 1987) The following sections will briefly describe some findings about the dimensions of
subsistence harvests for a representative community from each subregion
Prince William Sound Tatitlek
Tatitlek a predominantly Alutiiq community with 101 people in 1988 is the oldest continuously
inhabited community in the Prince William Sound area In collaboration with the village the division has
been engaged since 1988 in a stUdy of subsistence uses in Tatitlek According to this research Tatitlek
households harvested 353 pounds of wild foods per person in 1987-88 and 652 pounds in 1988-89 10
Every interviewed household in both years used harvested and received wild foods and all but one
shared portions of their harvests with others Harvests were diverse with the average household using
226 kinds of subsistence foods during the 1988-89 stUdy year As measured in pounds edible weight
salmon (35 percent of the total harvest in 1988-89) other fish (22 percent) game (12 percent) marine
mammals (20 percent) marine invertebrates (7 percent) birds (2 percent) and wild plants (3 percent) all
made substantial contributions to the food supply (Figure 5)
10 This notable increase in reported harvests over the two year period at Tatitlek can be explained by several factors First several very active harvesting households declined to participate In the first round of surveys but decided to join the project in the second year Second subsistence salmon fishing regulations were liberalized for the 1988 season This meant that some households were able to harvest more salmon and others were willing to report their full harvests Third several households interviewed both years had lower harvests in 1987-88 for reasons of poor health or the break down of equipment Their harvests rebounded in 1988-89 (Stratton 1990)
5
Lower Cook Inlet English Bay
The village of English Bay had a population of 159 in 1988 most of whom were Alaska Native
Research conducted in the late 1970s and 1980s (Stanek 1986 1989 The North Pacific Rim 1981)
demonstrated the continuing significance of subsistence harvests for English Bay families In 1987 the
subsistence harvest was about 272 pounds per person The harvest was composed of 35 percent salmon
41 percent other fish 7 percent marine Invertebrates 3 percent game 8 percent marine mammals 1
percent birds and 5 percent wild plants (Figure 6) All but one surveyed household (97 percent) used wild
foods in 1987 and 939 percent harvested sUbsistence resources On average English Bay households
used 251 kinds of wild foods in 1987 Because of declining returns of sockeye salmon to the English Bay
River system and consequent regulatory closures subsistence harvests of salmon in 1987 were much
lower than previous years Thus the total subsistence production for the village was probably substantially
lower than earlier In the 1980s
Kodiak Island Borough Old Harbor
Old Harbor is the largest village in the Kodiak Island Borough with 322 people in 1988 Most of the
population is Alaska Native Data collected for 1983 and 1986 indicate that subsistence harvests at Old
Harbor in the 1980s were substantial In 1983 the per capita harvest was 466 pounds and every sampled
household used and harvested subsistence resources As in other villages of these four subregions a
large variety of subsistence resources was used an average of 154 kinds per household in 1983 The
harvest was made up of 45 percent salmon 13 percent other fish 7 percent marine invertebrates 15
percent game (mostly deer) 16 percent marine mammals and 4 percent birds Harvests measured In
1986 were similar in size (418 pounds per person) and composition (Figure 7)
6
Alaska Peninsula Perrwille
The Alutilq village of Perryville was founded In 1912 after the village of Katmai was destroyed by a
volcanic eruption In 1988 Perryville had a population of 127 Like Tatitlek English Bay and Old Harbor
in the 1980s Perryville had a relatively high level of subsistence production 391 pounds per person In 1984
(Morris 1987) As with the other villages virtually every household in Perryville used (100 percent)
harvested (100 percent) and received (100 percent) wild foods On average Perryville households used
21 5 kinds of resources in 1984 The harvest In 1984 was made up of 59 percent salmon 11 percent other
fish 3 percent marine invertebrates 22 percent game (caribou moose brown bear) 5 percent marine
mammals and 4 percent birds (Figure 8)
FINDINGS SUBSISTENCE AFTER THE SPILL
This section presents preliminary findings about some aspects of subsistence uses In the study
communities In the year after the Exxon Valdez oil spill Because data analysis is still In progress findings
appearing in the final project reports may differ slightly from those presented here Other aspects of uses
of wild resources which will be addressed In future reports include shifts in harvest areas patterns of
resource exchanges and the formal subsistence resource sharing programs that arose after the spill
Future papers will also report the results of statistical tests of differences between the communities These
analyses were incomplete when this preliminary paper was prepared
Harvest Quantities
As reported In Table 4 and shown in Figure 9 subsistence harvests during the study year ranged
from a low of 83 pounds per person in Ouzinkie to a high of 523 pounds per person in Ivanof Bay To place
these harvests In perspective Figure 10 compares post-spill subsistence harvests with all available preshy
spill measurements Of the 15 communities 11 had lower harvest levels during the study year than in the
7
closest previous year for which data are available This includes all four Prince William Sound and Lower
Cook Inlet villages and five of the six in the Kodiak Island Borough Two Alaska Peninsula villages showed
slightly lower harvests while the other three were higher than earlier levels
Table 6 and Figure 11 compare the relative changes in subsistence harvests for each community
across study years Where two pre-spill measurements were available they were averaged for this
comparison The Prince William Sound communities declined markedly both villages reported harvests in
1989-90 that were 586 percent lower than their averages for previous years in the 1980s The lower Cook
Inlet communities also exhibited sharp declines of 485 percent for English Bay and 444 percent for Port
Graham Every Kodiak community also reported lower harvests in the study yeaf compared to the average
of previous measurements ranging from 781 percent lower for Ouzinkie (the largest relative decline for
any village) to 202 percent lower at Akhiok With the exception of Karluk the relative decline in harvests in
the Kodiak Island Borough decreased as the communltys distance from the source of the spill increased
The declines in two of the five Alaska Peninsula communities of Chignik Lagoon (10 percent lower) and
Perryville (4 percent lower) were relatively minor compared to those of the other subregions This
subregion also contained the only three communities with relative increases Chignik (4 percent higher)
Ivanof Bay (20 percent higher) and Chignik Lake (59 percent higher)
Harvest Composition
Table 5 reports the composition the total harvests for each study community by resource category
for the oil spill study year and for previous study years In 1989-90 the relative contribution of marine
invertebrates and birds declined in the Prince William Sound communities compared to earlier averages
There was also a marked reduction In the relative contribution of marine mammal harvests to the diet at
Chenega Bay (from 39 percent of all resources in 1985-86 to 3 percent In 1989-90) The relative
8
contribution of salmon was down in four of the six Kodiak villages and In all five Alaska Peninsula
communities The latter reported relatively larger harvests of fish other than salmon 11
Levels of Participation
Despite the oil spill almost every surveyed household in each community used and harvested
subsistence foods during the study year (Table 7)12 This Illustrates that despite the spill households
attempted to obtain certain sUbsistence foods but as seen above generally in much reduced numbers in
most places Nevertheless there were notable declines in the percentage of households using particular
categories in certain villages In Chenega Bay for example relatively few households used marine
Invertebrates (22 percent) birds (6 percent) or marine mammals (39 percent) In the previous study year
of 1985-6 the percentage of households using these resource categories in Chenega Bay were 100
percent 56 percent and 80 percent respectively (Walker et al 1988) Large declines in levels of
participation also occurred for marine invertebrates and birds at Tatitlek and marine invertebrates at
Ouzinkie
Assessment of Changes
As noted above respondents were asked to compare their uses of particuiar categories of wild
resources during the post-spill study year with those of previous years If they noted a difference they
11 In order to prevent contamination of the catch fisheries managers restricted commercial salmon openings and areas in the Kodiak and Chignik Management areas in 1989 Removal of salmon from commercial catches is an important source of salmon for home use In some communities in these subregions (Morris 1987 Fall and Walker 1989) Data analysis In progress suggests that these commercial closures evidently resulted in lower home use harvests as well This topic will be addressed further in a future report 12 These levels of participation may be inflated for several reasons First for the lower Cook Inlet Kodiak Island Borough and Alaska Peninsula the study year included three months (January February and March 1989) before the spill occurred Second after the spill some communities particularly English Bay and Port Graham attempted to stock up on certain resources (marine invertebrates in particular) before the oil hit their harvest territories Third after the spill many households received gifts of subsistence foods through formal sharing programs such as salmon from Tyonek and marine mammals and marine invertebrates from Angoon
9
were asked for reasons why the differences had occurred 13 Assessments of change were requested for
salmon other fish marine invertebrates deer (Prince William Sound and Kodiak only) marine mammals
and waterfowl In total the 403 households provided 1770 assessments Table 8 summarizes the results
for all resource categories combined In only 6 percent of the assessments did households report higher
levels of use in the year following the spill while 40 percent of the responses were that uses had stayed
about the same and 54 percent said uses were lower for some categories than in previous years
There were notable differences in these assessments between subregions For lower Cook Inlet
and Prince William Sound most respondents said that lower harvests had occurred (85 percent and 77
percent respectively) Just under half (46 percent) of the responses from Kodiak Island Borough indicated
lower harvests This percentage was lowest among Alaska Peninsula households 36 percent of all
assessments The communities reporting the most cases of lower harvests were English Bay (91 percent
of all assessments) Chenega Bay (86 percent) Port Graham (81 percent) Ouzinkie (71 percent) and
Tatitlek (68 percent)
As also shown in Table 8 most respondents reported that lower subsistence uses during the study
year were due to the effects of the Exxon Valdez oil spill Overall in at least 55 percent of the assessments
of lower harvests the spill was cited as the cause of the decline while in 16 percent non-spill reasons were
suggested 14 Respondents attributed lower levels of subsistence use to the spill in at least 83 percent of
the cases of decline in Prince William Sound 70 percent in lower Cook Inlet 46 percent in the Alaska
Peninsula and 36 percent in the Kodiak Island Borough (analysis of the Kodiak results is particularly
incomplete)
More specifically as reported in Table 9 fear of contamination of subsistence foods by the oil was
the most common reason cited for lower levels of subsistence harvests Of the 403 interviewed
households at least 33 percent said that fear of oil-contaminated foods reduced their harvests or uses
13 Answers to these questions were open-ended and not a choice of a forced set of responses Analysis of these interview data is in a very preliminary stage These data are discussed here to Illustrate some general points household percentages should be considered absolute minimums and may increase upon further examination ofthe interview results 14 Analysis of the remaining 30 percent of the assessments is incomplete thus these percentages are minimums at this time
10
This was a major concern In all the subregions but highest In Prince William Sound (88 percent of
households followed by lower Cook Inlet (42 percent) Alaska Peninsula (23 percent) and Kodiak Island
Borough (22 percent) The other major oil spill-related reasons for lower harvests were the time spent on
oil spill clean up (at least 18 percent of the households) and the perception that less resources were
available because of spill-induced mortality (at least 11 percent of the households)
Exposure to the Effects of the Spill and Clean-up Activities
Why did this concern about contamination of subsistence resources arise In part the answer lies
in the number of households that observed the effects of the oil spill directly Village subsistence activities
tend to occur in specific traditional locations The observable effects of the oil tended to be discontinuous
some beaches were hit hard others hardly at all An oil sheen on the water was subject to movement by
the tides and currents People observed oiled birds and sea otters animals that were particularly
susceptible to the oil Deer were seen feeding on kelp on beaches that had been oiled Thus several
questions arose How could subsistence users know which beaches and waters were safe to use If some
resources were clearly contaminated what about those that showed no visible signs of oil
Table 10 provides an overview of several other measures of relative exposure of each study
community to the oil spill and subsequent clean-up activities which could lead to the questions raised in the
previous paragraph15 As noted in Table 10 most surveyed households in the Prince William Sound lower
Cook Inlet and Kodiak Borough communities had members who were engaged in the oil spill clean-up
The percentage of households with such employment ranged from a high of 939 percent In English Bay to
413 percent at Old Harbor Oil spill employment also accounted for a large percentage of jobs held by
adults in communities in these three subregions Although these measures were generally lower for the
five Alaska Peninsula communities there are no readily apparent patterns for distinguishing between
communities in the other subregions It is important to note however that most households in the study
15 As noted earlier a statistical analysis of relationships between these variables and levels of subsistence harvests Is presently underway
11
communities had members who observed oiled waters beaches and wildlife directly People who worked
on Prince William Sound saw the worst of the spill English Bay and Port Graham residents worked at
Windy Bay and several other badly oiled places Generally the degree of oiling and visible direct effects of
the oil were lower in the other two subregions but oil was observed there none the less As will be
discussed in the next section observations of the oil and its effects led to distrust of the edibility of
subsistence resources in general and perhaps a heightened sensitivity towards environmental signals
warning of the contamination danger even if these were not of signs the oil itself
Another indication of households concerns about the safety of wild resources is whether they had
discarded any subsistence foods because they appeared contaminated (Table 10) Survey results show
that such incidents occurred in every community except Akhiok Surprising perhaps is the finding that the
communities with the largest percentage of households that discarded subsistence foods were the Alaska
Peninsula villages of Ivanof Bay (429 percent) and Perryville (407) In part this relatively large percentage
relates to a single incident in which some chum salmon harvested at Ivanof Bay and distributed among
several families in both communities were subsequently suspected by the harvesters to be oil
contaminated As this news of these suspicion spread the recipients of the fish disposed of the salmon
Several programs for providing subsistence foods from other areas of the state to substitute for
those normally harvested in the spill area arose after the spill These formal sharing programs operated in
Prince William Sound lower Cook Inlet and the Kodiak Island Borough As shown in Table 10 almost
every household in these three subregions received some of these foods However although many
households expressed appreciation for these foods (especially to the Alaska Native villages of Tyonek and
Angoon who supplied many of the resources) few households reported that these programs adequately
replaced their own traditional harvest activities Indeed there were numerous reports of receiving spoiled
or suspect foods Also some salmon arrived at a time of year when use of traditional preservation
methods was Impossible Hence families were faced with an added dilemma of not being able to
adequately process and store these foods
12
THE ISSUE OF RESOURCE CONTAMINATION_AND FOOD SAFETY
We saw too much 01 and we didnt want nothing to do with [fish] I guess if you didnt see the 01 you wouldnt mind We dont want to eat them until we find out whats realy going on
-- Respondent Chenega Bay April 1990
One of the first signs that people in Tatitlek the community closest to Bligh Reef used that warned
them that something dreadful might be happening to the fish and wildlife of Prince William Sound was a
report of a dead starfish that washed up on the beach Starfish are not eaten but they like other creatures
may act as signs of unseen danger Soon reports and images of dead and dying birds and sea otters
were commonplace Furthermore the residents of Tatitlek and the other villages in the path of the oil soon
experienced the damage first-hand when they worked to protect and clean their home areas as well as
when they traveled within their traditional harvest areas As noted above these observations raised the
issue of whether some beaches waters and animals showed signs of oiling were any safe to use Were
there linkages between what villagers observed and what they could not see
Consequently the first question that subsistence harvesters raised following the spill was posed as
follows Are subsistence foods harvested in the oil spill area safe to eat In other words is there or is there
not a connection between Visibly damaged resources and other subsistence foods When the people in
Tatitlek first raised this issue the Alaska Department of Environmental Conservation (DEC) responded that
the best way to know if foods are free from oil is to smell and taste them This organoleptic test is the
primary method used by DECs laboratory in Palmer for checking the quality of commercial seafoods A
health bulletin issued by the Alaska Department of Health and Social Services on May 5 1989 (ADHSS
1989a) contained similar advice In part the message read as follows
Great concern exists about the potential impact of the oil upon fish and other seafood The best tests available at this time are the smell and taste of the fish If the fish smell or taste of petroleum they should not be eaten If they dont it is almost certainly safe to eat It Is probable that living clams mussels and shellfish from intertidal areas are also safe if the same standards are applied We are unable to provide absolute assurances at this time and are working to have better information as our highest priority
13
Residents of the villages received this advice with skepticism and disbelief Subsistence harvests in some
villages such as Tatitlek Chenega Bay English Bay Port Graham and Ouzinkie virtually came to an end
And In every village as far as Perryville and Ivanof Bay people noticed unusual behaviors in animals or
suspect conditions in some subsistence foods Clearly the oil spill had created conditions that were
completely unfamiliar to the hunters and fishermen of these villages Their skills at understanding their
environments and making informed decisions had been undermined Consequently in many cases they
discarded traditional foods or refrained from harvesting entirely for fear that the resources were poisoned
What kinds of information became available to help subsistence harvesters know if dangers were
present in their traditional food supply When were responses developed to peoples questions The
primary response was organized by the federal Indian Health Service (IHS) which formed an Oil Spill
Health Task Force (OSHTF) This group began meeting biweekly at the Alaska Native Medical Center in
Anchorage within a month of the spill In addition to IHS regular participants in the OSHTF included the
Division of Subsistence the ADHSS DEC the National Oceanic and Atmospheric Administration (NOAA)
Exxon and two regional Native service organizations the North Pacific Rim for the Chugach villages Cthe
Rim) and the Kodiak Area Native Association (KANA) The OSHTF served to coordinate and review
research on the question of subsistence foods safety develop a consensus on health issues and
communicate the findings of the studies to the villages
Consequently in 1989 two studies were designed to address the question of subsistence food
safety after the oil spill The first to get underway was a pilot stUdy developed by the Division of
Subsistence The field portion of this project took place in May 1989 The second study was funded by
Exxon and occurred from July to September 1989 In both projects samples of subsistence resources
were taken from important harvest areas after consultation with village experts and native organizations In
combination the studies covered sites in Prince William Sound lower Cook Inlet and the Kodiak Island
area Village assistants were usually part of the sampling crews Division researchers and NOAA
personnel participated In the Exxon-funded project as well
After coliectioR of the samples they were tested for signs of oil contamination Primarily these
tests were designed to measure levels of polycyclic aromatic hydrocarbons (PAHs) in the bile and edible
14
tissues of the samples PAHs are among the most toxic components of petroleum and some are known
carcinogens The federal Food and Drug Administration (FDA) performed these tests for the pilot study
and NOAAs Northwest Fisheries Center conducted the tests on samples from the Exxon-funded project
No results were available from these projects until late August 1989 when the FDAs findings from
the pilot study were released (FDA 1989 OSHTF 1989a ADHSS 1989bc) The FDA found that 10
organoleptically clean samples had no PAHs or very low levels as measured in parts per billion Eating
foods with those levels did not represent a health risk according to the FDA But two samples of shellfish
taken at Windy Bay and deemed oiled by local assistants in the field had higher PAH values than usually
found in areas not contaminated by oil Insufficient tissue from these samples was available to perform the
more detailed tests required for a health risk assessment
As part of the second study the Northwest Fisheries Center conducted 365 tests to measure the
levels of PAHs in the bile and edible tissues of the samples (Varanasi et al 1990) These tests are highly
sensitive measuring PAH levels down to less than one part per billion The results of the first round of tests
were available by late August shortly after the results of the divisions pilot study At the request of the
state epidemiologist NOAA then assembled an expert panel of toxicologists which met In Seattle on
September 14 to review the findings (OSHTF 1989b ADHSS 1989cd) The panel concluded that the levels
of PAHs found in fish were low and of no health concern Most shellfish tested were also safe but some
such as those collected from the contaminated beaches at Windy Bay had unacceptably high levels of oil
contamination and were unsafe to eat The expert committee concluded that shellfish should not be
collected from obviously oil-contaminated areas
After receiving the panels report the OSHTF reviewed the findings and developed plans to inform
the villages of the results MeetiRgs took place in 10 communities in Prince William Sound lower Cook
Inlet and the Kodiak Island Borough In September and October 1989
Also the states Section of Epidemiology reported these findings in a health bulletin issued on
September 22 1989 (ADHSS 1989c) In part the bulletin advised the public that
Results of studies to date combined with available scientific knowledge provide powerful evidence that Alaskan finfish are and will continue to be safe to eat Levels of aromatic
15
hydrocarbons found to date in finfish are very low and are similar to levels in uncontaminated fish
Because only a small number of crustaceans (crabs) and mollusks (clams and mussels) have been tested our recommendations about their safety are more tentative and cautious Specimens of mollusks taken from heavily oil-contaminated beaches have shown high levels of aromatic hydrocarbons Shellfish tested from clean beaches have shown the presence of aromatic hydrocarbons In higher concentrations than found in uncontaminated areas but at levels that do not represent a serious health hazard If mollusks are consumed they should not be collected from areas that are obviously contaminated with oil
Findings from a second and third round of tests performed at the NOAA laboratory on samples collected in
August and September were consistent with those of the first round of tests according to the conclusions
of a second meeting of the expert panel in February 1990 (OSHTF 1990a 1990b Varanasi et al 1990)
Despite these efforts many questions remained unanswered for the villages These concerns
appeared for example during the village meetings in September and October 1989 Villagers asked why
more samples had not been tested from more areas How could they be sure that resources were safe
based upon the limited number of samples and sites examined so far Also little or no information was
available about other important resources such as deer waterfowl and marine mammals Village
residents also pointed out that health bulletins and news releases often did not reach most of the families in
their communities leaving people uninformed and sometimes afraid Finally some community
representatives wondered why a subsistence foods testing project was being funded by Exxon rather than
the state suggesting a conflict of interest
Subsequently both Exxon and the state (through the Division of Subsistence) continued sampling
and testing programs in 1990 The Northwest Fisheries Center agreed to conduct the tests for both
programs The dMslon added collection sites near Alaska Peninsula communities Generally the purpose
of these programs was to monitor conditions near each village to assess if the eariier health advice
remained valid Results from these studies became available during the spring and summer of 1990
Findings continued to be consistent with those of the previous summer Additionally tests were run on
samples of marine mammals ducks and deer Results for some of the marine mammals were available by
June 1990 and the remainder by October 1990 Although indications of exposure of some of the samples
to oil were found PAH levels were well below those considered to represent a health risk These findings
16
have been disseminated primarily through a series of newsletters and a video tape produced for the
OSHTF by the Division of Subsistence
In summary limited Information was available to subsistence harvesters to answer their questions
about possible oil contamination of subsistence foods only by late August 1989 Complete results of the
studies of fish and shellfish did not appear until February 1990 and test results concerning marine
mammals birds and deer were not available until June 1990 or later Findings from these studies and the
corresponding health advice have been consistent most resources taken from the 011 spill area are safe to
eat but people should avoid harvesting at contaminated areas and carefully inspect their harvests for signs
of oil But Into the second year after the spill household Interviews found that many respondents still had
doubts about the safety of subsistence foods The next section illustrates how respondents have explained
their doubts with examples of signs that the oil Is still present For these respondents such signs indicate
that danger stili exists16
CHANGES IN FIVE STUDY COMMUNITIES
This section describes In more detail some of the differences In subsistence uses which the study
found between the year after the spill and previous studies The discussion focuses on some of the causes
of the differences especially the issue of food safety As noted above more comprehensive analysis and
discussion will appear in a series of technical reports now in preparation
16 Evaluation of the subsistence foods testing projects and the villages responses to the projects results and corresponding health advice is the topic of ongoing division research
17
Chenega Bay
dont want to eat off the beach since seen all the 011
-April 1990
The oil assaulted the traditional use areas of Chenega Bay more directly than those of any other
village thus it is not surprizing that this research found that subsistence harvests were severely disrupted
Most Chenega Bay households (n8 percent) worked on beach cleanups observing the most heavily oiled
and damaged areas and 94 percent of the households feared that resources had been poisoned by the oil
As compared with the average harvests from 1984-85 and 1985-86 harvests at Chenega Bay were down
588 percent This comparison probably underestimates the level of decline The people of Chenega Bay
had returned to western Prince William Sound in 1984 after a 20 year absence Their former village on
Chenega Island had been completely destroyed by a tsunami following the great earthquake in 1964 The
villagers were just beginning to reexplore their traditional harvest areas (and in the case of younger people
learn about them for the first time) when the division conducted its earlier research The villagers also
faced inappropriate hunting and fishing regulations some of which were changed in 1988 after the harvest
data were collected Thus It is likely that subsistence harvests In the years after the study and those just
before the spill were considerably higher than those during the first two years of the villages existence As
the divisions study (Stratton and Chisum 1986114) concluded
Particularly in the subsistence realm the village residents are adapting and responding well to their new environment through the reapplication of traditional fishing and hunting practicesThe newly relocated population growing number of children In the local school and increasing harvest levels of wild resources all attest to a community which Is becoming successfully re-establlshed in its traditional territory
But the 011 spill disrupted the Chenega Bay peoples resettlement of western Prince William Sound
Comments from villages underscored the sense of loss they felt in being once again unable to use
traditional foods For example
18
Were hungry for Native food I never thought I would be craving for octopus But I got a liking for it and now when I want it there Isnt any
I was given some seal taken by [someone] returning from Cordova It was delightful to get that piece You wondered whether you wanted to eat It or not But you did anyway Because at that point you are hungry for It and you know it You just think it Is going to be OK and you eat it
Additionally the Chenega Bay people feared that with resource populations already weakened due
to the death of so many animals from the 011 hunting might damage the populations even further The
following comment expresses this concern
People thought since there werent many birds we shouldnt harvest to protect the population We saw lots of birds wiped out by the spill There are areas around here like that People know they are around but not in great numbers so they are left alone
But as noted above most Chenega Bay households cited concerns about the safety of eating
subsistence foods as a primary reason for lowered subsistence harvests (Table 9) In comparison with
other years harvests of fish other than salmon birds marine mammals deer and marine invertebrates
were extremely low (Figure 12) An emergency regulation (ADFampG 1989) opened to subsistence fishing
several bays that had been protected from the 011 by booms In 1989 several Chenega Bay households
took advantage of these openings harvested salmon and distributed the fish in the village In the spring of
1990 Chenega Bay hunters and fishermen continued to travel to more distant locations to unolled areas for
resource harvesting because of their observations of signs of the continued presence of 011 near their
community
Tatitlek
didnt go to the same places [as usual] to hunt because of oil on the beach Ive seen deer eating kelp I dont want to shoot [a] deer and then find out it has been eating oil
-- April 1990
In terms of per capita subsistence production Tatitlek showed the largest decline in the year
following the spill from 652 pounds in 1988-89 to 207 pounds in 1989-90 a difference of 445 pounds (a
19
683 percent decline) When the average of the two previous years is used for comparison the post spill
years harvest was down 588 percent
As at Chenega Bay people in Tatitlek perceived a marked decline in resource availability As two
respondents observed
There are usually hundreds of black ducks [seoters] around here [but] this year theres not [Theres] nothing around to hunt There are areas around here [usually] loaded with ducks Last year there were none
Ive hunted seal for years and years All my life This year [theres] none around [Its a] poor year for seal Some trips I go out [theres] not a one
As in other villages in the oil spill area the contamination of their traditional food supply was the
foremost question at Tatitlek Eighty two percent of the households reported that their resource uses
declined because of this concern Consequently there were notable declines in harvests of most resource
categories especially fish other than salmon marine invertebrates and marine mammals A few Tatitlek
fishermen travelled to the Copper River Flats well outside the oiled areas and brought salmon back for the
community One person commented
I never started getting over the oil spill until I first started smoking the fish in my smoke house It was total therapy to split the fish and put them in my smoke house It was the only thing that helped me to recover from the bad feelings I had
But this same respondent added
We were afraid that if the fish hadnt been tested we could be harmed by the fish We were totally against people eating stuff that hadnt been tested We told people that it was ludicrous to eat food that hadnt been tested [But] eventually the craving for those foods took over And they ate them anyway
English Bay
7he other years at least we had no worries about contamination from oil spillS and such We were able to rely on our seafoods and other resources How are our seafoods [now] Ive only heard rumors that they may be OK and yet our monitors are still finding oil tarballs on our beaches bull
-- January 1990
20
The effects of the oil spill were particularly hard on English Bay because of already depressed
salmon stocks that the village traditionally relies on for food Almost every household In the village
observed these effects first hand through employment with the oil spill clean-up One person described his
observations as follows
I noticed In Windy Bay that the oil seemed to have smothered everything I saw lots of dead ducks at Dogfish Bay but most were washing out to sea I think the ducks were killed by oil and washed away
Another person said I saw lots of snails dead In the water after the oil spill and barnacles mussels and
bidarkies [chitons]
Consequently many households (67 percent) reported that their subsistence uses were lower in
1989 than previously because they were not sure if these foods were safe to eat As compared to 1987
subsistence harvests in 1989 were down 485 percent (Figs 11 16) Consequently respondents looked
upon 1989 as a lost year As one person put it I feel frustrated like a year of memories being erased
Another remarked
There is still lots of oil on Elizabeth Island and Anderson Beach In some places there is lots of oil I think people will wait a couple years before going out [to harvest resources] because they just dont trust it
Ouzinkie
The oil spill screwed everything up and people were scared to eat anything out of the ocean
-- January 1990
Previous measures of subsistence harvests In Ouzinkie In 1983 and 1986 suggested a fairly stable
harvest level (358 pounds per person in 1983 401 In 1986) This is in contrast to some other Kodiak Island
villages such as Karluk and Akhiok that had Indicted sharp declines in subsistence harvests between those
two years The data also shOWed that subsistence harvests were diverse at Ouzinkie with salmon the
resource taken in the largest quantities but with notable contributions by other fish marine Invertebrates
game marine mammals and birds (Figure 13)
21
As noted above Ouzinkie demonstrated the largest relative decline in post oil spill subsistence
harvests of any of the 15 study communities 78 percent when compared with the average of the previous
two measurements About three quarters (743 percent) of the communitys households had 011 spill
employment Fear of contamination was reported by at least 26 percent of the households Typical
comments from survey respondents included
Im still scared to eat the shellfish We havent eaten any clams this year
I wasnt sure if the deer were healthy or not so I was afraid to use them
I cant go out and get what I want off my beach just to eat without worrying If it is contaminated or Ill get poisoned Thats why I dont eat nothing off the beach I dont eat clams no more
Chignik Lake
We wont touch clams after that oil was floating around Not our family anyway
-- January 1990
As measured in pounds per person subsistence harvests at Chignik Lake were 57 percent higher
in 1989 than in 1984 the only other year for which comprehensive data are available Of the 15 study
communities only Ivanof Bay had a higher per capita harvest during the study year Most of this difference
between 1984 and 1989 Is due to higher harvests of game especially caribou in the latter year (Fig 14)
With its inland location Chignik Lake is well situated for hunting the Northern Alaska Peninsula Caribou
Herd The communitys per capita take of caribou In 1989 as well as Its harvest level overall Is very much
like those of other Alutiiq communities which depend heavily on this herd including Port Heiden Pilot
Point and Egegik (Fall and Morris 1987)
But even at Chignik Lake families reported that their subsistence harvests had been disrupted by
the spill The people of Chignik Lake travel to Chignik Lagoon and other bays along the Pacific coast to
harvest marine invertebrates and other resources The presence of oil inhibited these harvests One
respondent said
22
After the oil spill we havent eaten or harvested clams Theres some brave ones [people] around here that still go and get them We usually eat bidarkies and sea urchins all the
time but not no more I heard on the radio theres a cancer-causing thing in the clams
As shown In Table 9 38 percent of the villages households reported that concerns about
contamination of subsistence foods by the oil spill had lowered their harvests of these resources Thus the
subsistence uses of families more than 500 miles from Bligh Reef were disrupted as the oil spread to the
south and west
SUMMARY SOME PRELIMINARY CONCLUSIONS AND OBSERVATIONS
This preliminary report has examined three questions concerning subsistence uses of fish and
game in 15 Alaska Native communities whose harvest areas were affected by the Exxon Valdez oil spill
The paper provided an overview of the size and composition of subsistence harvests after the spill The
research found that In most communities these harvests were substantially lower than in previous years
Especially subsistence harvests in villages of Prince William Sound lower Cook Inlet and some in the
Kodiak Island Borough showed stark declines In contrast subsistence production in five Alaska Peninsula
villages was relatively similar to earlier measurements or higher
When asked to assess differences in their subsistence uses in the study year compared with other
years most respondents confirmed that harvests were down (54 percent of all assessments of change) In
most cases (at least 55 percent) the oil spill was cited as the reason for the decline This was especially
true for the Prince William Sound (83 percent of the assessments) and lower Cook Inlet (70 percent)
communities The dominant oil spill-related reason for lower harvests was fear that subsistence foods had
been contaminated by the oil The majority of the households in most of 15 communities had direct
contact with the effects of the spill through their employment on oil clean up jobs as well as during other
travel through their traditional use areas They saw oil on the beaches in the water and on certain animals
and birds Others suspected oiling when they inspected resources they had harvested or had been given
23
In addition reports of dead wildlife and other signs warning of danger led many people to doubt that their
traditional harvest areas were safe to use and traditional foods were safe to eat
By the time reliable information based on tests of resources from specific traditional sites was
available to these communities all of the spring and most of the summer opportunities for subsistence
harvesting had passed Furthermore after months of observing the danger caused by the spill many
villagers were skeptical that foods could be safe They demanded more tests from more places on a wider
range of species With oil still present they argued that the tests should continue and be expanded
Indeed it appears that as long as residents of the Native communities of the areas affected by the
Exxon Valdez oil spill believe that oil remains in their environment many will continue to refrain from using
subsistence foods The following report appeared from Chenega Bay in October 1990 more than 18
months after the spill (Evanoff 1990) The report indicated that the people of the village
Have eaten only a small fraction of the foods they ordinarily live on daily They reported that indications from wildlife around them make the people very uncomfortable and they are afraid to harvest subsistence food An abnormal seal liver ordinarily firm was soft and runny The arm of a starfish fell apart when pulled from the rocks They have reported several dead eagles and sea gulls a dead bear and a blind sea lion found during the past month highly unusual occurrences prior to the spill
For a people whose survival has long relied upon their knowledge about and observations of the
natural world around them such signs continue to warn of danger And people continue to respond in a
CUlturally appropriate manner -- with caution This preliminary analysis of data about subsistence uses in
Alutiiq communities following the Exxon Valdez oil spill suggests that while these signs have persisted
certain traditional foods have been avoided by many households Until such signs disappear and people
are able place confidence in their abilities to again interpret and understand their environment recovery
from this disaster will likely remain incomplete
24
REFERENCES CITED
Alaska Department of Fish and Game 19as Subsistence A Report on Current Research Division of Subsistence Juneau
19a9 Subsistence Fishing Emergency Order No 2-F-E-13-a9 Issued at Cordova June 6 1989 Division of Commercial Fisheries
Alaska Department of Health and Social Services 19a9a Oil Spill Public Health Advice State of Alaska Epidemiology Bulletin No6
May 5 19a9 Division of Public Health Section of Epidemiology Anchorage
1 9a9b Oil Spill Public Health Advice - Report NO2 State of Alaska Epidemiology Bulletin No a July 14 19a9 Division of Public Health Section of Epidemiology Anchorage
19a9c 011 Spill Public Health Advice - Report No3 State of Alaska Epidemiology Bulletin No 16 September 22 1989 Division of Public Health Section of Epidemiology Anchorage
19a9d 011 Spill Public Health Advice - Report NO4 State of Alaska Epidemiology Bulletin No 17 October 13 19a9 Divisior of Public Health Section of Epidemiology Anchorage
Alaska Department of Labor 1990 Alaska Population Overview 1988 and Provisional 19a9 Estimates Administrative
Services Division Juneau
Clark Donald W 1984a Prehistory of the Pacific Eskimo Region In Handbook of North American Indians
Volume 5 Arctic David Damas editor pp 136-14a Washington Smithsonian Instituion
1 9a4b Pacific Eskimo Historical Ethnography In Handbook of North American Indians Volume 5 Arctic David Damas editor pp 1a5-197 Washington Smithsonian Instltuion
Davis Nancy Yaw 1984 Contemporary Pacific Eskimo In Handbook of North American Indians Volume 5
Arctic David Damas editor pp 19a-204 Washington Smithsonian Instituion
Evanoff Gail 1990 News from Chenega Bay Around the Rim A Newsletter Serving the People of the
Chugach Region 12(3)6
Fail James A 1900a Subsistence Uses of Fish and Wildlife and the Exxon Valdez Oil Spill Paper
presented at the 17 Annual Meeting of the Alaska Anthropological Association Fairbanks Alaska
1 990b The Division of Subsistence of the Alaska Department of Fish and Game An Overview of Its Research Program and Findings 19aO - 19a9 Arctic Anthropology 27(2)
25
Fall James A and Judith Morris 1987 Fish and Wildlife Harvests in Pilot Point Ugashik and Port Heiden Alaska
Peninsula 1986-1987 Alaska Department of Fish and Game Division of Subsistence Techncial Paper Number 158 Juneau
Fall James A and Robert J Walker 1989 Subsistence Harvest Survey Data for Six Kodiak Island Borough Communities
1986 Alaska Department of Fish and Game Division of Subsistence Technical Paper No 193 Juneau (Draft)
Kodiak Area Native Association 1983 Kodiak Island Area Local Fish and Game Resource Guide Prepared with assistance
from the Department of Fish and Game Division of Subsistence Kodiak
Krauss Michael E 1982 Native Peoples and Languages of Alaska (Map) University of Alaska Alaska Native
Language Center Fairbanks
Morris Judith M 1987 Fish and Wildlife Uses in Six Alaska Peninsula Communities Egegik Chignik
Chignik Lagoon Chignik Lake Perryville and Ivanof Bay Alaska Department of Fish and Game Division of Subsistence Technical Paper No 151 Juneau
Oil Spill Health Task Force (OSHTF) 1989a Results of ADFampG Pilot Study of Subsistence Foods Testing Released by FDA
Report dated 82589 Files Division of Subsistence Anchorage
1989b Interim Findings of Toxicological Expert Committee for Evaluating Data Related to the Consumption of Marine Subsistence Foods (EXXON VALDEZ Oil spill) Report dated September 14 1989 Seattle Washington Files Division of Subsistence Anchorage
1990a Findings of Toxicological Expert Committee for Evaluating Data Related to the Consumption of Marine Subsistence Foods (EXXON VALDEZ Oil spill) Report dated February 21-22 1990 Seattle Washington Files Division of Subsistence Anchorage
1990b February 1990 Newsletter Prepared by Division of Subsistence ADFampG Anchorage
The North Pacific Rim 1981 Chugach Region Community Subsistence Profiles Anchorage
Schroeder Robert F David B Andersen Robert Bosworth Judith M Morris and John M Wright 1987 Subsistence in Alaska Arctic Interior Southcentral Southwest and Western
Regional Summaries Alaska Department of Fish and Game Division of Subsistence Technical Paper No 150 Juneau
Stanek Ronald T 1985 Patterns of Resource Use in English Bay and Port Graham Alaska Department of
Fish and Game Division of Subsistence Technical Paper No 104 Juneau
26
1989 English Bay and Port Graham Resource Harvest Update Alaska Department of Fish and Game Division of Subsistence Technical Paper No 176 Juneau
Stratton lee 1989 Resource Uses in Cordova a Coastal Community of Southcentral Alaska
Department of Fish and Game Division of Subsistence Technical Paper No 153 Juneau
1990 Resource Harvests and Use in Tatitlek Alaska Alaska Department of Fish and Game Division of Subsistence Technical Paper No 181 Juneau (Draft)
Stratton lee and Evelyn B Chisum 1986 Resource Use Patterns in Chenega Western Prince William Sound Chenega in the
1960s and Chenega Bay 1984-1986 Alaska Department of Fish and Game Division of Subsistence Technical Paper No 139 Juneau
United States Department of Agriculture 1983 Food Consumption Households in the West Seasons and Year 1977-78 NFCS
1977-78 Report No H-1O Washington DC
United States Department of Commerce 1980 Census of Population and Housing 1980 -- Summary Tape File 3A On file Division
of Subsistence Anchorage
1984 American Indian Areas and Alaska Native Villages 1980 1980 Census of Population Supplementary Report Bureau of the Census Washington US Government Printing Office
United States Food and Drug Administration (FDA) 1989 Summary of Analyses of Subsistence Seafood from Pilot Study Center for Food
Safety and Applied Nutrition Washington
Varanasi Usha Sin-Lam Chan William D Macleod John E Stein Donald W Brown Douglas G Burrows Karen L Tilbury Catherine A Wigren Tom Horn Susan M Pierce
1990 Survey of Subsistence Fishmiddotand shellfish for Exposure to Oil Spilled from the EXXON VALDEZ Summary (Cycles I-III) Environmental Conservation Division Northwest Fisheries Center National Marine Fisheries Service National Oceanic and Atmospheric Administration Seattle
Walker Robert J David B Andersen and louis Brown 1988 Community Profile Database Catalog Alaska Department of Fish and Game
Division of Subsistence Anchorage
Woodbury Anthony C 1984 Eskimo and Aleut Languages In Handbook of North American Indians Volume 5
Arctic David Damas editor pp 49-63 Washington Smithsonian Instituion
Wolfe Robert J and Robert J Walker 1987 Subsistence Economies in Alaska Productivity Geography and Development
Impacts Arctic Anthropology 24(2) 56-81
27
TABLE 1 POPULATlON AND ETHNICITY STUDY COMMUNmeS
Percent AJas~a CommynitY Popylatfon 1988a Native 1980
TatlUek 101 779 Chenega Bay 68 770c
EngJlsh Bay 159 790 Port Graham 186 876
Ouzinkie 204 942 Port Uons 300 735 Old Harbor 322 926 Larsen Bay 149 833 Karluk 82 1000 Akhiok 93 962
Chignik 128 534 Chignik Lagoon 87 854 Chignik Lake 134 891 Perryville 127 928 lvanof Bay 47 925
a Source AJaska Department of Labor 1990 b Source United States Department of Commerce 1980 1984 c Source Stratton and ChIsum 1986 data pertain to 1985-86 The community was resettJed In 1984
TABLE 2 TOPICAL CONTENT OF DIVISION OF SUBSISTENCE HARVEST SURVEY QUESTlONNAIRE
DEMOGRAPHY For each household member
Birth date Birthplace Length of residency in community Relationship to househoid head Ethnlclty Level of format education Months resided in village in 1989 Plus Information on temporary residents of household In 1989
COMMERCIAL FISHING
Participation in each fishery in 1988 and 1989 Permit holders and crew members by person id number Amount of each resource removed from commercia harvests for home use
SUBSISTENCE USE AND HARVEST For each resource for 1989
Old household use the resource Old household try to harvest the resource Harvest quantftfes by gear type Did the household receive the resource from other harvesters Old the household give away the resource to other households Communities involved In the exchange of resources Areas used for resource harvesting (1989 1988 and -regularly) Plus respondents assessment of the households use of each resource category
in comparison with other years
EMPLOYMENT INCOME AND HOUSEHOLD EXPENSES
For each person over 16 years of age job title employer locatfon of Job months worked shift and amount earned
Other sources of income Household expenses in 1989 An assessment of 1989 expenses compared with other years
OTHER
Respondents views on trends in sharing and on treatment of elders in the community Households receipt of resources from formaJ sharing programsM organized
In response to the spill in 1989
TABLE 3 SAMPLE SIZES OIL SPILL AREA HARVEST SURVEY 1990
Community
Prince WIlliam Sound Subarea
Chenega Bay TatiUek
Subtotal
Lower Cook Inlet Area
english Bay PortGraham
Subtotal
Kodiak Island Borough
Akhiok Karluk Larsen Bay Old Harbor Ouzinkie Port Uons
Subtotal
Alaska Peninsula Area
Chignik Bay Chignik Lagoon Chignik Lake lvanof Bay Perryville
Subtotal
TOTAL
~
21 28
49
41 61
102
13 17 39 46 (50)a 35 (50)a 36 (50)a
186
39 15 28 7
31
120
457
Nymber of Households
Completed Refusals No contact
18 (857) 1 2 22 (786) 3 3
40 (816) 4 5
33 (805) 6 2 48 (787) 9 4
81 -794) 15 6
10 (769) 2 1 14 (824) 1 2 34 (872) 4 1 48 (1043) 2 NA 35 (100) 5 NA 36 (100) 5 NA
177 (952) 19 4
35 (897) 2 2 15 (100) a a 21 (750) a 7 7 (100) 0 a 27 (871) 2 2
105 (875) 4 11
403 (882) 42 26
a Target was a 50 percent random sample of year-round households
TABLE 4 COMPARISON Of SUBSISTENCE HARVESTS IN THE 1980S POUNDS EDIBLE WEIGHT PEA PERSON STUDY COHKUNITIES IN THE OIL SPILL AREA
Haryeat In Poun4 per Perlona Haryelt In Poun41 per Perlona Haryeat In Poun41 per Perlona
COlmlunlty ID1Qf1~~ttlQillill liQf1tlBHltJlBIlliAll li2fl1~iH[HItJfQillill
)~17-BB IjlHli 11)1I~-j9
Tatitlek 76 86 17 n 81 4 8 353 230 142 41 75 113 12 16 652 u 16 46 48 2 207
1~84-85 11)115-116 19III-IIO
Chanesa Bey 64 26 II 55 151 4 4 308 19 62 I 73 143 5 I 361 88 24 lt1 20 4 lt1 138
11)81 111l1li
Englhh Bay 84 112 18 8 21 3 15 272 64 30 14 15 12 2 2 138
Port Graha 82 83 11 II Il 3 11 216 42 58 bull lt1 bull 2 120
)~n )~sect 1118
OuzInkIe 156 65 4i 11 28 33 NA 358 183 63 2i 70 22 30 II 401 21 14 7 It 7 7 3 83
Port lIonl 88 81 31 36 8 8 NA 261 153 4 33 73 I 1 4 323 55 33 II 211 lt1 3 143
014 Harbor 210 6l 32 6i 14 11 NA 466 178 11 2Ii 61 107 bull 2 41t III 38 21 27 23 4 250
Lenen lay 156 64 41 61 54 13 Ht 388 18 33 25 3i 3 3 4 205 6l 38 33 40 18 4 5 203
Karluk 561 18 16 64 82 31 HI 812 250 41 14 44 Ii 25 2 381 181 14 5 27 4 4 2 237
Akhiok 222 U 4i 41 144 34 HI 518 105 6 13 31 2 158 102 58 47 29 43 8 288
19114 Itllil
ChIgnik 145 20 14 5 1 HA li4 lOS 54 16 16 2 4 4 202
ChIgnIk Lagoon 127 Ii IS 5i 2 HA 22i 95 41 21 11 o Ii 4 206
ChIgnik Lke 141 14 3 110 3 5 HA 283 145 38 17 216 8 17 7 441
Perryllle 22i 42 11 85 18 Ii HA lil Iii 65 22 60 27 8 8 382
onof By 275 15 26 iii 21 12 HA 445 226 62 55 140 21 17 10 532
Pound$ edible weight per peron rounded to nearbullbull t whole pound SUM Jan Of bull other ftlh HI bullbullartn Invertebrat GH bull g~bullbull HHmiddot artna ammall SROmiddot bird
and egg_ and PLT bull wIld plantl
TABLE 5 COMPARISON OF COMPOSITION Of SUBSISTENCE HARVESTS IN THE 1980S PERCENTAGE Of TOTAL BY RESOURCE CATEGORY STUDY COHHUNITIES IN THE OIL SPill AREA
Conmunltv
Percentage 0 Totl Capoed 0 lli1 2f1 W it tS IQ ill 1Y1
Percentg 0 Totl Capobullbulld 0 2tl W 2 ti IQ ill
Prcntg 0 Totl Capoed 0 1Y1 QfI1 tIU B tH IQ ill
l~l~U l~se-ei l~tI~-iO
ttthk 22 24 6 23 23 2 36 22 7 12 20 2 2 46 I lt1 22 23
1~I~-l5 li15-16 liIIl-IlO
Chneg Bay 21 8 2 18 4i 21 16 20 li 1 64 II lt1 16 3 lt1 lt1
111111 liBl
Englhh Bay
Port Grha
35
38
41
38
7
7
3
2
8 6
1
middot 411
36
21
49
10 11
ltI
9
7
2
2
1
l~ll 1~6 11I8i
Ou~tnkte
Port lion
lren Bay
Krluk
Akhiok
Old Hrbor
44
II
40
67
43
46
15
34
17
i
6
13
14
14
10
2
9
7
10
14
16
8
8
15
8
3
14
10
28
16
9
3
3
4
7
4
HA
HA
ItA
ItA
HA
HA
46
47
48
66
66
41
16
16
16
11
4
9
7
10
12
8
6
17
23
III
12
20
15
I
2
2
7
26
6
2
2
2
2
1
lt1
32
l8
31
76
36
62
17
23
19
6
20
16
9
II
16
2
16
II
22
20
20
11
10
11
I
9
2
II
I
bull 2
2
2
3
2
4
6
3
ltI
1984 111811
Chignik
Chtgnlk Lgoon
Chignik Lake
Perryllle
lanof 8y
74
55
52
58
62
11
8
5
11
3
4
7
3
6
26
311
22
22
3
6
5
3
2
3
H
HA
HA
HA
HA
62
46
32
60
41
27
21
9
17
12
8
10
4 10
8
18
48
16
2
o
2
7
4
2
3
4
2
3
2
2
2
2
2
Percentage 0 tot1 haret (Pound edible weight) SUM bullbullbull Ion OfH bull other fth HAl bullbullarlne Inertebrte GHf bull g HAMmiddot bullbullrln1bullbull BAD btrd and egg bullbull
bull nd PLT bull middotwtld plant
TABLE 6 COMPARISON OF PER CAPITA SUBSISTENCE HARVESTS STUOY COMMUNITIES
Percentage of decreaseIncrease in subsistence harvests during the year after the Exxon Valdez Oil Spill compared with
Communitv
Tatitlek Chenega Bay
english Bay PortGraham
Ouzinkie Port Lions Old Harbor Larsen Bay Karluk Akhiok
Chignik Chignik Lagoon Chignik Lake Perryville lvanof Bay
Most recent previous measYrement
-683 -618
-793 - 557 - 403 - 10 -244 + 823
Only one previous measurement exists
Average of aU previous measurements
-588 -588
-485 -444
-781 -515 -434 - 314 -609 -202
+ 41 -100 + 587 - 23 + 196
TABLE 7 LEVELS OF PARTICIPATION IN SUBSISTENCE ACTIVITIES 1989 OIL SPIll AREA COHHUNITIESa
Sa]IIIOQ Other fish Marine Iny Game tMrtn Halll Birds llintJ Any Resource Use Au tH u Au tH Yn~HI Wt AtJl tHr In lli HI u lli tIr Ju AR tHr ~ MJ HI
Chenega Bay 100 78 78 85 67 39 22 11 11 94 61 61 39 22 17 6 11 6 72 61 61 100 100 100 Tatitlek 96 59 59 82 50 46 55 32 27 91 64 55 86 36 32 64 46 41 100 91 91 100 100 100
English Bay 97 82 79 76 58 55 91 88 88 73 24 12 85 39 30 42 33 33 61 61 67 100 100 100 Port Graham 92 81 79 79 65 60 71 65 65 21 10 4 60 23 11 50 42 40 54 48 48 96 94 94
Ouzinkie 94 57 57 66 46 46 60 46 46 69 52 43 35 23 23 69 55 55 66 66 63 100 94 92 larsen Bay 100 71 68 94 56 56 97 79 79 94 59 53 32 12 12 71 50 44 85 19 19 100 91 91 Karluk 93 79 79 71 71 71 86 79 79 100 11 71 51 21 21 79 51 51 100 93 93 100 100 100 Akhiok 100 70 70 100 70 70 100 100 100 100 10 70 100 60 60 100 90 90 100 80 80 100 100 100 Old Harbor 100 83 83 90 67 69 96 83 83 85 54 54 68 21 25 11 54 54 90 85 81 100 98 98 Port lions 100 72 69 86 55 49 91 83 83 74 44 44 11 3 3 69 49 49 85 85 85 100 94 94
Chignik 97 80 77 89 83 77 89 80 77 83 60 34 34 20 20 66 54 49 89 86 86 91 100 94 Chignik lagoon 100 67 60 100 67 67 87 53 53 81 41 33 13 1 1 80 41 40 81 80 80 100 93 80 Chignik lake 95 91 86 86 81 81 81 48 48 95 71 61 71 38 29 81 62 62 100 100 100 100 100 100 Ivanof Bay 100 100 100 100 100 100 100 100 100 100 100 100 86 71 51 100 100 100 100 100 100 100 100 100 Perryvi lle 100 93 89 96 78 74 96 89 85 85 56 44 63 41 26 93 10 61 100 96 96 100 100 100
a The study year Is April 1989 - March 1990 for Chenega Bay and Tatitlek for the other communities the study year Is the calendar year 1989
Source Division of Subsistence Alasks Department of Fish and Game Survey 1990
Table 8 ASSESSMENT OF AU RESOURCES
REGIONCommunity Change In HarveatlUse
gher $ame le I I
Reason 01 le Non-splU 011 SplU Analyal Incomplete I
PRINCE WlWAM SOUND
Tatltlek Chenega Bay
2 46 22lI 163 77
1 1 35 31 76 68 3 3 11 11 87 86
7 136 83 20 12
5 60 78l1 12 16 3 3 78 87 8 8
LOWER COOK INlET
english Bay Port Graham
Q 3 3S 12 2fi1 85
3 2 8 6 114 81 8 3 27 15 143 81
31 12l1 18t 70l1 45 18
16 14 amp5 83 3 3 tIS 10l1 110 6OlI 42 29
KODIAK ISLAND
Ouzinkie Port Uona Old Harbor larsen Bay Karluk Akhiok
76 9 384 45 395 46
5 4 36 25 101 71 17 10 74 46 71 44 26 10l1 148 59 76 30 16 10 57 35 88 ~
8 11 33 41 38 48 3 5 38 61 20 34
73 18 t 36 181 46
5 5 39 38 57 66 12 17 27 38 32 45 I 31 41 22 29 23 30 12 14 32 38 44 150 5 13 12 31 22 66 I 8 40 Q 45 3 15 I
AlASKA PENINSULA 16 4 242 60 143 36 38 27 66 46 38 27 I
Chignik 7 5 75 59 46 36 15 33 20 43 11 24 Chignik lagoon 2 4 30 61 17 35 5 29 11 65 1 6 Chignik lake middot 0 70 80 17 20 4 24 12 71 1 6 Perryville 5 5 54 50 49 45 14 29 16 33 19 39 lvanofBay 2 7 13 45 14 48 0 7 I5OlI 7 150
PTAl ___ ~~_ - - ~05 - ~~ 707 40 ~ ~ - ~~ - - sect~- - 524 55 285 3Ol
Tabl 8 OILSPlll-RELATED REASONS FOR REDUCTION IN SUBSISTENCE HARVESTS
REGIONCommunity Households SulVe~
Leu Rllource F bull of Too byWorkIng 0Iher Around Due to SpIY Contamination to Obtain Sub Food Reuon bull
I-fi l(HH HH l(HH HH l(HH HH l(HH
PRINCE WlLUAM SOUND
Tatitlek Chnega Bay
40
22 18
18 451( 35 881( 8 231( 26 851(
10 451( 18 8211 4 181( 8 411( 8 laquoI( 17 841( 6 281( 17 841(
LOWER COOK INLET
Engllfih Bay Port Graham
81
33 61
12 161( 34 42 35 431( 10 121(
10 301( 22 671( 12 361( 8 121( 2 31( 12 201( 23 381( 2 41( I
I
KODIAK ISLAND 1n 2 11( 39 22J( 20 111( 8 61(
Ouzinkie 35 0 01( 9 26 2 61( 4 1151( PottUona 38 1 31( 10 281( 7 191( 1 31( Old Harbor 48 0 0 7 151( 2 41( 1 01( Larsen Bay 34 1 31( 8 261( 6 151( 2 121( Karluk 14 0 01( 3 211( 2 141( 1 171( Akhiok 10 0 01( 1 101( 2 201( 0 011
AlASKA PENINSULA 105 14 131( 24 23 7 71( 22 211(
Chignik 35 3 91( 4 111( 3 91( 10 5011 Chignik lagoon 15 4 271( 2 131( 2 131( 4 33J(
Chignik lake 21 0 01( 8 381( 0 01( 15 381( Perryville 27 8 221( 8 221( 2 71( 3 171( Ivanof Bay 7 1 141( 4 671( 0 01( 0 01(
TOTAl 403 46 111( 132 331( 71 181( fiT 171(
NOTE Analysl of all househOld response Is Incomplete Therefore percentage are minimums
TABLE 10 MEASURES OF OIL SPILL EXPOSURE DISCARDING OF RESOURCES AND OIL SPILL EMPLOYMENT
Percent of Sampled Hoyseholds
Discarding Receiving Resources Resources Percent of due to Through WIth 00 all Jobs Contamination Format SpDI-related that were aU
Commynlty Concerns Prggrams Employment Splll-related
Tatitlek 136 909 173 459
Chenega Bay 222 944 178 400
english Bay 91 939 939 703
Port Graham 229 958 729 545
Akhiok 0 1000 900 357
Kariuk 143 1000 786 413
Larsen Bay 206 912 794 442
Old Harbor 129 937 413 217
Ouzlnkle 116 829 743 354
Port Uons 104 861 583 328
Chignik 171 0 29 11
Chignik Lagoon 133 0 67 27
Chignik Lake 286 0 48 14
lvanof Bay 429 0 143 42
Perryville 407 0 407 211
Source Division of Subsistence ADFampG Survey 1990 preliminary data
I I AHTNA TANAINA I
CENTRAL YUPIK I CHUGACH
I I ALUTIIQ
I I I
-------shy Figure 1
~ el GULF OF ALASKA 0 I L S P ILL
~ ~~ q
BRISTOL BAY Cji- ~
K 0 N I A G AIIHIOK
A L UTI I Q tCb KILOMETER
4 ~ J Jo ~ 2Ao (I U S ri bullbull 11I411f Si
Ollill Otllu - c ic AIIIiI
IF
All ALEUT() VI
STUDY COMMUNITIES
Al ASKA
_ _ bull~~--___J
shyStudy Area
CENTRAL YUPIK
BRISTOL BAY
F J~
ALEU mD
bull 4
I I TANAINA I
~ -
~ ~
I
I I
I
I
AUTNA
Figure 2
- - ~tshy~~
+ft+
GULf Of ALASKA 0 I L S P ILL i-tshy
t-j ~
~
K 0 N I A G AIIHIOlC A L UTI I QtCraquo
(
ICILONLTER
A Jo Jo ~ 2Ao us ri~ bull lilUil Suice
Oilatill Olli - G Ii
STUDY COMMUNITIES ADle 011 Dilri~ulioD II 1 UDI 20111
-shyshy
ALASKA
Study Area
Resources Jan Feb IMar AfJI1 May JWy AugSeptJ Oct INov Dec
~ SaJmon iI
I -- 1 I i I I 11In iRed SaJmon U_____iIHI Pink Salmon
Chum Salmon 1middot---__II51U Silver SaJmon i I I
SaJmon Roe I I Halibut Hn
Herr~ Wt
1
I I II IIBlack Rockflsh I I I ~
~ ala I I ~ I ICOw ck ~111lnI1 IInullunIIIIIIIIbullbull_-il__ I I I I I I )
C~ Gray uu~nlmIIRIIbullbullbullbulllln~IIIbullbullbull~IIIbullbull~nIbullbull~IIIUbullbullIIII~I1II bullbull11I1
Ungcod I Iii I I I Red Rockfish I I lImIllIIII1middotI~middotImiddotmiddotbulll I
Sme4t ~1I1 i I I I I I Dollv Varden j IT~aIIbullbullbull~lnm~
Trout ~~mmI I Chitons ~HUII I ~nllIIn 1111 I
I J ill i I I Clams Razor I bullbullbullflubull 1InllbullbullIRI n II~ Clams Other 1IJnIIbullbull~II~nn~IIbullbullbull
I I T I I I 1 Cockles r_IUIl ~III I Mussels nu~ I I I
I i I I OctOQus IIlImmIIIliHIIII~nnn I I
Sea ClJcuTbers i I I Iii I lItmll~ i Seaweed I I lin 11In I
I I I rShrimp wlIn IIIIIIIbullbullnnI III
I f 1 I I I I I
Sea Won u_unIbullbullbullHluini IIIII__
Sea Otter ~a i I I I i H Harbor SeaJ n ______
Black Bear I I 1111 t 1IIIIIIII~IIIU1~ I 1 I IDeer ~IR I _________~
tGHoaare I i I
i I I-------I I I 1111Moose I I I ~ I
Porcupine IIIIIIII I 11InnRnn_
Crane II_H i I I ~ 1fDUCKS Geese I I I i I I i IGrouse
ptarmigan Bird Eggs _I I I I l i
Furbearers Ii inn illlIIIImiddotI--I-~Berries Pfants
Figure 3 Seasonal Round of Harvest Activities Chenega Bay 1984-1986 (Solid line s hews usual harvest season Broiten line indicates occasional effort )
I
I I 1r-------------------
~aO
II --- -- - - - I
I 1
1 I 1
~=O I ~r~ ~i~ ~ 0 I ~O~ I
Imiddot
-
Ii 6 7 1tIIIII
KEY
] Hrvbullbullted a bullbull 1 ~
0A Received 8eal
I shyt-1
L1J Houbullbullhold Unit tshy
shy -- shy - -- - - shy --- shy - I
I 1 1 2 I 3 I 4 I A cJ
SHARING Of SUBSISTENCE fOODS
Sharing of subsistence h8lVests Is widespread In aI the AJutlIq communities ThIs example Ii from EngUsh Bay lower Cook Inlet A hunter In Household (HH) 3 (A) shot a harbor seal while on a ~ tclp with his partner his cousin (MBS) In HH 7 (~) The partners s the seal equally and In turn shared It with six other households e househok18 wifh elders (HHs 4 6 6 ~_8) at their request received most of the fat the flippers and the IUIUS Others received fat ribs roasts liver kidneys and the heart In total 8 households with 25 people used portIOns of the seal AU the housholds were Inked by kinship ties
6~IO6 6-0 I ~~ I
b-O
I I I I 1 66~00
-----
I 8 I~
Male
Female
Marriage Link
Divorce
Figure 4 Distribution of a Seal English Bay
Harvest Composition Comparison Tatitlek
2_ 26 marine 11M de lft
ine 204
1988 1989 n -=a 3526 n ra 6523
NIaaon
nonaalmon 1 bull 1
198990 n 2066
middotWr-O~
bt - 04 Figlue 5 Composition of Subsistence Harvests Pounds Edible pampda - 0 Wetght per Person by Respurce CategolmiddotY Tatitlek 1981-8 1988-9
and 1989-90
Harvest Composition Comparison English Bay
salmon 462 346
pants 13 pants 65
nonsalmon 412 66 nonsalmon 213deg4marine Invl
birds 11 marin2 marTVTlais 77 85
game 33~ game 106 1987 198990
n 272 n-1391
Figure 6 Composition of Subsistence Harvests Pounds Edible Weight per Person by Resource Category English Bay 1987 and 1989
Harvest Composition Comparison Old Harbor
aaJmon 45 aaImon U
pIIrda 0 bull nonaaImon 1U
mIIIne IrM 1
mIIIne RIIIINMII 26bull
1983 1986 n = 4653 n = 4191
aaImon~U
plan 0
game 10 bull
198990 n = 2502
Figure 7 Composition of Subsistence Harvests Pounds Edible Weight per Person by Resource Category Old Harbor 1983 1986 and 1989
Harvest Composition Comparison Perryville
salmon 585 salmon 499
marine Invt 28 plants 22 birds 16
marine marrvnas ~aImon
marine mammals 71 game 216 game 157
1984 198990 n = 3905 n = 3815
Figure 8 Composition of Subsistence Harvests Pounds Edible Weight per Person
by Resourc~ Category Perryville 1984 and 1989
500
~ 0 00 tu 400
A ~
~ 300
Ul d ~ 200 ~ 0
P- 100
o 0
4fr lte~
Per Capita Subalatence Harveats In the year following the EXXON VALDEZ 011 spill
600
~ GOO
rAm
~l)-i ~e ~e ~of svf ~lgt-i Q0~ ~ ef gtgt oo~ ~I- ~~ ~lgt- ~ )li-~ 0 ~~ f Jgt~G~~ e v ~ v4
vlgt-~ aO- ~o~ 0G~~middot ~~ G~~
Community
Figure 9 Subsistence Harvests Pounds Edible Weight per Person in the Year Following the Exxon Valdez Oil Spill
lgt-~ ~~i 1 ~~ ~ ltcentgtl ef
10 1gt ltgto~ ~~~ ~eYQ 0shy~ G~e
1000
s Cd Q)
~ 800 s Q)
P
s o 600 CIl s Q)
P
s 400 Q)
P Cl
U s 200 o ~
P
a
Per Capita Subsistence Harvests Oil Spill Study Communities
Prince
Alaska Peninsula Kodiak L Cook Inlet William Sound middot
~ ~Igti -re ~V-e 01 ov ivV- ~Igti u0i 01fgt Ye ~Igti~ GIgtO~ ~Igti v~1gt10 ~e 1W y IgtQ0 CQ1 v ~Igt ~e1 1 Igt i V ()v1-1 oo ~~Q~ eQ1gt Igte cp 1 yen Ce1~ ()U ~o
Cp
bull Pre -Spill I II Pre -Spill II II Spill Year Two previous study years exist tor Kodiak and Prince Wm Sound One previous study year exists tor AK Peninsula and L Cook Inlet
Figure 10 Comparison of Subsistence Harvests Pounds Edible Weight per Person Before und After the Exxon Valdez Oil Spill
Comparison of Subsistence Harvests
Pounds per person per year
Before and after the EXXON VALDEZ 011 spill
100
80
6000 en [J) c 40 ~
20E 1)
~ oco c c
-20 ~ c ~
-40~ 5 (fl
-60
-80
-100
t-
l-- Alaska Peninsula
t--
t-
l-I-
= IillIt-
l--
1--
l--
1--
West
Q)
I c g ~ ~
2 0)
2 o
Kodiak Cook Inlet Prince WIlliam Sound
600 mUea from apiI 300 mile from plll 100 mile rom plY
~
E 0)
8 t t
I
I i1illllll~llllliiilil~H ~HQ nfi
Community
Figure ll Difference in Subsistence Harvests Before and After the Exxon Valdez Oil Spill
ll~iil jllmiii ~
i Ii I~i ~bullbullbull ~ i~
1~1 l~l hl1 lmmi
t - -
East
Harvest Composition Comparison Chenega Bay
nonsalmon 84 birds 12 birda 13nonaalmon
game
maiine Inlll 11 game 191 Ii~ plana 12 planl 13
marine mammala 489
198485 198586 n = 3089 n = 3716
ill 1~ marin mammal 26
nonsaJmon 116
198990 n = 1381
bull birds = 07 marine inlll 02 plants 07
Fi~ure 12 Composition of Subsistence Harvests Pounds Edible Weight per Person by Resource Category Chenega Bay 198485 198586 and 198990
Harvest Composition Comparison Ouzinkie
uJrnon4U~ aaImon 411
pIInIa 1 ~ nonaaJmonlU IlQflIIImQn 161
u
marine mammaIa Ja
1983 1986 n =3583 n = 4012
pienta 4~
marine maminaIa 13
198990 n = 833
Figure 13 Composition of Subsistence Harvests Pounds Edible Weight per Person by Resource Category Ouzinkie 1983 1986 and 1989
Harvest Composition Comparison Chignik Lake
salmon 521
nonsalmon 86
fu~(ile ~ 12 plants 16 i111ne Wanvnals 12 marine Invt 39nonsaimon 51
birds 37 marine marrvnals 20
game 388 1984 198990
n = 2825 n = 4491
Figure 14 Composition of Subsistence HarvestB Pounds Edible Weight per Person by Resource Category Chignik Lake 1984 and 1989
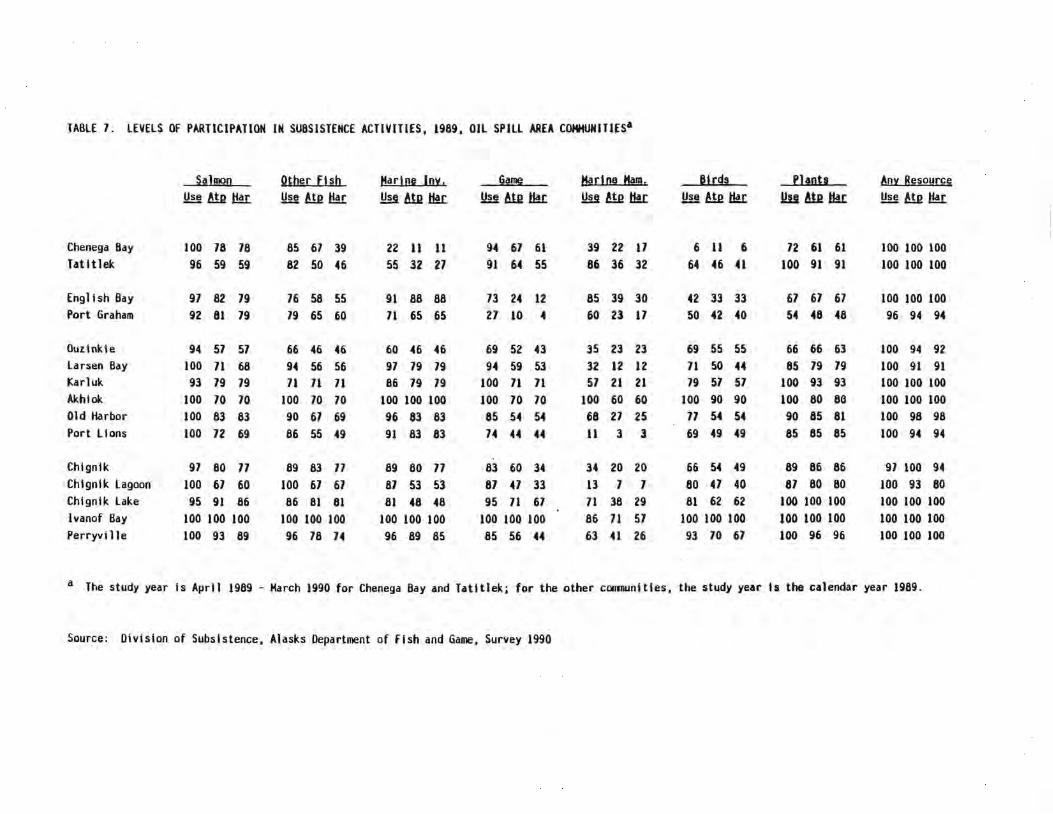
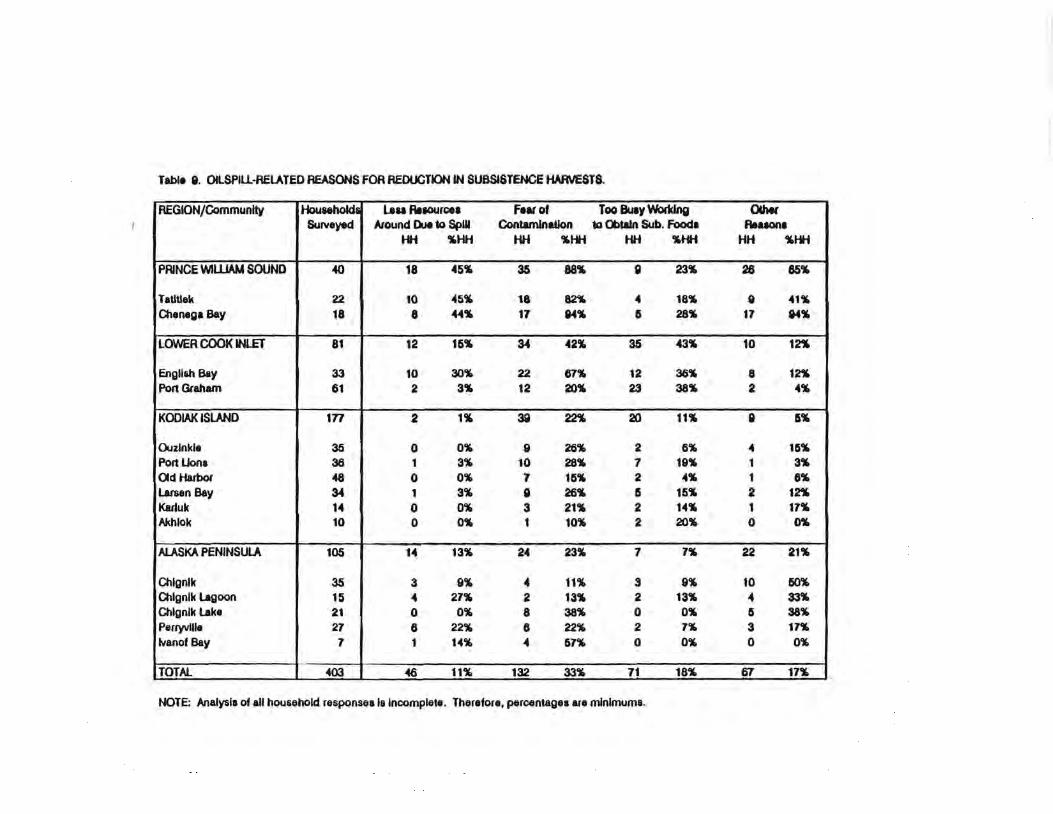

I
I I 1r-------------------
~aO
II --- -- - - - I
I 1
1 I 1
~=O I ~r~ ~i~ ~ 0 I ~O~ I
Imiddot
-
Ii 6 7 1tIIIII
KEY
] Hrvbullbullted a bullbull 1 ~
0A Received 8eal
I shyt-1
L1J Houbullbullhold Unit tshy
shy -- shy - -- - - shy --- shy - I
I 1 1 2 I 3 I 4 I A cJ
SHARING Of SUBSISTENCE fOODS
Sharing of subsistence h8lVests Is widespread In aI the AJutlIq communities ThIs example Ii from EngUsh Bay lower Cook Inlet A hunter In Household (HH) 3 (A) shot a harbor seal while on a ~ tclp with his partner his cousin (MBS) In HH 7 (~) The partners s the seal equally and In turn shared It with six other households e househok18 wifh elders (HHs 4 6 6 ~_8) at their request received most of the fat the flippers and the IUIUS Others received fat ribs roasts liver kidneys and the heart In total 8 households with 25 people used portIOns of the seal AU the housholds were Inked by kinship ties
6~IO6 6-0 I ~~ I
b-O
I I I I 1 66~00
-----
I 8 I~
Male
Female
Marriage Link
Divorce
Figure 4 Distribution of a Seal English Bay
Harvest Composition Comparison Tatitlek
2_ 26 marine 11M de lft
ine 204
1988 1989 n -=a 3526 n ra 6523
NIaaon
nonaalmon 1 bull 1
198990 n 2066
middotWr-O~
bt - 04 Figlue 5 Composition of Subsistence Harvests Pounds Edible pampda - 0 Wetght per Person by Respurce CategolmiddotY Tatitlek 1981-8 1988-9
and 1989-90
Harvest Composition Comparison English Bay
salmon 462 346
pants 13 pants 65
nonsalmon 412 66 nonsalmon 213deg4marine Invl
birds 11 marin2 marTVTlais 77 85
game 33~ game 106 1987 198990
n 272 n-1391
Figure 6 Composition of Subsistence Harvests Pounds Edible Weight per Person by Resource Category English Bay 1987 and 1989
Harvest Composition Comparison Old Harbor
aaJmon 45 aaImon U
pIIrda 0 bull nonaaImon 1U
mIIIne IrM 1
mIIIne RIIIINMII 26bull
1983 1986 n = 4653 n = 4191
aaImon~U
plan 0
game 10 bull
198990 n = 2502
Figure 7 Composition of Subsistence Harvests Pounds Edible Weight per Person by Resource Category Old Harbor 1983 1986 and 1989
Harvest Composition Comparison Perryville
salmon 585 salmon 499
marine Invt 28 plants 22 birds 16
marine marrvnas ~aImon
marine mammals 71 game 216 game 157
1984 198990 n = 3905 n = 3815
Figure 8 Composition of Subsistence Harvests Pounds Edible Weight per Person
by Resourc~ Category Perryville 1984 and 1989
500
~ 0 00 tu 400
A ~
~ 300
Ul d ~ 200 ~ 0
P- 100
o 0
4fr lte~
Per Capita Subalatence Harveats In the year following the EXXON VALDEZ 011 spill
600
~ GOO
rAm
~l)-i ~e ~e ~of svf ~lgt-i Q0~ ~ ef gtgt oo~ ~I- ~~ ~lgt- ~ )li-~ 0 ~~ f Jgt~G~~ e v ~ v4
vlgt-~ aO- ~o~ 0G~~middot ~~ G~~
Community
Figure 9 Subsistence Harvests Pounds Edible Weight per Person in the Year Following the Exxon Valdez Oil Spill
lgt-~ ~~i 1 ~~ ~ ltcentgtl ef
10 1gt ltgto~ ~~~ ~eYQ 0shy~ G~e
1000
s Cd Q)
~ 800 s Q)
P
s o 600 CIl s Q)
P
s 400 Q)
P Cl
U s 200 o ~
P
a
Per Capita Subsistence Harvests Oil Spill Study Communities
Prince
Alaska Peninsula Kodiak L Cook Inlet William Sound middot
~ ~Igti -re ~V-e 01 ov ivV- ~Igti u0i 01fgt Ye ~Igti~ GIgtO~ ~Igti v~1gt10 ~e 1W y IgtQ0 CQ1 v ~Igt ~e1 1 Igt i V ()v1-1 oo ~~Q~ eQ1gt Igte cp 1 yen Ce1~ ()U ~o
Cp
bull Pre -Spill I II Pre -Spill II II Spill Year Two previous study years exist tor Kodiak and Prince Wm Sound One previous study year exists tor AK Peninsula and L Cook Inlet
Figure 10 Comparison of Subsistence Harvests Pounds Edible Weight per Person Before und After the Exxon Valdez Oil Spill
Comparison of Subsistence Harvests
Pounds per person per year
Before and after the EXXON VALDEZ 011 spill
100
80
6000 en [J) c 40 ~
20E 1)
~ oco c c
-20 ~ c ~
-40~ 5 (fl
-60
-80
-100
t-
l-- Alaska Peninsula
t--
t-
l-I-
= IillIt-
l--
1--
l--
1--
West
Q)
I c g ~ ~
2 0)
2 o
Kodiak Cook Inlet Prince WIlliam Sound
600 mUea from apiI 300 mile from plll 100 mile rom plY
~
E 0)
8 t t
I
I i1illllll~llllliiilil~H ~HQ nfi
Community
Figure ll Difference in Subsistence Harvests Before and After the Exxon Valdez Oil Spill
ll~iil jllmiii ~
i Ii I~i ~bullbullbull ~ i~
1~1 l~l hl1 lmmi
t - -
East
Harvest Composition Comparison Chenega Bay
nonsalmon 84 birds 12 birda 13nonaalmon
game
maiine Inlll 11 game 191 Ii~ plana 12 planl 13
marine mammala 489
198485 198586 n = 3089 n = 3716
ill 1~ marin mammal 26
nonsaJmon 116
198990 n = 1381
bull birds = 07 marine inlll 02 plants 07
Fi~ure 12 Composition of Subsistence Harvests Pounds Edible Weight per Person by Resource Category Chenega Bay 198485 198586 and 198990
Harvest Composition Comparison Ouzinkie
uJrnon4U~ aaImon 411
pIInIa 1 ~ nonaaJmonlU IlQflIIImQn 161
u
marine mammaIa Ja
1983 1986 n =3583 n = 4012
pienta 4~
marine maminaIa 13
198990 n = 833
Figure 13 Composition of Subsistence Harvests Pounds Edible Weight per Person by Resource Category Ouzinkie 1983 1986 and 1989
Harvest Composition Comparison Chignik Lake
salmon 521
nonsalmon 86
fu~(ile ~ 12 plants 16 i111ne Wanvnals 12 marine Invt 39nonsaimon 51
birds 37 marine marrvnals 20
game 388 1984 198990
n = 2825 n = 4491
Figure 14 Composition of Subsistence HarvestB Pounds Edible Weight per Person by Resource Category Chignik Lake 1984 and 1989
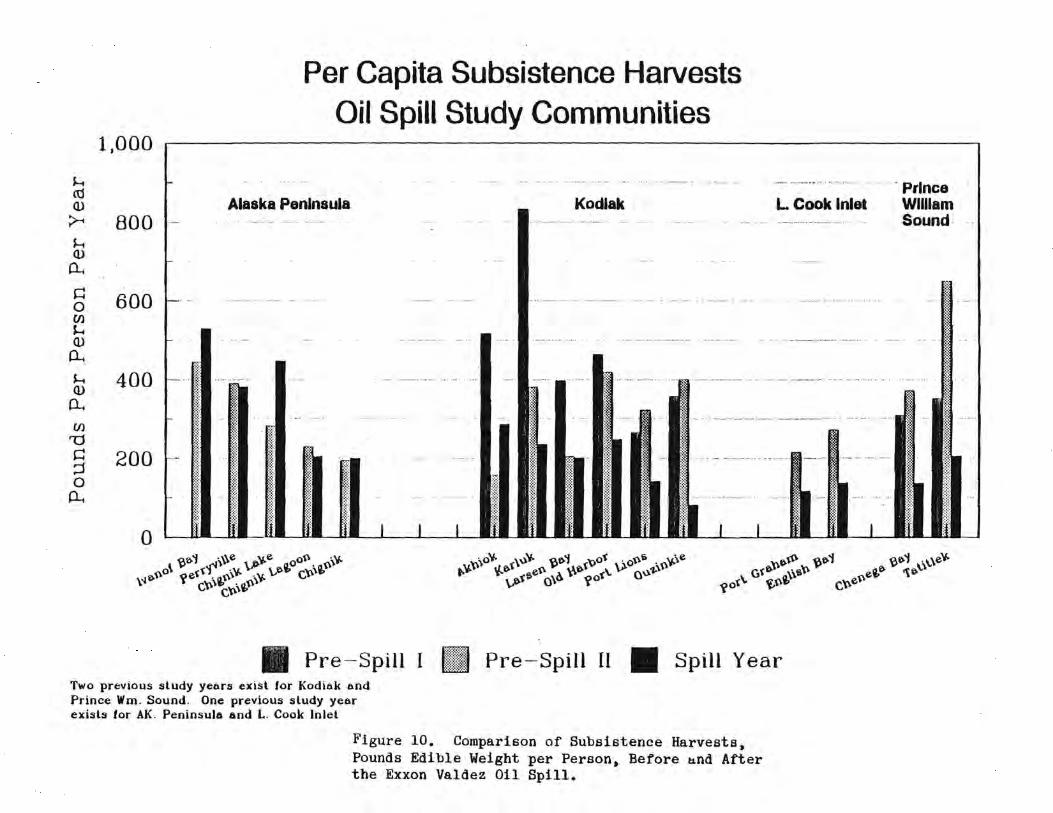