substance abuse livingston, michigan
TRANSCRIPT

!COMMUNITY!FOCUS:!Substance!Abuse!Indicators!!
in!Livingston!and!Washtenaw!Counties!!
_________________________________________________________________!!!!
Presented!by!the!!
Substance!Abuse!Monitoring,!Assessment!&!Recommendation!Team!A!subgroup!of!the!Livingston/Washtenaw!Substance!Abuse!Advisory!Council!
!!!
Epidemiologist/Principal!Author:!!Adreanne!Waller,!MPH,!Washtenaw!County!Public!Health!Coordinator:!!Jane!S.!Goerge,!MA,!Washtenaw!County!Public!Health!
!
!!
December!21,!2010!
!! ! ! ! ! ! ! ! ! ! ! ! !

Table!of!Contents!_________________________________________________________________!!!Substance!Abuse!Monitoring,!Assessment!&!Recommendation!Team!&!Acknowledgments!...................................................!1!!Overview!..............................................................................................................................................................!2!!Substance!Abuse!Indicator!Highlights!..........................................................................................................................!4!! !Indicators!
30"Day!Use!..................................................................................................................................................!6!!Perceived!Risk!of!Use!.....................................................................................................................................!8!!Age!of!First!Use!............................................................................................................................................!10!!DUI!Drug!Arrest!Rate!....................................................................................................................................!12!!Absenteeism!...............................................................................................................................................!14!!High!School!Dropout!.....................................................................................................................................!16!!Divorce!Rate!...............................................................................................................................................!18!!Motor!Vehicle!Crash!with!DUI!.........................................................................................................................!20!!Perceptions!of!Parental!Disapproval!................................................................................................................!22!!Unemployment............................................................................................................................................!24!

Substance!Abuse!Monitoring,!Assessment!&!Recommendation!Team!&!Acknowledgments!!!
Substance!Abuse!Monitoring,!Assessment!&!Recommendation!Team!!!!Terri!Beadlescomb,!LMSW,!Washtenaw!County!Juvenile!Drug!Court!Lindsay!Beaudry,!Human!Services!Collaborative!Body!of!Livingston!County!Mary!Beno,!MS,!Livingston!Educational!Service!Agency!Karen!Bergbower,!LMSW,!CAAC,!CPC"M,!Karen!Bergbower!&!Associates!!!Reiley!Curran,!MPH,!Chelsea!Community!Hospital!Therese!Doud,!LBSW,!Livingston/Washtenaw!Substance!Abuse!Coordinating!Agency!Jane!S.!Goerge,!MA,!Washtenaw!County!Public!Health!!Quinn!LaPeer,!Washtenaw!County!Sheriff’s!Office!Rick!Leyshock,!Washtenaw!Intermediate!School!District!Michael!B.!Murphy,!MA,!LMSW,!Human!Networks!Maureen!Norman,!MS,!Complete!Counseling!Center!Marci!Scalera,!ACSW,!LMSW,!CAAC,!Livingston/Washtenaw!Substance!Abuse!Coordinating!Agency!Adreanne!Waller,!MPH,!Washtenaw!County!Public!Health!!!
Acknowledgments!Fatema!Boxwala,!MPH,!Washtenaw!County!Public!Health!Lisa!Clarkson,!MPH,!Washtenaw!County!Public!Health!Donald!Dalgleish,!St.!Joseph!Church!Amanda!Naugle,!BS,!Washtenaw!County!Public!Health!Naomi!Norman,!Washtenaw!Intermediate!School!District!Reshma!Patel,!Student!Intern,!Washtenaw!County!Public!Health!Ruth!Shantz,!MSW,!Chelsea!Community!Hospital!Amy!Teddy,!BS,!University!of!Michigan,!C.S.!Mott!Children’s!Hospital!Marc!Zimmerman,!PhD,!University!of!Michigan,!Health!Behavior!&!Health!Education!!
The!SAFE!&!SOUND!survey!was!administered!by!Morley,!Inc.!!
Funding!Provided!By:!!!Michigan!Department!of!Community!Health,!Bureau!of!Substance!Abuse!and!Addiction!Services!!!! ! !
1

!! ! ! !!!!!!!!!!!!!Community Focus Livingston/Washtenaw Substance Abuse Coordinating Agency !
In October 2004, the Michigan Department of Community Health Office of Drug Control Policy received a Strategic Prevention Framework – State Incentive Grant (SPF/SIG) from the Substance Abuse and Mental Health Services Administration/Center for Substance Abuse Prevention (SAMHSA/CSAP). The purpose of SPF funding was to prevent the onset and reduce the progression of substance abuse and related problems. The SPF emphasizes the need to identify and address community influences that promote or discourage substance abuse. These powerful influences include advertising, pricing, law enforcement, cultural norms, access and availability of alcohol and other drugs. This emphasis represents a shift in prevention approaches that have traditionally focused on individuals’ knowledge, attitudes and behaviors. The Strategic Prevention Framework is an outcome-based, data driven, population-level approach to substance abuse prevention planning. The Substance Abuse and Mental Health Services Administration’s (SAMHSA) five step approach was used to direct this initiative.
SAMHSA’S Strategic Prevention Framework
! Assessment ! Capacity ! Planning ! Implementation ! Evaluation
The Livingston/Washtenaw Substance Abuse Coordinating Agency (CA) began implementing the Strategic Prevention Framework (SPF) in May 2007. Since this time the CA established a Community Epidemiological Workgroup (CEW) to conduct a community level needs assessment to define and drive decision making. This included a review of existing relevant substance abuse data on consumption and consequences such as alcohol-related traffic crash deaths and has helped to shape substance abuse prevention programming in Livingston and Washtenaw Counties.
Establishing SMART In order to continue to track and review community substance abuse related issues and make funding recommendations based on this information, a permanent subgroup of the Livingston/Washtenaw Substance Abuse Advisory Council was established. The Substance Abuse Monitoring, Assessment & Recommendation Team (SMART) consists of representatives from health, law enforcement, education, courts, service providers, mental health, substance abuse prevention and treatment services.
Areas of Interest & Selection Process In January 2009, Adreanne Waller, WCPH Epidemiologist, provided a structure for how our region (Livingston and Washtenaw) might measure substance abuse prevention needs. These included conventional measures regarding substance use (binge drinking, marijuana use, etc.) but also included indicators of substance abuse risk. For instance, some predictors of substance abuse include unemployment, high school dropout, as well as perceived risk of use and parental approval. Thus, assessment measures were selected for monitoring progress.
This structure identified criteria against which to measure indicators, including measurability, reliability, availability, and community importance. SMART then reviewed a matrix summarizing nearly 150 assessment indicators from various assessment models used to determine community substance abuse prevention needs. The indicator categories included the use of a social-ecological schema and SAMHSA-identified ‘ intervening variables’ extending beyond simply drug use and consequences. These community measures include consumption, accessibility, crime, education, family organization, social connectedness, etc. The following indicators were selected and rated against the aforementioned criteria:
! 30-Day Use ! Availability of Alcohol, Tobacco, &
Other Drugs ! Perceived Risk of Use ! Age of First Use ! Youth Drug Related Hospital
Diagnosis Rate ! Adult DUI Drug Arrest Rate ! Youth DUI Drug Arrest Rate ! Absenteeism ! High School Dropout ! Divorce Rate ! Motor Vehicle Crash with DUI ! Perceptions of Parental Disapproval ! Unemployment
!
2

!! ! ! !!!!!!!!!!!!!Community Focus Livingston/Washtenaw Substance Abuse Coordinating Agency !
SAFE & SOUND Survey The Substance Abuse Factors in our Environment and Survey for Understanding Neighborhood Determinants is a baseline survey conducted by the Washtenaw & Livingston Substance Abuse Coordinating Agency (SACA), SMART in August /September of 2009. This survey was designed to assess use, perceptions of risks, availability, parental perception of youth substance use, perceived parental efficacy and community norms encouraging substance abuse, as well as protective factors and environmental influences such as pricing, promotion, and law enforcement among randomly selected adults and youth (ages 12-17 years old) in Livingston and Washtenaw counties. A ma jor goal of the survey method design was to enable comparisons between adult and youth responses, including parental influence on youth substance use and attitudes. Survey questions were selected from already existing state and national tools, enabling comparability.
Purpose & Structure of Report Identifying and understanding substance abuse related issues in our locality are vital to making recommendations for potential improvements. Community Focus: Substance Abuse Indicators in Livingston and Washtenaw Counties was developed to assist this process and share findings with the greater region. In times of limited funding opportunities, it becomes even more critical to determine specific needs and target efforts through community and research based strategies.
Thus, resource allocation decisions are driven through a ‘diagnostic ’ understanding of substance abuse prevention needs. By utilizing the expertise of SMART members and other community professionals, an analysis of selected SMART indicators was conducted. The content of this report includes the indicator and the associated definition, status, limitations, relationship to substance abuse, relationship to the Recovery Oriented Systems of Care, potential evidenced-based interventions, and relevant SAFE & SOUND data.
Benefits to the Community & Next Steps for SMART Substance abuse continues to be associated with various individual, familial, and community issues. The Livingston/Washtenaw Substance Abuse Coordinating Agency understands the importance of targeting needs and strategies to promote healthy communities and individual well-being. By sharing and reporting results of the substance abuse related indicator analysis and the SAFE & SOUND survey, SMART hopes to promote the use of this information to target specific concerns and implement community-based, collaborative efforts. This report provides potential evidenced based interventions to enhance the opportunity for success and to reduce the negative effects of substance abuse.
SMART will continue to review substance abuse related data, identify gaps in data, and make recommendations based on this information. The long-term goal is to have community organizations, agencies and governmental entities include the priorities identified from SMART indicators into their strategic plans for funding, program planning and resource allocation decisions.
Connection to Other Initiatives SAMHSA is currently promoting the Recovery Oriented Systems of Care (ROSC). ROSC principles support person/family-centered and self-directed approaches to care that build on the personal responsibility, strengths, and resilience of individuals, families, and communities to achieve sustained health, wellness, and recovery from alcohol and other drug problems. The SPF and ROSC paradigms blend together to provide an!upstream approach to preventing substance abuse, as well as supporting persons in recovery. !
3

!! ! ! !!!!!!!!!!!!!Community Focus Livingston/Washtenaw Substance Abuse Coordinating Agency !
Unemployment ! The unemployment rate in Michigan is 40%
higher than that for the United States. ! The unemployment rate in Livingston
County in 2010 (12.1%) is 330% higher than it was in 2000 (2.8%).
! Binge drinking rates are two to four times higher in high school versus college graduates in Livingston and Washtenaw.
! Investing in substance abuse prevention and treatment reduces unemployment, absenteeism, tardiness and health care costs.
Perceptions of Parental Disapproval ! Washtenaw County youth identify having
parents who feel substance use would be ‘very wrong’ at significantly lower rates than Livingston County youth.
! Livingston and Washtenaw County youth who use alcohol or marijuana perceive less peer, parental and school disapproval than youth who do not use these substances.
! Parental disapproval of substance abuse is critical to preventing youth use. Interventions should target parents least likely to express disapproval.
High School Dropout and Graduation ! Livingston and Washtenaw Counties have
higher high school graduation rates than Michigan or the U.S.
! Dropping out is not a sudden act. Youth drop out of high school because they need a job, have failing grades, see classes as boring and perceive low expectations from others. Early warning systems can help identify students early so appropriate supports can be provided.
! Adults who are high school dropouts are 60%-150% more likely to use illicit substances than adults who graduated from high school.
! Poorer academic achievement also predicts greater risk of substance abuse.
30 Day Use ! Livingston and Washtenaw Counties have
significantly higher past month use for both alcohol and marijuana compared to Michigan or the U.S.
! Livingston and Washtenaw Counties have the highest rate of marijuana initiation during 2006-2008 compared to other Michigan counties and nearly all of the United States.
! The combination of high initiation rates plus low perceived risk of marijuana use in Livingston and Washtenaw presents a significant challenge regarding current and future addiction rates.
Perceived Risk ! Livingston and Washtenaw Counties have
much lower levels of perceived risk for marijuana use or binge drinking compared to Michigan or the U.S.
! Adolescents who perceive low risk from smoking marijuana were nearly seven times more likely to use marijuana than adolescents who perceive great risk.
! Livingston and Washtenaw youth who do not perceive great risk of marijuana use or binge drinking are much more likely to use than youth who do perceive great risk.
! Interventions to increase perceptions of risk should be particularly focused on youth whose parents are substance abusers.
DUI Crashes ! Underage drinkers are more likely to drink
more drinks and drive under the influence than are older adult drinkers.
! Livingston and Washtenaw County adults who report driving under the influence are much more likely to drink more drinks on each occasion than drinkers who do not drive under the influence.
4

!! ! ! !!!!!!!!!!!!!Community Focus Livingston/Washtenaw Substance Abuse Coordinating Agency !
! The percent of all motor vehicle crashes involving alcohol, as well as the fatal crashes involving alcohol, has remained steady for Livingston and Washtenaw during 2004-2008.
DUI Arrests ! Minority groups and residents of smaller
metropolitan communities are more likely to be arrested for DUI than residents of larger metropolitan communities.
! DUI arrest rates for Michigan and Livingston County have decreased between 2000 and 2006. However Washtenaw County adult DUI arrests have increased 40% during that time.
! DUI arrests frequently result in suspended driver’s licenses. Substance abusers are much more likely to be successful in recovery if they have access to employment, education and community resources. Appropriate opportunities for such access are critical.
! Employed females are three times more likely to be referred to substance abuse treatment resulting from DUI arrests than are unemployed females.!
Divorce!!! Divorce rates have dropped in Washtenaw,
Livingston and Michigan during the 2000’s. ! Increases in 1 liter of alcohol consumption
per capita results in 20% increase in divorce rates.
! Children in divorced families are two to three times more likely to drop out of school, have poorer academic achievement, and initiate drinking earlier, and use alcohol as a coping mechanism than their peers whose parents are not divorced.
! Livingston and Washtenaw adults who consume alcohol and who are divorced are three times more likely to be binge drinkers than their non-divorced counterparts.
Age of First Use!!! Washtenaw County youth have higher rates
of alcohol, marijuana and cigarette initiation younger than age 13 compared to Livingston County youth.
! Livingston and Washtenaw County youth initiate alcohol use at age 13.3 years and marijuana at age 14, on average.
! Interventions designed to delay age of first use must target youth in fourth or fifth grade or younger.
Absenteeism!! Risk factors for absenteeism include
phobias, anxiety, depression, lack of parental supervision, and poor academic achievement.
! School connectedness even in early secondary school predicts late teenage substance use, mental health and academic outcomes.
! In Michigan, African American students and students with disabilities have the highest absenteeism rates compared to other groups.
! Livingston and Washtenaw youth who use marijuana are more likely to have lower grades, say that their teacher never or seldomly notices when they do a good job, never or seldomly enjoys being at school and never or seldomly feels that what they do at school makes a difference, compared to their non-using counterparts.
!
5

!! ! ! !!!!!!!!!!!!!Community Focus Livingston/Washtenaw Substance Abuse Coordinating Agency !
How is ’30 day’ or ‘past month’ use defined. ‘30 day use’ refers to use of a substance at least once during the month preceding an individual ’s response to a given survey. How do we compare? ! Table 1 below indicates that the
Livingston and Washtenaw region has higher levels of past month alcohol, marijuana and illicit drug use compared to the United States. However, Michigan has higher rates of illicit drug use compared to rates in Livingston, Washtenaw or the United States.
Table!1!"!Substance!Use!in!Past!Month!!!2006"20081!! Livingston/!
Washtenaw!Region!
Michigan! United!States!
Alcohol! 61.9! 55.0! 51.2!
Marijuana! 7.5! 6.9! 5.9!
Illicit!Drugs!
4.0! 9.0! 3.7!
! An additional indicator related to ‘past
month use’ is the ‘ first use annual rate. ’ ‘First use’ indicates the proportion of a population initiating substance use during a certain period of time. As seen in Figure 1, the Livingston and Washtenaw region had the highest rate of first use of marijuana in 2006-2008 compared to all Michigan counties. In fact, the Livingston and Washtenaw region is in the highest rate category for the U.S. (see dark maroon indicating 2.53-3.55).
! The Livingston and Washtenaw region has
the lowest proportion of the population 12 and older that perceive that smoking marijuana once a month as a ‘great risk’ compared to all other Michigan regions (23% compared to 34% for Michigan).
Figure!1
6

!! ! ! !!!!!!!!!!!!!Community Focus Livingston/Washtenaw Substance Abuse Coordinating Agency !
What risk groups are most likely to have past month substance use? ! Illicit Drugs
o Persons 18-20 years o Males o Persons of two or more races o Unemployed o Large metropolitan cities
! Alcohol o Persons 21-25 years o Males o White o College educated o Employed o Large metropolitan areas
What are the trends regarding past month use? Table 2 below indicates that past month marijuana and alcohol use has decreased for adults and youth, with the exception of a slight increase for alcohol in 2008.
!Table!2!"!Past!Month!Use!"!Marijuana!&!Alcohol!!!
United!States!2002"2008!! 2002! 2005! 2008Marijuana!(12"17!years)!!
15.8! 13.3! 13.0
Alcohol!(12"17!years)! 17.6! 16.5! 14.6Marijuana!(adults)! 17.3! 16.6! 16.5Alcohol!(adults)! 60.5! 60.9! 61.2
How does past month use affect recovery? ! Recovery is hastened when substance use is
minimized. ! Recovery systems and supports should not
be withdrawn or denied because addicts relapse into substance use.
! Continuing recovery supports during relapse can increase the likelihood of future and continued recovery.
“A recovery oriented system of care ident i f ies and builds upon each individual ’s assets, st rengths, and areas of heal th and competence to support achieving a sense of mastery over his or her condi t ion while regaining a meaningful , const ruct ive, sense of membership in the broader communi ty2. ”
Are there interventions designed to reduce past month use? Project Northland3 is a multilevel intervention involving students, peers, parents, and community in programs designed to delay the age at which adolescents begin drinking, reduce alcohol use among those already drinking, and limit the number of alcohol-related problems among young drinkers. Administered to adolescents in grades 6–8 on a weekly basis, the program has a specific theme within each grade level that is incorporated into the parent, peer, and community components. What does the SAFE and SOUND survey tell us about 30 day use? Table 3 below indicates that Livingston County adults have higher rates of both past month use as well as binge drinking for males compared to Washtenaw County.
Table!3!"!Past!Month!Alcohol!Use!and!Binging!!!Washtenaw!and!Livingston!Adults!2009!
Use!Among!Parents Washtenaw Livingston!
Alcohol!Use! 62.3%! 67.4%!
Binge!drinking!!
Males! 5.5%! 7.8%!
Females! 4.9%! 4.1%!
How does this information help us better understand substance abuse prevention needs? ! The Livingston and Washtenaw region has
significant excesses in marijuana initiates and low levels of perceived risk for marijuana use, compared to Michigan or the United States.
! The Livingston and Washtenaw region also has significant excesses regarding alcohol use and binge drinking compared to Michigan or the United States.
! As a result, we will need to strengthen prevention efforts significantly to protect the next generation of adolescents and youth.
References: !!!!!!!!!!!!!!!!!!!!!!!!!!!!!!!!!!!!!!!!!!!!!!!!!!!!!!!!!!!!1!Substance!Abuse!and!Mental!Health!Services!Administration.!(2010).!Substate!Estimates!from!the!2006"2008!National!Surveys!on!Drug!Use!and!Health!(Office!of!Applied!Studies).!Rockville,!MD.!!http://oas.samhsa.gov/substate2k10/2k8Substate.pdf!!2!Kirk,!A.!,!et.al.!!Implementing!a!statewide!recovery!oriented!system!of!care.!NASMHPD!Research!Institute,!February!2005NASMHPD!Research!Institute,!February!2005Thomas!!3!SAMHSA.!National!Registry!of!Evidence!Based!Prevention!Practices.!http://www.nrepp.samhsa.gov/ViewIntervention.aspx?id=25!!
!
7

! ! ! ! !!!!!!!!!!!!!Community Focus Livingston/Washtenaw Substance Abuse Coordinating Agency
!
How is ‘perceived risk’ measured? Perceived risk is defined as the perception that using a substance is risky. Perceived risk is measured by survey questions and self identification. Perceptions of risk are typically measured on a scale including great, moderate, slight or no risk.
How do we compare? Survey results from the National Survey on Drug Use and Health (NSDUH) and Table 1 below indicate: ! Significantly lower proportion of
Washtenaw County residents aged 12 years and older perceive a great risk for smoking marijuana once a month and binge drinking once or twice a week compared to the United States. (Livingston County data not available for NSDUH substate estimates.)
!
Table!1!"!Great!Risk!Perceived!for!Marijuana!Use!!and!Binge!Drinking!!
2004"2006!NSDUH!–!Substate!Estimates1!! Washtenaw! Michigan! U.S.!
Smoking!marijuana!!once!a!month!(persons!12!years!and!older)!
29%! 36%! 39%!
Binge!drinking!once!or!twice!a!week!(persons!12!years!and!older)!
36%! 38%! 41%!
As seen in Table 2: ! Washtenaw County has a lower proportion
of youth and adults who perceive great risk for smoking marijuana more than once a week.
! A smaller proportion of Washtenaw County youth perceive great risk from binge drinking compared to Livingston County youth.
Table!2!"!Great!Risk!Perceived!for!Marijuana!Use!!and!Binge!Drinking!2009!Livingston/Washtenaw!!
SAFE!and!SOUND!Survey!
Washtenaw! Livingston!
Smoking!marijuana!!more!than!once!a!week!(Youth!aged!12"17!years)!
67%! 73%!
Smoking!marijuana!more!than!once!a!week!(adults!18!years!and!older)!
56%! 66%!
Binge!drinking!once!or!twice!a!week!(Youth!aged!12"17!years)!
52%! 56%!
Binge!drinking!once!or!twice!a!week!(adults!aged!18!years!and!older)!
64%! 62%!
What are the trends regarding perceived risk? Results from the 2009 NSDUH indicate: ! The percent of youth 12-17 years who
perceived great risk from smoking marijuana once a month increased between 2002 and 2003. However, the proportion remained relatively unchanged through 20032.
! Perceptions of great risk from using LSD declined between 2002 and 2008. However, the percent of youth perceiving great risk from using alcohol and cigarettes increased between 2002 and 2008.
Which groups are most likely to perceive great risk? Nationally: ! Perception of great risk from smoking
marijuana decreases with age for youth. ! Persons who use marijuana or binge drink
are much less likely to perceive great risk of use.
! Perception of great risk for binge drinking is higher for females than males. !
What is the relationship between perceived risk and substance abuse? National data indicate3: ! Adolescents who perceived great risk from
smoking marijuana once a month were much less likely to have used marijuana in the past month than those who perceived moderate to no risk (1.4 vs. 9.5 %). This finding was consistent for both genders and all age groups.
! Shifts in perceived risk of use of substance are generally thought to signal future changes in the prevalence of use.
8

! !
How drecov! Pe
anrecbasub
! Admithe
! Yodeyopesubabof arelowabsub
What tell uperce! Yo
usebinmocoin
! Nopeonor we
! !
does perceivevery? erceptions of riskd youth recovercovery or sobrie
ased on acknowlebstance has ove
dult addicts, freqinimize the effeceir lives.
outh addiction reependent on percuth behavior is h
eer and communibstance abuse. using youth are substance abusie likely exposedwered perceptiouse, not to menbstances.
does the SAFs about the li
eived risk andouth who are noters perceive grenge drinking andore likely to percmmunity perceiv substance abuseon-binge drinkingerceive great risknce or twice per more alcoholic eek (Figure 1).
!!!!!!!!!!! !
ed risk affect
k are key in bothry. The basis of ety centered groedging the power the individual.
quently, if not alcts of substance
ecovery is particceived risks. Prheavily influencity acceptance o Additionally, su frequently the ping families. The to authority fig
ons of risks of sution availability
FE and SOUNDnk between
d substance ust alcohol or marieater risks involvd marijuana use,ceive that their ves greater risk e, than youth whg adults are mork in smoking mar week and in dridrinks once or t
!!Comm Livingston
h adult many ups is
er that the . lways, abuse in
cularly imarily, ed by
of bstance products ese youth
gures’ bstance of illicit
D survey
se? i juana ved in and are involved ho use. re likely to rijuana nking five wice per
Aiid!
!
!
munity n/Washtenaw
Figure!1!"!Greaand!Bing
2009!Livingston/W
Are there cominterventions increase percdecrease subs! The Parents
Don't be a pawareness cabout the healcohol at teawareness ounderage dr
! All Stars proand drug usereduce fight
! The Project designed to people beginamong youngtried drinkinalcohol-relatAt end of intless likely tolower rates o
"10
10
30
50
70
Smo
percen
t
Focus Substance A
at!risk!Perceived!for!ge!Drinking!by!BinginWashtenaw!SAFE!an
mmunity base that are desi
ceived risk in ostance use? Who Host , Lose
party to teenageampaign educateealth and safety een parties and iof and compliancinking laws4.
ograms prevent ae, postpone sexuing and bullying Northland interdelay the age wn drinking, reducg people who ha
ng, and limit the ted problems of tervention, partio abuse substancof past month us
moking!marijuana!once!or!twice!per!
week
Drinalcohor!tw
Non!Binger Binge
s Abuse Coordi
Marijuana!Use!!ng!Status!nd!SOUND!Survey!
!
d igned to order to
e The Most : e drinking publices parents risks of serving ncreases
ce with
alcohol, tobaccoual activity, and 5.
rvention is hen young ce alcohol use
ave already number of young people.!!icipants were
ces, and have se6.!
k!five!or!more!olic!drinks!once!wice!per!week
er
nating Agenc
o
How doebetter unpreventi! Increa
substa! Interve
need tpercepmales.
! Particuyouth abuser
Referenc!!!!!!!!!!!!!!!!!!!1!http://ww2!Results!frohttp://oas.spdf!!3!NSDUH!204!http://dru5!http://ww6!NREPP.!!ww!!!
cy
es this informanderstand subon needs? sing perceived r
ance use. entions to increato account for thptions of risk for. ular attention sh whose parents ars.
ces: !!!!!!!!!!!!!!!!!!!! !!!!!!!!!
ww.oas.samhsa.govom!the!NSDUH!200samhsa.gov/NSDUH
009!ibid.!gfreeactionalliance
ww.allstarspreventioww.nrepp.samhsa
ation help us bstance abuse
risk may decreas
ased perceived rhe decreased r older youth and
hould be focusedare substance
!!!!!!!!!!/substate2k8/subs09.!!January!8,!2009H/2k9NSDUH/2k9R
e.org/pwh.php!on.com/!.gov!
e
se
risks
d
d on
state.pdf!!9.!ResultsP.
!
9
!
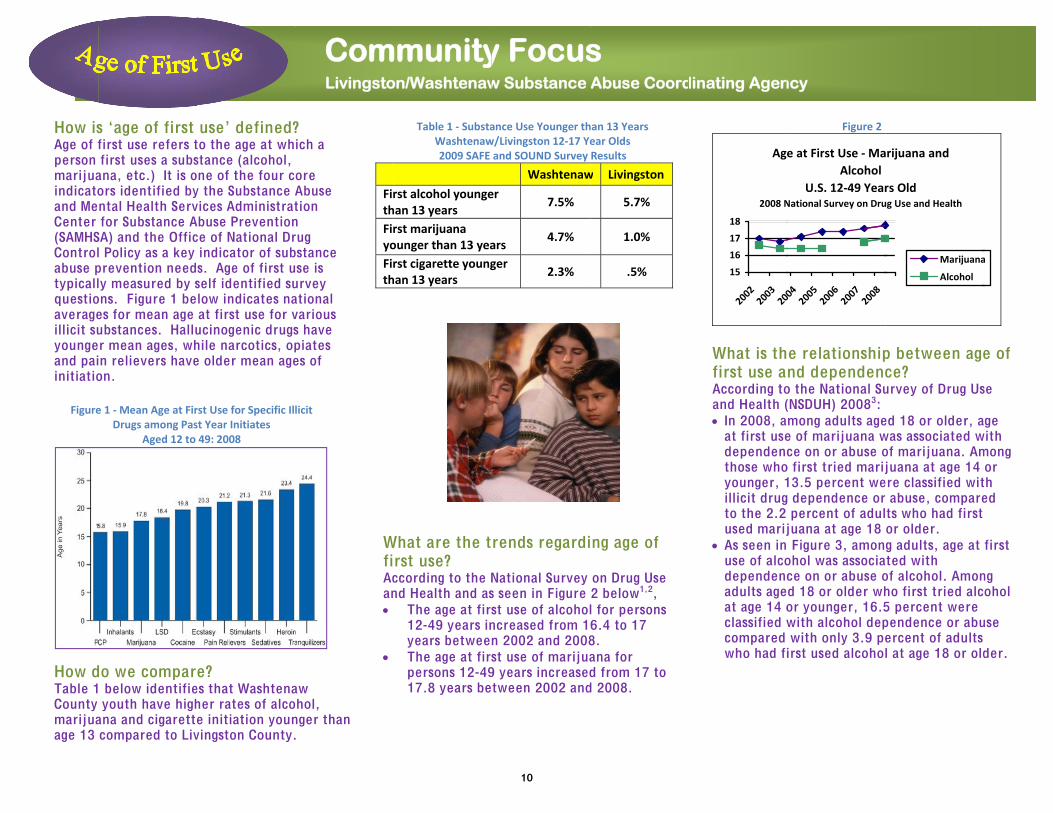
How isAge of fperson marijuaindicatoand MeCenter (SAMHSControlabuse ptypicallquestioaverageillicit suyoungeand paiinitiatio
Figure
How dTable 1County marijuaage 13
! !
s ‘age of first first use refers t first uses a subsana, etc.) It is oors identified byntal Health Serv for Substance A
SA) and the Officl Policy as a key prevention needly measured by s
ons. Figure 1 bees for mean age ubstances. Hallur mean ages, whin relievers haveon.
e!1!"!Mean!Age!at!FirDrugs!among!Pas
Aged!12!to!
do we compar below identifie youth have high
ana and cigarette compared to Liv
!!!!!!!!!!! !
use’ defined?to the age at whstance (alcohol, one of the four cy the Substance Avices AdministratAbuse Preventionce of National Dr indicator of subs. Age of first u
self identified sulow indicates na at first use for vucinogenic drugshile narcotics, ope older mean age
!rst!Use!for!Specific!Ilst!Year!Initiates!49:!2008!
e? es that Washtenaher rates of alcoe initiation younvingston County.
!! Com Livingsto
? ich a ore Abuse tion n rug bstance use is urvey ational various s have piates es of
licit!
aw ohol, nger than .
!
FirthFiryoFirth
WfiAcan!
!
mmunityon/Washtenaw
Table!1!"!SubstaWashtenaw2009!SAFE!
rst!alcohol!youngehan!13!years!rst!marijuana!ounger!than!13!yearst!cigarette!younghan!13!years!
What are the trst use?
ccording to the Nnd Health and as
The age at firs12-49 years inyears betweenThe age at firspersons 12-4917.8 years be
!y Focusw Substance
ance!Use!Younger!thw/Livingston!12"17!Yeand!SOUND!Survey!
Washtenaw
er!7.5%!
ars!4.7%!
ger!2.3%!
rends regardi
National Survey s seen in Figure st use of alcoholncreased from 1n 2002 and 2008st use of marijua9 years increasedtween 2002 and
s Abuse Coord
han!13!Years!!!ear!Olds!!!Results!
w! Livingston!
5.7%!
1.0%!
.5%!
ng age of
on Drug Use 2 below1,2, l for persons 6.4 to 17 8. ana for d from 17 to
d 2008.
dinating Agen
Age
2008!N
15
16
17
18
2002
2003
200
What is thfirst use aAccording toand Health (! In 2008, a
at first usedependencthose whoyounger, 1illicit drugto the 2.2 used marij
! As seen in use of alcodependencadults ageat age 14 oclassified wcompared who had fi
ncy
Figure!2
e!at!First!Use!"!MaAlcohol!!
U.S.!12"49!YearNational!Survey!on!Dru
0042005
2006
2007
2008
e relationshipnd dependenc
o the National Su(NSDUH) 20083: mong adults agee of marijuana wce on or abuse o
o first tried marij13.5 percent we
g dependence or percent of aduljuana at age 18 Figure 3, amonohol was associace on or abuse od 18 or older whor younger, 16.5with alcohol dep with only 3.9 peirst used alcohol
arijuana!and!
rs!Oldug!Use!and!Health
Marijuana
Alcohol
p between agece? urvey of Drug Us ed 18 or older, awas associated wof marijuana. Amjuana at age 14
ere classified wit abuse, comparelts who had first or older. g adults, age at
ated with of alcohol. Amonho first tried alc5 percent were pendence or abuercent of adults l at age 18 or old
a
e of
se
age with mong or
th ed
first
ng ohol
use der.
10

!
Alcohol!D
How drecove! Ear
to tsevyougreapotinstemonatReccoothe
! Manadopsysymthe
! !
FigDependence!or!Abuse!in21!or!Older,!by!Age!at!
does age of firery? lier ages of first the risk of depenerity of depende
unger substance ater the breadthentially negativetance, educationotional health, furally supportive
covery will thereordination and so
se limitations. ny symptoms of colescents can be ychiatric illness. mptom may be di drug abuse.
!!!!!!!!!!! !
!gure!3!!n!the!Past!Year!among!First!Use!of!Alcohol:!20
rst use affect
use are directlyndence, as well aence. Further, t abuse is initiateh of life skills thaely affected. Fon, employment, friendships, etc. e aspects of wel
efore require greophistication to a certain drugs in easily misdiagno Treating the obsifferent from tre
!! Com Livingsto
Adults!Aged!008!
y related as the the
ed, the at are
or are all ll being. eater address
osed for served eating
Ade!
!
WteAsWatag
mmunityon/Washtenaw
Polydrug abuscomplicates thwhen the treathe drug abusethe younger thexposure to a susceptible threaction4.
re there interelay age of fir
All Stars progand drug use, reduce fightinThe Project Ndesigned to depeople begin damong young tried drinkingalcohol-relateAt end of inteless likely to alower rates of
What does the ell us about ags seen in Figure
Washtenaw youtht age 13.3 years;ge14.
!y Focusw Substance
se in an adolescehe clinical picturating physician ise of the patient.he age that a pe chemical, the m
hat person is to a
rventions desirst use? rams prevent alc postpone sexua
ng and bullying5.Northland interveelay the age whedrinking, reduce people who hav
g, and limit the ned problems of yervention, particabuse substancef past month use
SAFE and SOUge of first use 4 below, Livings
h 12-17 years ini; while initiating
s Abuse Coord
ent further re, especially s unaware of . In addition,
erson has more a psychiatric
igned to
cohol, tobacco al activity, and ention is en young e alcohol use ve already number of young people.!!cipants were
s, and have e6.!
UND survey e?
ston and tiate alcohol
g marijuana at
dinating Agen
Age!of!FirMarijuana13"14!Yea
12
Alcohol
Cigarettes
Marijuana
How does understanneeds? Substance inadolescenceprevention iearlier beformaking rega
Reference!!!!!!!!!!!!!!!!!!!!!!1!http://www.oas2!http://www.oas3!http://www.oashttp://www.oas.s4!Morrison!MA:!A[Special!Issue].!Whttp://www.ncbi.med00117"0081.p5!http://www.alls6!NREPP.!!www.nr
ncy
Figure!4
rst!Use!for!!Alcoa!is!ars!Old!" Washtenaw/Li
13.3
13
12.5 13 13.5
Years
Use
this data helpd substance a
nitiation occurs ie, as early as 13 interventions mure adolescents h
arding life and dr
es: !!!!!!!!!!!!!!!!! !!!!!!!!!!!!s.samhsa.gov/nsduh/2ks.samhsa.gov/nsduh/2ks.samhsa.gov/nhsda.htmsamhsa.gov/nsduh/2k8ddiction!in!adolescents
West!J!Med!1990!May;!1nlm.nih.gov/pmc/articpdf!!tarsprevention.com/!repp.samhsa.gov!
ohol,!Cigarettes
ivingston!12"17!Year!Olds
3.5
14
14 14.5
p us better abuse prevent
in early years. Thereforust commence fahave begun decisrug choices.
!!!!!!!k8nsduh/2k8results.cfmk8nsduh/2k8results.pdfm;!nsduh/2k8results.cfms,!In!Addiction!Medicine52:543"546.!!les/PMC1002408/pdf/w
!and!
15
tion
re, ar sion
m#5.1!!!
e!
westj
11

!! ! ! !!!!!!!!!!!!!Community Focus Livingston/Washtenaw Substance Abuse Coordinating Agency
!
How is ‘Driving Under the Influence (DUI)’ defined? The driving or operating of any vehicle while under the influence of liquor or drugs. How do we compare?
DUI!Arrest!Rates!Per!100,0001!
Juveniles! 2000! 2006! %!change!Michigan! 13.9! 13.8! ".01%!Washtenaw! 9.8! 9.4! ".04%!Livingston! 19.9! 15.6! "22%!! ! ! !Adults! 2000! 2006! %!change!Michigan! 741.5! 619.3! "16%!Washtenaw! 280.6! 395.1! +40%!Livingston! 629.5! 500.5! "20%!
*Michigan State Police Uniform Crime Reports Who is most likely to be arrested for DUI? National data from the National Survey on Drug Use and Health2 indicates: ! Persons 21-25 years old are 60% more
likely to be arrested for DUI compared to their 26-34 year old counterparts. DUI arrest rates decrease with increasing age.
! Minority groups, including Native American, Hispanics and African Americans, have significantly higher rates of DUI compared to Non-Hispanic Whites.
! Residents of small metropolitan counties are much more likely to be arrested for DUI than large metropolitan county residents.
! Males are nearly six times more likely to have been arrested for DUI in the past year compared to females.
! In 2009 in Michigan3, while males were three times as likely to be arrested for DUI, DUI arrest rates for females have not been decreasing as rapidly as males’ rates in the past decade.
! Underage girls are much more likely to drink in a motor vehicle than boys and older women. Approximately 13% of 16 year old females last drank alcohol in a car or other motor vehicle, compared to only 2% of 20 year old females and 7% of 16 year old males4.
What are the trends regarding DUI arrests?!! Drugs have become a prominent factor in
DUI arrests, even outpacing impairment from alcohol.!
! The 2009 Michigan Drunk Driving Audit5 shows declines in alcohol-related crashes, fatalities and arrests, but notes increases in crashes and injuries involving drugs.
What don’t we know? ! There are many impaired drivers who are
not arrested. According to the 2005 Michigan Impaired Driving Plan6, studies suggest that there is one arrest made for every 80-100 incidences of driving with Blood Alcohol Content (BAC) over .08.
! While BAC is a standard measure of impaired driving under the influence of alcohol, there is no comparable quantifiable measure of illicit drug (or legal prescription) effects.
! While males and minority group members are more likely to be arrested for DUI, it is unclear whether this reflects more DUI behavior or rather, enforcement policies or resources that limit enforcement in other groups.
How does a DUI arrest affect recovery? ! Among adults aged 18 or older, national
data suggest that those who are unemployed are most likely to report that they have driven under the influence of drugs in the past year7. Employment opportunities are important factors in recovery.
! When females are referred to substance treatment by the criminal justice system, employed females are three times more likely to be referred through DUI programs than unemployed females. The DUI arrest may provide the opportunity to begin recovery.
12

!! ! ! !!!!!!!!!!!!!Community Focus Livingston/Washtenaw Substance Abuse Coordinating Agency
!
Are there community based interventions proven to reduce DUI? The Community Trials Intervention to Reduce High Risk Drinking Intervention8 is a multi-component, community-based program developed to alter the alcohol use patterns and related problems of people of all ages. The program incorporates a set of environmental interventions that assist in (1) restricting alcohol access through alcohol outlet density control; (2) enhancing responsible beverage service (3) increasing law enforcement and sobriety checkpoints (4) reducing youth access to alcohol by training alcohol retailers to avoid selling to minors; and (5) forming the coalitions needed to implement and support the interventions. Additionally, the Michigan Governor’s Traffic Safety Advisory Commission published the ‘Impaired Driving Action Plan9’ in 2005. The Plan outlines enforcement, education, judicial and legislative strategies customized for Michigan drivers. Strategies include (but are not limited to) the following:
! Promote increased support of national crackdown periods by law enforcement agencies
! Server training and education ! Encourage development of DUI courts ! Reinstitute sobriety checkpoints
What does the SAFE and SOUND survey tell us about the link between DUI and substance abuse? ! Livingston and Washtenaw male adults are
twice as likely to identify having driven while under the influence of drugs or alcohol.
! Contrary to national data, older adults and those in higher income brackets report higher DUI rates than their younger and less wealthy counterparts.
!
How does this information help us understand substance abuse prevention needs in Livingston and Washtenaw Counties? ! Approximately 1% of all incidents of DUI
result in an arrest. More consistent enforcement is necessary to identify drunk or drugged drivers.
! DUI campaigns must acknowledge the significant impact of both illicit and prescribed drugs on impaired driving.
! Young adults, males and minority group members are much more likely to be arrested for DUI than females and non-minority groups. Preventionists need to explore whether this fact reflects actual increased DUI behaviors or enforcement practices and resources that limit arrests in older adults, females and non-minority groups.
References: !!!!!!!!!!!!!!!!!!!!!!!!!!!!!!!!!!!!!!!!!!!!!!!!!!!!!!!!!!!!1!Michigan!State!Police!Uniform!Crime!Reports.!!2000!and!2005.!!http://www.michigan.gov/msp/0,1607,7"123"1645_3501_4621""",00.html!!2!Arrests!for!Driving!Under!the!Influence!Among!Adult!Drivers.!The!NSDUH!Report.!!September!2,!2005.!http://www.oas.samhsa.gov/2k5/DUIarrests/DUIarrests.htm!!!3!‘2009!Michigan!Annual!Drunk!Driving!Audit.’!!Michigan!Department!of!State!Police.!2009.!4!‘Underage!Alcohol!Use:!!Where!Do!Young!People!Drink?’!!The!NSDUH!Report.!!August!28,!2008.!!http://www.oas.samhsa.gov/2k8/location/underage.htm!!5!!‘2009!Michigan!Annual!Drunk!Driving!Audit.’!!Michigan!Department!of!State!Police.!2009.!http://www.michigan.gov/documents/msp/2009_DDA_WEB_325447_7.pdf!!!6!‘Impaired!Driving!Action!Plan.’!Governor’s!Traffic!Safety!Advisory!Commission.!!May!2005.!!http://www.michigan.gov/documents/MichiganImpairedDrivingActionPlanver201_162689_7.pdf!!7!‘Drugged!Driving.’!The!NHSDA!Report.!!November!19,!2002.!!http://www.oas.samhsa.gov/2k2/DrugDriving/DrugDriving.htm!!8!Community!Trials!to!Reduce!High!Risk!Drinking!Intervention.!!SAMHSA’s!National!Registry!of!Evidence!Based!Programs!and!Practices.!!2008!http://www.nrepp.samhsa.gov/ViewIntervention.aspx?id=9!!9!‘Impaired!Driving!Action!Plan.’!!Governor’s!Traffic!Safety!Advisory!Commission.!!May!2005.!http://www.michigan.gov/documents/MichiganImpairedDrivingActionPlanver201_162689_7.pdf!!
16
24 24
18 19
220
510
1520
25
Ages!18"45
Ages!46+ Males Females <$75K/yr $75K+
Percen
t
*2009!Washtenaw/Livingston!SAFE!and!SOUND!!data;!represents!only!adults!who!have!
consumed!alcohol!in!past!month
Adults!Who!Drink!Who!Admit!DUI!During!Past!Month*
Washtenaw/Livingston!SAFE!and!SOUND!Survey!2009
13

! ! ! ! !!!!!!!!!!!!!Community Focus Livingston/Washtenaw Substance Abuse Coordinating Agency
!
How is ‘absenteeism’ measured? Frequent absenteeism is a significant predictor of dropping out. It also is the most common indicator of student engagement. Students who are chronically absent due to poor attendance, frequent suspensions, or long expulsions, are disengaged from the academic and social life of school1. School and school district attendance rates are based on 1) each student ’s total possible number of attendance days that year, based on the student ’s date of enrollment, and 2) each student ’s actual days of attendance, divided by the total attendance days possible for that student. How do we compare? As part of the ‘Adequate Yearly Progress’ (AYP) indicators required by the Michigan Department of Education (MDE), schools and school districts must report attendance rates each school year.
!Table!1!"!2008"2009!Academic!School!Year!Attendance!
Rates!for!Livingston!and!Washtenaw!Counties!State of Michigan 94.3 Washtenaw Milan Area Schools 66.6 Washtenaw ISD 88.7 Eastern Washtenaw Mult icultural Academy 89.6 Willow Run Community Schools 92.7 Ann Arbor Learning Community 93.0 New Beginnings Academy 93.4 Lincoln Consolidated School District 93.6 Honey Creek Community School 94.0 South Arbor Charter Academy 94.2 School District of Ypsilanti 94.5 Whitmore Lake Public Schools 95.0 Fortis Academy 95.2 Saline Area Schools 95.3 Victory Academy Charter School 95.3 Ann Arbor Public Schools 95.4 Chelsea School District 95.4 Dexter Community School District 96.3 Manchester Community Schools 96.4 Central Academy 98.5 Washtenaw Technical Middle College 98.8
Livingston Charyl Stockwell Academy 95.1 Pinckney Community Schools 96.0 Fowlerville Community Schools 96.0 Hart land Consolidated Schools 96.5 Howell Public Schools 96.6 Kensington Woods High School 99.9
As Table 1 illustrates, more than half of the school districts in Washtenaw County and all of the districts in Livingston County exceed the State of Michigan average for attendance rates.
!Table!2!"!State!of!Michigan!!
2008"2009!Attendance!Rates!by!Subgroup!
Category!Attendance!Rate!
All!students 94.7%!Black/African!American 91%!Students!with!Disabilities 93.5%!American!Indian!or!Alaska!Native 93.7%!Hispanic!or!Latino 94.1%!Limited!English!Proficient 94.6%!Multiracial 94.8%!Economically!Disadvantaged 94.8%!White 95.7%!Asian 96.5%!
Which groups are more likely to be absent? ! Table 2 shows the variance between Michigan
subgroups categorized by MDE. Black and African American students have the greatest burden regarding absences at 91%, followed by disabled students and American Indian/Alaskan Natives.
! Risk factors for absenteeism include2:
o social and school phobia o anxiety o depression o lack of parental supervision o lack of school sanctions for unexcused
absences o low self esteem o poor academic achievement o retention in previous grades
What is the relationship between absenteeism and substance abuse? ! According to numerous studies, significant
links exist between youth risk behaviors and academic achievement and absenteeism. Youth with higher grades are less likely to use alcohol, marijuana or other illicit drugs than youth with lower grades3.
! Researchers have identified clear links between absenteeism and substance abuse, along with numerous poor health behaviors. This relationship is sustained even after controlling for demographic variables.
! School connectedness even in early secondary school predicts late teenage substance use, mental health and academic outcomes4.
! School environment can also influence the likelihood of substance abuse. School environments that reduce student disengagement, increase student participation, improve relationships and promote a positive school ethos may be associated with reduced drug use, as well as other risky health behaviors5.
14

! ! ! ! !!!!!!!!!!!!!Community Focus Livingston/Washtenaw Substance Abuse Coordinating Agency
!
How does absenteeism affect recovery? ! Education and subsequent employment
opportunities are integral factors in successful substance abuse treatment and continued sobriety. Chronic absenteeism is closely linked to school success and graduation.
! A critical aspect in increasing the likelihood of successful recovery is to promote and support youth resilience. Resilience involves developing and maintaining positive, functional habits and patterns in the face of risk. Successful school attendance is a primary protective aspect of resilience for youth, as it leads directly to academic success, future educational and employment opportunities, thereby decreasing the likelihood of returning to drug or alcohol abuse6.
What does the SAFE and SOUND survey results tell us about the link between absenteeism and substance abuse in Livingston and Washtenaw County youth? While SAFE and SOUND did not include questions regarding absenteeism from school, it did include a number of related protective factors regarding school connectedness and academic achievement. These factors are closely related to the risk of chronic absenteeism. Figure 1 illustrates that Livingston and Washtenaw County youth 12-17 that use marijuana are more likely to have lower grades (C’s, D’s and F’s), say that their teacher never or seldom notices when they do a good job, never or seldom enjoys being at school and never or seldom feels that what they do at school makes a difference, compared to their non-using counterparts.
Are there community level, evidence based interventions proven to decrease absenteeism? ! Posi t ive Action7 is an integrated and
comprehensive program that is designed to improve academic achievement; school attendance; and problem behaviors such as substance use, violence, suspensions, disruptive behaviors, dropping out, and sexual behavior. It is also designed to improve parent-child bonding, family cohesion, and family conflict.
! Reconnecting Youth: A Peer Group Approach to Building Li fe Skills (RY)8 is a school-based prevention program for students ages 14-19 years that teaches skills to build resiliency against risk factors and control early signs of substance abuse and emotional distress. RY targets youth who demonstrate poor school achievement and high potential for school dropout.
Figure!1"Marijuana!Use,!Academic!Achievement!and!!Attitudes!toward!School!!
Washtenaw!and!Livingston!Youth!SAFE!and!SOUND!Survey!Results!
How does this information help us to understand substance abuse prevention needs? ! Students are more likely to engage in healthy
behaviors and succeed academically when they feel connected to school.9
! Tracking absenteeism for individual students creates opportunity for identifying youth at risk of substance abuse and dropout who could benefit from prevention interventions.
! Chronic absenteeism is a sentinel event signaling substance abuse, mental or physical disabilities, family disorganization, lack of sense of school connectedness or other personal, family or school related obstacles.
References: !!!!!!!!!!!!!!!!!!!!!!!!!!!!!!!!!!!!!!!!!!!!!!!!!!!!!!!!!!!!
1!Dianda,!MR.!!Preventing!FutureHigh!School!Dropouts!An!Advocacy!and!Action!Guidefor!NEA!State!and!Local!Affiliates!National!Education!Association.!!Human!and!Civil!Rights.!!2008.!!http://www.nea.org/assets/docs/dropoutguide1108.pdf!!2!Williams,!L.!!Student!Absenteeism!and!Truancy:!!Technologies!and!Interventions!to!Reduce!and!Prevent!Chronic!Problems!Among!School!Age!Children.!!http://teach.valdosta.edu/are/Litreviews/vol1no1/williams_litr.pdf!!3!Health!Risk!Behavior!and!Academic!Achievement.!!Healthy!Youth.!!U.S.!Centers!for!Disease!Control.!!2009.!http://www.cdc.gov/HealthyYouth/health_and_academics/pdf/health_risk_behaviors.pdf!!4!Bond,!L.,!et!al.!!Social!and!school!connectedness!in!early!secondary!school!as!predictors!of!late!teenage!substance!use,!mental!health!and!academic!outcomes.!!J!Adolescent!Health.!!2007.!!April!(40)4:357.!5!Fletcher,!A.!!Bonell,!C.!Hargreaves,!J.!School!effects!on!young!people’s!drug!use:!!a!systematic!review!of!Intervention!and!observational!studies.!!J!Adolesc!Health.!!2008.!!March!42(3)!209"20.!6!Substance!Abuse!and!Mental!Health!Services!Administration.!(2009).!Designing!a!Recovery"Oriented!Care!Model!for!Adolescents!and!Transition!Age!Youth!with!Substance!Use!or!Cooccurring!Mental!Health!Disorders.!Rockville,!MD:!U.S.!Department!of!Health!and!Human!Services.!http://www.chestnut.org/LI/downloads/SAMSHA_Recovery_Report_on_Adolescents_and_Transitional_Age_Youth.pdf!!7!NREPP:!!SAMHSA’s!National!Registry!of!Evidence!Based!Programs!and!Practices.!!www.nrepp.samhsa.gov.!and!www.positiveaction.net!!8!NREPP.!!www.nrepp.samhsa.gov!!9Centers!for!Disease!Control!and!Prevention.!!School!Connectedness:!!Strategies!for!Increasing!Protective!Factors!Among!Youth.!!Atlanta,!Ga.!!U.S.!DHHS.!!2009.!!www.cdc.gov/healthyyouth!!
0 10 20 30 40 50
Never/Seldom!Enjoy!School
Never/Seldom!Things!I!Do!At!School!Make!Difference
Never/Seldom!Teacher!Notices!And!Lets!Me!Know!
When!I!Do!Good!Job!
Grades!C's,!D's,!F's
Non"User Marijuana!User
15

! ! ! ! !!!!!!!!!!!!!Community Focus Livingston/Washtenaw Substance Abuse Coordinating Agency !
How is ‘high school dropout ’ measured? The best measures for this indicator are cohort graduation rates and dropout rates. Cohort graduation rates are calculated by tracking individual students beginning when they first enter in 9th grade and anticipating a four-year expected completion of high school. The formula takes into account students who transfer to different schools. The dropout rate is based on the students from a four-year cohort who have officially dropped out of school and haven’t re-enrolled in another school1. How do we compare?
Table!1!–!High!School!Graduation!Rates!Local,!State!and!National!2008"2009!Academic!Year2!
Livingston! Washtenaw! Michigan! U.S.!!(2005"2006)!
88%! 83%! 75%! 73%!
! Table 1 indicates that Livingston and
Washtenaw counties have significantly higher graduation rates than Michigan or the U.S.
! While Livingston and Washtenaw County graduation rates are relatively high, profound disparities exist within subgroups of the county. Washtenaw County graduation rates for economically disadvantaged youth are only 56%; while 60% of Michigan economically disadvantaged youth graduated in 2009.
! Four school districts within Washtenaw County have graduation rates under 80%.
Which groups are more likely to dropout of high school? Nationally, reasons for high school dropout include3: ! Personal reasons:
o Needed employment o Parenthood o Caring for family member
! Academic performance: o Failing grades o Poorly prepared for high school o Required to repeat a grade
! Learning environment issues: o Classes uninteresting o Lack of motivation o Performed minimal homework o Low expectations from others
Other predictors of dropout includes 1) missing five weeks of school or more, and 2) receiving a failing final grade in Math or English4.
What are the trends regarding high school dropout rates? According to the National Center for Educational Statistics, United States’ dropout rates have declined between 2004-2007 (4.7% to 3.5%)5. Locally, rates have dropped in most school districts in Livingston and Washtenaw during 2007-2009. However, the rate of decline varies by district. Further, as seen in Figure 1 below, significant disparities exist between districts.
!
Figure!1 High School Dropout Rates
Washtenaw/Livingston Counties Selected School Districts – 2007-2009
7.1
26.7
12.6
5.7
13.9
3.5
7.3
25.6
13.2
3
9.5
3.94.7
25.1
9.6
4.1
10
3.4
0
5
10
15
20
25
30
Ann Arbor Ypsilanti Milan Brighton Howell Pinckney
Per
cent
Dro
pout
s
200720082009
*Washtenaw County Public Health & Michigan 2009 Cohort Dropout Rates. Center for Educational Performance and Information. http://michigan.gov/cepi/0,1607,7-113-21423_30451_51357---00 html
What is the relationship between high school dropout and substance abuse? ! According to the U.S. Substance Abuse and
Mental Health Services Agency (SAMHSA), white and black high school dropouts 18-24 years old were 60% and 150% more likely to have used illicit substances in the past month than their counterparts who graduated from high school6 in 2002.
! Adult dropouts 18-24 years old were 38% more likely to smoke cigarettes than adults who graduated.
! Conversely, 18-24 year old high school graduates were 30% more likely to have used alcohol in the past month than adults who dropped out of high school.
! Academic achievement also predicts substance abuse. Students who demonstrate a deterioration of their academic achievement over time are more likely to start using marijuana. Poor academic achievement and deterioration of academic achievement should be considered as risk factors for initiation of marijuana use among rural adolescents7. 16

! ! ! ! !!!!!!!!!!!!!Community Focus Livingston/Washtenaw Substance Abuse Coordinating Agency !
How does high school graduation and dropout affect recovery? ! Education and subsequent employment
opportunities are integral factors in successful substance abuse treatment and continued sobriety. In 2005, clients with 12 or more years of education who were discharged from intensive outpatient substance abuse treatment were 14% more likely to complete treatment than adults with less than 12 years of school. Clients who completed short and long term residential substance abuse treatment were 25% and 15% more likely to have 12 years or more of education than those who did not complete treatment8.
! According to SAMHSA, a “ recovery oriented system of care (ROSC)9 identifies and builds upon each individual ’s assets, strengths, and areas of health and competence to support achieving a sense of mastery over his or her condition while regaining a meaningful, constructive, sense of membership in the broader community. ”
! Since substance abusers frequently have less education than their non-using counterparts, they have greater challenges in accessing advanced education and employment.
! Consequently, the ROSC model is a framework that includes the need for agencies to offer a range of work and educational opportunities, eliminate work eligibility requirements, and strengthen linkages to vocational and educational providers.
Are there community level interventions proven to reduce the effects of the high school dropout/substance abuse relationship? According to the SAMHSA Model Programs10: ! Across Ages is a school and community-
based drug prevention program for youth 9 to 13 years old that seeks to strengthen the bonds between adults and youth and provide opportunities for positive community involvement. Outcomes include improved grades, school attendance, attitudes towards school and decreased suspensions, and decreased alcohol and tobacco use.
! CASASTART is a community-based, school-centered social support program designed to keep high risk 8 to 13 year old youth free of drug and crime involvement. Outcomes include significantly higher levels of promotion to the next grade, participation in after school and learning activities, participants are 20% less likely to use drugs in the past 30 days; 60% less likely to sell drugs; and 20% less likely to commit violent acts.
! Both Livingston and Washtenaw counties opened county-wide schools targeting dropouts in the Fall of 2010. The Widening Advancements for Youth (W-A-Y) Program is a school designed around individual student interests in a project-based, online learning environment. More information about the program can be found at www.wayprogram.net. Additionally, both counties adopted a data management system that will allow educators to identify students who are showing specific performance patterns and may be at-risk for dropping out.
How does this information help us to understand substance abuse prevention needs? ! Dropping out is not a sudden act, but rather
a very gradual process. Early warning systems can help identify students early so appropriate supports can be provided.
! Changing the learning environment to make the school experience more relevant and engaging will help keep students in school.
! Access to academic and social supports for struggling students is necessary to prevent dropping out11.
References: !!!!!!!!!!!!!!!!!!!!!!!!!!!!!!!!!!!!!!!!!!!!!!!!!!!!!!!!!!!!1!Norman,!N.!!‘Graduation!and!Dropout!Rates.’!SMART!Project.!!Washtenaw!Intermediate!School!District.!!Internal!document.!September!2010.!2!Legters,!Nettie.!(2010).!National!Perspectives!on!the!Dropout!Crisis!(presentation).!!Michigan!State!Dropout!Prevention!Summit:!“Moving!Students!up,!Not!Out.”!!Detroit,!MI,!August!11,!2010,!excerpted!from:!Norman,!N.!!‘Graduation!and!Dropout!Rates.’!SMART!Project.!!Washtenaw!Intermediate!School!District.!!Internal!document.!September!2010.!3!Freudenberg,!Nicholas,!Ruglis,!Jessica.!(2007).!Reframing!school!dropout!as!a!public!health!issue.!!Preventing!Chronic!Disease:!Public!Health!Research,!Practice,!and!Policy.!!October!2007.!(l4)4.!!www.cdc.gov/pcd/issues/2007/oct/07_0063.htm!!4!Norman,!N.!!ibid.!!!5!High!School!Dropout!and!Completion!Rates!in!the!United!States:!2007.!!National!Center!for!Educational!Statistics,!Institute!of!Education!Sciences.!!http://nces.ed.gov/pubs2009/2009064.pdf!!6!Substance!Use!among!school!dropouts.!!THE!NSDUH!Report.!!November!28,!2003.!!http://oas.samhsa.gov/2k3/dropouts/dropouts.htm!!7Henry,!LK.,!Smith,!EA.,!Caldwell,!LL.!Deterioration!of!academic!achievement!and!marijuana!use!onset!among!rural!adolescents!Health!Educ.!Res.!(2007)!22(3):!372"384!first!published!online!September!12,!2006!doi:10.1093/her/cyl083.!http://her.oxfordjournals.org/content/22/3/372.full#ack"1!!8!Predictors!of!Substance!Abuse!Treatment!Completion!or!Transfer!to!Further!Treatment,!by!Service!Type.!!Treatment!Episode!Data!Set.!!SAMHSA.!!February!26,!2009.!!http://oas.samhsa.gov/2k9/TXpredictors/TXpredictors.pdf!!9!http://rcsp.samhsa.gov/_pubs/rsswhitepaper.pdf!!10!SAMHSA!Model!Programs:!!Model!Prevention!Programs!Supporting!Academic!Achievement.!!http://captus.samhsa.gov/northeast/academics/model_programs.htm!!11!Norman,!N.!!ibid.!!
17

!! ! ! !!!!!!!!!!!!!Community Focus Livingston/Washtenaw Substance Abuse Coordinating Agency !
How is ‘divorce’ measured? Divorce rates are defined as divorced persons per 1,000 population rather than events per population (Number of divorced person/resident population) X 1,000. How do we compare? Figure 1 below indicates that Washtenaw County has the lowest divorce rate compared to Livingston or Michigan. Additionally, rates fell by 50% for Washtenaw between 2000 and 2008.
Figure!1!"!Divorce!Rates!by!Year!for!!Michigan,!Livingston!and!Washtenaw!Counties!
! Livingston! Washtenaw! Michigan!
2000! 7.4! 10.2! 7.8!
2001! 8.6! 6.6! 7.8!
2002! 8.0! 6.3! 7.5!
2003! 7.9! 6.0! 7.1!
2004! 7.3! 5.9! 6.9!
2005! 6.6! 5.8! 6.8!
2006! 7.5! 6.0! 6.9!
2007! 7.6! 5.8! 6.9!
2008! 7.5! 5.1! 6.7!
What groups are at greatest risk for divorce?
! Older women ! One or more births ! Some college (females) ! High school diploma (males) ! Poverty ! U.S. born
What is the relationship between substance abuse and divorce? ! A consumption increase of 1 liter of alcohol
per capita brings about an increase in the divorce rate of about 20%. This finding contrasts with results, using expenditures as the aggregate alcohol measure, that show that an increase of 1/1,000 in the divorce rate leads to a 10% increase in alcohol expenditures1.
! Children in divorced families have lower academic performance and achievement test scores compared to children in continuously married families. The differences are modest and decrease, but do not disappear, when income and socioeconomic status are controlled2.
! Children from divorced families are two to three times more likely to drop out of school compared to children of intact families, and the risk of teenage childbearing is doubled3.
! Adolescents from divorced families scored lower on tests of math and reading both prior to and after parental separation compared with adolescents in married families, and their parents were less involved in their adolescents’ education4.
! Children with parents who were separated or divorced initiate drinking earlier compared to their peers and they may be more likely to drink to cope with problems rather than for pleasure or to be social5.
How is divorce and recovery related? ! Persons in recovery are more likely to
succeed if they have adequate support systems, including spouse or significant others who are invested in their sobriety.
! Sobriety can often change the balance in relationships that were founded and based largely by sharing drugs or alcohol experiences. Patterns of interaction and behavior are likely to change significantly when the addict recovers.
Blog!comment!from!Al"Anon!website:!
!“As!a!codependent,!I!know!that!I!felt!superior!whenever!I!was!involved!with!an!alcoholic/addict.!I!was!in!charge,!yet!still!the!"martyr"!and!the!"victim".!Those!were!roles!I!knew!how!to!play.!When!the!alcoholic/addict!does!something!so!unexpected!like!GETTING!SOBER!(gasp!),!well!I!was!still!sick!!!And!didn't!know!it!!!And!didn't!know!my!role!anymore!!!And!angry!over!past!issues!!!And!suddenly,!it!could!ALL!be!about!me...”
18

!! ! ! !!!!!!!!!!!!!Community Focus Livingston/Washtenaw Substance Abuse Coordinating Agency !
Are there community based interventions proven to reduce the effects of divorce on substance abuse? Children in the Middle (CIM) helps children and parents deal with children’s reactions to divorce. The stress and anxiety experienced by children of divorce can increase children’s risk for behavior problems, depression, delinquency, substance use, teen pregnancy, school failure or dropout, and suicide6.
What does the SAFE and SOUND survey tell us about the link between alcohol consumption and the divorce? Adult males who binge drink are three times more likely to be divorced or separated than males who do not binge drink alcohol.
How does this information help us better understand substance abuse prevention needs? ! Children of divorced parents are both at
higher risk for earlier and sustained substance abuse, as well as divorce.
! Interventions aimed at decreasing substance abuse risk in divorced families should be family focused rather than individual focused.
! Focus health education on healthy coping mechanisms.
References: !!!!!!!!!!!!!!!!!!!!!!!!!!!!!!!!!!!!!!!!!!!!!!!!!!!!!!!!!!!!1!M.!Fe!Caces,!Thomas!C.!Harford,!Gerald!D.!Williams,!Eleanor!Z.!Hanna!Alcohol!Consumption!and!Divorce!Rates!in!the!United!States!Volume!60,!1999!>!Issue!5:!September!1999!.!2!Kelly,!JB.,!Emery,!RB.!!Children’s!adjustment!after!divorce:!!risk!and!resilience!issues.!(Family!Relations,!2003,!52,!352–362).!!http://www.childcenteredsolutions.org/documents/kelly"emery_001.pdf!!3!Kelly,!JB.!!Ibid.!4!Kelly,!JB.!!Ibid.!5!Rothman,!EF.!!Adverse!Childhood!Experiences!Predict!Earlier!Age!of!Drinking!Onset:!Results!From!a!Representative!US!Sample!of!Current!or!Former!Drinkers!PEDIATRICS!Vol.!122!No.!2!August!2008,!pp.!e298"e304!(doi:10.1542/peds.2007"3412!6!2010!Center!for!Divorce!Education,!1005!East!State!Street,!Ste!G,!Athens,OH!45701!(740)!594"2526.!!http://www.divorce"education.com!!!
!!!
12.5
3.8
0
5
10
15
Percen
t!Divorced!or!Sep
arated
Binge!Drinking!and!Divorce/Separated!Marital!Status!Washtenaw/Livingston!Adult!Males!
Who!Consume!Alcohol" 2010*!!
Binger Non!Binger
*Washtenaw/Livingston SAFE!and!SOUND!2010!Survey
19

!! ! ! !!!!!!!!!!!!!Community Focus Livingston/Washtenaw Substance Abuse Coordinating Agency
!
How are ‘DUI Crashes’ measured? Drinking prior to the crash by a driver, pedestrian, or cyclist as reported by the police, the coroner, or other accepted authorities.
How do we compare?
!!Washtenaw!2009!
Livingston!2009!
Michigan!2009!
%!of!Total!Crashes!Involving!Alcohol!
3.3%! 4.2%! 3.7%!
%!of!Fatal!Crashes!Involving!Alcohol!
32%! 28.6%! 34.3%!
Who is most likely to be involved in motor vehicle crashes involving alcohol? ! Youth aged 24 years and younger comprise
35% - 45% of alcohol related crashes. ! Alcohol related crashes occur more
frequently on local roads than on interstate highways, U.S. Routes and State Routes combined.
! Livingston has a higher percent of crashes involving alcohol compared to Washtenaw or Michigan.
What don’t we know? Various law enforcement agencies may assess and report alcohol involvement differently. Therefore, we cannot assume that excess rates actually reflect higher DUI rates, but potentially more stringent enforcement and recording of the offenses.
What is the relationship between alcohol use and DUI? National data indicates: ! Underage persons who are current drinkers
averaged more drinks per day than adults aged 21 and older1.
! Young adults aged 18 to 25 who are current drinkers were more likely than any other age group to drive under the influence of alcohol in the past year2.
! Drivers aged 15 to 17 in States with the most restrictive driver licensing laws had lower rates of heavy drinking compared to those in States with the least restrictive laws3.
How do DUI offenses affect recovery? ! Persons in recovery are more likely to
succeed if they have access to work and educational opportunities and have a paid job.
! DUI offenses may result in loss of driver’s license. Alternate plans for transportation for those in recovery may be necessary to assure steady employment or school attendance.
Are there community based interventions proven to reduce the effects of DUI and substance abuse relationship? The Community Trials Intervention to Reduce High Risk Drinking Intervention4 is a multi-component, community-based program developed to alter the alcohol use patterns and related problems of people of all ages. The program incorporates a set of environmental interventions that assist in (1) restricting alcohol access through alcohol outlet density control; (2) enhancing responsible beverage service (3) increasing law enforcement and sobriety checkpoints (4) reducing youth access to alcohol by training alcohol retailers to avoid selling to minors; and (5) forming the coalitions needed to implement and support the interventions.
Program outcomes include: ! 6% decrease in the amount the intervention
community drinks (p=0.008) ! Monthly average nightly injury crashes
decreased by 10% (p=0.009) ! 6% decreases in crashes involving drunk
drivers (p=0.001) ! 51% decrease in those who drove when
they thought they were “over” the legal alcohol limit
20

!! ! ! !!!!!!!!!!!!!Community Focus Livingston/Washtenaw Substance Abuse Coordinating Agency
!
What does the SAFE and SOUND survey tell us about the link between alcohol consumption and the risk of DUI? Adults who drink and drive drink have a higher average number of drinks per day than adults in Livingston and Washtenaw who do not drink and drive.
How does this information help us better understand substance abuse prevention needs? ! The percent of all motor vehicle crashes
involving alcohol, as well as the percent of fatal crashes involving alcohol has remained steady during 2004-2009.
! Underage drinkers and young adults are more likely to drink and drive than older drinkers.
! Younger drinkers are more likely to drink more drinks.
! Livingston and Washtenaw County adults who have reported drinking and driving are much more likely to drink more drinks on each occasion than drinkers who do not drive after drinking.!
References: !!!!!!!!!!!!!!!!!!!!!!!!!!!!!!!!!!!!!!!!!!!!!!!!!!!!!!!!!!!!1!Quantity!and!Frequency!of!Alcohol!Use.!!NSDUH!Report.!!December!12,!2003.!!http://www.oas.samhsa.gov/2k3/AlcQF/AlcQF.htm!!2!Ibid!Quantity!and!Frequency!NSDUH!Report.!3Graduated!Driver!Licensing!and!Drinking!Among!Young!Drivers.!!NSDUH!Report.!!April!30,!2004.!http://www.oas.samhsa.gov/2k4/licenses/licenses.htm!!4!Community!Trials!to!Reduce!High!Risk!Drinking!Intervention.!!SAMHSA’s!National!Registry!of!Evidence!Based!Programs!and!Practices.!!2008!http://www.nrepp.samhsa.gov/ViewIntervention.aspx?id=9!!
!!
4.9
3
0
2
4
6
Average!Num
ber!of!Drink
s!Pe
r!Day
DUI!and!Average!Number!of!Drinks!Per!DayWashtenaw/Livingston!Adults!Who!Consume!
Alcohol" 2010*!!
Drove!After!Drinking!in!Past!Month
Did!Not!Drive!after!Drinking!in!Past!Month
*Washtenaw/Livingston SAFE!and!SOUND!2010!Survey
21

!! ! ! !!!!!!!!!!!!!Community Focus Livingston/Washtenaw Substance Abuse Coordinating Agency
!
How is ‘perceptions of parental disapproval ’ measured? Perceptions of disapproval, especially parental, influence young people’s decisions to use drugs and alcohol. Findings from a 2008 research study suggests that parents can have a robust protective role even greater than peer influences, especially among sixth graders as compared to eight graders1. These perceptions are measured by survey questions asking youth ‘How wrong do your parents think it would be for you to (smoke cigarettes, marijuana, binge drink…etc.)? ‘Very wrong, wrong, a little wrong or not wrong at all. ’ How do we compare? Figure 1 below indicates that youth 12-17 years in Livingston County perceive greater parental disapproval of alcohol and marijuana use compared to Washtenaw County youth, or youth nationally.
Figure!1!
!^SAFE!and!SOUND!Survey;!*NSDUH!
What are the trends regarding perceptions of parental disapproval? ! Table 1 below indicates that nationally,
youths’ perceptions of parental disapproval of substance use have increased for marijuana, alcohol and cigarettes during 2002-2008.
! Nationally, youths who are younger, female, or Asian are more likely to think that their parents would strongly disapprove of their substance use compared to youths who are older, male or from other racial/ethnic groups2.
!Table!1!"!Trends!in!Perceptions!of!Parental!Disapproval!for!
Substance!Use!!!Youth!12"17!Years!!United!States!NSDUH!2009!Survey3!
! 2002! 2008! 2009!Parents!would!disapprove!of!marijuana!use!
89.1! 90.8! 90.5!
Parents!would!disapprove!of!alcohol!use!
89! 89.7! 90.3!
Parents!would!disapprove!of!cigarette!use!
89.5! 92.4! 92.6!
What is the link between perceptions of parental disapproval and substance abuse? Table 2 below indicates that nationally, youths’ perceptions of parental disapproval of substance use is closely related to past month use. For instance, youth who do not use marijuana or cigarettes are approximately six times more likely to identify that their parents ‘strongly disapprove’ of use compared to youth who use marijuana or cigarettes.
!
!
!Table!2!"!Past!Month!Use!and!Perceptions!of!Parental!
Disapproval!!!Youth!12"17!Years!!United!States!NSDUH!2009!Survey4!
Youth!who!used!marijuana!in!past!month!
Youth!who!used!cigarettes!in!past!month!
Parent!would!strongly!disapprove!of!marijuana!use!
4.8! !
Parents!would!not!strongly!disapprove!of!marijuana!use!
31.8! !
Parents!would!strongly!disapprove!of!cigarette!use!
! 6.5!
Parents!would!not!strongly!disapprove!of!cigarette!use!
! 40.5!
Are there community based interventions proven that involve increasing parental disapproval and youth perceptions of parental disapproval of substance abuse? The Parents Who Host , Lose The Most : Don't be a party to teenage drinking public awareness campaign educates parents about the health and safety risks of serving alcohol at teen parties and increases awareness of and compliance with underage drinking laws5.
91
90
91
87
98
94
80 85 90 95 100
Smoking!marijuana!once!a!month!or!more
Having!one!or!two!drinks!of!alcohol!nearly!every!day
Percent!
Youth!12"17!Years!Old!Who!Identify!Parents!Feel!Substance!Use!would!be!'Very!Wrong'!
2009!
Livingston^ Washtenaw^ United!States*
22

!
Program! 33%
par! 36%
con! 32%
and! 29%
whothe
! 42%par
What dtell uson the! Figu
andalcoparnon
! Liviwhothathe
! Parruleinflalco
! !
m outcomes incl% increase in parties if they knew
% decline in childntaining parties % increase in discd parents due to % decrease in pao host alcohol coir kids
% decline in childents who host p
does the SAFEs about the infeir children’s ure 2 below indid Washtenaw Couohol or marijuanental and schoo
n using counterpingston and Waso identified NOTt “parents do no most important
rents of non usines and perceive uence over theiohol use6.
!!!!!!!!!!!
!
ude: rents who wouldw the info dren attending a
cussion between campaign
arents who knowontaining parties
dren who know oarties serving al
E and SOUND fluence of pa substance abicates that Livingunty youth who na perceive less l disapproval tha
parts. htenaw County y
T using alcohol idot allow me to” at reasons to not ng youth have str that they have mr children’s drug
!!Comm Livingston
d not host
alcohol
n youth
w others s for
of lcohol
survey rents use? gston use peer, an their
youth dentified as one of use. ricter more g or
Hbepr!
!
munity n/Washtenaw
Figure!2!–!Peer,!PaAlcoh
Livingston!&!Wa
ow does this etter design arevention inte
Peer pressureassociated wityouth. Parenpowerful for yinfluence becimportant for It is necessaryinformation toand to know tdifference.
School!discouralcohol!use
Parent!disapprovmy!marijuana!u
Parent!disapprovmy!alcohol!us
None!of!my!frieused!marijuana!in
month
None!of!my!fribeen!drunk!in
month
Non"AlcoholNon"Marijua
! Focus Substance A
arental!and!School!Dhol!and!Marijuana!Usashtenaw!County!12"
information hand implemenerventions?
e and peer influeth substance usets’ influence is pyounger teens; womes increasing older teens. y for parents to ho share with thethat talking with
0 50
rages!e
ves!of!use
ves!of!se
nds!n!last!
ends!n!last!
percen
!User Alcohoana!User Marijua
s Abuse Coordi
isapproval!and!se!"17!year!olds!
!
help us nt
ence are e among particularly while peer gly more
have correct eir children them makes a
100nt
ol!Userana!User
nating Agenc
! Programbe desiglikely to use to thare morelack consubstanccareer aparents inevitab
Reference!!!!!!!!!!!!!!!!!!!!!!1!From!The!JournaPerceived!Parentainfluences!on!AdoThomas!M.!SawyPosted:!01/12/2477.!©!2008!Spr
2!NSDUH,!ibid.!3!Substance!Abuse(2010).!Results!froHealth:!Volume!I.!Studies,!NSDUH!S4856Findings).!Rohttp://oas.samhsa4!NSDUH!ibid.!!!5!http://drugfreea6!Pocket!Profile!–Washtenaw!CounHealth.!!2009.!!!
cy
ms targeted towagned to recruit p express disapprheir children, ince tolerant of drufidence and kno
ce use; parents wand home responwho believe thale.
es: !!!!!!!!!!!!!!!!! !!!!!!!!!!!!al!of!Primary!Preventional!and!Peer!Disapprovaolescent!Decision"Makinyer;!John!F.!Stevenson009;!J!Prim!Prev.!2008;ringer!
e!and!Mental!Health!Seom!the!2009!National!SSummary!of!National!F
Series!H"38A,!HHS!Publiockville,!MD.!a.gov/NSDUH/2k9NSDU
actionalliance.org/pwh.SAFE!and!SOUND!Adultnty!Health!Organization
rds parents shouparents who are roval of substanccluding parents
ug use; parents wowledge about with significant nsibilities; and at youth use is
!!!!!!!n!!l!Toward!Substances!ng!
29(6):465"
ervices!Administration.!Survey!on!Drug!Use!andFindings!(Office!of!Applcation!No.!SMA!10"
UH/2k9Results.htm#6.3
.php!t!Survey!Results.!!!&!Washtenaw!County!
uld less
ce who who !
d!ied!
3!!
Public!
23

!! ! ! !!!!!!!!!!!!!Community Focus Livingston/Washtenaw Substance Abuse Coordinating Agency !
How is ‘unemployment’ measured? Persons are classified as unemployed if they do not have a job, and have actively looked for work in the preceding four weeks, and are currently available for work. How do we compare? Livingston and Washtenaw County Unemployment rates are higher compared to the United States, but lower than those for Michigan. Livingston County rates are higher than, and have increased more rapidly than, those for Washtenaw County.
Unemployment Rates (July) 2000-20101
! 2000! 2010! %!Increase!United!States! 4%! 9.5%! 137%!Michigan! 3.8%! 13.1%! 244%!Washtenaw! 3.1%! 10%! 222%!Livingston! 2.8%! 12.1%! 332%!
Who is most likely to be unemployed? ! Adult males, teenagers, Blacks, and
Hispanics have the highest unemployment rates.
! Lower educational status is associated with higher unemployment rates. Unemployment rates decrease with higher educational levels2.
! September 2010 national unemployment data identifies that persons employed in the construction industries have the highest unemployment rates (17.2%), followed by leisure and hospitality (11.4%) and agriculture (11.1%)3.
What don’t we know? The U.S. Bureau of Labor definition does not include people who are incarcerated; those who have lost their job and stopped looking for a job; self employed; retirees who want to work; disabled persons. The labor force includes only persons classified as employed or unemployed. What is the relationship between substance abuse and unemployment? ! Long term involuntary unemployment is
associated with heavy drinking4. ! One percent increase in unemployment is
associated with a 28% increase in deaths from alcohol and 4.5% increase in suicides in persons less than 65 years5.
! Increased use of illicit drugs is associated with increased unemployment rates6.
How does unemployment affect recovery? ! Persons in recovery are more likely to
succeed if they have access to work and educational opportunities and have a paid job.
! Employment rates for substance abusing populations ranged from 15% in 1980 to 30% in 1991 compared to 72% in 1980 and 77% in 1991 in the non-substance using population7.
Are there community based interventions proven to reduce the effects of the unemployment/substance abuse relationship? ! Collaboration between independent and
autonomous treatment and vocational agencies is critical for persons in substance abuse treatment and recovery. Effective collaboration is necessary to seeing the client in the broadest possible context, beyond the boundaries of the substance abuse treatment agency and its provider8.
! Customized Employment Supports (CES) helps methadone treatment patients, who are likely to have irregular work histories, attain rapid placement in paid jobs and increase their legitimate earnings compared to groups receiving standard vocational training. Evaluation studies have documented that the CES results in greater proportion of clients with paid formal and informal employment9.
24

!! ! ! !!!!!!!!!!!!!Community Focus Livingston/Washtenaw Substance Abuse Coordinating Agency !
What does the SAFE and SOUND survey tell us about the link between unemployment and substance abuse?!!While the SAFE and SOUND survey did not determine employment status, educational status was identified by respondents. National and local data indicate that the lower the educational attainment, the higher the unemployment rate in adult population. Livingston and Washtenaw SAFE data indicates that males with a high school diploma have approximately four times higher binge drinking rates than their college educated counterparts. Females’ binge drinking rates for high school graduates are twice that of college educated females.
*Adults that have consumed alcohol in last 30 days.
How does this information help us understand substance abuse prevention needs? ! Unemployment rates in our region have
risen twice as fast as the national rate. ! Investing in substance abuse prevention
and treatment reduces unemployment, absenteeism, tardiness, conflicts between employees, crime, and health care costs.
! Unemployment increases the likelihood of substance abuse.
! Substance abuse increases the likelihood of unemployment.
!
References:!!!!!!!!!!!!!!!!!!!!!!!!!!!!!!!!!!!!!!!!!!!!!!!!!!!!!!!!!!!!!1!Local!Area!Unemployment!Statistics.!!U.S.!Dept!of!Labor,!Bureau!of!Labor!Statistics.!!October!13,!2010.!!http://data.bls.gov:8080/PDQ/servlet/SurveyOutputServlet;jsessionid=6230ce266b7715251762!!2!http://www.bls.gov/news.release/empsit.t04.htm!!3!http://www.bls.gov/news.release/empsit.t14.htm!!4!Mossakowski,!K.!‘Is!the!duration!of!poverty!and!unemployment!a!risk!factor!for!heavy!drinking?’!Social!Science!&!Medicine!Volume!67,!Issue!6,!September!2008,!Pages!947"955.!5!Stucker,!D.,!et!al.!‘The!public!health!effect!of!economic!crises!and!alternative!policy!responses!in!Europe:!an!empirical!analysis.’!The!Lancet,!Volume!374,!Issue!9686,!Pages!315!"!323,!25!July!2009!6!Peck,!D.,!Plant,!M.!‘Unemployment!and!illegal!Drug!Use.’!British!Medical!Journal.!!Vol!293.!October!11,!1986.!7!Young,!Nancy.!‘Integrating!Substance!Abuse!Treatment!and!Vocational!Services.’!SAMHSA/CSAT!Treatment!Improvement!Protocols.!!Executive!summary.!!Treatment!Improvement!Series!#38.!http://www.ncbi.nlm.nih.gov/bookshelf/br.fcgi?book=hssamhsatip&part=A68228!!!8!Ibid.!Young,!Nancy.!!‘Integrating!Substance!Abuse!Treatment!and!Vocational!Services.’!9!http://www.nrepp.samhsa.gov/ViewIntervention.aspx?id=79!
!!
0
5
10
15
20
25
30
Males Females
Percen
t!that!Binge!Drink
Binge!Drinking!Rates!in!High!School!Graduates!and!College!Educated!Adults*2009!Washtenaw/Livingston!SAFE!and!
SOUND!
High!School College
25