substance flow analysis for nickel in mainland china in 2009
TRANSCRIPT

lable at ScienceDirect
Journal of Cleaner Production xxx (2014) 1e9
Contents lists avai
Journal of Cleaner Production
journal homepage: www.elsevier .com/locate/ jc lepro
Substance flow analysis for nickel in mainland China in 2009
Chu-Long Huang a,b, Jonathan Vause b, Hwong-Wen Ma c, Yan Li b, Chang-Ping Yu b,*
aDepartment of Resources and Environmental Sciences, Quanzhou Normal University, 398 Donghai Street, Fengze, Quanzhou 362000, ChinabKey Laboratory of Urban Environment and Health, Institute of Urban Environment, Chinese Academy of Sciences, 1799 Jimei Road, Xiamen 361021, ChinacGraduate Institute of Environmental Engineering, National Taiwan University, 71 Chou-Shan Road, Taipei 10660, Taiwan
a r t i c l e i n f o
Article history:Received 18 September 2012Received in revised form21 November 2013Accepted 23 December 2013Available online xxx
Keywords:Substance flow analysisAnthropogenic nickelSustainability indicatorsEnvironmental burden shiftingCradle-to-cradle management
* Corresponding author. Institute of Urban EnviroSciences, No. 1799, Jimei Road, Xiamen 361021, China
E-mail address: [email protected] (C.-P. Yu).
0959-6526/$ e see front matter � 2014 Elsevier Ltd.http://dx.doi.org/10.1016/j.jclepro.2013.12.079
Please cite this article in press as: Huang, C.-L(2014), http://dx.doi.org/10.1016/j.jclepro.20
a b s t r a c t
A comprehensive understanding of the flows and stocks of non-renewable resources plays an importantrole in the development of sustainable resource use policies. Substance flow analysis (SFA) is an estab-lished method to comprehensively analyze resource flows in the anthroposphere, and this paper con-ducts a quantitative SFA for nickel in mainland China for the year 2009. The analysis shows that totalavailable primary nickel, total available nickel used in fabrication processes and in-use stock of nickelend-products during the year 2009 were 509.28 Gg, 647.25 Gg and 341.83 Gg respectively, and the netimport reliance was about 73%. Some sustainability indicators can be derived from the SFA results, andthese indicate that the sustainability of the Chinese nickel industry chain could be significantly improved.However, to conduct a comprehensive assessment of resource sustainability it would be necessary toderive systematic SFA indicators. The overall environmental burden exported from the Chinese nickelindustry is greater than the imported burden, with the imported environmental burden resulting mainlyfrom the smelting and refining of imported nickel ores. The results indicate that cradle-to-cradle man-agement is important for Chinese nickel industry, including shrinking the milling and refining capacity,improvements to processing technology, and enlarging the capacity for domestic and imported wastemanagement.
� 2014 Elsevier Ltd. All rights reserved.
1. Introduction
Nickel (symbol Ni, atomic weight 58.71, atomic number 28) is alustrous, silvery-white metal which is widely used in more than300,000 different products (International Nickel Study Group,abbreviated as ‘INSG’, http://www.insg.org/whatnickel.aspx).About 61% of new nickel produced worldwide is used to manu-facture stainless steels, 9% is used in other nickel alloys, 13% is usedin plating, and 17% in other uses, including batteries, catalysts, andchemicals (Bradley, 2011). Reck et al. (2008) divided end-use nickelproducts into the five categories of building and infrastructure,transportation, industrial machinery, household appliances andelectronics, and metal goods. In many of these applications, there isno substitute for nickel which can be used without reducing per-formance or increasing costs.
Although nickel is Earth’s fifth most common element,commercially exploitable reserves are limited. The use of nickel hasgrown exponentially over the past century, and approximately half
nment, Chinese Academy of. Tel./fax: þ86 592 6190768.
All rights reserved.
., et al., Substance flow analys13.12.079
of all nickel in circulation was put into use between 1980 and 2000(Reck et al., 2008). In 2004, the estimated Ni content of the globalnickel laterite resource available using current extraction technol-ogies was 161,000 Gg (Dalvi et al., 2004). In 2008, global economicand sub-economic nickel resources were estimated at 220,000 GgNi (USGS, 2009). If the growth in world nickel consumption con-tinues at current rates, this would be consumed within about 50years (see Eq. S(1) in the Supplementary data).
The recent increase in primary nickel consumption has beendriven by rapid development of the stainless steel industry. Chinahas become the world’s largest producer and consumer of stainlesssteels (Xu, 2008), accounting for less than 36% of world nickelconsumption in 2009, a total which increased to more than 43% in2011 (Table S1, Supplementary data). Chinese nickel reserves areonly 18 times greater than present annual primary nickel con-sumption, and available nickel from waste and scrap is limited.China therefore has an increasingly important role to play in sup-porting sustainable use of global nickel resources, and the identi-fication of potential savings in the processes of nickel production,consumption and recycling is an urgent task.
Substance flow analysis (SFA) is an analytical method used tosystematically assess the flow and stock of a substance through agiven system (e.g. productive system, economic or social system),
is for nickel in mainland China in 2009, Journal of Cleaner Production

C.-L. Huang et al. / Journal of Cleaner Production xxx (2014) 1e92
which should be clearly defined in space and time (Bringezu et al.,1997; Brunner and Rechberger, 2004; Hendriks et al., 2000). SFAmonitors flows of individual substances that raise particular con-cerns regarding the environmental and/or health risks associatedwith their production and consumption, and uses the principle ofmass balancing to analyze the relationships between substanceflows, human activities and environmental changes (OECD, 2008).Static SFA models can be used to identify the causes of pollutionproblems and to assess the effectiveness of management measures(Udo de Haes et al., 1997), while dynamic SFAmodels include stocksand materials-in-use (Bergbäck and Lohm, 1997). Stocks andmaterials-in-use are often the major cause of disconnection be-tween system inflow and outflow in a given year, meaning thatdynamic SFA models lead to more accurate prediction of futureresource use and waste streams (Elshkaki et al., 2005).
Nickel improves austenitic steel’s structural stability, oxidationresistance, high-temperature strength, and room-temperatureductility. However, a sustainable stainless steel industry dependsnot only on a sustainable supply of nickel ores, but also onwhether nickel products are produced, consumed and recycledthroughout their entire lifecycle in a sustainable way. For example,material flow analysis indicates that if austenitic stainless steelwere to be produced solely from scrap, energy use would be 67%less than ore-based production and CO2 emissions would be cut by70% (Johnson et al., 2008). Thus, nickel SFA can be used to help toassess the sustainability of nickel resource use, by understandinguse and loss characteristics as well as the balance between supplyand demand. Nickel SFA can also indicate how demand can besystematically reduced through improvements in nickel flow andrecycling.
Some anthropogenic nickel flow processes have already beenanalyzed. The anthropogenic nickel cycle for the year 2000, espe-cially the import/export and recycling of discarded nickel, has beenanalyzed at multiple levels, including 52 countries, territories, orcountry groups, eight regions, and the entire planet (Reck et al.,2008), while Matthew (2010) analyzed energy requirements andgreenhouse gas emissions from the entire global nickel industry.Other studies include regional material flow analysis of productscontaining nickel, for example, lithium batteries (Chang et al.,2009) and spent hydrogenation catalyst (Yang et al., 2011). How-ever, this study is the first to attempt a thorough integrated nickelflow analysis at the country level, and also discusses the role whichSFA results can play in the derivation of sustainability indicatorsand analysis of environmental burden shifting.
2. Methodology and data preparation
2.1. Substance flow analysis
Following standard SFA procedures, our study included thefollowing steps:
(1) Research objective and system definitionThis study analyzes the anthropogenic nickel cycle in
mainland China (excluding Hong Kong, Macao and Taiwan)in the year 2009.
(2) Data collection and SFA framework formulationThe results incorporate information from INSG, public data
from government and/or industrial organizations, literature,market research, expert judgment, best estimation, anddirect interviews with miners, manufacturers, importers,exporters, and so on. A full list of data sources used in thisstudy can be found in the Supplementary data. Based onthese data sources, we established a substance flow system
Please cite this article in press as: Huang, C.-L., et al., Substance flow analys(2014), http://dx.doi.org/10.1016/j.jclepro.2013.12.079
during the four stages of production, fabrication andmanufacturing, consumption, and waste management, asshown in Fig. 1.
(3) Mass balancingBased on the principle that mass-in is always equal to
mass-out (Fig. 1), simple mass balance formulas can becreated, such as Eq. (1). Nickel mass flow data was thencalculated and checked, and a nickel flow chart was created.
I ¼ O=ð1� LRÞ (1)
Where I is nickel input into a process; O is nickel output from theprocess; LR is nickel loss rate during the process; and 1 � LR is therecovery rate.
(4) Interpretation of resultsBased on the nickel flow chart, both the sustainability of
nickel resource use and environmental burden shifting wereassessed by analyzing the environmental performance ofnickel flow, import and export of Ni mass, resource use ef-ficiency and the balance of supply and demand.
2.2. Data sensitivity analysis
At present, there is no relevant nickel SFA database available inChina. Insufficient information was available to specify uncertaintyfor some stock and flow data. Based on the collective judgment ofthe authors regarding the reliability and quality of the data, highconfidence data include INSG data, official data, estimated or vali-dated data mainly based on official data and INSG data, and data ofa similar quality from other sources. Lower confidence data includethe authors’ estimated values mainly based on unofficial datasources, such as published literature whose data may be fromspecific experimental conditions, industrial reports where the datamay be affected by economic interest or reporters’ attitude, and soon. However, all data in the Results have been validated by massbalancing, and most are similar to INSG or official estimates, whichtend to confirm our estimates for some missing data, and is inaccordance with the history and present situation of the Chinesenickel industry. Detailed calculations can be found in the Supple-mentary data.
2.3. Background and assumptions for nickel SFA
(1) Chinese demand for primary nickel continues to escalate(Kuck et al., 2010). Net imports of products of nickel ores andconcentrates, primary nickel, and stainless steel waste andscrap all increased between 1999 and 2009 (Fig. 2). As pri-mary consumption is increasing more quickly than primarysupply, supply gaps for nickel ores and primary nickelincreased between 1998 and 2009 (Fig. 3).
(2) The London Metal Exchange (LME) nickel price hasdecreased sharply since 2007 (INSG, 2010), which may leadto further increase in demand for nickel.
(3) Many of the stimulus programs implemented in response tothe 2008 global economic slowdown funded electricitygeneration, transportation, and other major infrastructureprojects that require large tonnages of nickel-bearing stain-less steel and super-alloys (Kuck et al., 2010), especially 300series (austenitic) stainless steel (Chen, 2012). Nickel de-mand will continue to increase rapidly in line with stainlesssteel production, particularly in mainland China. In 2009,Chinese nickel demand exceeded domestic nickel supply by188.7 Gg (Fig. 3).
is for nickel in mainland China in 2009, Journal of Cleaner Production

Fig. 1. System framework for nickel flow analysis. Notes: This figure is modified from circular diagram by Reck et al. (2008). Nickel products are shown in square boxes andproduction processes in ovals; Dotted single-headed arrows denote nickel losses from the system during product processing; Full double-headed arrows denote input/output of Nimass across the system boundary; Full single-headed arrows denote flow direction of Ni mass within the system boundary.
C.-L. Huang et al. / Journal of Cleaner Production xxx (2014) 1e9 3
(4) Most nickel-containing products have long useful lives. Theaverage lifespan is probably 25e35 years, with many appli-cations lasting much longer (Nickel Institute, 2012). Theshortest lifetime of nickel-containing end-products is about8.5 years (Daigo et al., 2010) (Table S2).
The SFA in this study was therefore based on the following as-sumptions: 1) there was no stock in the domestic processes ofprimary nickel production, fabrication and manufacturing pro-cesses, and waste management in 2009 (i.e. all intermediateproducts were consumed, excluding port stocks of imported nickelores and concentrates and primary nickel, and end-use nickelproducts kept by consumers); 2) all domestic or net importednickel-bearing waste and scrap was recycled to the fabrication andmanufacturing processes.
Fig. 2. China’s net imports of nickel ores and concentrates, primary nickel, nickelwaste and scrap between 1999 and 2009.Notes: The line of 'Nickel ores and concen-trates’ matches left scale, while others match right scale. The nickel-related terms inthe figure and other places in this article are explained in the notes of Fig. S2 in theSupplementary data.Data source: INSG (2010). Units: Gg Ni/annum.
Please cite this article in press as: Huang, C.-L., et al., Substance flow analys(2014), http://dx.doi.org/10.1016/j.jclepro.2013.12.079
3. Results
3.1. Production of primary nickel
The production stage includes domestic production and im-ports/exports of primary nickel. Following the division of nickelproduction processes by Reck et al. (2008) and Norgate et al. (2007),we consider mining, milling, smelting and refining by pyrometal-lurgical and hydrometallurgical routes separately.
(1) Mining and milling of domestic nickel ores
If the actual Ni recovery rate during milling is 83.29%, Ni lossrate during nickel mining is 4.41% (CNIA, 2010), and Ni content ofdomestic ores and concentrates used in smelting is 79.36 Gg (INSG,2010), then, following Eq. (1), there should be 95.28 Gg of Ni con-tent of domestic crude ores used in the milling process with a loss
Fig. 3. Gap between production and consumption of domestic nickel ores and primarynickels in mainland China from 1998 to 2009. Notes: The terms in the figure and itstitle are explained in the notes of Fig. S2 in the Supplementary data.Data source: INSG (2010). Units: Gg Ni/annum.
is for nickel in mainland China in 2009, Journal of Cleaner Production
C.-L. Huang et al. / Journal of Cleaner Production xxx (2014) 1e94
of 15.92 Gg Ni, and 99.67 Gg of Ni content of the domestic nickelreserve used in the mining process with a loss of 4.39 Gg Ni.
(2) Smelting of domestic and imported nickel concentrates
Given that the Ni content of domestic ores and concentratesused in the smelting process is 79.36 Gg (INSG, 2010) and the Nirecovery rate of matte smelting is 94.94% (CNIA, 2010), we can useEq. (1) to calculate that 75.34 Gg Ni of domesticmattewas extractedfromdomestic nickel ores,with a loss of 4.02 GgNi during themattesmelting process. A further 67.61 Gg Ni of domestic matte wasobtained from 71.21 Gg Ni in imported ores and concentrates, witha loss of 3.60 Gg Ni (see Fig. S2 in the Supplementary data)
(3) Refining of domestic and imported mattes
If the Ni content of imported and domestic matte was 31.52 Gg(INSG, 2010) and 142.95 Gg (CNIA, 2010) respectively, and domesticrefined nickel was 163.80 Gg (INSG, 2010), then nickel loss duringthe refining process would be 10.67 Gg (Fig. S2, Supplementarydata).
(4) Refining of imported nickel ores or concentrates
According to the estimated or assumed average Ni content ofimported nickel ores from different countries, the highest possibleNi mass of total net imported nickel ores was 238.38 Gg (Table S5,Supplementary data).
According to the actual situation of Chinese nickel refining, weassume that the average Ni recovery rate of ferro-nickel refining inChina was no more than 80% (Table S7, Supplementary data). Thismeans that at least 112.50 Gg Ni of imported nickel ores would beneeded to refine 90.00 Gg ferro-nickel (INSG, 2010), assuming thatall domestic ferro-nickel produced in China is refined from im-ported laterite ores, and that other imported nickel ores and alldomestic sulphide ores are used in smelting nickel matte or arestocked in ports (Norgate et al., 2007; Zhang et al., 2007) (seeFig. S1, Supplementary data). Consequently, in 2009 nickel loss inthe refining process of producing ferro-nickel from importedlaterite ores would be at least 22.50 Gg. Following Eq. (2), below,the stock range of Ni content of imported nickel ores would be23.94e178.87 Gg, and the highest possible nickel port stock ofimported ores and concentrates was 54.66 Gg. Thus, of the238.38 Gg Ni contained in the imported nickel ores and concen-trates, 183.71 Gg Ni was input to smelting and refining processes inmainland China in 2009.
Nios ¼ Nito � Niom � Niof (2)
Where Nito is Ni content of total imported nickel ores and con-centrates; Nios is the stock of Ni; Niom is Ni used in smelting nickelmattes; and Niof is Ni used in refining ferro-nickel.
(5) Trade in primary nickel
Ni content of total net imported refined nickel equals the sum ofnet imported powder/flakes and unwrought nickel and not alloyed.Following Eq. (3) this total was 137.14 Gg (INSG, 2010) (Fig. S2,Supplementary data).
Nid ¼ Niipn �Niepn (3)
Where Nid is the D-value of Niipn minus Niepn; Niipn is Ni content ofimported primary nickel to China; and Niepn is Ni content ofexported primary nickel from China.
Please cite this article in press as: Huang, C.-L., et al., Substance flow analys(2014), http://dx.doi.org/10.1016/j.jclepro.2013.12.079
It also follows from Eq. (3) that Ni content of total net importedferro-nickel was 54.26 Gg, Ni content of total net imported nickeloxide sinterwas61.50Gg, andNi contentof total net importednickelchemicals was 2.60 Gg (Table S8, S9, and S10, Supplementary data).
Thus, the Ni content of total net imported primary nickel is thesummation of Ni contents of total net imported refined nickel,ferro-nickel, nickel oxide sinter and nickel chemicals, which was255.48 Gg. The mass balance calculation indicates that 61.10 Gg Niwas lost during the production of primary nickel.
3.2. Fabrication and manufacturing
(1) Fabrication and stock of primary nickel
In 2009, the estimated total usage of primary nickel was 442.50Gg, but Chinese domestic production of primary nickel was only253.80 Gg (INSG, 2010). Thus, it can be assumed that there was nostock of domestic primary nickel in China, other than port stocksfrom imported primary nickel. Thus, Eq. (4) indicates that 66.78 Ggimported primary nickel was stocked in ports in 2009, and that theother 188.70 Gg of imported primary nickel was used in domesticfabrication.
Nispn ¼ Nitipn � Nidpn � Nitcpn (4)
Where Nispn is stock of primary nickel; Nitipn is total net importedprimary nickel, 255.48 Gg; Nidpn is domestic primary nickel pro-duced in China, 253.80 Gg; and Nitcpn is the total consumption ofprimary nickel, 442.50 Gg.
Of the 442.50 Gg in China in 2009, it can be estimated that thetotal primary nickel loss in the fabrication process was 13.16 Gg(Table S11).
(2) Trade in fabricated products
The net imported nickel material was 8.80 Gg Ni in 2009 (CNIA,2010). Based on data from Antaike (2010) and Table S11 inSupplementary data, it can be calculated that the total net im-ported stainless steel contained an additional 15.37 Gg Ni.
(3) Discard from the fabrication process
It can be estimated that the Ni content of steel waste and scrapdiscarded from domestic industry and residential waste was66.12Gg and 99.36Gg respectively (Table S14, Supplementary data).
(4) Manufacturing
The total available nickel mass used in fabrication andmanufacturing in 2009was 647.25Gg (Fig. S2, Supplementary data).Ni contents of scrap discarded from fabrication and manufacturingprocesses of primary nickel were 13.16 Gg and 66.12 Gg (Tables S11and S14, Supplementary data) respectively. Thus, the total availablenickel used in manufacturing end-products in 2009 was 567.97 Gg.Due to lack of data sources for manufacturing of nickel end-products, and assuming that there was no nickel loss duringmanufacturing end-products, the Ni mass contained in total nickelend-products made in China was also 567.97 Gg.
3.3. Usage and waste management
(1) Trade of end-products containing nickel
The net export from China of nickel contained in end-productswas 85 Gg (Fig. S2, Supplementary data).
is for nickel in mainland China in 2009, Journal of Cleaner Production

C.-L. Huang et al. / Journal of Cleaner Production xxx (2014) 1e9 5
(2) Discard from nickel end-products
Primary nickel consumed in stainless steelmaking was 340 Gg(Antaike, 2010), and the Ni mass contained in total end productsconsumed inmainland Chinawas 482.97 Gg (i.e. 567.97 Gge85 Gg).Thus, the domestic discard from 482.97 Gg Ni of domesticallyconsumed nickel end products was an estimated 141.14 Gg (Fig. S2,Supplementary data).
(3) Stock of nickel end-products
Because net export and domestic discard of nickel end-productswere respectively 85 Gg and 141.14 Gg, the stock of nickel end-products must be 341.83 Gg of the 567.97 Gg total available nickelused in manufacturing.
(4) Recycling of nickel contained in steel waste and scrap
Total recycled Ni contained in domestic and net imported steelwaste and scrap was calculated to be 180.44 (Table S16,Supplementary data).
(5) Recycling of nickel waste and scrap
In 2009 China exported 0.007 Gg of nickel waste and scrap andimported 0.146 Gg (CNIA, 2010; INSG, 2010), thus the net importwas about 0.140 Gg.
(6) Nickel loss and recycling from waste management
If Ni content of industrial steel waste and scrap and domesticdiscard of nickel end-products was 66.12 Gg and 141.14 Ggrespectively, and if recycled Ni contained in domestic steel wasteand scrap was 150.89 Gg (see Tables S14 and S16, Supplementarydata), then loss from domestic waste management was 56.37 Gg
Fig. 4. A simplified schematic chart of a technological nickel flow, with successive life stagesO ¼ nickel in ores and concentrates, Production ¼ production stage, including milling, smeltiDS ¼ nickel discarded in dust and slag from fabrication process of primary nickel, FD ¼ steel fand dissipated nickel-bearing waste, Ipo ¼ nickel in imported ores and concentrates excludmatte, ImSs ¼ estimated Ni content of net imported stainless steels, Imp ¼ estimated Ni coimported primary nickel, Imm ¼ net import of nickel material, Iws ¼ Ni content of net impoand scrap, E ¼ end products. For detailed mass balance processes and other notes see Fig.
Please cite this article in press as: Huang, C.-L., et al., Substance flow analys(2014), http://dx.doi.org/10.1016/j.jclepro.2013.12.079
Ni. Assuming 0.14 Gg Ni in net imported nickel waste and scrap, and29.55 Gg Ni contained in net imported stainless steel waste andscrap, all of which was recycled, then the total recycled Ni contentof domestic waste steel, net imports of stainless steel and nickelwaste and scrap should be 180.58 Gg.
4. Discussion
Based on the above results, mass balancing can be used toestablish a simplified schematic chart of a technological nickelcycle in mainland China in 2009 (Fig. 4). This shows that the totalnet imported nickel metal contained in various nickel ores andconcentrates and their products, as well as in nickel-bearing wasteand scrap, was 494.23 Gg. Total nickel produced by domesticmining was 99.67 Gg, and total discarded nickel metal into theenvironment was 130.63 Gg. This means that 463.27 Gg Ni wasconsumed or stocked in China in 2009, and accounts for 34.41% ofthe 1346.4 Gg worldwide total nickel mining production in 2009(INSG, 2010). That indicates that China was the largest nationalconsumer of nickel in 2009, and that nickel use efficiency in Chinaplays a major role in the sustainability of global nickel resourceuse.
The nickel flow chart identifies where the critical process ofnickel loss occurs. It also allows for the derivation of indicators forsustainability assessment, and can reveal where environmentalburden shifting occurs.
4.1. Input-output indicators and sustainable developmentassessment
The SFA results allow for the derivation of systematic indicators,for example, the accumulation ratio, recycling ratio, secondaryinput ratio, discard ratio and utilization efficiency, which can beused for sustainability assessment.
plotted from left to right. Units: Gg Ni/annum. Notes: LP ¼ lithosphere and pedosphere,ng and refining, TS ¼ nickel discarded in tailings, slag, or other wastes from production,actories discard, WS ¼waste and scrap of steels and nickels to recycling, LD ¼ landfilleding Ipps, Ipps ¼ nickel in port stocks of imported ores and concentrates, Ipm ¼ nickelntent of net import of primary nickel excluding Imps, Imps ¼ nickel in port stocks ofrted waste and scrap of stainless steel, IwNi ¼ Ni content of net import of nickel wasteS2 in Supplementary data.
is for nickel in mainland China in 2009, Journal of Cleaner Production
C.-L. Huang et al. / Journal of Cleaner Production xxx (2014) 1e96
(1) Accumulation ratioThe accumulation ratio reflects both raw resource demand
and environmental burden. The accumulation ratio fromfabrication to use (namely, nickel entering domestic in-usestock of end-products as a function of the total availablenickel used in the fabrication process) was about 52.81% inChina in 2009, very close to the worldwide value (52.13%) forthe same indicator in 2000 (Reck et al., 2008). China’s nickeluse history is much shorter than worldwide nickel use his-tory, and most nickel end-products in China have only beenput into use in the last 10 years, compared to the last 50 yearsworldwide. This can be seen from the fact that world nickelconsumption increased from about 258 Gg/yr in 1960(Bilbrey and Long, 1961) to 1240.6 Gg/yr in 2009 (INSG,2010), while nickel consumption in China increased fromabout 42 Gg/yr in 1998 to 442.5 Gg/yr in 2009 (Fig. 3) (INSG,2010). Thus, there should be far less waste and scrap emis-sion per unit of nickel end-products in China than world-wide, and China’s nickel accumulation ratio should be muchhigher than the worldwide ratio. However, China’s accu-mulation ratio in 2009 was in fact very close to the world-wide accumulation ratio in 2000. Moreover, improvementsin global recycling capability since 2000 mean that China’saccumulation ratio in 2009 was likely lower than theworldwide average. Thus, it can be seen that the proportionof nickel end-products used in China for export, as well asnickel loss during the processes of fabrication, manufactureand use, is too high to achieve a sustainable nickel supply.
(2) Recycling ratioAlthough nickel is a non-renewable ‘finite’ resource, it is
also one of the world’s most recycled materials, with abouthalf of the Ni content of a stainless steel product typicallycoming from recycled sources (Nickel Institute, 2012). Asthe recycling ratio approaches 100%, the nickel resourcesupply becomes increasingly sustainable. The recycling ratio(the ratio of recycled to discarded Ni mass during eachdomestic flow process) during the processes of steelmaking,fabrication and manufacturing, and waste management is72.20% in mainland China, but 99.22% in Japan (calculatedfrom Fig. 10 in Daigo et al., 2010). Thus, there is a greatpotential to increase China’s nickel recycling ratio as part ofthe national policy to establish a ‘circular economy’, whichaims to decouple economic growth from environmentaldegradation and build an environmentally-friendly andresource-saving society (Bilitewski, 2005; Liu et al., 2009).Historically, the bulk of global nickel production has been
derived from sulfide ores, because laterites require morecomplex processing. However, to meet growing demand, anincreasing amount of nickel is being mined from lateriteores, leading to increasing energy costs and greenhouse gasemissions for nickel production (Mudd, 2010). BecauseChina is the world’s largest nickel consumer and one of thelargest primary nickel producers (INSG, 2010), and becausethere is no reason to suppose that Chinese demand forstainless steel and nickel will slowdown in the next 3e5years (Jahangir, 2010), there is an urgent need to improveChina’s nickel recycling ratio to support sustainable globalnickel resource use.
(3) Secondary input ratioChina’s secondary input ratio, that is, the total recycled
nickel as a function of the total available nickel used in thefabrication process, was about 27.90% in 2009, lower than thevalue of the same indicator in Japan. (This assertion is based
Please cite this article in press as: Huang, C.-L., et al., Substance flow analys(2014), http://dx.doi.org/10.1016/j.jclepro.2013.12.079
on the fact that, in Japan, 95% of nickel is consumed insteelmaking and 85% of this amount is for stainless steel; thatthe secondary input ratio of nickel waste and scrap related tostainless steel in Japan is 34.60% (see Fig. 10 in Daigo et al.,2010); and on the results for China’s secondary input ratiocalculated from the data of nickel-bearing steel waste andscrap in this study.) The value of this indicator is also lessthan the world average secondary input ratio in nickelfabrication in 2000, which was calculated to be 34% by Recket al. (2008). As with the accumulation ratio results, thesecondary input ratio results of nickel flow in China are alsoconsequences of the fact that most nickel end-products haveonly recently been put into use. However, Reck and Rotter(2012) have predicted that substantial nickel and stainlesssteel end-of-life flows will arise in China between 2015 and2020. China’s recycling capacity for nickel-bearing waste orscrap should therefore be enlarged to improve the sustain-ability of nickel resource use. In particular, the recycling ca-pacity for waste or scrap from electronic equipment,passenger vehicles and trucks should be improved, as theseproducts have lifetimes of less than 15 years (Table S2,Supplementary data).
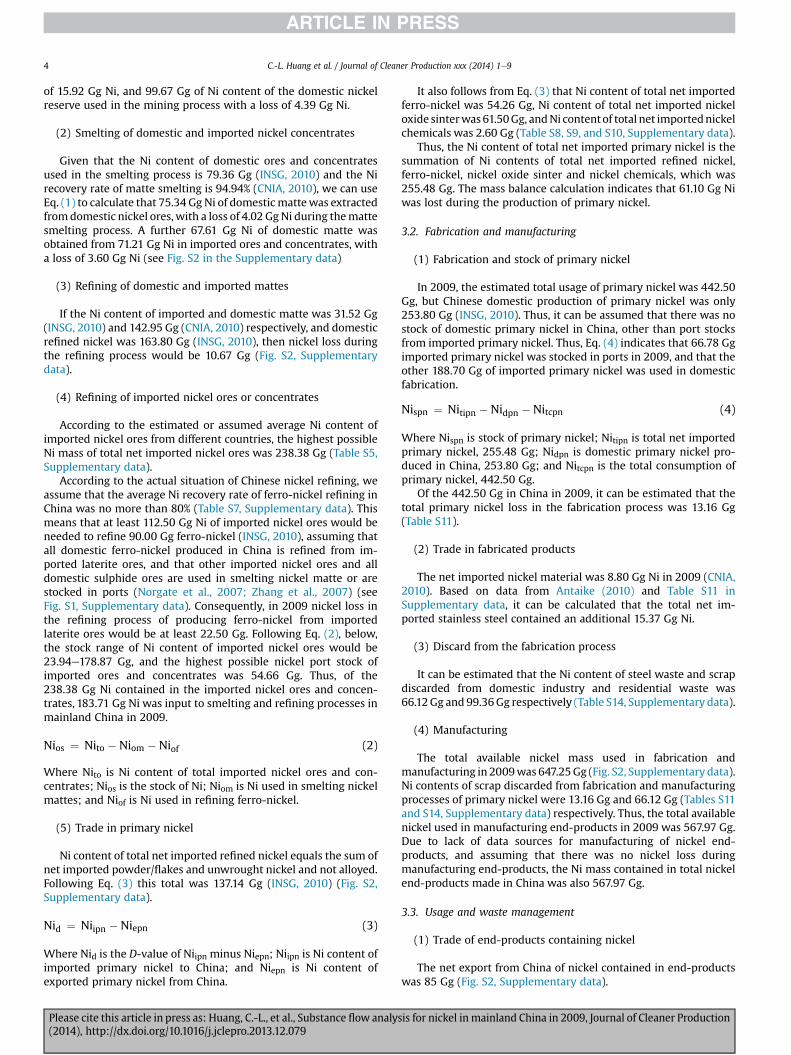
(4) Discard ratioNickel is harmful to the environment, and especially to
human health. It is also recognized as an energy intensivematerial, meaning that measures to reduce nickel lossthroughout all processes from mining to waste managementare extremely important. Nickel SFA provides a full view ofnickel loss throughout the nickel flow processes (Table 1),and indicates that the total discard ratio in China is 17.70%.Nickel which is not recycled is mainly generated duringprimary nickel production (61.10 Gg), followed by wastemanagement (56.37 Gg) and the fabrication andmanufacturing stages (13.16 Gg). The total process of miningandmilling of domestic ores, and the other three processes ofrefining of imported ores and concentrates, consumption,and waste management, had the highest nickel discard toinput (discard ratio �20%). This was followed by the pro-cesses of milling of domestic ores, and fabrication andmanufacturing, which had discard ratios of more than 10%.Processes with a high discard ratio require special attentionin future nickel flow management. The discard ratio of otherprocesses, including smelting and matte refining, was lessthan 10% (Table 1). The discard ratio of processes of smelting,fabrication and manufacturing in China in 2009 was close tothe world average in 2000 (Reck et al., 2008), but the discardratios of milling and refining was higher than the world av-erages, while the discard ratios of consumption and wastemanagement were lower than the world averages (Table 1).The higher milling and refining discard ratio is likely aconsequence of the fact that most Chinese milling andrefining companies are small and relatively inefficient. Thelower discard ratio of consumption and waste managementmay be a consequence of the fact that more nickel in China isused in end-products with a lifetime of more than 20 years(see Tables S2 and S17, Supplementary data) than in the restof the world. For example, 14% of stainless steel is used inconstruction applications worldwide, but in China more than20% is used in construction (Baddoo, 2008). In addition, mostnickel end-products in China have only been put into use inthe last 10 years (Fig. 3). The lower discard ratio of domesticmining may be because most domestic ores are high gradesulfides and are produced by JinChuan Group Co., Ltd.Because this company is one of the largest nickel producing
is for nickel in mainland China in 2009, Journal of Cleaner Production
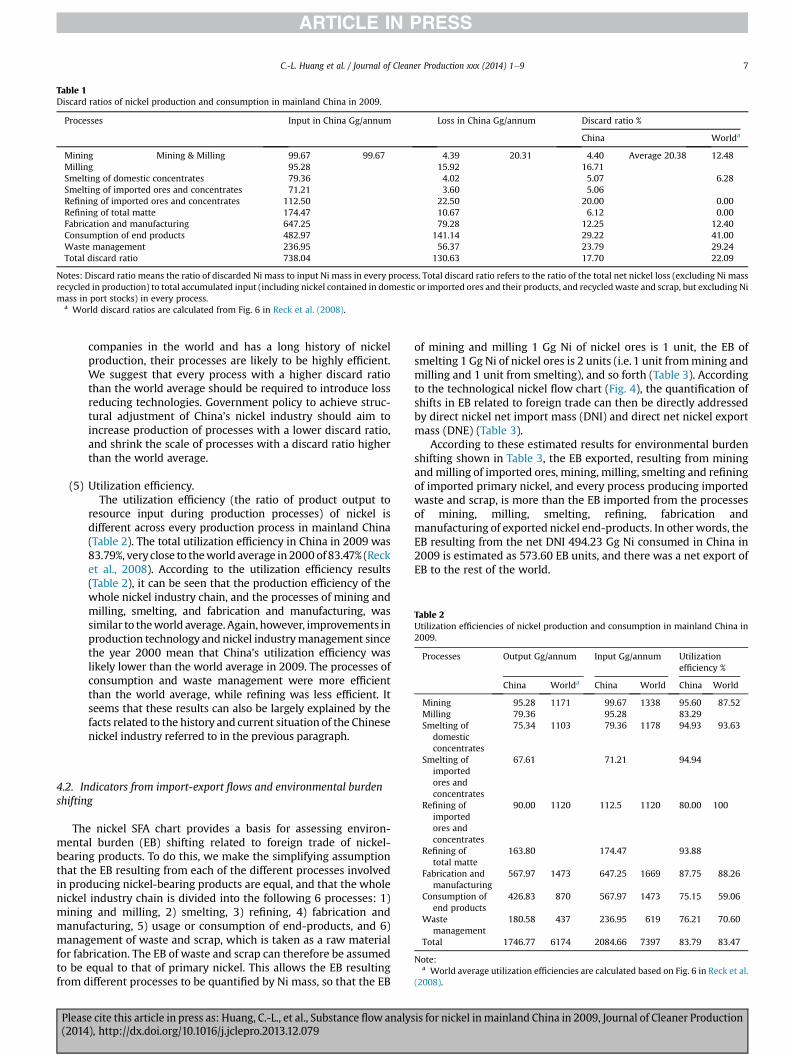
Table 1Discard ratios of nickel production and consumption in mainland China in 2009.
Processes Input in China Gg/annum Loss in China Gg/annum Discard ratio %
China Worlda
Mining Mining & Milling 99.67 99.67 4.39 20.31 4.40 Average 20.38 12.48Milling 95.28 15.92 16.71Smelting of domestic concentrates 79.36 4.02 5.07 6.28Smelting of imported ores and concentrates 71.21 3.60 5.06Refining of imported ores and concentrates 112.50 22.50 20.00 0.00Refining of total matte 174.47 10.67 6.12 0.00Fabrication and manufacturing 647.25 79.28 12.25 12.40Consumption of end products 482.97 141.14 29.22 41.00Waste management 236.95 56.37 23.79 29.24Total discard ratio 738.04 130.63 17.70 22.09
Notes: Discard ratio means the ratio of discarded Ni mass to input Ni mass in every process. Total discard ratio refers to the ratio of the total net nickel loss (excluding Ni massrecycled in production) to total accumulated input (including nickel contained in domestic or imported ores and their products, and recycled waste and scrap, but excluding Nimass in port stocks) in every process.
a World discard ratios are calculated from Fig. 6 in Reck et al. (2008).
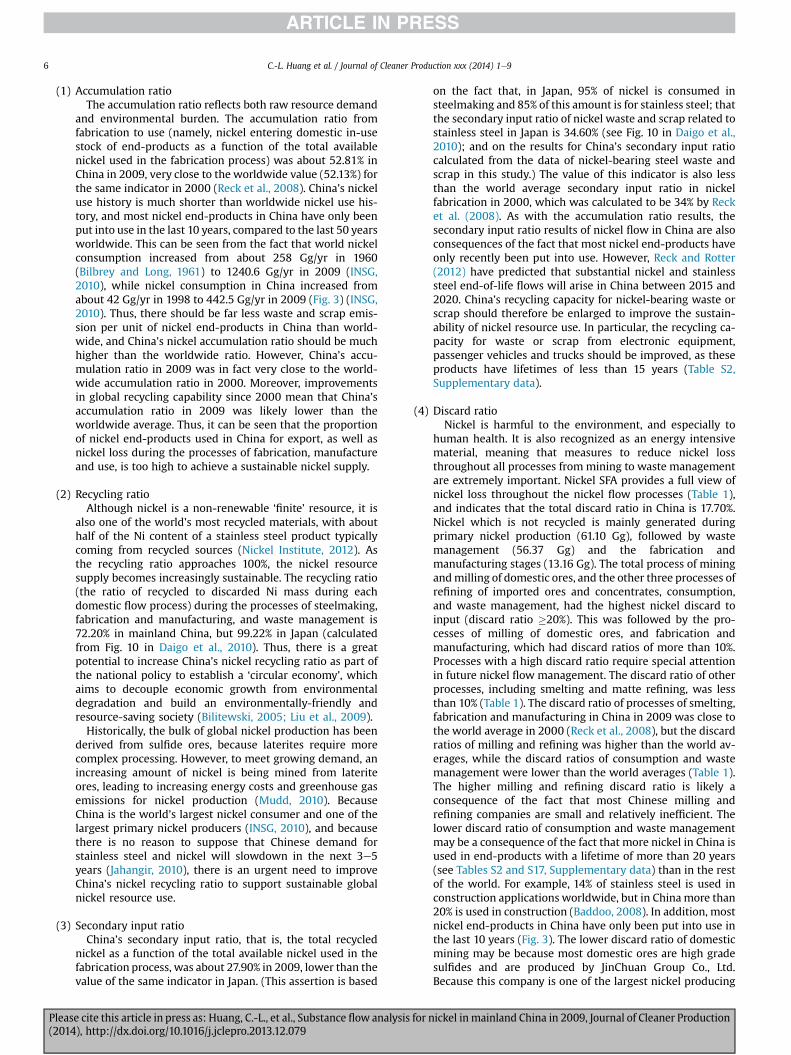
Table 2Utilization efficiencies of nickel production and consumption in mainland China in2009.
Processes Output Gg/annum Input Gg/annum Utilizationefficiency %
China Worlda China World China World
Mining 95.28 1171 99.67 1338 95.60 87.52Milling 79.36 95.28 83.29Smelting of
domestic75.34 1103 79.36 1178 94.93 93.63
C.-L. Huang et al. / Journal of Cleaner Production xxx (2014) 1e9 7
companies in the world and has a long history of nickelproduction, their processes are likely to be highly efficient.We suggest that every process with a higher discard ratiothan the world average should be required to introduce lossreducing technologies. Government policy to achieve struc-tural adjustment of China’s nickel industry should aim toincrease production of processes with a lower discard ratio,and shrink the scale of processes with a discard ratio higherthan the world average.
(5) Utilization efficiency.The utilization efficiency (the ratio of product output to
resource input during production processes) of nickel isdifferent across every production process in mainland China(Table 2). The total utilization efficiency in China in 2009 was83.79%, very close to theworld average in 2000 of 83.47% (Recket al., 2008). According to the utilization efficiency results(Table 2), it can be seen that the production efficiency of thewhole nickel industry chain, and the processes of mining andmilling, smelting, and fabrication and manufacturing, wassimilar to theworld average. Again, however, improvements inproduction technology and nickel industrymanagement sincethe year 2000 mean that China’s utilization efficiency waslikely lower than the world average in 2009. The processes ofconsumption and waste management were more efficientthan the world average, while refining was less efficient. Itseems that these results can also be largely explained by thefacts related to the history and current situation of the Chinesenickel industry referred to in the previous paragraph.
concentratesSmelting of
importedores andconcentrates
67.61 71.21 94.94
Refining ofimportedores andconcentrates
90.00 1120 112.5 1120 80.00 100
Refining oftotal matte
163.80 174.47 93.88
Fabrication andmanufacturing
567.97 1473 647.25 1669 87.75 88.26
Consumption ofend products
426.83 870 567.97 1473 75.15 59.06
Wastemanagement
180.58 437 236.95 619 76.21 70.60
Total 1746.77 6174 2084.66 7397 83.79 83.47
Note:a World average utilization efficiencies are calculated based on Fig. 6 in Reck et al.
(2008).
4.2. Indicators from import-export flows and environmental burdenshifting
The nickel SFA chart provides a basis for assessing environ-mental burden (EB) shifting related to foreign trade of nickel-bearing products. To do this, we make the simplifying assumptionthat the EB resulting from each of the different processes involvedin producing nickel-bearing products are equal, and that the wholenickel industry chain is divided into the following 6 processes: 1)mining and milling, 2) smelting, 3) refining, 4) fabrication andmanufacturing, 5) usage or consumption of end-products, and 6)management of waste and scrap, which is taken as a raw materialfor fabrication. The EB of waste and scrap can therefore be assumedto be equal to that of primary nickel. This allows the EB resultingfrom different processes to be quantified by Ni mass, so that the EB
Please cite this article in press as: Huang, C.-L., et al., Substance flow analys(2014), http://dx.doi.org/10.1016/j.jclepro.2013.12.079
of mining and milling 1 Gg Ni of nickel ores is 1 unit, the EB ofsmelting 1 Gg Ni of nickel ores is 2 units (i.e. 1 unit frommining andmilling and 1 unit from smelting), and so forth (Table 3). Accordingto the technological nickel flow chart (Fig. 4), the quantification ofshifts in EB related to foreign trade can then be directly addressedby direct nickel net import mass (DNI) and direct net nickel exportmass (DNE) (Table 3).
According to these estimated results for environmental burdenshifting shown in Table 3, the EB exported, resulting from miningandmilling of imported ores, mining, milling, smelting and refiningof imported primary nickel, and every process producing importedwaste and scrap, is more than the EB imported from the processesof mining, milling, smelting, refining, fabrication andmanufacturing of exported nickel end-products. In other words, theEB resulting from the net DNI 494.23 Gg Ni consumed in China in2009 is estimated as 573.60 EB units, and there was a net export ofEB to the rest of the world.
is for nickel in mainland China in 2009, Journal of Cleaner Production
Table 3Environmental burden shifting related to foreign trade.
Stage Products Gg EB unit/Gg Ni
DNI Gg DNEGg
EBSunits
P Ores and concentrate 1 183.71 �183.71Matte 2 31.52 �63.04
M Primary nickel 3 188.70 �566.10Fabricated products Stainless
steel4 15.37 �61.48
Nickelmaterial
4 8.80 �35.20
U End-products 5 85.00 425.00W Waste and scrap 3 29.69 �89.07Total �573.60
Notes: DNI is direct nickel net import mass; DNE is direct net nickel export mass;EBS refers to units of environmental burden shifting; P, M, U, W see notes to Fig. 4;‘+’ and ‘�’ respectively stand for the environmental burden imported and exported.
C.-L. Huang et al. / Journal of Cleaner Production xxx (2014) 1e98
Analyzing more closely, it can be seen that when the processesof mining, milling, smelting and refining of primary nickel productsare conducted overseas, China exports the environmental burden,but imports environmental burden by producing nickel end-products for export, including smelting and refining importednickel ores and the fabrication and manufacturing of importedprimary nickel products. However, conducting an EB assessmentacross the whole nickel flux is complicated. There are differentcategories of processes producing different nickel-bearing prod-ucts, so the exact size of the environmental burden cannot bedirectly quantified by Ni mass, but must be determined by jointapplication of SFA and lifecycle assessment (LCA) or other methods.For example, in Australia, one study of “cradle-to-gate” (raw ma-terial extraction and refining) environmental impacts found thatpressure acid leaching and solvent extraction/electrowinning oflaterite ore (1.0% Ni) resulted in greater impacts than flash furnacesmelting and SherritteGordon refining of sulphide ore (2.3% Ni) interms of gross energy requirement, global warming potential(determined by greenhouse gas emissions) and solid waste (miningwaste, tailings, slag and power station ash), while acidificationpotential (i.e. acidic gas emissions) was lower (Norgate et al., 2007).The results of this analysis reflect the differences in environmentalimpacts resulting from the processing of special grades of two kindsof nickel ores. However, accurate accounting of environmentalimpacts over the entire product lifecycle requires a large number ofspecific data and information, including but not limited to ore typeand grade, processing technology, fuel type, geographical location,country-to-country trade, and product quality (Eckelman, 2010). Inaddition, “cradle-to-gate” analysis does not consider “gate-to-gate”(product manufacture) and “gate-to-grave” (product use, recyclingand disposal) impacts.
Eq. (5) indicates that China’s net import reliance (net DNI as apercentage of apparent nickel consumption) was about 73%. Thishigh figuremeans that China’s nickel industry will tend to fluctuatewith the global market rather than achieving stable growth.
NIR ¼ net DNI=ðDNOþ TINÞ (5)
Where NIR is China’s net import reliance; DNI is direct nickelimport; DNO is nickel contained in domestic nickel ores; and TIN isthe total imported nickel input in the stages of production, fabri-cation and manufacturing, usage or consumption, and wastemanagement.
If China’s nickel demand was met using only domestic nickelresources with no recycling and if annual consumption remainedstable at 2009 levels (442.50 Gg/annum primary nickel; INSG,2010), then the 8000 Gg of China’s domestic nickel reserve (Chenand Tan, 2008) would be used up within about 18 years. Based on
Please cite this article in press as: Huang, C.-L., et al., Substance flow analys(2014), http://dx.doi.org/10.1016/j.jclepro.2013.12.079
the total nickel loss across all nickel flow processes (130.63 Gg/annum, see Table 1), domestic nickel reserves would run out inabout 61 years.
Not only is the resource endowment limited, but 1) net importsof nickel products, waste and scrap have been increasing since 1999(Fig. 2), 2) the gap between production and consumption of do-mestic nickel ores and primary nickel in mainland China increasedfrom 1998 to 2009 (Fig. 3), and 3) the net import reliance is high butthe recycling ratio is much lower than in Japan (Fig. 4 and Daigoet al., 2010). As a result, improvements in the recycling ratio, sec-ondary input ratio and utilization efficiency of the whole nickelindustry chain in China should be urgently sought. This could beachieved by cradle-to-cradle management, which achieves nouseless and potentially dangerous waste by reusing all material/substance outputs from any production processes, or storing thematerial/substance until it can be reused technically. However,based on the results of the Ni flow analysis, some challenges facingthe introduction of cradle-to-cradle management in China includethe following: 1) obstacles in dealing with the cumulative di-mensions of impacts in mining regions (see Franks et al., 2013), dueto uncertainties in controlling overlapping risks from vegetationdisturbance, water pollution, and soil degradation during mining;2) increasing energy and greenhouse gas emission costs for nickelproduction, resulting from both an increasing amount of nickelbeing mined from laterite ores (Mudd, 2010) and an increasingproduction of nickel pig iron (ferro-nickel) by small smelters usingsmall blast furnaces with inefficient pollution control facilities(Zhang et al., 2007); 3) unstable supply and demand chains due toboth high total NIR (see the previous paragraph) and import and/orexport of uncertain amounts of variable products during differentstages of production, fabrication and manufacturing, usage orconsumption, and waste management, as well as different social,economic and political factors between exporting and importingcountries; 4) building and maintaining multi-lateral cooperativearrangements for effective management of environmental burdenshifting caused by unstable import and export chains.
5. Conclusion
The results for the five indicators derived from nickel SFA inmainland China show that nickel use is currently not sustainable,and can be broadly explained by the history and present situation ofthe Chinese nickel industry. Two of these indicators (recycling ratioand secondary input ratio) suggest that the sustainability of nickelresource use is worse in China than in the rest of the world, whilethe other two indicators (discard ratio and utilization efficiency)suggest that the sustainability of nickel resource use is slightlybetter than elsewhere. This apparent contradiction reveals howdifferent indicators derived from nickel SFA play different roles insustainability assessment, and that it is necessary to derive sys-tematic SFA indicators to conduct a comprehensive assessment ofresource sustainability (Huang et al., 2012). The static SFA con-ducted in this study can only identify spatial differences in sus-tainability between China and other countries, and betweendifferent processes of substance flow. Conducting a dynamic SFAwould improve understanding of temporal changes in China’snickel resource sustainability.
The results for the five indicators show that sustainability ofnickel use would be improved by shrinking China’s milling andrefining capacity, while paying more attention to improvements inprocessing technologies and enlarging waste management capac-ity, including domestic and imported waste. Analysis of importeexport flows shows that China’s net import reliance is too high toachieve stable development of the nickel industry, especially thesupply of nickel ores and primary nickel products. The secondary
is for nickel in mainland China in 2009, Journal of Cleaner Production

C.-L. Huang et al. / Journal of Cleaner Production xxx (2014) 1e9 9
input ratio and recycling ratio should be improved, and the pro-portion of nickel end-products which are exported should bereduced. A simplified environmental burden analysis shows that anet export of environmental burden occurs across the entire nickelindustry chain, and that the environmental burden shifted intoChina results mainly from the smelting and refining of importednickel ores. However, it would be better to conduct a detailedanalysis of environmental burden shifting using LCA or similarmethods, on the basis of the nickel SFA results presented here.
Analysis of the nickel flow chart or used nickel accounting fa-cilitates the formulation of policies to extend the duration of nickelresource use, and highlights the importance of cradle-to-cradlemanagement for the Ni industry chain. It also forms a basis forenhancing fair competition for nickel resource use/consumptionacross differentflowprocesses by reducing nickel loss, aswell as faircompetition between nickel-related industries in different coun-tries. Increased efficiency in the nickel industry canplay amajor rolein helping to meet the needs of the present without compromisingthe ability of future generations to meet their own needs.
Acknowledgements
This research was supported by the CAS/SAFEA internationalpartnership program for creative research teams (KZCX2-YW-T08),the China Postdoctoral Science Foundation (2012M520402), OpenFund of Key Laboratory for Subtropical Mountain Ecology (Ministryof Science and Technology and Fujian Province funded), andQuanzhou Normal University Foundation for fostering academicleaders.
Appendix A. Supplementary data
Supplementary data related to this article can be found at http://dx.doi.org/10.1016/j.jclepro.2013.12.079.
References
Antaike, 2010. Review on Nickel Market in 2009 and Overlook in 2010.Available from: http://wenku.baidu.com/view/3f51690216fc700abb68fc69.html(accessed August 2012).
Baddoo, N.R., 2008. Stainless steel in construction: a review of research, applica-tions, challenges and opportunities. J. Constr. Steel Res. 64 (11), 1199e1206.
Bergbäck, B., Lohm, U., 1997. Metals in society. In: Brune, D., Chapman, V. (Eds.), TheGlobal Environment e Science, Technology and Management. ScandinavianScientific Press, Oslo, pp. 276e289.
Bilbrey, J.H.J., Long, E.R., 1961. Nickel. In: Bureau of Mines. Minerals yearbook metalsand minerals (except fuels) 1960, vol. 1United States Government Printing Of-fice, pp. 833e848. Available from: http://digital.library.wisc.edu/1711.dl/EcoNatRes.MinYB1960v1 (accessed August 2012).
Bilitewski, B., 2005. Task Force Report on Circular Economy. Available from: http://www.harbour.sfu.ca/dlam/Taskforce/circular%20economy2005.htm.
Bradley, K., 2011. Nickel applications & uses. In: The 8th Annual China NickelConference, Shanghai, 18e19 May.
Bringezu, S., Fischer-Kowalski, M., Kleijn, R., Palm, V. (Eds.), 1997. Regional andNational Material Flow Accounting: From Paradigm to Practice of Sustainability.Proceedings of the ConAccount Workshop, Leiden, Netherlands. WuppertalInstitute, Wuppertal, pp. 32e42.
Brunner, P.H., Rechberger, H., 2004. Practical Handbook of Material Flow Analysis.Lewis Publishers, The United States of America, Florida.
Chang, T.C., You, S.J., Yu, B.S., Yao, K.F., 2009. A material flow of lithium batteries inTaiwan. J. Hazard Mater. 163, 910e915.
Please cite this article in press as: Huang, C.-L., et al., Substance flow analys(2014), http://dx.doi.org/10.1016/j.jclepro.2013.12.079
Chen, J.Y., Tan, J.M., 2008. Technology of pyrometallurgical ferro-nickel with nickel-bearing laterite. Ferro-alloy 3, 13e15.
Chen, S.F., 2012. New higher historic record of stainless steels yield. China Metal.Bull. 5, 25.
CNIA (China Nonferrous Metals Industrial Association), 2010. Compilation of In-dustrial Statistics of Non-ferrous Metals of China in 2009. Information StatisticsDepartment.
Daigo, I., Matsuno, Y., Adachi, Y., 2010. Substance flow analysis of chromium andnickel in the material flow of stainless steel in Japan. Resour. Conserv. Recycl 54(11), 851e863.
Dalvi, A.D., Bacon, W.G., Osborne, R.C., 2004. The past and the future of nickellaterites. In: PDAC 2004 International Convention, Trade Show & InvestorsExchange, March 7e10.
Eckelman, M.J., 2010. Facility-level energy and greenhouse gas life-cycle assessmentof the global nickel industry. Resour. Conserv. Recycl. 54, 256e266.
Elshkaki, A., van der Voet, E., Timmermans, V., Van Holderbeke, M., 2005. Dynamicstock modelling: a method for the identification and estimation of future wastestreams and emissions based on past production and product stock charac-teristics. Energy 30 (8), 1353e1363.
Franks, D.M., Brereton, D., Moran, C.J., 2013. The cumulative dimensions of impactin resource regions. Resour. Policy 38 (4), 640e647. http://dx.doi.org/10.1016/j.resourpol.2013.07.002.
Hendriks, C., Obernosterer, R., Müller, D., Kytzia, S., Baccini, P., Brunner, P.H., 2000.Material flow analysis: a tool to support environmental policy decision making.Case-studies on the city of Vienna and the Swiss lowlands. Local Environ. InternJ. Justice Sustain. 5 (3), 311e328.
Huang, C.L., Vause, J., Ma, H.W., Yu, C.P., 2012. Using material/substance flowanalysis to support sustainable development assessment: a literature reviewand outlook. Resour. Conserv. Recycl. 68, 104e116.
INSG (International Nickel Study Group), 2010. World Nickel Statistics, vol. 18 (13).Jahangir, K., 2010. Nickel market overview. In: INSG Meeting, October. Roskill In-
formation Services Ltd..Johnson, J., Reck, B.K., Wang, T., Graedel, T.E., 2008. The energy benefits of stainless
steel recycling. Energ. Policy 36 (1), 181e192.Kuck, P.H., McNair, B.J., Wallace, G.J., 2010. U.S. Geological Survey Minerals Year-
booke2008: Nickel [Advance Release]. U.S. Department of the Interior and U.S.Geological Survey, pp. 1e28.
Liu, Q., Li, H.M., Zuo, X.L., Zhang, F.F., Wang, L., 2009. A survey and analysis on publicawareness and performance for promoting circular economy in China: a casestudy from Tianjin. J. Clean. Prod. 17 (2), 265e270.
Matthew, J.E., 2010. Facility-level energy and greenhouse gas life-cycle assessmentof the global nickel industry. Resour. Conserv. Recycl. 54, 256e266.
Mudd, G.M., 2010. Global trends and environmental issues in nickel mining: sul-fides versus laterites. Ore Geol. Rev. 38, 9e26.
Nickel Institute, 2012. ‘Nickel Metal e The Facts’ and ‘Where & Why Nickel is Used’.Available from: http://www.nickelinstitute.org/NickelUseInSociety (accessedAugust 2012).
Norgate, T.E., Jahanshahi, S., Rankin, W.J., 2007. Assessing the environmental impactof metal production processes. J. Clean. Prod. 15 (8e9), 838e848.
OECD, 2008. Measuring Material Flows and Resource Productivity. In: The OECDGuide, vol. 1. OECD, Paris, France.
Reck, B.K., Müller, D.B., Rostkowski, K., Graedel, T.E., 2008. Anthropogenic nickelcycle: insights into use, trade, and recycling. Environ. Sci. Technol. 42, 3394e3400.
Reck, B.K., Rotter, V.S., 2012. Comparing growth rates of nickel and stainless steeluse in the early 2000s. J. Ind. Ecol. 16 (4), 1e11.
Udo de Haes, H., Van der Voet, E., Kleijn, R., 1997. From quality to quantity: sub-stance flow analysis (SFA), an analytical tool for integrated chain management.In: Bringezu, S., Fischer-Kowalski, M., Kleijn, R., Palm, V. (Eds.), Regional andNational Material Flow Accounting: From Paradigm to Practice of Sustainability,Proceedings of the ConAccount workshop 21e23 January, Leiden, TheNetherlands.
USGS (U.S. Geological Survey), 2009. Minerals Commodity Summaries. Years 1996to 2009 (Reston, Virginia, USA).
Xu, K.D., 2008. Iron and steel industry development and technological innovation inChina. Iron Steel 43 (2), 1e13.
Yang, Q.Z., Qi, G.J., Low, H.C., Song, B., 2011. Sustainable recovery of nickel fromspent hydrogenation catalyst: economics, emissions and waste assessment.J. Clean. Prod. 19 (4), 365e375.
Zhang, Y.P., Zhou, Y.S., Li, Z.Y., Li, W.G., 2007. Characteristics of laterite resource andanalysis on its pyrometallurgy process. Ferro-alloy 18e21 (6), 40.
is for nickel in mainland China in 2009, Journal of Cleaner Production